Embed Size (px)
Citation preview

This PDF is a selection from an out-of-print volume from the NationalBureau of Economic Research
Volume Title: Business Concentration and Price Policy
Volume Author/Editor: Universities-National Bureau
Volume Publisher: Princeton University Press
Volume ISBN: 0-87014-196-1
Volume URL: http://www.nber.org/books/univ55-1
Publication Date: 1955
Chapter Title: Measures of Concentration
Chapter Author: Gideon Rosenbluth
Chapter URL: http://www.nber.org/chapters/c0953
Chapter pages in book: (p. 57 - 99)
MEASURES OF CONCENTRATION
GIDEON ROSENBLUTHQUEEN'S UNIVERSITY
A VARIETY of indexes of concentration have been used in the de-scription and analysis of industrial structures. We shall reviewsome of these measures, discussing their formal properties, theirempirical relations to one another, and some of the significant eco-nomic findings that can be obtained with their help.
1. Main Classes of IndexesTHE term "economic concentration" has been employed in manydifferent senses, and "indexes of concentration" have been con-structed to measure a number of quite distinct characteristics ofindustrial structure. Our discussion will center on those indexes ofconcentration that measure the extent to which a small number offirms account for a large proportion of an industry's output. Thisdefinition is somewhat vague since it involves two variables, but itis sufficiently precise to permit a discussion of its economic signifi-cance and to distinguish it from other concepts of concentration.
Economic theory suggests that concentration as defined here isan important determinant of market behavior and market results.Ceteris pan bus, monopolistic practices are more likely where a smallnumber of the leading firms account for the bulk of an industry'soutput than where even the largest firms are of relatively small im-portance. Hence, in the explanation of business policy, the charac-teristics of an industry expressed in the concentration index arelikely to play an important part. This relation to the degree ofmonopoly has motivated most of the empirical studies involvingthe measurement of concentration.1
1 In some studies, however, concentration has been measured for large sectorsof the economy that cannot be regarded as relevant to the problem of marketbehavior. The measurement by Gardiner C. Means of the importance of thelargest 200 corporations in relation to the economy as a whole is perhaps thebest-known example of an index of this type. A. A. Berle and G. C. Means, TheModern Corporation and Private Property (Macmillan. 1932), Bk. i, Chap. in.The significance of this index must be sought in theories that are broader inscope than the conventional economic analysis. The belief that democracy cannotsurvive where economic power is concentrated was cited by President Rooseveltas one of the bases for the investigations of the Temporary National EconomicCommittee (S. Doc. i7, 75th Cong., d Sess.), and probably implies the same con-cept of concentration as Mean's measure. The belief that the operation of an
57
MEASURES OF CONCENTRATION
It is not difficult for any imaginative investigator to develop agreat many indexes to measure concentration in the general sensedefined above. Our discussion will, however, be confined to measuresthat have actually been put to use in analyses of substantial bodiesof statistical data.
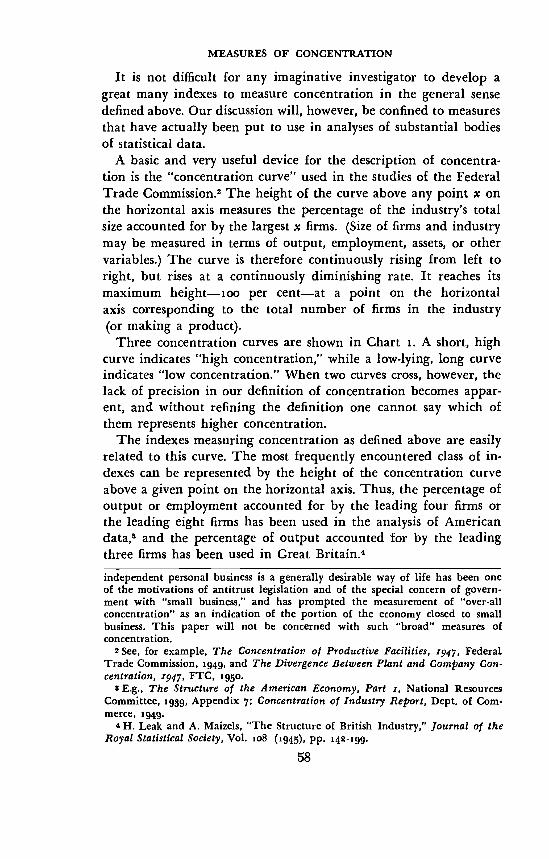
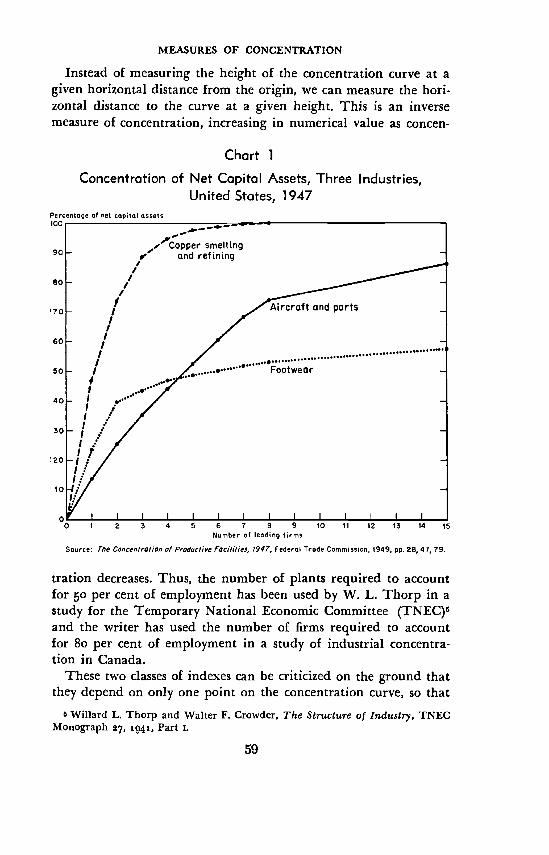
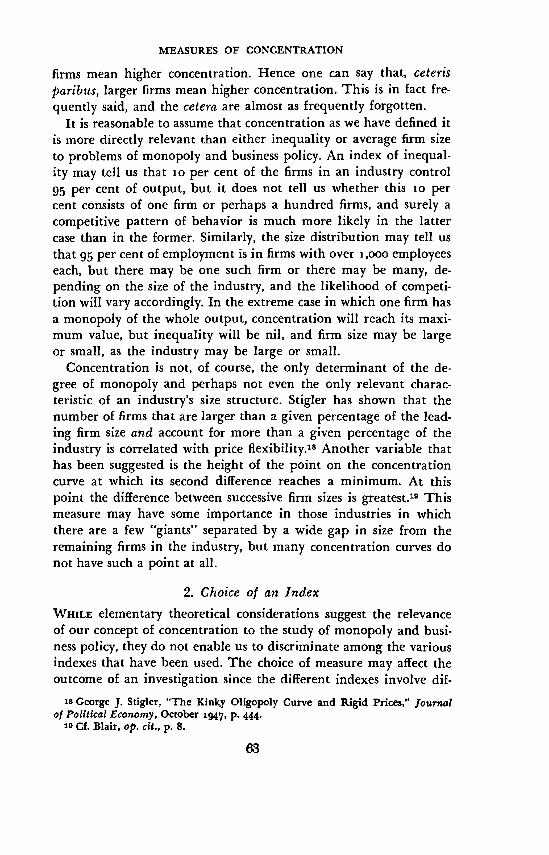
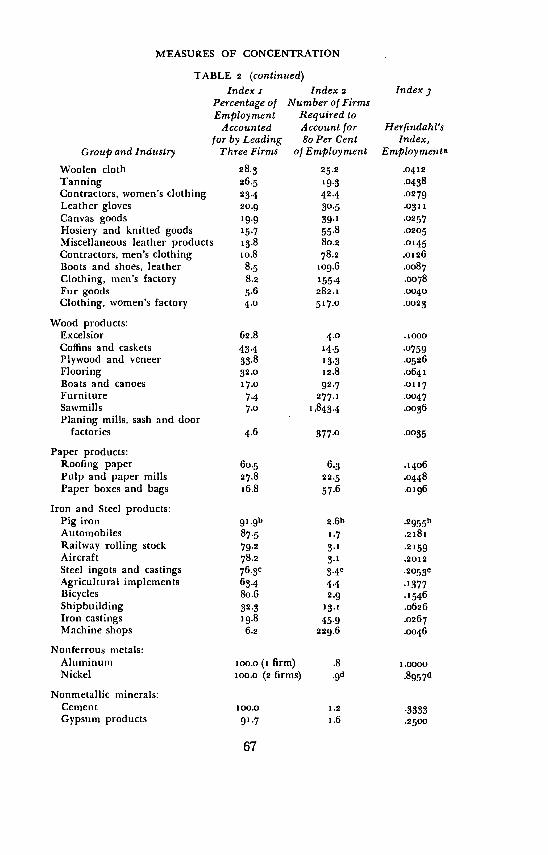
A basic and very useful device for the description of concentra-tion is the "concentration curve" used in the studies of the FederalTrade Commission.2 The height of the curve above any point x onthe horizontal axis measures the percentage of the industry's totalsize accounted for by the largest x firms. (Size of firms and industrymay be measured in terms of output, employment, assets, or othervariables.) The curve is therefore continuously rising from left toright, but rises at a continuously diminishing rate. It reaches itsmaximum height—coo per cent—at a point on the horizontalaxis corresponding to the total number of firms in the industry(or making a product).
Three concentration curves are shown in Chart i. A short, highcurve indicates "high concentration," while a low-lying, long curveindicates "low concentration." When two curves cross, however, thelack of precision in our definition of concentration becomes appar-ent, and without refining the definition one cannot say which ofthem represents higher concentration.
The indexes measuring concentration as defined above are easilyrelated to this curve. The most frequently encountered class of in-dexes can be represented by the height of the concentration curveabove a given point on the horizontal axis. Thus, the percentage ofoutput or employment accounted for by the leading four firms orthe leading eight firms has been used in the analysis of Americandata,3 and the percentage of output accounted for by the leadingthree firms has been used in Great Britain.independent personal business is a generally desirable way of life has been oneof the motivations of antitrust legislation and of the special concern of govern-ment with "small business," and has prompted the measurement of "over-allconcentration" as an indication of the portion of the economy closed to smallbusiness. This paper will not be concerned with such "broad" measures ofconcentration.
2 See, for example, The Concentration of Productive Facilities, 1947, Federal.Trade Commission, 1949, and The Divergence Between Plant and Company Con-centration, 1947, FTC, 1950.
8 E.g., The Structure of the American Economy, Part r, National ResourcesCommittee, igg. Appendix Concentration of Industry Report, Dept. of Corn-meice, 1949.
4 H. Leak and A. Maizels, "The Structure of British Industry," Journal of theRoyal Statistical Society, Vol. io8 (1945), pp. 142-199.
58
MIASURES OF CONCENTRATION
Instead of measuring the height of the concentration curve at agiven horizontal distance from the origin, we can measure the hori-zontal distance to the curve at a given height. This is an inversemeasure of concentration, increasing in numerical value as concen-
Chart 1
Concentration of Net Capital Assets, Three Industries,United States, 1947
tration decreases. Thus, the number of plants required to accountfor 50 per cent of employment has been used by W. L. Thorp in astudy for the Temporary National Economic Committee (TNEC)5and the writer has used the number of firms required to accountfor 8o per cent of employment in a study of industrial concentra-tion in Canada.
These two classes of indexes can be criticized on the ground thatthey depend on only one point on the concentration curve, so that
a Willard L. Thorp and Walter F. Crowder, The Structure of Industry, TNECMonograph 27, 1941, Part i.
59
Percentage of net capital onsets
Number of leading firms
Source: Tile Concentration of Productive Facilities, f947, Federal Trade Commission, 1949, Pp. 28, 47, 79.
MEASURES OF CONCENTRATION
there are many changes in the position of the curve that leave theindex unchanged. The lack of a summary measure utilizing allpoints on the curve has therefore been lamented6 and even offeredas an argument for using a different concept of concentration. Butsummary measures can be devised to measure concentration, just asthey have been developed for other characteristics of size distribu-tions. An ingenious measure of this type has been employed by 0.C. Herfindahl in an investigation of concentration in the steel in-dustry. It consists of the sum of squares of firm sizes, all measuredas percentages of total industry size. This index is equal to the re-ciprocal of the number of firms if all firms are of the same size, andreaches its maximum value of unity when there is only one firm inthe industry.
These are the classes of measures that will be investigated in thispaper. There is, however, an important class of concentration in-dexes that do not conform to our concept of concentration. Thewell-known Lorenz curve measures the cumulative percentages ofoutput accounted for by various percentages of the number of firms.9Gini's concentration ratio is a function of the area between theLorenz curve and the diagonal line the curve would follow if allfirms were of equal size. It thus measures the extent to which asmall percentage of all firms account for a large percentage of out-put, and does not measure concentration in our sense. The charac-teristic described by Gini's ratio and the Lorenz curve is oftencalled "inequality," and that usage wili be followed here, althoughsome writers identify inequality as "relative" concentration and re-fer to concentration as defined by us as "absolute" concentration.b0
6J. M. Blair, "Statistical Measures of Concentration in Business, Problems ofCompiling and Interpretation" (paper presented at the Annual Convention ofthe American Statistical Association, December 29, 195o).
'tJ. Lintner and J. K. Butters, "Effect of Mergers on Industrial Concentration.1940-1947," Review of Economics and Statistics, February 1950, p. 46.
8 Orris C. Herfindahi, "Concentration in the Steel Industry" (Ph.D. disserta-tion, Columbia University, 1950). It should be noted that "summary" is a some-what ambiguous term, and that in an important sense the measures based onintercepts of the concentration curve are also summary measures." For example,a change in the size of any one firm will affect all such indexes as well as Her-findahi's index. It is true that many concentration curves and many values ofHerfindahi's index are compatible with, say, the concentration of a givenpercentage of output in the leading four firms. But it is also true that manydifferent values of the percentage concentrated in the leading four firms arecompatible with a given value of Herfindahi's index.
o M. 0. Lorenz, "Methods of Measuring Concentration of Wealth," Journal ofthe American Statistical Association, June 1905. pp. 209-319.
10 Lintner and Butters, bc. cit.
60
MEASURES OF CONCENTRATION
Inequality is also identified with concentration in the work of R.Gibrat, who measures inequality of income-size distributions by thestandard deviation of a normal curve fitted to the logarithms of in-come1' and defines concentration as inequality of firm size.12 Thereare many other measures of inequality, either based on interceptsof the Lorenz curve or summarizing the whole size distribution, andtheir properties have received more careful study, mainly in con-nection with the distribution of incomes, than has been devoted tothe concentration indexes.19
Inequality is of course related to concentration, and an under-standing of their relation is important. Given the number of firms,concentration increases with an increase in inequality; and giventhe degree of inequality, concentration decreases with an increasein the number of firms.'4 This proposition can be demonstrated invarious ways. It follows directly from our definition of concentra-tion as the extent to which a small number of firms account for alarge percentage of output, and of inequality as the extent to whicha small percentage of the firms account for a large percentage ofoutput. The lack of precision in both definitions does not affect theprecise relation between them. A consideration of the relation be-tween the concentration curve and the Lorenz curve demonstratesthe same proposition. The only difference between the two curvesis that the first measures the cumulative number of firms along the
1 Or the logarithms of the deviation of income from a given minimum.12 R. Gibrat, Les inégalités économiques (Librairie du Recueil Sirey, igi), p.
206: "La concentration se définit et se mésure comme l'inegalité de repartitiondes entreprises suivant leur importance."
11 Cf. Dwight B. Yntema, "Measures of Inequality in the Personal Distributionof Wealth and Income," Journal of the American Statistical Association, De-cember 1933, p. 423.
14 This algebraic relation among the three variables also implies, of course,that given the degree of concentration, inequality increases with an increase inthe number of firms. It is not surprising, therefore, that some writers in this fieldhave asserted that concentration is not affected by the number of firms but thatinequality is so affected, while others have asserted the opposite. Mathematically,either statement can be correct if the right variable is held constant.
The misleading notion that measures of concentration are not affected bythe number of firms arises in part from the fact that it is possible to calculate,for example, the percentage of output accounted for by the largest x firms with-out knowing the total number of firms (while this is not in general possiblefor measures of inequality). This is of great practical importance where com-plete and accurate statistics are not available. Many industries contain a largenumber of very small firms, so that total industry output (and hence the per-centage accounted for by the leading four) can be estimated with great accuracyfrom a sample, while the total number of firms could be ascertained only atgreat cost.
61
MEASURES OF CONCENTRATION
horizontal axis, while the latter measures the cumulative percentageof firms.15 Hence, if we compare two industries with the same num-ber of firms any difference in their concentration curves must re-flect a difference in their Lorenz curves. On the other hand, if wecompare two industries with the same Lorenz curves, any differencein their concentration curves must reflect a difference in the numberof firms, the industry with more firms having a longer and lower-lying concentration curve.16
A third class of concentration measures indicates neither concen-tration nor inequality as we have defined these concepts, but ratheraverage firm size. In the study entitled Economic Concentration andWorld War II,' for example, the plants of an industry are groupedby size classes, size being measured in terms of employment, and therising percentage of employment in the large-size classes is cited asshowing increasing concentration. It is not quite clear whether theauthors of this study (and others who have used similar data) havein mind a concept of concentration similar to ours and have madean error in their method of measurement, or whether they have inmind a concept of concentration that identifies it with absolutesize. Again, there is, of course, a relation between these concepts.Given the size of 'the industry, a larger average firm size meansfewer firms, and given the degree of inequality of firm size, fewer
15 The original Lorenz curve measured the cumulative percentage of incomeon the horizontal axis and the cumulative percentage of the number of incomeson the vertical axis. Moreover, it started with the lowest incomes, while theconcentration curve starts with the largest firms. By simply changing the axesand replacing x per cent by soo — x per cent this curve can be transformed intoone identical with the concentration curve except for the difference mentionedin the text.
16 This relation between inequality and concentration can also be shown alge-braically in terms of the three types of concentration indexes discussed above.
a. Herfindahi's summary index can be shown, by simple algebraic manipula-tion, to be equal to (cl + i) --. n where c is the coefficient of variation (standarddeviation divided by mean) and n is the number of firms.
b. The index measuring the number of firms required to account for x percent of output is equal to the total number of firms multiplied by the indexmeasuring the percentage of firms required to account for x per cent of output.Here the indexes measure concentration and inequality inversely, so that, again,concentration increases with inequality and decreases with the number of firms.
c. The index measuring the percentage of output accounted for by the leadingk firms is equal to k (a/A) —i- n where a is the average size of the leading kfirms, A is the average size of all firms, and (a/A) can be regarded as a measureof inequality of firm size.
'TEconomic Concentration and World War II, Report of Smaller War PlantsCorporation before Special Committee on Small Business, S. Doc. 206, 7gth Cong.,2d Sess., i6.
62
MEASURES OF CONCENTRATION
firms mean higher concentration. Hence one can say that, ceterispan bus, larger firms mean higher concentration. This is in fact fre-quently said, and the cetera are almost as frequently forgotten.
It is reasonable to assume that concentration as we have defined itis more directly relevant than either inequality or average firm sizeto problems of monopoly and business policy. An index of inequal-ity may tell us that io per cent of the firms in an industry control95 per cent of output, but it does not tell us whether this io percent cOnsists of one firm or perhaps a hundred firms, and surely acompetitive pattern of behavior is much more likely in the lattercase than in the former. Similarly, the size distribution may tell usthat 95 per cent of employment is in firms with over i ,ooo employeeseach, but there may be one such firm or there may be many, de-pending on the size of the industry, and the likelihood of competi-tion will vary accordingly. In the extreme case in which one firm hasa monopoly of the whole output, concentration will reach its maxi-mum value, but inequality will be nil, and firm size may be largeor small, as the industry may be large or small.
Concentration is not, of course, the only determinant of the de-gree of monopoly and perhaps not even the only relevant charac-teristic of an industry's size structure. Stigler has shown that thenumber of firms that are larger than a given percentage of the lead-ing firm size and account for more than a given percentage of theindustry is correlated with price flexibility.18 Another variable thathas been suggested is the height of the point on the concentrationcurve at which its second difference reaches a minimum. At thispoint the difference between successive firm sizes is greatest.l° Thismeasure may have some importance in those industries in whichthere are a few "giants" separated by a wide gap in size from theremaining firms in the industry, but many concentration curves donot have such a point at all.
2. Choice of an IndexWHILE elementary theoretical considerations suggest the relevanceof our concept of concentration to the study of monopoly and busi-ness policy, they do not enable us to discriminate among the variousindexes that have been used. The choice of measure may affect theoutcome of an investigation since the different indexes involve dif-
18 George J. Stigler, "The Kinky Oligopoly Curve and Rigid Prices," Journalof Political Economy, October i7, p. 444.
19 Cf. Blair, op. cit., p. 8.
63
MEASURES OF CONCENTRATION
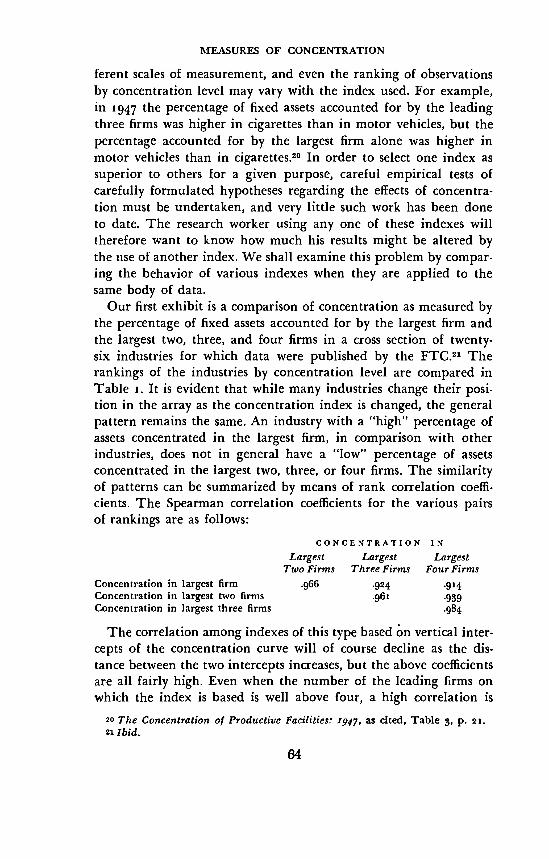
ferent scales of measurement, and even the ranking of observationsby concentration level may vary with the index used. For example,in 1947 the percentage of fixed assets accounted for by the leadingthree firms was higher in cigarettes than in motor vehicles, but thepercentage accounted for by the largest firm alone was higher inmotor vehicles than in cigarettes.20 In order to select one index assuperior to others for a given purpose, careful empirical tests ofcarefully formulated hypotheses regarding the effects of concentra-tion must be undertaken, and very little such work has been doneto date. The research worker using any one of these indexes willtherefore want to know how much his results might be altered bythe use of another index. We shall examine this problem by compar-ing the behavior of various indexes when they are applied to thesame body of data.
Our first exhibit is a comparison of concentration as measured bythe percentage of fixed assets accounted for by the largest firm andthe largest two, three, and four firms in a cross section of twenty-six industries for which data were published by the FTC.21 Therankings of the industries by concentration level are compared inTable 1. It is evident that while many industries change their posi-tion in the array as the concentration index is changed, the generalpattern remains the same. An industry with a "high" percentage ofassets concentrated in the largest firm, in comparison with otherindustries, does not in general have a "low" percentage of assetsconcentrated in the largest two, three, or four firms. The similarityof patterns can be summarized by means of rank correlation coeffi-cients. The Spearman correlation coefficients for the various pairsof rankings are as follows:
CONCENTRATION INLargest Largest Largest
Two Firms Three Firms Four FirmsConcentration in largest firm .966 .924 .914Concentration in largest two firms .961 .939Concentration in largest three firms .984
The correlation among indexes of this type based n vertical inter-cepts of the concentration curve will of course decline as the dis-tance between the two intercepts increases, but the above coefficientsare all fairly high. Even when the number of the leading firms onwhich the index is based is well above four, a high correlation is
20 The Concentration of Productive Facilities: as cited, Table 3, p. 21.21 Ibid.
64
MEASURES OF CONCENTRATION
TABLE aRanking of Industries according to the Percentage of Net Capital Assets
Controlled by the Largest Firms, United States, 1947Largest Largest Largest Largest
Firm Two Firms Three Firms Four Firmsindustry (i) (2) (j) ()
Linoleum 1 3 3 4Tin cans, etc. 2 1 2 2Aluminum 2 1 1
Copper smelting 4 4 4 3and refining
Biscuits, etc. 5 8 ii 11
Agricultural machinery 6 g 12 8Office machinery 7 10 9 9'/2Motor vehicles 8 7 10 12Cigarettes 9 6 5 6Plumbing equipment io 5 7 9½Distilled liquors 11 12 6 7Meat products 12 11 13 13Primary steel 13 i6 i6 17Rubber tires 14 13 8 5Dairy products 15 15 15 15
Glass and glassware iG 14 14 14Carpets and rugs 17 i8 17 i6
Footwear i8 17 19 20
Industrial chemicals 19 19 i8 i8
Woolen and worsted 20 221,4 24 25Electrical machinery 21 20 20 19Grain-mill products 22 221/2 23 23
Aircraft and parts 23 21 21 21Bread, etc. 24 25 25 24Canning 25 24 22 22Drugs and medicines 26 26 26 26
Source: Derived from Reliort on the Concentration of Productive Facilities,1947, FTC, 1949, Table , p. 21.
obtained. This is shown by the comparison of concentration in thelargest four and eight firms in 1935 for a sample of industries forwhich employment-concentration indexes were published by the Na-tional Resources Committee.22 The ranking of industries by the per-centage of employment concentrated in the leading eight firms isvery similar to the ranking by the percentage of employment con-centrated in the leading four firms, the correlation between therankings being .989.
22 The Structure of the American Economy, as cited, Appendix 7, Table 1.The sample was selected by taking every second industry in the table with a ran-dom start. Three industries for which concentration in the leading four firmswas not published and one for which concentration in the leading eight industrieswas not published were omitted.
65
MEASURES OF CONCENTRATION
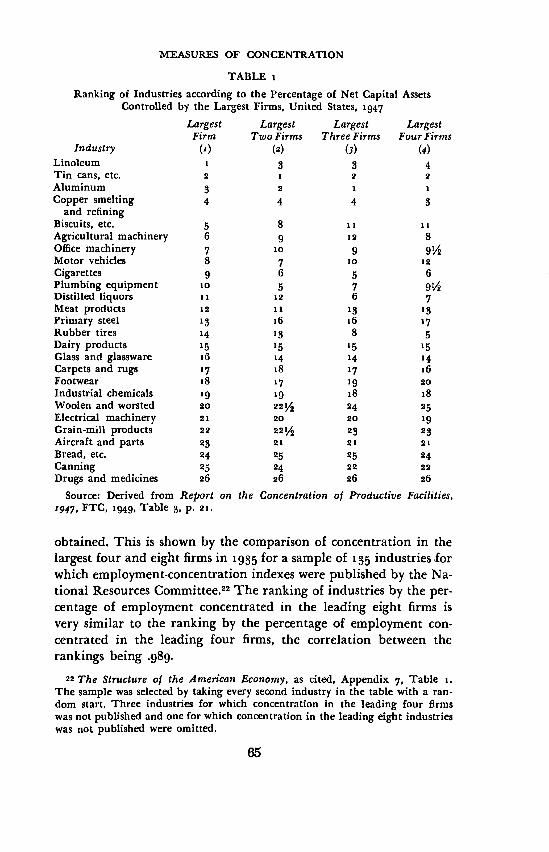
Concentration indexes belonging to three different families arecompared in Table 2. The table shows, for a group of 96 Canadianmanufacturing industries, estimates of (i) the percentage of em-ployment accounted for by the leading three firms; (2) the numberof firms required to account for 8o per cent of employment; (3)
TABLE 2Comparison of Three Concentration Indexes, Selected Canadian Manufacturing
Industries, 1948Index i Index 2 Index 3
Percentage of Number of FirmsEmployment Required to
Accounted Account for Herfindahi'sfor by Leading 8oPer Cent Index,
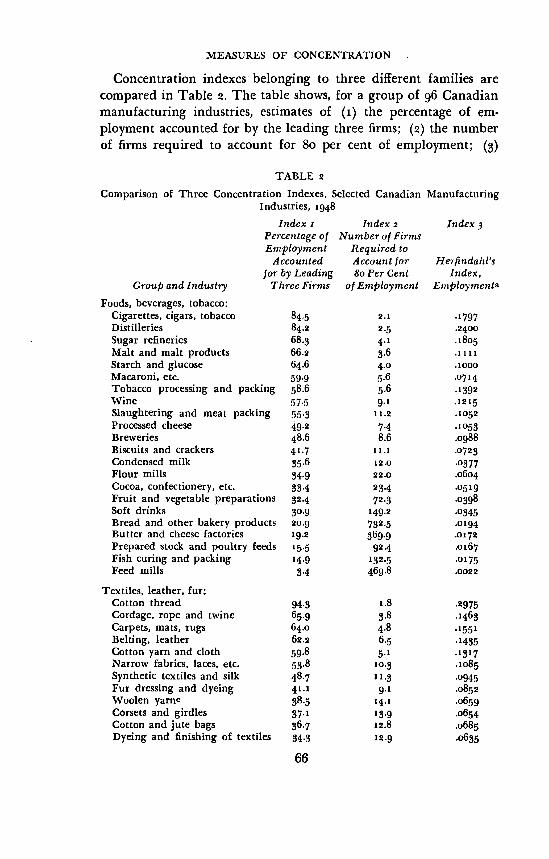
Group and Industry Three Firms of Employment Elnploy?nentaFoods, beverages, tobacco:
Cigarettes, cigars, tobacco 84.5 2.1 .1797Distilleries 84.2 2.5 .2400Sugar refineries 68.3 4.1 .1805Malt and malt products 66.2 3.6 .1111Starch and glucose 64.6 4.0 .1000Macaroni, etc. 59.9 5.6 .0714Tobacco processing and packing 58.6 5.6 .1392Wine 57.5 9.1 .1215Slaughtering and meat packing 55.3 11.2 .1052Processed cheese 49.2 7.4 .1053Breweries 48.6 8.6 .0988Biscuits and crackers 41.7 11.1 .0723Condensed milk 35.6 12.0 .0377Flour mills 94.9 22.0 .0604Cocoa, confectionery, etc. 93.4 23.4 .0519Fruit and vegetable preparations 32.4 72.3 .0398Soft drinks 30.9 149.2 .0345Bread and other bakery products 20.9 732.5 .0194Butter and cheese factories 19.2 369.9 .0172Prepared stock and poultry feeds '5.5 92.4 .oL67Fish curing and packing 14.9 132.5 .0175Feed mills 3.4 469.8 .0022
Textiles, leather, fur:Cotton thread 94.3 i.8 .2975Cordage, rope and twine 65.9 3.8 .1463Carpets, mats, rugs 64.0 4.8 .1551Belting, leather 62.2 6.5 .1435Cotton yarn and cloth 59.8 5.1 .1317Narrow fabrics, laces, etc. 53.8 10.3 .io8Synthetic textiles and silk 48.7 11.3 .0945Fur dressing and dyeing 41.1 9.1 .0852Woolen yarnc 38.5 14.1 .0659Corsets and girdles 37.1 13.9 .0654Cotton and jute bags 36.7 12.8 .o68Dyeing and finishing of textiles 34. 12.9 .0635
66
MEASURES OF CONCENTRATION
TABLE 2 (continued)Index i Index 2 Index,
Percentage of Number of FirmsEmployment Required to
Accounted Account for Herfindahi'sfor by Leading 8o Per Cent index,
Group and industry Three Firms of Employment Employrnenta
Woolen cloth 28.3 25.2 .0412Tanning 26.5 19.3 .0438Contractors, women's clothing 23.4 42.4 .0279Leather gloves 20.9 30.5 .0311Canvas goods 19.9 39.1 .0257Hosiery and knitted goods 15.7 55.8 .0205Miscellaneous leather products 13.8 80.2 .0145Contractors, men's clothing io.8 78.2 .0126Boots and shoes, leather 8.5 109.6 .0087Clothing, men's factory 8.2 155.4 .0078Fur goods 5.6 282.1 .0040Clothing, women's factory 4.0 517.0 .0023
Wood products:Excelsior 62.8 4.0 .1000Coffins and caskets 43.4 14.5 .0759Plywood and veneer 33.8 .0526Flooring 32.0 ia.8 .064 1Boats and canoes 17.0 92.7 .0117Furniture 7.4 277.1 .0047Sawmills 7.0 1,843.4 .0036Planing mills, sash and door
factories 4.6 377.0 .0035
Paper products:Roofing paper 60.5 6.3 .1406Pulp and paper mills 27.8 22.5 .0448Paper boxes and bags i6.8 57.6 .0196
Iron and Steel products:Pig iron gt.9b a.6b .2955bAutomobiles 87.5 1.7 .2181Railway rolling stock 79.2 3.1 .2159Aircraft 78.2 3.1 .20 12Steel ingots and castings 76.3c 34c .2o53cAgricultural implements 63.4 4.4 .1377Bicycles 8o.6 2.9 .1546Shipbuilding 32.3 13.1 .0626Iron castings 19.8 45.9 .0267Machine shops 6.2 229.6 .0046
Nonferrous metals:Aluminum ioo.o (i firm) .8 s.ooooNickel 100.0 (2 firms) .9d .8957d
Nonmetallic minerals:Cement ioo.o 1.2 .3333Gypsum products 91.7 i.6 .2500
67
MEASURES OF CONCENTRATION
TABLE 2 (Continued)Indexi Index a index3
Percentage of Number of FirmsEmployment Required to
Accounted Account for Herfindahl'sfor by Leading 8o Per Cent index,
Group and Industy Three Firms of Employment EmploymentsGlass 91.7 i.6 .2500Artificial abrasives 86.7 2.0 .2000Abrasive products 81.9 2.7 .1850Petroleum products 8o.i 2.99 .2 195Asbestos products 64.0 4.8 .1591Coke products 52.7 5.7 .1204Plate, cut, and ornamental glass 40.4 24.6 .0634Cement products 11.7 119.2 .oii8
Chemicals:Hardwood distillation soo.o (2 firms) s.o .5000Matches g7ge .8o2oeCoal.tar distillation 91.7 i.6 .2500Compressed gases 81.4 2.9 .2272Soaps 74.6 4.1 .1885Boiler compounds 66.7 3.7 .1562Writing inks 66.3 3.8 .1629Washing compounds 56.3 8.a .sii6Printing inks 56.7 6.3 .1121Vegetable oils 53.7 7.0 .1 206Polishes and dressings 6.o 12.1 .0677Paints and varnishes 35.5 22.2 .0478Medicinal and pharmaceutical
preparations 19.7 49.4 .0238
Miscellaneous:Pipes and smokers' supplies 85.3 2.3 .2451Umbrellas 83.5 2.7 .2416Fountain pens and pencils 67.3 44 .1248Buttons 48.9 8.8 .0992a See p. 6o and footnote 8. Figures represent minimum estimates derived from
grouped data on the assumption that firms within each size class are of equal size.b Concentration measured in terms of blast-furnace capacity. Source: The
Primary Iron and Steel Industry, 1948, Dominion Bureau of Statistics, Ottawa,1949, p. 8.
c Concentration measured in terms of steel-furnace capacity. Source: ThePrimary iron and Steel Industry, 5948, Dominion Bureau of Statistics, Ottawa,1949, P. 13.
d Concentration measured in terms of value of sales of nickel producers. Source:Moody's Industrials, 1949.
e Concentration measured in terms of number of matches produced. Source:Matches, Report of Commissioner, Combines Investigation Act, Ottawa, Dec.27, 1949, Ottawa, sgo.
Source: Estimates based on unpublished grouped firm-size distributions ob-tained from Dominion Bureau of Statistics.
68
MEASURES OF CONCENTRATION
Herfindahi's summary index measuring the sum of squares of firmsizes, expressed as percentages of industry size.
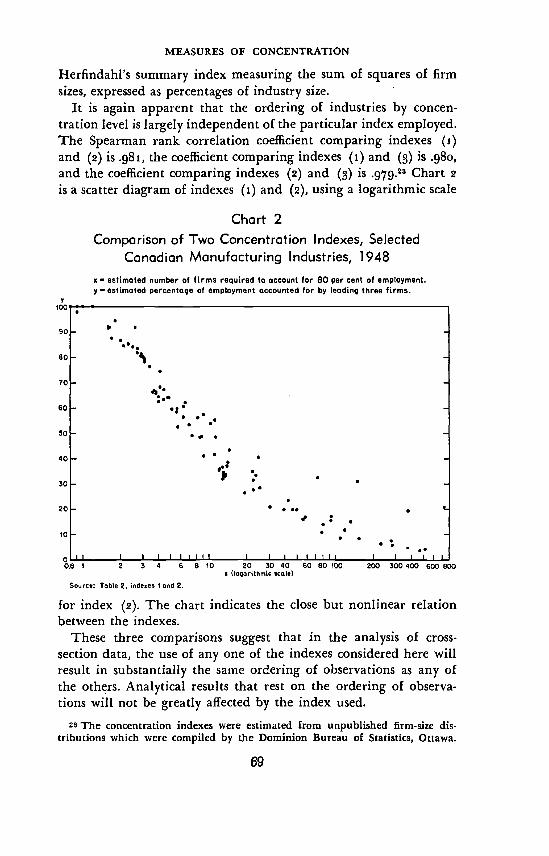
It is again apparent that the ordering of industries by concen-tration level is largely independent of the particular index employed.The Spearman rank correlation coefficient comparing indexes (i)and (2) is .981, the coefficient comparing indexes (i) and (3) is .980,and the coefficient comparing indexes (2) and () is .979.28 Chart 2
is a scatter diagram of indexes (i) and (2) using a logarithmic scale
Chart 2
Comparison of Two Concentration Indexes, SelectedCanadian Manufacturing Industries, 1948
— estimated number of firms required to account for 80 per cent of employment.y — estimated percentage of employment accounted far by leading three firms.
't 9
90- •" •
80
70
60. •5• • •
50- •
20- 9
.10 I •• •
II 111111 111111 I l'l II0.8 1 2 3 4 6 8 10 20 30 40 60 80 100 200 300 400 600 800
a (Isgartibmic scale)
Source: Table 2, indexes I end 2.
for index (2). The chart indicates the close but nonlinear relationbetween the indexes.
These three comparisons suggest that in the analysis of cross-section data, the use of any one of the indexes considered here willresult in substantially the same ordering of observations as any ofthe others. Analytical results that rest on the ordering of observa-tions will not be greatly affected by the index used.
23 The concentration indexes were estimated from unpublished firm-size dis-tributions which were compiled by the Dominion Bureau of Statistics, Ottawa.
69
MEASURES OF CONCENTRATION
3. Comparison of Concentration in the United Statesand the United Kingdom
As AN example of the use of cross-section data on concentration wehave made a comparison of the general level of concentration in themanufacturing industries of the United States and the United King-dom. It is often said that the British economy is less competitivethan that of the United States and it is of interest to see whetherthere is any basis for such a view in the size structure of businessfirms.
Reasonably comparable employment-concentration indexes forboth countries are available for the year 1935.24 The main difficultiesin making a comparison are that the American indexes measure theconcentration of employment in the leading four firms of each in-dustry, while the British data deal with the leading three firms, andthat the industrial classifications are not strictly comparable.
It is, of course, vital for a comparison of this sort that industriesshould be comparable in scope. In general, the more broadly anindustry is defined, the greater will be the number of firms and thelower will be the apparent level of concentration. Inspection of theindustrial classification of the United States Census of Manufacturesand the United Kingdom Census of Production indicates, however,that the scope of the various "industries" is, on the whole, com-parable in the two countries, although there are many differencesof detail.
An over-all comparison can be made, without reconciling eachindividual industry classification, by studying the frequency distri-butions of industries by concentration level in the two countries.ror this purpose the two different indexes used must be reconciled.There is of course no completely accurate method for comparingconcentration in four firms with concentration in three firms, unlessone knows the size of the fourth firm. We have made an estimate bycalculating the straight-line regression of concentration in fourfirms on concentration in three firms for a group of twenty-five in-dustries for which the necessary information was available.25 Even
24 The Structure of the American Economy, as cited, bc. cit., and Leak andMaizels, bc. cit.
25 The Concentration of Productive Facilities, as cited, Table g, p. 21. One ofthe twenty-six industries included there is omitted from our calculation since itcontains only three firms. The regression equation is C4 = 6.784 per cent +.ggi C, where C is concentration in the leading four firms and C, concentrationin the leading three firms, both expressed as percentages. The regression linefits the data very well, the correlation coefficient being .984. The 25 observationsto which this line has been fitted range from per cent to per cent (con-
70
MEASURES OF CONCENTRATION
though the data for this regression equation are for 1947 instead of1935 and measure asset concentration instead of employment con-centration it is probably good enough for our purpose.26 By apply-ing the equation to the class intervals into which the British datawere grouped, a comparable grouping of the American statisticscould be achieved. The comparison is based on all British industriesand a random sample of American industries.27
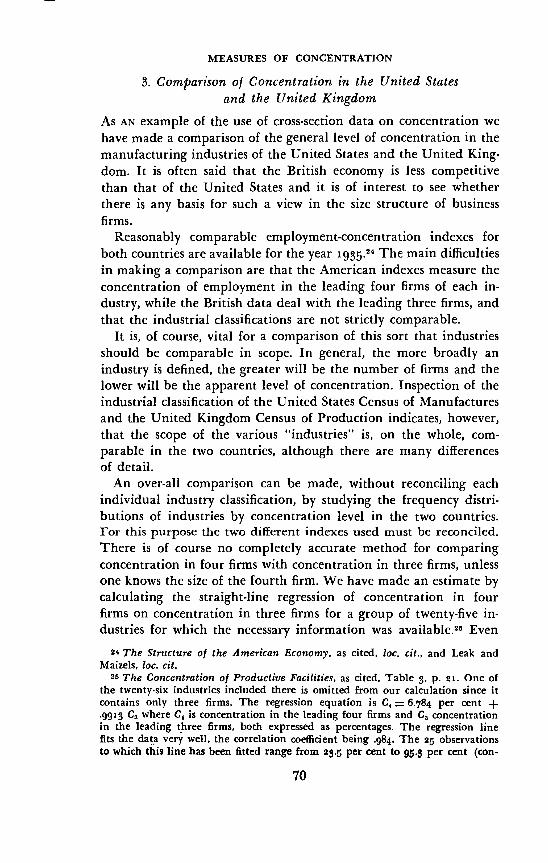
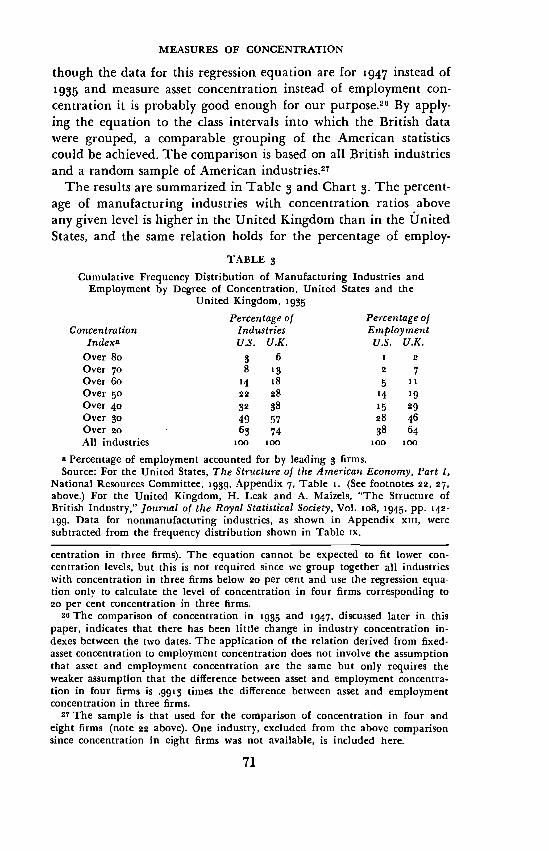
The results are summarized in Table 3 and Chart 3. The percent-age of manufacturing industries with concentration ratios aboveany given level is higher in the United Kingdom than in the UnitedStates, and the same relation holds for the percentage of employ-
TABLECumulative Frequency Distribution of Manufacturing Industries and
Employment by Degree of Concentration, United States and theUnited Kingdom, 1935
Percentage of Percentage ofConcentration Industries Employment
Indexa U.S. U.K. U.S. U.K.Over8o 6 a 2Over7o 8 2 7Over 6o 14 i8 5 11
Over 50 22 28 54 19Over 40 32 8 15 29Over 30 49 57 28 46Over 20 63 74 38 64All industries ioo 100 ioo lao
a Percentage of employment accounted for by leading 3 firms.Source: For the United States, The Structure of the American Economy, Part I,
National Resources Committee, 1939, Appendix 7. Table 1. (See footnotes 22, 27,above.) For the United Kingdom, H. Leak and A. Maizels. The Structure ofBritish Industry," Journal of the Royal Statistical Society, Vol. io8, sg45, pp. 542-199. Data for nonmanufacturing industries, as shown in Appendix xiii, weresubtracted from the frequency distribution shown in Table ix.
centration in three firms). The equation cannot be expected to fit lower con-centration levels, but this is not required since we group together all industrieswith concentration in three firms below 20 per cent and use the regression equa-tion only to calculate the level of concentration in four firms corresponding toso per cent concentration in three firms.
26 The comparison of concentration in 1935 and 1947, discussed later in thispaper, indicates that there has been little change in industry concentration in-dexes between the two dates. The application of the relation derived from fixed-asset concentration to employment concentration does not involve the assumptionthat asset and employment concentration are the same but only requires theweaker assumption that the difference between asset and employment concentra-tion in four firms is .ggi times the difference between asset and employmentconcentration in three firms.
27 The sample is that used for the comparison of concentration in four andeight firms (note 22 above). One industry, excluded from the above comparisonsince concentration in eight firms was not available, is included here.
71
MEASURES OF CONCENTRATION
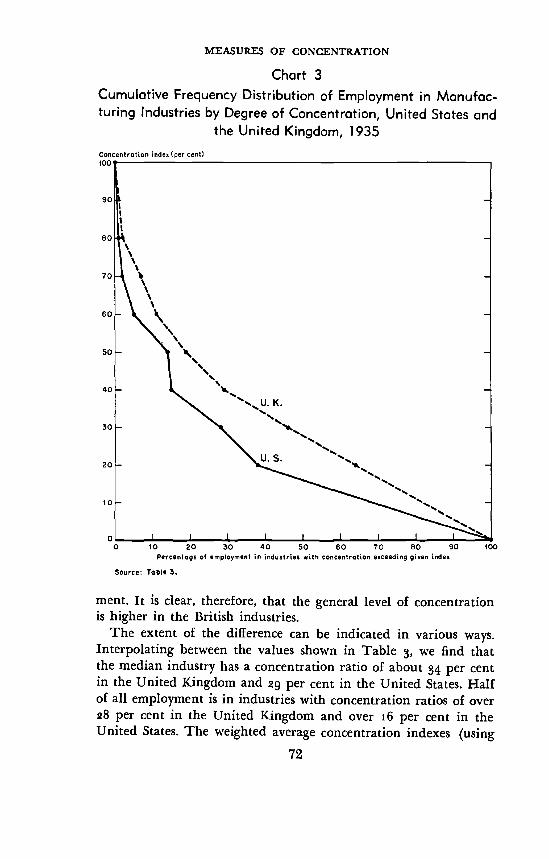
Chart 3
Cumulative Frequency Distribution of Employment in Manufac-turing Industries by Degree of Concentration, United States and
the United Kingdom, 1935
ment. It is clear, therefore, that the general level of concentrationis higher in the British industries.
The extent of the difference can be indicated in various ways.Interpolating between the values shown in Table , we find thatthe median industry has a concentration ratio of about 34 per centin the United Kingdom and g per cent in the United States. Halfof all employment is in industries with concentration ratios of over28 per cent in the United Kingdom and over i6 per cent in theUnited States. The weighted average concentration indexes (using
72
Concentration index (per cent)
10 20 30 40 50 60 70 80Percentope of employment in industries with concentration exceeding given index
Source: Table 3.
MEASURES OF CONCENTRATION
employment in each industry as weights) are 33 per cent for theUnited Kingdom and 19 per cent for the United States.
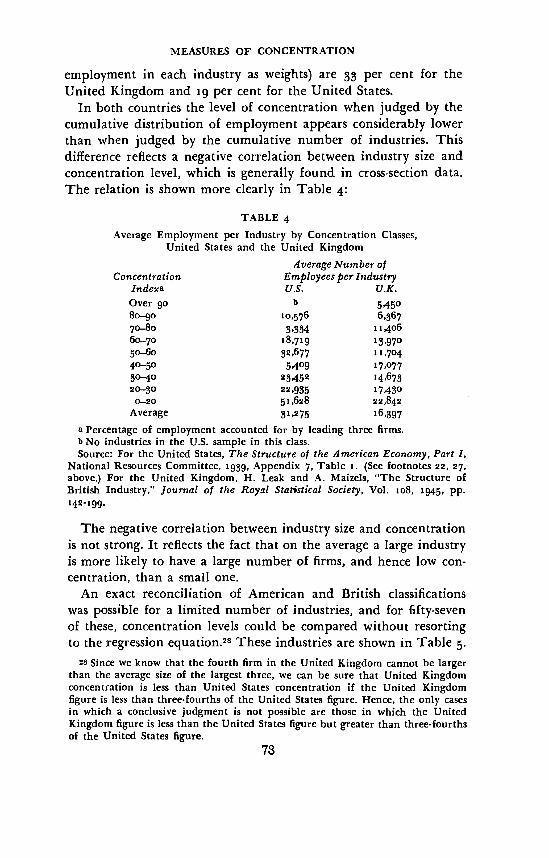
In both countries the level of concentration when judged by thecumulative distribution of employment appears considerably lowerthan when judged by the cumulative number of industries. Thisdifference reflects a negative correlation between industry size andconcentration level, which is generally found in cross-section data.The relation is shown more clearly in Table :
TABLE 4Average Employment per Industry by Concentration Classes,
United States and the United KingdomAverage Number of
Concentration Employees per IndustryIndexa U.S. U.K.Over go b 54508o—go 10,576 6,36770—80 3,334 1140660—70 18,719 13,97050—60 32,677 11,70440—50 5409 17,07730—40 23452 14,67320—30 22,935 17,430
0—20 51,628 22,842Average 31,275 16,397
a Percentage of employment accounted for by leading three firms.b No industries in the U.S. sample in this class.Source: For the United States, The Structure of the American Economy, Part 1,
National Resources Committee, 1939, Appendix 7, Table 1. (See footnotes 22, 27,above.) For the United Kingdom, H. Leak and A. Maizels, "The Structure ofBritish Industry," Journal of the Royal Statistical Society. Vol. io8, 1945, pp.142 199.
The negative correlation between industry size and concentrationis not strong. It reflects the fact that on the average a large industryis more likely to have a large number of firms, and hence low con-centration, than a small one.
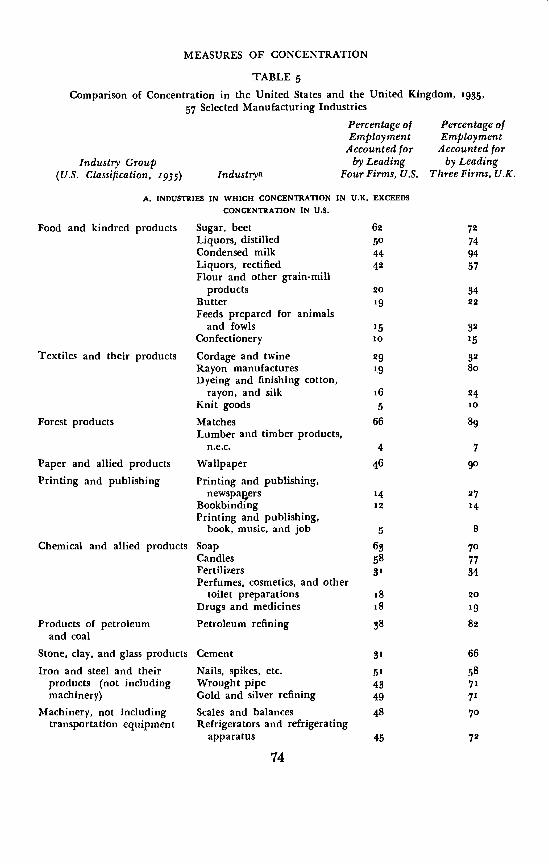
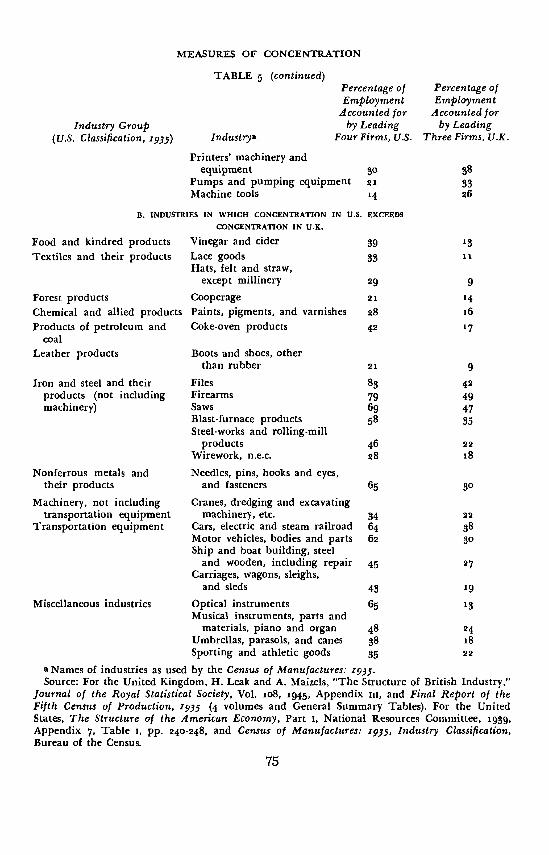
An exact reconciliation of American and British classificationswas possible for a limited number of industries, and for fifty-sevenof these, concentration levels could be compared without resortingto the regression equation.28 These industries are shown in Table 5.
28 Since we know that the fourth firm in the United Kingdom cannot be largerthan the average size of the largest three, we can be sure that United Kingdomconcentration is less than United States concentration if the United Kingdomfigure is less than three.fourths of the United States figure. Hence, the only casesin which a conclusive judgment is not possible are those in which the UnitedKingdom figure is less than the United States figure but greater than three-fourthsof the United States figure.
78
MEASURES OF CONCENTRATION
TABLE 5Comparison oE Concentration in the United States and the United Kingdom,
57 Selected Manufacturing IndustriesPercentage of Percentage ofEmployment Employment
Accounted for Accounted forIndustry Group by Leading by Leading
(U.S. Classification, 1935) Industrya Four Firms, U.S. Three Firms, U.K.
A. INDUSTRIES IN WHICH CONCENTRATION IN U.K. EXCEEDSCONCENTRATION IN U.S.
Food and kindred products Sugar, beet 62 72Liquors, distilled 50 74Condensed milk 44 94Liquors, rectified 42 57Flour and other grain-mill
products 20 34Butter 19 22Feeds prepared for animals
and fowls 15 32Confectionery so 15
Textiles and their products Cordage and twine 29 32Rayon manufactures 1.9 8oDyeing and finishing cotton,
rayon, and silk i6 24Knit goods 5 10
Forest products Matches 66 8gLumber and timber products,
n.e.c. 4 7
Paper and allied products Wallpaper 46 go
Printing and publishing Printing and publishing,newspagers 14 27
Bookbinding 12 14Printing and publishing,
book, music, and job B
Chemical and allied products Soap 63 70Candles 58 77Fertilizers 31 34Perfumes, cosmetics, and other
toilet preparations s8 soDrugs and medicines i8 19
Products of petroleum Petroleum refining 38 82and coal
Stone, clay, and glass products Cement 31 66
Iron and steel and their Nails, spikes, etc. 51 58products (not including Wrought pipe 43 71machinery) Gold and silver refining 49 71
Machinery, not including Scales and balances 48 70transportation equipment Refrigerators and refrigerating
apparatus 45 72
74
MEASURES OF CONCENTRATION
TABLE 5 (continued)Percentage of Percentage ofEmployment Employment
Accounted for Accounted forIndustry Group by Leading by Leading
(U.S. Classification, 5935) Industrya. Four Firms, U.S. Three Firms, U.K.
Printers' machinery andequipment o
Pumps and pumping equipment 21 33Machine tools 14 26
B. INDUSTRIES IN WHICH CONCENTRATION IN U.S. EXCEEDSCONCENTRATION IN U.K.
Food and kindred products Vinegar and ciderTextiles and their products Lace goods it
Hats, felt and straw,except millinery 29 9
Forest products Cooperage 21 14
Chemical and allied products Paints, pigments, and varnishes 28 i6Products of petroleum and Coke.oven products 42 17
coalLeather products Boots and shoes, other
than rubber 21 g
Iron and steel and their Files 83 42products (not including Firearms 79 49machinery) Saws 6g 47
Blast.furnace products 58Steel-works and rolling-mill
products 46 22Wirework, n.e.c. 28 18
Nonferrous metals and Needles, pins, hooks and eyes,their products and fasteners 65 30
Machinery, not including Cranes, dredging and excavatingtransportation equipment machinery, etc. 34 22
Transportation equipment Cars, electric and steam railroad 64 38Motor vehicles, bodies and parts 62 30Ship and boat building, steel
and wooden, including repair 45 27Carriages, wagons, sleighs,
and sleds 43 19
Miscellaneous industries Optical instruments 65 13Musical instruments, parts and
materials, piano and organ 48 24Umbrellas, parasols, and canes 8 i8Sporting and athletic goods 35 22
a Names of industries as used by the Census of Manufactures: 1935.Source: For the United Kingdom, H. Leak and A. Maizels, "The Structure of British Industry,'
Journal of the Royal Statistical Society, Vol. ,o8, 1945, Appendix in, and Final Report of theFifth Census of Production, 5935 (4 volumes and General Summary Tables). For the UnitedStates, The Structure of the American Economy, Part i, National Resources Committee, 1939,Appendix 7, Table i, pp. 240-248, and Census of Manufactures: 1935, Industry Classification,Bureau of the Census.
75
MEASURES OF CONCENTRATION
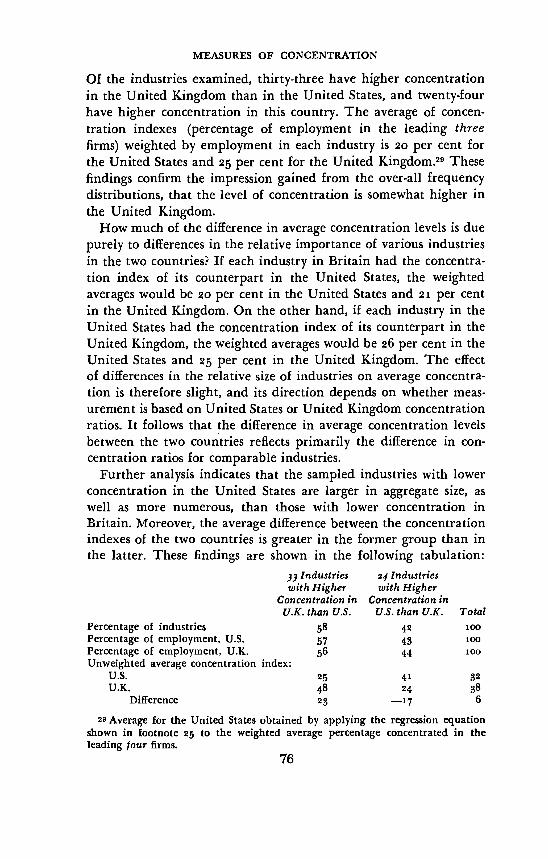
Of the industries examined, thirty-three have higher concentrationin the United Kingdom than in the United States, and twenty-fourhave higher concentration in this country. The average of concen-tration indexes (percentage of employment in the leading threefirms) weighted by employment in each industry is 20 per cent forthe United States and 25 per cent for the United Kingdom.2 Thesefindings confirm the impression gained from the over-all frequencydistributions, that the level of concentration is somewhat higher inthe United Kingdom.
How much of the difference in average concentration levels is duepurely to differences in the relative importance of various industriesin the two countries? If each industry in Britain had the concentra-tion index of its counterpart in the United States, the weightedaverages would be 20 per cent in the United States and 21 per centin the United Kingdom. On the other hand, if each industry in theUnited States had the concentration index of its counterpart in theUnited Kingdom, the weighted averages would be 26 per cent in theUnited States and 25 per cent in the United Kingdom. The effectof differences in the relative size of industries on average concentra-tion is therefore slight, and its direction depends on whether meas-urement is based on United States or United Kingdom concentrationratios. It follows that the difference in average concentration levelsbetween the two countries reflects primarily the difference in con-centration ratios for comparable industries.
Further analysis indicates that the sampled industries with lowerconcentration in the United States are larger in aggregate size, aswell as more numerous, than those with lower concentration inBritain. Moreover, the average difference between the concentrationindexes of the two countries is greater in the former group than inthe latter. These findings are shown in the following tabulation:
industries 24 Industrieswith Higher with Higher
Concentration in Concentration inU.K. than U.S. U.S. than U.K. Total
Percentage of industries 58 42 100Percentage of employment, U.S. 7 43 100Percentage of employment, U.K. 56 44 100Unweighted average concentration index:
U.S. 25 41 32U.K. 48 24 38
Difference 23 _17 6
29 Average for the United States obtained by applying the regression equationshown in footnote 25 to the weighted average percentage concentrated in theleading four firms.
76
MEASURES OF CONCENTRATION
The conclusion suggested by the sample of fifty-seven "matched"industries is that the general level of concentration in British manu-facturing industries is somewhat higher than in the United Statesbecause a majority of industries have higher concentration in theUnited Kingdom, and because in this majority group the inter-country difference in concentration is greater than in the minorityhaving higher concentration in the United States.
These results can be taken only as suggestions since the sampleis of course by no means random. The fifty-seven industries account-ed for 32 per cent of manufacturing employment in the UnitedKingdom and 33 per cent in the United States. The weighted av-erage concentration indexes for the United States and Britain are20 per cent and 25 per cent respectively in the sample and ig percent and per cent respectively for manufacturing as a whole.The sample therefore tends to understate the difference in concen-tration between the two countries.
4. Changes over TimeAa the different concentration indexes also in substantial agree-ment when changes in concentration over time are measured? Theevidence readily available for the investigation of this problem ismore slender and less conclusive than that relating to cross sections.
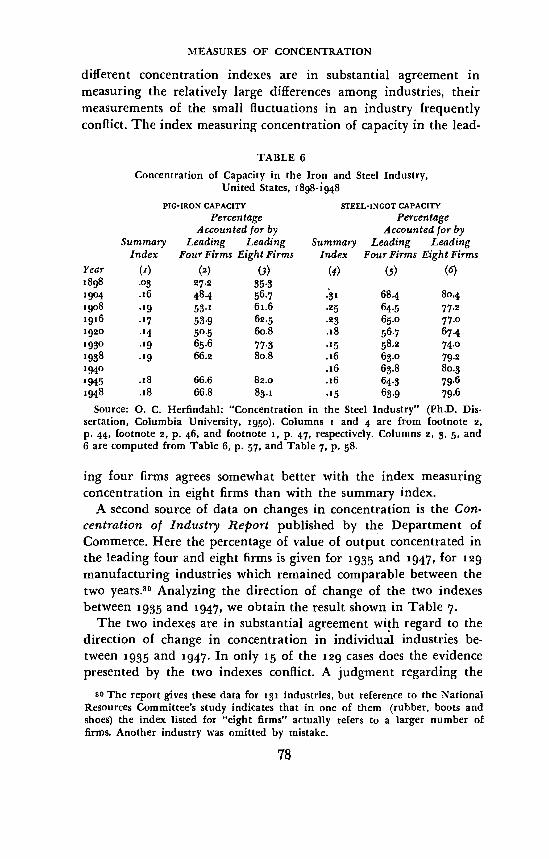
Flerfindahl's study of changes in concentration in the steel indus-try includes a comparison of his summary index with that measuringconcentration in the leading four firms. Table 6 shows time series forconcentration of pig-iron and steel-ingot capacity, based on his data.
The fluctuations in concentration shown in Table 6 are verysmall compared with the average difference in concentration amongindustries shown in Tables 2 and 5. The only large change in thetime series is that associated with the formation of the United StatesSteel Corporation in 1901.
While the increase from i8g8 to 1904 is reflected in all three con-centration indexes, the subsequent small fluctuations are not sohighly correlated as the variation among industries analyzed above.The rank correlation coefficient when Herfindahi's summary indexis compared with the index of concentration in the leading fourfirms is .68 for pig iron and .72 for steel ingot. The rank correlationcoefficient when concentration in the leading four firms and theleading eight firms is compared happens to be 1.00 for pig iron, butis only .53 for steel ingot.
The limited evidence of the steel industry suggests that while the
77
MEASURES OF CONCENTRATION
different concentration indexes are in substantial agreement inmeasuring the relatively large differences among industries, theirmeasurements of the small fluctuations in an industry frequentlyconflict. The index measuring concentration of capacity in the lead-
TABLE 6Concentration of Capacity in the Iron and Steel Industry,
United States, i898-i948PIG-IRON CAPACITY STEEL-INGOT CAPACITY
Percentage PercentageAccounted for by Accounted for by
Summary Leading Leading Summary Leading LeadingIndex Four Firms Eight Firms Index Four Firms Eight Firms
Year (i) (2) (5) () (5) (6)1898 .03 27.2 35.31904 .i6 48.4 56.7 .I 684 80.41908 .19 .i 6s.6 .25 64.5 77.23916 .17 53.9 62.5 .23 6.o 77.01920 .14 50.5 60.8 .s8 56.7 67.41930 .19 65.6 77.3 .15 58.2 74.01938 .19 66.2 8o.8 .s6 63.0 79.21940 .i6 63.8 80.31945 .i8 66.6 82.0 .i6 64.3 79.61948 .i8 66.8 83.1 .15 63.9 79.6
Source: 0. C. Herfindahi: "Concentration in the Steel Industry" (Ph.D. Dis-sertation, Columbia University, 1950). Columns i and 4 are from footnote 2,p. 44, footnote 2, p. 46, and footnote 1, p. 47, respectively. Columns 2, 3, , and6 are computed from Table 6, p. 57, and Table 7, p. 8.
ing four firms agrees somewhat better with the index measuringconcentration in eight firms than with the summary index.
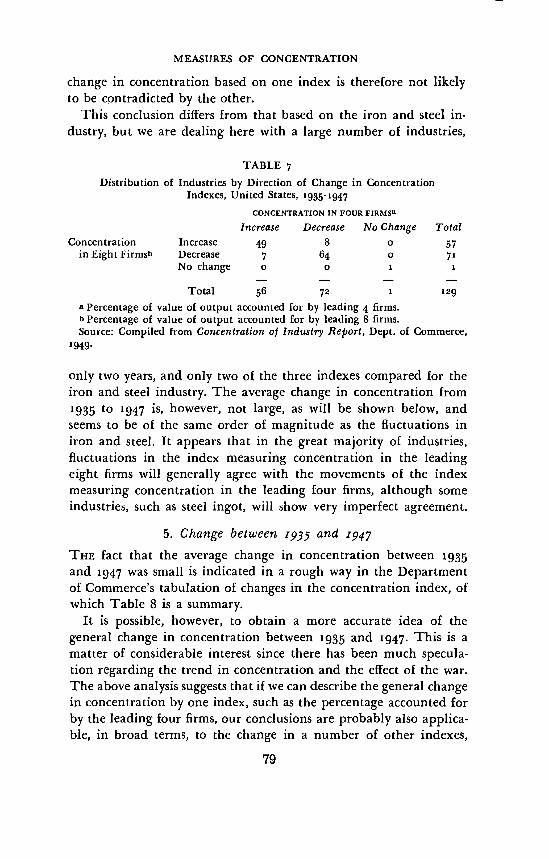
A second source of data on changes in concentration is the Con-centration of Industry Report published by the Department ofCommerce. Here the percentage of value of output concentrated inthe leading four and eight firms is given for '935 and 1947, for 129manufacturing industries which remained comparable between thetwo years.3° Analyzing the direction of change of the two indexesbetween 1935 and 1947, we obtain the result shown in Table 7.
The two indexes are in substantial agreement with regard to thedirection of change in concentration in individual industries be-tween ig and 1947. In only 15 of the 129 cases does the evidencepresented by the two indexes conflict. A judgment regarding the
30 The report gives these data for is industries, but reference to the NationalResources Committee's study indicates that in one of them (rubber, boots andshoes) the index listed for "eight firms" actually refers to a larger number offirms. Another industry was omitted by mistake.
78
MEASURES OF CONCENTRATION
change in concentration based on one index is therefore not likelyto be contradicted by the other.
This conclusion differs from that based on the iron and steel in-dustry, but we are dealing here with a large number of industries,
TABLE 7Distribution of Industries by Direction of Change in Concentration
Indexes, United States, 1935-1947CONCENTRATION IN FOUR FIRMS
Increase Decrease No Change TotalConcentration Increase 49 8 0 57
in Eight Firmsb Decrease 7 64 0 71Nochange 0 0 1 1
Total 56 72 1 129a Percentage of value of output accounted for by leading 4 firms.b Percentage of value of output accounted for by leading S firms.Source: Compiled from Concentration of Industry Report, Dept. of Commerce,
1949.
only two years, and only two of the three indexes compared for theiron and steel industry. The average change in concentration from1935 to 1947 1S, however, not large, as will be shown below, andseems to be of the same order of magnitude as the fluctuations iniron and steel. It appears that in the great majority of industries,fluctuations in the index measuring concentration in the leadingeight firms will generally agree with the movements of the indexmeasuring concentration in the leading four firms, although someindustries, such as steel ingot, will show very imperfect agreement.
5. Change between 1935 and 1947
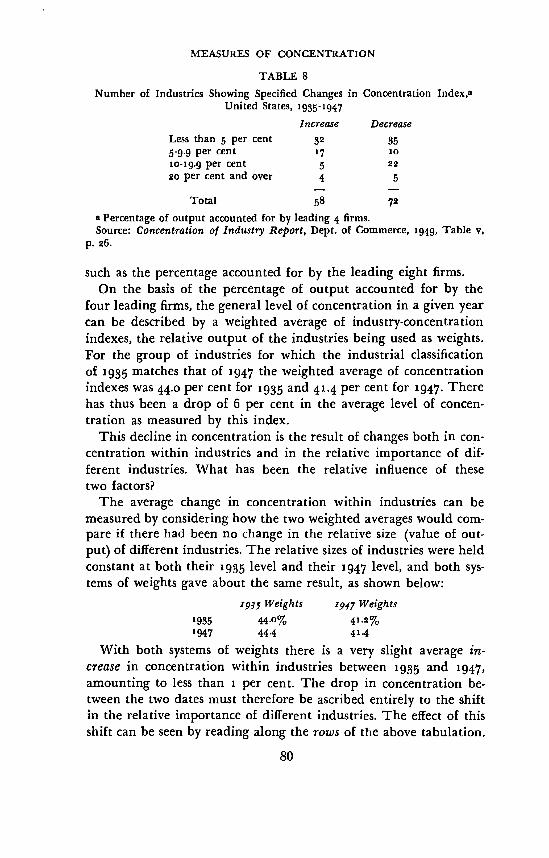
THE fact that the average change in concentration between 1935and 1947 was small is indicated in a rough way in the Departmentof Commerce's tabulation of changes in the concentration index, ofwhich Table 8 is a summary.
It is possible, however, to obtain a more accurate idea of thegeneral change in concentration between 1935 and 1947. This is amatter of considerable interest since there has been much specula-tion regarding the trend in concentration and the effect of the war.The above analysis suggests that if we can describe the general changein concentration by one index, such as the percentage accounted forby the leading four firms, our conclusions are probably also applica-ble, in broad terms, to the change in a number of other indexes,
79
MEASURES OF CONCENTRATION
TABLE 8Number of Industries Showing Specified Changes in Concentration Index,a
United States, 1935-1947Increase Decrease
Less than 5 per cent 32 355-9.9 per cent 17 10
10-19.9 per cent 5 2220 per cent and over 4 5
Total 58 72
a Percentage of output accounted for by leading 4 firms.Source: Concentration of Industry Report, Dept. of Commerce, 1949, Table v,
p. 26.
such as the percentage accounted for by the leading eight firms.On the basis of the percentage of output accounted for by the
four leading firms, the general level of concentration in a given yearcan be described by a weighted average of industry-concentrationindexes, the relative output of the industries being used as weights.For the group of industries for which the industrial classificationof 1935 matches that of 1947 the weighted average of concentrationindexes was 44.0 per cent for 1935 and 41.4 per cent for 1947. Therehas thus been a drop of 6 per cent in the average level of concen-tration as measured by this index.
This decline in concentration is the result of changes both in con-centration within industries and in the relative importance of dif-ferent industries. What has been the relative influence of thesetwo factors?
The average change in concentration within industries can bemeasured by considering how the two weighted averages would com-pare if there had been no change iii the relative size (value of out-put) of different industries. The relative sizes of industries were heldconstant at both their level and their 1947 level, and both sys-tems of weights gave about the same result, as shown below:
1935 Weights 1947 Weights1935 44.0% 41.2%1947 44.4 41.4
With both systems of weights there is a very slight average in-crease in concentration within industries between 1935 and 1947,amounting to less than i per cent. The drop in concentration be-tween the two dates must therefore be ascribed entirely to the shiftin the relative importance of different industries. The effect of thisshift can be seen by reading along the rows of the above tabulation.
80
MEASURES OF CONCENTRATION
If all industry-concentration indexes had remained constant at their1935 level, the shift in the relative importance of industries wouldhave lowered the average from 44.0 per cent to 41.2 per cent. If con-centration indexes had remained constant at their 1947 level, theshift in the relative importance of industries would have loweredthe average from 44.4 per cent to 41.4 per cent.
We conclude that while there have been many changes in con-centration in particular industries between 1935 and 1947, thesechanges have been small in most cases, and they show no unity ofdirection, the average change being close to zero. There has, how-ever, been some increase in the relative size of industries with lowconcentration.8'
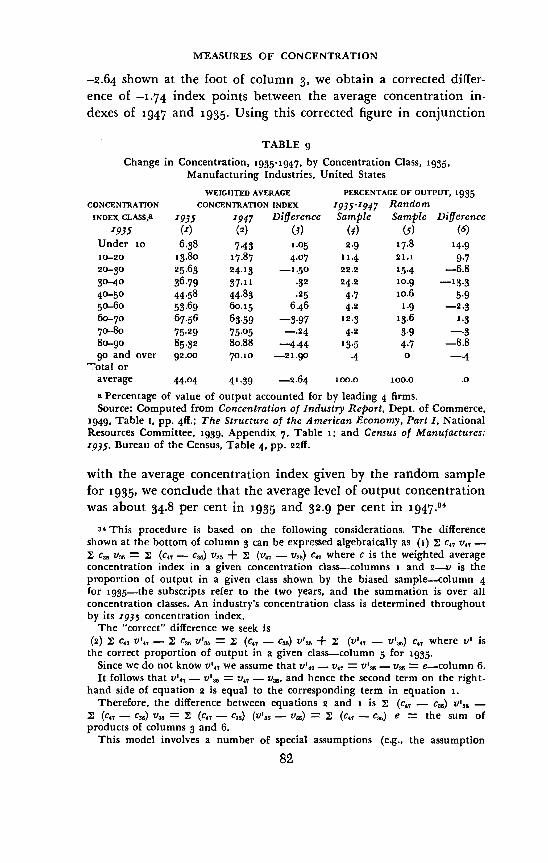
These conclusions are again based on a nonrandom sample. Theweighted average index of output concentration for 1935, as de-rived from this sample, is 44 per cent, while the corresponding indexderived from the random sample of 136 industries used for the com-parison with the United Kingdom is 35 per cent.32 Industries withrelatively high concentration are therefore overrepresented in thepresent sample, and our conclusions are misleading if there is acorrelation between the level of concentration in 1935 and thechange from 1935 to 1947. This possibility is investigated in Table 9,which indicates some association between high concentration (1935)and large decrease in concentration from 2935 to 1947, 50 that itappears that our sample, by overweighting the industries with highconcentration, overstates the decrease in concentration."
The bias in the change in concentration arising from the bias inthe percentage distribution of the sample between concentrationclasses, as shown in columns 4 to 6 of Table 9, can be calculated byadding the products of columns and 6. This procedure yields abias of .90 index points, and adding this to the sample difference of
31 The ten largest of the industries in the sample with lower-than-averageconcentration and greater-than-average increase in output are: soft drinks, maltliquors, poultry dressing, prepared animal feeds, pulp mills, paperboard boxes,lithography, sheet metal work, wire drawing, structural and ornamental products.
The ten largest of the industries with higher-than-average concentration anda smaller increase in value of output between 1935 and 5947 than the averagesare: cereal preparations, malt, chocolate and cocoa products, cane-sugar refining,beet sugar, cigarettes, chewing and smoking tobacco, tires and inner tubes, tincans and other tinware, welded pipe.
82 These figures refer to concentration of output, while the comparison withthe United Kingdom was based on concentration of employment.
33 The observed association may reflect the well-known regression effect, anda grouping by 1947 index classes may show the opposite association.
81
MEASURES OF CONCENTRATION
—2.64 shown at the foot of column 3, we obtain a corrected differ-ence of —1.74 index points between the average concentration in-dexes of 1947 and 1935. Using this corrected figure in conjunction
TABLE 9Change in Concentration, 1935-1947, by Concentration Class, 1935,
Manufacturing Industries, United StatesWEIGHTED AVERAGE PERCENTAGE OF OUTPUT, 1935
CONCENTRATION CONCENTRATION INDEX 1935-1947 RandomINDEX cLASS,a 1935 1947 Difference Sample Sample Difference
1935 (i) () (3) () () (6)Under to 6.38 7.43 1.05 2.9 17.8 14.910—20 13.80 17.87 4.07 11.4 21.1 9.720—30 25.63 24.13 _1.50 22.2 15.4 —6.830—40 36.79 37.11 .32 24.2 10.9 —13.340—50 44.58 44.83 .25 4.7 to.6 5.950—60 53.69 60.15 6.46 4.2 1.9 —2.367o 67.56 63.59 —3.97 12.3 13.6 1.370—80 75.29 75.05 —.24 4.2 3.9 —.380—go 85.32 80.88 —4.44 13.5 4.7 —8.890 and over 92.00 70.10 _21.90 .4 0 —.4
''otal oraverage 44.04 41.39 —2.64 100.0 100.0 .0
a Percentage of value of output accounted for by leading 4 firms.Source: Computed from Concentration of Industry Report, Dept. of Commerce,
'949, Table i, pp. 4ff; The Structure of the American Economy, Part I, NationalResources Committee, 1939, Appendix 7, Table s; and Census of Manufactures:'935, Bureau of the Census, Table 4, pp. 22ff.
with the average Concentration index given by the random samplefor 1935, we conclude that the average level of output concentrationwas about 34.8 per cent in i9 and 32.9 per cent in l947.
34 This procedure is based on the following considerations. The differenceshown at the bottom of column can be expressed algebraically as (i) c47 v4, —
c3, v = (C47 — c) s'35 + (vi. — v,5) c,7 where c is the weighted averageconcentration index in a given concentration class—columns m and 2—V is theproportion of output in a given class shown by the biased sample_column 4for 1935_the subscripts refer to the two years, and the summation is over allconcentration classes. An industry's concentration class is determined throughoutby its 1935 concentration index.
The 'correct" difference we seek is(2) c4 v', — c,,, v'3, = (c4, — c) v'. + (s"47 — uP31) c4, where v' isthe correct proportion of output in a given class-column 5 for 1935.
Since we do not know v' we assume that v' — u = V'35 — = e—column 6.It follows that si'47 — v',5 = v4, — v35, and hence the second term on the right-
hand side of equation 2 is equal to the corresponding term in equation i.Therefore, the difference between equations 2 and i is i (c47 — c,,) s"5, —(ci, — c,,) si,5 = (c47 — c35) (V' — it35) = (c4 — c,,) e = the sum of
products of columns and 6.This model involves a number of special assumptions (e.g., the assumption
82
MEASURES OF CONCENTRATION
The stability of concentration patterns shown by our sample hascharacterized a twelve-year period in which average plant size (interms of employment) has increased by 21 per cent and total em-ployment in manufacturing has increased by 73 per cent. This im-pressive increase in activity, the great technological advances of theperiod, the uneven wartime increase in plant capacity, the increasedparticipation of government in economic activity, and all the otherchanges associated with the New Deal, war, and postwar readjust-ment have had remarkably little effect on the average level of in-dustry concentration. The great expansion of industry size has beenmatched by increases in average firm size and/or in the degree ofinequality of firm size within industries.
6. The Dimensions of MeasurementTHE problems of measurement discussed in the preceding sectionshave been concerned with the form of the concentration index andwith techniques for summarizing a large number of concentrationreadings.
Equally important, however, are problems concerning what mightbe called the "dimensions" of concentration. First, what is the ap-propriate business unit for the measurement of concentration? Theplant? The firm? What degree of corporate control should definethe firm? What about firms that operate in several industries? Sec-ondly, what is the appropriate "scope" of an index? An industry(that is, group of plants or firms)? A product? A regional sector ofan industry? How are industries or products to be classified? Thirdly,how should size be measured? In the preceding sections employment,
that the 1935-1947 sample correctly represents the average concentration indexin each class, or that v'47 — v' — v41 — ii,,) but it is nevertheless a fairly reliableand fast method of calculating the bias due to the association o( high initialconcentration and decreasing concentration.
This correction has not, of course, taken account of bias arising from othersources. Both new and rapidly growing industries and industries that are oldand declining are likely to be in the group for which ig and '947 classificationsare not comparable, and hence omitted from the sample. The former are oftendivided and redivided by the statistician as they grow, while the latter, whenthey become small enough, are merged into the "other" or "miscellaneous"groups.
We may hazard the guess that the rapidly growing industries are characterizedby decreasing concentration, and the decaying industries by increasing concentra-tion (cf. TNEC Monograph No. 27, Part i, Chap. iv, especially pp. 58-59, 61.62).Over the period 1935.1947 the former undoubtedly predominated so that it seemslikely that the over-all decline in concentration is greater than the correctedfigure shown by the sample.
88
MEASURES OF CONCENTRATION
output, and fixed assets have all been used, and other measures,such as income, are possible. Finally, what is the best time periodfor the measurement of concentration; for example, output in amonth? A year? A two-year period? These problems are, of course,to some extent interdependent. For example, if the index is basedon products it would be difficult to use employment as the measureof size.
We shall not undertake an exhaustive discussion of these questionshere. The most appropriate set of dimensions must depend on theparticular problem in hand, and the set of dimensions actually usedwill depend only partly on what is most appropriate and verylargely on the statistics that are available. In every empirical studyof concentration the investigator will have to substitute what hecan get for what he would like.
Instead of discussing the "optimum" set of dimensions we shalltherefore comment on the empirical relation between some of thealternatives. Such comparisons must be of interest to any investi-gator forced to use "substitutes," and will also reveal importantfeatures of the industrial structure.
PLANTS AND FIRMS
THE statistics published by the National Resources Committee, TheConcentration of Industry Report for 1947, and the firm.size datacompiled by the Canadian Bureau of Statistics for 1948, all use"industries" that are defined as groups of plants with a commonmajor product. The "firms" in these statistics consist of groups ofplants under common ownership within such an industry. A firmthat has plants in two industries as defined by the Census of Manu-factures appears in the statistics as two firms.
If the industry classification is reasonably suitable for the studyof monopoly, this definition of the firm and the industry is prob-ably more appropriate for the measurement of concentration inparticular markets than one which would throw all activities of thefirm into the same industry. An incidental advantage for our presentpurpose is that this classification enables us to compare plant- andfirm-concentration indexes having exactly comparable scope.
Firm concentration in an industry cannot be lower than plantconcentration, but it may be higher if there are multiplant firms.Each firm has at least one plant, so that the collective size of the
84
MEASURES OF CONCENTRATION
largest x firms cannot be less, but may be greater, than the size ofthe x largest plants.85
Two important questions can be answered by a comparison ofplant and firm concentration for a cross section of industries. First,are plant and firm concentration correlated? If we have data con-cerning one, can we draw conclusions concerning the other? Sec-ondly, how great is the difference between plant and firm concen-tration? If all multiplant firms were split up, and their plants madeindependent, how much lower would the level of concentration be?
Analysis of the Canadian statistics for 1948, for the sample of in-dustries listed in Table 2, shows that the ranking of industries by firm-concentration index is very similar to the ranking by plant-concen-tration index. The Spearman correlation coefficient for the tworankings is .947. This analysis is based on employment concentra-tiOn86
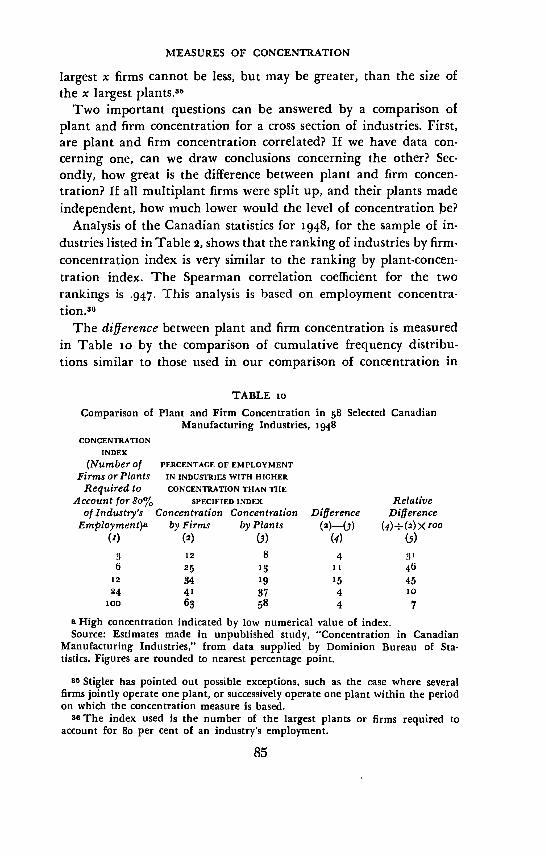
The difference between plant and firm concentration is measuredin Table io by the comparison of cumulative frequency distribu-tions similar to those used in our comparison of concentration in
TABLE 10Comparison of Plant and Firm Concentration in 58 Selected Canadian
Manufacturing Industries, 1948CONCENTRATION
INDEX(Number of PERCENTAGE OF EMPLOYMENT
Firms or Plants IN INDUSTRIES WITH HIGHERRequired to CONCENTRATION THAN THE
Account for 80% SPECIFIED INDEX Relativeof Industry's Concentration Concentration Difference Difference
Employment)a by Firms by Plants (2)_(;) (4)÷(2)X 100(x) (2) (j) () (j)
3 12 8 4 31
6 25 13 Ii 4612 34 19 15 4524 41 37 4 10
100 63 58 4 7
a High concentration indicated by low numerical value of index.Source: Estimates made in unpublished study, "Concentration in Canadian
Manufacturing Industries," from data supplied by Dominion Bureau of Sta-tistics. Figures are rounded to nearest percentage point.
85 Stigler has pointed out possible exceptions, such as the case where severalfirms jointly operate one plant, or successively operate one plant within the periodon which the concentration measure is based.
86 The index used is the number of the largest plants or firms required toaccount for 8o per cent of an industry's employment.
85
MEASURES OF CONCENTRATION
the United States and the United Kingdom. The table is based ona group of 58 industries in which concentration measured on a"national" basis can reasonably be expected to be related to pricepolicy. Industries with a very heterogeneous product structure orproducts that are largely produced in other industries are excluded,as are industries with substantially separate regional markets andthose in which imports or exports play a large role.
A comparison of plant and firm concentration that is to be rele-vant to problems of social policy must provide the answer to thisquestion: If one takes a given concentration level as representingthe maximum compatible with adequate competition, how large isthe industrial sector with "excessive" firm concentration, and howmuch would it be reduced if all plants were independent? Table ioanswers this question for the concentration levels shown.
The table shows, for example, that 25 per cent of all employmentis in industries in which fewer than six firms account for 8o percent, but only 13 per cent of all employment is in industries inwhich fewer than six plants account for 8o per cent. Hence, if allplants were made independent, the total employment representedby "excessively" concentrated industries would be reduced by 40per cent, as shown in column . If any concentration index between3 and 12 is taken as representing the highest level that should betolerated, a drastic "trust-busting" policy would reduce the area of"excessive concentration" by between one-third and one-half.
How far are these findings for Canada applicable to the UnitedStates? A comparison of plant and firm concentration in this countryhas recently been published by the Federal Trade Commission, butunfortunately it does not answer either of the questions we haveasked above.8
A rough idea of the degree to which the Canadian results areapplicable to the United States can, however, be obtained by com-paring the number of plants per firm in the manufacturing indus-tries of the two countries. The decile values of the number of plantsper firm in the 96 Canadian industries on which our correlation of
37 The Divergence Between Plant and Company Concentration, 1947, as cited.In this study the divergence between plant and company concentration is meas-ured by the area between the plant and company concentration curves for thefirst fifty plants and firms, and is presented as an index, based on the medianarea as ioo. It is impossible to tell from these statistics how closely plant andfirm concentration are correlated, or how much the area of "excessive concentra-tion" (on any given definition) differs when plant and firm concentration arecompared.
86
MEASURES OF CONCENTRATION
plant and firm concentration is based are compared below withthose for 452 United States manufacturing industries for 1947.88
Number of Plants per Firm96 Canadian Industries 152 U.S. Industries
Decile 1948 1947
1 1.00 1.002 1.00 1.01
3 1.01 1.024 1.02—1.03 1.045 1.05 i.o66 1.09 1.107 1.17—1.18 1.158 1.31—1.32 1.249 1.75—1.81 1.52—1.56
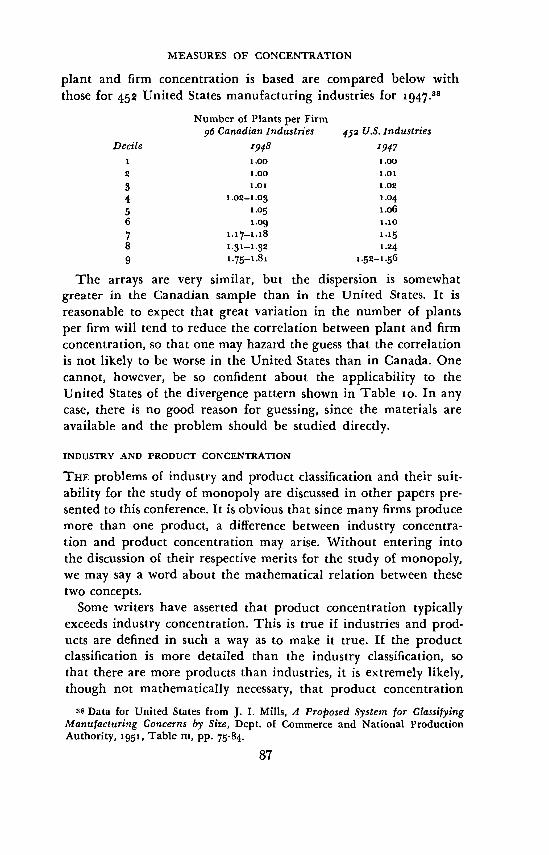
The arrays are very similar, but the dispersion is somewhatgreater in the Canadian sample than in the United States. It isreasonable to expect that great variation in the number of plantsper firm will tend to reduce the correlation between plant and firmconcentration, so that one may hazard the guess that the correlationis not likely to be worse in the United States than in Canada. Onecannot, however, be so confident about the applicability to theUnited States of the divergence pattern shown in Table io. In anycase, there is no good reason for guessing, since the materials areavailable and the problem should be studied directly.
INDUSTRY AND PRODUCT CONCENTRATION
THE problems of industry and product classification and their suit-ability for the study of monopoly are discussed in other papers pre-sented to this conference. It is obvious that since many firms producemore than one product, a difference between industry concentra-tion and product concentration may arise. Without entering intothe discussion of their respective merits for the study of monopoly,we may say a word about the mathematical relation between thesetwo concepts.
Some writers have asserted that product concentration typicallyexceeds industry concentration. This is true if industries and prod-ucts are defined in such a way as to make it true. If the productclassification is more detailed than the industry classification, sothat there are more products than industries, it is extremely likely,though not mathematically necessary, that product concentration
38 Data for United States from J. I. Mills, A Proposed System for ClassifyingManufacturing Concerns by Size, Dept. of Commerce and National ProductionAuthority, igi, Table ni, pp. 75-84.
87
MEASURES OF CONCENTRATION
will be higher than industry concentration. The average productmarket will be smaller than the average industry, and if there is anydegree of specialization among firms, the average number of firmsproducing a given product will be less than the average number offirms in an industry, so that concentration will tend to be higher.It is therefore not surprising that the general level of concentrationin 1,807 manufactured products analyzed by W. F. Crowder in hisstudy for the TNEC is considerably higher than the average levelof concentration in manufacturing industries analyzed by Meansfor the National Resources Committee. The product classificationused by Crowder was much finer than the Census of Manufacturesindustry classification.
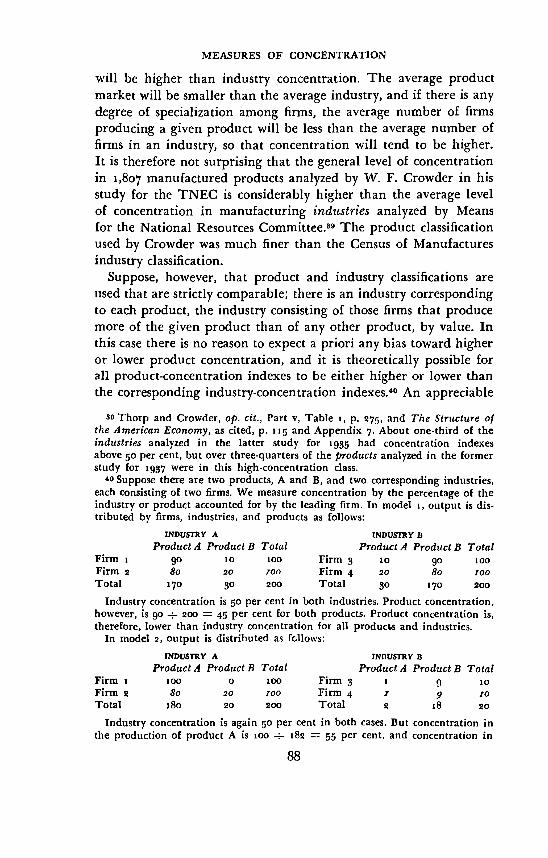
Suppose, however, that product and industry classifications areused that are strictly comparable; there is an industry correspondingto each product, the industry consisting of those firms that producemore of the given product than of any other product, by value. Inthis case there is no reason to expect a priori any bias toward higheror lower product concentration, and it is theoretically possible forall product-concentration indexes to be either higher or lower thanthe corresponding industry-concentration indexes.° An appreciable
30 Thorp and Crowder, op. cit., Part V. Table s, p. 275, and The Structure ofthe American Economy, as cited, p. 115 and Appendix 7. About one-third of theindustries analyzed in the latter study for 1935 had concentration indexesabove 50 per cent, but over three-quarters of the products analyzed in the formerstudy for 1937 were in this high-concentration class.
40 Suppose there are two products, A and B, and two corresponding industries,each consisting of two firms. We measure concentration by the percentage of theindustry or product accounted for by the leading firm. In model s, output is dis-tributed by firms, industries, and products as follows:
INDUSTRY A INDUSTRY BProduct A Product B Total Product A Product B Total
Firm 1 90 10 100 Firm 10 90 100Firm 2 8o 20 ZOO Firm 4 ao 8o zooTotal 170 30 200 Total 30 170 200
Industry concentration is 50 per cent in both industries. Product concentration,however, is 90 ± 200 = 45 per cent for both products. Product concentration is,therefore, lower than industry concentration for all product.s and industries.
In model 2, OUtput is distributed as fcllows:INDUSTRY A INDUSTRY B
Product A Product B Total Product A Product B TotalFirm i 100 0 100 Firm 3 t g soFirm 2 8o 20 ZOO Firm 4 r 9 10Total i8o 20 200 Total 2 i8 20
Industry concentration is again 50 per cent in both cases. But concentration inthe production of product A is 100 ± 182 = 55 per cent, and concentration in
88
MEASURES OF CONCENTRATION
divergence of product concentration from industry concentration isof course not likely in those industries where the product accountsfor the bulk of the industry's output and no large portion of theproduct originates outside the industry. Since industry-concentra-tion data are often used as a substitute for product concentration,the percentage of the industry's output accounted for by the productand the percentage of the total product output produced outsidethe industry should be studied in interpreting such data.
OUTPUT, EMPLOYMENT, AND ASSETS
THE concentration statistics used in the preceding sections haveemployed value of output, employment, and fixed assets as measuresof Size. If we wish to know whether results obtained by the use ofone of these variables are applicable to another, two questions mustbe answered. First, are there systematic differences in the level ofconcentration as measured by these three variables, and secondly,does an industry having high or low concentration (in relation toother industries) in terms of one of the measures also have high orlow concentration in terms of another.
Output and assets concentration can be compared for a verylimited number of industries by using the Department of Com-merce Concentration of Industry Report and the FTC Report onthe Concentration of Productive Facilities, 1947. For eleven indus-tries the classifications appear to be comparable so that a com-parison of concentration indexes can be made. Even for this lim-ited group of industries the scope of the indexes is not strictly com-parable, since in the FTC's study the "industry" consists of a groupof firms, while the "industry" as defined by the Census of Manu-factures and used in the Department of Commerce study consists ofa group of plants and a "firm" consists of those plants within anindustry that are under common ownership.
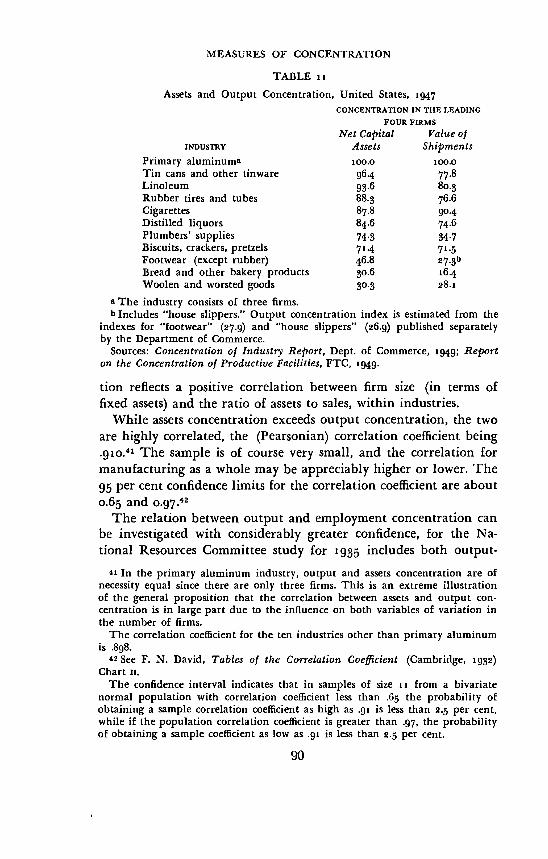
The comparison of assets and output concentration in eleven in-dustries is shown in Table ii.
In this sample assets concentration exceeds output concentration.There are only two industries in which this relation is reversed—cigarettes and biscuits—and in the latter the concentration indexesdiffer by a negligible amount. The higher level of assets concentra-
product B is 20 -i.- = 53 per cent. In this example, therefore, product con-centration exceeds industry concentration for all products and industries.
The Census of Manufactures contains many examples of industry-product rela-(ions such as those used in these models.
89
MEASURES OF CONCENTRATION
TABLE iiAssets and Output Concentration, United States, '947
CONCENTRATION IN THE LEADING
FOUR FIRMSNet Capital Value of
INDUSTRY Assets ShipmentsPrimary aluminuma 100.0 100.0Tin cans and other tinware 96.4 77.8Linoleum 93.6 80.3Rubber tires and tubes 88.3 76.6Cigarettes 87.8 90.4Distilled liquors 84.6 74.6Plumbers' supplies 74.3 34.7Biscuits, crackers, pretzels 71.4 71.5Footwear (except rubber) 46.8 27.3bBread and other bakery products 30.6 16.4Woolen and worsted goods 30.3 28.1
a The industry consists of three firms,b Includes "house slippers." Output concentration index is estimated from the
indexes for "footwear" (27.9) and "house slippers" (26.9) published separatelyby the Department of Commerce.
Sources: Concentration of Industry Report, Dept. of Commerce, 1949; Reporton the Concentration of Productive Facilities, FTC, 1949.
tion reflects a positive correlation between firm size (in terms offixed assets) and the ratio of assets to sales, within industries,
While assets concentration exceeds output concentration, the twoare highly correlated, the (Pearsonian) correlation coefficient being.9io.' The sample is of course very small, and the correlation formanufacturing as a whole may be appreciably higher or lower. The95 per cent confidence limits for the correlation coefficient are about0.65 and 0.97.42
The relation between output and employment concentration canbe investigated with considerably greater confidence, for the Na-tional Resources Committee study for 1935 includes both output-
41 In the primary aluminum industry, output and assets concentration are ofnecessity equal since there are only three firms. This is an extreme illustrationof the general proposition that the correlation between assets and output con-centration is in large part due to the influence on both variables of variation inthe number of firms,
The correlation coefficient for the ten industries other than primary aluminumis .898.
42 See F. N. David, Tables of the Correlation Coefficient (Cambridge, 1932)Chart II.
The confidence interval indicates that in samples of size 11 from a bivariatenormal population with correlation coefficient less than .6 the probability ofobtaining a sample correlation coefficient as high as .91 is less than 2.5 per cent,while if the population correlation coefficient is greater than .yi, the probabilityof obtaining a sample coefficient as low as .91 is less than 2.5 per cent.
90
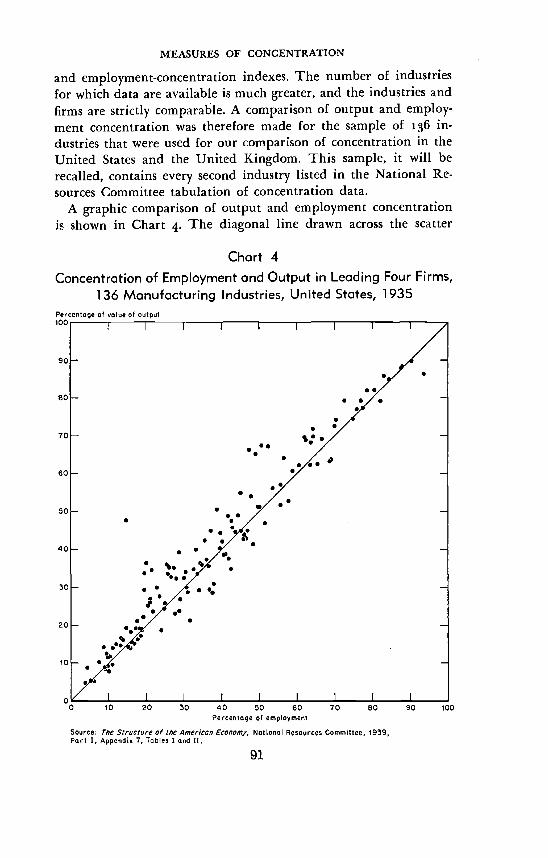
MEASURES OF CONCENTRATION
and employment-concentration indexes. The number of industriesfor which data are available is much greater, and the industries andfirms are strictly comparable. A comparison of output and employ-ment concentration was therefore made for the sample of 186 in-dustries that were used for our comparison of concentration in theUnited States and the United Kingdom. This sample, it will berecalled, contains every second industry listed in the National Re-sources Committee tabulation of concentration data.
A graphic comparison of output and employment concentrationis shown in Chart . The diagonal line drawn across the scatter
Chart 4
Concentration of Employment and Output in Leading Four Firms,136 Manufacturing Industries, United States, 1935
91
Percentage of value at output
0 10 20 30 40 50 60 90 100Percentage of employment
Source: rite Structure of the American Economy. National Resources Committee, 1939,Port 1, Appendin 7, Tables I and It.
70 60
r1EASURES OF CONCENTRATION
diagram is not a regression line fitted to the points, but is intendedto show where the points would lie if output concentration wereexactly equal to employment concentration in all industries. Thediagram shows that the majority of points lie above this line, indi-cating that in most of the industries output concentration exceedsemployment concentration. This tendency is, however, not over-whelming. In 48 of the 136 industries examined—over one-third ofthe total_output concentration is less than employment concen-tration, and in two industries they are equal. Nevertheless, there isa considerable difference between the weighted average indexes ofoutput and employment concentration. The former (using value-of-output weights) is 35 per cent, while the latter (using employ-ment weights) is 26 per cent.
The diagram also shows that output and employment concentra-tion are highly correlated, so that the value of one can be used withgreat confidence for estimating the other. The rank correlationcoefficient relating output and employment concentration is .g8.
These two investigations suggest that while, in general, concen-tration in terms of fixed assets exceeds output concentration, whichin turn exceeds employment concentration, the ordering of indus-tries by concentration level is much the same, no matter whichstandard of size is used, so that the results of cross-section analysesbased on one measure will also be applicable to the others. Withrespect to asset concentration, this conclusion is based on a verysmall sample and must be regarded as tentative.
THE TIME PERIOD
THE concentration statistics we have examined are all based onperiods of one year, but it is not obvious that this particular periodis the most suitable for the study of the structural factors that governbusiness policy. Stigler has suggested that the period is too short,since there is a random element in the year-to-year changes in a firm'soutput, so that a concentration index based on annual data may notadequately reflect the normal long-run size structure that is relevantto considerations of price policy. He has also suggested that an indexbased on a longer period would show lower values than one basedon a year, since the averaging of fluctuations in individual firmsizes tends to lower their inequality.
Given a constant group of firms, an index based on a period ofseveral years may be lower than the average of indexes for the com-ponent years if the ranking of firms changes during the period, and
92
MEASURES OF CONCENTRATION
it would be of interest to investigate the actual importance of suchchanges for different industries and periods. Some evidence on thispoint is provided by Crowder's study of product concentration forthe TNEC. Comparing the four leading companies in 1935 and igfor 262 products, he tabulated the extent to which the leaders co-incided in the two years, as shown in the following summary:43
Number of Firmsamong the Leading
Four in Both Percentage of Cases1935 and '937 (Products)
4 193 412 271 110 2
100
Over the three-year period covered by this comparison, two ormore of the leading firms were replaced by others in 40 per cent ofthe cases. This result certainly suggests that concentration indexescomputed on a three-year basis would tend to be lower than the cor-responding average of annual concentration indexes. Crowder sug-gests that the identity of the leading firms is more stable in old,well-established industries and in industries not subject to style ormodel changes than in others.
Granted that random year-to-year fluctuations in output are im-portant and should not be reflected in the concentration index, theaveraging or summing of output figures for individual firms may notbe the best solution. The structural characteristics that a concentra-tion index is intended to measure are not fixed; they may changeover time, and one of the purposes of our indexes is to measure thischange. In averaging firm sizes for several years one may average outnot only random fluctuations but also real, long-term changes inindustrial structure. This problem could perhaps be handled by theuse of moving averages; an alternative solution would be to measureconcentration for short periods, but in terms of a variable less sub-ject to random fluctuations than output and employment. It wouldbe reasonable to treat changes in capacity as representing structuralchanges that should be reflected in the index, and to measure con-
41 We compiled this summary from the detailed data in Thorp and Crowder,op. cit., Part v, Table IC, pp. 495-505. In the text (p. 342) Crowder gives thenumber of products as 256 instead of 262 and the percentage of cases in whichtwo of the leaders repeat as 7 instead of 27. The figure 256 is probably an error,and the figure 7 per cent certainly is, since his other percentages agree with ours.
93
MEASURES OF CONCENTRATION
centration in terms of plant capacity owned by each firm, thuseliminating the effect of fluctuations in the use of capacity.
At present we have no comprehensive data for either the measure-ment of concentration for longer periods than a year or its measure-ment in terms of capacity, and we can only speculate about the timeperiod and measure of size most closely related to business policy.This is just one illustration of the need for better data and tests ofcarefully framed hypotheses, to be discussed in the next section.
7. Empirical TestsWE ix not, as yet, know enough about the behavior of the variousconcentration indexes to be able to choose between them in investi-gating any given problem. Such knowledge can, however, be gainedby using the indexes in empirical tests of hypotheses regarding theinfluence of concentration on business policy. Some, but very little,systematic work in this direction has been done to date.
Tests of this sort are not likely to discriminate effectively amongthe various indexes unless the concentration measures are used inconjunction with other determining variables, and the effects of thedifferent variables are segregated as far as possible.
The danger involved in neglecting other variables is illustratedby an experiment we performed on a recent study by J. S. Bain. Bainfinds a weak but significant association between profit rate and con-centration index in a cross section of 42 industries, using the per-centage of employment in the leading eight firms (taken from theNational Resources Committee study) as measure of concentration.We found a very slightly better (inverse) association between hisprofit-rates data and the number of plants in each industry.4 It
44 Joe S. Bain, "Relation of Profit Rate to Industry Concentration, AmericanManufacturing, 1936-1940," Quarterly Journal of Economics, August, igi, pp.293-324, esp. Table I, p. 312 and pp. 311-17.
For this comparison we used Kendall's rank correlation coefficient, which isbased on a comparison of all possible pairs of observations. We say that twovariables_profit rate and concentration_agree" in a pair of observations (in-dustries) if their ranks are in the same order, e.g., if higher profit rate in in-dustry A than in industry B is associated with higher concentration in industryA than in industry B. Supplementing Bain's data by the number of plants ineach of the industries (from the 1935 Census of Manufactures), we can classifythe pairs of industries by type of agreement as follows
94
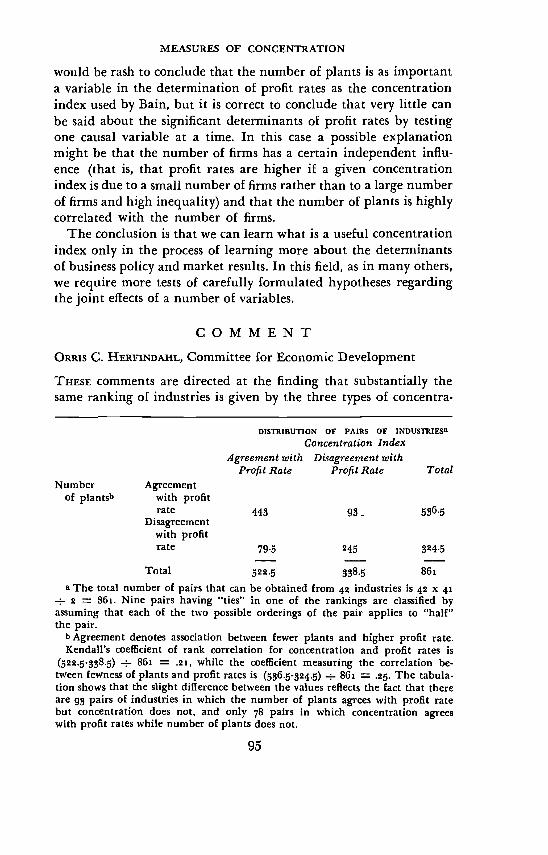
MEASURES OF CONCENTRATION
would be rash to conclude that the number of plants is as importanta variable in the determination of profit rates as the concentrationindex used by Bain, but it is correct to conclude that very little canbe said about the significant determinants of profit rates by testingone causal variable at a time. In this case a possible explanationmight be that the number of firms has a certain independent influ-ence (that is, that profit rates are higher if a given concentrationindex is due to a small number of firms rather than to a large numberof firms and high inequality) and that the number of plants is highlycorrelated with the number of firms.
The conclusion is that we can learn what is a useful concentrationindex only in the process of learning more about the determinantsof business policy and market results. In this field, as in many others,we require more tests of carefully formulated hypotheses regardingthe joint effects of a number of variables.
COMMENTORRIs C. HERFINDAHL, Committee for Economic Development
THESE comments are directed at the finding that substantially thesame ranking of industries is given by the three types of concentra
DISTRIBUTION OF PAIRS OF INDUSTRIESConcentration Index
Agreement with Disagreement withProfit Rate Profit Rate Total
Number Agreementof plantsb with profit
rate 443 536.5Disagreement
with profitrate 79.5 245 324.5
Total 522.5 338.5 86ia The total number of pairs that can be obtained from 42 industries is 42 x 41
± 2 — 86i. Nine pairs having "ties" in one of the rankings are classified byassuming that each of the two possible orderings of the pair applies to "half"the pair.
b Agreement denotes association between fewer plants and higher profit rate.Kendall's coefficient of rank correlation for concentration and profit rates is
(522.5-338.5) 86s = .21, while the coefficient measuring the correlation be-tween fewness of plants and profit rates is (536.5-324.5) ÷ 86i .25. The tabula-tion shows that the slight difference between the values reflects the fact that thereare 93 pairs of industries in which the number of plants agrees with profit ratebut concentration does not, and only 78 pairs in which concentration agreeswith profit rates while number of plants does not.
95
MEASURES OF CONCENTRATION
tion measures compared by Rosenbiuth.' My remarks do not repre-sent disagreement with his findings and evaluation of their signifi-cance, but serve to emphasize some points that were perhaps inade-quately stressed in his paper.
Agreement among the ranks resulting from the use of these threemeasures of concentration does not, of course, permit the conclusionthat the measures are good indicators of monopoly power or businesspolicy. They may be equally poor indicators, suggesting differencesamong industries where none exist or even suggesting differences inthe wrong direction. Lack of knowledge on this point should lead tocaution in evaluations of Rosenbluth's study of concentration changesover time in the United States and his comparison of manufacturingindustries in the United States and the United Kingdom. We cannotbe sure whether limited differences in these concentration measuresover time or between countries are important or not. This is not tosay that such investigations, using measures whose significance forbusiness behavior is not well understood, are not useful. After all,these measures came to be used because observation indicates, at theleast, that some differences in the sizes of the coefficients are stronglyassociated with differences in the behavior of the industries' firms.Similarly, a showing of substantial change in concentration over aperiod of time is important because a part of the changes withinindustries will likely be indicative of changes in competition eventhough some of the changes in concentration are not.
In measuring concentration, the goal need not be, however, ameasure whose every level corresponds to a different degree of com-petition. If we think of the measurement problem in terms of theconcentration, numbers, and inequality framework used by Rosen-bluth in his paper, the various combinations of number and in-equality produce a concentration surface for a given measure. It isnot necessary that the levels of this surface be in a one-to-one cor-respondence with the competitive behavior of the industry, for asignificant improvement in the measurement of concentration wouldbe represented by a partitioning of this surface into several sectors,each corresponding to a different degree of competitiveness.
We can be quite sure that the three types of measure under con-sideration in the paper do correspond with the competitiveness of
1 The three types of measures are (s) the percentage of the industry's outputaccounted for by a given number of leading firms, (2) the number of leadingfirms required to account for a given percentage of the industry's output, and ()a 'summary' measure equal to the reciprocal of the number of firms in the indus-try times one plus the square of the coefficient of variation of the firm's outputs.
96
MEASURES OF CONCENTRATION
industry behavior for rather extreme values of the measures, but thearea of uncertainty is sizable. So long as studies of the relationshipbetween the values taken on by these measures and the behavior ofthe industries are lacking, the possibility is open that the measuresdo not take account of some significant aspects of the size distribu-tions. In the case of the first two types of measures, there is somedoubt that they give proper weight to the number of firms in theindustry. The definitions of these measures do not include the num-ber of firms, and the association between the measures and the num-ber of firms is weak enough for the same level of concentration to beassigned to industries with possibly important differences in thenumber of firms.
From Rosenbluth's reformulations of types one and two measures,in order to show the relations among concentration, number, andinequality that are desirable in a measure of concentration, it mayappear that the two measures do adequately reflect the number offirms. His purpose, however, was a demonstration of the desirablerelationships and not that number is actually taken into account.Following Rosenbiuth's suggestion, the type one measure_e.g. thepercentage controlled by the top four firms—can be regarded as
4 (average size of 4 largest)Total no. (average size of all firms),of firms
with the right factor viewed as a measure of inequality and the leftfactor reflecting the number of firms. But this measure can also beviewed as
average size of 4 largestaverage size if firms
accounted for all output.The number of firms is not essential to calculation of the measure.
The type two measure can be viewed as N (n/N), where n is thenumber of firms required to account for a given percentage of in-dustry output and N is the total number of firms in the industry.But the total number of firms cancels out in this formulation sothat again it is not essential to calculation of the measure.
The fact that these two measures reflect only one point in the dis-tribution rather than the whole distribution also makes it possiblefor inequality to change, with number of firms constant, withoutaffecting the measure of concentration, contrary to the relationshipsdesired if we choose to measure concentration in terms of number
97
MEASURES OF CONCENTRATION
and inequality. Suppose there are two industries with the firms' out-puts distributed as follows:
INDUSTRY A INDUSTRY B
Firm Outputs Cumulated Outputs Firm Outputs Cumulated Outputs40 40 55 5535 75 20 7515 90 20 9510 100 5 100
100 100
Concentration is the same in both industries if it is measured by thepercentage of output accounted for by the two largest firms or by thenumber of firms required to account for 75 per cent of the industry'soutput. Yet inequality is greater in industry B, unless special sig-nificance is attributed to the cumulated values for two firms.2
The fact that a measure can permit inequality to increase withoutshowing an increase in concentration, number of firms remainingthe same, is not necessarily a serious defect. Nor does a showing thatthe number of firms is not essential to the calculation of a concentra-tion measure permit the conclusion that the measure is inadequate.It may be highly correlated with the number of firms or if it is not,the size distributions that it fails to distinguish may actually notdiffer in any respect significant for industry behavior.
The second possibility is not dealt with here, but the 1947 datafrom the Department of Commerce study of concentration in manu-facturing can throw some light on the question of correlation be-tween types one and two measures and the number of firms. It willbe recalled that the rank correlations between type one measuresfor one, two, three, and four firms, based on the twenty-six industryFTC data, were all over .90. The lowest was .gi, between one and fourfirms. The 1935 National Resources Committee data gave a corre-lation of . for measures based on four and eight firms, and theCanadian data gave a correlation of .g8 between types one andtwo measures, using measurement axes of three firms and 8o percent of employment, and a coefficient of .98 between type three andeach of the first two types.
The 1947 Commerce data suggest that these measures would notbe so highly correlated with measures that give more weight to the
2 The 'summary" measure used by Rosenbluth, the sum of the squares of thepercentage/mo outputs of the firms, does differentiate between the two in-dustries because it depends on the outputs of all the firms. By this measure,concentration is .s5 for industry A and for industry B.
98
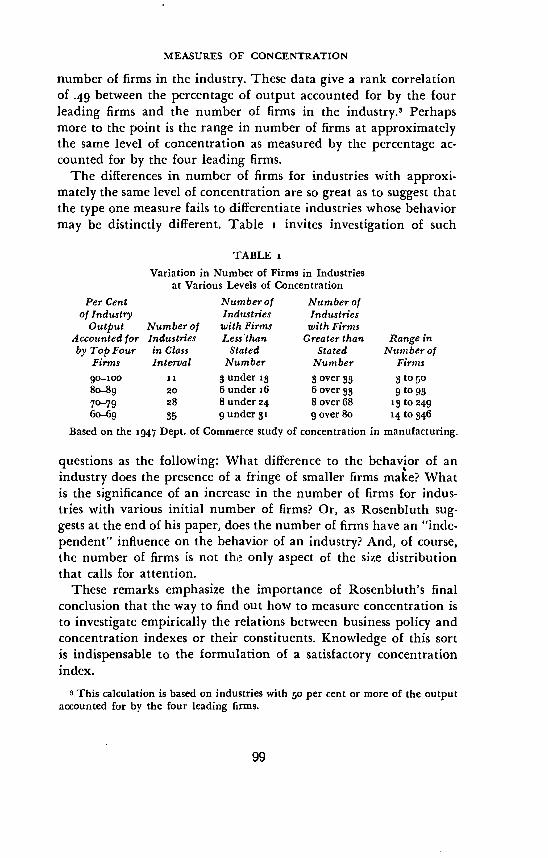
MEASURES OF CONCENTRATION
number of firms in the industry. These data give a rank correlationof .49 between the percentage of output accounted for by the fourleading firms and the number of firms in the industry.3 Perhapsmore to the point is the range in number of firms at approximatelythe same level of concentration as measured by the percentage ac-counted for by the four leading firms.
The differences in number of firms for industries with approxi-mately the same level of concentration are so great as to suggest thatthe type one measure fails to differentiate industries whose behaviormay be distinctly different. Table 1 invites investigation of such
TABLE 1Variation in Number of Firms in Industries
at Various Levels of ConcentrationPer Cent Number of Number of
of Industry Industries IndustriesOutput Number of with Firms with Firms
Accounted for Industries Less'than Greater than Range inby Top Four in Class Stated Stated Number of
Firms Interval Number Number Firms90—100 11 3underl3 3over33 3to5o80-89 20 6 under i6 6 over 9 to 970—79 28 8 under 24 8 over 68 13 to 24960-69 35 gundert gover8o 14 to 346
Based on the 1947 Dept. of Commerce study of concentration in manufacturing.
questions as the following: What difference to the behavior of anindustry does the presence of a fringe of smaller firms make? Whatis the significance of an increase in the number of firms for indus-tries with various initial number of firms? Or, as Rosenbiuth sug-gests at the end of his paper, does the number of firms have an "inde-pendent" influence on the behavior of an industry? And, of course,the number of firms is not the only aspect of the size distributionthat calls for attention.
These remarks emphasize the importance of Rosenbiuth's finalconclusion that the way to find out how to measure concentration isto investigate empirically the relations between business policy andconcentration indexes or their constituents. Knowledge of this sortis indispensable to the formulation of a satisfactory concentrationindex.
S This calculation is based on industries with 50 per cent or more of the outputaccounted for by the four leading firms.
99