Embed Size (px)
Citation preview
Measures of Academic Progress Interim Assessments
for Grades K – 12
Your comprehensive guide to MAP from NWEA
2 Measures of Academic Progress Interim Assessments for Grades K – 12 Partnering to Help All Kids Learn® | NWEA.org
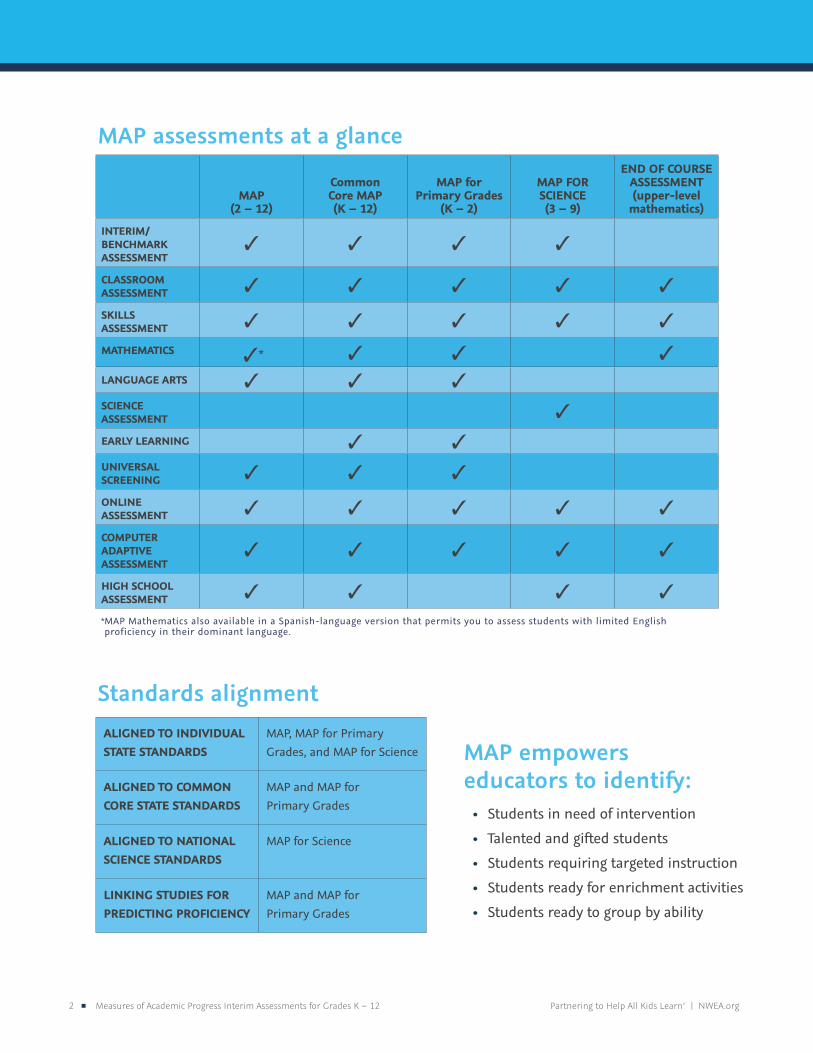
MAP empowers educators to identify:
• Students in need of intervention
• Talented and gifted students
• Students requiring targeted instruction
• Students ready for enrichment activities
• Students ready to group by ability
MAP (2 – 12)
Common Core MAP (K – 12)
MAP for Primary Grades
(K – 2)
MAP FOR SCIENCE (3 – 9)
END OF COURSE ASSESSMENT (upper-level mathematics)
INTERIM/BENCHMARK ASSESSMENT
✓ ✓ ✓ ✓
CLASSROOM ASSESSMENT ✓ ✓ ✓ ✓ ✓
SKILLS ASSESSMENT ✓ ✓ ✓ ✓ ✓
MATHEMATICS ✓* ✓ ✓ ✓
LANGUAGE ARTS ✓ ✓ ✓SCIENCE ASSESSMENT ✓
EARLY LEARNING ✓ ✓UNIVERSAL SCREENING ✓ ✓ ✓
ONLINE ASSESSMENT ✓ ✓ ✓ ✓ ✓
COMPUTER ADAPTIVE ASSESSMENT
✓ ✓ ✓ ✓ ✓
HIGH SCHOOL ASSESSMENT ✓ ✓ ✓ ✓
ALIGNED TO INDIVIDUAL STATE STANDARDS
MAP, MAP for Primary Grades, and MAP for Science
ALIGNED TO COMMON CORE STATE STANDARDS
MAP and MAP for Primary Grades
ALIGNED TO NATIONAL SCIENCE STANDARDS
MAP for Science
LINKING STUDIES FOR PREDICTING PROFICIENCY
MAP and MAP for Primary Grades
MAP assessments at a glance
Standards alignment
* MAP Mathematics also available in a Spanish-language version that permits you to assess students with limited English proficiency in their dominant language.
503.624.1951 | 121 NW Everett St. Portland, OR 97209 Measures of Academic Progress Interim Assessments for Grades K – 12 3
ContentsOVERVIEW OF MAP ASSESSMENTS ...................................................4
Measure growth to support every student’s unique learning path .........................................5
Inform K – 12 instruction with MAP ............................................................................................8
MAP subjects and standards ..........................................................................................................9
VALID, RELIABLE DATA .................................................................. 12
Identify each student’s performance level with pinpoint precision ...................................... 13
Compare and contrast student performance with MAP Norms ............................................ 18
THE BENEFITS OF MEASURING GROWTH ....................................... 20
Accelerate growth with actionable data .................................................................................... 21
MAP assessments and rigorous new standards ........................................................................ 24
Drive growth with MAP: six powerful approaches ................................................................... 28
MAKE THE MOST OF MAP DATA ..................................................... 31
Empower educators with professional learning ...................................................................... 32
Extend your data to promote individual learning .................................................................. 36
“It’s all about growth. And we see tremendous growth every year, which is wonderful. We’ve taken MAP and we’ve used it to the point of excellence.
Dean Cunningham, Principal, Nenahnezad Community School, New Mexico
4 Measures of Academic Progress Interim Assessments for Grades K – 12 Partnering to Help All Kids Learn® | NWEA.org
Overview of MAP Assessments
503.624.1951 | 121 NW Everett St. Portland, OR 97209 Measures of Academic Progress Interim Assessments for Grades K – 12 5
Measure growth to support every student’s unique learning pathMeasures of Academic Progress® (MAP®) K – 12 interim assessments provide essential information about a student’s continuum of learning and growth trajectory. Discover why educators around the globe trust MAP to deliver instructional insights that help them accelerate student learning.
The many uses of MAP dataMAP assessments provide real-time information that helps teachers teach, students learn, and administrators lead.
TEACHERSPersonalize instruction in order to maximize every student’s academic growth.
PRINCIPALS Track the achievement and growth of individual students and classrooms in order to help evaluate the success of programs.
EDUCATIONAL LEADERS Understand the progress of every student, classroom, and school in your district.
6 Measures of Academic Progress Interim Assessments for Grades K – 12 Partnering to Help All Kids Learn® | NWEA.org
Discover data that help you make a difference in every student’s learning and growthTo quickly reveal the precise achievement of every student, use our computer adaptive MAP interim assessments. Based on over 30 years of solid research, MAP adapts to each student’s learning level, creating personalized assessment experiences.
Within 24 hours of assessing, you’ll have essential information about what your K – 12 students know—and are ready to learn—on rigorous new state standards.
“A MAP assessment is different because it is student-centric. It’s not about external accountability to the state. It’s not about test prep for a college entrance exam. It’s focused on accurately reflecting a student’s achievement and instructional level. Using MAP test results for differentiation, flexible grouping, feedback, and resource alignment help us accelerate students’ learning.”
— Steve Petros, Assessment Specialist, Grand Rapids Public Schools, Michigan
The unique design of MAP produces valid, reliable student growth data
• Inform in-the-moment instructional practices.
• Measure the growth of every student over time regardless of on, above, or below grade level performance—and even if standards change.
• Engage students and families with goal setting.
• Create and reinforce evidence-informed instructional practices.
• Evaluate programs and identify professional development needs.
• Compare and predict student achievement and growth over time via exclusive normative and growth information.
Test in fall, winter, and spring for a consistent longitudinal measure of student growth. It’s an ideal way to get a clear picture of your students’ learning, proficiency, and college readiness regardless of whether scores on your state summative assessment show drops in proficiency.
Each year, educators around the globe trust MAP data to deliver instructional insights that help them accelerate student learning for nearly eight million students. Read on to learn more about how MAP student growth data can help you support each of your students’ unique learning paths.
503.624.1951 | 121 NW Everett St. Portland, OR 97209 Measures of Academic Progress Interim Assessments for Grades K – 12 7
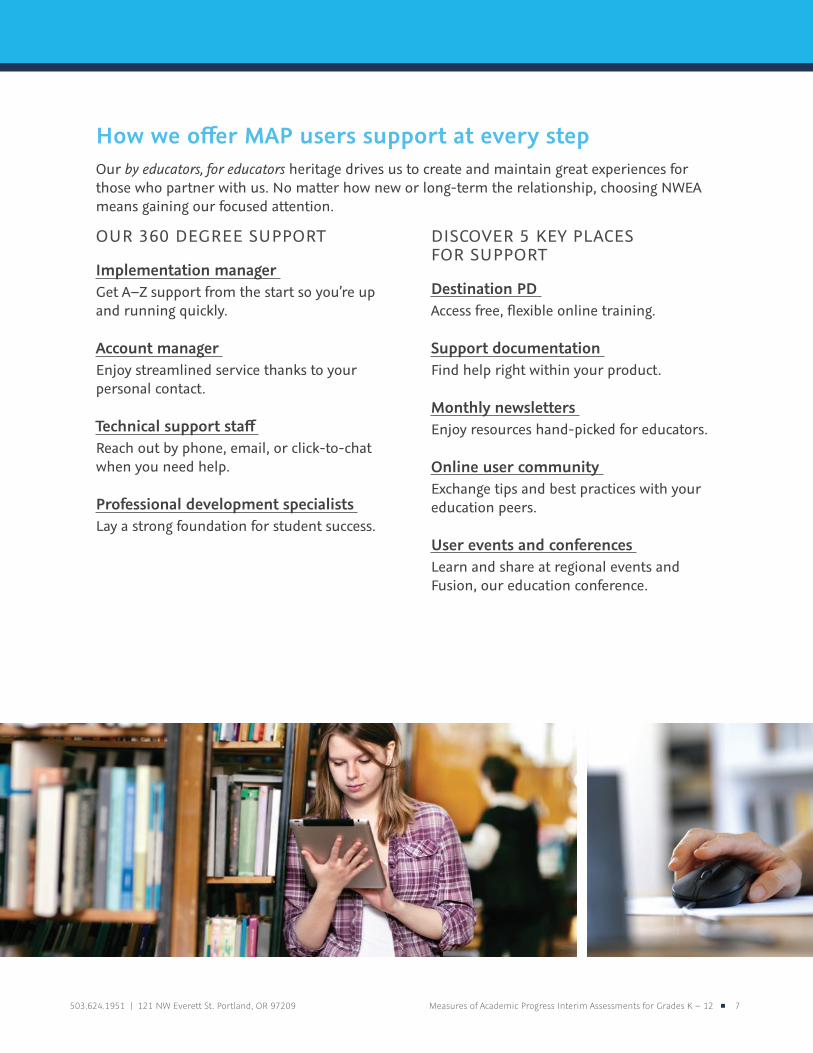
How we offer MAP users support at every stepOur by educators, for educators heritage drives us to create and maintain great experiences for those who partner with us. No matter how new or long-term the relationship, choosing NWEA means gaining our focused attention.
OUR 360 DEGREE SUPPORT
Implementation manager Get A–Z support from the start so you’re up and running quickly.
Account manager Enjoy streamlined service thanks to your personal contact.
Technical support staff Reach out by phone, email, or click-to-chat when you need help.
Professional development specialists Lay a strong foundation for student success.
DISCOVER 5 KEY PLACES FOR SUPPORT
Destination PD Access free, flexible online training.
Support documentation Find help right within your product.
Monthly newsletters Enjoy resources hand-picked for educators.
Online user community Exchange tips and best practices with your education peers.
User events and conferences Learn and share at regional events and Fusion, our education conference.
8 Measures of Academic Progress Interim Assessments for Grades K – 12 Partnering to Help All Kids Learn® | NWEA.org
Inform K – 12 instruction with MAPMAP delivers powerful student growth data when educators need them the most—when there’s still time to make a difference. Use its real-time data to create targeted instructional plans. Benefit from its ability to track every student’s growth and achievement within and across the years. And see how its valid, reliable results support growth measurement and benefit students, teachers, and parents.
“NWEA is the absolute backbone to our success. NWEA and MAP helped us begin our journey towards data analysis and creating a culture of data. We have worked together to embrace the use of data to drive instruction, and by doing that, we have achieved great results with student performance.”
— Joseph Powers, Superintendent, Crawford AuSable School District, Michigan
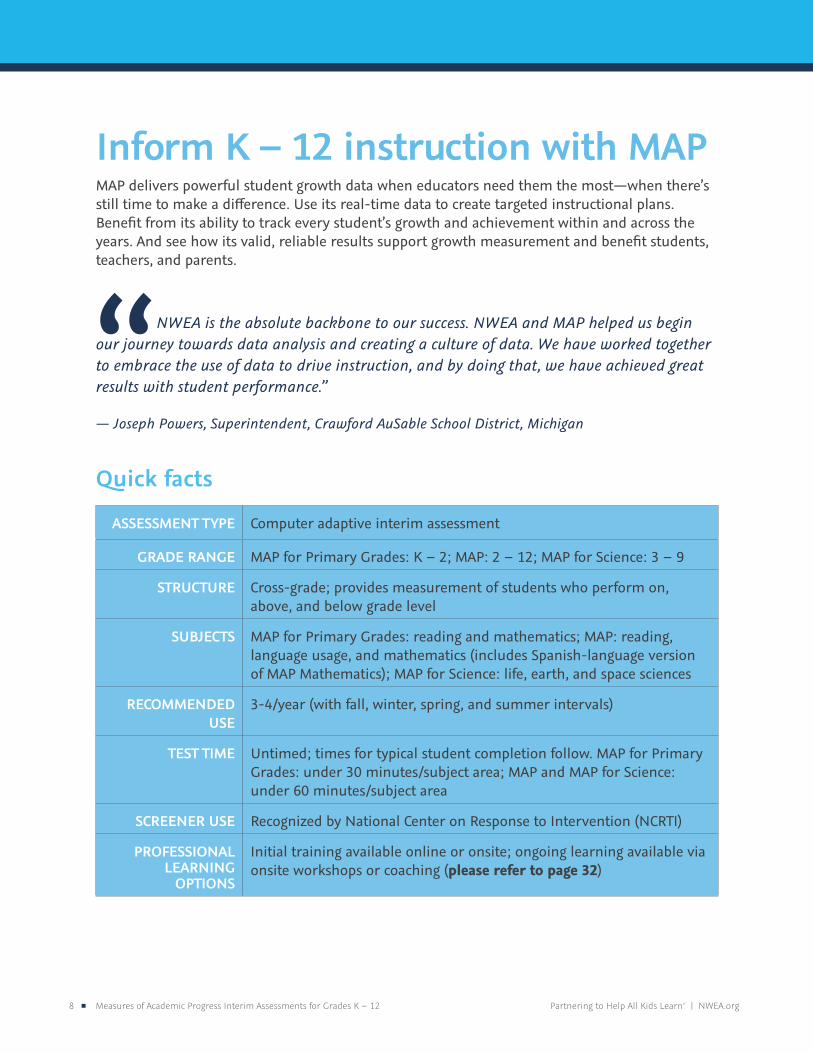
Quick facts
ASSESSMENT TYPE Computer adaptive interim assessment
GRADE RANGE MAP for Primary Grades: K – 2; MAP: 2 – 12; MAP for Science: 3 – 9
STRUCTURE Cross-grade; provides measurement of students who perform on, above, and below grade level
SUBJECTS MAP for Primary Grades: reading and mathematics; MAP: reading, language usage, and mathematics (includes Spanish-language version of MAP Mathematics); MAP for Science: life, earth, and space sciences
RECOMMENDED USE
3-4/year (with fall, winter, spring, and summer intervals)
TEST TIME Untimed; times for typical student completion follow. MAP for Primary Grades: under 30 minutes/subject area; MAP and MAP for Science: under 60 minutes/subject area
SCREENER USE Recognized by National Center on Response to Intervention (NCRTI)
PROFESSIONAL LEARNING
OPTIONS
Initial training available online or onsite; ongoing learning available via onsite workshops or coaching (please refer to page 32)

503.624.1951 | 121 NW Everett St. Portland, OR 97209 Measures of Academic Progress Interim Assessments for Grades K – 12 9
MAP subjectsMAP for Mathematics, Reading, and Language Usage (grades 2 – 12)MAP includes three types of assessments:
• Survey with Goals: broad surveys of reading, language usage, and mathematics achievement scored on the RIT scale
• Survey assessments: shorter versions of the Survey with Goals tests that provide overall scores only; use to quickly place incoming students
• End of Course Mathematics tests: five tests for upper-level math students
Use MAP Survey with Goals interim assessments to uncover each student’s learning level on core concepts and receive information you can use to promote student growth every day. Sample goal areas include:
• Reading: Word Recognition, Structure and Vocabulary, and Reading Informational Texts
• Language usage: Craft Structure and Evaluation, Grammar and Usage, and Writing Conventions
• Mathematics: Algebra, Geometry, Measurement, Problem Solving, Reasoning, and Proofs
Our five End of Course Mathematics tests allow teachers to measure students’ understanding of specific content after a year of instruction. Please note End of Course tests aren’t pretests or mastery tests. Content covers:
• Algebra 1, Geometry, Algebra 2
• Integrated Mathematics 1 and 2
• Integrated Mathematics 3
MAP for Primary Grades for Reading and Mathematics (grades K – 2)Use MAP for Primary Grades (MPG) to gain insights that inform instructional decisions and ensure your youngest students are on track well before high-stakes testing begins in 3rd grade. MPG includes three types of assessments:
• Survey with Goals: broad surveys of reading and mathematics achievement scored on the RIT scale
• Screening Tests: entry level tests of pre-literacy and number skills
• Skills Checklists: brief tests of single skills such as phonological awareness, phonics, numeracy, and computation
To help keep students immersed in the assessment experience, all include audio instructions and engaging visuals.
10 Measures of Academic Progress Interim Assessments for Grades K – 12 Partnering to Help All Kids Learn® | NWEA.org
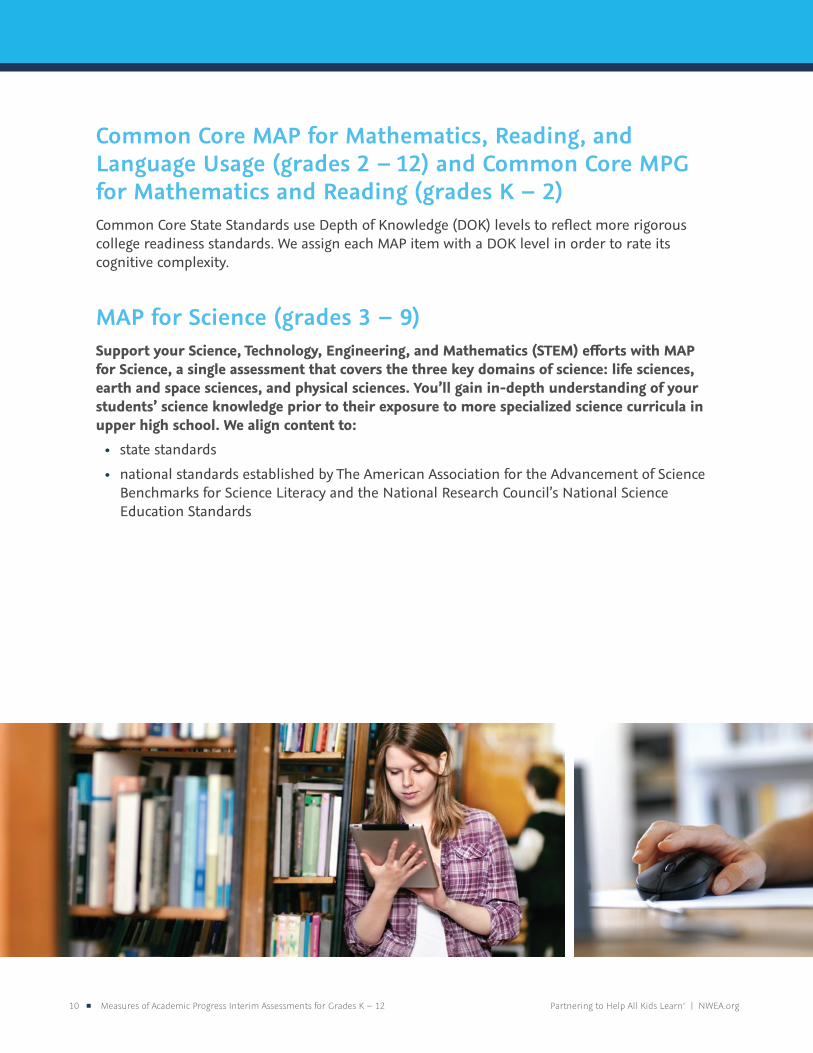
Common Core MAP for Mathematics, Reading, and Language Usage (grades 2 – 12) and Common Core MPG for Mathematics and Reading (grades K – 2)Common Core State Standards use Depth of Knowledge (DOK) levels to reflect more rigorous college readiness standards. We assign each MAP item with a DOK level in order to rate its cognitive complexity.
MAP for Science (grades 3 – 9)Support your Science, Technology, Engineering, and Mathematics (STEM) efforts with MAP for Science, a single assessment that covers the three key domains of science: life sciences, earth and space sciences, and physical sciences. You’ll gain in-depth understanding of your students’ science knowledge prior to their exposure to more specialized science curricula in upper high school. We align content to:
• state standards
• national standards established by The American Association for the Advancement of Science Benchmarks for Science Literacy and the National Research Council’s National Science Education Standards
503.624.1951 | 121 NW Everett St. Portland, OR 97209 Measures of Academic Progress Interim Assessments for Grades K – 12 11
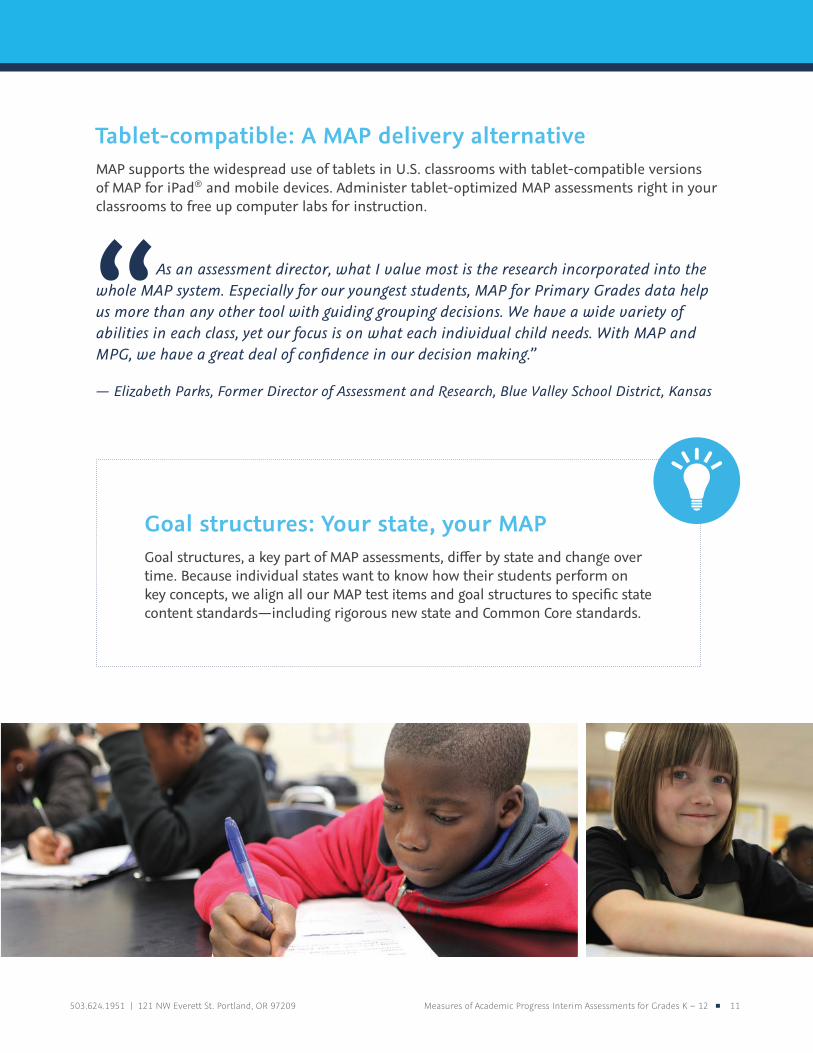
Tablet-compatible: A MAP delivery alternativeMAP supports the widespread use of tablets in U.S. classrooms with tablet-compatible versions of MAP for iPad® and mobile devices. Administer tablet-optimized MAP assessments right in your classrooms to free up computer labs for instruction.
“As an assessment director, what I value most is the research incorporated into the whole MAP system. Especially for our youngest students, MAP for Primary Grades data help us more than any other tool with guiding grouping decisions. We have a wide variety of abilities in each class, yet our focus is on what each individual child needs. With MAP and MPG, we have a great deal of confidence in our decision making.”
— Elizabeth Parks, Former Director of Assessment and Research, Blue Valley School District, Kansas
Goal structures: Your state, your MAPGoal structures, a key part of MAP assessments, differ by state and change over time. Because individual states want to know how their students perform on key concepts, we align all our MAP test items and goal structures to specific state content standards—including rigorous new state and Common Core standards.

12 Measures of Academic Progress Interim Assessments for Grades K – 12 Partnering to Help All Kids Learn® | NWEA.org
Valid, Reliable Data
503.624.1951 | 121 NW Everett St. Portland, OR 97209 Measures of Academic Progress Interim Assessments for Grades K – 12 13
Identify each student’s performance level with pinpoint precisionComputer adaptive assessmentMAP tests begin with a question appropriate for each student, then dynamically adapt throughout the test in response to student performance. A correct answer generates a more difficult test item; an incorrect answer, an easier one. This progressive refinement allows MAP to challenge top performers without overwhelming students whose skills are below grade level.
Explore how MAP produces precise data that you can use to help differentiate instruction—and students can use to better connect with their learning goals.
Our mature, stable, and reliable RIT scaleAfter every MAP assessment, each student receives a score that helps illuminate what he or she knows, is ready to learn, and is projected to achieve. And thanks to something no other interim assessment offers—a mature, reliable, and stable scale—you can trust that the scores you see are both accurate and fair.
How it works: MAP assessments use the RIT scale to create a grade-independent RIT score, which indicates the level of question difficulty a given student is capable of answering correctly about 50% of the time. RIT scores help educators understand every student’s current achievement level based on their zone of proximal development.
Regardless of the standards alignment of a particular MAP test, a given item has a single RIT value associated with it. This underlying design of MAP tests permits RIT scores to carry the same meaning, in terms of student ability, regardless of which test or set of standards was used to obtain them.
Additionally, the RIT scale remains continuous across grades, making it ideal to track student achievement growth both within a school year and across adjacent school years.
When you compare, is it fair?Our RIT scale and robust national norms support your efforts to boost every student’s learning and growth. From a single classroom to the entire nation, you can compare and contrast student performance. See page 18 for details.
14 Measures of Academic Progress Interim Assessments for Grades K – 12 Partnering to Help All Kids Learn® | NWEA.org
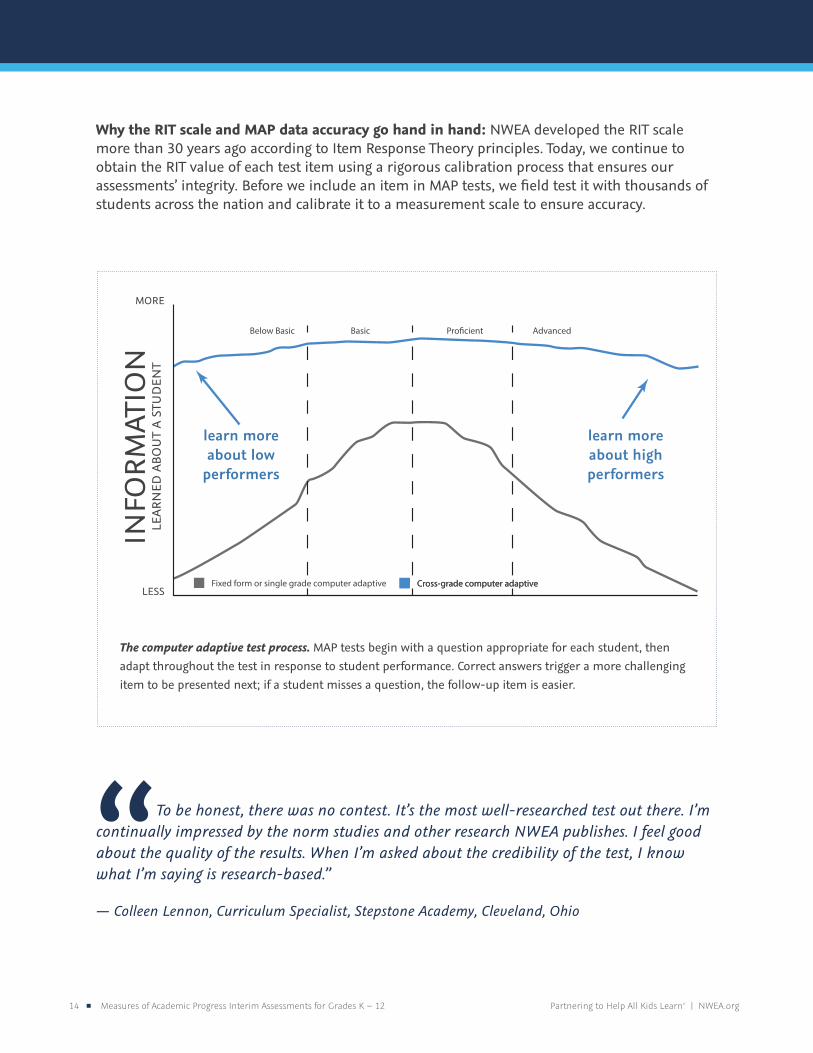
learn more about low
performers
learn more about high performers
INFO
RMAT
ION
LEAR
NED
ABO
UT
A ST
UD
ENT
MORE
LESSCross-grade computer adaptiveCross-grade computer adaptiveFixed form or single grade computer adaptive
Below Basic Basic Pro�cient Advanced
Why the RIT scale and MAP data accuracy go hand in hand: NWEA developed the RIT scale more than 30 years ago according to Item Response Theory principles. Today, we continue to obtain the RIT value of each test item using a rigorous calibration process that ensures our assessments’ integrity. Before we include an item in MAP tests, we field test it with thousands of students across the nation and calibrate it to a measurement scale to ensure accuracy.
The computer adaptive test process. MAP tests begin with a question appropriate for each student, then adapt throughout the test in response to student performance. Correct answers trigger a more challenging item to be presented next; if a student misses a question, the follow-up item is easier.
“To be honest, there was no contest. It’s the most well-researched test out there. I’m continually impressed by the norm studies and other research NWEA publishes. I feel good about the quality of the results. When I’m asked about the credibility of the test, I know what I’m saying is research-based.”
— Colleen Lennon, Curriculum Specialist, Stepstone Academy, Cleveland, Ohio
503.624.1951 | 121 NW Everett St. Portland, OR 97209 Measures of Academic Progress Interim Assessments for Grades K – 12 15
Test Questions
Basic
Proficient
Advanced
DIF
FICU
LTY
EXPR
ESSE
D A
S R
IT V
ALU
E
190
200
210
220
230
Correct Answer
Test Standard Error
Incorrect Answer
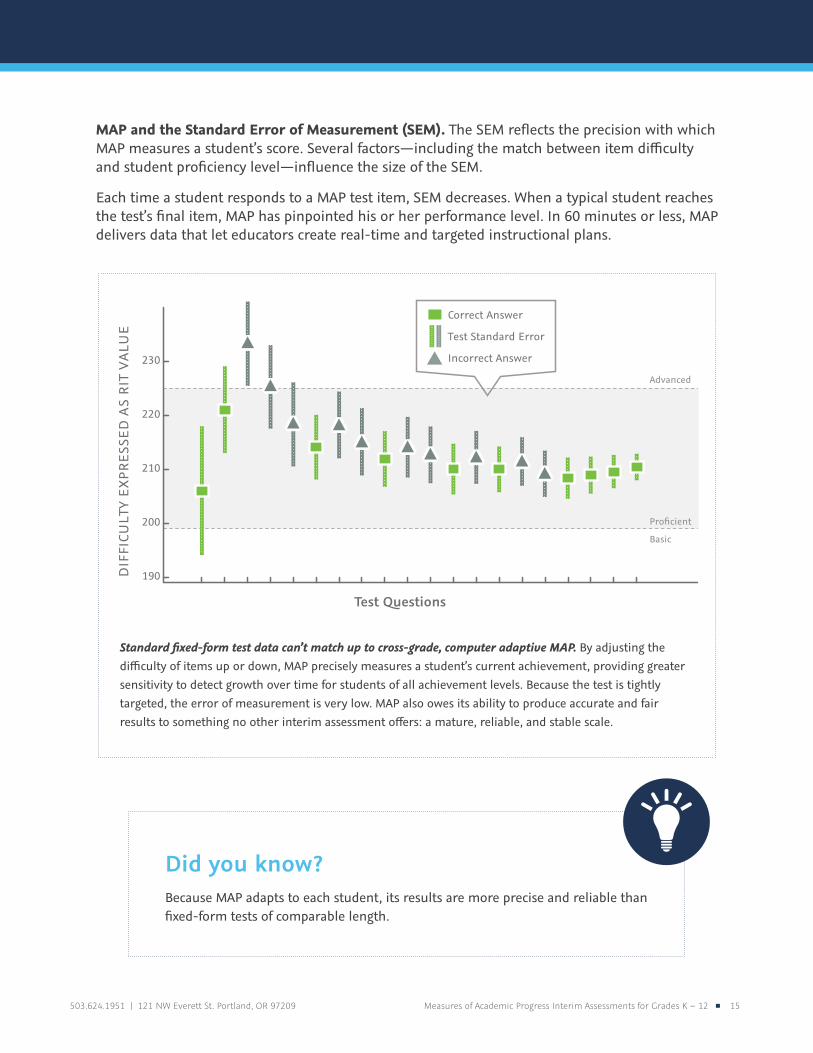
Standard fixed-form test data can’t match up to cross-grade, computer adaptive MAP. By adjusting the difficulty of items up or down, MAP precisely measures a student’s current achievement, providing greater sensitivity to detect growth over time for students of all achievement levels. Because the test is tightly targeted, the error of measurement is very low. MAP also owes its ability to produce accurate and fair results to something no other interim assessment offers: a mature, reliable, and stable scale.
MAP and the Standard Error of Measurement (SEM). The SEM reflects the precision with which MAP measures a student’s score. Several factors—including the match between item difficulty and student proficiency level—influence the size of the SEM.
Each time a student responds to a MAP test item, SEM decreases. When a typical student reaches the test’s final item, MAP has pinpointed his or her performance level. In 60 minutes or less, MAP delivers data that let educators create real-time and targeted instructional plans.
Did you know? Because MAP adapts to each student, its results are more precise and reliable than fixed-form tests of comparable length.
16 Measures of Academic Progress Interim Assessments for Grades K – 12 Partnering to Help All Kids Learn® | NWEA.org
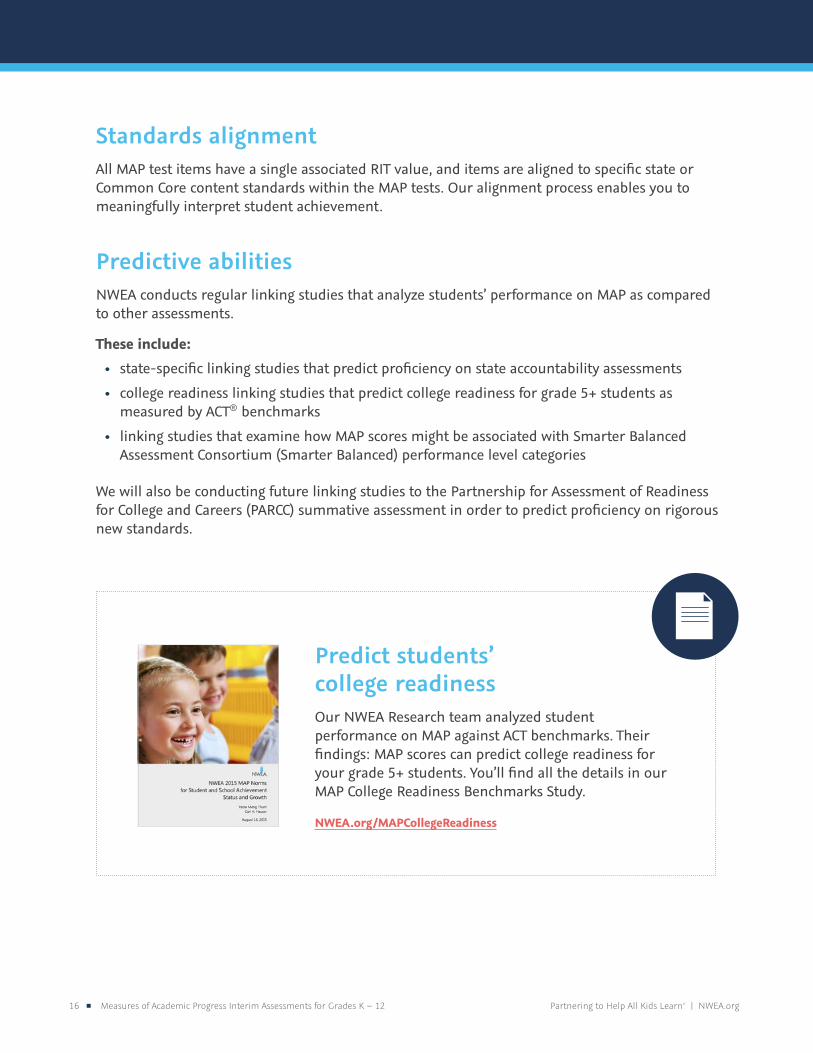
Predict students’ college readiness Our NWEA Research team analyzed student performance on MAP against ACT benchmarks. Their findings: MAP scores can predict college readiness for your grade 5+ students. You’ll find all the details in our MAP College Readiness Benchmarks Study.
NWEA.org/MAPCollegeReadiness
Standards alignmentAll MAP test items have a single associated RIT value, and items are aligned to specific state or Common Core content standards within the MAP tests. Our alignment process enables you to meaningfully interpret student achievement.
Predictive abilitiesNWEA conducts regular linking studies that analyze students’ performance on MAP as compared to other assessments.
These include: • state-specific linking studies that predict proficiency on state accountability assessments
• college readiness linking studies that predict college readiness for grade 5+ students as measured by ACT® benchmarks
• linking studies that examine how MAP scores might be associated with Smarter Balanced Assessment Consortium (Smarter Balanced) performance level categories
We will also be conducting future linking studies to the Partnership for Assessment of Readiness for College and Careers (PARCC) summative assessment in order to predict proficiency on rigorous new standards.
503.624.1951 | 121 NW Everett St. Portland, OR 97209 Measures of Academic Progress Interim Assessments for Grades K – 12 17
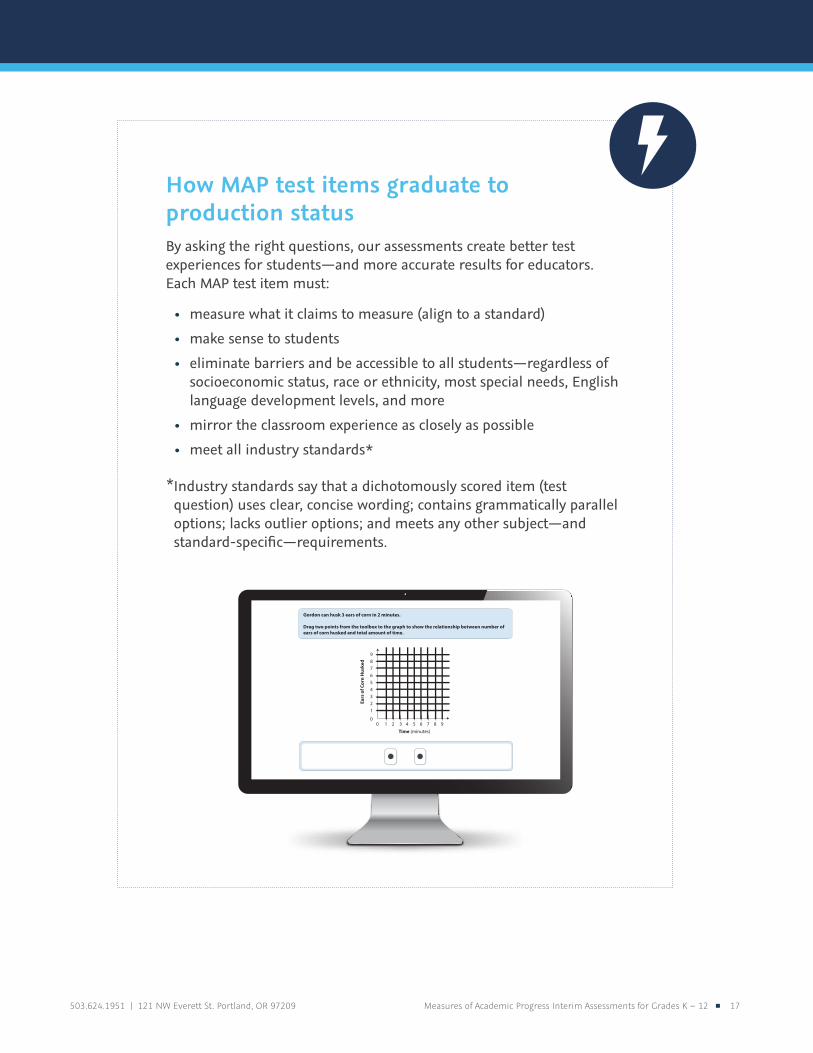
How MAP test items graduate to production status By asking the right questions, our assessments create better test experiences for students—and more accurate results for educators. Each MAP test item must:
• measure what it claims to measure (align to a standard)
• make sense to students
• eliminate barriers and be accessible to all students—regardless of socioeconomic status, race or ethnicity, most special needs, English language development levels, and more
• mirror the classroom experience as closely as possible
• meet all industry standards*
* Industry standards say that a dichotomously scored item (test question) uses clear, concise wording; contains grammatically parallel options; lacks outlier options; and meets any other subject—and standard-specific—requirements.
Gordon can husk 3 ears of corn in 2 minutes.
Drag two points from the toolbox to the graph to show the relationship between number of ears of corn husked and total amount of time.
00 1
1
2
2
3
3
4
4
5
5
6
6
7
7
8
8
9
9
18 Measures of Academic Progress Interim Assessments for Grades K – 12 Partnering to Help All Kids Learn® | NWEA.org
Compare and contrast student and school performance with MAP NormsNWEA Research produces norms based on a nationally representative sample of MAP test scores from over ten million students. From a single classroom to the entire nation, you can see how each student’s performance compares to his or her peers’. You can also monitor school performance over time and compare specific grade levels across schools or the nation.
MAP achievement and growth normsNorms help educators see if a student is growing at an expected pace, regardless of where the student started.
NWEA norms allow you to compare your students’ academic performance relative to:
• national achievement and growth norms
• state standards, including Common Core and other college and career readiness standards
While MAP achievement norms show you a student’s percentile ranking in a nationally representative student population, MAP growth norms allow you to compare a student’s growth to that of his or her academic peers. As part of our commitment to giving educators high-quality data, we conduct regular norming that determines mean growth based on each student’s starting position on the RIT scale and the amount of instructional time offered.
Our 2015 NWEA norming study includes students whose districts or states have adopted and implemented the Common Core as well as those who have not. To aid your district-level decision making, it also provides MAP status and growth norms for schools as well as students.
503.624.1951 | 121 NW Everett St. Portland, OR 97209 Measures of Academic Progress Interim Assessments for Grades K – 12 19
Growth analysis simplifiedNWEA offers educators who use MAP the opportunity to order customized norms-based reports. These reports are typically requested by district and school leaders who require easy-to-access comparative data to inform decisions about program planning, professional development, and curriculum.
Standard Comparison Group (SCG) reporting is created with your selected student growth data and provides a view of growth by school, achievement level, grade, ethnicity, or gender. Virtual Comparison Group (VCG) reporting takes leaders beyond local or regional comparisons to see how their students are growing compared to similar student groups across the country.
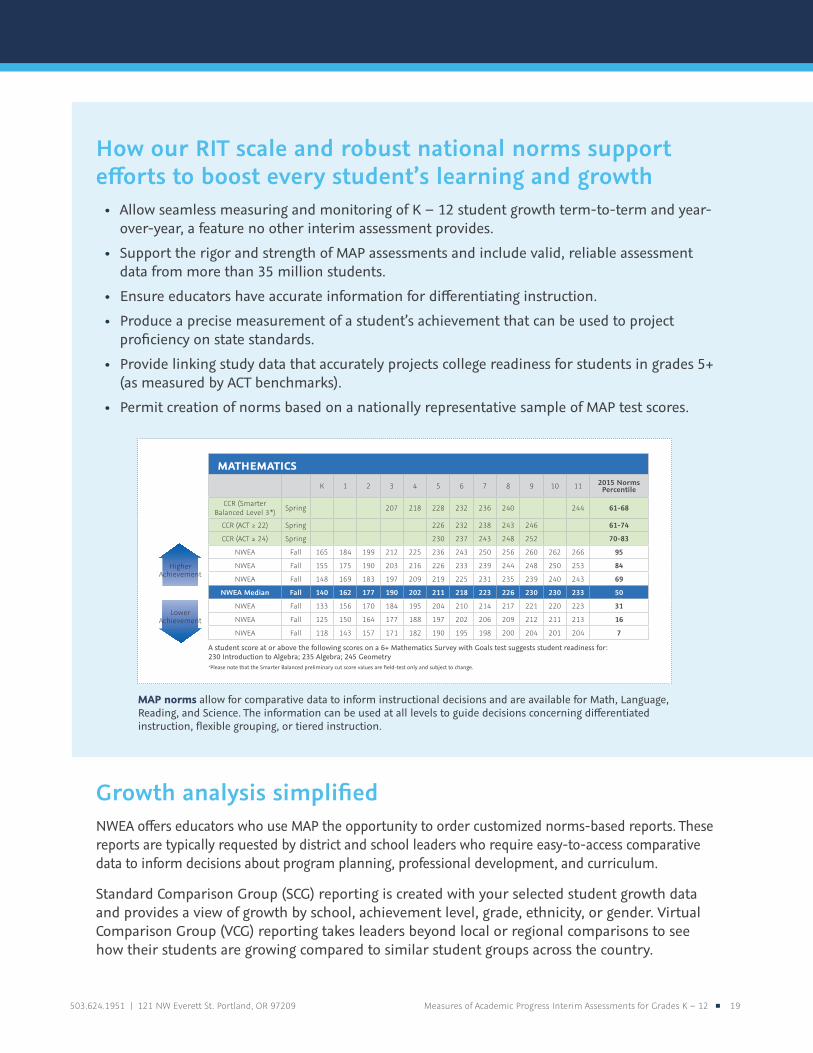
How our RIT scale and robust national norms support efforts to boost every student’s learning and growth
• Allow seamless measuring and monitoring of K – 12 student growth term-to-term and year-over-year, a feature no other interim assessment provides.
• Support the rigor and strength of MAP assessments and include valid, reliable assessment data from more than 35 million students.
• Ensure educators have accurate information for differentiating instruction.
• Produce a precise measurement of a student’s achievement that can be used to project proficiency on state standards.
• Provide linking study data that accurately projects college readiness for students in grades 5+ (as measured by ACT benchmarks).
• Permit creation of norms based on a nationally representative sample of MAP test scores.
MAP norms allow for comparative data to inform instructional decisions and are available for Math, Language, Reading, and Science. The information can be used at all levels to guide decisions concerning differentiated instruction, flexible grouping, or tiered instruction.
When you’re armed with MAP interim assessment data, you’re better prepared to meet your students when and where they need you most.
Use the comparative data in the tables below as one of your data points for instructional decision making. While not intended for use as a single placement guide, these data can help inform a variety of programmatic and instructional decisions, including:
• identifying and qualifying students for various instructional strategies
• guiding teachers who do not regularly make decisions on instructional program choices for students
• scheduling and grouping to meet students’ learning needs• screening for special or alternative instruction• staffing and resourcing
About each chart• The grade designations represent beginning-of-year grade levels.• The RIT scores defining each level are separated by 1/2 standard
deviation except for the highest level, which is set at the 95th percentile.
• At all levels, consider differentiated instruction, flexible grouping, or tiered instruction.
• As scores ascend, give more consideration to curriculum-compacting, accelerated instructional pacing, and special programs.
• As scores descend, give more consideration to additional instructional time, one-on-one tutoring, use of short cycle assessments, and special programs.
The instructional suggestions in this document are intended to provide initial ideas, not to be an exhaustive list of options.
Higher Achievement
Lower Achievement
MATHEMATICS
K 1 2 3 4 5 6 7 8 9 10 11 2015 Norms Percentile
CCR (Smarter Balanced Level 3*) Spring 207 218 228 232 236 240 244 61-68
CCR (ACT ≥ 22) Spring 226 232 238 243 246 61-74
CCR (ACT ≥ 24) Spring 230 237 243 248 252 70-83
NWEA Fall 165 184 199 212 225 236 243 250 256 260 262 266 95
NWEA Fall 155 175 190 203 216 226 233 239 244 248 250 253 84
NWEA Fall 148 169 183 197 209 219 225 231 235 239 240 243 69
NWEA Median Fall 140 162 177 190 202 211 218 223 226 230 230 233 50
NWEA Fall 133 156 170 184 195 204 210 214 217 221 220 223 31
NWEA Fall 125 150 164 177 188 197 202 206 209 212 211 213 16
NWEA Fall 118 143 157 171 182 190 195 198 200 204 201 204 7
NWEA RESEARCH | 2015 COMPARATIVE DATA
Comparative Data to Inform Instructional Decisions
To help provide context to Measures of Academic Progress® (MAP®) normative percentiles, this document includes multiple College and Career Readiness (CCR) benchmarks, including those from ACT® and Smarter Balanced Assessment Consortium (Smarter Balanced)*.
Higher Achievement
Lower Achievement
READING
K 1 2 3 4 5 6 7 8 9 10 11 2015 Norms Percentile
CCR (Smarter Balanced Level 3*)
Spring 203 209 214 219 222 223 226 56-62
CCR (ACT ≥ 22) Spring 215 220 224 227 230 59-69
CCR (ACT ≥ 24) Spring 218 223 227 230 233 66-75
NWEA Fall 163 182 200 214 224 231 236 240 243 246 248 250 95
NWEA Fall 155 174 190 204 214 221 226 230 233 236 237 239 84
NWEA Fall 148 167 182 196 206 213 218 222 225 228 229 231 69
NWEA Median Fall 141 161 175 188 198 206 211 214 217 220 220 223 50
NWEA Fall 134 154 167 180 190 198 204 207 209 212 212 214 31
NWEA Fall 128 148 159 173 183 191 196 199 202 205 204 206 16
NWEA Fall 121 141 152 165 175 183 189 192 194 197 196 198 7
*Please note that the Smarter Balanced preliminary cut score values are field-test only and subject to change.
*Please note that the Smarter Balanced preliminary cut score values are field-test only and subject to change.
A student score at or above the following scores on a 6+ Mathematics Survey with Goals test suggests student readiness for: 230 Introduction to Algebra; 235 Algebra; 245 Geometry
Partnering to Help All Kids Learn® | NWEA.org | 503.624.1951 | 121 NW Everett St., Portland, OR 97209
20 Measures of Academic Progress Interim Assessments for Grades K – 12 Partnering to Help All Kids Learn® | NWEA.org
The Benefits of Measuring Growth
503.624.1951 | 121 NW Everett St. Portland, OR 97209 Measures of Academic Progress Interim Assessments for Grades K – 12 21
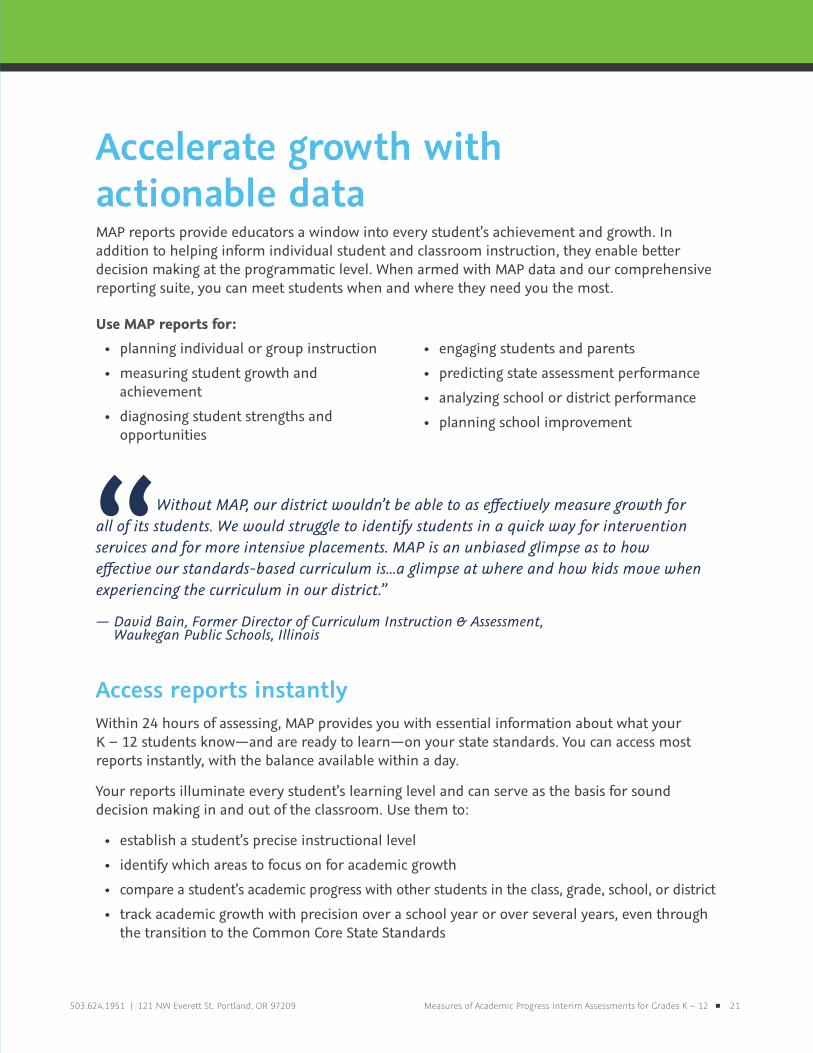
Accelerate growth with actionable dataMAP reports provide educators a window into every student’s achievement and growth. In addition to helping inform individual student and classroom instruction, they enable better decision making at the programmatic level. When armed with MAP data and our comprehensive reporting suite, you can meet students when and where they need you the most.
Use MAP reports for:• planning individual or group instruction
• measuring student growth and achievement
• diagnosing student strengths and opportunities
• engaging students and parents
• predicting state assessment performance
• analyzing school or district performance
• planning school improvement
“Without MAP, our district wouldn’t be able to as effectively measure growth for all of its students. We would struggle to identify students in a quick way for intervention services and for more intensive placements. MAP is an unbiased glimpse as to how effective our standards-based curriculum is...a glimpse at where and how kids move when experiencing the curriculum in our district.”
— David Bain, Former Director of Curriculum Instruction & Assessment, Waukegan Public Schools, Illinois
Access reports instantly Within 24 hours of assessing, MAP provides you with essential information about what your K – 12 students know—and are ready to learn—on your state standards. You can access most reports instantly, with the balance available within a day.
Your reports illuminate every student’s learning level and can serve as the basis for sound decision making in and out of the classroom. Use them to:
• establish a student’s precise instructional level
• identify which areas to focus on for academic growth
• compare a student’s academic progress with other students in the class, grade, school, or district
• track academic growth with precision over a school year or over several years, even through the transition to the Common Core State Standards
22 Measures of Academic Progress Interim Assessments for Grades K – 12 Partnering to Help All Kids Learn® | NWEA.org
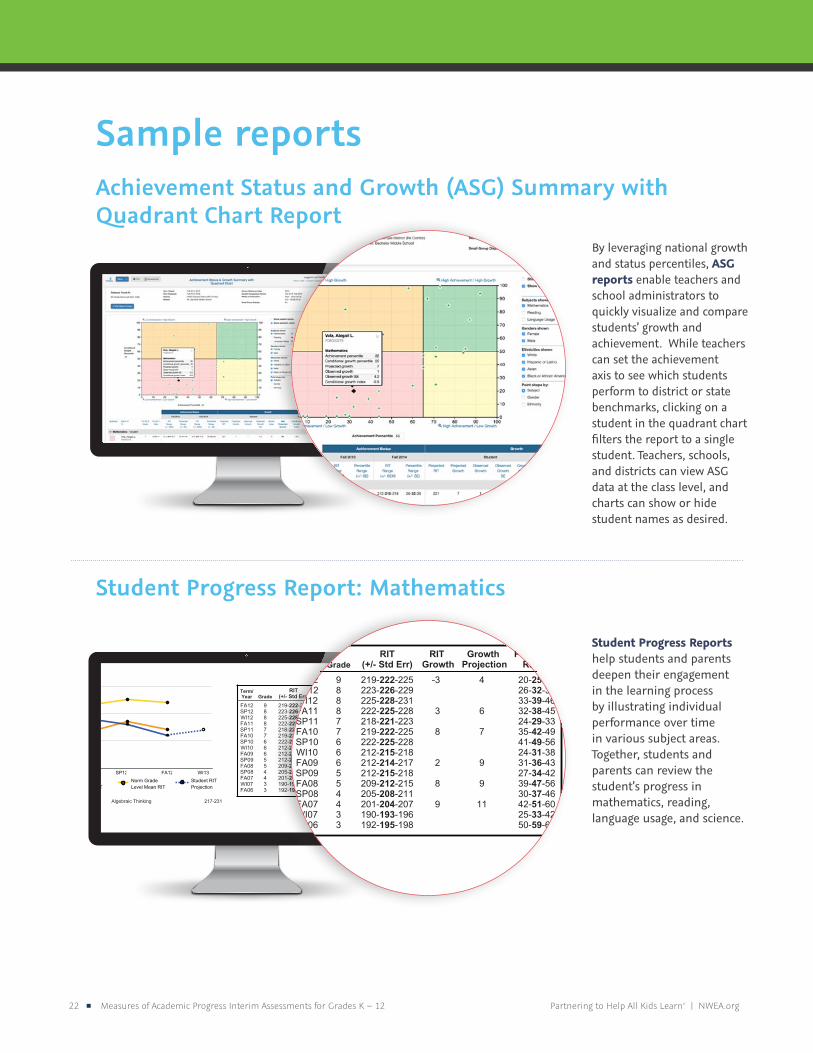
Achievement Status and Growth (ASG) Summary with Quadrant Chart Report
Student Progress Report: Mathematics
By leveraging national growth and status percentiles, ASG reports enable teachers and school administrators to quickly visualize and compare students’ growth and achievement. While teachers can set the achievement axis to see which students perform to district or state benchmarks, clicking on a student in the quadrant chart filters the report to a single student. Teachers, schools, and districts can view ASG data at the class level, and charts can show or hide student names as desired.
Student Progress Reports help students and parents deepen their engagement in the learning process by illustrating individual performance over time in various subject areas. Together, students and parents can review the student’s progress in mathematics, reading, language usage, and science.
Sample reports
Mathematics Goals Performance - Fall 2012-2013Real and Complex Number Systems 224-238Geometry 226-241Statistics and Probability 194-211
Algebraic Thinking 217-231
Term/Year Grade
RIT(+/- Std Err)
RIT Growth
Growth Projection
Percentile Range
FA12 9 219-222-225 -3 4 20-25-31SP12 8 223-226-229 26-32-38WI12 8 225-228-231 33-39-46FA11 8 222-225-228 3 6 32-38-45SP11 7 218-221-223 24-29-33FA10 7 219-222-225 8 7 35-42-49SP10 6 222-225-228 41-49-56WI10 6 212-215-218 24-31-38FA09 6 212-214-217 2 9 31-36-43SP09 5 212-215-218 27-34-42FA08 5 209-212-215 8 9 39-47-56SP08 4 205-208-211 30-37-46FA07 4 201-204-207 9 11 42-51-60WI07 3 190-193-196 25-33-42FA06 3 192-195-198 50-59-68
503.624.1951 | 121 NW Everett St. Portland, OR 97209 Measures of Academic Progress Interim Assessments for Grades K – 12 23
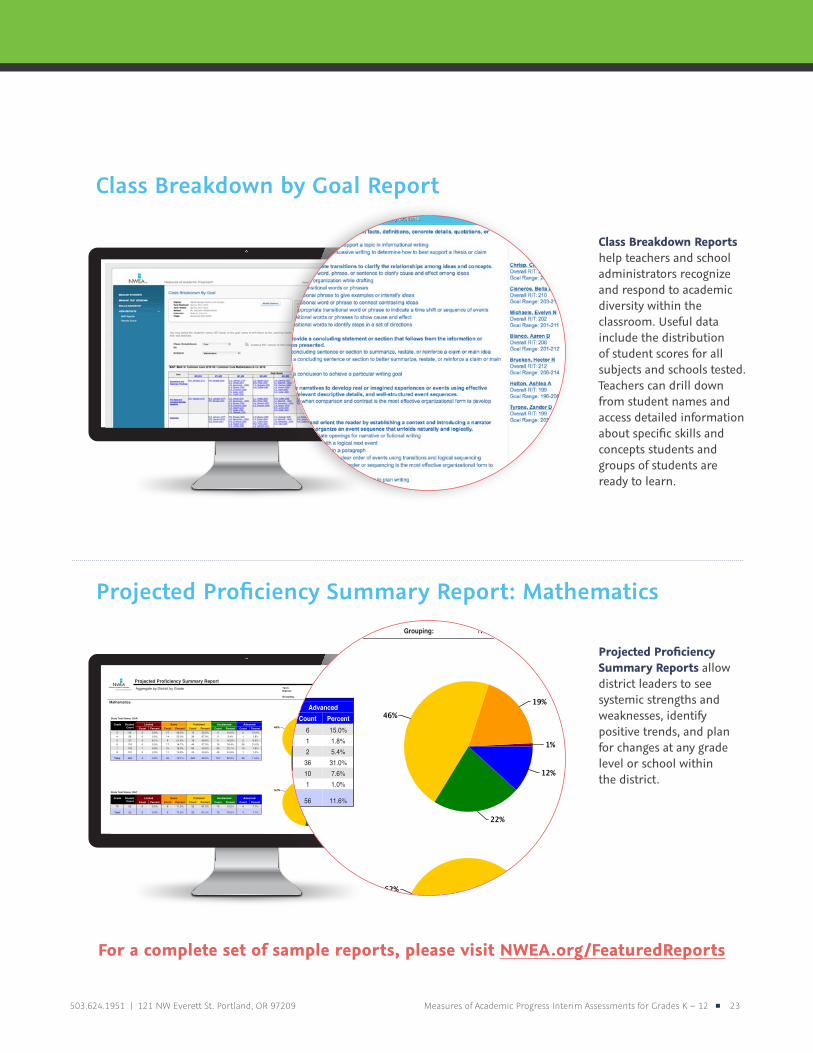
Class Breakdown by Goal Report
Class Breakdown Reports help teachers and school administrators recognize and respond to academic diversity within the classroom. Useful data include the distribution of student scores for all subjects and schools tested. Teachers can drill down from student names and access detailed information about specific skills and concepts students and groups of students are ready to learn.
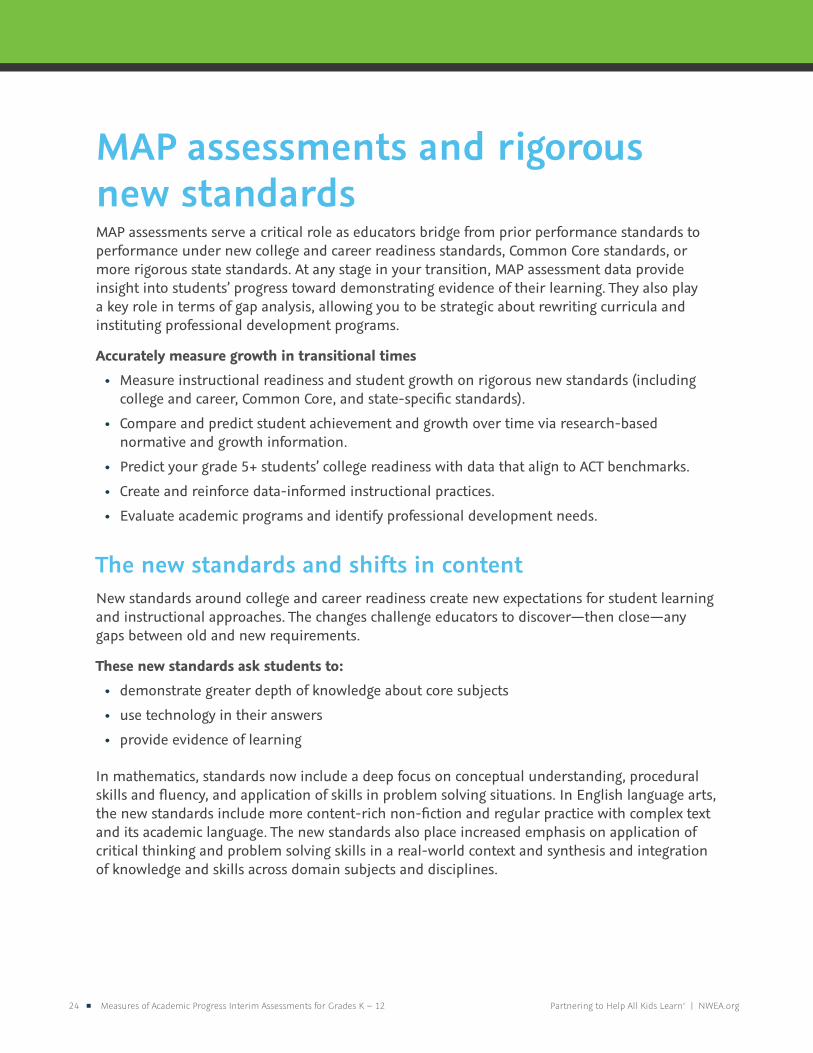
Projected Proficiency Summary Reports allow district leaders to see systemic strengths and weaknesses, identify positive trends, and plan for changes at any grade level or school within the district.
For a complete set of sample reports, please visit NWEA.org/FeaturedReports
Explanatory NotesThis report shows students' projected performance on the state assessment(s) based on NWEA alignment/linking studies. Performance categories are defined by the state and are specific to each state. For any state that does not have an alignment/linking study, NWEA uses the 40th percentile from the norming study to forecast basic proficiency and the 70th percentile to forecast proficient-plus.Proficiency is projected from MAP assessments administered in Fall 2014-2015 to state test(s) administered in Spring 2014-2015.
Generated 8/26/15, 1:48:57 PM © 2000-2015 Northwest Evaluation Association. All rights reserved. Common Core State Standards are provided under a public license. © Copyright 2010. National Governors Association Center for Best Practices and Council of Chief State School Officers. All rights reserved.
Page 1 of 2
Projected Proficiency Summary ReportAggregate by District by Grade Term: Fall 2014-2015
District: NWEA Sample District (PdM Combo)
Grouping: None
Mathematics
State Test Name: OAA
Grade StudentCount
Limited Basic Proficient Accelerated AdvancedCount Percent Count Percent Count Percent Count Percent Count Percent
3 40 0 0.0% 17 42.5% 13 32.5% 4 10.0% 6 15.0%4 56 0 0.0% 14 25.0% 38 67.9% 3 5.4% 1 1.8%5 37 3 8.1% 8 21.6% 18 48.6% 6 16.2% 2 5.4%6 116 0 0.0% 17 14.7% 44 37.9% 19 16.4% 36 31.0%7 132 1 0.8% 25 18.9% 66 50.0% 30 22.7% 10 7.6%8 101 0 0.0% 11 10.9% 44 43.6% 45 44.6% 1 1.0%
Total 482 4 0.8% 92 19.1% 223 46.3% 107 22.2% 56 11.6%
State Test Name: OGT
Grade StudentCount
Limited Basic Proficient Accelerated AdvancedCount Percent Count Percent Count Percent Count Percent Count Percent
10 52 0 0.0% 6 11.5% 32 61.5% 10 19.2% 4 7.7%
Total 52 0 0.0% 6 11.5% 32 61.5% 10 19.2% 4 7.7%
Projected Proficiency Summary Report: Mathematics
24 Measures of Academic Progress Interim Assessments for Grades K – 12 Partnering to Help All Kids Learn® | NWEA.org
MAP assessments and rigorous new standardsMAP assessments serve a critical role as educators bridge from prior performance standards to performance under new college and career readiness standards, Common Core standards, or more rigorous state standards. At any stage in your transition, MAP assessment data provide insight into students’ progress toward demonstrating evidence of their learning. They also play a key role in terms of gap analysis, allowing you to be strategic about rewriting curricula and instituting professional development programs.
Accurately measure growth in transitional times • Measure instructional readiness and student growth on rigorous new standards (including
college and career, Common Core, and state-specific standards).
• Compare and predict student achievement and growth over time via research-based normative and growth information.
• Predict your grade 5+ students’ college readiness with data that align to ACT benchmarks.
• Create and reinforce data-informed instructional practices.
• Evaluate academic programs and identify professional development needs.
The new standards and shifts in content New standards around college and career readiness create new expectations for student learning and instructional approaches. The changes challenge educators to discover—then close—any gaps between old and new requirements.
These new standards ask students to:• demonstrate greater depth of knowledge about core subjects
• use technology in their answers
• provide evidence of learning
In mathematics, standards now include a deep focus on conceptual understanding, procedural skills and fluency, and application of skills in problem solving situations. In English language arts, the new standards include more content-rich non-fiction and regular practice with complex text and its academic language. The new standards also place increased emphasis on application of critical thinking and problem solving skills in a real-world context and synthesis and integration of knowledge and skills across domain subjects and disciplines.
503.624.1951 | 121 NW Everett St. Portland, OR 97209 Measures of Academic Progress Interim Assessments for Grades K – 12 25
How MAP addresses the new standardsCommon Core MAP reflects changes to more rigorous college readiness standards by using the DOK system to rate the cognitive demand of each of our assessment items. Our test items correspond to the depth and breadth of the new standards.
For those states adopting the CCSS and opting to add their own standards content, known as Common Core + 15%, we developed CCSS + 15% MAP tests aligned to the needs of individual states.
As with all MAP assessments, Common Core MAP supports a stable, valid, and reliable measure of student academic growth. Regardless of changes in standards, students’ Common Core MAP RIT scores effectively measure their growth over time.
In order to use MAP data in a meaningful way, though, your instructional content must align with the content of MAP test questions. To ensure a better match between curriculum and assessment content, we recommend that educators implement or transition to Common Core MAP/MPG between academic years.
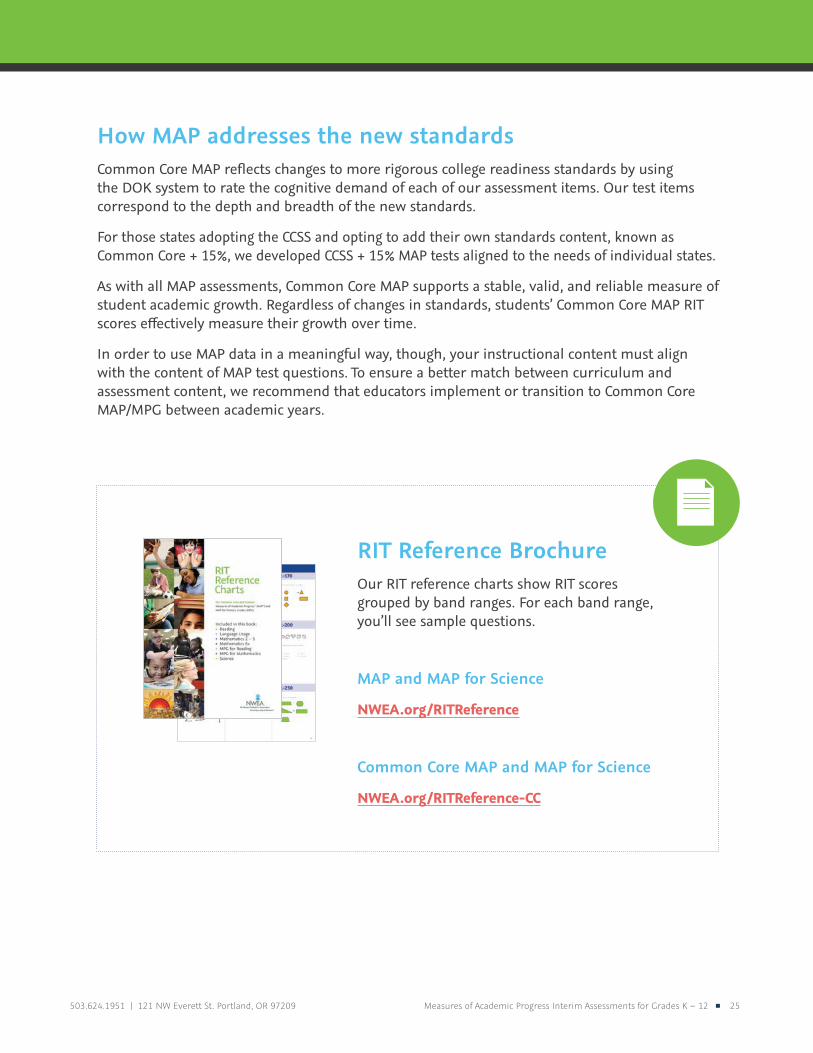
RIT Reference Brochure Our RIT reference charts show RIT scores grouped by band ranges. For each band range, you’ll see sample questions.
MAP and MAP for Science NWEA.org/RITReference
Common Core MAP and MAP for Science NWEA.org/RITReference-CC
26 Measures of Academic Progress Interim Assessments for Grades K – 12 Partnering to Help All Kids Learn® | NWEA.org
Technology-Enhanced Items (TEIs) in MAPAlong with test items in multiple-choice format, MAP and MPG assessments include technology-enhanced and common stimulus items. In combination, these item types help measure the depth and breadth of student comprehension as required by rigorous new state standards, including the Common Core. You’ll also find our scientific and graphing calculator, which allows students to demonstrate proficiency with technology and solve higher-order problems.
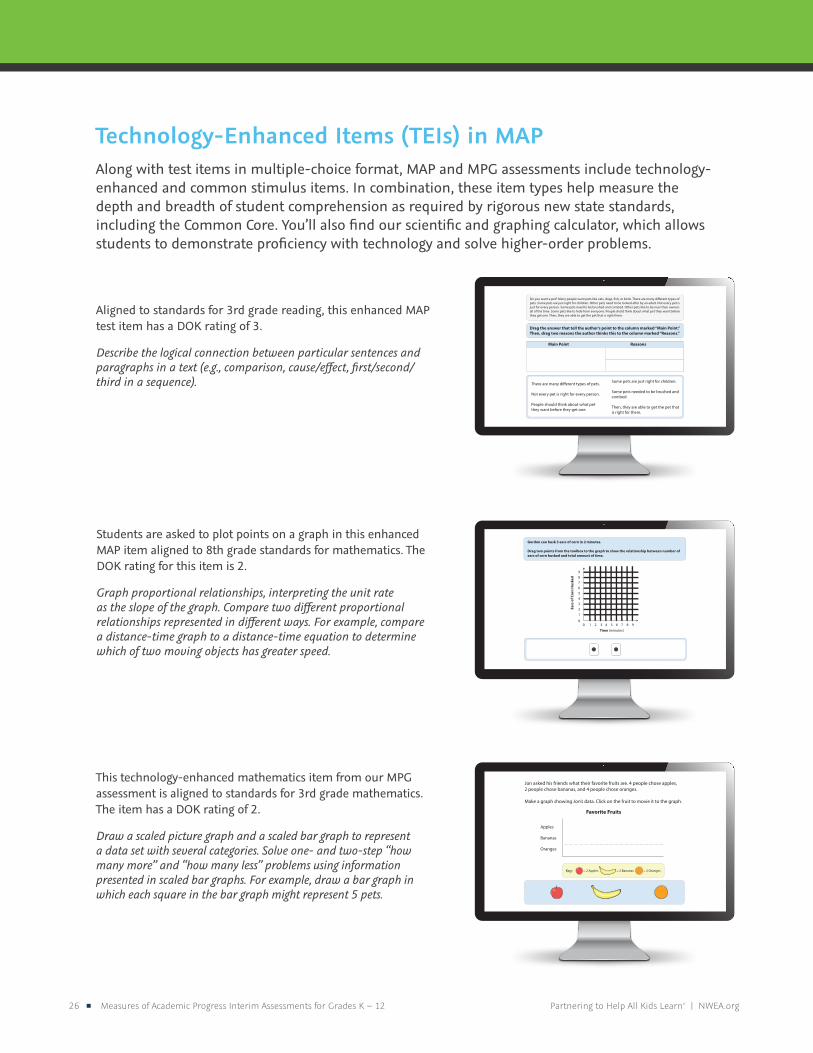
Aligned to standards for 3rd grade reading, this enhanced MAP test item has a DOK rating of 3.
Describe the logical connection between particular sentences and paragraphs in a text (e.g., comparison, cause/effect, first/second/third in a sequence).
Do you want a pet? Many people want pets like cats, dogs, �sh, or birds. There are many di�erent types of pets. Some pets are just right for children. Other pets need to be looked after by an adult. Not every pet is just for every person. Some pets need to be brushed and combed. Other pets like to be near their owners all of the time. Some pets like to hide from everyone. People shold think about what pet they want before they get one. Then, they are able to get the pet that is right them.
There are many di�erent types of pets.
Not every pet is right for every person.
People should think about what petthey want before they get one.
Some pets are just right for children.
Some pets needed to be brushed and combed.
Then, they are able to get the pet that is right for them.
Drag the answer that tell the author’s point to the column marked “Main Point.” Then, drag two reasons the author thinks this to the column marked “Reasons.”
Main Point Reasons
Students are asked to plot points on a graph in this enhanced MAP item aligned to 8th grade standards for mathematics. The DOK rating for this item is 2.
Graph proportional relationships, interpreting the unit rate as the slope of the graph. Compare two different proportional relationships represented in different ways. For example, compare a distance-time graph to a distance-time equation to determine which of two moving objects has greater speed.
Gordon can husk 3 ears of corn in 2 minutes.
Drag two points from the toolbox to the graph to show the relationship between number of ears of corn husked and total amount of time.
00 1
1
2
2
3
3
4
4
5
5
6
6
7
7
8
8
9
9
This technology-enhanced mathematics item from our MPG assessment is aligned to standards for 3rd grade mathematics. The item has a DOK rating of 2.
Draw a scaled picture graph and a scaled bar graph to represent a data set with several categories. Solve one- and two-step “how many more” and “how many less” problems using information presented in scaled bar graphs. For example, draw a bar graph in which each square in the bar graph might represent 5 pets.
Favorite Fruits
Jon asked his friends what their favorite fruits are. 4 people chose apples,2 people chose bananas, and 4 people chose oranges.
Make a graph showing Jon’s data. Click on the fruit to movie it to the graph.
Key: = 2 Apples = 2 Bananas = 2 Oranges
Apples
Bananas
Oranges
503.624.1951 | 121 NW Everett St. Portland, OR 97209 Measures of Academic Progress Interim Assessments for Grades K – 12 27
MAP and the Consortia assessmentsAs part of their college and career readiness efforts, many states have joined one of two Consortia—the Smarter Balanced Assessment Consortium (Smarter Balanced) or the Partnership for Assessment of Readiness for College and Careers (PARCC). Both require summative assessments that will measure students’ on-grade proficiency on Common Core State Standards.
While Smarter Balanced and PARCC summative assessments will assess student understanding of on-grade Common Core standards, Common Core MAP helps you identify instructional needs for students performing at, above, and below grade level. By pairing MAP with your PARCC or Smarter Balanced summative test, you’ll receive a more well-rounded view of student achievement and growth—even if you experience proficiency level drops on your summative assessment.
During and after your transition to CCSS, you’ll find that MAP continues to fill an important need: to provide useful, instructionally relevant, and reliable data that can measure student learning growth during a school year, and across school years, on a stable scale.
Read Better Together: How Smarter Balanced Districts Can Gain Critical Teaching and Learning Data with MAP – Today and Beyond
NWEA.org/BetterTogether
Access the white paper, Common Core MAP: Supporting Your Transition to the Common Core
NWEA.org/TransitionSupport
Read A Powerful Pairing: How PARCC Districts Can Gain Critical Teaching and Learning Data with MAP
NWEA.org/PowerfulPairing
28 Measures of Academic Progress Interim Assessments for Grades K – 12 Partnering to Help All Kids Learn® | NWEA.org
Drive growth with MAP: six powerful approachesEducators use MAP assessment data to better understand the learning needs of every student. Here are six ways MAP data help promote a positive educational experience—and significant student growth—throughout the year.
Read NWEA partner case studies on these topics, and more
NWEA.org/CaseStudies
1. Differentiating instructionStudents within the same class often perform at different grade levels, and educators face the challenge of ensuring that every child—from the highest to the lowest achievers—continues to grow. MAP data make it easy to identify learning levels so teachers can engage in differentiated instruction and ability grouping that leads to positive results for every student.
“Instead of teaching to the whole class, the teachers are able to challenge them at the appropriate level within that skill set. And MAP scores form the baseline. It’s the first of several data points used to determine where they are instructionally on that skill.”
— Frank Reliford, Principal, Dee-Mack Intermediate School, Illinois
School and district leaders use MAP reports to evaluate programs and monitor school and student performance relative to growth, proficiency, and norms.
District decision makers rely on MAP reports to aid in resource management, help determine performance trends by grade and school, and compare local student achievement to the national scale.
Teachers depend on MAP reports to help them create teaching strategies and provide differentiated instruction, and to create flexible grouping across the classroom.
503.624.1951 | 121 NW Everett St. Portland, OR 97209 Measures of Academic Progress Interim Assessments for Grades K – 12 29
2. Using MAP as a Universal Screener/RTI placement toolA foundational component to a response to intervention (RTI) system is the use of universal screening tools that can be used to both identify those students at risk of academic failure and inform a learning plan. Grade-independent MAP assessments received the highest possible rating for classification accuracy and high ratings in all other categories from the National Center on Response to Intervention (NCRTI).
“Before using MAP, we were missing the full picture of how to teach kids who were gifted and talented, or struggling to learn, or were English language learners....But now that we know what our students are ready to learn before we even begin teaching them, growth is inevitable—even for our gifted and talented and Title I students.”
— Linda Foote, Instructional Technology Specialist, Poway Unified School District, California
3. Evaluating programsWith tightening budgets and expanding student populations, MAP data have become a key component in assessing the impact of specific programs. MAP scores contribute to understanding what works, so when special programs are instituted, educators can see precisely how much growth has occurred with participating students.
“MAP gives us such rich data, such evidence of student learning and challenges, that it lets us analyze program effectiveness in ways we couldn’t previously.”
— Mike Cady, Chief Academic Officer, Pewaukee School District, Wisconsin
4. Setting student goalsStudents become more committed to the learning process when they can set goals and see results. Using the Student Goal Setting worksheet and other NWEA tools, it’s easy for teachers and students to build an action plan together and for parents to become engaged in the process.
“Students see that they learn on a continuum. They have people around them to talk to them about their progress, and how far they’ve come. MAP is an assessment that is showing students here’s where you started, and here’s where you can finish, and here’s where you WILL finish. So they feel like a success.”
— Dr. Tanya Green, Chief Academic Officer, Friendship Public Charter Schools, D.C.
National Center on Response to Intervention
30 Measures of Academic Progress Interim Assessments for Grades K – 12 Partnering to Help All Kids Learn® | NWEA.org
5. Predicting college readiness To help educators build an educational foundation for college success—years in advance—our researchers created the NWEA College Readiness Linking Study. For students in grade 5 and above, the study conclusively shows high predictive relationships between MAP assessment scores and the college readiness benchmarks of ACT achievement tests.
“I would describe MAP as a valuable resource for differentiation, for measuring student growth, and as a predictor of college readiness. We hear praise constantly from teachers, administrators, and external partners that they value MAP more than any other assessment that they’ve used historically.”
— Steve Petros, Assessment Specialist, Department of Assessment and Evaluation, Grand Rapids Public Schools, Michigan
6. Projecting proficiency on state testsMAP assessment items have a single associated RIT value. This enables NWEA Research to analyze students’ performance on MAP as compared to other assessments; from there, they create state-specific linking studies that predict proficiency on state accountability assessments as well as college readiness linking studies that predict college readiness for grade 5+ students as measured by ACT benchmarks.
Future linking studies will predict proficiency on high-stakes summative assessments that cover college and career readiness standards, including Common Core standards.
“If we didn’t have MAP, we’d have no idea what to expect from and how to prepare for ISTEP+ [the Indiana state-mandated test]. Teachers gain valuable insights into the way students learn, so they can best support them in meeting growth targets and passing important tests.”
— Barbara Campbell, Former Staff Development Coordinator, Mt. Vernon Schools, Indiana

503.624.1951 | 121 NW Everett St. Portland, OR 97209 Measures of Academic Progress Interim Assessments for Grades K – 12 31
Make the Most of MAP Data
32 Measures of Academic Progress Interim Assessments for Grades K – 12 Partnering to Help All Kids Learn® | NWEA.org
Empower educators with professional learningNWEA professional development offerings help educators create cultures where quality data informs day-to-day teacher practice, student learning, and curriculum. See how proven strategies—plus delivery options designed for busy lives—make it easier to do more with data.
MAP Foundation SeriesWORKSHOPSUse our MAP Foundation Series workshops to boost expertise in data-informed decision making, support strategic planning, and improve learning outcomes for every student. Choose from three key themes: applying reports, informing instruction, and focusing on growth. Our workshops immerse your teachers and leaders in key issues—including how to use MAP data to support your transition to more rigorous state standards.
How it works: Schedule a full day (six hours) to focus on one theme, mix and match two three-hour modules from different themes, or collaborate with us to create a more specific plan.
MAP Administration WorkshopThis training is a first step for partners new to MAP. Prepare teachers, proctors, and your leadership team to set up your implementation for success, administer the assessment for the first time, and use the data to optimize learning. By default, receive this content in an online format to help every staff member get up to speed quickly. For the entire duration of your MAP license, enjoy access to live webinars and 24/7 on-demand resources for an unlimited number of participants through our online learning platform. Alternatively, a full-day onsite option is also available.
Applying Reports WorkshopOnce you are comfortable with the basics of administering MAP, get hands-on with the rich data in your reports in this onsite workshop. Ensure informed use of MAP data among teachers, administrators, and instructional specialists. Gain strategies for using the reports to engage in high-impact goal setting that will help each student grow. Available three-hour modules to choose from:
• Essential Reports for Teachers
• Student Goal Setting and Growth
• Essential Reports for Primary Teachers
• Essential Reports for Administrators
503.624.1951 | 121 NW Everett St. Portland, OR 97209 Measures of Academic Progress Interim Assessments for Grades K – 12 33
Informing Instruction WorkshopEnable teachers and instructional leaders to dive deeper into classroom applications of MAP reports in this onsite workshop. Support differentiated instruction and meet the needs of every student through the use of flexible groupings and instructional ladders based on your MAP results. Available three-hour modules to choose from:
• Instructional Ladders
• Differentiated Instruction
Focusing on Growth WorkshopOnce you have a full year of MAP data under your belt, help administrators and instructional leaders explore longitudinal growth to identify significant trends, strengths, and areas of concern in this onsite workshop. Use this analysis to set goals at all levels (district, school, grade, class, and student) to support school or district improvement plans. Available three-hour modules to choose from:
• Investigating Growth
• District and School Goal Setting
Data CoachingCOACHING FOR MAP PARTNERS NWEA professional development takes your unique data challenges and opportunities into account. We’ll start by helping you analyze a wide range of your local data—including student records, examples of student work, and results from different types of assessments. Then we’ll hone your data strengths and work to construct and implement plans focused on making a positive difference in student learning.
Boost your team’s data confidence to benefit every student’s academic growthOur data coaches quickly energize and empower your teams to move beyond common barriers to student learning.
• Grasp how to effectively use data from multiple assessments.
• Align educators’ use of data with district goals.
• Integrate assessment data into instructional and programmatic decision making.
• Build assessment literacy district-wide.
• Support teams’ transition to—and long-term success with—more rigorous state standards (including college and career/Common Core).

34 Measures of Academic Progress Interim Assessments for Grades K – 12 Partnering to Help All Kids Learn® | NWEA.org
Choose from the recommended topics below or work with us to tailor a solution. Assessment Program Alignment
Make essential connections between your assessments and the actions they inform. Our data coaches will help you develop district-wide assessment literacy and ensure a cohesive approach to your overall assessment plan. Participants will take stock of their assessment practices, identify time and resource efficiencies, clarify assessment priorities, and align specific assessments with their appropriate uses.
Data Conversations
Master constructive, practical techniques for regularly analyzing, discussing, and applying your data. Let our data coaches help you strengthen your culture of data use. Participants will learn to use regular, structured data conversations to systematically embed data use into instructional decisions and organizational planning.
Goal-Focused Planning
Build comprehensive and integrated district plans centered around student learning needs. Work with our data coaches to determine the best way to use multiple data sets to inform the development of your professional learning, assessment choices, and instructional plans. We’ll ensure your plans align with student needs and district goals as well as available district resources.
Destination PDOnline Learning To make the most of MAP, take advantage of your complimentary access to Destination PD™ (formerly Knowledge Academy), our exclusive online learning platform. We’ve designed our on-demand tutorials, recorded webinars, videos, and courses to help you create seamless assessment experiences—and to help your teachers and leaders use MAP data to enhance student learning and growth.
With an abundance of free resources plus supplementary resources for your paid onsite workshops, Destination PD is your one-stop shop for 24/7 online learning from NWEA. Whether your staff members want to spend a few minutes with a refresher tutorial or immerse themselves in an hour-long course, any computer with internet access allows them to meet their professional learning goals.
Support diverse staff learning needs with targeted, role-based resources • Help sustain and extend face-to-face workshop learning for all participants.
• Provide new teachers with important information about the value of MAP for instruction.
• Give teachers tools for using MAP data to meet both daily and seasonal needs.
• Prepare proctors to offer an optimal assessment experience for students.
• Elevate prep time for Professional Learning Community (PLC) meetings with “small bite” learning options.
503.624.1951 | 121 NW Everett St. Portland, OR 97209 Measures of Academic Progress Interim Assessments for Grades K – 12 35
Keeping Learning on TrackFORMATIVE ASSESSMENT PROFESSIONAL DEVELOPMENTIf you’re seeking to maximize student growth and engagement while strengthening your school community, turn to Keeping Learning on Track® (KLT™), a proven, multi-year curriculum focused on classroom formative assessment practice. Using KLT district wide prepares all your educators (regardless of grade level or subject area) to continuously gather evidence of student learning, adjust classroom instruction in the moment, and build local capacity to sustain those instructional shifts over time.
Skip the wasteful and go for WOWKLT supplies educators with more than just practical classroom strategies: it provides a process for applying those strategies over time.
• Rely on 100+ proven formative assessment techniques gleaned from decades of research.
• Help teachers cultivate students’ college- and career-readiness skills, including critical thinking and problem solving.
• Complement existing Professional Learning Communities (PLCs).
• Receive resources and support to empower teachers to transfer new strategies into sustained practice.
Discover how this powerful complement to MAP interim assessments helps drive student learning minute by minute.
Plan your perfect professional learning experienceWhen you purchase a minimum of three days’ worth of data coaching and/or onsite MAP Foundation Series workshops (beyond your initial required MAP Administration training), you qualify for a Customized MAP Professional Development Package. With the customized package, you receive planning guidance and ongoing support from a dedicated coach who tailors professional learning to your needs, the needs of your students, and the goals of your district; at a granular level, and within your schedule.
36 Measures of Academic Progress Interim Assessments for Grades K – 12 Partnering to Help All Kids Learn® | NWEA.org
Extend your data to promote individual learning At NWEA, we offer educators several ways to make the most of their MAP data, including the interactive Learning Continuum, RIT to Resource, MAP to Khan Academy, and NWEA instructional content providers.
The Learning ContinuumDISCOVER HOW THE LEARNING CONTINUUM EMPOWERS YOU TO CREATE STUDENT-SPECIFIC LEARNING LADDERS MAP includes our proprietary interactive tool for teachers, the Learning Continuum. Teachers can use the Learning Continuum’s information to streamline instructional planning, differentiate instruction for both individual students and skill-based activity groups, and better engage students in their learning. It’s a powerful shortcut to understanding which skills students are ready to learn.
A DATA-INFORMED CONTINUUM OF LEARNING THAT’S BASED ON DIFFICULTY, NOT SCOPE AND SEQUENCEThe Learning Continuum lets teachers see what students performing at a given RIT level on MAP assessments are typically ready to learn. From there, they can use the learning statements within the continuum to drive instruction.
• Learning statements provide you with an instructional starting point by describing the skills and concepts that are most ready to be introduced, developed, or reinforced along a continuum of learning.
• Test and Class Views supply global and student-specific information for tailoring instruction.
• MAP RIT scores get connected to skills and concepts students are ready to learn, helping you identify learning goals and targets so you can both share them with your students and parents plus create more personalized lesson plans.
503.624.1951 | 121 NW Everett St. Portland, OR 97209 Measures of Academic Progress Interim Assessments for Grades K – 12 37
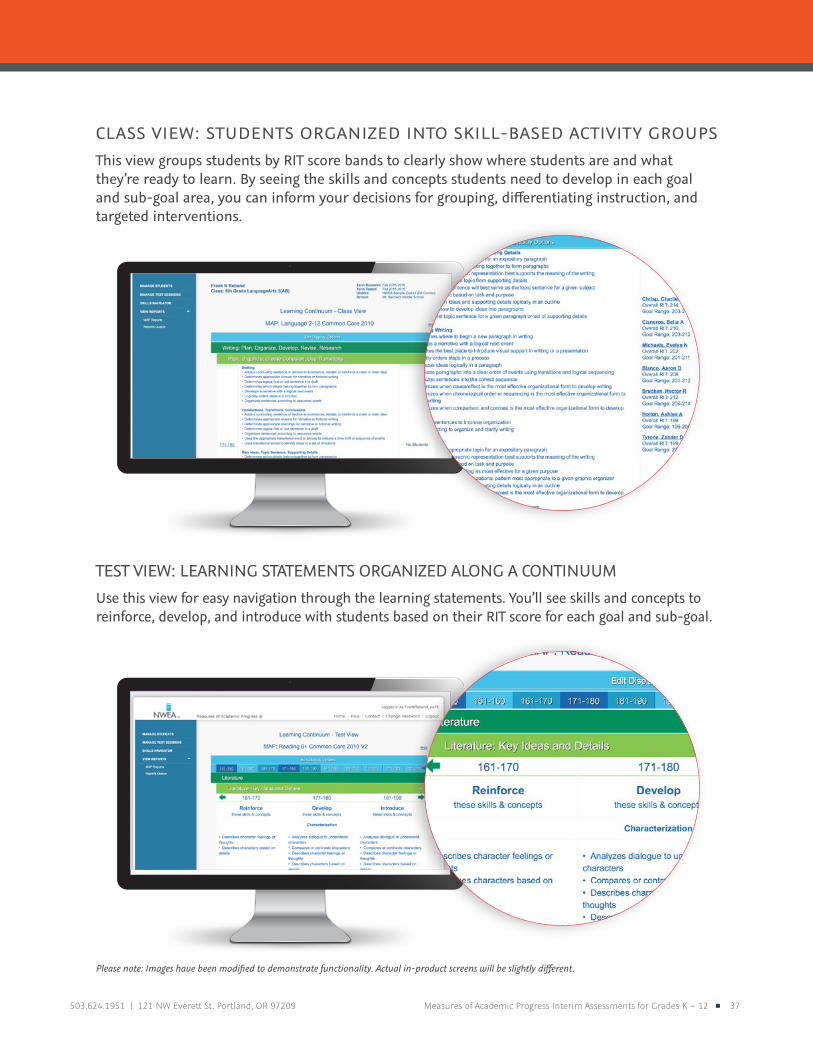
CLASS VIEW: STUDENTS ORGANIZED INTO SKILL-BASED ACTIVITY GROUPSThis view groups students by RIT score bands to clearly show where students are and what they’re ready to learn. By seeing the skills and concepts students need to develop in each goal and sub-goal area, you can inform your decisions for grouping, differentiating instruction, and targeted interventions.
TEST VIEW: LEARNING STATEMENTS ORGANIZED ALONG A CONTINUUM Use this view for easy navigation through the learning statements. You’ll see skills and concepts to reinforce, develop, and introduce with students based on their RIT score for each goal and sub-goal.
Please note: Images have been modified to demonstrate functionality. Actual in-product screens will be slightly different.

38 Measures of Academic Progress Interim Assessments for Grades K – 12 Partnering to Help All Kids Learn® | NWEA.org
Leverage your data with NWEA instructional content providersTo extend the benefits of MAP, NWEA partners with leading providers of electronic curriculum and instruction. With these partnerships, MAP scores have been aligned with content so that test results may be used to match each student with appropriate learning activities.
MAP scores are used by Compass Learning®, Study Island®, Triumph Learning™, and other instructional content providers that offer direct supplemental instruction aligned to the students’ performance levels and needs.
NWEA also partners with MetaMetrics®. Students who take MAP Reading tests receive a Lexile® measure correlated to the student’s RIT score, and that Lexile measure can be used by educators to select texts appropriate to a student’s comprehension level.
MAP to Khan AcademyNWEA offers educators who use MAP complimentary access to MAP to Khan Academy. Because MAP RIT scores correlate to free Khan Academy math practice exercises, teachers can quickly and easily support each student’s learning path. Both students and teachers can access the no-cost practice activities online, making them ideal for independent classroom work, skill-based small group instruction, or at-home learning.
We’ve based the standards alignments in MAP to Khan Academy on the CCSS alignment Khan Academy provided. Teachers whose districts aren’t implementing CCSS can relate the goals or sub-goals on their state MAP test to similar goals and sub-goals used in these documents.
RIT to ResourceFor convenient access to key MAP student performance indicators while on-the-go in the classroom, educators can turn to RIT to Resource (RITtoResource.org).
Use this information to:
• understand how a student is performing in relation to the NWEA norm group
• identify appropriate reading materials based on a student’s Lexile range
• find appropriate resources (via provided links) whose content aligns to CCSS, then easily share resources through email
• gain insights as to whether or not a student is on track for college readiness as measured by the ACT benchmarks
• project how a student may perform on their state summative test
503.624.1951 | 121 NW Everett St. Portland, OR 97209 Measures of Academic Progress Interim Assessments for Grades K – 12 39
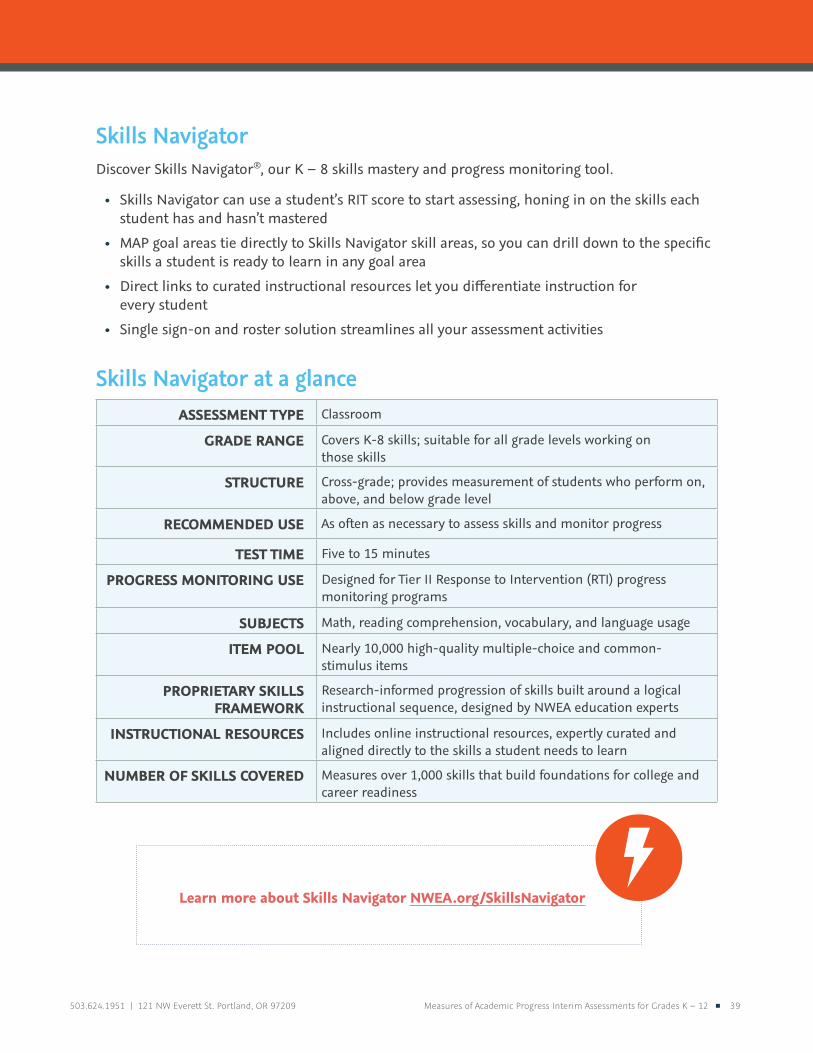
Skills NavigatorDiscover Skills Navigator®, our K – 8 skills mastery and progress monitoring tool.
• Skills Navigator can use a student’s RIT score to start assessing, honing in on the skills each student has and hasn’t mastered
• MAP goal areas tie directly to Skills Navigator skill areas, so you can drill down to the specific skills a student is ready to learn in any goal area
• Direct links to curated instructional resources let you differentiate instruction for every student
• Single sign-on and roster solution streamlines all your assessment activities
Skills Navigator at a glanceASSESSMENT TYPE Classroom
GRADE RANGE Covers K-8 skills; suitable for all grade levels working on those skills
STRUCTURE Cross-grade; provides measurement of students who perform on, above, and below grade level
RECOMMENDED USE As often as necessary to assess skills and monitor progress
TEST TIME Five to 15 minutes
PROGRESS MONITORING USE Designed for Tier II Response to Intervention (RTI) progress monitoring programs
SUBJECTS Math, reading comprehension, vocabulary, and language usage
ITEM POOL Nearly 10,000 high-quality multiple-choice and common-stimulus items
PROPRIETARY SKILLS FRAMEWORK
Research-informed progression of skills built around a logical instructional sequence, designed by NWEA education experts
INSTRUCTIONAL RESOURCES Includes online instructional resources, expertly curated and aligned directly to the skills a student needs to learn
NUMBER OF SKILLS COVERED Measures over 1,000 skills that build foundations for college and career readiness
Learn more about Skills Navigator NWEA.org/SkillsNavigator
09/2015 MAPXX_MKTG10035 0000800
Visit NWEA.org or call 866-654-3246 to find out how NWEA can partner with you to help all kids learn.
© 2015 Northwest Evaluation Association | 121 NW Everett St. Portland, OR 97209 | NWEA.org
Founded by educators nearly 40 years ago, Northwest Evaluation Association (NWEA) is a global not–for–profit educational services organization known for our flagship interim assessment, Measures of Academic Progress (MAP). More than 7,600 partners in U.S. schools, school districts, education agencies, and international schools trust us to offer pre-kindergarten through grade 12 assessments that accurately measure student growth and learning needs, professional development that fosters educators’ abilities to accelerate student learning, and research that supports assessment validity and informed policy. To better inform instruction and maximize every learner’s academic growth, educators currently use NWEA assessments with nearly 8 million students.
MAP, Measures of Academic Progress, Keeping Learning on Track, Skills Navigator, and Partnering to Help All Kids Learn are registered trademarks and NWEA and KLT are trademarks of Northwest Evaluation Association in the U.S. and other countries. The names of other companies and their products mentioned in this brochure are the trademarks of their respective owners.