Embed Size (px)
Citation preview

Measurements of the forced convective heat loss from open cylindrical cavities ofmulti-MW scale solar central receiver systemsSilvan Siegrist, Hannes Stadler, and Bernhard Hoffschmidt
Citation: AIP Conference Proceedings 2033, 040036 (2018); doi: 10.1063/1.5067072View online: https://doi.org/10.1063/1.5067072View Table of Contents: http://aip.scitation.org/toc/apc/2033/1Published by the American Institute of Physics
Articles you may be interested inFluidized particle-in-tube solar receiver and reactor: A versatile concept for particulate calcination and highefficiency thermodynamic cyclesAIP Conference Proceedings 2033, 040017 (2018); 10.1063/1.5067053
Advanced power cycles and configurations for solar towers: Techno-economical optimization of the decoupledsolar combined cycle conceptAIP Conference Proceedings 2033, 040037 (2018); 10.1063/1.5067073
Dispatchable solar power plantAIP Conference Proceedings 2033, 040032 (2018); 10.1063/1.5067068

Measurements of the Forced Convective Heat Loss from Open Cylindrical Cavities
of Multi-MW Scale Solar Central Receiver Systems
Silvan Siegrist1, a), Hannes Stadler1 and Bernhard Hoffschmidt2
1Institute of Solar Research, German Aerospace Center (DLR), Professor-Rehm-Str. 1, 52428 Juelich (Germany) 2Institute of Solar Research, German Aerospace Center (DLR), Linder Hoehe, 51147 Koeln (Germany)
a)Corresponding author: [email protected]
Abstract. We investigated the forced convective heat loss from a model of a multi-MW cavity receiver of a concentrated solar power (CSP) tower system in a high-pressure wind tunnel. Measurements of 5 geometrical configurations of this model are reported in this contribution. The experiment covered a Reynolds number range of between 2 ⋅ 106 and 8 ⋅ 106, based on the external flow field. The results show that the maximum forced convective heat loss for all configurations occurs when the wind blows from frontal directions of between 60° and 80° relative to the tower symmetry plane. We found that the peak location does not vary for different inclinations, but does vary for different apertures. Also, the results show that the direction of the wind causes the forced convective heat loss to vary with a factor of up to 6.3. Last but not least, we augmented the interpretation of our heat loss measurements with images produced with a Background-oriented Schlieren Imaging (BOS) setup.
INTRODUCTION
During the operation of multi-MW receivers of concentrated solar power (CSP) tower systems, heat is lost mainly due to (a) the partial reflection of the incoming solar radiation on the receiver surface, (b) the radiation from the hot receiver surfaces to the surroundings, (c) the conduction to support structures and (d) the mixed convection from the hot receiver surfaces to the surroundings.
Previous research showed that the wind speed may have significant influence on the convective heat loss from concentrated solar power (CSP) cavity receivers. See Flesch et al. [1] for a recent summary of the state of knowledge concerning convective heat loss from cavities. Flesch et al. [1] also reported an experimental analysis, but for smaller receivers and mixed convection. This work focuses on the forced convective heat loss from cavities of solar central receiver (SCR) systems with a receiver thermal output power of around 100 MW.
Though there have been many studies on the convective heat loss from cavities, the convective heat loss of such a receiver on multi-MW scale remains difficult to measure on original scale due to the complicated geometries and large dimensions. These large dimensions lead to Reynolds numbers Re of up to 107 and Grashof numbers Gr of up to 1014. As a consequence, a physically similar model on a smaller length scale is hardly achievable if one would like to model the mixed convection and thus would need to keep both dimensionless numbers constant. Therefore, we chose to measure only the forced convection in this experiment and hence, only the Reynolds similarity needs to be adhered to.
For the measurement of the forced convective heat loss we used wall-mounted hot-film sensors operated in constant temperature mode. Wall-mounted hot-film sensors have been used to measure local time-resolved heat transfer in several experiments, see O’Donovan et al. [2] for a thorough summary. Since conventional straight hot-film sensors are heavily dependent on the incident angle of the flow [3-4], we designed a ringlike wall-mounted hot-film sensor [5-6] to reduce this angular dependency.
SolarPACES 2017AIP Conf. Proc. 2033, 040036-1–040036-8; https://doi.org/10.1063/1.5067072
Published by AIP Publishing. 978-0-7354-1757-1/$30.00
040036-1
EXPERIMENTAL METHODS
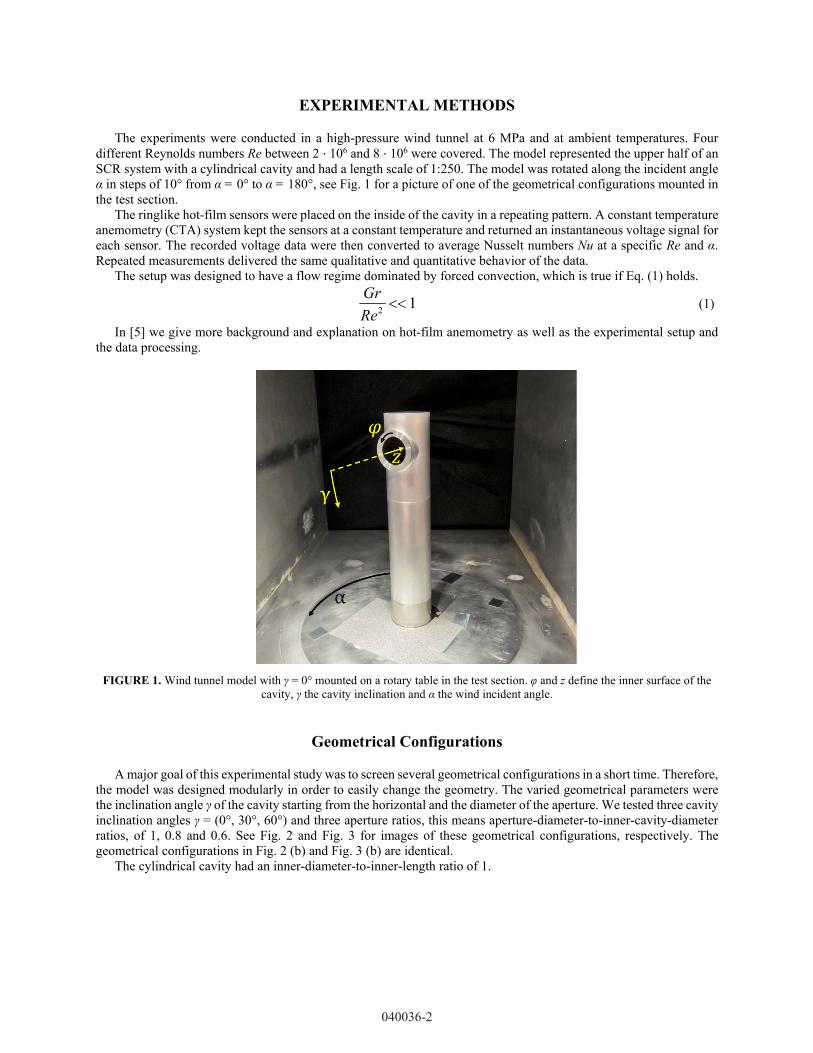
The experiments were conducted in a high-pressure wind tunnel at 6 MPa and at ambient temperatures. Four different Reynolds numbers Re between 2 ⋅ 106 and 8 ⋅ 106 were covered. The model represented the upper half of an SCR system with a cylindrical cavity and had a length scale of 1:250. The model was rotated along the incident angle α in steps of 10° from α = 0° to α = 180°, see Fig. 1 for a picture of one of the geometrical configurations mounted in the test section.
The ringlike hot-film sensors were placed on the inside of the cavity in a repeating pattern. A constant temperature anemometry (CTA) system kept the sensors at a constant temperature and returned an instantaneous voltage signal for each sensor. The recorded voltage data were then converted to average Nusselt numbers Nu at a specific Re and α. Repeated measurements delivered the same qualitative and quantitative behavior of the data.
The setup was designed to have a flow regime dominated by forced convection, which is true if Eq. (1) holds.
12
Re
Gr (1)
In [5] we give more background and explanation on hot-film anemometry as well as the experimental setup and the data processing.
FIGURE 1. Wind tunnel model with γ = 0° mounted on a rotary table in the test section. φ and z define the inner surface of the cavity, γ the cavity inclination and α the wind incident angle.
Geometrical Configurations
A major goal of this experimental study was to screen several geometrical configurations in a short time. Therefore, the model was designed modularly in order to easily change the geometry. The varied geometrical parameters were the inclination angle γ of the cavity starting from the horizontal and the diameter of the aperture. We tested three cavity inclination angles γ = (0°, 30°, 60°) and three aperture ratios, this means aperture-diameter-to-inner-cavity-diameter ratios, of 1, 0.8 and 0.6. See Fig. 2 and Fig. 3 for images of these geometrical configurations, respectively. The geometrical configurations in Fig. 2 (b) and Fig. 3 (b) are identical.
The cylindrical cavity had an inner-diameter-to-inner-length ratio of 1.
040036-2

(a) (b) (c)
FIGURE 2. Wind tunnel model with cavity inclination angles (a) γ = 0°, (b) γ = 30° and (c) γ = 60°. All three models have the same aperture ratio of 0.8.
(a) (b) (c)
FIGURE 3. Wind tunnel model with aperture ratios (a) 1, (b) 0.8 and (c) 0.6. All three models have the same cavity inclination angle of γ = 30°.
Data Processing
The obtained CTA voltage signal can be converted to the power delivered to the sensor Pel,s as shown in Eq. (2)
)( w
2s
sel, TR
EP (2)
with Es being the voltage drop across a sensor and R(Tw) the sensor resistance at operating Temperature. Then, the difference of power needed to keep a sensor at the desired operating temperature with wind Pel,s,wind and
at the same temperature but without wind Pel,s,calm equals the additional power transported away from the sensor by forced convection, as defined hereafter.
sforc,conv,calms,el,winds,el,sel, QPPP (3)
And finally, we can form a Nusselt number expression as
Tk
PCNu
air
sel,s (4)
with Cs being a constant related to the sensor geometry, kair the thermal conductivity of air at fluid temperature and ΔT the temperature difference between sensor operating temperature and fluid temperature. For comparison, the Nusselt numbers of each sensor were then area-averaged over the whole inner cylindrical surface.
Background-oriented Schlieren Imaging
In order to obtain more information on the flow around the cavity of our model, we applied a Background-oriented Schlieren Imaging (BOS) setup. A BOS setup is able to visualize density gradients in a transparent fluid. The measurement principle bases on the correlation of the index of refraction with density. In general, the BOS method
040036-3

delivers qualitative and quantitative results. The theory, setup and data processing for an infinite cylinder in a high-pressure environment were introduced in [7]. In this experiment we adapted the method from [7] to our finite cylinder with cavity.
RESULTS
The forced convective heat loss results presented hereafter are normalized to the maximum area-averaged Nusselt number Numax of all measurement points in the experiment. Any missing points are due to operation limitations of the force balance.
Forced Convective Heat Loss for Three Inclinations
Figure 4 shows the relative forced convective heat loss at an aperture ratio of 0.8. From left to right, the results are plotted for the cavity inclination angles γ = (0°, 30°, 60°).
For a horizontal cavity (see left subfigure in Fig. 4), the data rise until the maximum heat loss at α = 70°, with the exception of a small plateau at α = (50°, 60°). The maximum value for these Reynolds number series is slightly more than 0.8. After the clear peak, the data drop within Δα = 20° to levels comparable to heat loss at α = 0°. For Re = 2 ⋅ 106, the heat loss remains small and even decreases at α = 180°. For Re = 4 ⋅ 106, the heat loss slightly increases again until a second, sharp maximum at α = 180°. For Re ≥ 6 ⋅ 106, the data also increase slightly, but until a second, broad maximum at α = (170°, 180°).
In the case of a cavity with γ = 30° (see center subfigure in Fig. 4), the data rise until the maximum heat loss at α = 70°, but with the exception of a small plateau at α = (30°, 40°). The peak value for these Reynolds number series is almost 1. Thereafter, the data fall within Δα = 20° to levels comparable to heat loss at α = 0° or to even lower heat loss. For Re = 2 ⋅ 106, the heat loss remains small and even decreases for α = 180°. For Re = 4 ⋅ 106, the data further decrease slightly, but increase again for α ≥ 150° to a second maximum at α = 180°. For Re ≥ 6 ⋅ 106, the data also further decrease slightly and increase again for α ≥ 160° until a second maximum at α = 180°.
In the case of a cavity with γ = 60° (see right subfigure in Fig. 4), the data rise until the maximum heat loss at α = 70°, but with the exception of a small buckle at α = (30°, 40°). The peak value for these Reynolds number series lies at around 0.7, not including the values for Re = 8 ⋅ 106 at α = (40° … 130°). For Re = 2 ⋅ 106, the heat loss drops within Δα = 10° to values well below those at α = 0°. For Re = 4 ⋅ 106 and Re = 6 ⋅ 106, the data drop within Δα = 20° to heat loss values well below those at α = 0°. For Re = 8 ⋅ 106, data at the incident angles where we expect the peak is not existent due to the technical limits of the force balance. For Re = 2 ⋅ 106, the data remain at low values until an increase at α ≥ 130°. This second maximum is a broad peak at α = (140° … 160°) with reduced values for α ≥ 170°. For Re = 4 ⋅ 106 and Re = 6 ⋅ 106, the values remain low, except a second, smaller peak at α = (150°, 160°). For Re = 8 ⋅ 106, nothing can be said on the values at α = (40° … 130°). But, the values of this Reynolds number series show a small maximum at α = 150° with a linear decrease until α = 180°. All of the data at α ≥ 140° lie below the values at α = 0°. The heat loss for all Reynolds number series at α = 180° shows similar values located around 0.2.
FIGURE 4. Relative forced convective heat loss for a horizontal cavity with γ = 0° (left), a downward inclined cavity with γ = 30° (center), and for a downward inclined cavity with γ = 60° (right). The aperture ratio was 0.8.
040036-4
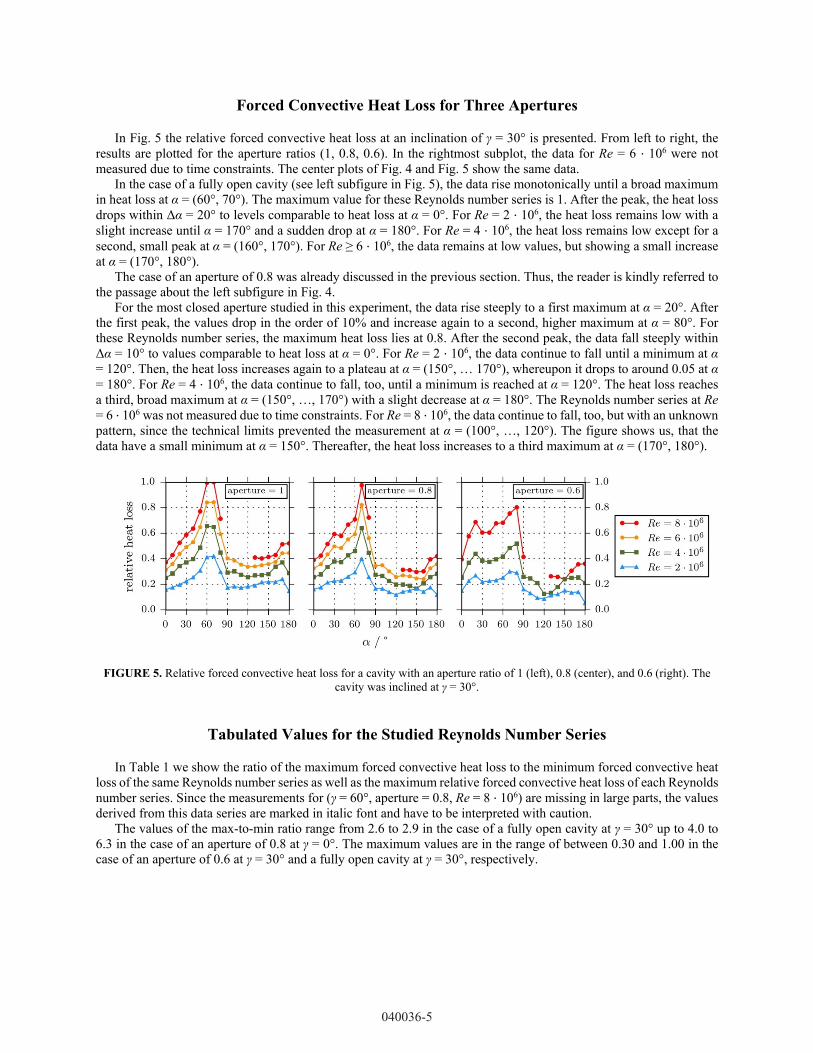
Forced Convective Heat Loss for Three Apertures
In Fig. 5 the relative forced convective heat loss at an inclination of γ = 30° is presented. From left to right, the results are plotted for the aperture ratios (1, 0.8, 0.6). In the rightmost subplot, the data for Re = 6 ⋅ 106 were not measured due to time constraints. The center plots of Fig. 4 and Fig. 5 show the same data.
In the case of a fully open cavity (see left subfigure in Fig. 5), the data rise monotonically until a broad maximum in heat loss at α = (60°, 70°). The maximum value for these Reynolds number series is 1. After the peak, the heat loss drops within Δα = 20° to levels comparable to heat loss at α = 0°. For Re = 2 ⋅ 106, the heat loss remains low with a slight increase until α = 170° and a sudden drop at α = 180°. For Re = 4 ⋅ 106, the heat loss remains low except for a second, small peak at α = (160°, 170°). For Re ≥ 6 ⋅ 106, the data remains at low values, but showing a small increase at α = (170°, 180°).
The case of an aperture of 0.8 was already discussed in the previous section. Thus, the reader is kindly referred to the passage about the left subfigure in Fig. 4.
For the most closed aperture studied in this experiment, the data rise steeply to a first maximum at α = 20°. After the first peak, the values drop in the order of 10% and increase again to a second, higher maximum at α = 80°. For these Reynolds number series, the maximum heat loss lies at 0.8. After the second peak, the data fall steeply within Δα = 10° to values comparable to heat loss at α = 0°. For Re = 2 ⋅ 106, the data continue to fall until a minimum at α = 120°. Then, the heat loss increases again to a plateau at α = (150°, … 170°), whereupon it drops to around 0.05 at α = 180°. For Re = 4 ⋅ 106, the data continue to fall, too, until a minimum is reached at α = 120°. The heat loss reaches a third, broad maximum at α = (150°, …, 170°) with a slight decrease at α = 180°. The Reynolds number series at Re = 6 ⋅ 106 was not measured due to time constraints. For Re = 8 ⋅ 106, the data continue to fall, too, but with an unknown pattern, since the technical limits prevented the measurement at α = (100°, …, 120°). The figure shows us, that the data have a small minimum at α = 150°. Thereafter, the heat loss increases to a third maximum at α = (170°, 180°).
FIGURE 5. Relative forced convective heat loss for a cavity with an aperture ratio of 1 (left), 0.8 (center), and 0.6 (right). The cavity was inclined at γ = 30°.
Tabulated Values for the Studied Reynolds Number Series
In Table 1 we show the ratio of the maximum forced convective heat loss to the minimum forced convective heat loss of the same Reynolds number series as well as the maximum relative forced convective heat loss of each Reynolds number series. Since the measurements for (γ = 60°, aperture = 0.8, Re = 8 ⋅ 106) are missing in large parts, the values derived from this data series are marked in italic font and have to be interpreted with caution.
The values of the max-to-min ratio range from 2.6 to 2.9 in the case of a fully open cavity at γ = 30° up to 4.0 to 6.3 in the case of an aperture of 0.8 at γ = 0°. The maximum values are in the range of between 0.30 and 1.00 in the case of an aperture of 0.6 at γ = 30° and a fully open cavity at γ = 30°, respectively.
040036-5

Background-oriented Schlieren Imaging
In this experiment, the images obtained with the BOS method can give us more insight in flow effects which are not captured with or which are impossible to explain with the rest of the measurement equipment of our experiment. In Fig. 6, we present images from the Reynolds number series (γ = 0°, aperture = 0.8, Re = 8 ⋅ 106) at four selected incident angles: (a) α = 60°, (b) α = 70°, (c) α = 80°, and (d) α = 90°. The color indicates the pixel displacement of the background pattern due to density gradients. The small black arrows display the size and direction of the displacement. This displacement is caused by the changes of the index of refraction which stem from density gradients. The gray area represents the tower seen from above. The aperture of the cavity is in-plane with the long horizontal edge of the gray area. Around the tower and at the borders there is a layer of white space caused by the post-processing algorithm. The thin head of the white arrow points in the direction of the fluid flow.
During these Δα = 40°, the forced convective heat loss rises from 0.59 to its maximum at 0.82 and falls in two steps to 0.72 and 0.32. The flow pattern shown in Fig. 6 (a) has few and weak density gradients close to the aperture. In Fig. 6 (b), the flow shows a large zone with strong density gradients right in front of the aperture. This picture corresponds to the maximum forced convective heat loss of this Reynolds number series. In the third subfigure, Fig. 6 (c), the zone of density gradients is even larger, but with less strong density gradients and they are located at a small distance from the aperture. In Fig. 6 (d), the density gradient zone is far away from the aperture and the strength of the density gradients is low.
TABLE 1. Ratio of the maximum forced convective heat loss to the minimum forced convective heat loss of the same Reynolds number series as well as the maximum relative forced convective heat loss of each Reynolds number series. The data in Fig. 4 center and Fig. 5 center is identical. The data for (γ = 30°, aperture = 0.6, Re = 6 ⋅ 106) is missing due to time
constraints. Values in italic should be used with caution, since they are calculated from a largely incomplete data series.
Subfigure Inclination Angle γ / °
Aperture Reynolds NumberRe / 106
Max-to-min Ratio Maximum Value Nu / Numax
Fig. 4 left
0 0.8 2 6.3 0.350 0.8 4 4.6 0.550 0.8 6 4.1 0.700 0.8 8 4.0 0.82
Fig. 4 center
30 0.8 2 3.4 0.4030 0.8 4 3.8 0.6430 0.8 6 3.4 0.8230 0.8 8 3.3 0.97
Fig. 4 right
60 0.8 2 2.8 0.3560 0.8 4 3.2 0.5460 0.8 6 3.2 0.7160 0.8 8 2.8 0.72
Fig. 5 left
30 1 2 2.9 0.4230 1 4 2.6 0.6530 1 6 2.7 0.8430 1 8 2.8 1.00
Fig. 5 right 30 0.6 2 5.5 0.3030 0.6 4 4.1 0.5230 0.6 8 3.4 0.80
040036-6

(a)
(b)
(c)
(d)
FIGURE 6. Pixel displacement of the background pattern obtained with a BOS setup. This displacement is caused by changes of the index of refraction which stem from density gradients. The gray area is the tower seen from above. The aperture of the cavity
is in-plane with the long horizontal edge of the gray area. Around the tower and at the borders there is a layer of white space caused by the post-processing algorithm. The thin head of the white arrow displays the direction of the fluid flow. The small
black arrows indicate the size and direction of the displacement.
DISCUSSION
In Fig. 4 and 5 it is visible that the incident angle α has substantial influence on the forced convective heat loss no matter neither what geometrical configuration we study nor how large Re is. In Table 1 we see that the lowest max-to-min ratio for a Reynolds number series is in the case of a fully open cavity with a ratio of between 2.6 and 2.9. At the same time, we see that the max-to-min ratio can be as high as 6.3 in the case of a horizontal cavity with an aperture of 0.8. Such high max-to-min ratios indicate that the angular influence on the forced convective heat loss from cylindrical cavities of large SCR systems cannot be neglected.
From Table 1 we obtain that the highest maximum heat loss are to be found in cavities with (γ = 30°, aperture = 0.8) and (γ = 30°, aperture = 1).
In Fig. 4 we identify a constant location of the peak with respect to the incident angle α. The incident angle where the maximum is found does not change when changing the inclination angle and the wind speed, while keeping the aperture constant. But, keeping the inclination angle constant and changing the aperture and the wind speed, reveals that the inclination angle corresponding to the peak increases with decreasing aperture. For the apertures studied here, the total shift is Δα = 20° in positive direction.
In a previous wind tunnel experiment [1], the maximum heat loss was found to be at α = 90° for γ = 0°, γ = 30° and γ = 60°. All experiments in [1] were performed with an aperture = 0.55, with mixed convection and with a maximum Reynolds number of 5.2 ⋅ 105. The studied geometry was a simple cavity model similar to the one used in this work, but without modeling the tower. Although one should be very careful with comparing results under such different conditions, we can say that the location of the maximum heat loss is close to the one measured for (γ = 30°, aperture = 0.6). We expect the remaining difference of Δα = 10° to come either from the presence of the tower in our experiment or from additional effects of the mixed convection in the previous experiment.
From the images of Fig. 6 we may deduce that large zones of strong density gradients right in front of the aperture correspond with a high forced convective heat loss. Assuming that density gradients are related to pressure gradients (see [7]), we can conclude that high density gradients mean high pressure gradients mean high flow speeds mean enhanced exchange of fluid and heat between the cavity inside and the surroundings.
Δpx
2.25
1.50
0.75
0.00
3.00
040036-7

CONCLUSIONS
We conclude that (i) the effect of the wind direction on the forced convective heat loss from circular cavities may be large with a max-to-min ratio ranging from 2.6 to 6.3 in the studied cases per Reynolds number series. We further conclude that (ii) the maximum forced convective heat loss for configurations with a constant aperture, but varying inclination occurs at a constant incident angle α, in the case of aperture = 0.8 it is α = 70°. We also showed that (iii) the peak location for different apertures, but with a constant inclination moves in positive direction with decreasing aperture, in the case of γ = 30° there is a shift of Δα = 20° in total. Furthermore, compared to a previous experiment we conclude that (iv) our measured peak locations are close to previously measured ones, but still have a difference which could be due to (v) the tower present in our experiment or (vi) additional effects of the mixed convection in the previous experiment. And finally, we conclude that (vii) the used BOS setup augments the interpretation of the heat loss measurements.
ACKNOWLEDGMENTS
We want to thank (in alphabetic order) Andreas Benkel, Arne Tiddens, Karsten Steiner, Markus Jacobs, Markus Loehr, Matthias Offergeld, Nils van Hinsberg, Robert Flesch, and Stefan Koch for fruitful discussions and invaluable support during the experiments.
This work was carried out with financial support from the Ministry of Innovation, Science and Research of the State of North Rhine-Westphalia (MIWF NRW), Germany under contract 323-2010-006 (Start-SF).
REFERENCES
1. R. Flesch, H. Stadler, R. Uhlig and B. Hoffschmidt, Appl. Therm. Eng. 87, 724-735 (2015). 2. T. S. O’Donovan, T. Persoons and D. B. Murray, Meas. Sci. Technol. 22, 105402 (2011). 3. C. G. Lomas, Fundamentals of Hot Wire Anemometry, (Cambridge University Press, Cambrigde, 1986). 4. C. Tropea, A. Yarin and J. F. Foss, Springer Handbook of Experimental Fluid Mechanics, (Springer, Berlin,
2007). 5. S. Siegrist, H. Stadler and B. Hoffschmidt, “Novel Wall-mounted Hot-film Sensors for the Measurement of the
Forced Convection from an Open Cylindrical Cavity”, 9th World Conference on Experimental Heat Transfer, Fluid Mechanics and Thermodynamics (ExHFT-9), 12-15 June 2017, Foz do Iguaçu, Brazil.
6. S. Siegrist, Patent application, DE 102016221629.5 (4 November 2016). 7. H. Stadler, A. Bauknecht, S. Siegrist, R. Flesch, C. C. Wolf, N. van Hinsberg and M. Jacobs, Exp. Fluids 58, 114
(2017).
040036-8


![Radiative heat transfer - MIT OpenCourseWare · Convective Heat Transfer Coefficient [W/m2K] Flow dependent • Natural Convection • Forced Convection Thermal Radiation T hot T](https://img.pdfslide.us/doc/110x75/5b0c69c77f8b9a61448e6b64/radiative-heat-transfer-mit-opencourseware-heat-transfer-coefficient-wm2k-flow.jpg)