Embed Size (px)
Citation preview
Thomas P. Kurosu (1), Kelly Chance (1), Rainer Volkamer (2)
(1) Harvard-Smithsonian Center for Astrophysics, 60 Garden Street, Cambridge, MA 02138, USA, [email protected]; [email protected]
(2) University of California at San Diego, 9500 Gilman Drive, La Jolla, CA 920093, USA, [email protected] 1. ABSTRACT Several years after First Light, data products of minor trace species from the Dutch-Finnish Ozone Monitoring Instrument [1] are showing great potential for atmospheric chemistry studies: BrO, an important compound in stratospheric ozone depletion due to its high efficiency in destroying ozone molecules, has been observed by OMI in the troposphere over shelf ice and over salt lakes. Recent improvements in the retrieval of HCHO, the major proxy for volatile organic compound (VOC) emissions, produced from methane oxidation and isoprene emissions, and an indicator for urban air quality, has significantly enhanced the quality of this data product and has brought into reach its utilization in air quality studies. Finally, the observation of CHOCHO (glyoxal), a VOC recently detected in ground-based measurements over Mexico City, constituted the first-ever measurement of this elusive indicator of air quality from a satellite instrument. With ground pixel sizes of 13×24 km2 at nadir and daily global coverage, OMI provides a unique data set for global tropospheric chemistry monitoring. In this brief presentation, we show recent advances on the detection of BrO (both tropospheric and stratospheric), and we present updates on the retrievals of HCHO and CHOCHO including time-resolved measurements of CHOCHO over a one-year period. The retrieval algorithm is introduced briefly, and an overview of the status and availability of OMI data products both, operational (BrO, HCHO) and scientific (CHOCHO), derived at the SAO is given. 2. RETRIEVAL ALGORITHMS For the molecules presented here, OMI spectra are first fitted to determine slant column abundances using the method developed at the Smithsonian Astrophysical Observatory (SAO) for the GOME and SCIAMACHY satellite instruments, as in [1]: Radiance spectra are fitted directly using a nonlinear least-squares fitting approach, where the fitting includes wavelength calibration by Fraunhofer cross-correlation [2], correction for the Ring effect [3], and correction for spectral undersampling [4].
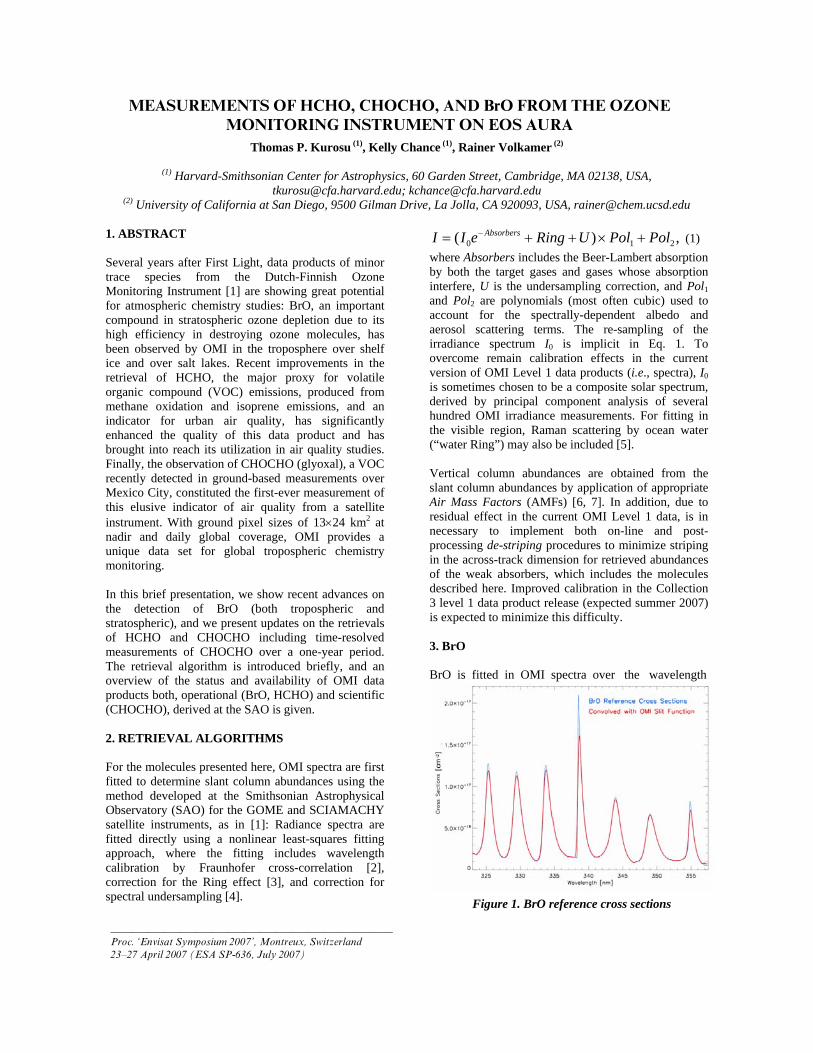
0 1 2( ) ,AbsorbersI I e Ring U Pol Pol−= + + × + (1) where Absorbers includes the Beer-Lambert absorption by both the target gases and gases whose absorption interfere, U is the undersampling correction, and Pol1 and Pol2 are polynomials (most often cubic) used to account for the spectrally-dependent albedo and aerosol scattering terms. The re-sampling of the irradiance spectrum I0 is implicit in Eq. 1. To overcome remain calibration effects in the current version of OMI Level 1 data products (i.e., spectra), I0 is sometimes chosen to be a composite solar spectrum, derived by principal component analysis of several hundred OMI irradiance measurements. For fitting in the visible region, Raman scattering by ocean water (“water Ring”) may also be included [5]. Vertical column abundances are obtained from the slant column abundances by application of appropriate Air Mass Factors (AMFs) [6, 7]. In addition, due to residual effect in the current OMI Level 1 data, is in necessary to implement both on-line and post-processing de-striping procedures to minimize striping in the across-track dimension for retrieved abundances of the weak absorbers, which includes the molecules described here. Improved calibration in the Collection 3 level 1 data product release (expected summer 2007) is expected to minimize this difficulty. 3. BrO BrO is fitted in OMI spectra over the wavelength
Figure 1. BrO reference cross sections
MEASUREMENTS OF HCHO, CHOCHO, AND BrO FROM THE OZONE MONITORING INSTRUMENT ON EOS AURA
_____________________________________________________
Proc. ‘Envisat Symposium 2007’, Montreux, Switzerland 23–27 April 2007 (ESA SP-636, July 2007)

window 338-357 nm (the UV2 channel). Fig. 1 shows the BrO reference cross-sections [8] before and after spectral convolution to the OMI spectral resolution, in preparation for fitting. BrO fitting uncertainties for OMI are 5% (hot spots) to 50% (background), or about 0.5-1.5×10¹³ mol/cm2 Fig. 2 gives a global view of
BrO for the Month of August 2006. It is largely stratospheric, having a relatively uniform global distribution, with stratospheric minimum of 2-4×10¹³ mol/cm2 at the equator. Bromine is efficient in the destruction of stratospheric ozone, where the large abundance of BrO makes the catalytic Br + O3 cycle 40-100 times more efficient than that of the chlorine
catalytic cycle on its own. The polar ice shelves in
springtime are major tropospheric sources of BrO, as seen previously in GOME and SCIAMACHY measurements. Fig. 3 shows examples for polar BrO in
both hemispheres. OMI has made the first measurements of tropospheric BrO from volcanoes and salt lakes. Fig. 4 shows BrO derived from gases emitted by the Ambrym Volcano in Vanuatu. Fig. 5 shows BrO from the Dead Sea, where the prevailing northeasterly winds cause the concentration to peak in the southwest [9]. 4. HCHO: INTRODUCTION AND FITTING HCHO has been, to date, the major proxy for volatile organic compound (VOC) emissions in satellite measurements of the troposphere. It is produced from the oxidation of methane oxidation, isoprene, and other hydrocarbons, and is a primary Indicator for air quality. It has an average atmospheric lifetime of ~1.5 hours, against photolysis and reaction with OH. Its measurement has been a major success story for GOME, where the measurement capability developed
Figure 2. Bro vertical column: Monthly average for August 2006
Figure 3. Polar springtime BrO from OMI
Figure 4. OMI BrO from the Ambrym Volcano
Figure 5. OMI BrO from the Dead Sea
Figure 6. HCHO fitting window
by SAO has led to a large number of quantitative science studies together with the Harvard atmospheric chemistry modeling group (cf. [10, 11] and references therein). We are poised to repeat this success with OMI: Daily (Level 2) and monthly (Level 3) HCHO products are now being produced. The HCHO fitting window is 324–357 nm (UV2 channel): Fig. 6 shows the HCHO reference cross sections [12] before and after spectral convolution to the OMI spectral resolution, in preparation for fitting. Fitting uncertainties for individual spectra are now at the 50-100% level, with further improvements expected. The initial public release of data has been made. 5. CHOCHO: INTRODUCTION AND FITTING CHOCHO was recently observed by ground-based DOAS measurements in Mexico City during the MCMA-2003 campaign [13] and later during the MILAGRO campaign and in the Pearl River Delta, China (see below). SAO measurements of CHOCHO using OMI are the first measurements from space, followed by measurements from SCIAMACHY [14]. The first seasonally-resolved measurements from OMI are now being produced. CHOCHO is produced from oxidation of a number of VOCs including, in regions with strong anthropogenic influence, substantial contributions from aromatics: Unlike HCHO, it is not directly affected by vehicle emission and, hence, is a better indicator for VOC oxidation (photochemical smog). The photochemical lifetime is ≤1.3 hours, the primary sinks being photolysis and reaction with OH.
The CHOCHO fitting window is 430–460 nm (VIS channel): Fig. 7 shows the CHOCHO reference cross sections [14] before and after spectral convolution to the OMI spectral resolution, in preparation for fitting.
Figure 7. CHOCHO fitting window
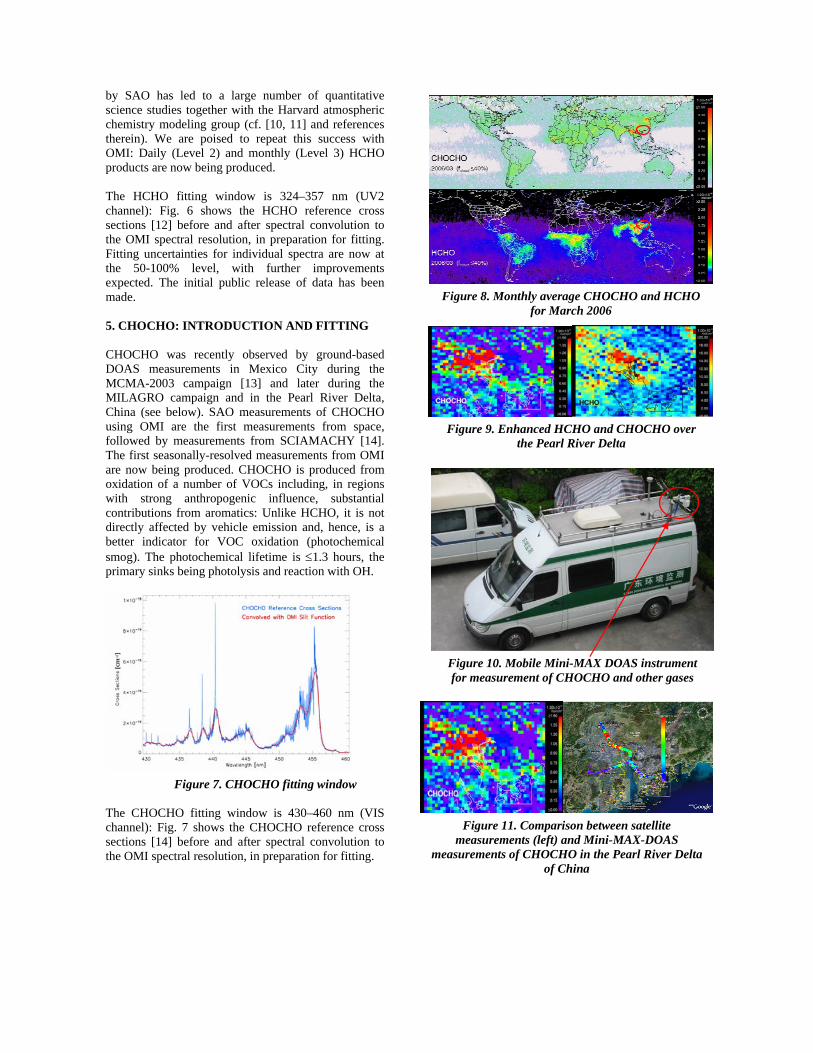
Figure 8. Monthly average CHOCHO and HCHO for March 2006
Figure 10. Mobile Mini-MAX DOAS instrument for measurement of CHOCHO and other gases
Figure 11. Comparison between satellite measurements (left) and Mini-MAX-DOAS
measurements of CHOCHO in the Pearl River Delta of China
Figure 9. Enhanced HCHO and CHOCHO over the Pearl River Delta
6. OBSERVATIONS OF CHOCHO AND HCHO Fig. 8 shows the global monthly averages for both HCHO and CHOCHO for March 2006, i.e., during the INTEX-B Campaign. Pollution over the Guangzhou region in China, including the Pearl River Delta, is emphasized. Fig. 9 shows the enhancements in HCHO and CHOCHO over the Pearl River Delta in detail for July 2006, during the time the PRD-2006 ground-based campaign occurred. This campaign included both the OMI measurements (~15 km resolution) and solar stray light remote sensing from the ground using the Mobile Mini-MAX DOAS instrument of R. Volkamer (~2 km resolution), shown mounted in Fig. 10. Initial comparisons, shown in Fig. 11, are quite encouraging, although the quantitative scientific analysis is currently in progress. 7. SUMMARY AND OUTLOOK OMI on EOS-Aura (global coverage, equator crossing time 1338h) is ideally positioned for air quality observations. Calibration issues leading to stripes in the OMI Level 2 data products, particularly for small absorbers including BrO, HCHO and CHOCHO are beginning to come under control due to both improved Level 1-2 destriping strategies and advancements in the L1b data product. BrO observations have matured. All major sources of tropospheric BrO (shelf ice, salt lakes, volcanoes) are observed by OMI. HCHO spatial resolution shows great improvements over previous GOME results. The recent emergence of daily products is due to advancements in destriping procedures. CHOCHO data quality is beginning to stabilize. Daily observations are well within reach over strong source regions like Guangzhou and Mexico City. Initial comparisons with ground-based measurements in the Pearl River Delta is encouraging. Validation of the OMI products is ongoing. At present OMI underestimates both BrO and HCHO with respect to previous GOME and SCIAMACHY measurements and OMI validation studies (M. Van Roozendael, I. De Smedt, and F. Hendrick, private communication). Comparisons of OMI and SCIAMACHY CHOCHO measurements will be necessary to quantitatively address global distributions and chemistry. Scientific studies planned and underway include analysis of HCHO/CHOCHO/NO2/tropospheric O3 correlations (including tropospheric O3 developed at SAO (X. Liu et al.); detailed analysis of tropospheric BrO; quantification of the BrO/SO2 ratios over volcanoes; “missing” CHOCHO over isoprene hot-
spots: Is there a mechanism that prevents glyoxal formation in such conditions? The improved collection 3 level 1b data set is expected in summer 2007. 8. ACKNOWLEDGMENTS We are pleased to acknowledge our ongoing collaboration with members of the Harvard atmospheric chemistry modeling team, particularly D. Jacob, T.-M. Fu, and D. Millet. We are also grateful for the efforts of M. Van Roozendael, I. De Smedt, and F. Hendrick in validation of OMI BrO and HCHO measurements, and to the U.S. and European OMI Science Teams for ongoing scientific support. This research was supported by NASA. R.V. acknowledges a Feodor-Lynen Fellowship from the Alexander von Humboldt Foundation. OMI is a Dutch-Finnish instrument and is managed by KNMI and NIVR in the Netherlands. 9. REFERENCES 1. Levelt, P.F., G.H.J. van den Oord, M.R. Dobber, A.
Mälkki, H. Visser, J. de Vries, P. Stammes, J. Lundell and H. Saari, The Ozone Monitoring Instrument, IEEE Trans. Geosci. Rem. Sens. 44, 1093-1101, doi:10.1109/TGRS.2006.872333, 2006.
2. Chance, K., Ed., OMI Algorithm Theoretical Basis
Document, Volume IV, OMI Trace Gas Algorithms, ATBD-OMI-02, Version 1.0, September 2001. Available at http://eospso.gsfc.nasa.gov/
3. Caspar, C., and K. Chance, GOME Wavelength
Calibration Using Solar and Atmospheric Spectra, Proc. Third ERS Symposium on Space at the Service of our Environment, Ed. T.-D. Guyenne and D. Danesy, European Space Agency publication SP-414, ISBN 92-9092-656-2, 1997.
4. Chance, K., and R.J.D. Spurr, Ring Effect Studies:
Rayleigh Scattering, Including Molecular Parameters for Rotational Raman Scattering, and the Fraunhofer Spectrum, Appl. Opt. 36, 5224-5230, 1997.
5. Chance, K., T.P. Kurosu, and C.E. Sioris,
Undersampling Correction for Array-Detector Based Satellite Spectrometers, Appl. Opt. 44, 1296-1304, 2005.
6. Martin, R.V., K. Chance, D.J. Jacob, T.P. Kurosu,
R.J.D. Spurr, E. Bucsela, J.F. Gleason, P.I. Palmer, I. Bey, A.M. Fiore, Q. Li, R.M. Yantosca, and R.B.A. Koelemeijer, An Improved Retrieval of
Tropospheric Nitrogen Dioxide from GOME, J. Geophys. Res. 107, 4437, doi:10.1029/2001JD0010127, 2002.
7. Platt, U., Differential Optical Absorption
Spectroscopy (DOAS), in: Air Monitoring by Spectroscopic Techniques, Ed. M.W. Sigrist, Chem. Anal. Ser. 127 (John Wiley, New York, 1994), pp. 27-84.
8. Palmer, P.I., D.J. Jacob, K. Chance, R.V. Martin,
R.J.D. Spurr, T.P. Kurosu, I. Bey, R. Yantosca, A. Fiore, and Q. Li, Air Mass Factor Formulation for Spectroscopic Measurements from Satellites: Application to Formaldehyde Retrievals from the Global Ozone Monitoring Experiment, J. Geophys. Res. 106, 14,539-14,550, 2001.
9. Wilmouth, D.M., T.F. Hanisco, N.M. Donahue, and
J.G. Anderson, Fourier Transform Ultraviolet Spectroscopy of the A 2Π3/2 ← X 2Π3/2 Transition of BrO, J. Phys. Chem A 103, 8935-8945, 1999.
10. Tas, E., M. Peleg, V. Matveev, J. Zingler, and M.
Luria, Frequency and Extent of Bromine Oxide Formation Over the Dead Sea J. Geophys. Res. 110, doi:10.1029/2004JD005665, 2005.
11. Fu, T.-M., D.J. Jacob, P.I. Palmer, K. Chance, Y.X.
Wang, B. Barletta, D.R. Blake, J.C. Stanton, and M.J. Pilling, Space-Based Formaldehyde Measurements as Constraints on Volatile Organic Compound Emissions in East and South Asia, and Implications for Ozone, J. Geophys. Res. 112, D06312, doi:10.1029/2006JD007853, 2007.
12. Palmer, P.I., M.P. Barkley, T.P. Kurosu, A.C.
Lewis, J.E. Saxton, K. Chance, and L.V. Gatti, Interpreting Satellite Column Observations of Formaldehyde over Tropical South America, Phil. Trans. R. Soc. A., in press, 2007.
13. Cantrell, C.A., J.A. Davidson, A.H. McDonald,
R.E. Shetter, and J.G. Calvert, Temperature-Dependent Formaldehyde Cross Sections in the Near-Ultraviolet Spectral Region, J. Phys. Chem. 94, 3902-3908, 1990.
14. Volkamer, R., L.T. Molina, M.J. Molina, T.
Shirley, and W.H. Brune, DOAS Measurement of Glyoxal as an Indicator for Fast VOC Chemistry in Urban Air, Geophys. Res. Lett. 32, L08806, doi:10.1029/2005GL022616, 2005.
15. Wittrock, F., A. Richter, H. Oetjen, J. P. Burrows,
M. Kanakidou, S. Myriokefalitakis, R. Volkamer, S. Beirle, U. Platt, and T. Wagner, Simultaneous
Global Observations of Glyoxal and Formaldehyde from Space, Geophys. Res. Lett. 33, L16804, doi:10.1029/2006GL026310, 2006.
15. Volkamer, R., P. Spietz, J.P. Burrows, and U. Platt.
High-Resolution Absorption Cross-Section of Glyoxal in the UV/Vis and IR Spectral Ranges, J. Photochem. Photobiol. A: Chem 175, 35-46, 2005.


![OMI Measurements of BrO, HCHO, and CHO-CHO...CHOCHO (glyoxal) is a volatile organic compound (VOC) recently observed in Mexico city [Volkamer et al., 2005]. It is produced from oxidation](https://img.pdfslide.us/doc/110x75/612ec2081ecc5158694303ec/omi-measurements-of-bro-hcho-and-cho-cho-chocho-glyoxal-is-a-volatile-organic.jpg)