Embed Size (px)
Citation preview

Measurements of Evaporation Kinetics of Pure Water and Salt Solutions
by
Walter Stanley Drisdell
A dissertation in partial satisfaction of the
requirements for the degree of
Doctor of Philosophy
in
Chemistry
in the
GRADUATE DIVISION
of the
UNIVERSITY OF CALIFORNIA, BERKELEY
Committee in Charge: Professor Ronald C. Cohen, Chair
Professor Richard J. Saykally Professor Robert M. Glaeser
Spring 2010

Measurements of Evaporation Kinetics of Pure Water and Salt Solutions
Copyright 2010 by
Walter Stanley Drisdell

1
Abstract
Measurements of Evaporation Kinetics of Pure Water and Salt Solutions by
Walter Stanley Drisdell
Doctor of Philosophy in Chemistry University of California, Berkeley
Professor Ronald C. Cohen, Chair
The kinetics of vapor-liquid exchange in water are poorly understood, yet may be critically important in predicting changes in Earth’s climate and understanding the water isotope record preserved in ice cores . In this thesis we present measurements of the kinetics of water evaporation. In Chapter 1 we review recent work on the subject, including our own liquid microjet technique which has higher precision than other methods. In Chapter 2 we extend our earlier measurements of the evaporation kinetics of H2O by studying pure D2O. We find that the evaporation coefficient, which can be thought of as the percentage of evaporation “attempts” which succeed, is identical for the two isotopomers. We interpret this result using a previously developed transition state theory (TST) model of evaporation, which predicts the respective evaporation coefficients to be equal due to competing energetic and entropic effects. In Chapter 3, we examine the evaporation kinetics of H2O evaporating from 3M ammonium sulfate solution. Ammonium sulfate was selected as it is the largest inorganic component of anthropogenic aerosol in the atmosphere. Again we find that the evaporation coefficient is unchanged relative to pure water. This is consistent with theoretical and experimental studies suggesting that both the ammonium ion and sulfate ion are repelled from the air-water interface, implying that these ions will not directly interact with evaporating water molecules. This result also suggests that inorganic components of atmospheric aerosol are unlikely to significantly affect evaporation kinetics. In Chapter 4 we examine the evaporation kinetics of H2O from 4M sodium perchlorate solution. Perchlorate was selected as it is expected to be strongly enhanced in concentration at the air-water interface, and therefore more likely to directly influence the evaporation process. We find that the evaporation coefficient for this system is ~25% smaller than that for pure H2O, indicating that the perchlorate ions do indeed impede evaporation. Given experimental evidence for the perchlorate ion slowing the rotational motions of H2O molecules in its first solvation shell, and our TST predictions indicating that the evaporation kinetics of water are highly sensitive to the hindered rotational motions of surface water molecules, we suggest that perchlorate ions at the interface are inhibiting the evaporation of H2O molecules with which they are in direct contact. This result suggests that other surface-enhanced ions may also affect the evaporation kinetics through direct interactions with evaporating molecules and opens several interesting new avenues of study, which are discussed in Chapter 5.

i
For everyone who has ever had to pull a microjet.

ii
Contents Chapter 1 – Introduction………………….……………………………………………………….... 1 Chapter 2 – Determination of the Evaporation Coefficient of D2O………………………………... 10
2-1 Introduction…………………………………………………………………………… 10 2-2 Method………………………………………………………………………………... 11 2-3 Results and Analysis………………………………………………………………….. 12 2-4 Discussion..…………………………………………………………………………… 15 2-5 Conclusions…………………………………………………………………………… 17
Chapter 3 – On the Evaporation of Ammonium Sulfate Solution…………………………..…….. 26
3-1 Introduction…………………………………………………………………………… 26 3-2 Results………………………………………………………………………………… 28 3-3 Discussion…………………………………………………………………………….. 29 3-4 Materials and Methods………………………………………………………………... 30
Chapter 4 – The Effect of Surface Active Ions On the Rate of Water Evaporation……………….. 39
4-1 Introduction…………………………………………………………………………… 39 4-2 Experimental………………………………………………………………………….. 41 4-3 Results………………………………………………………………………………… 43 4-4 Discussion…………………………………………………………………………….. 44 4-5 Conclusions…………………………………………………………………………… 45
Chapter 5 – Future Work………………….……………………………………………….. 51

iii
Acknowledgements
First and foremost I would like to thank my advisors, Ron and Rich, for their invaluable advice and assistance during my graduate career. They always showed great insight when things weren’t working, and kept me thinking about the big picture when I started getting bogged down in details. None of this work would have been possible without their guidance. I would also like to thank Chris Cappa and Jared Smith for being excellent mentors in my early years as a graduate student. They were always happy to help me out with even the most trivial of problems, and didn’t mind when I bothered them for advice long after they had graduated. All of the members of the Cohen Group and Saykally group were great to work with, and didn’t mind if I stopped by to bounce ideas off them or to look for another perspective on problems. And of course I would like to thank my friends, especially Craig Schwartz, Keith Lawler, Aaron Esser-Kahn, and Dan Kelly, for making graduate school much more entertaining, and my family for being incredibly supportive during my time at Berkeley. This work was supported by the Chemical Sciences Division, U.S. Department of Energy, and by the National Science Foundation.

1
Chapter 1 – Introduction
Evaporation and condensation rates and mechanisms are of current scientific
interest, being critical in contexts ranging from cooling systems to combustion engines to atmospheric physics (1-3). The case of water is of especial note, as it is the most abundant liquid on earth and is essential for life as we know it (4). The liquid-vapor exchange of water controls the hydrologic cycle and is therefore a vital process in ecosystems, and the high enthalpy of the phase transfer has significant impact on the thermal balance across the globe (3). The process itself is also of fundamental interest, as water exhibits many unusual properties including the fact that it forms a stable liquid at relatively high temperatures due to its hydrogen bonding network, a fact that is in contrast with other molecules of such low molecular weight (5). Both liquid and gaseous water play critical roles in climate. The single largest unknown factor in calculations of the global radiative balance is the effect of atmospheric aerosol particles and clouds, and their mutual interactions (6). Aerosol, while typically comprising a solid core, takes up liquid water in the atmosphere and scatters incoming solar radiation in a manner highly dependent on the particle size (7-12). Additionally, aerosol can serve as cloud condensation nuclei (CCN), acting as seeds on which liquid cloud droplets form from atmospheric water vapor. Thus, atmospheric aerosol, which is a mixture of directly emitted particles and particles that form from oxidation and condensation of gases, directly impacts global temperatures through light scattering and also indirectly through effects on the particle number and particle size distribution of clouds (13-15). Atmospheric aerosols also exhibit significant spatial variation across the globe. A thorough understanding of the liquid-vapor exchange kinetics and thermodynamics of water on particles of various size and composition is essential to predicting the formation and temporal size evolution of atmospheric aerosol particles, as well as their interactions with clouds and subsequent climate effects. Unfortunately, the kinetics of evaporation and condensation of water have proven very difficult to measure. In such studies, a value called the evaporation coefficient (typically labeled eγ ), condensation coefficient (typically labeled cγ or cα ) or mass
accommodation coefficient (typically labeled mα , sometimes simply called the
accommodation coefficient) is often reported. These coefficients are identical in value but are named differently depending on whether the experiment is examining evaporation or condensation (also called mass accommodation). The coefficients have values between zero and one, and represent the fraction of the maximum possible rate, determined from gas kinetic theory, at which the process proceeds. For condensation, or based on microscopic reversibility, evaporation, this maximum rate is equal to the collision rate of the gas against the liquid surface; values of eγ less than unity imply that
not all vapor collisions with the liquid surface result in condensation. The evaporation coefficient is discussed in more detail in Chapters 2-4.
While observations and calculations of evaporation rates of low volatility monatomic liquids such as mercury or argon are relatively straightforward, with experimental studies converging to values of eγ near unity (16-18), studies of polyatomic
liquids are more difficult. Polyatomic liquids pose difficulties because strong

2
intermolecular interactions like the hydrogen bonding in water can occur, and the orientation of liquid molecules can be important. Much attention has been given to water, although other liquids such as methanol have also been studied. For example, Maerefat et al. examined methanol condensation in a shock tube, finding a condensation coefficient between 0.13 and 0.17 (19). The authors later used the same technique to determine a condensation coefficient of 0.35 for water and 0.64 for carbon tetrachloride (20). More recent shock tube measurements on methanol, however, yield higher values when employing conditions closer to equilibrium; Fujikawa et al. found a value of unity near equilibrium and Mikami et al. found a value between 0.8 and 0.9 (21, 22). Theoretical studies of methanol condensation have typically produced condensation coefficients of unity (23).
For water, measurements of evaporation kinetics date back to the 1930s, with reported evaporation coefficients spanning the range of 0.001 to 1 (24, 25). The sensitivity of modeled cloud droplet formation and growth rates to the value of this coefficient has been examined in several studies, revealing high sensitivity to values smaller than 0.1 but relative insensitivity to larger values (26-29). Low values of the coefficient would cause higher supersaturations of water vapor leading to a larger number of aerosol particles acting as CCN, forming stable clouds with larger numbers of small droplets than otherwise with a consequent increase in cloud brightness and lower likelihood of precipitation (28). In light of this, it is of special interest to accurately determine the evaporation coefficient for H2O mixtures characteristic of cloud droplets and CCN. Recent results have narrowed the range for pure H2O to ~0.1 - 1 (30), but different methods still give different answers. Many early measurements involving static surfaces of water have been criticized due to their sensitivity to the buildup of surface contaminants, which could affect evaporation rates (24, 25). Experimental methods and results through 2006 are reviewed in detail by Davidovits et al (30). Studies since 1997 generally fall into two groups; those resulting in relatively small evaporation coefficients of ca. 0.1 – 0.3, and those resulting in coefficients closer to unity. Notable studies in the first category include a study by Shaw and Lamb, in which levitated liquid droplets in subsaturated vapor were observed using light scattering techniques (31). The rate of nucleation of ice in the droplets was used as a proxy for the temperature, which in turn was used to derive a condensation coefficient between 0.04 and 0.1. Li et al. examined the condensation of isotopically labeled H2
17O onto a liquid H2O in a droplet train flow reactor (32). Liquid droplets were exposed to the isotopically labeled vapor for 7-20 ms, and depletion of the isotopically labeled species due to condensation into the liquid, as well as the droplet size change, was measured. An accommodation coefficient with an inverse temperature dependence was found, increasing from 0.17 at 280 K to 0.32 at 258 K. A new study by Jakubczyk et al., in which the evaporation of a levitated droplet of water in nitrogen gas was observed via Mie scattering, also yielded small values for the evaporation coefficient, between 0.054 and 0.12 (33). The same group later published results for evaporation in air, and additionally amended their previously published results for evaporation in nitrogen through improved data processing and better theoretical fitting (34). The values for air and nitrogen were found to be consistent, with the evaporation coefficient decreasing from ~0.18 to ~0.13 as the temperature increased from 273.1 K to 293.1 K, showing good agreement with the work of the Li et al.

3
In contrast to these results, Winkler et al. studied droplet growth in an expansion chamber (35). Silver nanoparticles were used as seeds and the formation and growth of liquid water aerosol was monitored via Mie scattering, resulting in an accommodation coefficient between 0.4 and 1. The authors collaboration later published an update to this experiment, in which the data are presented again along with more detailed error analysis and a more detailed description of the data analysis procedures (36). The study reinforces the high accommodation coefficients deduced previously, and argues that the true value is likely unity. In addition, the authors point out that predictions of cloud behavior should not be affected by accommodation coefficients less than 0.5, and therefore the accommodation coefficient need not be considered in such modeling efforts. Kobayashi et al. studied water condensation on the walls of a shock tube, using numerical simulations to deduce a condensation coefficient between 0.84 and 0.71 (37).
Experimental efforts focusing on uptake of liquid water by aqueous solutions or solid surfaces have shown similar discrepancies. A recent experimental work by Fukuta and Myers used a horizontal-flow thermal diffusion chamber to examine the growth rate of liquid water droplets on solid NaCl and (NH4)2SO4 cores (with final concentrations of ca. 0.05 M) via Mie scattering (38). In this work, it was noted that the moving vapor-liquid boundary in space (“moving boundary effect”) can significantly affect the results if not properly accounted for. Fukuta and Myers found the mass accommodation coefficient to be 0.043 ± 0.016 when taking into account the moving boundary effect. In contrast, Voigtlander et al. performed experiments of droplet growth on solid NaCl particles (with final salt concentrations of ca. 0.003 M) in a cloud chamber, coupled with CFD to determine growth rates consistent with 3.0>mα (39). Coefficients less than
unity are in agreement with molecular beam scattering experiments performed by Nathanson and coworkers, in which collisions of gas-phase D2O on a surface of concentrated H2SO4 solution were examined using time-of flight mass spectrometry (TOF-MS) (40, 41). The results suggested that impinging D2O molecules could scatter impulsively from the liquid surface if impinging at a glancing or single collision angle, but impinging molecules that featured multiple collisions at the interface would become incorporated into the liquid with a high probability, rather than desorb from the surface.
There has been some debate as to the cause of the discrepancy between the experiments resulting in high coefficients and the experiments resulting in low coefficients. Experiments in both groups are run at a range of temperatures and timescales, with no clear systematic features to explain the discrepancy. Explanations have therefore focused on the specific details of individual experiments. Morita et al. examined the droplet train measurements described by Li et al. with computational fluid dynamics (CFD), positing that the effects of gas-phase diffusion were underestimated in that study and that the reported value of 0.2 for the accommodation coefficient at 273 K is actually consistent with values between 0.2 and 1 (42). This claim was later disputed (43, 44). Another attempt to resolve the discrepancy between the results of Li et al. and the results of Winkler et al. was made in a joint publication by both groups, in which it was argued that the Winkler et al. measurements may have observed higher condensation rates due to the supersaturated vapor conditions under which the experiments were performed (45). Vapor molecules which had impinged upon the surface, but not fully condensed, could be stimulated to condense by the large incoming flux of vapor. While this idea could not be rigorously tested, the authors noted that in both studies, the

4
accommodation coefficient was found to be larger than 0.1, implying that kinetic effects would not alter cloud droplet formation and growth in the clean atmosphere, but in polluted air, large concentrations of impurities could lower the effective coefficient and impose kinetic limits. Winkler et al. later argued that a value of unity should be used in cloud models, as these typically use the same transition regime condensation theory used in the their experiment (46). Zientara et al. also made arguments about the discrepancies resulting from different studies, suggesting that sharp changes in temperature between the liquid surface and the vapor may not be accurately accounted for in other experiments (34). They also invoked the “moving boundary effect” proposed by Fukuta and Meyers (38) as a source of error if not accounted for in other experiments.
Molecular scale theoretical studies of water evaporation and condensation have necessarily been more recent, due to the considerable computational power required to simulate such phenomena. Molecular dynamics (MD) studies of both condensation and evaporation have now been performed, but most studies address condensation, as there are typically only a small number of evaporation events observed on computational timescales (23, 47). MD studies of the uptake of gas-phase species, including water vapor, onto liquid water through 2006 have been reviewed by Garrett et al. (48). Most of these studies compute accommodation coefficients near unity (42, 49, 50), although smaller values have been reported (47). Interestingly, MD studies of the uptake of other gas-phase species onto liquid water also typically find uptake coefficients near unity, whereas experimental studies of these uptake processes typically produce much smaller values (30, 48). This has caused some researchers to question the suitability of these MD calculations for uptake calculations, on the grounds that uptake kinetics can be affected by processes occurring on larger spatial and temporal scales than are available in MD models (30). Despite these concerns, many researchers still employ MD to examine condensation of molecular liquids. Recently, Morita and Garrett performed MD studies of methanol condensation onto water-methanol mixtures, and argue that correct characterization of the interface, including chemical composition and impurities, is critical in determining accurate mass accommodation coefficients (51). Chakraborty and Zachariah performed MD studies of mass accommodation occurring on a 4 nm aerosol droplet coated with a fatty acid surfactant layer, finding values of ~0.11 – 0.16, implying a slowing of uptake kinetics due to the surfactant (52). The coefficient for condensation onto pure water, however, was not explicitly calculated. They also examined probabilities of accommodation for incoming water clusters, finding the value increasing to unity for clusters of ten molecules or more. Bahadur and Russell performed MD calculations of deliquescence of NaCl particles, revealing low uptake coefficients of ~0.1 for 11 nm particles, increasing to 0.64 for 2 nm particles, but not enough liquid water formed on the particles within the simulation time to determine a value for the accommodation coefficient of water on water (53). By examining the liquid water reservoirs used in the simulations to maintain constant relative humidity (RH), the authors were able to make a rough estimate of the evaporation coefficient, finding a value of ~0.3 for pure water, increasing with increasing concentration of NaCl, to ~0.57 at 6M (54). Holyst and Litniewski performed MD studies of water evaporation from a liquid film, but did not explicitly consider the evaporation coefficient, instead offering an alternative to the usual kinetic gas theory formulation for the flux; additionally the different definitions of temperature in the study do not account for the evaporative
5
cooling of the liquid surface (55). Unfortunately, MD studies to date have not provided much in the way of mechanistic insight into the evaporation and condensation processes for liquid water, with little agreement as to molecular details of the uptake process, even among studies which predict an evaporation coefficient of unity (48).
Given the debate over the experimental and theoretical treatments of vapor-liquid exchange kinetics of water and water solutions, in our laboratory, we endeavored to design an experiment in which analysis would be significantly simplified. Our goal was to examine evaporation without accompanying condensation by using liquid microjets in vacuum. Relative to most of the experiments above (with the notable exception of Nathanson et al.) the removal of the condensation rate as a variable represents a dramatic simplification. The details of the experiment are described in Chapters 2-4. In our first study, we examined mixtures of H2O and D2O evaporating into high vacuum, and monitored the isotopic composition of the evaporate with a mass spectrometer (56). The changes in isotope ratios in the evaporate indicated that the evaporation coefficient was necessarily smaller than unity, but a definite value could not be determined. To explain our results, we performed a transition-state theory (TST) study of evaporation for isotopic mixtures (57). The TST model was limited in its predictive power due to the difficulty in determining precise frequencies for intermolecular motions at the liquid water surface from spectroscopic studies, so detailed information about the transition state for the evaporation process could not be obtained. We were able, however, to determine that the results were very sensitive to the frequencies of the hindered translational and librational motions of the liquid water molecules at the interface and relatively insensitive to other motions. This result suggested that the evaporation mechanism likely involves multiple molecules moving in a concerted manner.
We then designed an experiment to examine the absolute evaporation rate of liquid water using Raman thermometry. By incorporating a piezoelectric ceramic into our jet apparatus, we were able to run our liquid microjet as a vibrating orifice aerosol generator (VOAG), which generates a uniform-sized droplet train by coupling vibrations to the capillary waves in the liquid jet (58, 59). The uniform-size droplets cool due to evaporation in vacuum, and by monitoring the temperature via Raman thermometry, we are able to extract the evaporation coefficient with a simple evaporative cooling model that explicitly accounts for the colder droplet surface temperature and subsequent evolution of thermal gradients within the droplet. With this technique, we determined the evaporation coefficient of liquid H2O to be 0.62 ± 0.03 (95% confidence interval) (60). In this thesis, we present extensions of this study by applying the experimental technique to new systems. In Chapter 2, we examine the evaporation kinetics of pure D2O and compare it to our previous results for H2O. In Chapter 3, we examine the evaporation kinetics of liquid water evaporating from 3M ammonium sulfate solution and discuss the implications for atmospheric sulfate aerosol. In Chapter 4, we examine the evaporation kinetics of liquid water from 4M sodium perchlorate solution, and discuss the kinetic changes associated with the presence of surface-enhanced ions in the liquid.

6
References: 1. Haaf S, Henrici H (2002) in Ullmann's Encyclopedia of Industrial Chemistry
(Wiley-VCH, Weinheim). 2. Heywood J (1988) Internal Combustion Engine Fundamentals (McGraw-Hill
Science/Engineering/Math, New york). 3. Seinfeld J H, Pandis S N (1998) Atmospheric Chemistry and Physics (John Wiley
& Sons, Inc., New York). 4. (1972) The Physics and Physical Chemistry of Water (Plenium Press, New York). 5. Eisenberg D, Kauzmann W (1969) The Structure and Properties of Water
(Oxford University Press, New York). 6. Forster P, V. Ramaswamy, P. Artaxo, T. Berntsen, R. Betts, D.W. Fahey, J.
Haywood, J. Lean, D.C. Lowe, G. Myhre, J. Nganga, R. Prinn, G. Raga M S a R V D (2007) in Climate Change 2007: The Physical Science Basis. Contribution of Working Group I to the Fourth Assessment Report of the Intergovernmental Panel on Climate Change, ed. Solomon, S., D. Qin, M. Manning, Z. Chen, M. Marquis, K.B. Averyt, M.Tignor and H.L. Miller (Cambridge University Press, Cambridge).
7. McMurry P H (2000) A review of atmospheric aerosol measurements. Atmospheric Environment 34: 1959-1999.
8. Smirnov A, et al. (2002) Optical properties of atmospheric aerosol in maritime environments. Journal Of The Atmospheric Sciences 59: 501-523.
9. Kanakidou M, et al. (2005) Organic aerosol and global climate modelling: a review. Atmospheric Chemistry And Physics 5: 1053-1123.
10. Freud E, et al. (2008) Robust relations between CCN and the vertical evolution of cloud drop size distribution in deep convective clouds. Atmospheric Chemistry And Physics 8: 1661-1675.
11. Sullivan R C, et al. (2009) Effect of chemical mixing state on the hygroscopicity and cloud nucleation properties of calcium mineral dust particles. Atmospheric Chemistry And Physics 9: 3303-3316.
12. Wex H, et al. (2009) Towards closing the gap between hygroscopic growth and activation for secondary organic aerosol: Part 1-Evidence from measurements. Atmospheric Chemistry And Physics 9: 3987-3997.
13. Lohmann U, Feichter J (2005) Global indirect aerosol effects: a review. Atmospheric Chemistry And Physics 5: 715-737.
14. Lohmann U, Quaas J, Kinne S, Feichter J (2007) Different approaches for constraining global climate models of the anthropogenic indirect aerosol effect. Bulletin Of The American Meteorological Society 88: 243-249.
15. Sun J M, Ariya P A (2006) Atmospheric organic and bio-aerosols as cloud condensation nuclei (CCN): A review. Atmospheric Environment 40: 795-820.
16. Knudsen M (1915) The maximum rate of vaporisation of mercury. Annalen Der Physik 47: 697-708.
17. Volmer M, Estermann I (1921) Vapourisation coefficient of solid and liquid mercury. Zeitschrift Fur Physik 7: 1-12.

7
18. Singhal N S (1972) Evaporation Of Mercury Into Vacuum Under Isothermal Conditions. Indian Journal Of Physics And Proceedings Of The Indian Association For The Cultivation Of Science 46: 499-507.
19. Maerefat M, et al. (1989) An Experimental-Study Of Non-Equilibrium Vapor Condensation In A Shock-Tube. Experiments In Fluids 7: 513-520.
20. Maerefat M, Akamatsu T, Fujikawa S (1990) Nonequilibrium Condensation Of Water And Carbontetrachloride Vapor In A Shock-Tube. Experiments In Fluids 9: 345-351.
21. Fujikawa S, et al. (2004) Molecular gas dynamics applied to phase change processes at a vapor-liquid interface: shock-tube experiment and MGD computation for methanol. Experiments In Fluids 37: 80-86.
22. Mikami S, et al. (2006) Molecular gas dynamics approaches to interfacial phenomena accompanied with condensation. Experimental Thermal And Fluid Science 30: 795-800.
23. Ishiyama T, Yano T, Fujikawa S (2004) Molecular dynamics study of kinetic boundary condition at an interface between a polyatomic vapor and its condensed phase. Physics Of Fluids 16: 4713-4726.
24. Eames I W, Marr N J, Sabir H (1997) The evaporation coefficient of water: A review. International Journal Of Heat And Mass Transfer 40: 2963-2973.
25. Marek R, Straub J (2001) Analysis of the evaporation coefficient and the condensation coefficient of water. International Journal Of Heat And Mass Transfer 44: 39-53.
26. Kulmala M, et al. (1996) The effect of hygroscopicity on cloud droplet formation. Tellus Series B-Chemical And Physical Meteorology 48: 347-360.
27. Nenes A, et al. (2001) Kinetic limitations on cloud droplet formation and impact on cloud albedo. Tellus Series B-Chemical And Physical Meteorology 53: 133-149.
28. Rudolf R, et al. (2001) Experimental study of sticking probabilities for condensation of nitric acid - water vapor mixtures. Journal Of Aerosol Science 32: 913-932.
29. Yum S S, Hudson J G, Xie Y H (1998) Comparisons of cloud microphysics with cloud condensation nuclei spectra over the summertime Southern Ocean. Journal Of Geophysical Research-Atmospheres 103: 16625-16636.
30. Davidovits P, et al. (2006) Mass accommodation and chemical reactions at gas-liquid interfaces. Chemical Reviews 106: 1323-1354.
31. Shaw R A, Lamb D (1999) Experimental determination of the thermal accommodation and condensation coefficients of water. Journal Of Chemical Physics 111: 10659-10663.
32. Li Y Q, et al. (2001) Mass and thermal accommodation coefficients of H2O(g) on liquid water as a function of temperature. Journal Of Physical Chemistry A 105: 10627-10634.
33. Jakubczyk D, Zientara M, Kolwas K, Kolwas M (2007) Temperature dependence of evaporation coefficient for water measured in droplets in nitrogen under atmospheric pressure. Journal Of The Atmospheric Sciences 64: 996-1004.

8
34. Zientara M, Jakubczyk D, Kolwas K, Kolwas M (2008) Temperature Dependence of the Evaporation Coefficient of Water in Air and Nitrogen under Atmospheric Pressure: Study in Water Droplets. J. Phys. Chem. A 112: 5152-5158.
35. Winkler P M, et al. (2004) Mass and thermal accommodation during gas-liquid condensation of water. Physical Review Letters 93.
36. Winkler P M, et al. (2006) Condensation of water vapor: Experimental determination of mass and thermal accommodation coefficients. Journal Of Geophysical Research-Atmospheres 111.
37. Kobayashi K, et al. (2008) Condensation coefficient of water in a weak condensation state. Fluid Dynamics Research 40: 585-596.
38. Fukuta N, Myers M N (2007) Simultaneous measurement of condensation and thermal accommodation coefficients for cloud droplet growth in due consideration of a new moving surface-boundary effect. Journal Of The Atmospheric Sciences 64: 955-968.
39. Voigtlander J, et al. (2007) Mass Accomodation Coefficient of Water: A Combined Computational Fluid Dynamics and Experimental Analysis. Journal of Geophysical Research 112: D20208.
40. Govoni S T, Nathanson G M (1994) Exploring The Fate Of Water-Molecules Striking Concentrated Sulfuric-Acid - Scattering Versus Solvation. Journal Of The American Chemical Society 116: 779-780.
41. Nathanson G M (2004) Molecular beam studies of gas-liquid interfaces. Annual Review Of Physical Chemistry 55: 231-255.
42. Morita A, et al. (2004) Mass accommodation coefficient of water: Molecular dynamics simulation and revised analysis of droplet train/flow reactor experiment. Journal Of Physical Chemistry B 108: 9111-9120.
43. Davidovits P, et al. (2005) Comment on "Mass accommodation coefficient of water: Molecular dynamics simulation and revised analysis of droplet train/flow reactor experiment". Journal Of Physical Chemistry B 109: 14742-14746.
44. Morita A, Sugiyama M, Koda S, Hanson D R (2005) Reply to "Comment on 'Mass accommodation ccefficient of water: Molecular dynamics simulation and revised analysis of droplet train/flow reactor experiment"'. Journal Of Physical Chemistry B 109: 14747-14749.
45. Davidovits P, et al. (2004) Mass accommodation coefficient of water vapor on liquid water. Geophysical Research Letters 31.
46. Laaksonen A, et al. (2005) Commentary on cloud modelling and the mass accommodation coefficient of water. Atmospheric Chemistry And Physics 5: 461-464.
47. Yang T H, Pan C (2005) Molecular dynamics simulation of a thin water layer evaporation and evaporation coefficient. International Journal Of Heat And Mass Transfer 48: 3516-3526.
48. Garrett B C, Schenter G K, Morita A (2006) Molecular Simulations of the Transport of Molecules across the Liquid/Vapor Interface of Water. Chem. Rev. 106: 1355-1374.
49. Vieceli J, Roeselova M, Tobias D J (2004) Accommodation coefficients for water vapor at the air/water interface. Chemical Physics Letters 393: 249-255.

9
50. Vieceli J, et al. (2005) Molecular dynamics simulations of atmospheric oxidants at the air-water interface: Solvation and accommodation of OH and O-3. Journal Of Physical Chemistry B 109: 15876-15892.
51. Morita A, Garrett B C (2008) Molecular theory of mass transfer kinetics and dynamics at gas-water interface. Fluid Dynamics Research 40: 459-473.
52. Chakraborty P, Zachariah M R (2008) Sticking Coefficient and Processing of Water Vapor on Organic-Coated Nanoaerosols. J. Phys. Chem. A 112: 966-972.
53. Bahadur R, Russell L M (2008) Water uptake coefficients and deliquescence of NaCl nanoparticles at atmospheric relative humidities from molecular dynamics simulations. Journal Of Chemical Physics 129.
54. Russell L M, Bahadur R (2008) Personal communication. 55. Holyst R, Litniewski M (2009) Evaporation into vacuum: Mass flux from
momentum flux and the Hertz-Knudsen relation revisited. Journal Of Chemical Physics 130.
56. Cappa C D, et al. (2005) Isotope fractionation of water during evaporation without condensation. Journal Of Physical Chemistry B 109: 24391-24400.
57. Cappa C D, et al. (2007) Interpreting the H/D isotope fractionation of liquid water during evaporation without condensation. Journal Of Physical Chemistry C 111: 7011-7020.
58. Berglund R N, Liu B Y H (1973) Generation Of Monodisperse Aerosol Standards. Environmental Science & Technology 7: 147-153.
59. Schneider J M, Hendricks C D (1964) Source Of Uniform-Sized Liquid Droplets. Review Of Scientific Instruments 35: 1349-&.
60. Smith J D, et al. (2006) Raman thermometry measurements of free evaporation from liquid water droplets. Journal Of The American Chemical Society 128: 12892-12898.

10
Chapter 2 – Determination of the Evaporation Coefficient of D2O 2-1 Introduction:
The evaporation and condensation rates of liquid water are of fundamental
importance to many chemical, biological, and atmospheric processes. In particular, the formation and growth rates of cloud and aerosol particles are, in principle, sensitive to both kinetic and thermodynamic variables (1). Clouds and aerosols have a cooling effect on the earth’s atmosphere due to scattering of solar radiation, although some aerosols (black carbon) have a warming effect (2). Current cloud models vary widely in their predictions for the radiative effects of anthropogenic emissions that affect the number and composition of particles on which cloud droplets condense (CCN) (2-5). This variation is in part due to differing values for water evaporation and condensation kinetics and their relation to particle growth rates in these models (3). Direct measurements of the microscopic rates of evaporation and condensation of pure water vary over three orders of magnitude, although recent measurements have narrowed the range to between 0.05 – 1 times the gas kinetic limit (6-8). Some of the variation in older literature is likely due to impurities in or on the surface of the water samples used in the experiments; we note this fact hints that impurities will be important determinants of evaporation and condensation rates in mixed systems, a notion supported by field measurements of droplet growth rates (9, 10). It is generally accepted that condensation and evaporation occurring faster than 10% of the gas kinetic limit results in thermodynamic control over droplet growth while slower rates result in kinetic control over these growth rates (3, 11).
The maximum condensation rate of a gas is generally expressed via the Hertz-Knudsen equation, derived from gas kinetic theory (6),
mkT
p
cJπ2max, = , (1)
where p is the vapor pressure above the liquid surface, m is the molecular mass, k is Boltzmann’s constant, and T is the temperature. At equilibrium, the evaporation and condensation rates are equal; therefore the maximum evaporation rate can be expressed as
mkT
pec
satJJπ2max.max, == , (2)
where psat is the saturation vapor pressure. Since the activity of the pure liquid is unity, this expression for the evaporation rate holds at all vapor pressures. However, not all substances evaporate at the maximum rate (6, 12). Deviations from the maximum rate are treated by introducing the evaporation coefficient (γe) and the condensation coefficient, alternatively referred to as the mass accommodation coefficient (αm):
mkT
peeobse
sateJJπ
γγ2max.. == (3)
mkT
pcmobsc
mJJπ
αα2max.. == (4)

11
The evaporation and mass accommodation coefficients, which have values between zero and one, must be equal due to detailed balance at equilibrium. The equality holds for non-equilibrium systems as long as the velocity distribution in the gas phase does not deviate significantly from a Boltzmann distribution, because a Boltzmann distribution is assumed in the derivation of Eq. (1). Indeed, theoretical treatments of condensation have shown little sensitivity to gas phase speeds selected from the Boltzmann distribution at room temperature, although the condensation probability lowers for very high speeds (~1000 m/s) (13).
In addition to insuring the absence of impurities, measuring γe for H2O is challenging because the high vapor pressure makes it difficult to observe evaporation or condensation in isolation without significant contributions from the opposing term. In addition, knowledge of the liquid surface temperature is required, and evaporation results in cooling of the surface by as much as 3-4 K relative to the bulk (14).
Our own experiments have made use of liquid jets and droplet streams with high vacuum (10-4 torr) maintained around the fluid, such that evaporation occurs with negligible accompanying condensation. This greatly simplifies the interpretation as compared with many other recent experiments. The liquid jets and droplets also provide a renewing surface, minimizing contamination issues. Measurements of isotopic ratios in evaporation between 264 and 295 K showed that γe < 1 and that it varied with the H/D ratio in the liquid (15). Using Raman thermometry we derived a precise value of γe from the temperature change associated evaporation of pure H2O, yielding a value of 0.62 ± 0.09 over a temperature range of 245 – 295 K (16). We interpreted the results of our prior experiments using a transition-state theory (TST) model of liquid water evaporation (17). The calculations indicated that the evaporation rate is primarily influenced by the intermolecular hindered translational and librational motions of molecules at the liquid surface.
Here we describe the extension of our previous studies to droplet train measurements of γe of pure D2O. These measurements serve as a further test of the microscopic theory of evaporation and of the reproducibility and precision of the methodology, providing a firm basis for future studies of the evaporation from mixtures of water with salts, oils or surfactants. 2-2 Method: Evaporation rates from liquid D2O in vacuum were determined by measuring the temperature change of evaporating droplets using Raman thermometry. The evaporation rate is deduced from the cooling rate and the well known heat of vaporization. The droplets were formed with a vibrating orifice aerosol generator (VOAG). The D2O used in this study was obtained from Cambridge Isotope Laboratories, with a stated purity of 99.9%. The Raman spectroscopy apparatus has been described in detail previously (16) and a schematic is given in Fig. 1. Briefly, a syringe pump (Teledyne ISCO Model 260D) is used to force the liquid through a fused silica orifice (2.5 – 4 µm radius) mounted on a piezoelectric ceramic. The silica orifice is generated by pulling 100 µm ID silica tubing to the desired size with a commercial CO2 laser micropipette puller. The piezo is driven with a 0-20 V square wave at 200 – 1000 kHz to generate a uniform

12
droplet train with a spread in radius of less than 0.1 µm (18). The radii of the droplets produced is calculated from the liquid flowrate and the oscillation frequency (16). The VOAG is mounted on a bellows attached to the top of a 7 cm cubical vacuum chamber pumped by a 110 liter/second turbomolecular pump. The VOAG as attached to an XYZ manipulator to allow positioning of the droplet stream. Pressures in the chamber during experiments were lower than 5 × 10⁻⁴ torr. At these pressures, heat transfer from the walls of the chamber to the droplets is negligible. Viewports on the chamber allow the introduction of the 514.5 nm line from an argon ion laser operating at ~250 mW or less, which is focused onto the droplet train. The laser power is sufficiently low to avoid heating the droplets or otherwise affecting their evaporation (18, 19). Raman scatter from the droplets is filtered and collected at 90 degrees through a fiber-optic cable and routed to a spectrometer with a liquid nitrogen cooled CCD camera. After the droplets leave the interaction volume, they enter a liquid nitrogen trap located ~ 50 cm from the nozzle. To ensure that the droplets are uniform in size, a photodiode is placed in the path of the laser, after it has crossed the droplet train. The photodiode signal and the modulation frequency are monitored with an oscilloscope. As a droplet passes through the laser beam, there is a dip in signal on the photodiode; the oscillation frequency is tuned until the signal is sinusoidal in nature, indicating the formation of uniform droplets as described above. The OD-stretching region of the Raman spectrum (2150-2800 cm-1) is used to determine the temperature of the droplets in a manner similar to that reported by Smith et al. (16). Calibration curves were collected using both the thermostated nozzle technique described by Smith et al., and by measuring the total Raman scatter from liquid D2O in a cuvette over a similar temperature range (0-50 °C). The cuvette method was found to be more consistent (< 2% deviation) compared to the jet method (~ 5% deviation) and has the additional advantage of requiring significantly smaller amounts of liquid. Calibrations taken using the cuvette method were used for the bulk of the data. Examples of the spectra used to generate the temperature calibrations are shown in Fig. 2a, and Fig. 2b shows one of the calibration curves. Measurements were taken as a function of distance from the VOAG nozzle, which we converted to the residence time in the vacuum using the velocity of the droplet train. This velocity is calculated from the liquid flowrate and the orifice size. As described previously, the orifice size is determined by measuring the liquid jet diameter immediately after the nozzle using Mie scattering with the VOAG turned off (15). The initial temperature of the droplets was determined by collecting the Raman spectrum of the droplet train in ambient air, where evaporative cooling is minimal (16). 2-3 Results and Analysis:
Measurements for eight different droplet sizes with radii in the range between 5.3
µm and 8.1 µm were performed. Data were collected as a function of residence time in the vacuum chamber for maximum times ranging from 435 µs to 1117 µs, with most around 600 µs. This corresponds to a temperature range from 295 K to as low as 255 K. That our measurements are taken in the free evaporation regime was verified by calculating the average number of collisions experienced by an evaporating molecule as it leaves the droplet surface and reaches an infinite distance:

13
∫∫ ∞∞
===00
),()(2
),(),(
0
02
200
20
r
coll
r
coll Tr
r
r
drrrnd
Tr
drTrN
λπ
λ , (5)
where r0 is the droplet radius, 10 )](2[),( −= rndTr collπλ is the mean free path of the
vapor, and colld is the collision diameter (2.6 × 10⁻¹⁰ m). For D2O, the vapor pressure
predicted at a distance of 1 mm from the nozzle, where the first data point is taken, is ~7.5 torr. This corresponds to a mean free path of ~ 12 µm; thus molecules evaporating from droplets with radii less than 12 µm experience less than one collision in the vapor phase on average and condensation may be neglected (16).
We model the observed cooling numerically in the same manner as in our study of H2O (16). We divide the droplet into concentric spherical shells, and considering evaporation from the outermost shell. Using Eq. (3), the cooling rate of the outermost shell is expressed as
sp
vapsate VC
H
mkT
pA
dt
dT
ρπγ
∆−=
2, (6)
where A is the surface area of the outermost shell (= 204 rπ ), psat is the satsuration vapor
pressure, m is the molecular mass, k is Boltzmann’s constant, T is the temperature of the outermost shell, vapH∆ is the enthalpy of vaporization (45.7 kJ/mol for D2O), Cp is the
specific heat capacity (4.704 kJ/kg*K for D2O), ,ρ is the density, and Vs is the volume of the outermost shell. This simplifies to
13
13
0
20
)(
3
2 ρπγ
rr
r
C
H
mkT
p
dt
dT
p
vapsate −
∆−= , (7)
where r0 and r1 are the outer and inner radii of the outermost shell of the droplet. The only tunable parameter is γe. Thermal diffusion between adjacent shells is modeled as
dr
dTA
dt
dQ κ−= , (8)
where κ is the thermal conductivity (0.595 W/m*K at 298 K for D2O), A is the surface area of the shell and dT/dr is the temperature difference between the two adjacent shells; we do not assume instantaneous thermal equilibrium. As the outermost shell evaporates, mass loss due to evaporation is taken into account and the droplet and all the shells are re-sized accordingly at each time step (10-10 s). The droplet radius typically decreases by ~5% over the duration of a measurement. The temperature gradient and the volume-averaged temperature of the entire droplet are calculated at each time step. As the entire droplet resides within the laser focal volume, we interpret the observed temperature as the volume-averaged temperature. We determine γe by fitting the observations to the model represented by Eq. (7). We have considered three variations on the form of γe, one where γe is a constant with temperature and two where γe is allowed to vary with temperature.
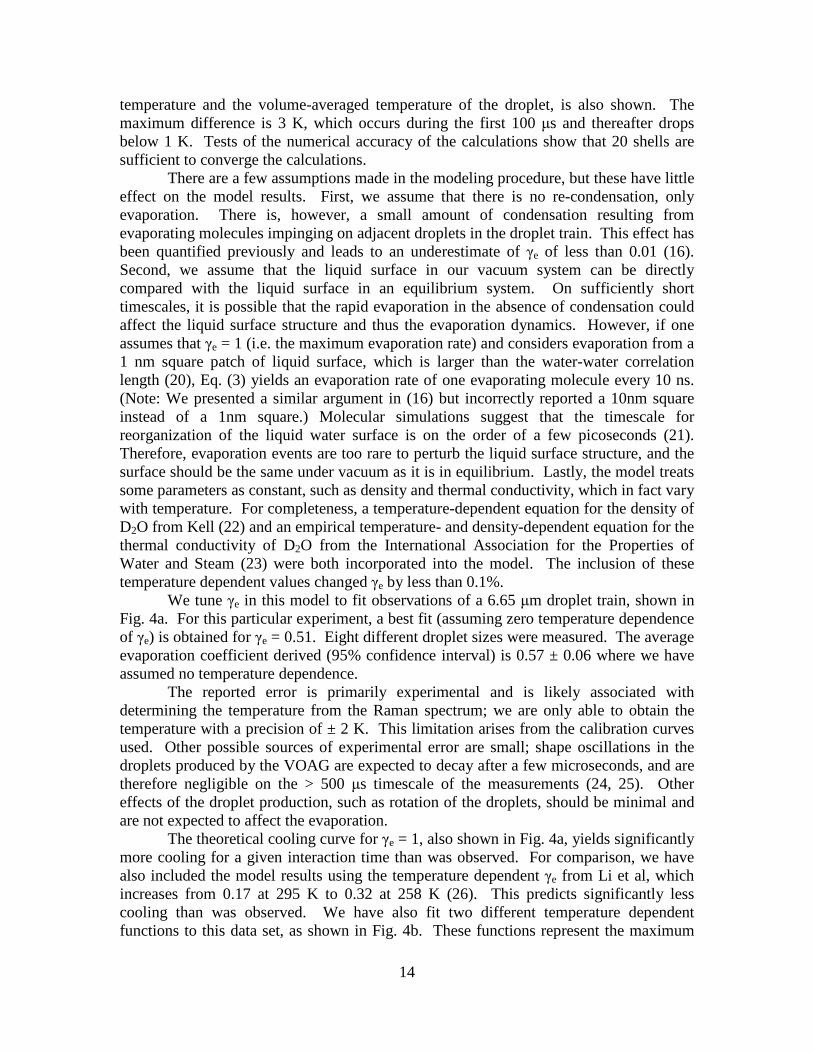
An example calculation is shown in Fig. 3. The figure shows the calculated temperatures for each of 20 spherical shells as a function of time, as well as the volume-averaged temperature for the entire 6.65 µm droplet. The magnitude of the surface-bulk temperature difference in the droplet, defined as the difference between the outer shell
14
temperature and the volume-averaged temperature of the droplet, is also shown. The maximum difference is 3 K, which occurs during the first 100 µs and thereafter drops below 1 K. Tests of the numerical accuracy of the calculations show that 20 shells are sufficient to converge the calculations.
There are a few assumptions made in the modeling procedure, but these have little effect on the model results. First, we assume that there is no re-condensation, only evaporation. There is, however, a small amount of condensation resulting from evaporating molecules impinging on adjacent droplets in the droplet train. This effect has been quantified previously and leads to an underestimate of γe of less than 0.01 (16). Second, we assume that the liquid surface in our vacuum system can be directly compared with the liquid surface in an equilibrium system. On sufficiently short timescales, it is possible that the rapid evaporation in the absence of condensation could affect the liquid surface structure and thus the evaporation dynamics. However, if one assumes that γe = 1 (i.e. the maximum evaporation rate) and considers evaporation from a 1 nm square patch of liquid surface, which is larger than the water-water correlation length (20), Eq. (3) yields an evaporation rate of one evaporating molecule every 10 ns. (Note: We presented a similar argument in (16) but incorrectly reported a 10nm square instead of a 1nm square.) Molecular simulations suggest that the timescale for reorganization of the liquid water surface is on the order of a few picoseconds (21). Therefore, evaporation events are too rare to perturb the liquid surface structure, and the surface should be the same under vacuum as it is in equilibrium. Lastly, the model treats some parameters as constant, such as density and thermal conductivity, which in fact vary with temperature. For completeness, a temperature-dependent equation for the density of D2O from Kell (22) and an empirical temperature- and density-dependent equation for the thermal conductivity of D2O from the International Association for the Properties of Water and Steam (23) were both incorporated into the model. The inclusion of these temperature dependent values changed γe by less than 0.1%.
We tune γe in this model to fit observations of a 6.65 µm droplet train, shown in Fig. 4a. For this particular experiment, a best fit (assuming zero temperature dependence of γe) is obtained for γe = 0.51. Eight different droplet sizes were measured. The average evaporation coefficient derived (95% confidence interval) is 0.57 ± 0.06 where we have assumed no temperature dependence.
The reported error is primarily experimental and is likely associated with determining the temperature from the Raman spectrum; we are only able to obtain the temperature with a precision of ± 2 K. This limitation arises from the calibration curves used. Other possible sources of experimental error are small; shape oscillations in the droplets produced by the VOAG are expected to decay after a few microseconds, and are therefore negligible on the > 500 µs timescale of the measurements (24, 25). Other effects of the droplet production, such as rotation of the droplets, should be minimal and are not expected to affect the evaporation.
The theoretical cooling curve for γe = 1, also shown in Fig. 4a, yields significantly more cooling for a given interaction time than was observed. For comparison, we have also included the model results using the temperature dependent γe from Li et al, which increases from 0.17 at 295 K to 0.32 at 258 K (26). This predicts significantly less cooling than was observed. We have also fit two different temperature dependent functions to this data set, as shown in Fig. 4b. These functions represent the maximum

15
positive and negative temperature dependences that are still consistent with the observations. First, we use the functional form of the temperature dependence described by Li et al., but adjusted to give a larger γe at lower temperature than that measured by Li et al. This yields results consistent with our observations if γe is equal to 0.4 at 295 K and to 0.6 at 258 K. Second, we assume an exponential temperature dependence for γe of the form )/exp( RTEae −= ργ , where ρ was constrained to be 1≤ . The maximum Ea for
this case that is still consistent with observations is 1.8 kJ/mol, corresponding to a γe of 0.48 at 295 K and 0.43 at 258 K. 2-4 Discussion:
The observed value of γe for D2O is smaller than unity. The value is nearly
identical to that obtained recently for H2O (0.62 ± 0.09) (16). The TST model study by Cappa et al. predicts that H2O and D2O would have similar values of γe, based on calculations of the absolute evaporation rates of the different isotopes as a function of deuterium mole fraction in the liquid (Fig. 5 of that study), although the relative evaporation rates of the pure liquids was not explicitly calculated (17). To determine whether an isotope effect is predicted, we calculated the ratio of γe for pure H2O to that for pure D2O using the following equation adapted from Cappa et al.:
kTEHs
Ds
D
HHe
De
De
He aeQ
Q
Q
Q
J
Jr /
*
*
max,
max,
,
, ∆−==γγ
γ , (9)
where Je,max is the maximum evaporation rate from Eq. (2), *Q and sQ are the partition
functions of the transition state and the liquid surface species, respectively, and aE∆ is the
difference in activation energies between the two isotopes (17). The sub- and superscripts H and D refer to H2O and D2O, respectively. By calculating the ratio rγ we avoid several assumptions associated with calculating the absolute evaporation rates of the isotopes, such as knowledge of the transition state area and the absolute magnitude of the activation energy (17). The observed ratio from experiment, rγ,exp, is 1.09 ± 0.18. The calculated ratio rγ from Eq. (9) was found to vary between 0.90 and 1.08 at 295 K, depending on the specific choices of *Q , sQ , and aE∆ given in Cappa et al. (17). The smallest isotope
effect (rγ = 1.02) was found using the values derived from the “scaled” surface frequencies. These intermolecular translational and librational frequencies of the liquid
surface species were scaled by a factor of 4/3 relative to the bulk frequencies to better approximate the looser binding at the surface (27). At 265 K, rγ varies between 0.84 and 0.99, with the scaled frequencies yielding rγ = 0.94. This difference implies a very weak temperature dependence to the relative values of γe for the two isotopes. We note that a value of rγ less than unity implies that D2O has a higher evaporation coefficient than H2O, but does not imply that it has a higher evaporation rate; the maximum theoretical rates for the two species are different according to Eq. (2). The small isotope effect is due to a competing effect between the partition function ratios in the exponential pre-factor (entropy) and the activation energy difference in the exponential. The results of our previous study of the evaporation of isotopic mixtures and the calculations by Cappa et al. suggests that these effects only balance each other for the pure liquids, and that γe for

16
H2O and D2O in different isotopic mixtures can differ by as much as a factor of 3 (15, 17). It is important to note that the hindered translational frequencies for D2O are taken to be smaller than those of H2O when comparing the pure solutions, as this plays an important role in determining rγ. The activation energy for D2O evaporation is predicted to be ~2 kJ/mol higher than that for H2O, which is approximately the difference expected from zero point energy effects. Therefore, this assessment remains valid if both H2O and D2O have no energetic barrier to evaporation and the kinetic limit results entirely from entropic effects; however, a small energetic barrier is certainly possible. Recent measurements by Ward and Stanga showed a small (~8 °C) temperature discontinuity between evaporating liquid H2O and the vapor (14). Assuming that the higher temperature in the vapor is due to an energetic barrier to evaporation, and using the specific heat capacity of the vapor (Cp = 37.47 J mol-1 K-1), the barrier size is predicted to be very small (~300 J/mol) for H2O. Our data provide a weak constraint on the size of the barrier. The analysis above suggested the energetic barrier is less than 1.8 kJ/mol for D2O. The apparent lack of a temperature dependence to γe observed in this study and that of Smith et al. (16) may appear to be in contrast to an earlier study by Cappa et al. (15) wherein a stronger temperature dependence to γe was suggested. As noted in that work, and discussed in a later publication (17), the prediction involved several assumptions and high uncertainty. However, the relative evaporation rates of the isotopic species in the mixtures measured in that study are expected to display a temperature dependence.
Our measurements of γe for D2O and H2O can be compared with other recent measurements. Our value of γe falls within the range of, but has much higher precision than, recent measurements by Winkler et al.(1, 28) and Voigtlander et al (29), both of which were condensation studies. Winkler et al. found γe to be between 0.8 – 1.0 for temperatures between 250 and 270 K and 0.4 – 1.0 for temperatures between 270 and 290 K, although values higher than 1 (up to 10 in the case of 290 K) were within error for these measurements. Values larger than unity are not physically meaningful. Voigtlander et al. found γe to be between 0.3 and 1 for uptake on NaCl particles. Li et al. determined that γe has an inverse temperature dependence, with γe increasing from 0.17 ± 0.03 at 285 K to 0.32 ± 0.04 at 258 K (26). Similarly, a group from the Polish Academy of Sciences (30, 31) observed γe to increase from 0.13 at 293.1 K to 0.18 at 273.1 K. It is important to note that in all of these studies, the γe values determined are higher than the 0.1 threshold below which cloud formation becomes kinetically controlled. While attempts have been made to reconcile some of these experiments (32) there is not yet a satisfactory explanation for the observed differences. A recent study by Fukuta and Myers (33) highlights the “moving boundary effect” which can occur during modeling of evaporation or condensation. They report that incorrectly accounting for the shifting liquid-vapor boundary as a droplet grows or shrinks can lead to errors in the calculated evaporation or condensation coefficients as large as several percent. In our case, the droplet radius shrinks by ~5% over the duration of a measurement, but the moving boundary effect is explicitly accounted for within the model by resizing the droplet at every timestep. Zientara et al. argue that even larger corrections may be necessary in many cases due to thermal effusion near the droplet surface (31). Many models of condensation and evaporation treat the vapor using the framework of diffusion,

17
but Zientara et al. argue that at distances below the mean free path of the vapor, a droplet must be modeled as evaporating and condensing through vacuum. In certain cases, while the droplet would be considered to be quasi-stationary in the diffusion framework, thermal effusion near the surface can significantly change the temperature of the surface of the droplet from what would be predicted by diffusion, dependent on the different timescales of various experiments (31). In our experiments, the vapor is negligible and our model explicitly accounts for the cooling of the surface of the droplets. Therefore such a temperature jump cannot explain the difference between our measured values and those of Li et al. and Zientara et al.
In a previous work (15) we discussed a possible source of discrepancy between our experiments and those of Li et al., claiming that our formulations of γe and αm are different, with γe ~ (1 - αm). We now recognize that this prior analysis was incorrect and resulted from equating two different rates in formulations of the evaporation and mass accommodation processes which are not equivalent. Reanalysis of the different formulations of γe and αm indicates that the formulations are equivalent, and consistent with the definitions in Eqs. (3) and (4) of the present manuscript.
Our reported value of γe = 0.57 for D2O provides support for our previous results for H2O, confirming that γe for pure H2O is not small enough to have a significant impact on formation rates of cloud droplets in the atmosphere (16). There are other effects, however, that could lower water uptake rates on ambient CCN, which are not pure H2O or D2O, such as the presence of concentrated solutes or surfactant coatings on the droplets. For example, the effects of dissolved salts on the vapor pressure of liquid water have been extensively studied (34-37), but the kinetic effects on the evaporation coefficient are unknown. It has been argued that surface active solutes can lower the evaporation rate considerably, possibly leading to large changes in γe (7). Many studies of the effect of surfactants on water evaporation indicate a dramatic lowering of the evaporation rate upon sufficient surface coverage by surfactant molecules (38-40). Additionally, recent molecular dynamics (MD) simulations of condensation onto an aerosol particle coated with organics show a significantly lowered condensation probability (13). Given that CCN are often composed of inorganic solutes as well as of organics which might partition to the surface, measurements of γe on these more complex mixtures will be important to improving microscopic models of cloud droplet growth rates, number and size. Indeed, a recent study sampling atmospheric aerosol from several different sites found that cloud droplet growth rates were often consistent with values of γe less than 0.1 (10), providing additional motivation for continued development of methods capable of precise determination of γe. 2-5 Conclusions:
We have determined the evaporation coefficient of D2O to be 0.57 ± 0.06 using
Raman thermometry measurements on droplets undergoing evaporation in the absence of condensation. This value is the same, within experimental error, as that previously measured for H2O (16). Thus, γe for pure water is less than unity, but is not small enough to have a significant impact on models for cloud formation and aerosol growth rates. A TST model for water evaporation (17) is consistent with both the H2O and D2O observations and indicates that the lack of an isotope effect is due to competing energetic

18
and entropic effects. Further understanding of the source and magnitude of these effects and how they are affected by the presence of salts, oils and surfactants will likely be important to understanding evaporation and condensation in mixed phase systems.
Acknowledgements: This work was supported by NSF ATM 0639847 and the Director, Office of Science, Office of Basic Energy Sciences, of the U.S. Department of Energy under Contract No. DE-AC02-05CH11231. W.S. Drisdell thanks the Berkeley Atmospheric Science Center for a graduate student research fellowship.

19
Figure 1: Experimental apparatus. The droplet train is positioned onto the focal point of the 514.5 nm line of the Ar+ laser with an XYZ manipulator. Raman scatter is collected at 90 degrees into a fiber coupler and routed to a monochromator (f/6.5) with a liquid nitrogen cooled CCD detector. A photodiode monitors the laser light attenuation after passing through the droplet train and is used in conjunction with an oscilloscope to ensure that uniform droplets are being produced. Spectra of the droplets as a function of time are taken by sampling at multiple points along the droplet stream, corresponding to liquid temperatures between 295 K and 255 - 260 K.

20
Figure 2: (a) Representative spectra used to generate one of the temperature calibration curves. The dashed line shows the frequency ω* = 2468 cm-1 where the spectra were split. The full curve is constructed from spectra of liquid D2O at 22 different temperatures between 3.6° C and 50.7° C. (b) Representative temperature calibration curve. R2 = 0.9992.

21
Figure 3: Representative model output for a 6.65 µm radius droplet with γe of 0.57. The black line is the volume-averaged temperature, the blue line is the magnitude of the thermal gradient within the droplet (the difference between the outer shell temperature and the volume-averaged temperature), and the red lines are the temperatures of each shell. Absolute temperature is on the left axis and the magnitude of the temperature difference is on the right axis. The inset is an enlarged image of the first 50 µs to depict the shell temperatures more clearly. The volume-averaged temperature (black line) is the output that is fit to the experimental data. Note that the thermal gradient quickly drops below 1 K.

22
Figure 4: (a) Experimental data for a droplet size of 6.65 µm radius, shown with the model fit (red line) to γe = 0.51. The triangle represents the “time zero” data point taken in ambient air, and the squares represent the data taken under vacuum. The black line shows the model output for γe = 1. The green line represents the predicted cooling using the temperature dependent γe from Li et al. (b) The same data, shown with the temperature independent fit for γe = 0.51 (red line), a temperature dependent fit with the functional form from Li et al. (green line) where γe increases from 0.4 at 295 K to 0.6 at 258 K, and an exponential temperature dependent fit (blue line) corresponding to an activation energy of 1.8 kJ/mol. This exponential function is constrained to give 1≤eγ
for all temperatures. The exponential fit gives γe = 0.48 at 295 K and γe = 0.43 at 258 K. Both temperature-dependent fits were tuned to yield the strongest temperature dependence that agrees with the observations within experimental error.

23
References: 1. Winkler P M, et al. (2004) Mass and thermal accommodation during gas-liquid
condensation of water. Physical Review Letters 93. 2. IPCC (2007). 3. Laaksonen A, et al. (2005) Commentary on cloud modelling and the mass
accommodation coefficient of water. Atmospheric Chemistry And Physics 5: 461-464.
4. McComiskey A, Feingold G (2008) Quantifying Error in the Radiation Forcing of the First Aerosol Indirect Effect. Geophysical Research Letters 35.
5. Lohmann U, Quaas J, Kinne S, Feichter J (2007) Different approaches for constraining global climate models of the anthropogenic indirect aerosol effect. Bulletin Of The American Meteorological Society 88: 243-249.
6. Eames I W, Marr N J, Sabir H (1997) The evaporation coefficient of water: A review. International Journal Of Heat And Mass Transfer 40: 2963-2973.
7. Marek R, Straub J (2001) Analysis of the evaporation coefficient and the condensation coefficient of water. International Journal Of Heat And Mass Transfer 44: 39-53.
8. Davidovits P, et al. (2006) Mass accommodation and chemical reactions at gas-liquid interfaces. Chemical Reviews 106: 1323-1354.
9. Feingold G, Chuang P Y (2002) Analysis of the influence of film-forming compounds on droplet growth: Implications for cloud microphysical processes and climate. Journal Of The Atmospheric Sciences 59: 2006-2018.
10. Ruehl C R, Chuang P Y, Nenes A (2008) How quickly do cloud droplets form on atmospheric particles? Atmos. Chem. Phys. 8: 1043.
11. Chuang P Y, Charlson R J, Seinfeld J H (1997) Kinetic limitations on droplet formation in clouds. Nature 390: 594-596.
12. McFeely F R, Somorjai G A (1972) Studies Of Vaporization Kinetics Of Hydrogen-Bonded Liquids. Journal Of Physical Chemistry 76: 914-918.
13. Chakraborty P, Zachariah M R (2008) Sticking Coefficient and Processing of Water Vapor on Organic-Coated Nanoaerosols. J. Phys. Chem. A 112: 966-972.
14. Ward C A, Stanga D (2001) Interfacial conditions during evaporation or condensation of water. Physical Review E 6405.
15. Cappa C D, et al. (2005) Isotope fractionation of water during evaporation without condensation. Journal Of Physical Chemistry B 109: 24391-24400.
16. Smith J D, et al. (2006) Raman thermometry measurements of free evaporation from liquid water droplets. Journal Of The American Chemical Society 128: 12892-12898.
17. Cappa C D, et al. (2007) Interpreting the H/D isotope fractionation of liquid water during evaporation without condensation. Journal Of Physical Chemistry C 111: 7011-7020.
18. Sayer R M, Gatherer R D B, Gilham R J J, Reid J P (2003) Determination and validation of water droplet size distributions probed by cavity enhanced Raman scattering. Physical Chemistry Chemical Physics 5: 3732-3739.
19. Smith R C, Baker K S (1981) Optical-Properties Of The Clearest Natural-Waters (200-800 Nm). Applied Optics 20: 177-184.

24
20. Head-Gordon T, Hura G (2002) Water structure from scattering experiments and simulation. Chemical Reviews 102: 2651-2669.
21. Garrett B C, Schenter G K, Morita A (2006) Molecular Simulations of the Transport of Molecules across the Liquid/Vapor Interface of Water. Chem. Rev. 106: 1355-1374.
22. Kell G S (1967) Precise Representation Of Volume Properties Of Water At 1 Atmosphere. Journal Of Chemical And Engineering Data 12: 66-69.
23. Kestin J (2007) Revised Release on Viscosity and Thermal Conductivity of Heavy Water Substance. International Association for the Properties of Water and Steam.
24. Weierstall U, et al. (2008) Droplet streams for serial crystallography of proteins. Experiments In Fluids 44: 675-689.
25. Devarakonda V, Ray A K, Kaiser T, Schweiger G (1998) Vibrating orifice droplet generator for studying fast processes associated with microdroplets. Aerosol Science And Technology 28: 531-547.
26. Li Y Q, et al. (2001) Mass and thermal accommodation coefficients of H2O(g) on liquid water as a function of temperature. Journal Of Physical Chemistry A 105: 10627-10634.
27. Smith J A, Livingston F E, George S M (2003) Isothermal desorption kinetics of crystalline H2O, (H2O)-O-18, and D2O ice multilayers. Journal Of Physical Chemistry B 107: 3871-3877.
28. Winkler P M, et al. (2006) Condensation of water vapor: Experimental determination of mass and thermal accommodation coefficients. Journal Of Geophysical Research-Atmospheres 111.
29. Voigtlander J, et al. (2007) Mass Accomodation Coefficient of Water: A Combined Computational Fluid Dynamics and Experimental Analysis. Journal of Geophysical Research 112: D20208.
30. Jakubczyk D, Zientara M, Kolwas K, Kolwas M (2007) Temperature dependence of evaporation coefficient for water measured in droplets in nitrogen under atmospheric pressure. Journal Of The Atmospheric Sciences 64: 996-1004.
31. Zientara M, Jakubczyk D, Kolwas K, Kolwas M (2008) Temperature Dependence of the Evaporation Coefficient of Water in Air and Nitrogen under Atmospheric Pressure: Study in Water Droplets. J. Phys. Chem. A 112: 5152-5158.
32. Davidovits P, et al. (2004) Mass accommodation coefficient of water vapor on liquid water. Geophysical Research Letters 31.
33. Fukuta N, Myers M N (2007) Simultaneous measurement of condensation and thermal accommodation coefficients for cloud droplet growth in due consideration of a new moving surface-boundary effect. Journal Of The Atmospheric Sciences 64: 955-968.
34. MacMullin R B (1969) Algorithms For Vapor Pressure Of Water Over Aqueous Solutions Of Salt And Caustic Soda. Journal Of The Electrochemical Society 116: 416-419.
35. Hornung E W, Giauque W F (1955) The Vapor Pressure Of Water Over Aqueous Sulfuric Acid At 25-Degrees. Journal Of The American Chemical Society 77: 2744-2746.

25
36. Horita J, Wesolowski D J, Cole D R (1992) The Activity-Composition Relationship of Oxygen and Hydrogen Isotopes In Aqueous Salt Solutions: I. Vapor-liquid Water Equilibration of Single Salt Solutions From 50 To 100 C. Geochimica et Cosmochimica Acta 57: 2797-2817.
37. Shmulovich K I, Landwehr D, Simon K, Heinrich W (1999) Stable isotope fractionation between liquid and vapour in water-salt systems up to 600 degrees C. Chemical Geology 157: 343-354.
38. Lunkenheimer K, Zembala M (1997) Attempts to study a water evaporation retardation by soluble surfactants. Journal Of Colloid And Interface Science 188: 363-371.
39. Rusdi M, Moroi Y (2004) Study on water evaporation through 1-alkanol monolayers by the thermogravimetry method. Journal Of Colloid And Interface Science 272: 472-479.
40. Seaver M, et al. (1992) Evaporation Kinetics Of Ventilated Waterdrops Coated With Octadecanol Monolayers. Journal Of Physical Chemistry 96: 6389-6394.

26
Chapter 3 – On the Evaporation of Ammonium Sulfate Solution 3-1 Introduction:
The vapor-liquid exchange dynamics of water underlie vital processes in biology, engineering and atmospheric science. The evaporation and condensation rates of water are particularly important in the formation of cloud particles, and are among the largest unknowns in assessing the impact of indirect aerosol effects on the radiative balance in the atmosphere (1). Model studies suggest that evaporation rates slower than 10% of the maximum rate determined by gas kinetic theory for atmospherically relevant aqueous systems would indicate kinetic control over cloud growth processes, with implications for cloud and aerosol models (2, 3). Attempts to quantify the evaporation and condensation rates of water have yielded values spanning three orders of magnitude, although the most recent values converge to a single order of magnitude (4-10). This contributes to the wide variability in cloud model predictions for the anthropogenic effect on size and number of cloud condensation nuclei (CCN) and the corresponding radiative impact on the global system (1, 3, 11, 12).
Measuring evaporation and condensation rates of liquid water is difficult due to the complex heat and mass transfer processes occurring in such experiments. The temperature of the liquid surface must be accurately determined and, in most cases, both evaporation and condensation must be properly accounted for. In addition, it has been suggested that some of the earlier measurements of these rates, which typically involved static liquid surfaces, yielded artificially low rates due to the contamination of the liquid with surface impurities (6). Such impurities may well be present in atmospheric conditions; indeed, field measurements of aerosol growth rates appear to indicate such a slowing effect (13, 14). In our previous work, we addressed the problem of accurately modeling the heat and mass transfer processes through our measurements of the free evaporation of pure H2O and pure D2O (4, 5, 10). We also studied relative evaporation rates of isotopomers in mixtures (10, 15). In these studies of pure solutions, condensation was negligible, allowing the evaporation process to be modeled accurately and then directly related to the cooling rate of the droplets. We found that evaporation for both pure H2O and pure D2O occurred at ~ 60% of the maximum rate determined by gas kinetic theory, too fast to result in a kinetic limit to cloud droplet growth. In the present study, we take the first step towards accounting for the effects of impurities on the evaporation rate by performing similar experiments on ammonium sulfate solutions. Ammonium sulfate was selected as a realistic model system for atmospheric inorganic aerosol due to its well-documented prevalence in the troposphere. Field studies using aerosol mass spectrometers (AMS) have revealed significant fractions of the ambient aerosol to comprise aqueous ammonium and sulfate at the surface in both urban and rural areas (16). Additionally, single-particle studies have shown that the majority of atmospheric aerosol particles are internally well-mixed and consist of approximately 50% ammonium sulfate and 50% carbonaceous components, with little altitude variation (17). Many thermodynamic studies of ammonium sulfate aerosol have shown a hysteresis in

27
the deliquescence properties. Solid particles deliquesce at relative humidities greater than ~80%, but can remain in the aqueous phase as the relative humidity drops as low as ~35%, resulting in supersaturated solution up to approximately twice the saturation concentration before efflorescence occurs (18-20). This suggests that in the atmosphere much of the ammonium sulfate aerosol will be in the form of concentrated aqueous solution. While there have been some measurements of the kinetics of evaporation and condensation from mixed systems including aqueous ammonium sulfate (21, 22), as well as studies of other systems, such as sodium chloride (23), few studies of the aqueous ammonium sulfate system exist (14, 24). A definitive laboratory study of evaporation kinetics from concentrated ammonium sulfate solution is needed to determine if the presence of such inorganic solutes significantly affects the gas-liquid exchange dynamics for atmospheric particles. Most studies of evaporation or condensation report a quantity known as the evaporation coefficient (eγ ) or condensation coefficient (cγ ). The condensation
coefficient is also referred to as the mass accommodation coefficient or simply the accommodation coefficient (mα ). All of these quantities are equal and are defined via
the Hertz-Knudsen equation, which is a formulation of the maximum theoretical condensation rate for a given substance derived from kinetic gas theory (6):
mkT
pJ mc π
α2
= . (1)
Here cJ is the condensation rate, p is the vapor pressure above the liquid surface, m is
the molecular mass of the substance, k is the Boltzmann constant, and T is the temperature. The accommodation coefficient mα is a quantity ranging from zero to one;
a unity value implies that condensation occurs at the maximum theoretical rate, with lower values implying some kinetic limit to the condensation rate. At equilibrium, the evaporation and condensation rates are equal, so the evaporation rate can be expressed as:
mkT
pJ sat
ee πγ
2= , (2)
Here satp is the equilibrium vapor pressure, and the accommodation coefficient has been
replaced by the evaporation coefficient eγ . While Equation (1) can only be used to
formulate the condensation rate when the vapor exhibits a Maxwell distribution of velocities (which will not apply in non-equilibrium situations with low vapor pressures), Equation (2) can be used to formulate the evaporation rate even in non-equilibrium systems because the activity of the liquid is unchanged. Our previous measurements utilized liquid microjets to form droplet streams in vacuum with radii in the range of 6 – 7.5 µm. This allowed the study of evaporation in the absence of condensation, significantly simplifying the experimental system. This is shown by integrating the number of collisions experienced by a single evaporating molecule as it leaves the droplet and travels an infinite distance away:
),()(2
),(),(
0
02
200
20
0 0Tr
r
r
drrrnd
Tr
drTrN
r r
collcoll λπ
λ=== ∫ ∫∞ ∞
, (3)

28
Here 0r is the radius of the droplet, 12 )](2[),( −= rndTr collπλ is the mean free path of the
vapor, colld is the collision diameter, and )(rn is the number density of the vapor. For
H2O, the vapor pressure at 283 K, the temperature at which our measurements began, is ~ 9 torr, corresponding to a mean free path of ~10 µm (5). Thus, molecules evaporating from droplets with radii smaller than 10 µm should experience less than one collision on average, allowing condensation to be neglected. In other words, the Knudsen number
1/ 0 >= rKn λ . We used Raman thermometry to measure the temperature of the
evaporating water droplets as a function of time and modeled this cooling curve with a simple discrete model in which eγ is the only adjustable parameter. The studies yielded
a eγ value of 0.62 ± 0.09 for pure H2O (5) and 0.57 ± 0.06 for pure D2O (4). We
interpreted these results and our measurements of isotope effects during evaporation (10) using a modified transition-state theory (TST) formulation (15). This formulation suggested that the energetic and entropic isotope effects cancelled, resulting in similar evaporation kinetics for the two isotopic species (4). In extending these studies to ammonium sulfate solutions, we report the value of
eγ as defined by Equation (2). Here, however, satp is the equilibrium vapor pressure of
the solution, rather than that of pure water. Since this vapor pressure is ~13% lower than that of pure water, the maximum theoretical evaporation rate for the solution is lower than that of pure water. Ideally, the solution in this study should be as concentrated as possible in order to simulate atmospheric conditions. The saturation limit is 3.9M at 273 K (25). The measurements presented here use 3M solutions, as more concentrated solutions resulted in frequent clogging of our µm sized orifices. 3-2 Results:
Raman spectra were measured for droplet radii between 8.9 and 11.55 µm. We calculate that evaporation from a droplet of 11.55 µm radius or smaller will be collision-free (i.e. 1>Kn ) for temperatures of ~283.3 K or colder. All of the data taken in this study are below that temperature, but the liquid begins at laboratory temperature (293 K), so collisions resulting in a return flux to the liquid could play a role at very early interaction times, before the first data are taken. At 293 K 54.0=Kn for an 11.55 µm radius droplet and 0.70 for an 8.9 µm radius droplet. We confirmed that these effects are unimportant by repeating our previous observations of H2O evaporation, where we used droplets of radii less than 8 µm, on larger droplet sizes. Droplets with radii of 9.5 µm, 11.05 µm and 11.9 µm were tested, yielding eγ values of 0.63, 0.61 and 0.55,
respectively. These are in excellent agreement with our previously measured value of 0.62 ± 0.09 for H2O (5). No systematic deviation from the model predictions were found at early interaction times for either H2O or ammonium sulfate solutions. We have previously observed such deviations to occur for pure H2O droplets of 20.3 µm radius (5), suggesting that droplets must approach this size before condensation effects become important. Eight measurements on seven different droplet sizes were collected for the 3M ammonium sulfate solution, resulting in an average eγ of 0.58 ± 0.05. The variance
shown is the 95% confidence interval. The droplet residence times in vacuum were

29
between 597 µs and 1014 µs. A representative experimental cooling curve for a droplet of 9.1 µm radius is shown in Figure (1), with a model fit using a eγ value of 0.58. As in
our previous studies, the best fit to the data is found when eγ does not vary with
temperature. Model fits for all measurements were conducted with 20 spherical shells per droplet, sufficient to produce a numerically converged temperature field.
In general, there was more noise in the experimental cooling curves in this study compared to our work on pure liquid H2O or D2O. One possible explanation is the presence of icicles. The ammonium sulfate solution formed icicles in the liquid nitrogen trap much more readily than did either pure H2O or pure D2O, due to salt crystallization upon freezing. Icicles often grew into the interaction region of the laser during a measurement, despite the extended length of the liquid nitrogen trap (60 cm). The issue was most prominent for droplet streams that were not completely straight and may have impinged the side of the trap, rather than the bottom. The trap was fitted with an icicle breaker to allow icicles to be removed during measurements, but it is possible that icicles may still have interfered slightly with the measurements (causing additional noise) by providing a surface for gas-phase collisions and possibly leading to some re-condensation of vapor onto the droplet stream. The use of ammonium sulfate solution instead of pure H2O introduces some other potential complications as well. The spectra used for the temperature calibration exhibit two features from the ammonium ion (Figure (2)). This means that the temperature measurements are sensitive to the concentration of the solution. To ensure that no dilution occurred before each measurement, the spectrum of the droplet stream in ambient air was taken to verify that laboratory temperature was reproduced; pure H2O tests revealed that this should be true for distances less than 5 mm from the nozzle. During a typical vacuum measurement, however, the volume of the droplets is expected to decrease by up to 6% due to evaporation, implying a 6 % increase in solute concentration. While this is a small change that is not expected to affect the evaporation kinetics, it alters the Raman spectrum. We calibrated the Raman spectrum as a function of temperature for both 3 and 3.18M solutions. Derived temperatures from the spectra of liquid jets were interpolated between the values from 3M solution and from 3.18M solution based on the expected concentration increase at each experimental time point., 3-3 Discussion:
The eγ value of 0.58 ± 0.05 found in this study suggests that the presence of
ammonium sulfate does not significantly affect the evaporation mechanism of liquid water, despite the ~13% reduction in vapor pressure. This at first seems surprising; the 3M solution used in this study contains a 9M total ion concentration, and if a hydration shell of ~4-6 water molecules is assumed then virtually every water molecule should be interacting with an ion. It is reasonable to assume that these interactions would alter the mechanism for evaporation and therefore the evaporation coefficient. Our results suggest, however, that there is remarkable similarity in the efficiencies of the evaporation and condensation processes for pure water and 3M ammonium sulfate solution. This may in part be explained by the fact that both solute ions are expected to be depleted in the surface region, limiting their effect on evaporating water molecules. Molecular dynamics (MD) simulations of ammonium sulfate solution in the interfacial region show the sulfate

30
anion completely depleted from the interface to a depth of approximately 7 Å (26). This result is in agreement with interpretations of surface tension measurements of ammonium sulfate solution (27). The ammonium ion, however, is not completely depleted from the interfacial region in the MD simulations and exists at lower density within the upper 5 Å of the interface. Thus the ammonium ion may be expected to have some interactions with evaporating water molecules. Car-Parrinello molecular dynamics (CPMD) simulations of the solvated ammonium ion predict a first solvation shell containing four tightly bound water molecules in a tetrahedral cage, and a fifth more weakly bound and more mobile water molecule that occasionally exchanges with one of the other four (28). The radius of the solvation shell is found to be ~ 3 Å. If one estimates, from the MD results presented by Gopalakrishnan et al., that the ammonium ion concentration is ~ 15 – 20% of its bulk concentration at a depth of 3 Å from the surface, then only 7 – 11% of the water molecules in the interfacial layer are within the first solvation shell of an ammonium ion in our 3M solution, implying that any solute effects on evaporation are unimportant. The results of this study indicate that ammonium sulfate, even if present at highly supersaturated aqueous concentrations, is not likely to significantly affect evaporation and condensation kinetics in the atmosphere, other than by reducing the vapor pressure. Field observations, however, have shown large variation in particle growth rates, including many cases in which growth rates were significantly lower than measured values for ammonium sulfate aerosol in the laboratory (14, 34). It is likely that other atmospheric constituents, e.g. organics, can affect the liquid-vapor exchange rates of water in the atmosphere and subsequently affect cloud condensation behavior. There is currently much interest in the effects of organic aerosol on the hygroscopic behavior of atmospheric particles (13, 21, 22, 35, 36), although, to date, available kinetic information has been limited. A more recent study by Shantz et al. shows that anthropogenic aerosol in the field, consisting of ammonium sulfate and organic components, exhibits growth rates consistent with a lowering of eγ by over an order of magnitude relative to pure
ammonium sulfate aerosol (34). The specific effects of different organic species in that study could not be determined, however. New and improved methods are needed to quantify the effect of organic surfactant films on evaporation and condensation rates in the atmosphere. From a purely physical perspective, other inorganic solutes might be expected to alter evaporation rates more readily. Ions such as thiocyanate and perchlorate, which are expected to be strongly enhanced in concentration at the air-water interface might be expected to have large effects on eγ through direct interactions with evaporating water
molecules (37). Studies of perchlorate solutions are currently underway in our laboratory. 3-4 Materials and Methods: Sample Preparation: Samples were prepared volumetrically, using commercial anhydrous ammonium sulfate (Sigma Aldrich, ≥99%) and deionized and filtered H2O (18.2 MΩ resistivity, Milli-Q, Millipore). Solutions were then filtered through a 2 µm particle retention filter and stored in a sealed container when not in use.

31
Experimental Apparatus: The experimental apparatus has been described in detail previously (4, 5). Briefly, a syringe pump (Teledyne ISCO Model 260D) is used to pump the sample solution through a fused silica orifice mounted on a piezoelectric ceramic. In our earlier studies, the orifice radii used were 2.5-4 µm; however, clogging issues upon running salt solutions necessitated larger orifices for this study, in the range of 4-6.5 µm diameter. The orifices were prepared from 100 µm ID fused silica tubing using a CO2 laser micropipette puller (Sutter Instrument Co. Model P2000). Orifice sizes were determined via Mie scattering of a HeNe laser intersecting the liquid stream, in the same manner described previously (10). The piezoelectric ceramic allows the silica orifice to act as a Vibrating Orifice Aerosol Generator (VOAG). By driving the piezoelectric ceramic with a 20V square wave at 300 – 800 kHz, a uniform droplet stream is generated with a spread in radius of less than 0.1 µm (38). Droplets in this study were between 8.9 and 11.55 µm in radius; sizes were calculated from the liquid flow rate and oscillation frequency (4). The VOAG apparatus is mounted on an XYZ manipulator stage which is in turn attached to a 7 cm cubical vacuum chamber via a bellows, allowing for positioning of the droplet stream within the chamber. The vacuum chamber is pumped by a 110 L/s turbomolecular pump. The droplet stream is intercepted by the 514.5 nm line of an argon ion laser operating at <250 mW. After the laser has passed through the droplet stream, the laser light is detected on a photodiode. Droplets passing through the laser focal volume lower the signal on the photodiode, allowing for real-time monitoring of the droplet stream produced by the VOAG and ensuring that a uniform droplet stream is being generated for any given driving frequency. After the droplet stream has passed through the laser focal volume, the liquid is captured in a liquid nitrogen trap. The trap used in this study was extended compared to that used in our previous studies and was equipped with an icicle breaker. Raman scatter from the droplets is collected and filtered at 90° and sent via fiber-optic cable to a monochromator (f/6.5) with a liquid nitrogen cooled CCD detector. The OH-stretching region of the Raman spectrum of ( 2500 – 3900 cm-1) is used to determine the temperature of the droplets via Raman thermometry with a precision of ±2 K (4, 5). First, a calibration is taken by splitting the spectrum at an arbitrary frequency and plotting natural logarithm of the ratio of the area under the spectrum before and after the split point versus inverse temperature, giving a linear relationship. Calibration spectra were taken using solutions in a constant temperature cuvette (Figure (2)) (4). The spectra show two features near 2875 cm-1 and 3075 cm-1 due to the ammonium ion (39). The calibration curve allows the determination of the temperature of the droplets in vacuum from their Raman spectra. To account for increasing concentration due to evaporaton in vacuum, separate calibration curves were taken for 3M and 3.18M solution. Raman measurements were taken as a function of distance from the VOAG nozzle. Droplet stream velocity, calculated from the liquid flow rate and orifice size, is used to calculate the residence time in vacuum. The initial temperature of the droplets is the ambient temperature in the lab. Evaporative Cooling Model: We determine eγ by relating the temperature derived from the Raman spectra to
evaporation rates, under the assumption that each evaporative event results in cooling of

32
the solution (4, 5). We infer the effect on solution temperature by calculating the heat loss from a droplet due to evaporation. The droplet is divided into concentric spherical shells, with evaporation occurring in the outermost shell. Heat is then propagated outwards from the inner shells according to the thermal diffusion equation; this ensures an accurate droplet surface temperature. Mass loss due to evaporation from the outermost shell is accounted for; all shells are resized after each time step, then the process is iterated. Using Equation (2), the cooling rate of the droplets is defined as
sp
vapsate VC
H
mkT
pA
dt
dT
ρπγ
∆−=
2 , (6)
where A is the surface area of the outermost shell ( 204 rπ= ), vapH∆ is the enthalpy of
vaporization (44.4 kJ/mol), pC is the specific heat capacity,ρ is the density, and sV is
the volume of the outermost shell ( 303
4rπ= ). For a 3M ammonium sulfate solution, a
value of 60.625 J/mol was used for pC (40). The value of satp was determined by
applying a water activity of 0.874 to the empirical temperature-dependent equation for vapor pressure of pure water reported by Murphy and Koop (41). The water activity was determined from the data of Tang and Munkelwitz (42) and was assumed to be invariant with temperature. The density of the solution was measured as 1.188 g/ml and was assumed to be constant with temperature. Such an assumption proved valid for our previous work on pure H2O and D2O (4, 5). Equation (6) can be simplified to
ρπγ
)(
3
2 31
30
20
rr
r
C
H
mkT
p
dt
dT
p
vapsate −
∆−= , (7)
where 0r and 1r are the outer and inner radii of the outermost droplet, respectively. Here
eγ is the only adjustable parameter. Heat transfer between adjacent shells in the droplet
is modeled with the thermal diffusion equation
dr
dTA
dt
dQ κ−= , (8)
where dQ/dt is the heat transferred from the inner shell to the outer shell over the duration of a time step, 532.0=κ is the thermal conductivity (43), A is the surface area of the inner shell in question, and dT/dr is the temperature difference between the two shells. The volume-averaged temperature is then calculated at each time step; this is matched to experiment by tuning eγ . While the Raman response from liquid microdroplets has been
demonstrated to be nonuniform (44), the effect is minimized when collecting Raman signal at 90 degrees, and the response becomes more uniform for droplet radii larger than 5 µm (45). In addition, since our experiment does not trap a single droplet but rather samples a droplet stream, there is further averaging of the Raman response over the droplet volume. As a test, we matched the experimental temperatures to the average temperature of only the outermost five spherical shells, rather than the volume averaged temperature of the entire droplet, resulting in a change of only a few percent in eγ . In
light of this, we have elected to use the volume averaged temperature model output to match experiment.

33
The cooling model is also used to account for the change in the Raman spectra upon increasing concentration due to evaporation in vacuum. The model predicts the change in droplet size at each time step, and therefore the expected concentration increase as a function of time. The expected concentration at each of the experimental time points is used to interpolate between the temperatures produced by the 3M and 3.18M calibrations. The model is tuned by changing eγ until the volume-averaged temperature
predicted by the model matches the interpolated derived temperatures from the Raman measurements. Acknowledgements: This work was supported by NSF ATM 0639847 and the Director, Office of Science, Office of Basic Energy Sciences, of the US Department of Energy under Contract No. DE-AC02-05CH11231. Walter S. Drisdell thanks Robert M. Onorato and Dale E. Otten for enlightening discussions.

34
Figure 1: Experimental data for droplets of 9.1 µm diameter, consisting of 19 temperature values. The triangle represents the measurement of the initial droplet temperature taken in ambient air. The squares are data from the droplet in vacuum. Error bars are ± 2 K, and provide an estimate of the precision of determining the temperature from the Raman spectra. The solid line is the model fit, corresponding to eγ = 0.58.
Deviation in the experimental data from the model fit at ~ 160 µs and ~315 µs may be due to the presence of icicles in the vacuum chamber when the corresponding spectra were collected.
Figure 2: Selected spectra of 3M ammonium sulfate solution (a) collected at 273 K, 298.1 K, and 325.9 K and used for temperature calibration. The features at ~2875 cm-1 and ~3075 cm-1 are due to the ammonium ion. The dotted black line represents the frequency ω* = 3424 cm-1 at which the spectra were split; the natural log of the ratio of the area under the spectrum below this frequency to the area under the spectrum above this frequency shows a linear relationship when plotted versus 1/T, as shown in (b). The squares in (b) represent the full calibration curve for 3M ammonium sulfate, featuring 26

35
spectra collected at temperatures between 273 K and 325.9 K. The red line is the linear fit (R2 = 0.9988). The circles represent the full calibration curve for 3.18M ammonium sulfate, featuring 27 spectra at temperatures between 274.35 K and 334.15 K. The blue line is the linear fit (R2 = 0.9981). Experimental temperatures are determined by interpolating between these two curves based on the expected concentration at each time point. The choice of the frequency ω* is arbitrary; the frequency chosen is convenient for alternating between calibration curves for ammonium sulfate solution and pure water.

36
References: 1. Forster P, V. Ramaswamy, P. Artaxo, T. Berntsen, R. Betts, D.W. Fahey, J.
Haywood, J. Lean, D.C. Lowe, G. Myhre, J. Nganga, R. Prinn, G. Raga M S a R V D (2007) in Climate Change 2007: The Physical Science Basis. Contribution of Working Group I to the Fourth Assessment Report of the Intergovernmental Panel on Climate Change, ed. Solomon, S., D. Qin, M. Manning, Z. Chen, M. Marquis, K.B. Averyt, M.Tignor and H.L. Miller (Cambridge University Press, Cambridge).
2. Chuang P Y, Charlson R J, Seinfeld J H (1997) Kinetic limitations on droplet formation in clouds. Nature 390: 594-596.
3. Laaksonen A, et al. (2005) Commentary on cloud modelling and the mass accommodation coefficient of water. Atmospheric Chemistry And Physics 5: 461-464.
4. Drisdell W S, et al. (2008) Determination of the evaporation coefficient of D2O. Atmos. Chem. Phys. 8: 6699.
5. Smith J D, et al. (2006) Raman thermometry measurements of free evaporation from liquid water droplets. Journal Of The American Chemical Society 128: 12892-12898.
6. Eames I W, Marr N J, Sabir H (1997) The evaporation coefficient of water: A review. International Journal Of Heat And Mass Transfer 40: 2963-2973.
7. Marek R, Straub J (2001) Analysis of the evaporation coefficient and the condensation coefficient of water. International Journal Of Heat And Mass Transfer 44: 39-53.
8. Davidovits P, et al. (2006) Mass accommodation and chemical reactions at gas-liquid interfaces. Chemical Reviews 106: 1323-1354.
9. Zientara M, Jakubczyk D, Kolwas K, Kolwas M (2008) Temperature Dependence of the Evaporation Coefficient of Water in Air and Nitrogen under Atmospheric Pressure: Study in Water Droplets. J. Phys. Chem. A 112: 5152-5158.
10. Cappa C D, et al. (2005) Isotope fractionation of water during evaporation without condensation. Journal Of Physical Chemistry B 109: 24391-24400.
11. McComiskey A, Feingold G (2008) Quantifying Error in the Radiation Forcing of the First Aerosol Indirect Effect. Geophysical Research Letters 35.
12. Lohmann U, Quaas J, Kinne S, Feichter J (2007) Different approaches for constraining global climate models of the anthropogenic indirect aerosol effect. Bulletin Of The American Meteorological Society 88: 243-249.
13. Feingold G, Chuang P Y (2002) Analysis of the influence of film-forming compounds on droplet growth: Implications for cloud microphysical processes and climate. Journal Of The Atmospheric Sciences 59: 2006-2018.
14. Ruehl C R, Chuang P Y, Nenes A (2008) How quickly do cloud droplets form on atmospheric particles? Atmos. Chem. Phys. 8: 1043.
15. Cappa C D, et al. (2007) Interpreting the H/D isotope fractionation of liquid water during evaporation without condensation. Journal Of Physical Chemistry C 111: 7011-7020.

37
16. Zhang Q, et al. (2007) Ubiquity and dominance of oxygenated species in organic aerosols in anthropogenically-influenced Northern Hemisphere midlatitudes. Geophysical Research Letters 34.
17. Murphy D M, et al. (2006) Single-particle mass spectrometry of tropospheric aerosol particles. J. Geophys. Res. 111.
18. Tang I N, Munkelwitz H R (1993) Composition And Temperature-Dependence Of The Deliquescence Properties Of Hygroscopic Aerosols. Atmospheric Environment Part A-General Topics 27: 467-473.
19. Onasch T B, et al. (1999) Infrared spectroscopic study of the deliquescence and efflorescence of ammonium sulfate aerosol as a function of temperature. Journal Of Geophysical Research-Atmospheres 104: 21317-21326.
20. Cziczo D J, Abbatt J P D (1999) Deliquescence, efflorescence, and supercooling of ammonium sulfate aerosols at low temperature: Implications for cirrus cloud formation and aerosol phase in the atmosphere. Journal Of Geophysical Research-Atmospheres 104: 13781-13790.
21. Sjogren S, et al. (2007) Hygroscopic growth and water uptake kinetics of two-phase aerosol particles consisting of ammonium sulfate, adipic and humic acid mixtures. Journal Of Aerosol Science 38: 157-171.
22. Garland R M, et al. (2005) Impact of palmitic acid coating on the water uptake and loss of ammonium sulfate particles. Atmospheric Chemistry And Physics 5: 1951-1961.
23. Richardson C B, Lin H B, McGraw R, Tang I N (1986) Growth-Rate Measurements For Single Suspended Droplets Using The Optical Resonance Method. Aerosol Science And Technology 5: 103-112.
24. Rose D, et al. (2008) Calibration and measurement uncertainties of a continuous-flow cloud condensation nuclei counter (DMT-CCNC): CCN activation of ammonium sulfate and sodium chloride aerosol particles in theory and experiment. Atmospheric Chemistry And Physics 8: 1153-1179.
25. Robertson J (1985) Densities of aqueous solutions of inorganic substances by O. Sohnel and P. Novotny. Acta Crystallographica Section B 41: 208.
26. Gopalakrishnan S, Jungwirth P, Tobias D J, Allen H C (2005) Air-liquid interfaces of aqueous solutions containing ammonium and sulfate: Spectroscopic and molecular dynamics studies. Journal Of Physical Chemistry B 109: 8861-8872.
27. Pegram L M, Record M T (2007) Hofmeister salt effects on surface tension arise from partitioning of anions and cations between bulk water and the air-water interface. Journal Of Physical Chemistry B 111: 5411-5417.
28. Bruge F, Bernasconi M, Parrinello M (1999) Ab initio simulation of rotational dynamics of solvated ammonium ion in water. Journal Of The American Chemical Society 121: 10883-10888.
29. Pudzianowski A T (1995) Mp2/6-311++G(D,P) Study Of 10 Ionic Hydrogen-Bonded Binary-Systems - Structures, Normal-Modes, Thermodynamics, And Counterpoise Energies. Journal Of Chemical Physics 102: 8029-8039.
30. Bruge F, Bernasconi M, Parrinello M (1999) Density-functional study of hydration of ammonium in water clusters. Journal Of Chemical Physics 110: 4734-4736.

38
31. Hofmeister F (1888) Zur Lehre von der Wirkung der Salze. Naunyn-Schmiedeberg's Archives of Pharmacology 24: 247.
32. Collins K D, Washabaugh M W (1985) The Hofmeister Effect And The Behavior Of Water At Interfaces. Quarterly Reviews Of Biophysics 18: 323-422.
33. Cacace M G, Landau E M, Ramsden J J (1997) The Hofmeister series: salt and solvent effects on interfacial phenomena. Quarterly Reviews Of Biophysics 30: 241-277.
34. Shantz N C, et al. (2009) Slower CCN growth kinetics of anthropogenic aerosol compared to biogenic aerosol observed at a rural site. Atmos. Chem. Phys. Discuss. 9: 13775.
35. Abbatt J P D, Broekhuizen K, Kumal P P (2005) Cloud condensation nucleus activity of internally mixed ammonium sulfate/organic acid aerosol particles. Atmospheric Environment 39: 4767-4778.
36. Shantz N C, Leaitch W R, Caffrey P F (2003) Effect of organics of low solubility on the growth rate of cloud droplets. Journal Of Geophysical Research-Atmospheres 108.
37. Petersen P B, Saykally R J, Mucha M, Jungwirth P (2005) Enhanced concentration of polarizable anions at the liquid water surface: SHG spectroscopy and MD simulations of sodium thiocyanide. Journal Of Physical Chemistry B 109: 10915-10921.
38. Sayer R M, Gatherer R D B, Gilham R J J, Reid J P (2003) Determination and validation of water droplet size distributions probed by cavity enhanced Raman scattering. Physical Chemistry Chemical Physics 5: 3732-3739.
39. Fawcett V, Long D A, Sankaranarayanan V N (1975) Study Of Internal Frequency Region (400-4000cm-1) Of Raman-Spectrum Of A Single-Crystal Of Sodium Ammonium-Sulfate Dihydrate, Nanh4so4.2h2o Over Temperature-Range 293-87k. Journal Of Raman Spectroscopy 3: 217-228.
40. Roth K, Wolf U, Wolf G (1997) A simple method for modelling and prediction of the specific heat and density of aqueous electrolyte solutions. Calphad-Computer Coupling Of Phase Diagrams And Thermochemistry 21: 475-481.
41. Murphy D M, Koop T (2005) Review of the vapour pressures of ice and supercooled water for atmospheric applications. Quarterly Journal Of The Royal Meteorological Society 131: 1539-1565.
42. Tang I N, Munkelwitz H R (1994) Water Activities, Densities, And Refractive-Indexes Of Aqueous Sulfates And Sodium-Nitrate Droplets Of Atmospheric Importance. Journal Of Geophysical Research-Atmospheres 99: 18801-18808.
43. Riedel L (1951) Die Wärmeleitfähigkeit von wäßrigen Lösungen starker Elektrolyte. Chemie Ingenieur Technik - CIT 23: 59-64.
44. Schweiger G (1990) Raman-Scattering On Single Aerosol-Particles And On Flowing Aerosols - A Review. Journal Of Aerosol Science 21: 483-509.
45. Reid J P, Mitchem L (2006) Laser probing of single-aerosoldroplet dynamics. Annual Review Of Physical Chemistry 57: 245-271.

39
Chapter 4 – The Effect of Surface Active Ions on the Rate of Water Evaporation 4-1 Introduction:
The vapor-liquid exchange of water is of interest in many areas of science, and
particularly in atmospheric chemistry, since the kinetics and equlibria strongly influence aerosol and cloud properties and thus terrestrial climate. Nevertheless, current understanding of the fundamental processes involved is poor. In the atmosphere, the interactions between clouds and aerosol particles and their effects on climate remain the largest uncertainties climate modeling, due in part to our inability to accurately quantify the microscopic liquid-vapor exchange rates on ambient particles (1). The problem is compounded by the presence of dissolved solutes as well as organic surfactant species that are prevalent in atmospheric aerosol, but even attempts to quantify vapor-liquid exchange kinetics for pure water have proven difficult. Previous attempts to measure these rates have yielded values that span three orders of magnitude, but recent measurements have converged to within a single order of magnitude (2-10). Several factors have contributed to experimental difficulties, including accounting for simultaneous evaporation and condensation, accurately determining the liquid surface temperature during the mass transfer process, and quantifying the complex thermal and mass fluxes in the vapor phase (5, 7). Some recent studies have suggested that the changing position of the liquid-vapor boundary on the timescale of the experiments can cause problems, especially when using a computer model to interpret experimental data (9, 11).
In our own previous studies, we have employed liquid microjets coupled with Raman thermometry to examine water evaporation without accompanying condensation (2, 3). This technique simplifies the interpretation of the data significantly, allowing the evaporation rate to be derived from the data using a simple evaporative cooling model. For both pure H2O and pure D2O we found that the evaporation process proceeds at ~60% of the thermodynamic maximum rate derived from kinetic gas theory. This is not slow enough to affect cloud growth rates in current models (which assume the maximum rate) (12). There are, however, several field studies which suggest that aerosol and cloud droplet growth rates in the atmosphere are often much slower than this, likely due to the presence of dissolved impurities and organic surfactant coatings on evaporating particles (12-14). To determine the effects of such species, we have recently performed similar evaporation measurements on 3M ammonium sulfate solution (15). Ammonium sulfate was selected because it represents the largest inorganic component of anthropogenic aerosol (16). We found that, while the thermodynamic maximum evaporation rate for 3M ammonium sulfate solution is lower than that of pure water by ~13%, water still evaporated from the solution at ca. 60% of this maximum rate. The lack of change in the kinetics is consistent with calculations and experiments showing that both the ammonium and sulfate ions are depleted from the interfacial layer, and therefore have limited interactions directly with evaporating water molecules at the surface (15, 17, 18). Other atmospherically relevant solutes, such as sodium, chloride and nitrate, are also predicted to be surface-depleted, so it seems unlikely that inorganic solutes affect liquid-vapor
40
exchange in the atmosphere (18-22). It is possible, however, that ions that are enhanced in concentration at the air-water interface could have an effect on evaporation kinetics. While most of these ions are not atmospherically relevant, a study of their effect on the evaporation kinetics of liquid water could elucidate the underlying molecular mechanism. It is with this aim that we extend our evaporation studies to sodium perchlorate solution. Perchlorate was selected for study as it is predicted to be among the most strongly surface-enhanced ions in liquid water (18, 23).
In studies of evaporation and condensation, a convenient parameter to report is the evaporation coefficient or mass accommodation coefficient. This parameter is defined via the Hertz-Knudsen equation, which represents the maximum condensation rate of a gas onto a surface from kinetic gas theory (4):
mkT
pJ sat
ec πγ
2= (1)
Here, cJ is the condensation rate in molecules per unit area per time, satp is the
saturation vapor pressure of the liquid, m is the molecular mass, k is the boltzmann constant, T is the temperature and eγ is the evaporation coefficient (sometimes referred
to in condensation studies as the mass accommodation coefficient or simply the accommodation coefficient, denoted as mα ). This equation applies to equilibrium, so the
evaporation and condensation rates are equal and are both described by this equation. In non-equilibrium conditions, the condensation rate will depend on the gas pressure, but the evaporation rate will not, as the activity of the liquid is constant. Therefore, Equation (1) can be used to describe the evaporation rate even in non-equilibrium states. The evaporation coefficient eγ is a value between zero and one, and can be thought of as a
transition probability, representing the fraction of evaporation or condensation attempts which succeed. For condensation, each collision with the surface is considered a condensation attempt. A coefficient of unity indicates that the process proceeds at the thermodynamic maximum rate, whereas lower values indicates that a kinetic process limits the rate. Recent measurements of this quantity have yielded values spanning the range of 0.13 – 1 for pure water (7-9). From our own measurements, we have determined the evaporation coefficient for pure H2O and pure D2O to be 0.62 ± 0.09 (2 standard deviations) and 0.57 ± 0.06 (95% confidence interval), respectively (2, 3). Our recent study of ammonium sulfate solution showed no change, with a value of 0.58 ± 0.05 (95% confidence interval) for eγ (15). In the present study, we perform similar measurements
of 4M sodium perchlorate solution. As in our study of ammonium sulfate, the maximum thermodynamic evaporation rate for the sodium perchlorate solution as determined by Equation (1) will be slower than that for pure water (by ~17%) as a result of the lower vapor pressure of the solution (see below for details of the vapor pressure estimation); the value determined for eγ will therefore reflect the percentage of this lower maximum rate
at which evaporation actually proceeds. A 4M solution was the highest concentration that did not result in clogged orifices or complications in the spectral analysis. This concentration is lower than that expected for atmospheric inorganic constituents such as ammonium sulfate , which are often supersaturated by up to twice the saturation limit (15).

41
The high precision of our experimental technique is due to the fact that experiments are performed in the absence of condensation, allowing for the data to be interpreted with a relatively simple evaporative cooling model. We ensure that the droplets produced in our vacuum chamber are in the regime where condensation is negligible by insuring the mean free path of evaporating molecules is large compared to the diameter of the droplets. We use the relationship between the Knudsen number and the number of collisions experienced by an evaporating molecule moving from the surface of the droplet to an infinite distance to estimate the required droplet size:
),(
1
),()(2
),(),(
00
02
200
20
0 0TrKnTr
r
r
drrrnd
Tr
drTrN
r r
collcoll ==== ∫ ∫∞ ∞
λπ
λ (2)
In this expression, ),( TrN coll is the number of collisions experienced by an evaporating
droplet starting at distance r from the droplet center, 12 )](2[),( −= rndTr collπλ is the
mean free path in the vapor phase, 0r is the radius of the droplet, colld is the collision
diameter of H2O, )(rn is the number density of the vapor, and rKn /λ= is the Knudsen number. For 1>Kn , evaporating molecules undergo less than one collision on average, ensuring that none return to the droplet and condense. Droplets used in this study were between 9.15 and 12.3 µm in radius; the mean free path of evaporate from the 4M sodium perchlorate solution reaches 12.3 µm at temperatures of 283 K and colder. Only a small portion of the data taken in this study was above this temperature (up to 285.5 K, typically only one measured temperature point out of 20-25 points per experimental run). Given that our data do not show any dependence on droplet size, and that our model fits are unchanged when ignoring any temperature points above 283 K, we believe that any effects from gas-phase collisions in the first ~75 µs of measurement are smaller than our experimental precision. Even if vapor-phase collisions occurred in these cases, solid angle considerations imply that only a fraction of the colliding molecules would actually impinge upon the droplet. Additionally, we have seen no evidence for condensation effects in our previous studies for droplet sizes smaller than 20 µm radius (2, 3, 15).
4-2 Experimental: Sample Preparation:
Anhydrous sodium perchlorate was obtained commercially (Sigma, ACS reagent, ≥ 98%). Solutions were prepared volumetrically using filtered and deionized H2O (18.2 MΩ resistivity, Milli-Q, Millipore). Solutions were additionally filtered through disposable 0.5 µm particle retention filters and stored in a sealed container when not in use.
Experimental Apparatus:
The experimental apparatus has been described in detail previously (3, 15). Briefly, the liquid orifice is mounted on a piezoelectric ceramic which acts as a vibrating orifice aerosol generator (VOAG). This allows the droplets produced by the jet to be forced into a uniform size by applying a square wave driving frequency from a function generator. Orifices used in this study ranged between 4.3 and 6.6 µm radius and were produced from 100 µm ID fused silica tubing using a commercial CO2 laser pipet puller

42
(Sutter Instrument Model P2000). Orifices were sized using angle-resolved Mie scattering as reported previously (3, 10). The VOAG apparatus is, in turn, mounted on an XYZ manipulator and attached via bellows to the 7cm cubical vacuum chamber, with the droplet stream propagating downwards. The vacuum chamber is pumped by a 110 L/s turbomolecular pump. The droplet stream is intersected by the beam of an Ar+ laser operating at ~250 mW or less at 514.5nm. Raman scatter is collected at 90 degrees, filtered, focused and sent via optical fiber to a monochromator (f/6.5) equipped with a liquid nitrogen-cooled CCD detector. After the laser light has intersected the droplet train, it is collected by a photodiode and sent to an oscilloscope. This allows real-time monitoring of the droplets produced by the VOAG; as droplets pass through the laser focus, there is a dip in signal on the photodiode. A sinusoidal signal on the oscilloscope indicates the presence of uniformly sized droplets. After the droplets have passed through the interaction region, they enter a liquid nitrogen-cooled trap to freeze the liquid and prevent any re-evaporation.
The OH-stretching region of the Raman spectrum (2500 – 3900 cm-1) is used to determine the temperature of the liquid to within ± 2 K. Calibration spectra of the 4M solution were taken in a cuvette at temperatures between ~ 273 K and ~325 K, monitored with a thermocouple. Example calibration spectra are shown in Figure 1a, and show a feature at ~ 3580 cm-1 due to the perchlorate ion (24). This feature partially obscures the H2O spectrum and causes slightly lower precision in the temperature derivation relative to pure water, while still being within ± 2 K. Spectra were split at 3422.6 cm-1, and the ratio of the area under the spectrum for frequencies below this point to the area under the spectrum for frequencies above this point was plotted against 1/T to create a temperature calibration curve. In our previous studies, the resulting curve was linear (2, 3, 15), but in this study we observed a slight curvature and found a quadratic fit to reproduce the calibration data more accurately, especially the lower temperatures. Figure 1b shows a sample calibration curve with both linear and quadratic fits.
In our study of ammonium sulfate, we predicted a ~5% concentration increase to occur during experiments as a result of evaporative loss of water from the solution (15), While this small change was not expected to affect the evaporation kinetics, we found that the Raman spectral shape was quite sensitive to concentration changes, and that our calibrations needed to account for the change to avoid skewing our derived temperatures. Specifically, we took a second temperature calibration at 6% higher salt concentration and interpolated between the two calibrations based on the expected concentration increase over time. To determine if the same correction is necessary for sodium perchlorate solutions, we used a 4.24M solution for a test calibration, but found that the spectral shape was relatively insensitive to the concentration change. Corrections to the derived temperatures were less than 0.1 K, much smaller than the precision of the temperature derivation. Therefore we simply used 4M calibration curves for all data.
Evaporative Cooling Model:
The discrete evaporative cooling model used to interpret our temperature data has been described in detail previously (2, 3, 15), The model divides the droplet into 20 concentric spherical shells, each with its own temperature. The calculation is performed in two steps; in the first the outermost shell is allowed to evaporate and therefore cool, and in the second step heat is propagated outwards from the inner shells according to the

43
thermal diffusion equation. This allows an accurate representation of the surface temperature of the droplet. Mass loss from the evaporation process is also taken into account, and all shells are re-sized accordingly. The process is then iterated. We determine eγ by matching the predicted cooling rate from the model to that observed in
our experiments. The cooling rate of outermost shell of the modeled droplet can be expressed as
ρπγ
)(
3
2 31
30
20
rr
r
C
H
mkT
p
dt
dT
p
vapsate −
∆= , (3)
where satp is the saturation vapor pressure, m is the mass of an evaporating molecule, k
is the Boltzmann constant, T is the temperature in Kelvin, vapH∆ is the enthalpy of
vaporization (44.4 kJ/mol), pC is the specific heat capacity of the solution, 0r and 1r are
the outer and inner radii of the outermost shell, respectively, and ρ is the density of the solution (15). The saturation vapor pressure of the 4M sodium perchlorate solution was determined using the empirical temperature-dependent equation for the vapor pressure of pure water presented by Murphy and Koop (25) and applying a water activity of 0.8308 as reported by Djogic and Branica (estimated to be accurate to ± 0.001) (26). The water activity was assumed to be constant with temperature, i.e. the temperature dependence of the vapor pressure was assumed to be of the same form as that for pure water in the formula of Murphy and Koop. The specific heat of the solution was calculated using the formula of Roth, Wolf and Wolf (27). The density of the solution was measured to be 1.580 g/ml. Heat is then allowed to flow into the outermost shell from the shell underneath according to the thermal diffusion equation
dr
dTA
dt
dQ κ−= , (4)
where dQ/dt is the amount of heat transferred per time step, κ is the thermal conductivity of the solution, A is the surface area of the inner shell, and dT/dr is the temperature difference between the two shells. A thermal conductivity of 0.5404 W m-1 K-1 was calculated for 4M sodium perchlorate solution using the formula of Riedel (28). The thermal diffusion process is repeated iteratively for all shells, before moving to the next time step and allowing the outermost shell to evaporate again. The volume-averaged temperature is also calculated; this is the value that is compared to experiment. In our study of ammonium sulfate, we discussed the validity of this comparison in detail; in short, the Raman response from the droplet is not uniform in space, but empirical tests of our model indicate that the volume-averaged temperature is a good approximation of the experimental data (15). The only tunable parameter in the model is eγ , which is adjusted
until the modeled temperatures match experimental values.
4-3 Results:
Seven cooling curves were measured on six different droplet sizes in the range of 9.15 µm to 14.05 µm radius. Unlike our previous measurements of ammonium sulfate solution, no icicles were observed to grow into the interaction region for sodium perchlorate solutions, meaning that interference from solid icicles both directly and

44
indirectly (by providing a collision surface and enabling condensation back on the droplets) was not an issue (15). This is likely due to a difference in salt crystal structure upon freezing of the solution.
The average eγ value from all data is 0.47 ± 0.02 (95% confidence interval) with
a standard deviation of 0.03. The high precision of the 95% confidence interval arises from very high consistency across data sets, despite individual temperature measurements being slightly less precise than in our previous experiments. This value of eγ is lower by
~25% from our value reported for pure H2O (3) and is outside of the uncertainty range defined either as 95% confidence intervals (0.62 ± 0.03 for H2O vs. 0.47 ± 0.02 for sodium perchlorate solution) or 2 standard deviations (0.62 ± 0.09 for H2O vs. 0.47 ± 0.06 for sodium perchlorate solution). An example cooling curve is shown in Figure (2), for 12.05 µm radius droplets, with a eγ value of 0.48. Also shown are the representative
cooling curves for 62.0=eγ , the value we measured previously for pure H2O, as well as
1=eγ for contrast. As in our previous studies, the best fit to the data arises when there is
no assumed temperature dependence to eγ (2, 3, 15).
4-4 Discussion:
The eγ value of 0.47 ± 0.02 found in this study for 4M sodium perchlorate
solution suggests that the perchlorate ion has a small but measurable effect on the evaporation kinetics of liquid water. To ensure that the observed decrease in eγ is not
due to incorrect parameters in our evaporative cooling model, we performed several tests of the sensitivity of the model output to the input constants. The enthalpy of vaporization used is that of pure water; in highly concentrated salt solutions this value might be expected to change. In the absence of data for sodium perchlorate solution, we used the work of Apelblat and Korin on other saturated solutions as a guide (29-31). Assuming a ~4% increase in enthalpy alters the model output by <0.5%. We also tested a temperature-dependent value for the enthalpy by allowing the enthalpy to increase linearly from 44.4 kJ/mol at 295 K to the measured value of 46.467 kJ/mol at 240 K reported by Murphy and Koop (25). This resulted in less <0.1% change in model output. Using the 3 m NaCl data of Murphy and Koop as a guide, we assumed a 5% increase in heat capacity of the solution when cooled from 295 K to 240 K, which changed the model output by ~1%. This change is well within the precision of our temperature derivations. We also tested temperature-dependent values for density and thermal conductivity, using the empirical formulas of Hare and Sorensen and the International Association For the Properties of Water and Steam, respectively (32, 33). We modified these pure water formulas by applying our measured density and calculated thermal conductivity, but retained the form of the temperature dependence, and found <0.1% change in model output in both cases.
We also considered whether the evaporation of the droplets might produce higher surface concentrations of the perchlorate ions, if the ions are unable to diffuse away from the interface quickly enough. This would result in a higher surface concentration in our experiments than would be expected from a 4M solution. A 12.05 µm radius droplet is expected to shrink by ~150 nm over ~800 µs during our measurements. Using the

45
diffusion coefficient of 91047.1 −× m2s-1 measured for the perchlorate ion in saturated ammonium perchlorate solution by Hiquily and Clifton (34), we estimate that a perchlorate ion would diffuse ~1 µm within this same time period. The diffusion coefficient is expected to decrease as the droplet cools, but it is unlikely to be lowered to such an extent as to allow for concentrating of the perchlorate ions in the surface layer due to evaporation.
Another concern is whether our results could be affected by organic impurities in the salt crystals. Such impurities would likely be surface active and have been theorized lower the evaporation rate of water (4). Such impurities, however, would also be expected to be present in our previous study of ammonium sulfate solution, in which we observed no change in eγ relative to pure water (15). We also observed no difference in
solutions made from different batches of sodium perchlorate, which might be expected to show different amounts of impurities. Moreover, impurities would partition to the surface of the solutions when stored in bottles, but solutions were loaded into the syringe pump from the bottom of the bottles, implying that any surface active impurities would not enter the pumping system. Therefore we believe that any effects from such impurities are significantly smaller than the precision of our derived temperatures.
It seems likely, then, that the reduced eγ is due to the surface enhancement of the
perchlorate ion, but the exact nature of the kinetic effect is not immediately clear. While experimental studies of sodium perchlorate solutions have shown evidence for a strong surface partitioning of the perchlorate ion, they were unable to provide quantitative information about the expected surface concentration relative to that of the bulk (18, 23). If we assume a surface concentration of 4M, there should be one perchlorate ion for every 11.24 water molecules. If each water molecule at the air-water interface is assumed to have three hydrogen bonds to other species in the liquid, then one in every 3.74 water molecules, or 26.7%, can be expected to be directly interacting with a perchlorate ion. Theoretical studies of hydration of the perchlorate ion show a large hydration radius, suggesting that the perchlorate ion forms relatively weak hydrogen bonds with water molecules (35, 36). This is supported by attenuated total reflectance-Fourier transform infra-red (FTIR-ATR) measurements, which indicate weaker interactions between water molecules and perchlorate ions than for water molecules interacting with other water molecules (37). Ultrafast measurements of solvated perchlorate ions, however, indicate that while the interactions between the ions and water molecules are weak, the orientational correlation time is significantly slowed for water molecules within the perchlorate solvation shell (38, 39). Our own transition state theory (TST) model of water evaporation suggested that the evaporation kinetics are primarily influenced by the hindered translational and librational motions at the liquid surface, although the specific mechanism could not be determined (40). If perchlorate ions hinder the librational motions of surface water molecules, they may slow or completely inhibit evaporation for these molecules, leading to a lower value for eγ relative to pure water, since fewer
evaporation attempts would succeed. The results of the present study do show, however, that inorganic solutes can
indeed affect the evaporation kinetics of liquid water. Further studies on other inorganic solutes will likely prove interesting, although the small change observed in the present study suggests that ion effects are not necessarily strong and may be undetectable in

46
many cases, even with high precision technique. Even so, studies of other surface-active ions, such as thiocyanate, will help determine whether surface activity is the determining factor for kinetic effects on evaporation or if other specific ion effects are involved. Additionally, studies on acidic and basic solutions could prove insightful, as there is considerable debate over the role played by the hydronium and hydroxide ions at the air-water interface (41-43). Effects of hydronium on evaporation would also be pertinent to the atmosphere, where low pH is common in liquid aerosol. It seems likely, however, that the largest determinant for vapor-liquid exchange kinetics in the atmosphere is the presence of surface active organic species on droplets (13, 14). New experimental techniques are needed to examine the effects of such coatings on evaporation with precision.
4-5 Conclusions:
Using liquid microjets in a free evaporation regime, we have measured the evaporation coefficient of 4M sodium perchlorate solution to be 0.48 ± 0.02, roughly 25% smaller than our pure water value of 0.62 ± 0.09.(3) No such change was observed in our previous study of ammonium sulfate solution (15). The smaller evaporation coefficient is likely due to the expected surface enhancement of the perchlorate ion, allowing direct interactions between perchlorate and evaporating water molecules. The perchlorate ion has been shown to affect the orientational correlation time for water molecules within its solvation shell (38, 39), suggesting that the ion may interfere with the librational motions of surface water molecules, leading to an inhibition of evaporation. Further theoretical work is needed to examine this possibility. While the perchlorate ion itself is not relevant in the atmosphere, its effects on evaporation suggest that certain inorganic solutes can alter the evaporation and condensation kinetics of water, especially if the solutes are expected to be enhanced in concentration at the air-water interface. Acknowledgements: This work was supported by National Science Foundation Grant ATM 0639847 and the Director, Office of Science, Office of Basic Energy Sciences, of the U.S. Department of Energy under Contract DE-AC02-05CH11231.

47
Figure 1. a) Representative spectra used to generate a temperature calibration curve. The spectral feature at ~3580 cm-1 is due to the perchlorate anion. The full calibration curve was constructed from 24 spectra taken at varying temperatures between 273.35 K and 324.95 K (both extremes are shown). The dashed line indicates the frequency *ω = 3422.6 cm-1 where the spectra were split in order to construct the calibration curve. b) The calibration curve constructed from the spectra. The red line shows the quadratic fit used for the calibration curve. The dashed blue line shows a linear fit, for contrast. The quadratic fit was used due to better self-reproduction of the calibration temperatures.

48
Figure 2. A representative cooling curve for 12.05 µm radius droplets. The solid red line is the fit from the evaporative cooling model, yielding a eγ value of 0.48 in this case.
The dashed line is what the modeled cooling curve would be for 62.0=eγ , the value we
obtained previously for pure H2O. The green line is the modeled cooling curve for 1=eγ , shown for contrast.

49
References: 1. Forster P, V. Ramaswamy, P. Artaxo, T. Berntsen, R. Betts, D.W. Fahey, J.
Haywood, J. Lean, D.C. Lowe, G. Myhre, J. Nganga, R. Prinn, G. Raga M S a R V D (2007) in Climate Change 2007: The Physical Science Basis. Contribution of Working Group I to the Fourth Assessment Report of the Intergovernmental Panel on Climate Change, ed. Solomon, S., D. Qin, M. Manning, Z. Chen, M. Marquis, K.B. Averyt, M.Tignor and H.L. Miller (Cambridge University Press, Cambridge).
2. Drisdell W S, et al. (2008) Determination of the evaporation coefficient of D2O. Atmos. Chem. Phys. 8: 6699.
3. Smith J D, et al. (2006) Raman thermometry measurements of free evaporation from liquid water droplets. Journal Of The American Chemical Society 128: 12892-12898.
4. Eames I W, Marr N J, Sabir H (1997) The evaporation coefficient of water: A review. International Journal Of Heat And Mass Transfer 40: 2963-2973.
5. Marek R, Straub J (2001) Analysis of the evaporation coefficient and the condensation coefficient of water. International Journal Of Heat And Mass Transfer 44: 39-53.
6. Li Y Q, et al. (2001) Mass and thermal accommodation coefficients of H2O(g) on liquid water as a function of temperature. Journal Of Physical Chemistry A 105: 10627-10634.
7. Davidovits P, et al. (2006) Mass accommodation and chemical reactions at gas-liquid interfaces. Chemical Reviews 106: 1323-1354.
8. Winkler P M, et al. (2006) Condensation of water vapor: Experimental determination of mass and thermal accommodation coefficients. Journal Of Geophysical Research-Atmospheres 111.
9. Zientara M, Jakubczyk D, Kolwas K, Kolwas M (2008) Temperature Dependence of the Evaporation Coefficient of Water in Air and Nitrogen under Atmospheric Pressure: Study in Water Droplets. J. Phys. Chem. A 112: 5152-5158.
10. Cappa C D, et al. (2005) Isotope fractionation of water during evaporation without condensation. Journal Of Physical Chemistry B 109: 24391-24400.
11. Fukuta N, Myers M N (2007) Simultaneous measurement of condensation and thermal accommodation coefficients for cloud droplet growth in due consideration of a new moving surface-boundary effect. Journal Of The Atmospheric Sciences 64: 955-968.
12. Chuang P Y, Charlson R J, Seinfeld J H (1997) Kinetic limitations on droplet formation in clouds. Nature 390: 594-596.
13. Ruehl C R, Chuang P Y, Nenes A (2008) How quickly do cloud droplets form on atmospheric particles? Atmos. Chem. Phys. 8: 1043.
14. Shantz N C, et al. (2010) Slower CCN growth kinetics of anthropogenic aerosol compared to biogenic aerosol observed at a rural site. Atmos. Chem. Phys. 10: 299.
15. Drisdell W S, Saykally R J, Cohen R C (2009) On the evaporation of ammonium sulfate solution. Proceedings Of The National Academy Of Sciences Of The United States Of America 106: 18897-18901.

50
16. Zhang Q, et al. (2007) Ubiquity and dominance of oxygenated species in organic aerosols in anthropogenically-influenced Northern Hemisphere midlatitudes. Geophysical Research Letters 34.
17. Gopalakrishnan S, Jungwirth P, Tobias D J, Allen H C (2005) Air-liquid interfaces of aqueous solutions containing ammonium and sulfate: Spectroscopic and molecular dynamics studies. Journal Of Physical Chemistry B 109: 8861-8872.
18. Pegram L M, Record M T (2007) Hofmeister Salt Effects on Surface Tension Arise from Partitioning of Anions and Cations between Bulk Water and the Air / Water Interface. The Journal of Physical Chemistry B 111: 5411-5417.
19. Gopalakrishnan S, et al. (2006) Vibrational spectroscopic studies of aqueous interfaces: Salts, acids, bases, and nanodrops. Chemical Reviews 106: 1155-1175.
20. Thomas J L, Roeselova M, Dang L X, Tobias D J (2007) Molecular dynamics simulations of the solution-air interface of aqueous sodium nitrate. Journal Of Physical Chemistry A 111: 3091-3098.
21. Kido Soule M C, Blower P G, Richmond G L (2007) Effects of atmospherically important solvated ions on organic acid adsorption at the surface of aqueous solutions. Journal of Physical Chemistry B 111: 13703-13713.
22. Otten D E, Petersen P B, Saykally R J (2007) Observation of nitrate ions at the air/water interface by UV-second harmonic generation. Chemical Physics Letters 449: 261-265.
23. Cheng J, Vecitis C D, Hoffmann M R, Colussi A J (2006) Experimental anion affinities for the air/water interface. Journal Of Physical Chemistry B 110: 25598-25602.
24. Walrafen G E (1970) Raman Spectral Studies Of Effects Of Perchlorate Ion On Water Structure. Journal Of Chemical Physics 52: 4176-&.
25. Murphy D M, Koop T (2005) Review of the vapour pressures of ice and supercooled water for atmospheric applications. Quarterly Journal Of The Royal Meteorological Society 131: 1539-1565.
26. Djogic R, Branica M (1993) Study Of Uranyl(Vi) Ion Reduction At Various Ionic Strengths Of Sodium-Perchlorate. Analytica Chimica Acta 281: 291-297.
27. Roth K, Wolf U, Wolf G (1997) A simple method for modelling and prediction of the specific heat and density of aqueous electrolyte solutions. Calphad-Computer Coupling Of Phase Diagrams And Thermochemistry 21: 475-481.
28. Riedel L (1951) Die Wärmeleitfähigkeit von wäßrigen Lösungen starker Elektrolyte. Chemie Ingenieur Technik - CIT 23: 59-64.
29. Apelblat A, Korin E (1998) The vapour pressures of saturated aqueous solutions of sodium chloride, sodium bromide, sodium nitrate, sodium nitrite, potassium iodate, and rubidium chloride at temperatures from 227 K to 323 K. Journal Of Chemical Thermodynamics 30: 59-71.
30. Apelblat A, Korin E (1998) Vapour pressures of saturated aqueous solutions of ammonium iodide, potassium iodide, potassium nitrate, strontium chloride, lithium sulphate, sodium thiosulphate, magnesium nitrate, and uranyl nitrate from T = (278 to 323) K. Journal Of Chemical Thermodynamics 30: 459-471.
31. Apelblat A, Korin E (2002) The vapour pressure of water over saturated solutions of sodium sulfate, calcium bromide, ferric chloride, zinc nitrate, calcium nitrate,

51
and lithium nitrate at temperatures from 278.15 K to 323.15 K. Journal Of Chemical Thermodynamics 34: 1621-1637.
32. Hare D E, Sorensen C M (1987) The Density Of Supercooled Water.2. Bulk Samples Cooled To The Homogeneous Nucleation Limit. Journal Of Chemical Physics 87: 4840-4845.
33. Scheffler K (2008) Revised Release on the IAPS Formulation 1985 for the Thermal Conductivity of Ordinary Water Substance. International Association for the Properties of Water and Steam.
34. Hiquily N, Clifton M J (1984) Diffusion-Coefficient Of Ammonium-Perchlorate In Concentrated Aqueous-Solutions Between 20-Degrees-C And 30-Degrees-C. Journal Of Chemical And Engineering Data 29: 371-373.
35. Conway B E, Ayranci E (1999) Effective ionic radii and hydration volumes for evaluation of solution properties and ionic adsorption. Journal Of Solution Chemistry 28: 163-192.
36. Li C X, Lee H (2000) Density calculation of electrolyte solutions with the solution osmotic pressure. Chemical Engineering Science 55: 655-665.
37. Wei Z F, et al. (2005) Observation of the first hydration layer of isolated cations and anions through the FTIR-ATR difference spectra. Journal Of Physical Chemistry A 109: 1337-1342.
38. Omta A W, Kropman M F, Woutersen S, Bakker H J (2003) Influence of ions on the hydrogen-bond structure in liquid water. Journal Of Chemical Physics 119: 12457-12461.
39. Omta A W, Kropman M F, Woutersen S, Bakker H J (2003) Negligible effect of ions on the hydrogen-bond structure in liquid water. Science 301: 347-349.
40. Cappa C D, et al. (2007) Interpreting the H/D isotope fractionation of liquid water during evaporation without condensation. Journal Of Physical Chemistry C 111: 7011-7020.
41. Petersen P B, Saykally R J (2005) Evidence for an enhanced hydronium concentration at the liquid water surface. Journal Of Physical Chemistry B 109: 7976-7980.
42. Petersen P B, Saykally R J (2008) Is the liquid water surface basic or acidic? Macroscopic vs. molecular-scale investigations. Chemical Physics Letters 458: 255-261.
43. Gray-Weale A, Beattie J K (2009) An explanation for the charge on water's surface. Physical Chemistry Chemical Physics 11: 10994-11005.
51
Chapter 5 – Future Work
In this thesis, we presented measurements of the evaporation coefficient of pure D2O, as well as the coefficient for evaporation of H2O from solutions of ammonium sulfate and sodium perchlorate. We showed that the evaporation coefficient for D2O is identical to that of pure H2O, and used a transition state theory (TST) model to show that this is due to competing energetic and entropic factors (1). We also showed that water evaporating from ammonium sulfate solution, in which the ions are expected to be depleted from the interfacial layer, has the same evaporation coefficient as pure water, whereas water evaporating from sodium perchlorate solution, in which the perchlorate ion is expected to be strongly enhanced in the interfacial layer, has an evaporation coefficient ~25% smaller than that of pure water. Given this result, there are many promising avenues to explore with future experiments. As noted in Chapter 4, the effects of other ions which are expected to be surface active (e.g. thiocyanate or iodide) should be examined. This will help determine whether surface activity is the determinant for kinetic effects on evaporation or if there are other specific ion effects involved. The effects of pH on evaporation rates may also prove interesting, given current debate about whether the hydronium and hydroxide ions are present in the interfacial layer (2-4). Further theoretical study of the evaporation mechanism for liquid water would be very helpful in interpreting experimental data and guiding which systems to examine. As discussed in Chapter 1, the spatial and temporal limitations of theoretical methods such as molecular dynamics (MD) pose problems when examining the evaporation and condensation process for molecular liquids. A newer technique, transition path sampling (TPS), shows promise in this regard, as it is capable of examining rare events by sampling trajectory space rather than modeling the system in real space (5, 6). TPS has been successfully employed in modeling rare event phenomena such as autoionization in liquid water (7), protein folding (8) and nanocrystal structural reorganization (9). Applying TPS to liquid water evaporation would provide critical molecular information on the transition pathway that would allow much better interpretation of our experimental data. There are several other experimental directions which could be explored as well. Other molecular liquids, such as methanol or other alcohols, could be examined, for example. Our technique is currently limited to systems in which Raman thermometry measurements are possible, typically systems with an OH stretch, such as alcohols. The study of mixed systems, such as alcohol/water mixtures, is also possible, but our evaporative cooling model would need to be modified to account for the separate evaporating species and evolving composition of the droplet. It is possible that the CH stretching region of the Raman spectrum could be used as a proxy for the remaining amount of alcohol in an alcohol/water mixture. Changes in the temperature calibration as well as thermal conductivity and density due to compositional changes would need to be accounted for as well. Another mixed system that deserves more study is the mixed H2O/D2O system. Our TST study of evaporation indicated that for mixtures of H2O and D2O, the specific evaporation coefficients of the isotopomers show a dependence on the isotopic composition of the mixture (1). It is theoretically possible for our Raman thermometry

52
technique to be used to determine evaporation coefficients for the individual isotopomers, but the small difference in enthalpy of vaporization for the isotopomers (44.4 kJ/mol for H2O vs. 45.7 kJ/mol for D2O) will make it difficult, given the ±2 K precision of our temperature derivation. Additionally, the temperature calibration would need to take into account as the fact that the isotopic composition would change due to evaporation during measurements, altering the spectrum. The addition of a mass spectrometer to the experimental system to examine the isotopic ratios in the evaporate, as per our earlier study of evaporation (10), could help overcome these difficulties. Finally, the major outstanding question with regard to liquid-vapor exchange kinetics in the atmosphere is quantifying the effects of organic surfactant films in inhibiting mass transport across the liquid-vapor interface (11-13). Unfortunately, conducting such studies with our current experimental apparatus is likely not possible, as the organic coatings would need to be condensed onto the droplets after formation, negating the free evaporation regime upon which the experiments depend. Given our results for sodium perchlorate solution, however, it is possible that even weak, soluble surfactants could inhibit evaporation slightly. Using mixtures of water and short-chain alcohols as discussed above as a starting point, other small organic species of lower volatility could also be mixed with water to examine effects on the evaporation kinetics. It might even be possible to immiscibly mix insoluble organic liquids with water using two syringe pumps, but it is unclear whether this would make stable liquid jets suitable for vacuum studies. Additionally, such immiscibly mixed systems would be difficult to calibrate for Raman thermometry. Futher experimentation in this direction is needed to determine the extent to which our experimental technique can examine such systems.

53
References: 1. Cappa C D, et al. (2007) Interpreting the H/D isotope fractionation of liquid water
during evaporation without condensation. Journal Of Physical Chemistry C 111: 7011-7020.
2. Petersen P B, Saykally R J, Mucha M, Jungwirth P (2005) Enhanced concentration of polarizable anions at the liquid water surface: SHG spectroscopy and MD simulations of sodium thiocyanide. Journal Of Physical Chemistry B 109: 10915-10921.
3. Petersen P B, Saykally R J (2008) Is the liquid water surface basic or acidic? Macroscopic vs. molecular-scale investigations. Chemical Physics Letters 458: 255-261.
4. Gray-Weale A, Beattie J K (2009) An explanation for the charge on water's surface. Physical Chemistry Chemical Physics 11: 10994-11005.
5. Bolhuis P G, Chandler D, Dellago C, Geissler P L (2002) Transition path sampling: Throwing ropes over rough mountain passes, in the dark. Annual Review Of Physical Chemistry 53: 291-318.
6. Dellago C, Bolhuis P G, Geissler P L (2002) in Advances In Chemical Physics, Vol 123 (John Wiley & Sons Inc, New York), Vol. 123, pp. 1-78.
7. Geissler P L, et al. (2001) Autoionization in liquid water. Science 291: 2121-2124.
8. Juraszek J, Bolhuis P G (2006) Sampling the multiple folding mechanisms of Trp-cage in explicit solvent. Proceedings Of The National Academy Of Sciences Of The United States Of America 103: 15859-15864.
9. Grunwald M, Dellago C (2009) Nucleation and Growth in Structural Transformations of Nanocrystals. Nano Letters 9: 2099-2102.
10. Cappa C D, et al. (2005) Isotope fractionation of water during evaporation without condensation. Journal Of Physical Chemistry B 109: 24391-24400.
11. Shantz N C, Leaitch W R, Caffrey P F (2003) Effect of organics of low solubility on the growth rate of cloud droplets. Journal Of Geophysical Research-Atmospheres 108.
12. Ruehl C R, Chuang P Y, Nenes A (2008) How quickly do cloud droplets form on atmospheric particles? Atmos. Chem. Phys. 8: 1043.
13. Shantz N C, et al. (2010) Slower CCN growth kinetics of anthropogenic aerosol compared to biogenic aerosol observed at a rural site. Atmos. Chem. Phys. 10: 299.