Embed Size (px)
Citation preview
944|Int. J. of Multidisciplinary and Current research, Sept/Oct 2014
International Journal of Multidisciplinary and Current Research
Research Article
ISSN: 2321-3124
Available at: http://ijmcr.com
Measurements of Air & Noise Pollutants Maaz Ahmed Khan, Shahzad Nasim
and Sarwar Wasi
Department of Computer Science & Technology, Dadabhoy Institute of Higher Education, Karachi Accepted 20 Sept 2014, Available online 01 Oct 2014, Vol.2 (Sept/Oct 2014 issue)
Abstract Environmental issues in Pakistan threaten the population’s physical situation and have been upsetting the equilibrium linking financial progress and ecological safety. Environment is now becoming a real threat for our exports and we should solve this issue immediately. We must try to enforce the environmental regulation policies and self- monitoring system. Pollutants Calculator is a pollution monitoring system that monitors and records the pollution and provides preventive measures and solutions accordingly. It is a safety program that provides an overview about the major pollutants of environmental pollution. Pollutants Calculator contains pollution meter which receives the values for pollutants and calculates the average pollution, and displays the levels of health concern with different color codes according to the average calculated value of pollution at any time. Pollutants Calculator comprises of Desktop Application, Mobile Application and Website. The website delivers detailed understanding and awareness for various kinds of environmental pollution and their adverse effects on the living things (human, flora and fauna), non-living things (buildings, stone materials and monuments) and the eco-system Keywords: Pollutants Calculator, Pollution, Pollutants. 1. Introduction 1.1 Air Pollution Air pollution is the introduction into the atmosphere of chemicals, particulate matter, or biological that cause discomfort, disease, or death to humans, damage other living organisms such as food crops, or damage the natural environment or environment. Pollutants are basically the substances that cause pollutions. Primary pollutants are the pollutant that pollutes the environment by pumping it directly for example sulfur dioxide and carbon monoxide. When the primary pollutants react in the atmosphere it creates secondary pollutants for e.g. photochemical smog.
1.2 Air Quality Index
The AQI is an index for reporting daily air quality. It shows the level of pollutants in our air. AQI is divided into six categories namely good, moderate, unhealthy for sensitive groups, unhealthy, very unhealthy & hazardous.
1.3 Noise Pollution & Sources of Noise Pollution It is basically the unnecessary sound in our surrounding. Noise pollution derives from several sources like.
Road Traffic Noise
Aircraft Noise
Noise from Railroads
Construction Noise
Noise in Industry
Noise from Consumer Products
2. Methodology
The project is developed on two platforms simultaneously
Microsoft Visual Studio 2010
Eclipse
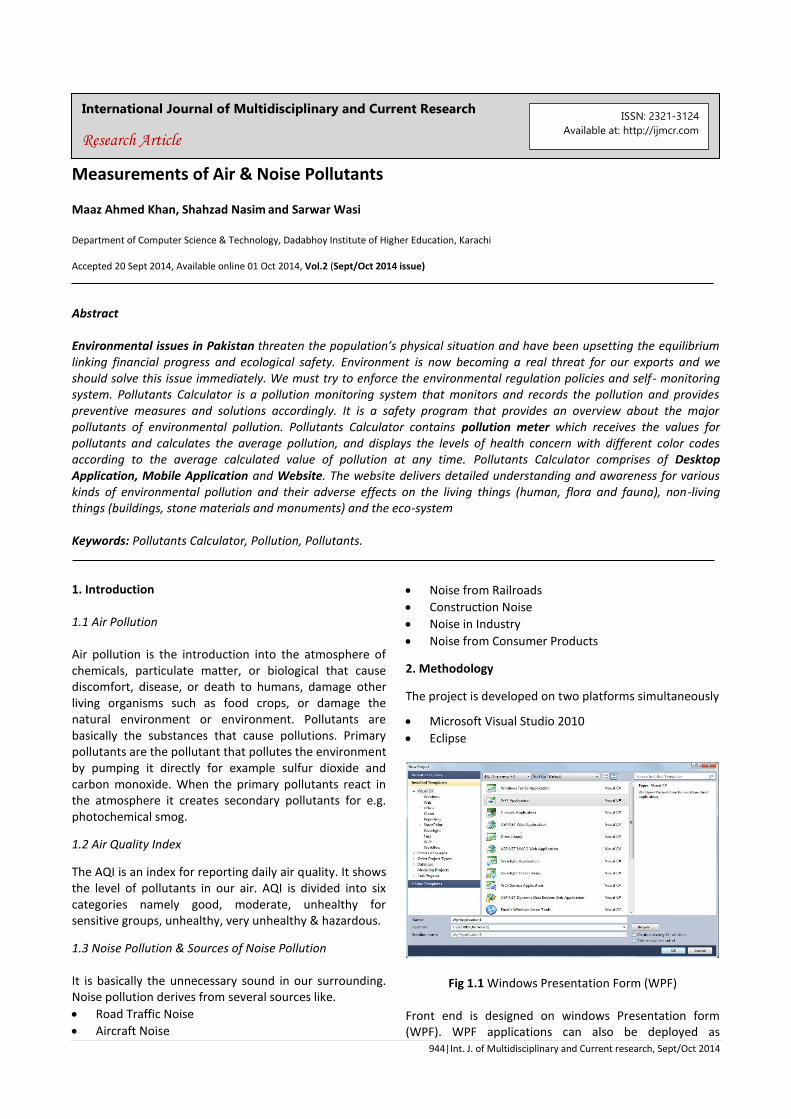
Fig 1.1 Windows Presentation Form (WPF) Front end is designed on windows Presentation form (WPF). WPF applications can also be deployed as
Maaz Ahmed Khan et al Measurements of Air & Noise Pollutants
945 | Int. J. of Multidisciplinary and Current research, Sept/Oct 2014
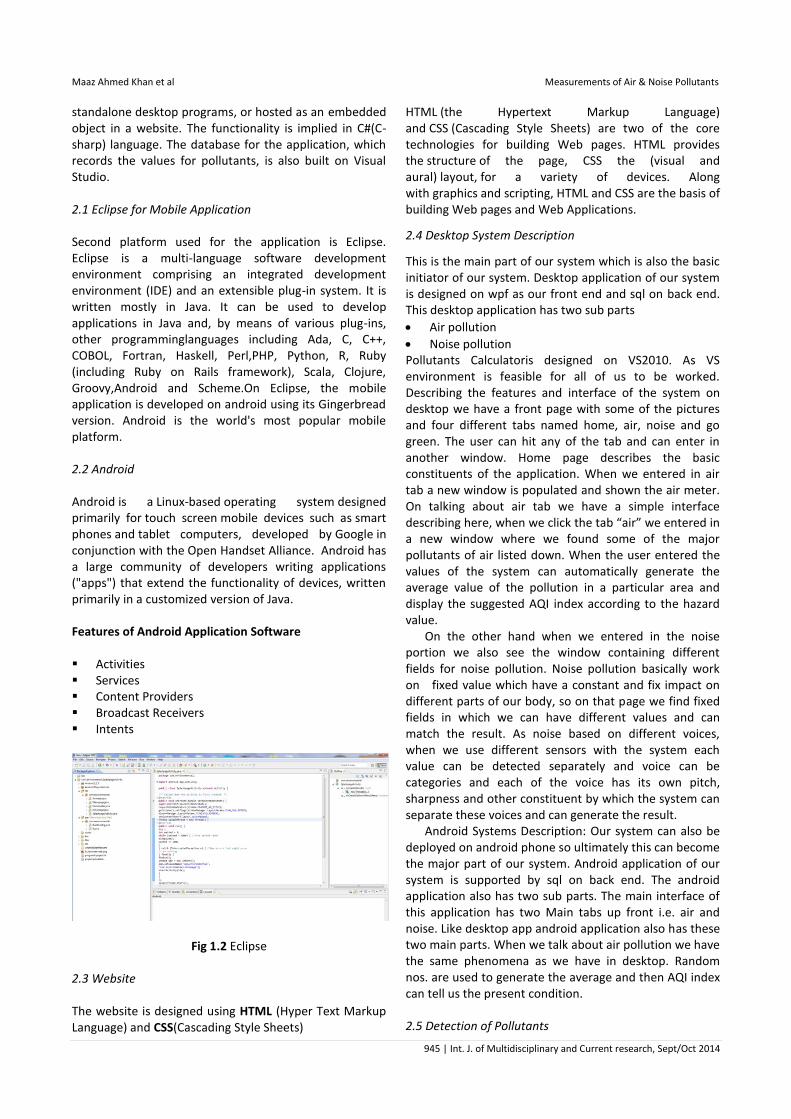
standalone desktop programs, or hosted as an embedded object in a website. The functionality is implied in C#(C-sharp) language. The database for the application, which records the values for pollutants, is also built on Visual Studio. 2.1 Eclipse for Mobile Application Second platform used for the application is Eclipse. Eclipse is a multi-language software development environment comprising an integrated development environment (IDE) and an extensible plug-in system. It is written mostly in Java. It can be used to develop applications in Java and, by means of various plug-ins, other programminglanguages including Ada, C, C++, COBOL, Fortran, Haskell, Perl,PHP, Python, R, Ruby (including Ruby on Rails framework), Scala, Clojure, Groovy,Android and Scheme.On Eclipse, the mobile application is developed on android using its Gingerbread version. Android is the world's most popular mobile platform. 2.2 Android Android is a Linux-based operating system designed primarily for touch screen mobile devices such as smart phones and tablet computers, developed by Google in conjunction with the Open Handset Alliance. Android has a large community of developers writing applications ("apps") that extend the functionality of devices, written primarily in a customized version of Java. Features of Android Application Software Activities Services Content Providers Broadcast Receivers Intents
Fig 1.2 Eclipse 2.3 Website The website is designed using HTML (Hyper Text Markup Language) and CSS(Cascading Style Sheets)
HTML (the Hypertext Markup Language) and CSS (Cascading Style Sheets) are two of the core technologies for building Web pages. HTML provides the structure of the page, CSS the (visual and aural) layout, for a variety of devices. Along with graphics and scripting, HTML and CSS are the basis of building Web pages and Web Applications.
2.4 Desktop System Description
This is the main part of our system which is also the basic initiator of our system. Desktop application of our system is designed on wpf as our front end and sql on back end. This desktop application has two sub parts
Air pollution
Noise pollution Pollutants Calculatoris designed on VS2010. As VS environment is feasible for all of us to be worked. Describing the features and interface of the system on desktop we have a front page with some of the pictures and four different tabs named home, air, noise and go green. The user can hit any of the tab and can enter in another window. Home page describes the basic constituents of the application. When we entered in air tab a new window is populated and shown the air meter. On talking about air tab we have a simple interface describing here, when we click the tab “air” we entered in a new window where we found some of the major pollutants of air listed down. When the user entered the values of the system can automatically generate the average value of the pollution in a particular area and display the suggested AQI index according to the hazard value. On the other hand when we entered in the noise portion we also see the window containing different fields for noise pollution. Noise pollution basically work on fixed value which have a constant and fix impact on different parts of our body, so on that page we find fixed fields in which we can have different values and can match the result. As noise based on different voices, when we use different sensors with the system each value can be detected separately and voice can be categories and each of the voice has its own pitch, sharpness and other constituent by which the system can separate these voices and can generate the result. Android Systems Description: Our system can also be deployed on android phone so ultimately this can become the major part of our system. Android application of our system is supported by sql on back end. The android application also has two sub parts. The main interface of this application has two Main tabs up front i.e. air and noise. Like desktop app android application also has these two main parts. When we talk about air pollution we have the same phenomena as we have in desktop. Random nos. are used to generate the average and then AQI index can tell us the present condition. 2.5 Detection of Pollutants
Maaz Ahmed Khan et al Measurements of Air & Noise Pollutants
946 | Int. J. of Multidisciplinary and Current research, Sept/Oct 2014
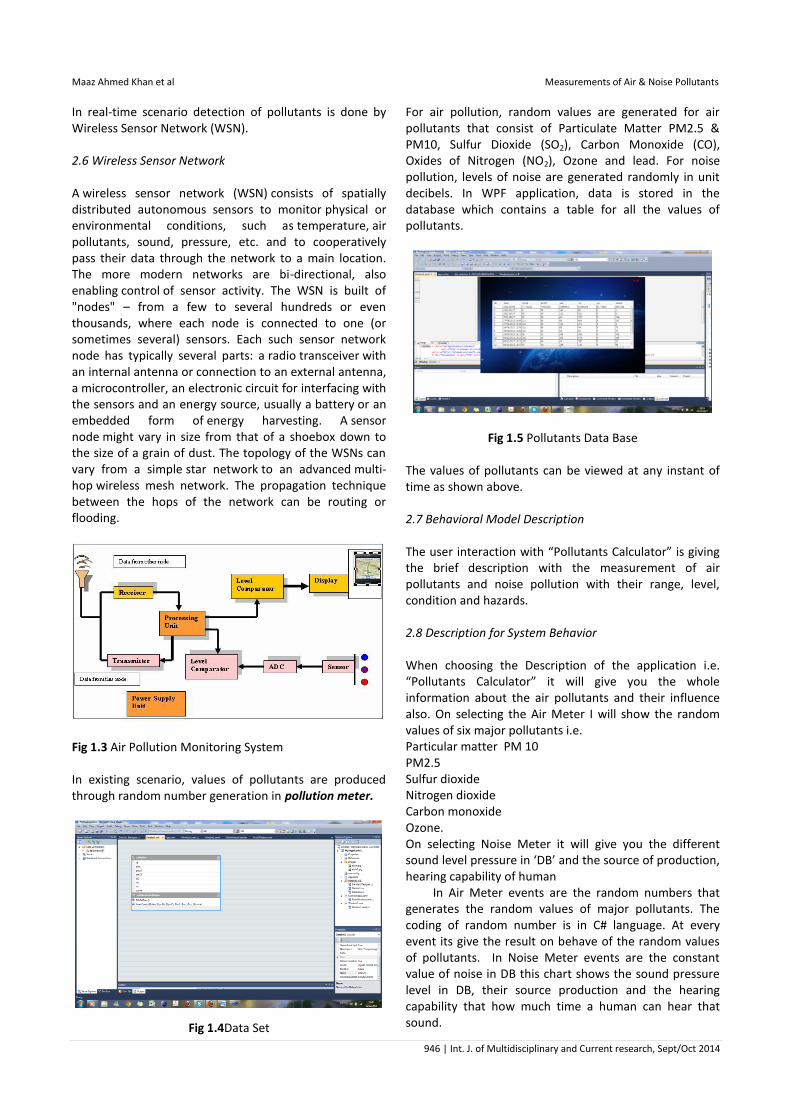
In real-time scenario detection of pollutants is done by Wireless Sensor Network (WSN). 2.6 Wireless Sensor Network A wireless sensor network (WSN) consists of spatially distributed autonomous sensors to monitor physical or environmental conditions, such as temperature, air pollutants, sound, pressure, etc. and to cooperatively pass their data through the network to a main location. The more modern networks are bi-directional, also enabling control of sensor activity. The WSN is built of "nodes" – from a few to several hundreds or even thousands, where each node is connected to one (or sometimes several) sensors. Each such sensor network node has typically several parts: a radio transceiver with an internal antenna or connection to an external antenna, a microcontroller, an electronic circuit for interfacing with the sensors and an energy source, usually a battery or an embedded form of energy harvesting. A sensor node might vary in size from that of a shoebox down to the size of a grain of dust. The topology of the WSNs can vary from a simple star network to an advanced multi-hop wireless mesh network. The propagation technique between the hops of the network can be routing or flooding.
Fig 1.3 Air Pollution Monitoring System In existing scenario, values of pollutants are produced through random number generation in pollution meter.
Fig 1.4Data Set
For air pollution, random values are generated for air pollutants that consist of Particulate Matter PM2.5 & PM10, Sulfur Dioxide (SO2), Carbon Monoxide (CO), Oxides of Nitrogen (NO2), Ozone and lead. For noise pollution, levels of noise are generated randomly in unit decibels. In WPF application, data is stored in the database which contains a table for all the values of pollutants.
Fig 1.5 Pollutants Data Base The values of pollutants can be viewed at any instant of time as shown above. 2.7 Behavioral Model Description The user interaction with “Pollutants Calculator” is giving the brief description with the measurement of air pollutants and noise pollution with their range, level, condition and hazards. 2.8 Description for System Behavior When choosing the Description of the application i.e. “Pollutants Calculator” it will give you the whole information about the air pollutants and their influence also. On selecting the Air Meter I will show the random values of six major pollutants i.e. Particular matter PM 10 PM2.5 Sulfur dioxide Nitrogen dioxide Carbon monoxide Ozone. On selecting Noise Meter it will give you the different sound level pressure in ‘DB’ and the source of production, hearing capability of human In Air Meter events are the random numbers that generates the random values of major pollutants. The coding of random number is in C# language. At every event its give the result on behave of the random values of pollutants. In Noise Meter events are the constant value of noise in DB this chart shows the sound pressure level in DB, their source production and the hearing capability that how much time a human can hear that sound.
Maaz Ahmed Khan et al Measurements of Air & Noise Pollutants
947 | Int. J. of Multidisciplinary and Current research, Sept/Oct 2014
Fig 1.6 Noise Sources & Perception 2.9 Active Mode
In this mode user will be interacting with the application i.e. Pollutants Calculator. The user wants to know the air pollutants in the environment and noise pollution. In Air Pollution, the major six pollutants show in the application page, give the random values with the minimum and maximum range of air quality condition also with the color and hazards. In Noise Pollution, the application gives the sound pressure level and the sound source generation and also the hearing capability of that sound in human.
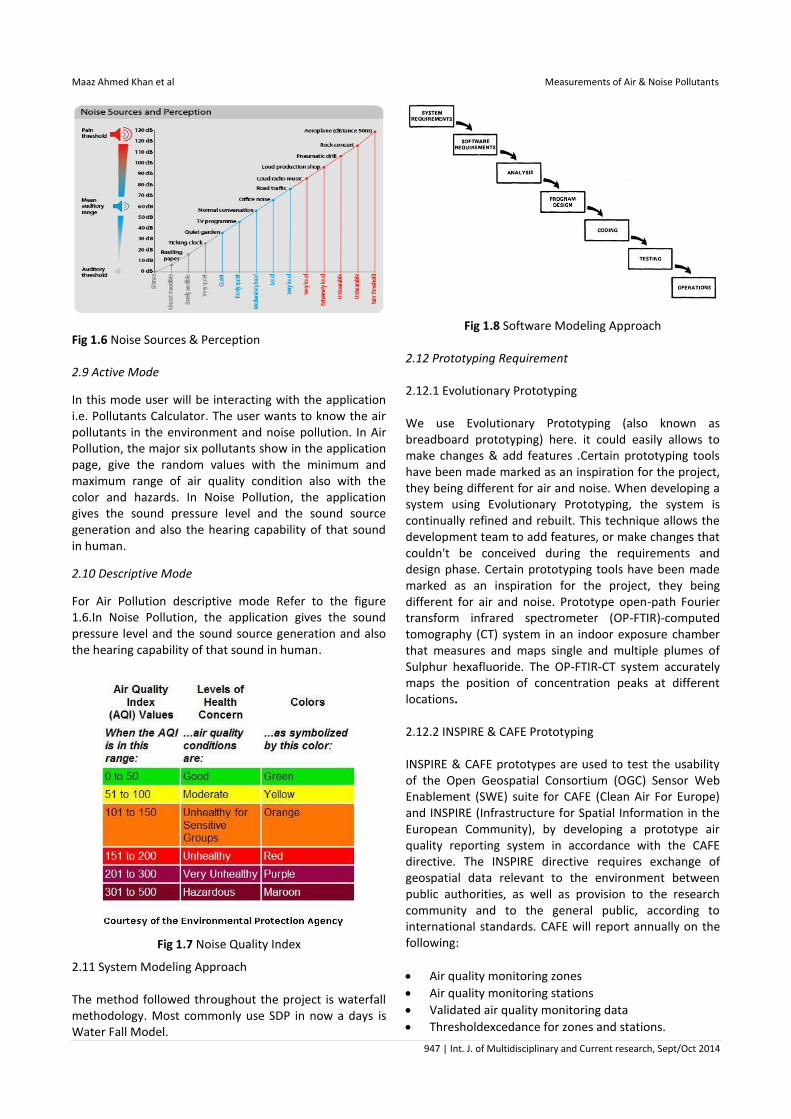
2.10 Descriptive Mode
For Air Pollution descriptive mode Refer to the figure 1.6.In Noise Pollution, the application gives the sound pressure level and the sound source generation and also the hearing capability of that sound in human.
Fig 1.7 Noise Quality Index
2.11 System Modeling Approach The method followed throughout the project is waterfall methodology. Most commonly use SDP in now a days is Water Fall Model.
Fig 1.8 Software Modeling Approach 2.12 Prototyping Requirement 2.12.1 Evolutionary Prototyping We use Evolutionary Prototyping (also known as breadboard prototyping) here. it could easily allows to make changes & add features .Certain prototyping tools have been made marked as an inspiration for the project, they being different for air and noise. When developing a system using Evolutionary Prototyping, the system is continually refined and rebuilt. This technique allows the development team to add features, or make changes that couldn't be conceived during the requirements and design phase. Certain prototyping tools have been made marked as an inspiration for the project, they being different for air and noise. Prototype open-path Fourier transform infrared spectrometer (OP-FTIR)-computed tomography (CT) system in an indoor exposure chamber that measures and maps single and multiple plumes of Sulphur hexafluoride. The OP-FTIR-CT system accurately maps the position of concentration peaks at different locations. 2.12.2 INSPIRE & CAFE Prototyping INSPIRE & CAFE prototypes are used to test the usability of the Open Geospatial Consortium (OGC) Sensor Web Enablement (SWE) suite for CAFE (Clean Air For Europe) and INSPIRE (Infrastructure for Spatial Information in the European Community), by developing a prototype air quality reporting system in accordance with the CAFE directive. The INSPIRE directive requires exchange of geospatial data relevant to the environment between public authorities, as well as provision to the research community and to the general public, according to international standards. CAFE will report annually on the following:
Air quality monitoring zones
Air quality monitoring stations
Validated air quality monitoring data
Thresholdexcedance for zones and stations.
Maaz Ahmed Khan et al Measurements of Air & Noise Pollutants
948 | Int. J. of Multidisciplinary and Current research, Sept/Oct 2014
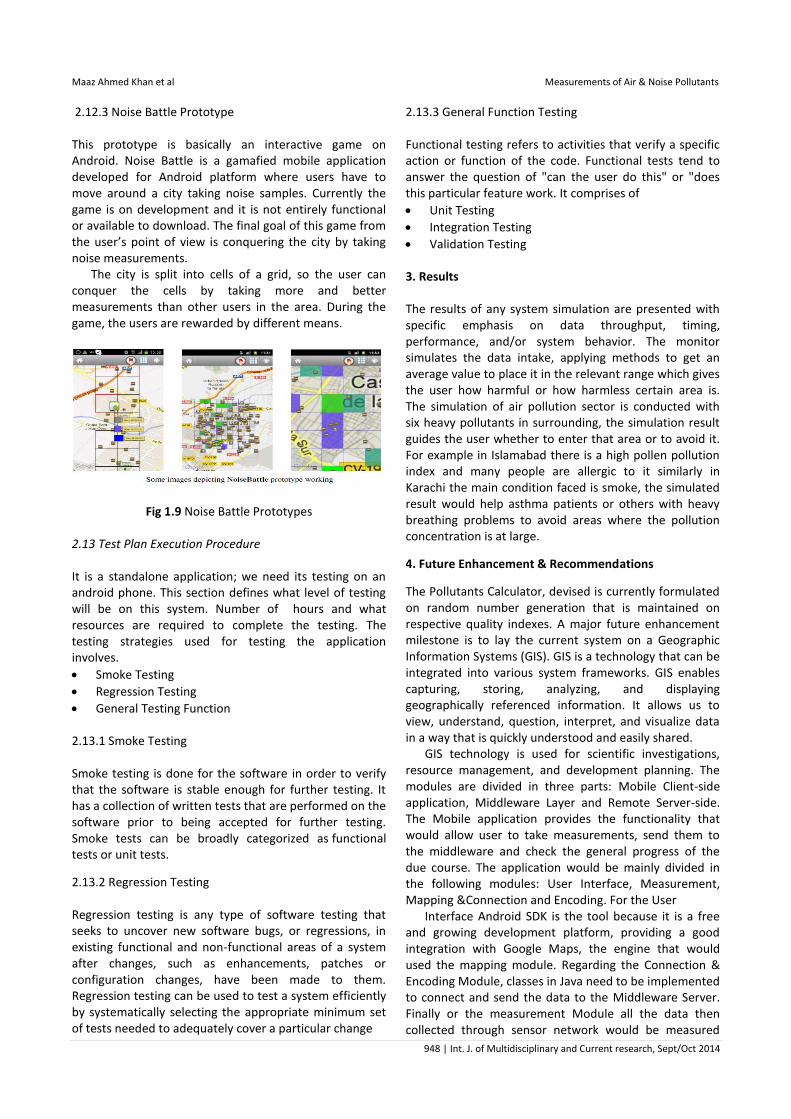
2.12.3 Noise Battle Prototype This prototype is basically an interactive game on Android. Noise Battle is a gamafied mobile application developed for Android platform where users have to move around a city taking noise samples. Currently the game is on development and it is not entirely functional or available to download. The final goal of this game from the user’s point of view is conquering the city by taking noise measurements. The city is split into cells of a grid, so the user can conquer the cells by taking more and better measurements than other users in the area. During the game, the users are rewarded by different means.
Fig 1.9 Noise Battle Prototypes 2.13 Test Plan Execution Procedure It is a standalone application; we need its testing on an android phone. This section defines what level of testing will be on this system. Number of hours and what resources are required to complete the testing. The testing strategies used for testing the application involves.
Smoke Testing
Regression Testing
General Testing Function 2.13.1 Smoke Testing Smoke testing is done for the software in order to verify that the software is stable enough for further testing. It has a collection of written tests that are performed on the software prior to being accepted for further testing. Smoke tests can be broadly categorized as functional tests or unit tests.
2.13.2 Regression Testing Regression testing is any type of software testing that seeks to uncover new software bugs, or regressions, in existing functional and non-functional areas of a system after changes, such as enhancements, patches or configuration changes, have been made to them. Regression testing can be used to test a system efficiently by systematically selecting the appropriate minimum set of tests needed to adequately cover a particular change
2.13.3 General Function Testing Functional testing refers to activities that verify a specific action or function of the code. Functional tests tend to answer the question of "can the user do this" or "does this particular feature work. It comprises of
Unit Testing
Integration Testing
Validation Testing 3. Results The results of any system simulation are presented with specific emphasis on data throughput, timing, performance, and/or system behavior. The monitor simulates the data intake, applying methods to get an average value to place it in the relevant range which gives the user how harmful or how harmless certain area is. The simulation of air pollution sector is conducted with six heavy pollutants in surrounding, the simulation result guides the user whether to enter that area or to avoid it. For example in Islamabad there is a high pollen pollution index and many people are allergic to it similarly in Karachi the main condition faced is smoke, the simulated result would help asthma patients or others with heavy breathing problems to avoid areas where the pollution concentration is at large.
4. Future Enhancement & Recommendations
The Pollutants Calculator, devised is currently formulated on random number generation that is maintained on respective quality indexes. A major future enhancement milestone is to lay the current system on a Geographic Information Systems (GIS). GIS is a technology that can be integrated into various system frameworks. GIS enables capturing, storing, analyzing, and displaying geographically referenced information. It allows us to view, understand, question, interpret, and visualize data in a way that is quickly understood and easily shared. GIS technology is used for scientific investigations, resource management, and development planning. The modules are divided in three parts: Mobile Client-side application, Middleware Layer and Remote Server-side. The Mobile application provides the functionality that would allow user to take measurements, send them to the middleware and check the general progress of the due course. The application would be mainly divided in the following modules: User Interface, Measurement, Mapping &Connection and Encoding. For the User Interface Android SDK is the tool because it is a free and growing development platform, providing a good integration with Google Maps, the engine that would used the mapping module. Regarding the Connection & Encoding Module, classes in Java need to be implemented to connect and send the data to the Middleware Server. Finally or the measurement Module all the data then collected through sensor network would be measured
Maaz Ahmed Khan et al Measurements of Air & Noise Pollutants
949 | Int. J. of Multidisciplinary and Current research, Sept/Oct 2014
and displayed using the current mobile pollution measurement application. References http://airquality.deq.idaho.gov/Information_AQI.htm http://weather.weatherbug.com/CA/Yountville-weather/air-
quality.html http://www.authorstream.com/Presentation/aSGuest132572-
1395086-causes-and-remedies-of-pollution/ http://www.developsense.com/presentations/2012-09-KWSQA-
Regression.pdf
http://www.dep.state.fl.us/Air/air_quality/aqi.htm http://kingkavin.blogspot.com/2011/02/wireless-sensor-
network.html http://www.navajonationepa.org/aqcp/AirMonitoringAQI.html http://en.wikipedia.org/wiki/Software_prototyping http://en.wikipedia.org/wiki/Regression_testing http://www.epa.gov/airnow/aqi_brochure_02_14.pdf http://cleanairmakemore.com/air-quality-index/ https://www.classle.net/book/software-prototyping http://ercim-news.ercim.eu/en79/rd/sensorweb-based-prototype-for-air-quality-reporting-systems http://airnow.gov/index.cfm?action=aqibasics.aqi http://www.thebigger.com/biology/pollution/what-is-noise-pollution/