Embed Size (px)
Citation preview

Measurement UncertaintyAssessment from Proficiency
Testing
Raluca IavetzNational Measurement Institute

Measurement Uncertainty
• “Non negative parameter characterising the dispersion of the quantity values being attributed to a measurand, based on the information used”(JCGM 200:2008 VIM, 3 ed.)
or• A range containing the true value with a stated
level of confidence

Why is MU Important?
• Is a condition of (NATA) Accreditation to ISO 17025 (clause 5.10.3 c)
• Is a pre-requisite for measurement traceability
• Enables assessment of “fitness for purpose” of result
• Provides basis for meaningful comparison of results
• Provides confidence in decisions based on results• (specification compliance / legal limits)

MU and Specification
(d) In some cases, measurement (even with a small uncertainty) will not resolve the question of compliance / non-compliance.
(d)Maximum
value
Con
cent
ratio
n(a)
(a)
(a) When compliance decisions are clear, MU is not critical.
(b)
(b) When measured results are close to decision points, smaller MUvalues will improve decision making.
(c)(c)
(c) Where false positive decisions are undesirable, underestimation ofMU can lead to inappropriate decisions.
Proficiency testing and MU
• Participants are required to quantitatively analyse the sample provided using their normal test method and report results with associated expanded uncertainty
• z-score provides an assessment of the result relative to the assigned value using the target standard deviation.
• En-score provides an assessment of the uncertainty estimates. • calculated using expanded uncertainties for both the assigned and
participant values.• provides the validity of the coverage factor k
• The |z| and |En| values illustrate the importance of reporting a realistic uncertainty.

En-Scores
• Complementary to z-scores• No set performance target (ie target SD). • Focus on measurement uncertainty• Uncertainty of the assigned value must be
• soundly established • sufficiently small

Satisfactory z and En scores Trace metals in water
69% 70%66%
84% 83%75%
55%
71%
93%
83% 83%
97%92%
83%
0%
10%
20%
30%
40%
50%
60%
70%
80%
90%
100%
AQA 07-05 AQA 08-02 AQA 08-10 AQA 09-05 AQA 09-18 AQA 10-06 AQA 10-17
Study Number
% o
f Sat
isfa
ctor
y En
-sco
res
% satisfactory En-scores % satisfactory z-scores

Results for Iron in Water 2009
Results: S1 - Fe
0
20
40
60
80
100
120
140
160
180
200
17 13 6 8 15 10 1 3 11 14 4 9 2 5 16 18 7 M d R.A. H.V. S
Laboratory
Res
ults
(ug/
L)
D istribut io n o f R esults
0
5
10
<-3 -3-2 -2-1 -1-0 0-1 1-2 2-3 >3
Target SD from Assigned Value
Assigned Value = 109 ± 5 ug/L

For labs 13, 6, 8, 16, 18 and 7 • |z| score was satisfactory
• |En| value indicates that the results for are not in agreement with the assigned values when the uncertainties are taken into consideration.
z - S c o r e s : S 1 - F e
- 0 . 6 - 0 . 4 - 0 . 4 - 0 . 3 - 0 . 3 - 0 . 2 - 0 . 1 - 0 . 1
0 . 0 0 . 0 0 . 0 0 . 0 0 . 1 0 . 2
0 . 6
1. 1 1. 1
- 4
- 3
- 2
- 1
0
1
2
3
4
1 7 1 3 6 8 1 5 1 0 1 3 1 1 1 4 4 9 2 5 1 6 1 8 7L a b o r a t o r y
z-Sc
ore
T a r g e t S t a n d a r d D e v i a t i o n 2 2 u g / L ( E q u i v a l e n t t o 2 0 % C V )
E n - S c o r e s : S 1 - F e
- 0 . 6
- 1 . 8- 1 . 4
- 1 . 0
- 0 . 5- 0 . 2 - 0 . 2
- 0 . 6
0 . 1 0 . 1 0 . 1 0 . 1 0 . 10 . 4
1 . 1 1 . 1 1 . 2
- 4
- 3
- 2
- 1
0
1
2
3
4
1 7 1 3 6 8 1 5 1 0 1 3 1 1 1 4 4 9 2 5 1 6 1 8 7
L a b o r a t o r y
E n-Sco
re

Three casesCase 1: Uncertainty overestimated - |En| alwayssignificantly less than 1Case 2: Estimated uncertainty is correct - |En| in therange 0 to 1Case 3: Uncertainty underestimated - |En| is over 1
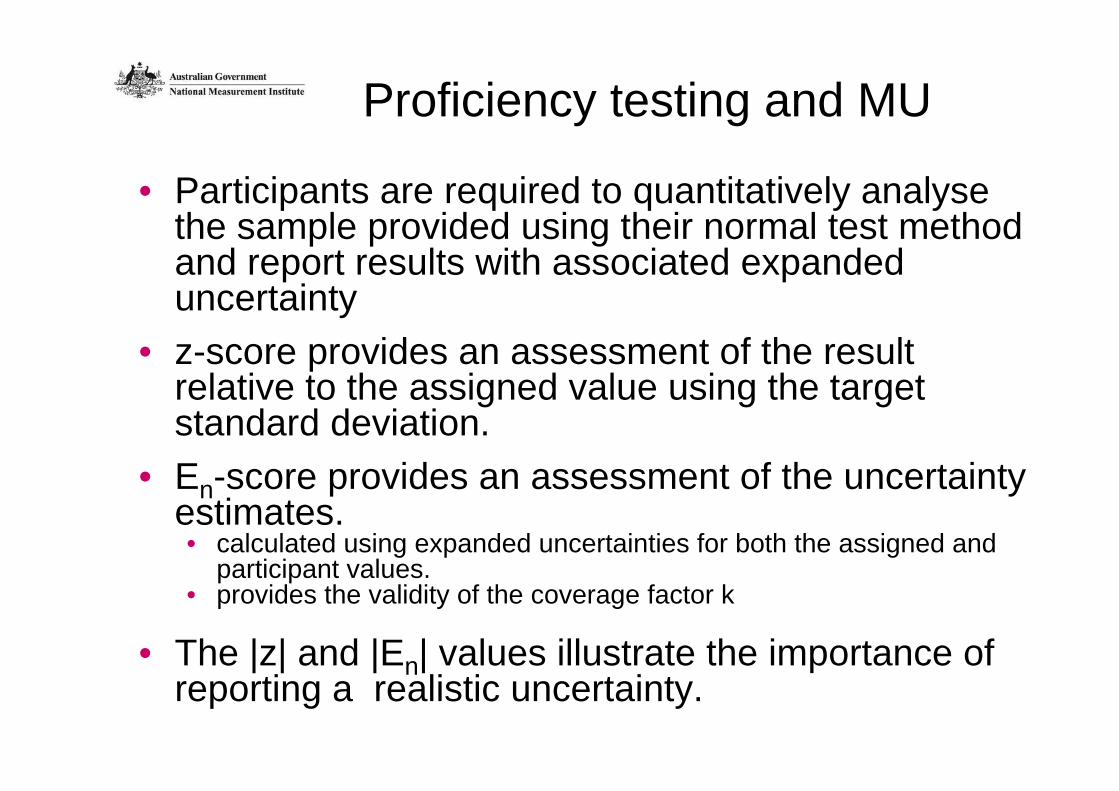
Chromium in saline water 2009• Difficult matrix, low analyte concentration • Assigned value = reference value IDMS.
• 3 labs (purple) have both z-scores and En-scores less than 1• 4 labs (yellow) are in agreement with each other but not with the assigned value (results are comparable, but not accurate. All have z-scores >2 and En-scores>1• 3 labs (grey) have z-scores less than 1, but En-scores >1 –laboratories should revise the uncertainty estimates to obtain a more realistic estimate Results: S1 - Cr
0
1
2
3
4
5
6
7
8
23 12 16 6 22 7 1 11 20 4 3 Md Rv S
Laboratory
Res
ults
(ug/
L)
Assigned Value = 1.20 ± 0.10 ug/L
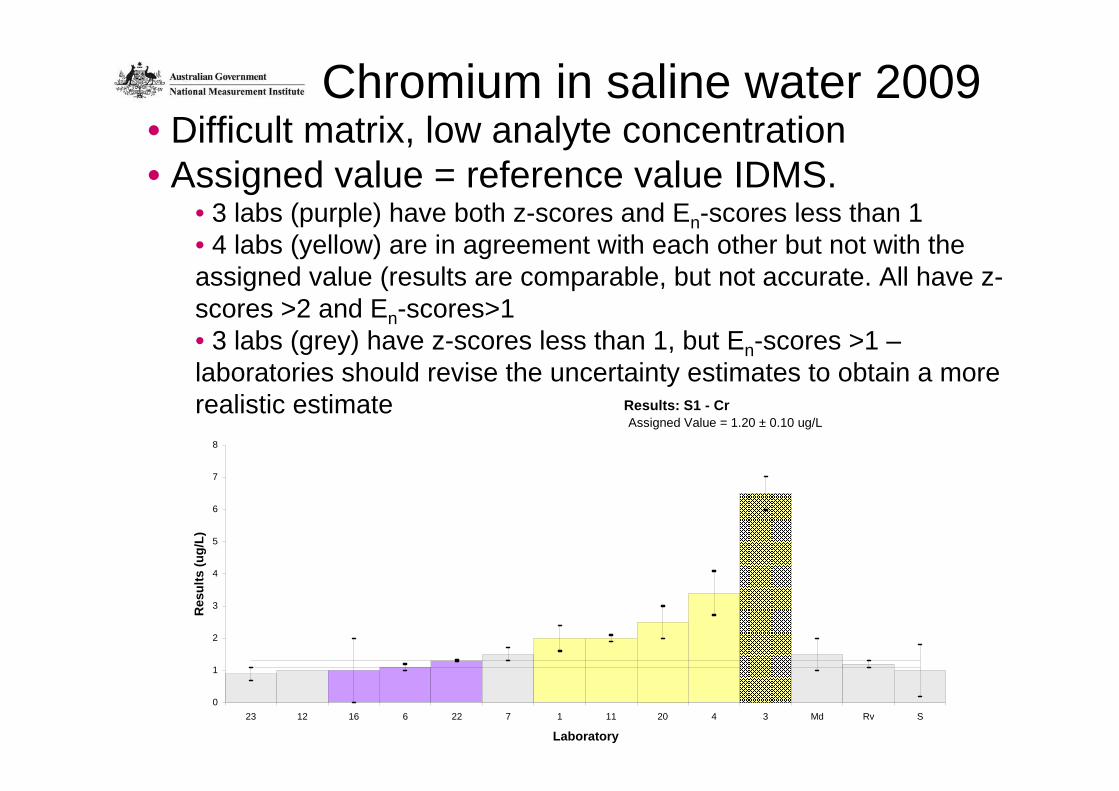
• Lab 3 and 7 have reported different uncertainties for identical samples.
Results: S1 and S2 - Cd
0.0000
0.0005
0.0010
0.0015
0.0020
0.0025
0.0030
0.0035
0.0040
0.0045
0.0050
9 13 11 3 16 15 5 4 2 14 10 7 12 19 20 21 8 1 6 17 18 NMILaboratory
Res
ult (
mg/
L)
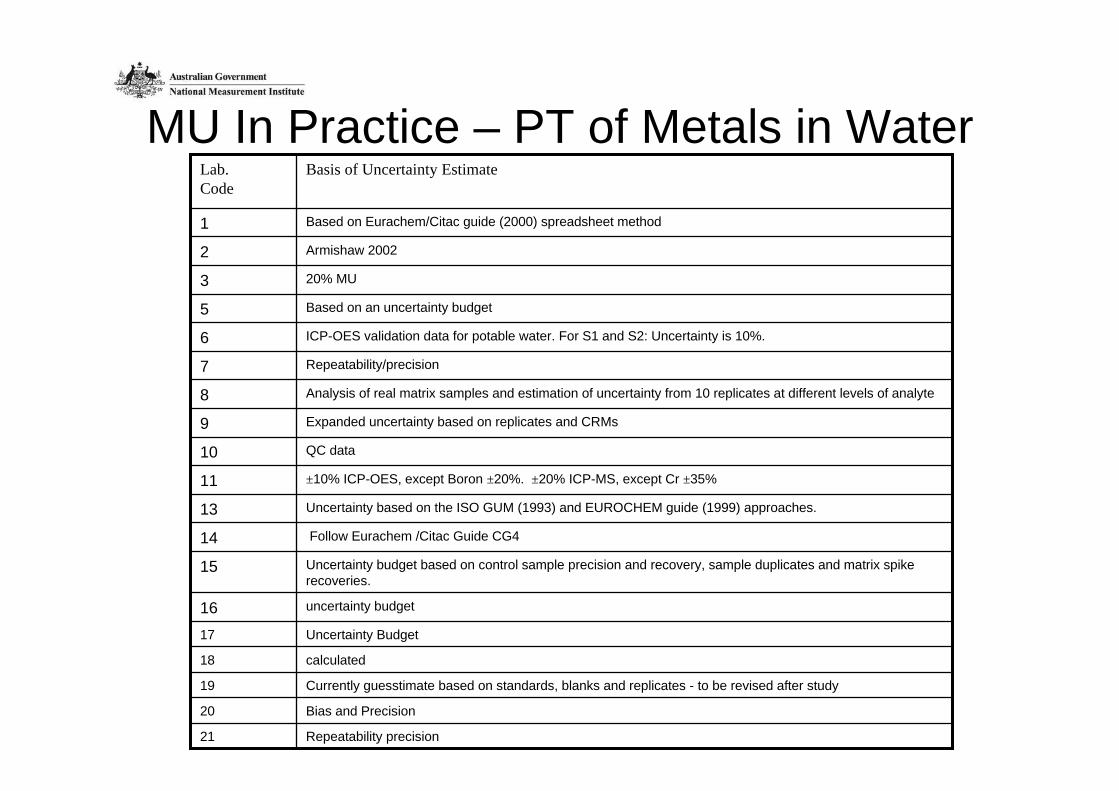
MU In Practice – PT of Metals in Water
Repeatability precision21
Bias and Precision20
Currently guesstimate based on standards, blanks and replicates - to be revised after study19
calculated18
Uncertainty Budget17
uncertainty budget16
Uncertainty budget based on control sample precision and recovery, sample duplicates and matrix spike recoveries.
15
Follow Eurachem /Citac Guide CG414
Uncertainty based on the ISO GUM (1993) and EUROCHEM guide (1999) approaches.13
±10% ICP-OES, except Boron ±20%. ±20% ICP-MS, except Cr ±35%11
QC data 10
Expanded uncertainty based on replicates and CRMs9
Analysis of real matrix samples and estimation of uncertainty from 10 replicates at different levels of analyte8
Repeatability/precision7
ICP-OES validation data for potable water. For S1 and S2: Uncertainty is 10%.6
Based on an uncertainty budget5
20% MU3
Armishaw 20022
Based on Eurachem/Citac guide (2000) spreadsheet method1
Basis of Uncertainty EstimateLab.Code

• Most laboratories are able to estimate uncertainties
• The quality of these uncertainty estimates is very variable
• Reporting poor estimates of uncertainty can be prevented by some simple reality checks

Reality Checking Uncertainty Estimates• Does it make sense?
• experienced analysts have a intuitive feel for the size of the uncertainty• 1.3 0.02 ug/L for Chromium in saline water ??????? (1.5% rel)• reference value 1.20 0.10 ug/L (8%)
• Compare to proficiency testing results• as in the previous slides
• Compare to generalised models• Horwitz – Thompson equation1
• Using T-statistics to verify uncertainty budgets2
• Does the MU account for variability in QA results• duplicates• control charts
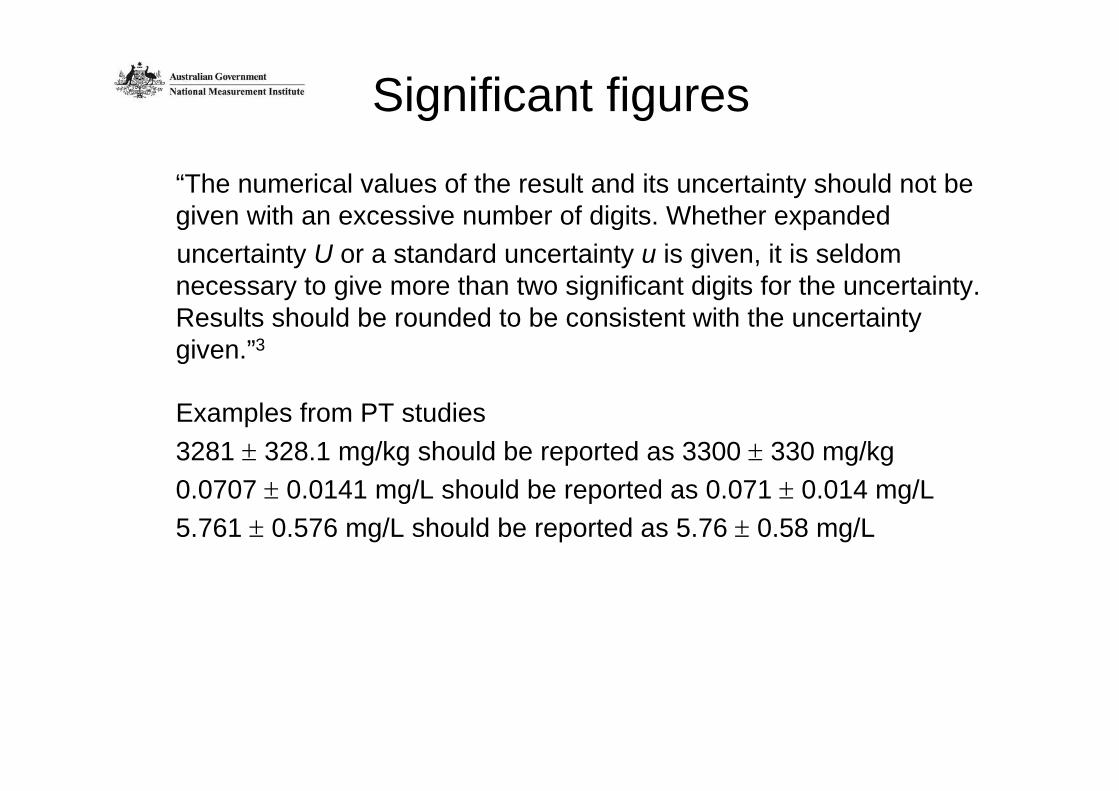
Significant figures
“The numerical values of the result and its uncertainty should not be given with an excessive number of digits. Whether expandeduncertainty U or a standard uncertainty u is given, it is seldom necessary to give more than two significant digits for the uncertainty. Results should be rounded to be consistent with the uncertainty given.”3
Examples from PT studies3281 328.1 mg/kg should be reported as 3300 330 mg/kg0.0707 0.0141 mg/L should be reported as 0.071 0.014 mg/L5.761 0.576 mg/L should be reported as 5.76 0.58 mg/L

Nordtest4 approach• Combines
• within-laboratory reproducibility standard deviation obtained from QC data
• estimates of the method and laboratory bias using PT data
• QC data must cover all steps in analytical chain and all type of matrices as well as long term variations
• Bias estimates is recommended after participation in at least 6 PTs.
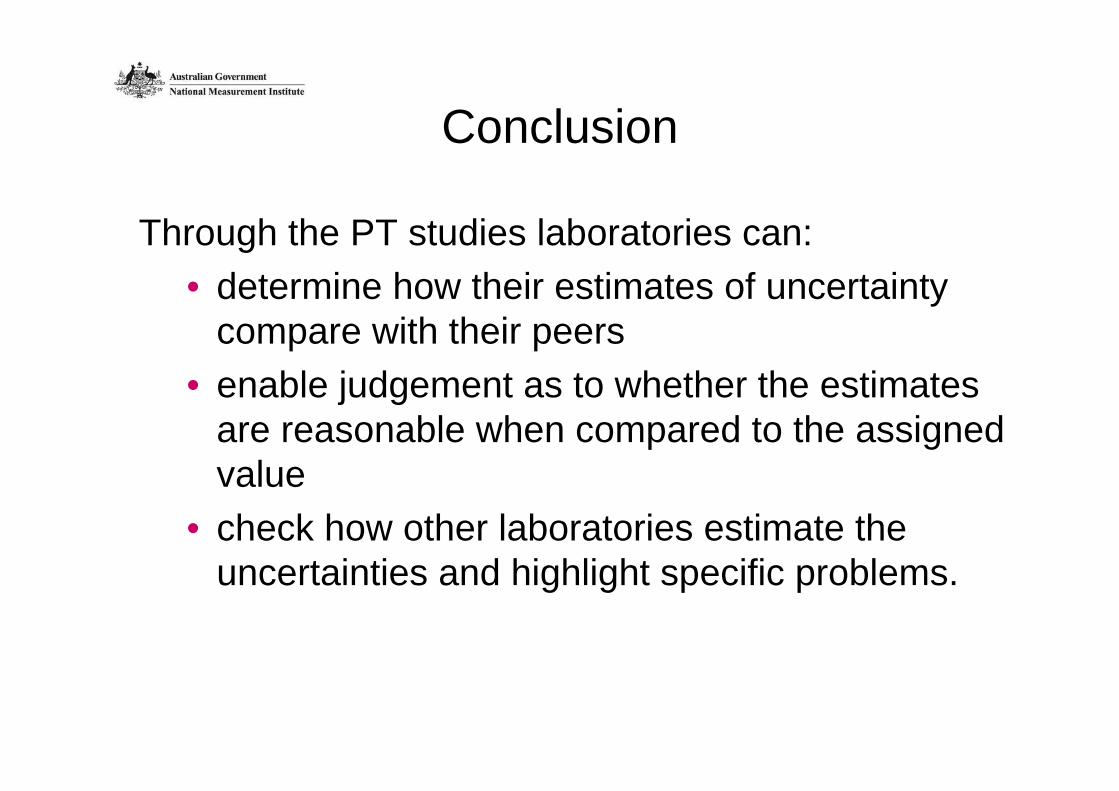
Conclusion
Through the PT studies laboratories can:• determine how their estimates of uncertainty
compare with their peers • enable judgement as to whether the estimates
are reasonable when compared to the assigned value
• check how other laboratories estimate the uncertainties and highlight specific problems.
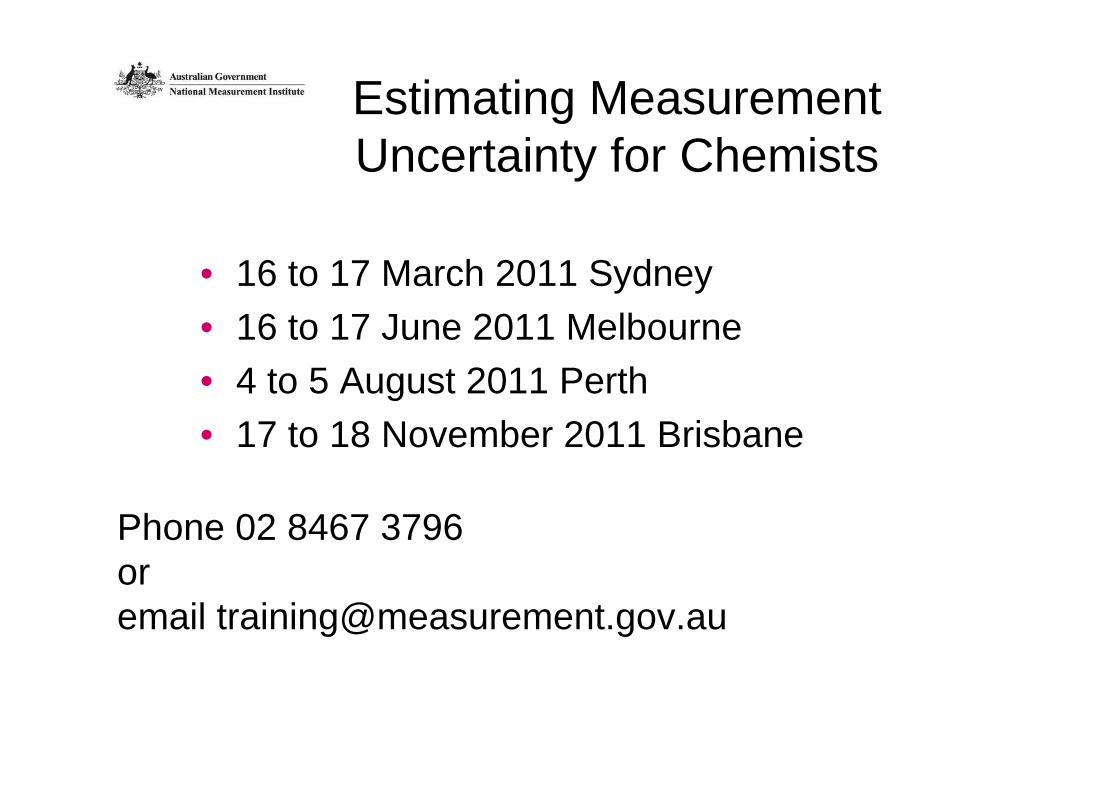
Estimating Measurement Uncertainty for Chemists
• 16 to 17 March 2011 Sydney• 16 to 17 June 2011 Melbourne• 4 to 5 August 2011 Perth• 17 to 18 November 2011 Brisbane
Phone 02 8467 3796 or email [email protected]

References
1. Thompson, M., “Recent trends in inter-laboratory precision at ppb and sub-ppb concentrations in relation to fitness for purpose criteria in proficiency testing”, Analyst, 125, 385-386, 2000.
2. Heydorn, K., Madsen, B. S., “Verification of uncertainty budgets”, Accreditation and Quality Assurance, 10, 403-408, 2005.
3. “Quantifying uncertainty in Analytical Measurement”, 2nd ed., 2000,http://www.eurachem.org/guides/pdf/QUAM2000-1.pdf
4. Nordtest report TR 537 http://www.nordicinnovation.net/nordtestfiler/tec537dk.pdf
National Measurement Institute1 Suakin StreetPymble NSW 2073Australia
Phone: + 61 2 9449 0111
Email: [email protected]