Embed Size (px)
Citation preview

MEASUREMENT OF VOLTAGE DISTRIBUTION
ON HIGH VOLTAGE SUSPENSION INSULATOR
STRING UNDER POLLUTED CONDITION
A Thesis Submitted in Partial Fulfilment
of the Requirements for the Award of the Degree of
Master of Technology
in
Electrical Engineering (Industrial Electronics)
by
Simanta Kumar Samal (Roll No: 213EE5350)
May, 2015
Department of Electrical Engineering
National Institute of Technology
Rourkela-769008
https://www.nitrkl.ac.in

MEASUREMENT OF VOLTAGE DISTRIBUTION
ON HIGH VOLTAGE SUSPENSION INSULATOR
STRING UNDER POLLUTED CONDITION
A Thesis Submitted in Partial Fulfilment
of the Requirements for the Award of the Degree of
Master of Technology
in
Electrical Engineering (Industrial Electronics)
by
Simanta Kumar Samal (Roll No: 213EE5350)
May, 2015
Under the Guidance of
Prof. Subrata Karmakar
Department of Electrical Engineering
National Institute of Technology
Rourkela-769008
https://www.nitrkl.ac.in

National Institute of Technology
Rourkela
CERTIFICATE
This is to certify that the thesis entitled, “Measurement of Voltage Distribution on High
Voltage Suspension Insulator String Under Polluted Condition” submitted by Simanta
Kumar Samal in partial fulfilment of the requirements for the award of Master of Technology
Degree in Electrical Engineering with specialization in Industrial Electronics during 2014 - 2015
at the National Institute of Technology, Rourkela is an authentic work carried out by him under
my supervision and guidance.
To the best of my knowledge, the matter embodied in the thesis has not been submitted to
any other University / Institute for the award of any Degree or Diploma.
Date: Prof. S. Karmakar
Department of Electrical Engineering
National Institute of Technology
Rourkela-769008

ACKNOWLEDGEMENT
I would like to express my sincere gratitude to my supervisor Prof. S. Karmakar for
his guidance, encouragement and support throughout the course of this work. It was an
invaluable learning experience for me to be one of his students. From him I have gained not only
extensive knowledge, but also a sincere research attitude.
I express my gratitude to Prof. A. K. Panda, Head of the Department, Electrical
Engineering for his invaluable suggestions and constant encouragement all through the research
work.
My thanks are extended to my friend’s Prakash, Jitendra, Sumanta in “Industrial
Electronics,” and Susant who built an academic and friendly research environment that made my
study at NIT, Rourkela most memorable and fruitful. I would also like to acknowledge the entire
teaching and non-teaching staff of Electrical Engineering Department for establishing a working
environment and for constructive discussions.
Finally, I am always indebted to my parents and my brother for their endless love and
blessings.
Simanta Kumar Samal
(Roll No. 213EE5350)

i
ABSTRACT
From electrical engineering point of view insulator plays an important role. As it is used as basic
element in overhead transmission and distribution networks. They are not only to insulate the
power line but also to carry the weight of the transmission line conductor. Voltage and electric
field are the main factors to withstand the insulation. Therefore it is very much essential for
insulator string to relate the potential distribution and electric field distribution to that of the
respective ideal string accurately. In operational high voltage, the non-uniformity of potential
distribution across the insulator string is due to the presence of stray capacitance. Also, the
performance of insulator (voltage distribution, electric field distribution) varies by the deposition
of environmental pollutants either uniformly distributed or non-uniformly distributed on the
surface of insulator, which deteriorated by the help of captivation of moisture particles sharply.
So to sort out this dilemma practically by the help of a full equivalent circuit in which the
properties of insulating material and stray capacitance effect should be taken for proper
consideration, which is derived from the Finite Element Method Based Software and executed in
the Ansys Maxwell software package for the calculation of potential distribution, electric field
distribution and also electric field vector distribution throughout the specified string with and
without pollutants in proper power frequency along with desired voltage. A comparison
between normal and polluted (coastal polluted and industrial polluted) creepage voltage vs
creepage distance in graphical form is studied by using Matlab. Finally a voltage gradient and
electric field comparison is studied by using Matlab.

ii
CONTENTS
Title Page No.
Abstract i
List of Abbreviations iii
List of Tables iv
List of Figures v
CHAPTER-1: INTRODUCTION 1
1.1 Introduction 1
1.2 Literature survey 3
1.3 Motivation 5
1.4 Objectives 5
1.5 Thesis organization 6
CHAPTER-2: THEORETICAL STUDIES OF SUSPENSION INSULATOR 7
2.1 Introduction 7
2.2 Types of pollution 7
2.3 Insulator under study 8
2.4 Theoretically voltage measurement 9
2.5 Effects of electric field distribution 13
CHAPTER-3: SIMULATION RESULTS AND DISCUSSION 14
CHAPTER-4: CONCLUSION AND SCOPE FOR FUTURE WORK 30
REFERENCES 31
APPENDIX 33

iii
LIST OF ABBREVIATION
Symbols Abbreviation
C Capacitance between each insulator unit and line conductor (line capacitance).
𝐶′ Capacitance between each unit and ground (stray capacitance).
𝐼𝑛+1 Current flow in the (𝑛 + 1)𝑡ℎ unit due to current in 𝑛𝑡ℎ unit line capacitance
and that of stray capacitance.
∆𝑉𝑛+1 Voltage across (𝑛 + 1)𝑡ℎ unit due to 𝑛𝑡ℎunit line capacitance voltage and that of
stray capacitance.
𝑋𝑐 Capacitive reactance of line capacitance.
𝜔 Power frequency in (𝑟𝑎𝑑 𝑠𝑒𝑐⁄ ).
𝐼𝑛′ Current flow in the 𝑛𝑡ℎ unit of stray capacitance.
𝑋𝑐′ Capacitive reactance of stray capacitance.
𝑉𝑛+1 Voltage of (𝑛 + 1)𝑡ℎunit only due to line capacitance.
𝐼𝑛 Current in the 𝑛𝑡ℎ unit line capacitance.
Δ𝑉𝑛 Voltage across 𝑛𝑡ℎ unit due to both line capacitance voltage and that of stray
capacitance.
𝑚 Capacitance ratio or de-multiplication factor.
Δ𝑉0 Voltage across first unit from tower side.
Δ𝑉1 Voltage across second unit from tower side.
Δ𝑉2 Voltage across third unit from tower side.

iv
LIST OF TABLES
Table No. Table Name Page No.
Table 1 Convergence criteria for 132 kV insulator string in normal 15
condition
Table 2 Convergence criteria for 132 kV insulator string in polluted 16
condition
v
LIST OF FIGURES
Fig. No. Figure Name Page No.
Fig. 1 Various parts of single disc insulator in normal condition 9
Fig. 2 Various parts of single disc insulator in pollution condition 9
Fig. 3 Equivalent circuit of an insulator string with seven units in a 132 kv
line in normal condition.
10
Fig. 4 Mesh analysis of 132 kV insulator string in normal condition 17
Fig. 5 Mesh analysis of 132 kV insulator string in polluted condition 17
Fig. 6 Voltage distribution of 132 kV insulator string in normal condition 18
Fig. 7 Electric field distribution of 132 kV insulator string in normal
condition
19
Fig. 8 Electric field vector distribution of 132 kV insulator string in
normal condition
20
Fig. 9 Voltage distribution of 132 kV insulator string in coastal pollutant
condition
20
Fig. 10 Electric field distribution of 132 kV insulator string in coastal
pollutant condition
21
Fig. 11 Electric field vector distribution of 132 kV insulator string in
coastal pollutant condition
22
Fig. 12 Voltage distribution of 132 kV insulator string in industrial
pollutant condition
22
Fig. 13 Electric field distribution of 132 kV insulator string in industrial
pollutant condition
23
Fig. 14 Electric field vector distribution of 132 kV insulator string in
industrial pollutant condition
24
Fig. 15 Creepage voltage distribution of insulator string in normal and
coastal pollution conditions
25
Fig. 16 Creepage voltage distribution of insulator string in normal and
industrial pollution conditions
26
Fig. 17 Creepage voltage distribution in all the environmental conditions 27

vi
Fig. 18 Voltage gradient comparison in all the environment conditions 28
Fig. 19 Electric field comparison in all the environment conditions 29

Chapter 1 Introduction
1
CHAPTER-1
INTRODUCTION
1.1 INTRODUCTION
An electrical insulator is nothing but a material whose internal electric charges do not flow freely
and hence make it very hard to conduct an electric current under the influence of an electric field.
That’s why it plays an important role in electrical system. In the whole universe a perfect
insulator does not exist, because a portion of the insulator could become electrically conductive,
when the voltage applied across it exceeds the breakdown voltage. Therefore insulator is one of
the most vital component of power transmission and distribution network [1], [3]. At the lower
utilization voltage the insulation completely surrounds the live conductor and hence acts as a
barrier which keeps the live conductors unreachable from human being or animals. It is mainly
house warring and domestics purpose where the applied voltage for services is lower. In the
other hand for high voltage overhead transmission and distribution the transmission towers or
poles support the lines and insulators are used to insulate the live conductor from the
transmission towers. At the same time the insulators used in transmission and distribution system
are also required to carry large tensional or compressive load [7]. Depending upon the applied
voltage a various type of insulators are used in transmission and distribution network. Such as
pin insulator (Low voltage up to 33 kV), shackle insulator (Low voltage distribution network),
suspension insulator (High voltage transmission network), strain insulator (High voltage
transmission network), these are mainly used for transmission and distribution. The shackle
insulator is replaced by strain insulator in high voltage transmission network whereas pin
insulator is replaced by suspension insulator. But now a days shackle insulators are not used
because of the increased use of underground cable in distribution network. Suspension insulators
are widely used in transmission network, i.e. in high voltage lines. The knowledge of the voltage
distribution and electric field within and around high voltage insulators is of paramount
importance for the engineer involved in the design of power lines insulation [24].

Chapter 1 Introduction
2
Mainly the overhead line insulators are failed due to occurrence of flashover which
normally creates in between the line and earth when the voltage increases to reach a particular
value in the system. Puncture of insulator unit is occurred because of maximum arcing at the
time of flashover [11]. Therefore insulation materials have some specific properties. Such as,
1. It must be mechanically strong, so that to carry tension and weight of the conductors.
2. The dielectric strength must be very high, so that to withstand the high voltage stress.
3. The insulation resistance must be high, so that to prevent the leakage current to the earth.
4. It must be free from unwanted impurities and should not be porous.
5. It should be non-hydroscopic.
6. Its physical and electrical properties must be less affected due to change in temperature.
So porcelain is used as the insulating material most commonly in overhead insulators [2].
The porcelain is nothing but aluminium silicate which mixed with plastic kaolin, feldspar and
quartz to obtained final glazed and hard porcelain insulator material. As the surface is glazed, so
that water should not be traced on it. Porcelain is also free from porosity, as the deterioration of
its dielectric property is because of porosity. Also porcelain is free from any impurities and air
bubble inside the material [2], [10].
In the overhead transmission line, the length of the composite insulator and the number of
suspension insulator units depends not only on the voltage gradient but also the environment
condition in case of the overhead transmission network. It also depends on properties of the
materials used for insulator unit. A main problem in these insulators is the accumulation of a
pollution layer that comes from the surrounding environment [4], [7]. The insulators of
substations and overhead transmission lines, in desert areas which contain very fast sand
particles are often due to sandstorms, hurricanes and cyclones. When the surrounding humidity
of insulator string reaches a significant level due to rain, dew or fog formation on the polluted
insulators by severe changes of temperature from night and day, as a result the conductivity of
those pollutant layers is increased. So, a leakage current passes through the pollutant layers under
this condition. It gives rise to heat, which results in the formation of dry bands on the insulator
surface. Hence there will be the appearance of partial discharges on the insulator string surface.
Where discharge activity on the surface of the insulator string is caused due to electric field. That
electric field is more than the ionization level of the ambient air. This high electric field depends

Chapter 1 Introduction
3
on the applied voltage, the type of materials used in the insulator string as well as the
environmental conditions [1], [5], [7].
1.2 LITERATURE SURVEY
Extensive literature review of different journal paper related to insulator string voltage
distribution and electric field distribution in different conditions, flashover of insulator and
breakdown of insulator were studied. In 2006 S. IIhan, et al. [2] proposed the voltage distribution
among the insulator units are not uniform in normal condition due to presence of stray
capacitance. But in case of alternating and lightning impulse, potential distribution are same. Due
to wind pressure the conductor swings towards the tower and the line metal clearance became
critical. If the line clearance increases then the value of stray capacitance also increased and
hence the potential distribution becomes more non-uniform. The voltage distribution improves in
uniform contamination of the clean case for switching impulse voltages and power frequency
voltages. But it has no effect for the lightning impulse voltages. Therefore it has more critical for
contaminated insulator strings in lightning impulse voltages. In normal condition the insulator
units are usually subjected to withstand higher electric stresses. To nullify the undesirable effects
in case of randomly deposition of pollutants, it is better to be cleaned all units of string when
replacing the failed units. In order to minimize the temporary outages all the units in the insulator
string will be replaced by stronger fog-type units. Hence, replacement of lowermost and
uppermost units with fog-type units can alleviate the problem. In 2007 V. T. Kontargyri, et al.
[3] implemented how to use proper type of insulator which has given appropriate and required
result in a very fast and economic way. The voltage distribution on a suspension type porcelain
insulator string. Also the simulation results has been compared with experimental results. At the
end it discussed the limitations of an electrostatic solution for the conducting and dielectric
properties of the materials. In 2009 K. Siderakis, et al. [4] studied how to creepage distance
correlated with the performance of the insulators in case of pollution condition especially in
coastal regions. For condensation wetting, the whole creepage distance in addition with the
protected parts were exposed to wetting. Hence it is required to determine the aerodynamic
behaviour of insulator, amount of contamination accumulated and also the distribution of
contamination along the leakage path. Therefore the more is the convoluted geometry of the
insulator, the less is the cleaning effect of the wind and hence the surface conductivity formed is

Chapter 1 Introduction
4
greater. So, the possibility of pollution flashover increased, where the creepage distance may be
the same. In 2010 Ehsan Azordegan, et al. [5] proposed how to electromagnetic radiation
signatures of a cracked and a polluted insulator string. Hence it was studied that, the
characteristics of electromagnetic radiation for polluted and cracked insulator with respect to the
negative and positive cycles. Also the electromagnetic radiations were captured by different
receivers from the insulator strings. In 2013 Subba Reddy B, et al. [6] studied the field
distribution and surface potential for single disc and insulator string for both in normal condition
and in a string which has defective discs. How to enhance the electric stress across the first disc
from the line end. Because it is required to improve the electric stress to prevent the flashover.
According to the fault location on the string, it might be increased the percentage of electric
stress across the first disc from the line end. Here it concludes that, the stress on the normal
insulator string is depend on the location of the defective insulators of the insulator string. The
effect of electric stress across normal insulator string when compared with defective insulator
disc according to the location of defective disc. Hence it is helpful for power utilities while
replacing the faulty discs in a string. In 2014 Ahmed el-Tayeb, et al. [7] concluded that, the
potential distribution across the normal insulator string is both non-uniform and non-linear
because of the presence of stray capacitance. But in the presence of pollution layer the potential
distribution throughout the length of the insulator string makes linear. Due to the occurrence of
pollution layer on the upper surface of insulator string is strongly modified the electric field
distribution along the creep age path. Because of a homogenous pollution (i.e. the condition of
uniform pollution) the insulator pin region of unit submits the highest stress, but the electric field
is similar to that of clean insulator string. When the uniform contamination enhances the voltage
distribution compared with that of clean one at the other hand the electric field distribution
increases approximately six times when compared with clean and dry one. The linearization of
potential distribution implies that, the higher voltages towards the centre of the insulator and the
insulator surface is conducting. As a result the high field strengths arise near the sections with a
small radius of curvature. Hence it may be initiate the corona. As compared to lower part of
insulator with upper part of insulator for the same thickness and same conductivity of pollutant
material has higher electric field.

Chapter 1 Introduction
5
1.3 MOTIVATION
The fact which motivated for accurate measurement of potential distribution in case of high
voltage suspension insulator string under the influence of pollutant materials is, in nowadays
there is a fast growing attention towards the development of electric arc across the polluted
insulator units. A large number of experiments are conducted and so many studies have been
published around the world to concern the occurrence of pollutant flashover. In spite of these
significant efforts it has become evident that there is not a fully acceptable explanation of the
pollution flashover mechanism and that is the reason why there is not still a general and efficient
method in facing the problem. A few works have been reported in the voltage and electric field
measurement of suspension insulator string accurately, simulation result comparison of normal
one and polluted one suspension porcelain insulator string might not do properly, flashover and
puncture of insulator due to non-uniform voltage and electric field distribution.
1.4 OBJECTIVE
The main objective of this research work is to measure the voltage distribution properly so that
can avoid puncture and flashover of insulator string according to the required precautions.
Because the voltage and electric field distributions are non-uniform on its units. Due to these
non-uniformity insulator damage, electric discharge over the surface and lastly forced outage
normally occurred in the pollutant regions. By using Ansys Maxwell software for simulation and
design the more number of equations, time consumption and iteration points for convergence
should be avoided. We can compare voltage distribution, electric field distribution and electric
field vector distribution between normal and polluted insulator string. From that we can know
withstanding and breakdown voltage of insulator disc. So that, we can take appropriate
precaution for them.

Chapter 1 Introduction
6
1.5 THESIS ORGANIZATION
The outline of the work is as follows:
Chapter 1 presents the background for this thesis research, having introduction with a
comprehensive literature review in related area.
Chapter 2 presents the types of pollution, design of single disc porcelain insulator
both in normal and polluted condition, theoretically calculation of voltage distribution
in insulator string and effects of electric field distribution.
Chapter 3 presents the simulation results of voltage distribution, electric field and
electric field vector distribution along with discussions for various conditions of
insulator string and also graphical studies of creepage voltage in various
environmental conditions, voltage gradient among the insulator discs and electric field
along the leakage distance in all the environment conditions.
Chapter 4 concludes the work and proposes scope for future work in this domain.

Chapter 2 Theoretical Studies of suspension Insulator
7
CHAPTER-2
THEORETICAL STUDIES OF SUSPENSION
INSULATOR
2.1 INTRODUCTION
Among all the types of insulator suspension insulator plays a vital role in high voltage
transmission lines. Because it is economical with respect to size and weight of the other types of
insulator. In case of suspension insulator string formation is possible by connecting more number
of insulators in series. By doing this replacement of damaged insulator unit is become easier. The
main focus in all types insulators are voltage and electric field distribution. Because these are
responsible for premature aging of insulator, audible noise and also for partial discharge on the
insulator surface. Electric field distribution and voltage distribution are mainly depends on
applied voltage, properties of materials used in insulator and surrounding or environmental
condition (contamination type and level) [3], [8].
2.2 TYPE OF POLLUTION
The insulators on transmission lines are normally subject to the deposition of pollutant materials
on the insulator surface by the environment. As the nature of the pollutants deposition is mostly
affected by nature of the environment. Mainly, the nature of the deposition of pollutant on the
surface of the insulator are two types like uniformly deposited pollutants and non-uniformly
deposited pollutants. Similarly, the types of pollution are mainly of two types (according to the
nature of pollutant materials) like coastal pollution and industrial pollution [4].
Coastal Pollution:
The insulators those are located in coastal regions especially contaminated by soluble
contaminants, mostly NaCl (Sodium chloride). The salt spray from the sea or wind driven salt
laden solid material such as sand collects on the insulator surface. These layers become
conducting during periods of high humidity and fog. Sodium chloride is the main constituent of
this type of pollution. The flashover can occur as long as the salts are soluble enough to form a
conducting layer on the insulator surface, irrespective of the contaminant nature [5].

Chapter 2 Theoretical Studies of suspension Insulator
8
Industrial Pollution:
Substations and power lines near industrial complexes are subjects to the stack emissions from
nearby plants. These materials are usually dry when deposited; they may then become
conducting when wetted. The materials will absorb moisture to different degrees and apart from
salts, acids are also deposited on the insulator. Industrial pollutions which occurred mainly in
paper and cement industry areas are especially contaminated by a significant amount of non-
soluble contaminants. Rather than all of the above some of the contaminants are occurred due to
calcium chloride, carbon and cement dust [5].
Many dedicated computer packages are much helpful for design and simulation of
insulator. As they are making a digital model for any insulator and their performance by the help
of computer simulation. The design and computer simulation that is used here depends on FEM
(Finite Element Method) of Ansys Maxwell package. Preference of this computer based design
and simulation is only because of more precise results will get in very less time and in more
economical way [6].
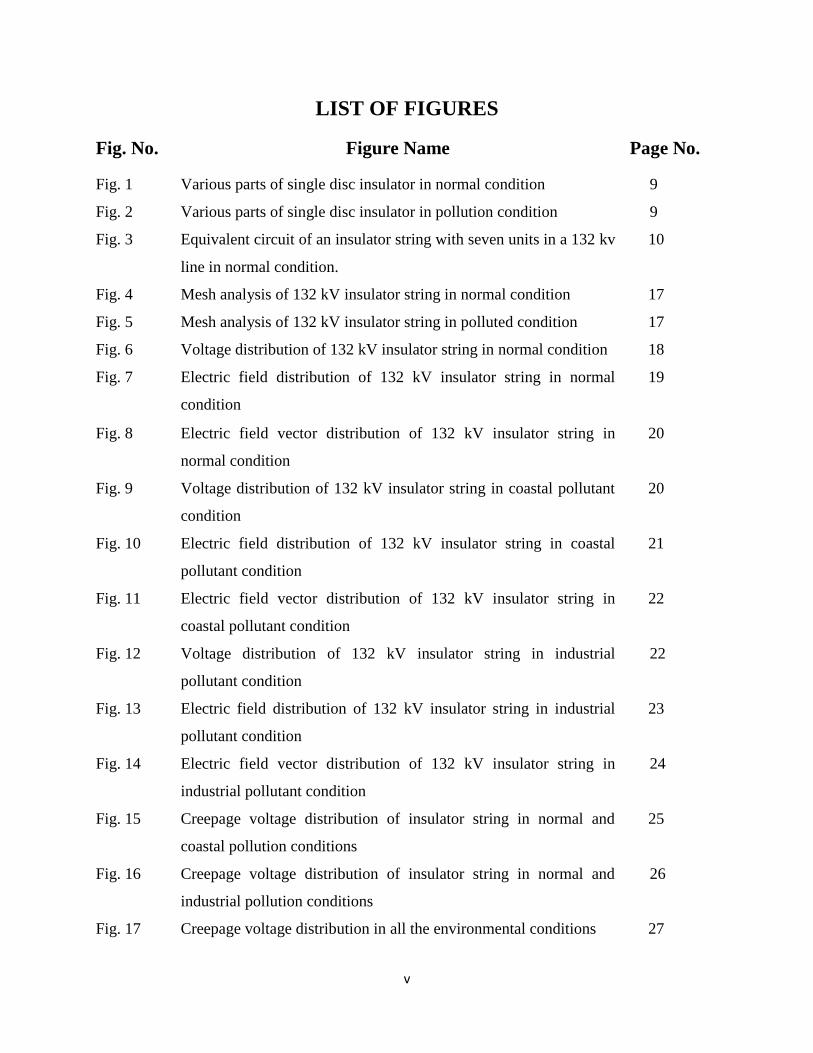
2.3 INSULATOR UNDER STUDY
The porcelain insulator is widely used for 132 kV, 220 kV and 500 kV transmission lines. Fig. 1
shows the single unit of porcelain insulator which used in this study for normal condition. Fig. 2
shows the single unit of porcelain insulator which used in this study for polluted condition.
Normally a thickness of 0.03mm to 0.09mm pollutant materials are distributed either uniformly
or non-uniformly on the insulator surface. The insulator cap and the insulator pin are made from
steel and they are embedded in bonding material (cement layer) with a relative permittivity of 14
and a conductivity of 10−13 𝑆 𝑚⁄ in order to fix with porcelain shell and the shell is made of
porcelain which has a relative permittivity of 6 with a conductivity of 2×10⁻¹³ 𝑆 𝑚⁄ . In polluted
condition for coastal pollution, the pollutant material is NaCl whereas for industrial pollution, the
pollutant material include calcium chloride, carbon and cement dust. For coastal pollutant the
relative permittivity of 4.5 and conductivity of 70µ𝑆 𝑚⁄ whereas for industrial pollutant the
relative permittivity of 2 and conductivity of 30µ𝑆 𝑚⁄ . The pollutant conductivity may varies
according to the thickness of the pollutant materials deposited on the surface of the insulator. The
total insulator string consists of 7 units for 132 kV transmission line [4], [11].
Chapter 2 Theoretical Studies of suspension Insulator
9
Fig. 1: Various parts of single disc insulator in normal condition
Fig. 2: Various parts of single disc insulator in pollution condition
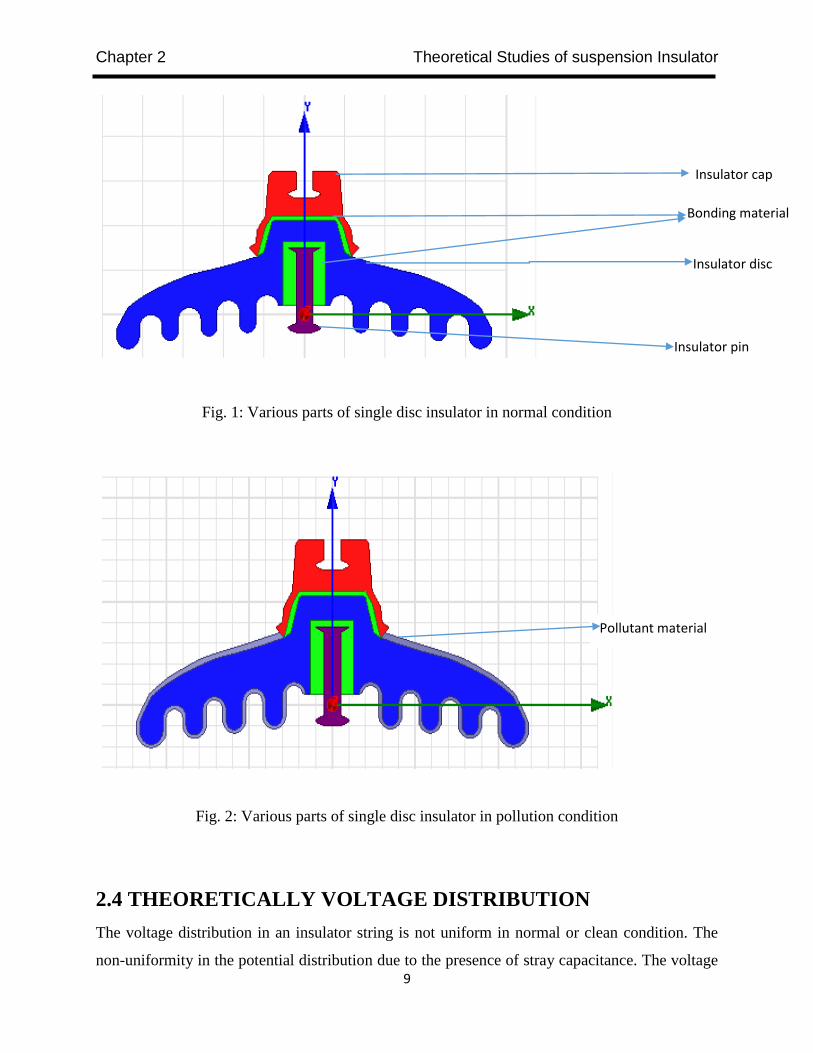
2.4 THEORETICALLY VOLTAGE DISTRIBUTION
The voltage distribution in an insulator string is not uniform in normal or clean condition. The
non-uniformity in the potential distribution due to the presence of stray capacitance. The voltage
Insulator cap Insulator cap
Bonding material
Insulator disc
Insulator pin
Pollutant material
Chapter 2 Theoretical Studies of suspension Insulator
10
near to the power conductor is attend the maximum value whereas the voltage near to tower end
is minimum. To maintain the uniformity in the voltage distribution various techniques are
adopted, such as using longer length of cross arm, using capacitance grading, using static
shielding or guard ring.
Fig. 3: Equivalent circuit of an insulator string with seven units in a 132 kv line in normal
condition

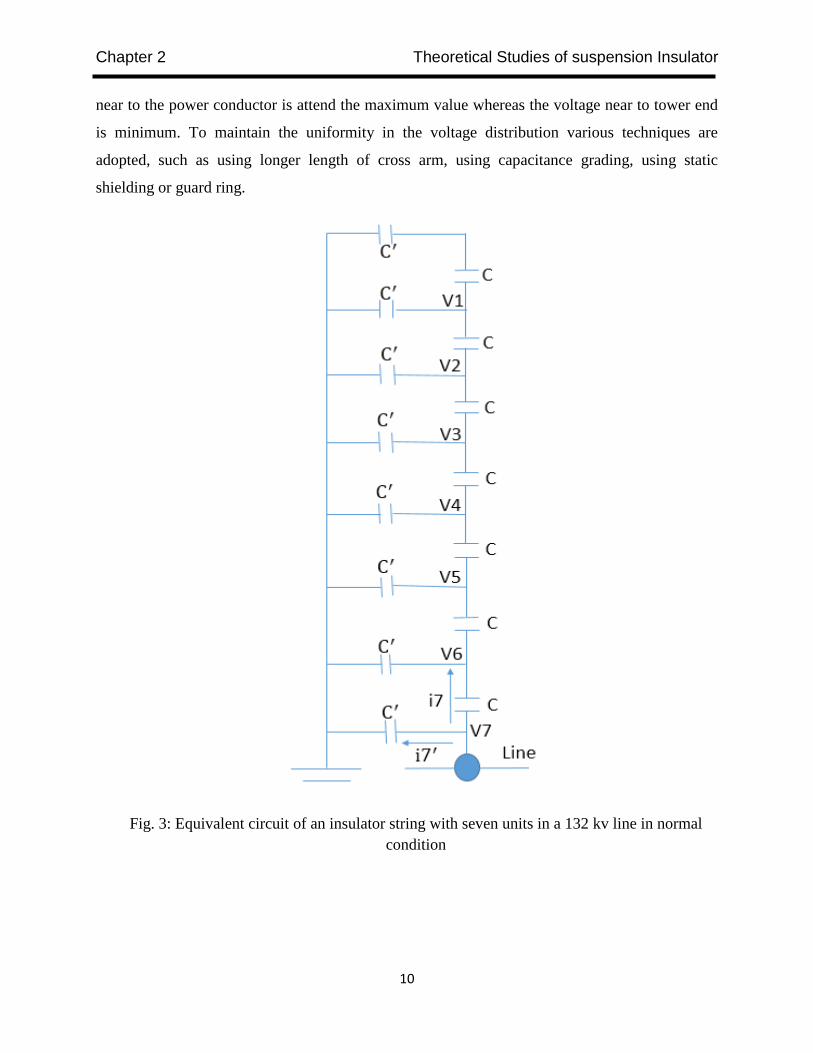
Chapter 2 Theoretical Studies of suspension Insulator
11
Fig. 3 indicates equivalent circuit of an insulator string with seven units in a 132 kV line [3]. But
when the pollutant materials cover the insulator surface, then it considerably changes the voltage
distribution and electric field distribution across the specified insulator units. Pollution is
normally replicated by a high resistance attached across the self-capacitance of each unit. This
resistance value depends upon pollution conductivity, diameter of insulator along with arc length
on insulator’s surface which can be considered equal to creepage distance and cross section of
pollution on insulator surface. This resistance value may be ranged from several MΩ to tenths of
kΩ. This will change the capacitance ratio (self-capacitance to shunt-capacitance ratio), which
has mainly affected the voltage distribution in insulator string. The deposition of pollutants on
the surface of the insulator became conductive and provide a path across the insulator for leakage
current. When the temperature increases it forms a dry band on the insulator surface which
increases the voltage gradient until arcing occurs across the bands [11].
By solving KVL and KCL equations for equivalent circuit of insulator string, each unit
voltage can be calculated as follows;
𝐼𝑛+1=Δ𝑉𝑛+1
𝑋𝑐 = C. 𝜔. Δ𝑉𝑛+1 (1)
𝑤ℎ𝑒𝑟𝑒,C is capacitance between each insulator unit and line conductor or line capacitance, 𝐶′ is
capacitance between each unit and ground or stray capacitance, 𝐼𝑛+1(A) is current flow in the
(𝑛 + 1)𝑡ℎ unit due to current in𝑛𝑡ℎ unit line capacitance and that of stray capacitance, ∆𝑉𝑛+1(V)
is voltage across (𝑛 + 1)𝑡ℎunit due to𝑛𝑡ℎunit line capacitance voltage and that of stray
capacitance,𝑋𝑐(Ω) is capacitive reactance of line capacitance, 𝜔(𝑟𝑎𝑑 𝑠𝑒𝑐⁄ ) is power frequency.
The current flow in the 𝑛𝑡ℎ unit of stray capacitance,𝐼𝑛′ (A), is calculated as follows
𝐼𝑛′ =
𝑉𝑛+1
𝑋𝑐′ = 𝐶′.𝜔.𝑉𝑛+1 (2)
𝑤ℎ𝑒𝑟𝑒, 𝑋𝑐′(Ω) is the capacitive reactance of stray capacitance, 𝑉𝑛+1(V) is the voltage of (𝑛 +
1)𝑡ℎunit only due to line capacitance.
The current in the 𝑛𝑡ℎ unit line capacitance,𝐼𝑛(𝐴), is calculated as follows
𝐼𝑛= C.𝜔.Δ𝑉𝑛 (3)

Chapter 2 Theoretical Studies of suspension Insulator
12
where, Δ𝑉𝑛(V) is the voltage across 𝑛𝑡ℎ unit due to both line capacitance voltage and that of stray
capacitance.
The current flow in the (𝑛 + 1)𝑡ℎ unit due to current in 𝑛𝑡ℎ unit line capacitance and that of stray
capacitance, 𝐼𝑛+1(A), is calculated as follows
𝐼𝑛+1= 𝐼𝑛+ 𝐼𝑛′ (4)
Capacitance ratio or de-multiplication factor, m, is given as
𝑚 = 𝐶
𝐶′ (5)
According to the above equations (1) - (5):
C.𝜔.Δ𝑉𝑛+1= C.𝜔.Δ𝑉𝑛 + 𝐶
𝑚𝜔. 𝑉𝑛+1 (6)
Δ𝑉𝑛+1= Δ𝑉𝑛 + 𝑉𝑛+1
𝑚 (7)
Then:
𝑉𝑛+1= 𝑉𝑛 + Δ𝑉𝑛 (8)
Δ𝑉0 = 𝑉1 (9)
Δ𝑉1 = (1 + 1
𝑚) Δ𝑉0 (10)
Where, Δ𝑉0(V) is the voltage across first unit from tower side, Δ𝑉1(V) is the voltage across
second unit from tower side, Δ𝑉2(V) is the voltage across third unit from tower side.
Δ𝑉2 = (1 + 3
𝑚 +
1
𝑚2) Δ𝑉0 (11)
And so on.
In the above expression when the capacitance ratio (m) increases to higher value, then the
potential distribution across the various discs of the insulator string tends to be more
homogenous.

Chapter 2 Theoretical Studies of suspension Insulator
13
2.5 EFFECTS OF ELECTRIC FIELD DISTRIBUTION
For the design of the insulator, calculation of the electric field and potential distribution across
the high voltage insulator is more essential. The electric field in high levels are mostly
responsible for partial discharge, audible noise and premature aging of insulator. As the
flashover propagation depends on electric field, so a descent electric field distribution is
essential for insulator string. The flashover is nothing but an arc formation between the
conducting parts and over the insulator surface, as the result of breakdown of dielectric strength
of surrounding air. Due to the effect of pollution layers for calculation of electric field and
voltage distributions around and inside the insulator unit, the insulator pin of first unit (line end
unit) is stressed by 132 kV AC voltage whereas in the insulator cap of the 7𝑡ℎ unit is grounded.
The accuracy of the calculation is increased by increasing the number of meshes [4], [13].

Chapter 3 Results and discussions
14
CHAPTER-3
RESULTS AND DISCUSSIONS
The symmetry of the insulator assembly is exploited when creating the finite element model,
resulting in axis-symmetric two dimensional problems. The model is generated with the help of
key points later joined and designed by poly lines and then forming 2-D area model. In this
designed Maxwell 15.0 software is used. This model is designed with the help of Maxwell
software where the solution type is electrostatic. The percentage of error is fixed below 0.5%,
the refinement per pass is 50%, the non-linear residual is fixed below 0.0001 and five iteration
points are taken in case of all the models. The applied model consists of 6 parts for normal
insulator string and 7 parts for polluted insulator string. The 6 parts are cap (ductile iron), pin
(forged iron), disc (porcelain), bonding material (cement), surrounding air and 7th part is
pollutant material (salt, pollutant dust from cement or paper industry). The thickness of pollutant
material is 0.07mm and it is uniformly polluted. Here two pollution cases are taken, such as
coastal pollutant and industrial pollutant. In case of coastal pollution the pollutant material is salt
where as in case of industrial pollution the pollutant material is industrial dust. The applied
polluted models are uniformly polluted. The voltage distribution and electric field distribution
are different according to the pollutant material and their properties in case of pollutant insulator
string. Between the applied pollutant models coastal pollutant material has more permittivity and
conductivity than that of industrial pollutant material. All the applied models and simulations are
done under a standard temperature that is at 23 degree Celsius and also at a standard atmospheric
pressure.

Chapter 3 Results and discussions
15
Table 1: Convergence criteria for 132 kV insulator string in normal condition
Here the Table 1 shows the total convergence criteria in case of 132 kV insulator string in
normal condition. Whereas Table 2 shows the total convergence criteria in case of 132 kV
insulator string in normal condition. In both the cases for convergence the energy error and delta
energy error is fixed below 0.5%. Convergence in case of normal condition takes more times
than that of in case of polluted condition. Because the number of passes and number of triangles
in case of normal condition is more than that of polluted condition. The convergence criteria
meet in six passes in case of normal condition in which the maximum number of passes for
convergence is ten. Whereas in case of polluted condition the convergence criteria meet in three
passes. It is observed that, more number triangles are formed in case of normal condition , as the
specified region for convergence in case of normal condition is less than that of in case of
polluted condition. Finally, from Table 1 the convergence is achieved when energy error is
0.18269% and delta energy is 0.26135%. Whereas from Table 2 (polluted condition) it is
0.37919% and 0.45087% respectively.

Chapter 3 Results and discussions
16
Table 2: Convergence criteria for 132 kV insulator string in polluted condition
To achieve required level of accuracy in result, the mesh needs to be refined in areas where fields
are of interest or the field gradients are high and adaptive meshing provides automated mesh
refinement capability which is depend on desired energy error in simulation. It is only available
in case of static solvers. Fig. 4 shows mesh analysis of 132 kV insulator string in normal
condition. Whereas Fig. 5 shows mesh analysis of 132 kV insulator string in polluted condition.
In mesh analysis the total specified region is divided into some triangles and it converges
according to the triangles. In case of polluted condition the specified region is larger than that of
in case of normal condition. As the electric field distribution is depend on the convergence
region or mesh region, so electric field distribution is higher in case of polluted condition than
that of normal condition.

Chapter 3 Results and discussions
17
Fig. 4: Mesh analysis of 132 kV insulator string in normal condition
Fig. 5: Mesh analysis of 132 kV insulator string in polluted condition

Chapter 3 Results and discussions
18
Fig. 6: Voltage distribution of 132 kV insulator string in normal condition
Firstly, calculation is performed for the case of normal condition (clean insulator string). Fig. 6
indicates the simulation result for voltage distribution in 7 units clean insulator string where the
supply voltage is 132 kV. It concluded that the voltage distribution is non-linear and non-
uniform along the surface of insulator string because of stray capacitances. The maximum
voltage is achieved at the insulator pin of the line end unit whereas the minimum voltage is
achieved at the insulator cap of the 7𝑡ℎunit in the insulator string. Therefore at high voltages
corona rings are connected with the composite insulators. The voltage between 1𝑠𝑡unit
and7𝑡ℎunit of the insulator string is distributed according to the capacitance and stray
capacitance to the line and to the ground.

Chapter 3 Results and discussions
19
Fig. 7: Electric field distribution of 132 kV insulator string in normal condition
Fig. 7 shows the electric field distribution of 7 units insulator string under normal condition
where the applied voltage is 132 kV. It is indicate that the electric field intensity is higher at
those points which are closer to energized end (insulator pin) than those points which are closer
to the grounded end (insulator cap). Also it is observed that, the magnitude of electric field has
higher values at the junction of (air-cap-porcelain), the junction of (air-pin-cement-porcelain),
near the section of a small radius of curvature and live-end-fitting.

Chapter 3 Results and discussions
20
Fig. 8: Electric field vector distribution of 132 kV insulator string in normal condition
Fig. 8 shows the electric field vector distribution of 7 units based insulator string where the
applied voltage is 132 kV in normal condition. The electric field vectors are stronger at the
junction of insulator pin-cement-porcelain. The electric field vectors are scattered throughout the
specified region.
Fig. 9: Voltage distribution of 132 kV insulator string in coastal pollutant condition
Chapter 3 Results and discussions
21
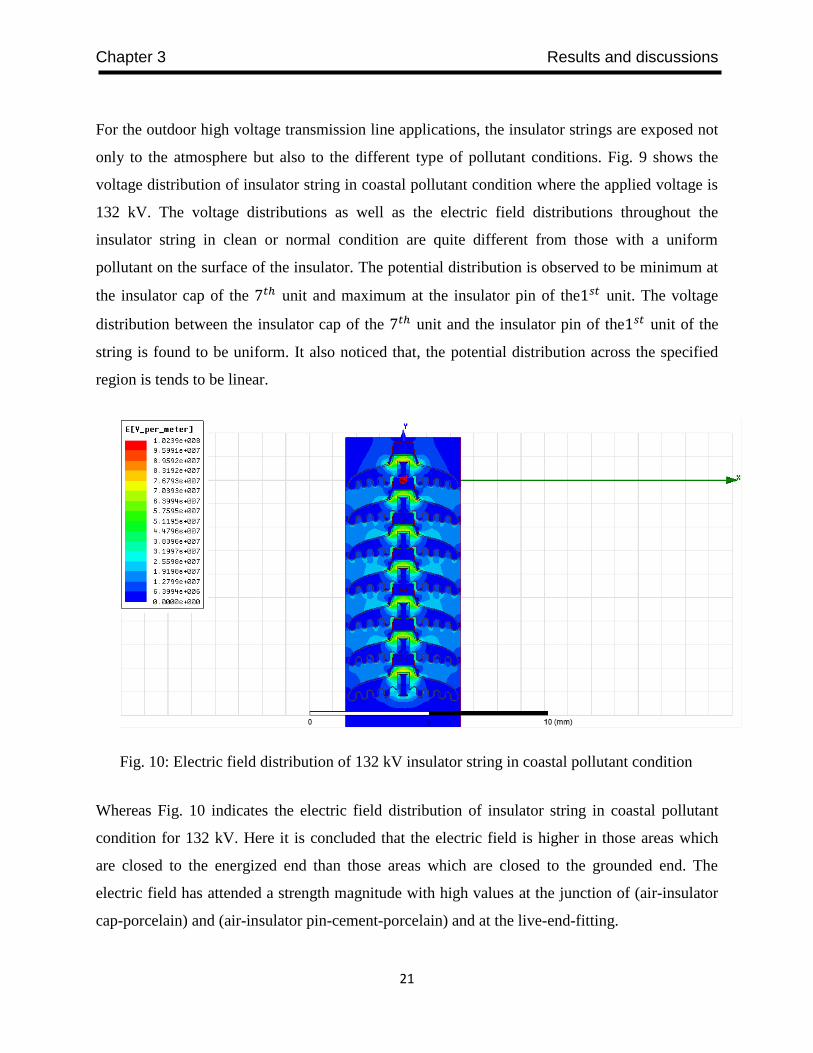
For the outdoor high voltage transmission line applications, the insulator strings are exposed not
only to the atmosphere but also to the different type of pollutant conditions. Fig. 9 shows the
voltage distribution of insulator string in coastal pollutant condition where the applied voltage is
132 kV. The voltage distributions as well as the electric field distributions throughout the
insulator string in clean or normal condition are quite different from those with a uniform
pollutant on the surface of the insulator. The potential distribution is observed to be minimum at
the insulator cap of the 7𝑡ℎ unit and maximum at the insulator pin of the1𝑠𝑡 unit. The voltage
distribution between the insulator cap of the 7𝑡ℎ unit and the insulator pin of the1𝑠𝑡 unit of the
string is found to be uniform. It also noticed that, the potential distribution across the specified
region is tends to be linear.
Fig. 10: Electric field distribution of 132 kV insulator string in coastal pollutant condition
Whereas Fig. 10 indicates the electric field distribution of insulator string in coastal pollutant
condition for 132 kV. Here it is concluded that the electric field is higher in those areas which
are closed to the energized end than those areas which are closed to the grounded end. The
electric field has attended a strength magnitude with high values at the junction of (air-insulator
cap-porcelain) and (air-insulator pin-cement-porcelain) and at the live-end-fitting.

Chapter 3 Results and discussions
22
Fig. 11: Electric field vector distribution of 132 kV insulator string in coastal pollutant
condition
Fig. 11 shows electric field vector distribution of 132 kV insulator string in case of coastal
pollutant. As electric field vector distribution mainly depends upon conductivity, so it has more
density in this case. The electric field vectors are going from more energized region to less
energized region (from insulator pin of the 1𝑠𝑡unit to insulator cap of the 7𝑡ℎunit).
Fig. 12: Voltage distribution of 132 kV insulator string in industrial pollutant condition

Chapter 3 Results and discussions
23
Fig. 12 shows the potential distribution in case of 132 kV insulator string where the insulator
surface is uniformly polluted by industrial pollutant. It is observed that the insulator pin of
1𝑠𝑡unit has maximum value whereas the insulator cap of 7𝑡ℎunit has minimum value and the
voltage between them is varied very firstly throughout the length. But the voltage distribution
across the specified area is approximately linear and uniform.
Fig. 13: Electric field distribution of 132 kV insulator string in industrial pollutant condition
The Fig. 13 indicates the electric field distribution across the 132 kV insulator string when the
surface of the insulator disc is polluted by industrial pollutants. It is observed that the electric
field intensity is higher at the energized end (insulator pin) than the electric field intensity at the
grounded end (insulator cap). The electric field has indicated its highest value as compare to its
all other values throughout the specified region is at the junction of air-insulator cap-porcelain
region. The other electric field high values are appeared at the junction of the air-insulator pin-
cement-porcelain region, near the sections with a smaller radius of curvature and live-end-fitting.

Chapter 3 Results and discussions
24
Fig. 14: Electric field vector distribution of 132 kV insulator string in industrial pollutant
condition
The Fig. 14 shows electric field vector distribution of 132 kV insulator string when the surface of
the insulator is polluted by uniformly covered industrial pollutant. It is observed that the electric
field vectors are attended its highest strength at the junction of insulator pin-cement-porcelain
when compared the strength of that with other regions in the specified area.
DISCUSSION
From the above results of voltage distribution, it is observed that the voltage distribution in case
of coastal pollution is more linear and more uniform than the others. The voltage distribution in
case of industrial pollution changes very firstly when compared to the other two cases. The
voltage distribution in case of clean insulator string (normal condition) is non-linear as well as
non-uniform. So from linearity and uniformity point of view voltage distribution in case of
industrial pollution stands in the middle.
From the above results of electric field distribution, it is concluded that the electric field
magnitude is maximum in case of coastal pollution when it compared with other cases. In all the
cases the maximum values are observed at the junction of insulator pin-cement-porcelain region.
The electric field magnitude distribution is least in case of clean or normal condition insulator
string and in case of industrial pollution it is moderate. Electric field increases with the increase
in the polluted layer conductivity in case of pollutant conditions.

Chapter 3 Results and discussions
25
From the above results of electric field vector distribution, it is observed that the density
of electric field vector is maximum in case of coastal pollution. As density of electric field vector
depends on conductivity of material and in case of coastal pollution, the pollutant material higher
conductivity than that of industrial pollutant. The electric field vector distribution density in the
specified region is minimum in case of clean or normal condition insulator string. In all the cases
the electric field vector density is more at the energized end (1𝑠𝑡unit of the insulator pin).
GRAPHICAL STUDY
Fig. 15: Creepage voltage distribution of insulator string in normal and coastal pollution
conditions

Chapter 3 Results and discussions
26
Fig. 16: Creepage voltage distribution of insulator string in normal and industrial pollution
conditions
Creepage distance is nothing but a shortest distance the two electrodes which is along the surface
of the insulator disc and that of the voltage is called creepage voltage.Fig. 15 shows the graphical
comparison of creepage voltage vs creepage distance between normal and coastal polluted
condition. Creepage distance must be increase in highly polluted sea salt areas. So, the creepage
voltage is higher in case of coastal pollution than that of in normal condition for the same
creepage distance. An average of 6.2% difference is observed when creepage voltage of coastal
pollutant condition compare with that of normal one. Fig. 16 shows the graphical comparison of
creepage voltage vs creepage distance between normal condition and industrial pollution
condition. The creepage voltage in case of industrial pollution lies below that of in case of
normal condition. An average of -3.5% difference is observed when creepage voltage of
industrial pollutant condition compare with that of normal condition.

Chapter 3 Results and discussions
27
Fig. 17: Creepage voltage distribution in all the environmental conditions
Fig. 17 shows the graphical comparison of creepage voltage vs creepage distance between all the
environmental conditions (normal condition, coastal pollutant condition and industrial pollutant
condition). Creepage distance is more important in design point of view. Because it is protected
from tracking and for localized deterioration on the insulating material of its surface is produced
a partially conducting root. It is observed that the creepage voltage in case of coastal pollution
condition is more than that of other two conditions and among all the conditions industrial
pollutant condition has least value of creepage voltage. An average of 9.7% difference is
observed when creepage voltage of coastal pollutant condition compare with that of industrial
pollutant condition.
Fig. 18 gives the graphical comparison 0f voltage gradient along the discs of the insulator
string in all the environment conditions (in normal, coastal polluted and industrial polluted
conditions). By comparison it is concluded that the voltage gradient is more uniform and linear
in case of coastal pollutant condition and least uniform and linear in normal condition. It is due
to the increase in line capacitance value because of high permittivity in case of coastal polluted
0 500 1000 1500 2000 25000
20
40
60
80
100
120
140
Creepage Distance in mm
Cre
epage V
oltage in k
V
Figure: Creepage Voltage distribution of insulator string in different environment conditions
Normal Condition
Industrial Pollution
Coastal Pollution

Chapter 3 Results and discussions
28
condition. So, that the capacitance ratio is increased (line capacitance divided by stray
capacitance).
Fig. 18: Voltage gradient comparison in all the environment conditions
Fig. 19 shows the electric field comparison in all the environment conditions (in normal, coastal
polluted and industrial polluted conditions). Here X-axis is leakage distance (meter) and Y-axis
is electric field (𝑘𝑉 𝑚⁄ ). Leakage distance is the shortest between the two conducting parts of the
insulator. Electric field point of view coastal polluted condition is more critical. Because electric
field is more in this case, due to which the chances of breakdown of dielectric strength of air is
more for it. As a result the occurrence of flashover and puncture is more here. It is also
concluded that it is more dangerous for first unit which is near to the live conductor. It is least
dangerous for normal condition. Therefore in polluted conditions it is preferred to use more
number of insulator unit in the string of same voltage level.
1 2 3 4 5 6 7 80
20
40
60
80
100
120
140
Disc number
Voltage g
radie
nt
in k
V
Normal Condition
Coastal Pollution
Industrial Pollution

Chapter 3 Results and discussions
29
Fig. 19: Electric field comparison in all the environment conditions
0 0.5 1 1.50
200
400
600
800
1000
1200
Leakage path distance (m)
Ele
ctric
Fie
ld (
kV/m
)
Normal Condition
Coastal Pollution
Industrial Pollution

Chapter 4 Conclusion and scope for future work
30
CHAPTER-4
CONCLUSION AND SCOPE FOR FUTURE WORK
Here a comprehensive Ansys Maxwell software based electrostatic finite element analysis of 132
kV suspension type porcelain insulator string has been presented in normal condition, in coastal
polluted condition and industrial polluted condition. It represents the voltage distribution, electric
field distribution and electric field vector distribution without writing any equation. It shows the
voltage and electric field at each and every point of the specified area in normal as well as in
polluted condition. As voltage attends its maximum value on the insulator pin of the first unit
(line end unit), so it is necessary to use a corona rings for high voltages in the case of composite
insulators. From the simulation results, the maximum value of electric field has achieved in all
the cases at the triple junction point (cement, porcelain and air). It is observed here the electric
field along the leakage path of the composite insulator at the conductivity of each polluted layer
has relatively the same patterns. The electric field increases with the increase in the polluted
layer conductivity. From the simulation results electric field vector distribution, it is concluded
that the electric field vector density is maximum in case of coastal pollution, as the conductivity
of pollutant material and insulating material has higher values when it compare with the values
of other conditions. Here a comparison between normal and polluted insulator string in the form
of creepage voltage vs creepage distance in graphical manner has been presented and the
creepage voltage in case of coastal pollutant condition has higher value than that of other two
conditions.
SCOPE FOR FUTURE WORK
There is a lot of scope for future work in this project. There is further modelling and simulation
in various cases of environmental conditions to study the flashover and puncture of insulator.
Observe the voltage and electric field distribution for non-uniformly distributed pollutants, as it
is more critical than uniformly polluted insulator string.

31
REFERENCES
[1] Y. Mizuno, H. Nakamura, K. Adomah and K. Naito, “Assessment of thermal
deterioration of transmission line conductor by probabilistic method,”IEEE Trans. Power
Del., vol. 13, pp. 266-271, 1998.
[2] SuatIlhan, AydoganOzdemir, “Voltage Distribution Effects of Non-Uniform Units in
Suspension Strings,” IEEE 978-1-4244-2190-9/07, 2007.
[3] V.T. Kontargyri, L.N. Plati, I.F. Gonos, I.A. Stathopulos and A.M. Michaelides,
“Measurement and simulation of the voltage distribution on an insulator string,
“University of Ljubljana, Elektroinštitut Milan Vidmar, Ljubljana, Slovenia, August,
2007.
[4] K. Siderakis, D. Agoris, J. Stefanakis and E. Thalassinakis, “Influence of the profile on
the performance of porcelain insulators installed in coastal high voltage networks in the
case of condensation wetting,” IEE Proceedings online no. 20050050,The Institution of
Engineering and Technology, 2006.
[5] Ehsan Azordegan ,BehzadKordi, David R. Swatek, “Radiated Electromagnetic Field
Signature of Faulty and Polluted Porcelain Insulators,” IEEE 978-1-4244-8286-3/10,
2010.
[6] Subba Reddy B, Satish Naik B, Udaya Kumar and L Satish, “Potential and Electric Field
Distribution in a Ceramic Disc Insulator String with Faulty Insulators,” IEEE 10th
International Conference on the Properties and Applications of Dielectric Materials July
24-28, 2012.
[7] EL-Tayeb Mohamed Maowed and AdelZein El Dein Mohammed Moussa, “Performance
of Ceramic Insulator String for 132 kVunder Different Polluted Conditions,”J. Energy
Power Sources Vol. 1, pp. 152-160, September 30, 2014.
[8] Looms, J.S.T., Insulators for High Voltages, Peter Peregrinus, London, 1988.
[9] Asenjo. E, Morales N, Valdenegro., “Solution of low frequency complex fields in
polluted insulators by means of the finite element method,”IEEE transactions on
dielectric and electric insulation. doi:10.1109/94.590856.
[10] Swarno, ArioBasuki, F Lendy, “Improving outdoor insulator performances installed at
coastal area using silicone rubber coating,”IEEE transactions, September 2012.
32
[11] G.H. Vaillancourt, J.P. Bellerive, M. St-jean, “New live line tester for porcelain
suspension insulators on high voltage power line,”IEEE Trans. Power Del., vol.9,
pp.208-219, Jan. 1994.
[12] Rasolonjanahary, J.L., Krähenbühl, L.andNicolas.A., “Computation of electric fields and
potential on polluted insulators using a boundary element method,” IEEE Trans. on
magnetics, vol.2, pp. 1473-1476, Feb.1992.
[13] Osama E. Gouda and Adel Z. El Dein, “Simulation of Overhead Transmission Line
Insulators (porcelain and composite types) under Desert Environments,”IEEE Trans. on
electrostatics, Dec.2009.
[14] Morales N, Asenjo E, Valdenegro A., “Field solution in polluted insulators with non-
symmetric boundary conditions,”IEEE Transactions on Dielectrics and Electrical
Insulation; vol.8, pp. 168–172, 2001.
[15] Zhao T, Comber G., “Calculation of electric field and potential distribution along non-
ceramic insulators considering the effects of conductors and transmission towers,”IEEE
Transactions Power Delivery; vol.15, pp. 313–318, 2000.
[16] S. M. A. Dhalaan and M. A. Elhirbawy, “Simulation of voltage distribution calculation
methods over a string of suspension insulators," Transmission and Distribution
Conference and Exposition, IEEE PES, vol.3, pp. 909- 914, Sept. 2003.
[17] M. Fazelian, C.Y. Wu, T.C. Cheng, H.I. Nour, L.J. Wang, “A study on the profile of
HVDC insulators dc flashover performance,” IEEE Transactions on Dielectrics and
Electrical Insulation, 24, 119-125, 1989.
[18] K. Takasu, T. Shindo, N. Arai, “Natural contamination test of insulators with DC voltage
energization at inland areas,”IEEE Transactions Power Delivery vol.3, pp. 1847-1853,
1998.
[19] H.SedighNezhad, A.Gholami, A.Jalilian, M.T.Hassanzadeh, “Performance improvement
of insulator string in polluted conditions”, Regular paper.
[20] Aydogmus, Zafer and Cebeci, Mehmet, “A new flashover dynamic model of polluted
high voltage insulators,” IEEE Transactions on Dielectrics and Electrical Insulation,
vol.11, pp. 4-13, August, 2004.
[21] A. E. Lastos, “Experience from insulators with RTV silicone rubbersheds and shed
coatings,” IEEE Trans. Power Del., vol. 5, pp. 2030-2038, Oct. 1990.

33
[22] H. P. Mercure, “Insulator pollution performance at high altitude: Major trends,” IEEE
Trans. Power Del., vol. 4, pp. 1461-1468, Apr. 1989.
[23] Gonos, I.F., Topalis, F.V., and Stathopoulos, I.A., “A model for the flashover process of
non-uniformly polluted insulators,” International Journal of Modelling and Simulation,
2002.
[24] C.L. Wadhwa, Electrical Power System, 2005.
APPENDIX
Dimension of single disc suspension insulator is
Diameter = 254mm
Height = 127mm
Leakage distance of single disc = 326mm
Supply voltage = 132 kV
Thickness of pollutant material in each disc = 0.07mm
Materials used ductile iron, forged iron, porcelain, cement, air and polluted material as the
combination of salt and carbon monoxide all are with their normal properties.


![Hydrodynamic calculation Butterfly valve (lenticular disc) [EN] calculation Butterfly valve... · Hydrodynamic calculation Butterfly valve (lenticular disc)!=0,262’ (=1,15’ Fig.1](https://img.pdfslide.us/doc/110x75/5e4d4893a5620b2b3175568a/hydrodynamic-calculation-butterfly-valve-lenticular-disc-en-calculation-butterfly.jpg)


![WELCOME [davcomanufacturing.com]...Knife change Fig. 4-1 Remove the disc inspection cover (1) in Fig. 4-1 to gain access to the top of the disc. Rotate the disc by hand until the first](https://img.pdfslide.us/doc/110x75/5f672ef35ec32550146dd56a/welcome-knife-change-fig-4-1-remove-the-disc-inspection-cover-1-in-fig.jpg)


![Published by · Simply post a photocopy of this completed coversheet to NAVTTC NAVTTC OFFICE ... 7 Disc Insulator [With Tension Set] 8 Earth Wire 9 Earthing Plate ... 19 Shackle Insulator](https://img.pdfslide.us/doc/110x75/601d6c31099adf2054757290/published-by-simply-post-a-photocopy-of-this-completed-coversheet-to-navttc-navttc.jpg)