Embed Size (px)
Citation preview
Journal of Mechanics Engineering and Automation 5 (2015) 39-44 doi: 10.17265/2159-5275/2015.01.006
Biomechanics of the Intervertebral Disc in Compression:
Experimental and Numerical Study
Ramiro Arturo González Gutiérrez, Vladimir Rangel Alonso and José Gustavo Zambrano Rosas
Department of Metalworking, Instituto Tecnológico de Tijuana, Tijuana 22414, Mexico
Received: November 04, 2014 / Accepted: November 17, 2014 / Published: January 25, 2015. Abstract: Loading history and age are factors for disc degeneration and disc biomechanics; however, their relationship is unclear. To evaluate disc biomechanics, we conducted an experimental, anatomical and numerical approach to distinguish discs with mild and severe degeneration. In the experimental procedure, 10 cadaveric lumbar discs are tested to static and dynamic compression, and the elastic and viscous moduli and the dynamic parameters are reported. The morphology of disc degeneration is gained with MRI (magnetic resonance imaging) and used to generate a nonlinear finite element model of a degenerated disc, and assisted with the experimental results in order to numerically investigate the distribution of stresses and strains within the disc. The results show a promising methodology for the study of intervertebral disc biomechanics and in general other tissues, organs and medical devices. Key words: Intervertebral disc, viscoelasticity, testing, magnetic resonance imaging, finite element model.
1. Introduction
The intervertebral disc is a fibrocartilage structure
composed of a nucleus pulpous, annulus fibrosis, and
cartilage endplate (Fig. 1). The disc along with the
facet joints carries all the loading to which the trunk
is subjected. This includes compression, shear,
bending and torsion, acting together statically or
dynamically [1].
The biomechanics of disc loading changes with age
and degeneration [1], and its study have been the
subject of numerous investigations: experimentally,
numerically, and clinically [2-5]. Testing discs in
compression serves to evaluate disc stiffness, Young’s
modulus, and storage and loss moduli [2-4]. From a
viscoelastic approach, degenerated discs have shown
a reduction in disc stiffness, movement, stress
relaxation and damping capacity [5]. Such results
represent valuable data as inputs into numerical
models, such as the FEM (finite element method), for
Corresponding author: Ramiro Arturo González Gutiérrez,
professor, Ph.D., research fields: mechanical design, biomechanics, finite element modeling. E-mail: [email protected].
Fig. 1 Intervertebral disc components.
investigating mechanical properties of the disc tissues
and the distribution of stress and strain inside the disc.
Thus, we developed one FEM of a degenerated disc
based on magnetic resonance imaging and
investigated the stress and strain distribution using
also testing results from a group of degenerated discs.
The paper is organized as follows: Sections 2-5 give
the materials and methodologies; Sections 6-8 present
the results from the MRI (magnetic resonance imaging)
inspection, testing and the FEM simulation,
respectively; Section 9 addresses the implications of
the results; and Section 10 gives the main conclusions.
2. The Specimens
Ten lumbar intervertebral discs from elderly donors
D DAVID PUBLISHING
Biomechanics of the Intervertebral Disc in Compression: Experimental and Numerical Study
40
obtained from Hospital Clinic of Barcelona, Spain
were used in this study. After dissection, all
specimens were examined to verify absence of any
disease, and measurements of the disc height and
cross section were recorded before the inspection with
MRI. The anatomical data are given in Table 1.
3. MRI Inspection
A Siemens Harmony™ system was used with a
spin-echo T1 and echo-gradient T2 sequences in
accordance with Ref. [6]. The tomography resolution
for all discs were 256 × 256 pixels, field of view of
10.4 mm × 10.4 mm; slide thickness of 0.4 mm, and
slide interspace of 0.4 mm. One tomography was used
for developing the FEM of disc degeneration, using
additionally MIMICS™ (MATERIALISETM, Leuven,
Belgium) and MARC MENTAT™ (MSC Software™,
Santa Ana CA, USA) software for treatment of
medical imaging, and stress and strain analyses,
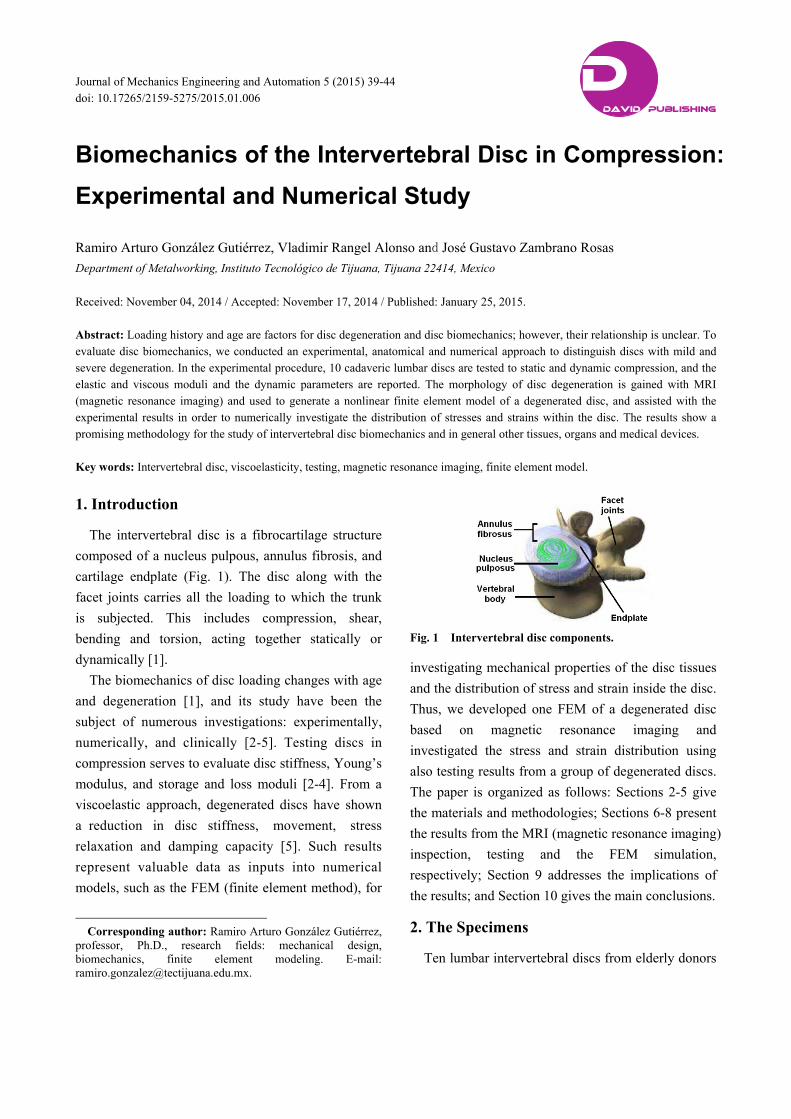
respectively. The procedure used in this study is
outlined in Fig. 2.
4. Experimental Protocol
Biomechanical testing to all intervertebral discs was
done at the biomaterials laboratory of the CMEM
Table 1 Mean and standard deviation of the disc age, size and height.
Discs Lumbar level
Sex F = Female M = Male
Age (years)
Cross section (mm2)
Height (mm)
n = 5 L23 F = 1, M = 4 70 (3.5) 1,739 (184)
9.8 (1.8)
n = 5 L45 F = 1, M = 4 70 (3.5) 1,951 (223)
10 (1.6)
Fig. 2 Procedure used.
(Departament of Materials Science and Metallurgy) of
the Polytechnic University of Catalonia. The
experimental protocol was based on previous studies
[2, 4] and included axial compression and dynamic
compression. The compressive modulus and stress
relaxation were determined using static loading and
adjusting data to a Kelvin-Voigt model as follows:
(1)
(2)
exp (3)
exp (4)
where, E is the compressive modulus, (t) is time
dependent strain, is viscosity, 0 is stress, 0 is strain,
ER is the relaxation modulus, tR is time decay from 0
to a stress equal to (1/exp)*0.
The disc storage E’ and loss E” moduli and
hysteresis H were determined using cyclic
compression and adjusting data as follows:
′ cos (5)
" sin (6)
tan"
′ (7)
H =[ d]load - [ d]unload (8)
where, is the phase shift between stress and strain,
and tan and H represents the ratio of storage to loss
moduli and the hysteresis, respectively.
5. Numerical Protocol
Thresholding of the disc and vertebrae was the first
step in creating the FEM. This task included creation
of masks for the various segmentations through
Boolean algebra, and identification of cortical and
cancellous bone from the vertebrae, and nucleus,
annulus, endplate and cavities from the disc. The
Biomechanics of the Intervertebral Disc in Compression: Experimental and Numerical Study
41
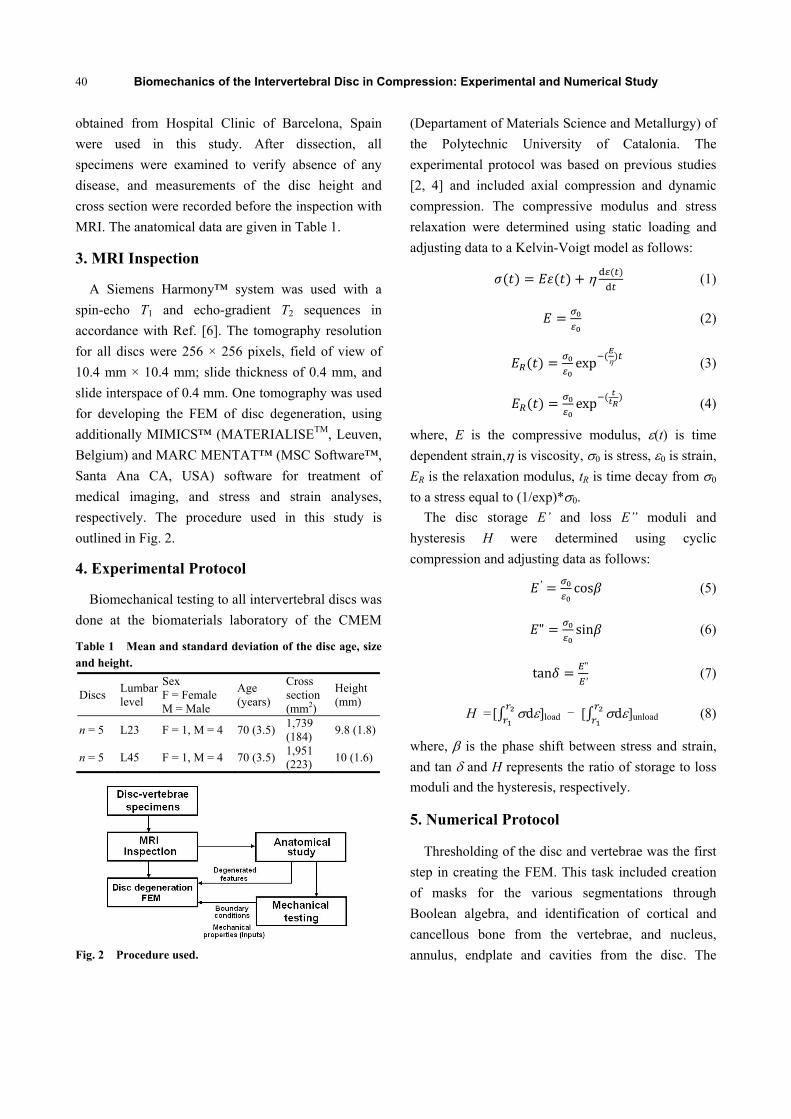
procedure in MIMICSTM is outlined in Fig. 3, and a
3D view of the regions of segmentation is shown in
Fig. 4.
The finite element mesh was created in MARC™
and was based on tetrahedral element # 157 with four
nodes, ideally suitable for incompressible materials.
Five models were developed base on the triangle size:
1 mm, 1.5 mm, 2 mm, 3 mm and 5 mm, which were in
accordance with the size of most degenerative features.
Material formulation included orthotrophy for cancellous
and cortical bone, with values of the Young’s moduli
in the range of 140 MPa < E < 22,000 MPa, Shear
modulus 48 MPa < G < 5,400 MPa, Poisson ratio 0.20
< < 0.48; disc materials were treated as
incompressible and elastomeric with a formulation
based on the Mooney-Rivlin solid model [7, 8]:
Fig. 3 Segmentation procedure for bone and disc.
Fig. 4 Disc model showing segmentation.
W = C1(I1 - 3) + C2(I2 - 3) (9)
where, I1 and I2 are the first and second invariant of
the Cauchy strain tensor, C1 and C2 are empiric
constants of the material with values shown in
Table 2.
The constants for the annulus fibrosus were kept fix
(C1 = 0.10 and C2 = 0.025) and only the constants for
the nucleus pulposus were adjusted, on the basis that
under compression, the main deformation occurs in
the nucleus [9]. The criterion used for the adjustment
of the Mooney-Rivlin constants were based on the
reaction F.D. (force difference) between those from
the simulation (Fs) and the testing (1,000 N), as
follows:
. . 1,000 (10)
All disc models were submitted to the same
boundary conditions corresponding to the
compression testing. The type of analysis used was a
nonlinear static and the displacements, reaction force,
stress and strain for the intervertebral disc and
vertebrae materials were investigated.
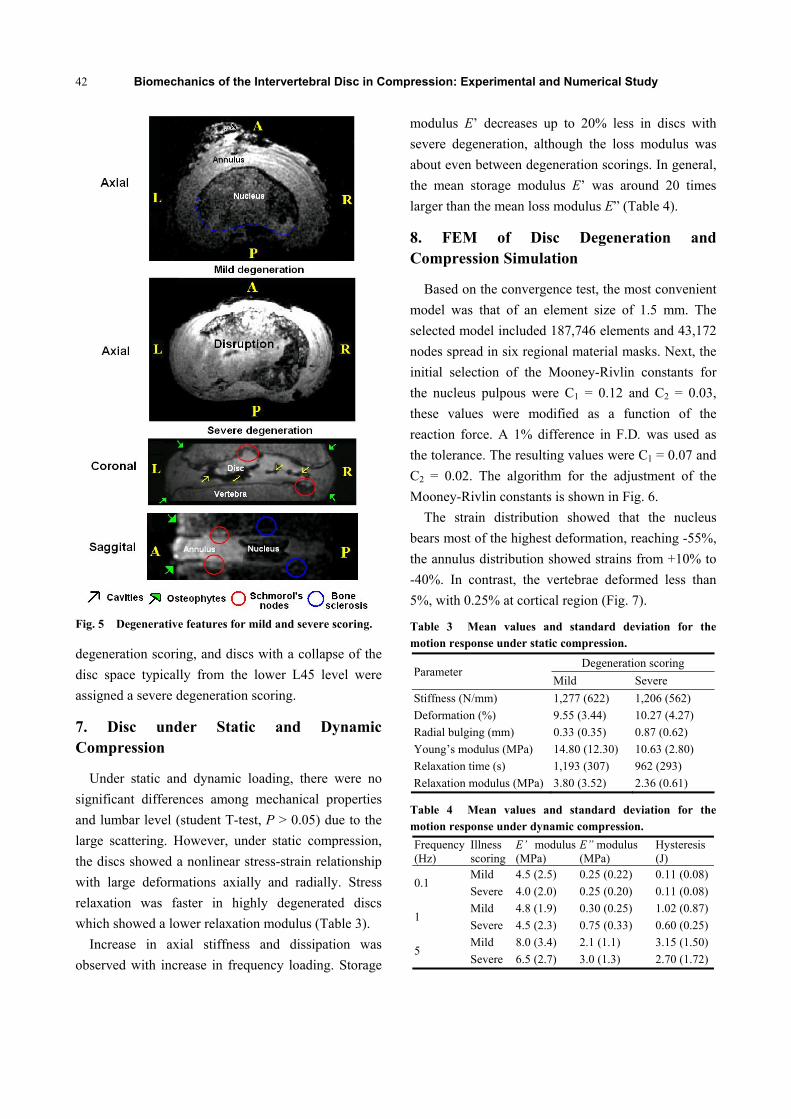
6. Degenerative Features with MRI
The MRI inspection revealed that the lumbar level
was sensitive with degeneration scoring (student T-test,
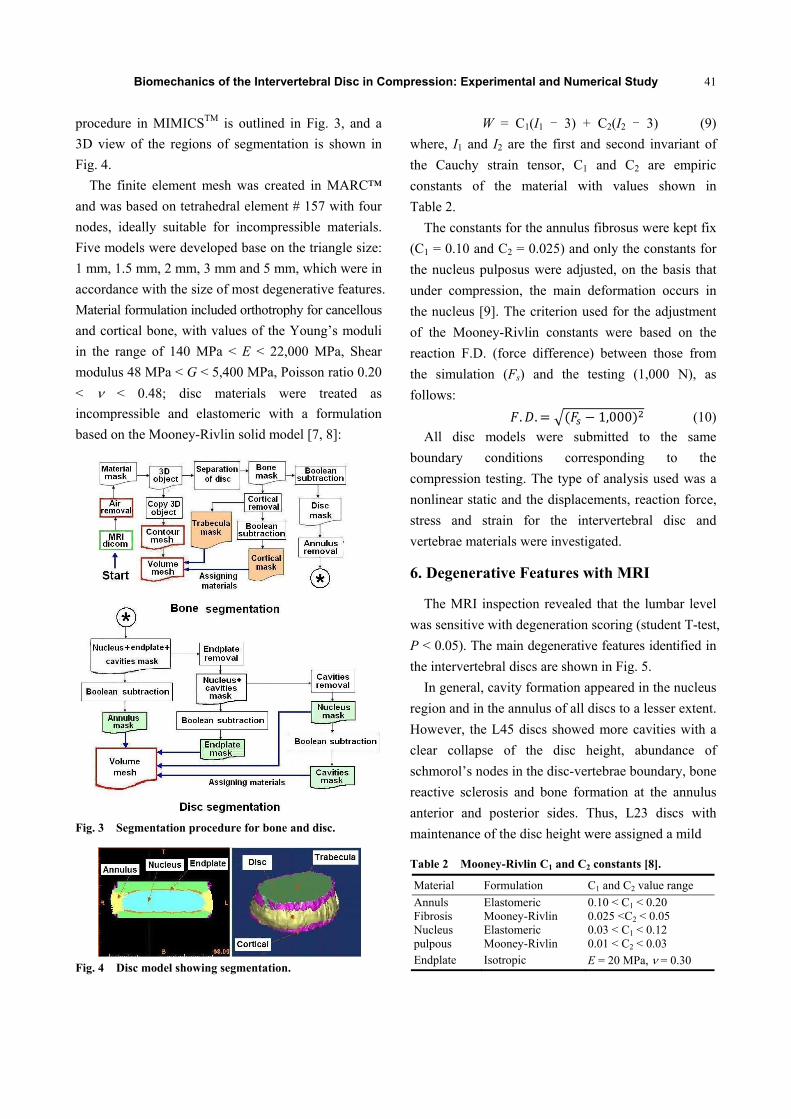
P < 0.05). The main degenerative features identified in
the intervertebral discs are shown in Fig. 5.
In general, cavity formation appeared in the nucleus
region and in the annulus of all discs to a lesser extent.
However, the L45 discs showed more cavities with a
clear collapse of the disc height, abundance of
schmorol’s nodes in the disc-vertebrae boundary, bone
reactive sclerosis and bone formation at the annulus
anterior and posterior sides. Thus, L23 discs with
maintenance of the disc height were assigned a mild
Table 2 Mooney-Rivlin C1 and C2 constants [8].
Material Formulation C1 and C2 value range
Annuls Fibrosis
Elastomeric Mooney-Rivlin
0.10 < C1 < 0.20 0.025 <C2 < 0.05
Nucleus pulpous
Elastomeric Mooney-Rivlin
0.03 < C1 < 0.12 0.01 < C2 < 0.03
Endplate Isotropic E = 20 MPa, = 0.30
Biomechanics of the Intervertebral Disc in Compression: Experimental and Numerical Study
42
Fig. 5 Degenerative features for mild and severe scoring.
degeneration scoring, and discs with a collapse of the
disc space typically from the lower L45 level were
assigned a severe degeneration scoring.
7. Disc under Static and Dynamic Compression
Under static and dynamic loading, there were no
significant differences among mechanical properties
and lumbar level (student T-test, P > 0.05) due to the
large scattering. However, under static compression,
the discs showed a nonlinear stress-strain relationship
with large deformations axially and radially. Stress
relaxation was faster in highly degenerated discs
which showed a lower relaxation modulus (Table 3).
Increase in axial stiffness and dissipation was
observed with increase in frequency loading. Storage
modulus E’ decreases up to 20% less in discs with
severe degeneration, although the loss modulus was
about even between degeneration scorings. In general,
the mean storage modulus E’ was around 20 times
larger than the mean loss modulus E” (Table 4).
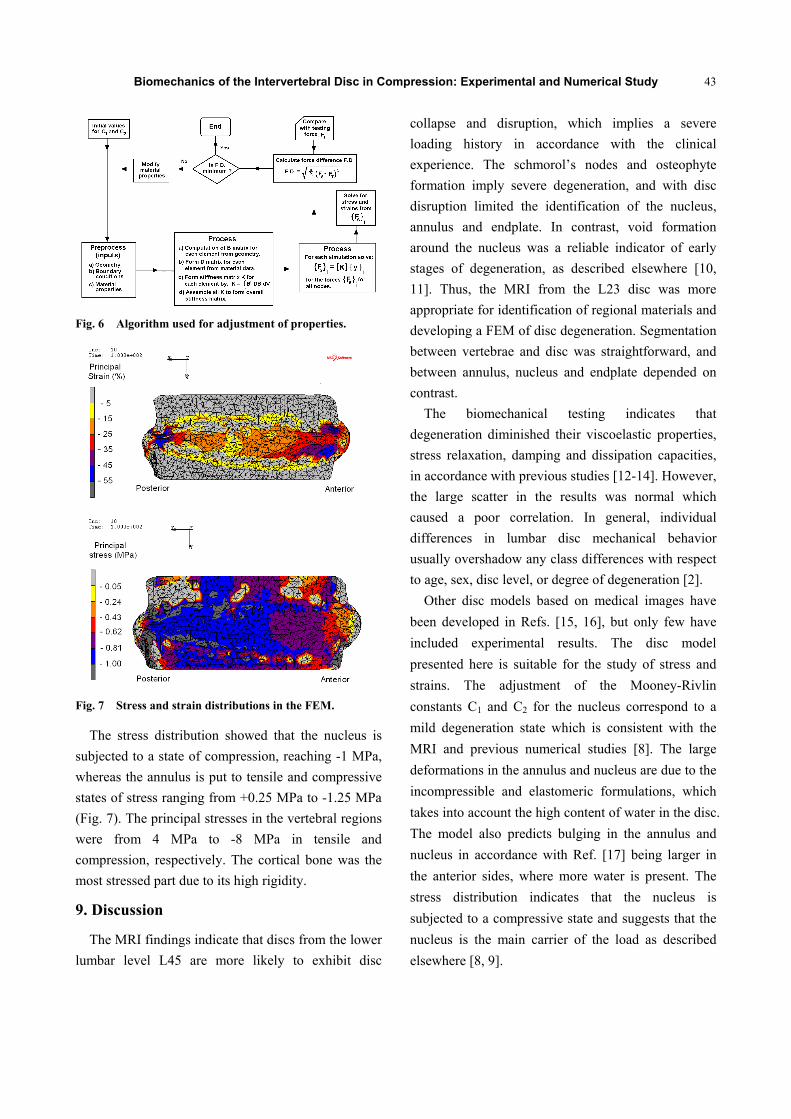
8. FEM of Disc Degeneration and Compression Simulation
Based on the convergence test, the most convenient
model was that of an element size of 1.5 mm. The
selected model included 187,746 elements and 43,172
nodes spread in six regional material masks. Next, the
initial selection of the Mooney-Rivlin constants for
the nucleus pulpous were C1 = 0.12 and C2 = 0.03,
these values were modified as a function of the
reaction force. A 1% difference in F.D. was used as
the tolerance. The resulting values were C1 = 0.07 and
C2 = 0.02. The algorithm for the adjustment of the
Mooney-Rivlin constants is shown in Fig. 6.
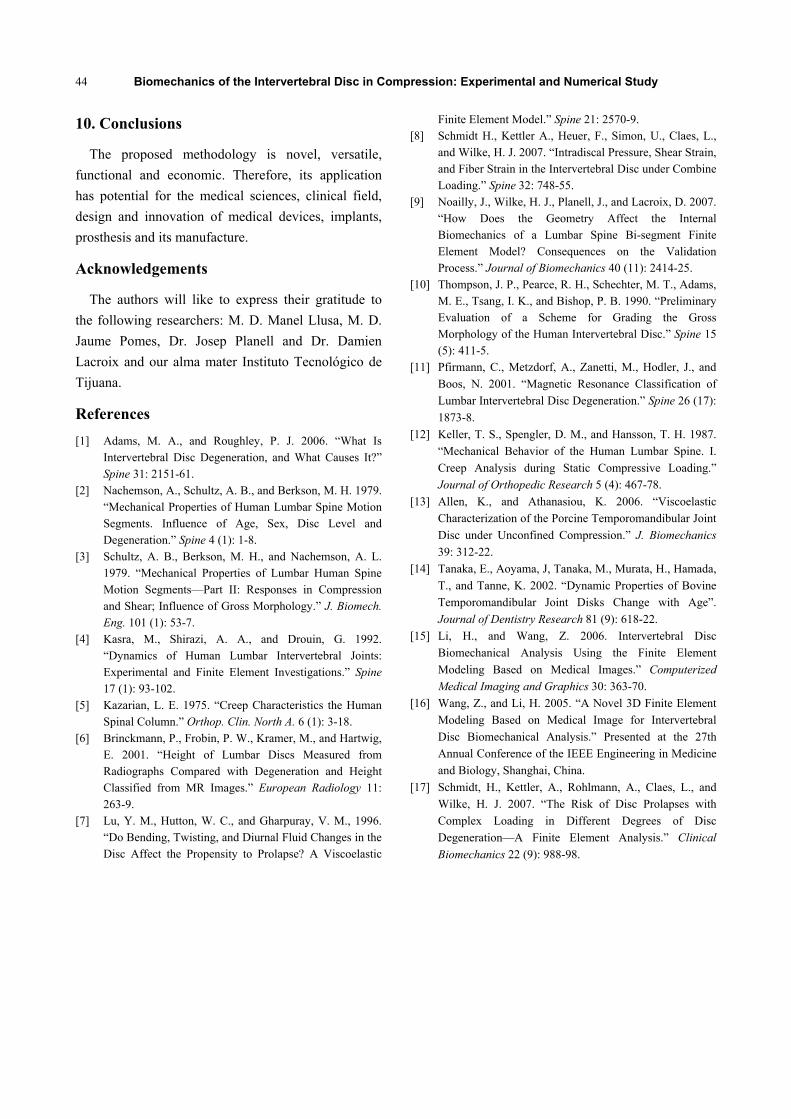
The strain distribution showed that the nucleus
bears most of the highest deformation, reaching -55%,
the annulus distribution showed strains from +10% to
-40%. In contrast, the vertebrae deformed less than
5%, with 0.25% at cortical region (Fig. 7).
Table 3 Mean values and standard deviation for the motion response under static compression.
Parameter Degeneration scoring
Mild Severe
Stiffness (N/mm) 1,277 (622) 1,206 (562)
Deformation (%) 9.55 (3.44) 10.27 (4.27)
Radial bulging (mm) 0.33 (0.35) 0.87 (0.62)
Young’s modulus (MPa) 14.80 (12.30) 10.63 (2.80)
Relaxation time (s) 1,193 (307) 962 (293)
Relaxation modulus (MPa) 3.80 (3.52) 2.36 (0.61)
Table 4 Mean values and standard deviation for the motion response under dynamic compression.
Frequency(Hz)
Illness scoring
E’ modulus (MPa)
E” modulus (MPa)
Hysteresis(J)
0.1 Mild 4.5 (2.5) 0.25 (0.22) 0.11 (0.08)
Severe 4.0 (2.0) 0.25 (0.20) 0.11 (0.08)
1 Mild 4.8 (1.9) 0.30 (0.25) 1.02 (0.87)
Severe 4.5 (2.3) 0.75 (0.33) 0.60 (0.25)
5 Mild 8.0 (3.4) 2.1 (1.1) 3.15 (1.50)
Severe 6.5 (2.7) 3.0 (1.3) 2.70 (1.72)
Biomechanics of the Intervertebral Disc in Compression: Experimental and Numerical Study
43
Fig. 6 Algorithm used for adjustment of properties.
Fig. 7 Stress and strain distributions in the FEM.
The stress distribution showed that the nucleus is
subjected to a state of compression, reaching -1 MPa,
whereas the annulus is put to tensile and compressive
states of stress ranging from +0.25 MPa to -1.25 MPa
(Fig. 7). The principal stresses in the vertebral regions
were from 4 MPa to -8 MPa in tensile and
compression, respectively. The cortical bone was the
most stressed part due to its high rigidity.
9. Discussion
The MRI findings indicate that discs from the lower
lumbar level L45 are more likely to exhibit disc
collapse and disruption, which implies a severe
loading history in accordance with the clinical
experience. The schmorol’s nodes and osteophyte
formation imply severe degeneration, and with disc
disruption limited the identification of the nucleus,
annulus and endplate. In contrast, void formation
around the nucleus was a reliable indicator of early
stages of degeneration, as described elsewhere [10,
11]. Thus, the MRI from the L23 disc was more
appropriate for identification of regional materials and
developing a FEM of disc degeneration. Segmentation
between vertebrae and disc was straightforward, and
between annulus, nucleus and endplate depended on
contrast.
The biomechanical testing indicates that
degeneration diminished their viscoelastic properties,
stress relaxation, damping and dissipation capacities,
in accordance with previous studies [12-14]. However,
the large scatter in the results was normal which
caused a poor correlation. In general, individual
differences in lumbar disc mechanical behavior
usually overshadow any class differences with respect
to age, sex, disc level, or degree of degeneration [2].
Other disc models based on medical images have
been developed in Refs. [15, 16], but only few have
included experimental results. The disc model
presented here is suitable for the study of stress and
strains. The adjustment of the Mooney-Rivlin
constants C1 and C2 for the nucleus correspond to a
mild degeneration state which is consistent with the
MRI and previous numerical studies [8]. The large
deformations in the annulus and nucleus are due to the
incompressible and elastomeric formulations, which
takes into account the high content of water in the disc.
The model also predicts bulging in the annulus and
nucleus in accordance with Ref. [17] being larger in
the anterior sides, where more water is present. The
stress distribution indicates that the nucleus is
subjected to a compressive state and suggests that the
nucleus is the main carrier of the load as described
elsewhere [8, 9].
Biomechanics of the Intervertebral Disc in Compression: Experimental and Numerical Study
44
10. Conclusions
The proposed methodology is novel, versatile,
functional and economic. Therefore, its application
has potential for the medical sciences, clinical field,
design and innovation of medical devices, implants,
prosthesis and its manufacture.
Acknowledgements
The authors will like to express their gratitude to
the following researchers: M. D. Manel Llusa, M. D.
Jaume Pomes, Dr. Josep Planell and Dr. Damien
Lacroix and our alma mater Instituto Tecnológico de
Tijuana.
References
[1] Adams, M. A., and Roughley, P. J. 2006. “What Is Intervertebral Disc Degeneration, and What Causes It?” Spine 31: 2151-61.
[2] Nachemson, A., Schultz, A. B., and Berkson, M. H. 1979. “Mechanical Properties of Human Lumbar Spine Motion Segments. Influence of Age, Sex, Disc Level and Degeneration.” Spine 4 (1): 1-8.
[3] Schultz, A. B., Berkson, M. H., and Nachemson, A. L. 1979. “Mechanical Properties of Lumbar Human Spine Motion Segments—Part II: Responses in Compression and Shear; Influence of Gross Morphology.” J. Biomech. Eng. 101 (1): 53-7.
[4] Kasra, M., Shirazi, A. A., and Drouin, G. 1992. “Dynamics of Human Lumbar Intervertebral Joints: Experimental and Finite Element Investigations.” Spine 17 (1): 93-102.
[5] Kazarian, L. E. 1975. “Creep Characteristics the Human Spinal Column.” Orthop. Clin. North A. 6 (1): 3-18.
[6] Brinckmann, P., Frobin, P. W., Kramer, M., and Hartwig, E. 2001. “Height of Lumbar Discs Measured from Radiographs Compared with Degeneration and Height Classified from MR Images.” European Radiology 11: 263-9.
[7] Lu, Y. M., Hutton, W. C., and Gharpuray, V. M., 1996. “Do Bending, Twisting, and Diurnal Fluid Changes in the Disc Affect the Propensity to Prolapse? A Viscoelastic
Finite Element Model.” Spine 21: 2570-9. [8] Schmidt H., Kettler A., Heuer, F., Simon, U., Claes, L.,
and Wilke, H. J. 2007. “Intradiscal Pressure, Shear Strain, and Fiber Strain in the Intervertebral Disc under Combine Loading.” Spine 32: 748-55.
[9] Noailly, J., Wilke, H. J., Planell, J., and Lacroix, D. 2007. “How Does the Geometry Affect the Internal Biomechanics of a Lumbar Spine Bi-segment Finite Element Model? Consequences on the Validation Process.” Journal of Biomechanics 40 (11): 2414-25.
[10] Thompson, J. P., Pearce, R. H., Schechter, M. T., Adams, M. E., Tsang, I. K., and Bishop, P. B. 1990. “Preliminary Evaluation of a Scheme for Grading the Gross Morphology of the Human Intervertebral Disc.” Spine 15 (5): 411-5.
[11] Pfirmann, C., Metzdorf, A., Zanetti, M., Hodler, J., and
Boos, N. 2001. “Magnetic Resonance Classification of
Lumbar Intervertebral Disc Degeneration.” Spine 26 (17):
1873-8.
[12] Keller, T. S., Spengler, D. M., and Hansson, T. H. 1987.
“Mechanical Behavior of the Human Lumbar Spine. I.
Creep Analysis during Static Compressive Loading.”
Journal of Orthopedic Research 5 (4): 467-78.
[13] Allen, K., and Athanasiou, K. 2006. “Viscoelastic
Characterization of the Porcine Temporomandibular Joint
Disc under Unconfined Compression.” J. Biomechanics
39: 312-22.
[14] Tanaka, E., Aoyama, J, Tanaka, M., Murata, H., Hamada,
T., and Tanne, K. 2002. “Dynamic Properties of Bovine
Temporomandibular Joint Disks Change with Age”.
Journal of Dentistry Research 81 (9): 618-22.
[15] Li, H., and Wang, Z. 2006. Intervertebral Disc
Biomechanical Analysis Using the Finite Element
Modeling Based on Medical Images.” Computerized
Medical Imaging and Graphics 30: 363-70.
[16] Wang, Z., and Li, H. 2005. “A Novel 3D Finite Element
Modeling Based on Medical Image for Intervertebral
Disc Biomechanical Analysis.” Presented at the 27th
Annual Conference of the IEEE Engineering in Medicine
and Biology, Shanghai, China.
[17] Schmidt, H., Kettler, A., Rohlmann, A., Claes, L., and
Wilke, H. J. 2007. “The Risk of Disc Prolapses with
Complex Loading in Different Degrees of Disc
Degeneration—A Finite Element Analysis.” Clinical
Biomechanics 22 (9): 988-98.