Embed Size (px)
Citation preview

Measurement of Locomotive Head End Power Engine Fuel and Emissions
Draft Final Report
Prepared by:
H. Christopher Frey and Jiangchuan Hu
Department of Civil, Construction, and Environmental Engineering
North Carolina State University
Raleigh, NC
Prepared for:
North Carolina Department of Transportation
Raleigh, NC
September 1, 2015
i
REPORT DOCUMENTATION PAGE Form Approved OMB No. 0704-0188
Public reporting burden for this collection of information is estimated to average 1 hour per response, including the time for reviewing instructions, searching existing data sources, gathering and maintaining the data needed, and completing and reviewing the collection of information. Send comments regarding this burden estimate or any other aspect of this collection of information, including suggestions for reducing this burden, to Washington Headquarters Services, Directorate for Information Operations and Reports, 1215 Jefferson Davis Highway, Suite 1204, Arlington, VA 22202-4302, and to the Office of Management and Budget, Paperwork Reduction Project (0704-0188), Washington, DC 20503.
1. AGENCY USE ONLY (Leave blank)
2. REPORT DATE September 2015
3. REPORT TYPE AND DATES COVERED Technical Report
4. TITLE AND SUBTITLE Measurement of Locomotive Head End Power Engine Fuel and Emissions
5. FUNDING NUMBERS
6. AUTHOR(S) H. Christopher Frey and Jiangchuan Hu
7. PERFORMING ORGANIZATION NAME(S) AND ADDRESS(ES) Department of Civil, Construction, and Environmental Engineering North Carolina State University Campus Box 7908 Raleigh, NC 27695-7908
8. PERFORMING ORGANIZATION REPORT NUMBER
9. SPONSORING/MONITORING AGENCY NAME(S) AND ADDRESS(ES) North Carolina Department of Transportation Raleigh, NC
10. SPONSORING/MONITORING AGENCY REPORT NUMBER
11. SUPPLEMENTARY NOTES COTR: 12a. DISTRIBUTION/AVAILABILITY STATEMENT This document is available to the public.
12b. DISTRIBUTION CODE
13. ABSTRACT (Maximum 200 words) In the U.S., there were more than 5,000 commuter rail diesel locomotives in use in 2011. Many of these have head end power (HEP) engines that provide power for hotel services in the passenger cars. The North Carolina Department of Transportation owns six diesel passenger locomotives that have recently replaced HEP engines. The general goal of this work is to quantify the in-use emission rates of these engines on ultra low sulfur diesel (ULSD) fuel and evaluate the effect of soy-based B20 biodisel fuel on each engine. The specific research objectives are to: (1) evaluate the effect of engine load on emission rates of CO, HC, NOx, and PM; (2) compare B20 versus ULSD with respect to emission rates of CO, HC, NOx, and PM; (3) compare to emission standards taking into account differences in measurement methods; (4) evaluate the inter-engine variability in emission rates; and (5) estimate an emission inventory of CO, HC, NOx, and PM for the HEP engines. As expected, fuel use and emission rates are sensitive to engine load. Cycle average PM emission rates were 20% lower for B20 than for ULSD, with no significant measured change in emission rates of other pollutants.
14. SUBJECT TERMS Railroad transportation, Diesel electric locomotives, Emissions testing
15. NUMBER OF PAGES 97
16. PRICE CODE
17. SECURITY CLASSIFICATION OF REPORT Unclassified
18. SECURITY CLASSIFICATION OF THIS PAGE Unclassified
19. SECURITY CLASSIFICATION OF ABSTRACT Unclassified
20. LIMITATION OF ABSTRACT

ii
Acknowledgement
This work was made possible by the in-kind technical and logistical support on the part of many people, including Allan Paul, Sharon Mahoney, and Kyle Anderson from the North Carolina Department of Transportation Rail Division, Curtis McDowell and Lynn Harris from McDowell Engineers, all of the NCDOT Capital Railyard onsite contractors from Herzog Transit Services NC and RailPlan International, Inc.

iii
Table of Contents
Acknowledgement ........................................................................................................................... i
List of Tables .................................................................................................................................. v
List of Figures ................................................................................................................................ ix
1. Introduction ................................................................................................................. 1
1.1 Background ................................................................................................................. 1
1.2 Objectives .................................................................................................................... 3
1.3 Scope ........................................................................................................................... 3
2. Method......................................................................................................................... 4
2.1 Study Design ............................................................................................................... 4
2.2 Instruments .................................................................................................................. 4
2.3 Data Collection ............................................................................................................ 8
2.4 Quality Assurance ..................................................................................................... 10
2.5 Data Analysis ............................................................................................................ 11
3. Results ....................................................................................................................... 14
3.1 Example Detailed Results for NC 1755 Head End Power Engine on Ultra-Low Sulfur Diesel .............................................................................................................. 14
3.2 Results for FID/NDIR HC and NOx/NO Ratios ........................................................ 16
3.3 Summary of Fuel Use and Emission Rates ............................................................... 18
3.4 Comparison to U.S. EPA Standards .......................................................................... 29
3.5 Inter-Engine Variability ............................................................................................ 31
3.6 Estimating Emission Inventory ................................................................................. 31
4. Conclusions ............................................................................................................... 33
5. References ................................................................................................................. 35
Appendix A. Results for NC 1755 HEP Engine ......................................................................... A-1
A1 NC 1755 on ULSD .................................................................................................. A-1
A2 NC 1755 on B20 ...................................................................................................... A-5
Appendix B. Results for NC 1797 HEP Engine ......................................................................... A-9
B1 NC 1797 on ULSD .................................................................................................. A-9
iv
B2 NC 1797 on B20 .................................................................................................... A-13
Appendix C. Results for NC 1893 HEP Engine ....................................................................... A-17
C1 NC 1893 on ULSD ................................................................................................ A-17
C2 NC 1893 on B20 .................................................................................................... A-21
Appendix D. Results for NC 1810 HEP Engine ....................................................................... A-25
D1 NC 1810 on ULSD ................................................................................................ A-25
D2 NC 1810 on B20 .................................................................................................... A-29
Appendix E. Results for NC 1859 HEP Engine ....................................................................... A-33
E1 NC 1859 on ULSD ................................................................................................ A-33
E2 NC 1859 on B20 .................................................................................................... A-37
Appendix F. Results for NC 1869 HEP Engine........................................................................ A-41
F1 NC 1869 on ULSD ................................................................................................ A-41
F2 NC 1869 on B20 .................................................................................................... A-45

v
List of Tables
Table 2-1 Test Cycle Used in Head-End Power (HEP) Engine Rail Yard Measurement .........10
Table 2-2 Summary of EPA Non-Road Diesel Engine Emission Standards .............................13
Table 3-1 Observed Load, Engine Output, Time-Based Fuel Use and Engine Output-Based Emission Rates for Locomotive NC 1755 Caterpillar C18 ACERTTM Head End Power Engine Operated on Ultra Low Sulfur Diesel (ULSD) ...............15
Table 3-2 Observed Load, Engine Output, and Time-Based Fuel Use Rates for Each Locomotive Head End Power Engine Operated on Ultra-Low Sulfur Diesel ........20
Table 3-3 Engine Output-Based Emission Rates for Each Locomotive Head End Power Engine Operated on Ultra-Low Sulfur Diesel .........................................................21
Table 3-4 Observed Load, Engine Output, and Time-Based Fuel Use Rates for Each Locomotive Head End Power Engine Operated on B20 Biodiesel .........................22
Table 3-5 Engine Output-Based Emission Rates for Each Locomotive Head End Power Engine Operated on B20 Biodiesel .........................................................................23
Table 3-6 Guide to Detailed Results in Appendices for Each Locomotive Head End Power (HEP) Engine on Each of Ultra-Low Sulfur Diesel (ULSD) and B20 Biodiesel ..................................................................................................................24
Table 3-7 Comparison of Cycle Average Engine Output-Based Emission Rates for Each Pollutant Measured by Locomotive Head End Power (HEP) Engine and Fuel ......28
Table 3-8 Cycle Average Emission Rates for Each Locomotive Head End Power (HEP) Engine on Each of Ultra-Low Sulfur Diesel (ULSD) and B20 Biodiesel Compared to U.S. Environmental Protection Agency Standards ............................30
Table 3-9 Estimated Annual Emission Inventory for Each Locomotive Head End Power (HEP) Engine on Each of Ultra-Low Sulfur Diesel (ULSD) and B20 Biodiesel ..................................................................................................................32
Table A-1 Observed Load, Engine Output, and Time-Based Fuel Use and Emission Rates for Locomotive NC 1755 on ULSD. .......................................................... A-3
Table A-2 Observed Load, Engine Output, and Engine Output-Based Fuel Use and Emission Rates for NC 1755 on ULSD. ............................................................... A-3
Table A-3 Observed Load, Engine Output, and Fuel-Based Fuel Use and Emission Rates for NC 1755 on ULSD. ........................................................................................ A-4
Table A-4 Observed Load, Engine Output, and Engine Activities for NC 1755 on ULSD ... A-4
Table A-5 Observed Load, Engine Output, and Time-Based Fuel Use and Emission Rates for Locomotive NC 1755 on B20. .............................................................. A-7

vi
Table A-6 Observed Load, Engine Output, and Engine Output-Based Fuel Use and Emission Rates for NC 1755 on B20. .................................................................. A-7
Table A-7 Observed Load, Engine Output, and Fuel-Based Fuel Use and Emission Rates for NC 1755 on B20. ............................................................................................ A-8
Table A-8 Observed Load, Engine Output, and Engine Activities for NC 1755 on B20 ....... A-8
Table B-1 Observed Load, Engine Output, and Time-Based Fuel Use and Emission Rates for Locomotive NC 1797 on ULSD. ........................................................ A-11
Table B-2 Observed Load, Engine Output, and Engine Output-Based Fuel Use and Emission Rates for NC 1797 on ULSD. ............................................................. A-11
Table B-3 Observed Load, Engine Output, and Fuel-Based Fuel Use and Emission Rates for NC 1797 on ULSD. ...................................................................................... A-12
Table B-4 Observed Load, Engine Output, and Engine Activities for NC 1797 on ULSD . A-12
Table B-5 Observed Load, Engine Output, and Time-Based Fuel Use and Emission Rates for Locomotive NC 1797 on B20. ............................................................ A-15
Table B-6 Observed Load, Engine Output, and Engine Output-Based Fuel Use and Emission Rates for NC 1797 on B20. ................................................................ A-15
Table B-7 Observed Load, Engine Output, and Fuel-Based Fuel Use and Emission Rates for NC 1797 on B20. .......................................................................................... A-16
Table B-8 Observed Load, Engine Output, and Engine Activities for NC 1797 on B20 ..... A-16
Table C-1 Observed Load, Engine Output, and Time-Based Fuel Use and Emission Rates for Locomotive NC 1893 on ULSD. ........................................................ A-19
Table C-2 Observed Load, Engine Output, and Engine Output-Based Fuel Use and Emission Rates for NC 1893 on ULSD. ............................................................. A-19
Table C-3 Observed Load, Engine Output, and Fuel-Based Fuel Use and Emission Rates for NC 1893 on ULSD. ...................................................................................... A-20
Table C-4 Observed Load, Engine Output, and Engine Activities for NC 1893 on ULSD . A-20
Table C-5 Observed Load, Engine Output, and Time-Based Fuel Use and Emission Rates for Locomotive NC 1893 on B20. ............................................................ A-23
Table C-6 Observed Load, Engine Output, and Engine Output-Based Fuel Use and Emission Rates for NC 1893 on B20. ................................................................ A-23
Table C-7 Observed Load, Engine Output, and Fuel-Based Fuel Use and Emission Rates for NC 1893 on B20. .......................................................................................... A-24
Table C-8 Observed Load, Engine Output, and Engine Activities for NC 1893 on B20 ..... A-24

vii
Table D-1 Observed Load, Engine Output, and Time-Based Fuel Use and Emission Rates for Locomotive NC 1810 on ULSD. ........................................................ A-27
Table D-2 Observed Load, Engine Output, and Engine Output-Based Fuel Use and Emission Rates for NC 1810 on ULSD. ............................................................. A-27
Table D-3 Observed Load, Engine Output, and Fuel-Based Fuel Use and Emission Rates for NC 1810 on ULSD. ...................................................................................... A-28
Table D-4 Observed Load, Engine Output, and Engine Activities for NC 1810 on ULSD . A-28
Table D-5 Observed Load, Engine Output, and Time-Based Fuel Use and Emission Rates for Locomotive NC 1810 on B20. ............................................................ A-31
Table D-6 Observed Load, Engine Output, and Engine Output-Based Fuel Use and Emission Rates for NC 1810 on B20. ................................................................ A-31
Table D-7 Observed Load, Engine Output, and Fuel-Based Fuel Use and Emission Rates for NC 1810 on B20. .......................................................................................... A-32
Table D-8 Observed Load, Engine Output, and Engine Activities for NC 1810 on B20 ..... A-32
Table E-1 Observed Load, Engine Output, and Time-Based Fuel Use and Emission Rates for Locomotive NC 1859 on ULSD. ........................................................ A-35
Table E-2 Observed Load, Engine Output, and Engine Output-Based Fuel Use and Emission Rates for NC 1859 on ULSD. ............................................................. A-35
Table E-3 Observed Load, Engine Output, and Fuel-Based Fuel Use and Emission Rates for NC 1859 on ULSD. ...................................................................................... A-36
Table E-4 Observed Load, Engine Output, and Engine Activities for NC 1859 on ULSD . A-36
Table E-5 Observed Load, Engine Output, and Time-Based Fuel Use and Emission Rates for Locomotive NC 1859 on B20. ............................................................ A-39
Table E-6 Observed Load, Engine Output, and Engine Output-Based Fuel Use and Emission Rates for NC 1859 on B20. ................................................................ A-39
Table E-7 Observed Load, Engine Output, and Fuel-Based Fuel Use and Emission Rates for NC 1859 on B20. .......................................................................................... A-40
Table E-8 Observed Load, Engine Output, and Engine Activities for NC 1859 on B20 ..... A-40
Table F-1 Observed Load, Engine Output, and Time-Based Fuel Use and Emission Rates for Locomotive NC 1869 on ULSD. .................................................................. A-43
Table F-2 Observed Load, Engine Output, and Engine Output-Based Fuel Use and Emission Rates for NC 1869 on ULSD. ............................................................. A-43
Table F-3 Observed Load, Engine Output, and Fuel-Based Fuel Use and Emission Rates for NC 1869 on ULSD. ...................................................................................... A-44

viii
Table F-4 Observed Load, Engine Output, and Engine Activities for NC 1869 on ULSD.. A-44
Table F-5 Observed Load, Engine Output, and Time-Based Fuel Use and Emission Rates for Locomotive NC 1869 on B20. ...................................................................... A-47
Table F-6 Observed Load, Engine Output, and Engine Output-Based Fuel Use and Emission Rates for NC 1869 on B20. ................................................................ A-47
Table F-7 Observed Load, Engine Output, and Fuel-Based Fuel Use and Emission Rates for NC 1869 on B20. .......................................................................................... A-48
Table F-8 Observed Load, Engine Output, and Engine Activities for NC 1869 on B20 ..... A-48

ix
List of Figures
Figure 2-1 Pictures of the Axion and SEMTECH-DS Portable Emission Measurement Systems. ............................................................................................ 5
Figure 2-2 Caterpillar "Electronic Technician" Communication Adapter and the Laptop Connected for Logging Engine Control Unit Data. .................................... 6
Figure 2-3 Pictures of the Load Box, Connection Cables to the Locomotive, Digital Control Panel, and Load Control Switches. ............................................................ 7
Figure 2-4 Deployment of the Instruments and Connection of the Exhaust Sampling Lines ........................................................................................................................ 9
Figure 2-5 Relationship between Engine Power and Load Percentage for the Two Types of Head End Power Engines ....................................................................... 12
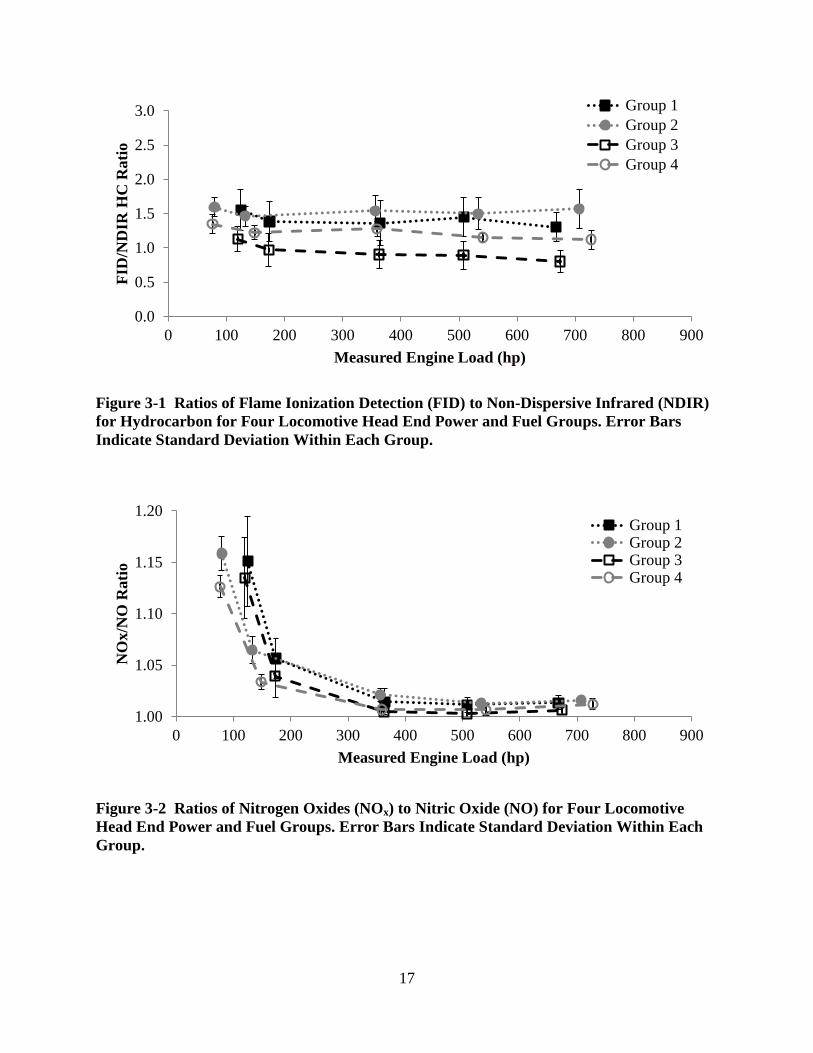
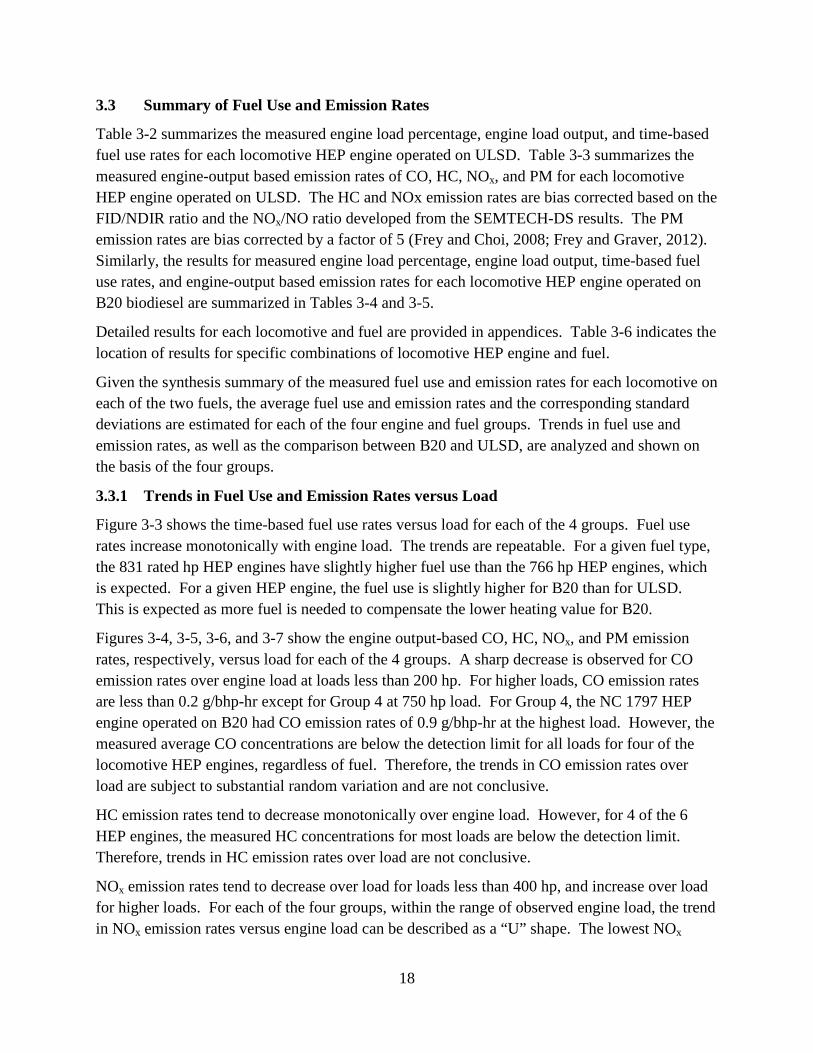
Figure 3-1 Ratios of Flame Ionization Detection (FID) to Non-Dispersive Infrared (NDIR) for Hydrocarbon for Four Locomotive Head End Power and Fuel Groups. Error Bars Indicate Standard Deviation Within Each Group. .................................................................................................................... 17
Figure 3-2 Ratios of Nitrogen Oxides (NOx) to Nitric Oxide (NO) for Four Locomotive Head End Power and Fuel Groups. Error Bars Indicate Standard Deviation Within Each Group. ............................................................... 17
Figure 3-3 Time-based Fuel Use Rates versus Measured Engine Load for Locomotive Head End Power Engines Operated on Ultra-Low Sulfur Diesel (ULSD) and B20 Biodiesel. Error Bars Indicate Standard Deviation Within Each Group. .............................................................................. 24
Figure 3-4 Engine Output-based Carbon Monoxide (CO) Emission Rates versus Measured Engine Load for Locomotive Head End Power Engines Operated on Ultra-Low Sulfur Diesel (ULSD) and B20 Biodiesel. Error Bars Indicate Standard Deviation Within Each Group. ........................................ 25
Figure 3-5 Engine Output-based Hydrocarbon (HC) Emission Rates versus Measured Engine Load for Locomotive Head End Power Engines Operated on Ultra-Low Sulfur Diesel (ULSD) and B20 Biodiesel. Error Bars Indicate Standard Deviation Within Each Group. ................................................. 25
Figure 3-6 Engine Output-based Nitrogen Oxides (NOx) Emission Rates versus Measured Engine Load for Locomotive Head End Power Engines Operated on Ultra-Low Sulfur Diesel (ULSD) and B20 Biodiesel. Error Bars Indicate Standard Deviation Within Each Group. ........................................ 26
Figure 3-7 Engine Output-based Particulate Matter (PM) Emission Rates versus Measured Engine Load for Locomotive Head End Power Engines
x
Operated on Ultra-Low Sulfur Diesel (ULSD) and B20 Biodiesel. Error Bars Indicate Standard Deviation Within Each Group. ........................................ 26
Figure A-1 Estimated Engine Load versus Load Box Load for Locomotive NC 1755 Operated on Ultra Low Sulfur Diesel. ................................................................. A-2
Figure A-2 Estimated Engine Load versus Load Box Load for Locomotive NC 1755 Operated on B20 Biodiesel. ................................................................................. A-6
Figure B-1 Estimated Engine Load versus Load Box Load for Locomotive NC 1797 Operated on Ultra Low Sulfur Diesel. ............................................................... A-10
Figure B-2 Estimated Engine Load versus Load Box Load for Locomotive NC 1797 Operated on B20 Biodiesel. ............................................................................... A-14
Figure C-1 Estimated Engine Load versus Load Box Load for Locomotive NC 1893 Operated on Ultra Low Sulfur Diesel. ............................................................... A-18
Figure C-2 Estimated Engine Load versus Load Box Load for Locomotive NC 1893 Operated on B20 Biodiesel. ............................................................................... A-22
Figure D-1 Estimated Engine Load versus Load Box Load for Locomotive NC 1810 Operated on B20 Biodiesel. ............................................................................... A-30
Figure E-1 Estimated Engine Load versus Load Box Load for Locomotive NC 1859 Operated on Ultra Low Sulfur Diesel. ............................................................... A-34
Figure E-2 Estimated Engine Load versus Load Box Load for Locomotive NC 1859 Operated on B20 Biodiesel. ............................................................................... A-38
Figure F-1 Estimated Engine Load versus Load Box Load for Locomotive NC 1869 Operated on Ultra Low Sulfur Diesel. ............................................................... A-42
Figure F-2 Estimated Engine Load versus Load Box Load for Locomotive NC 1869 Operated on B20 Biodiesel. ............................................................................... A-46
1
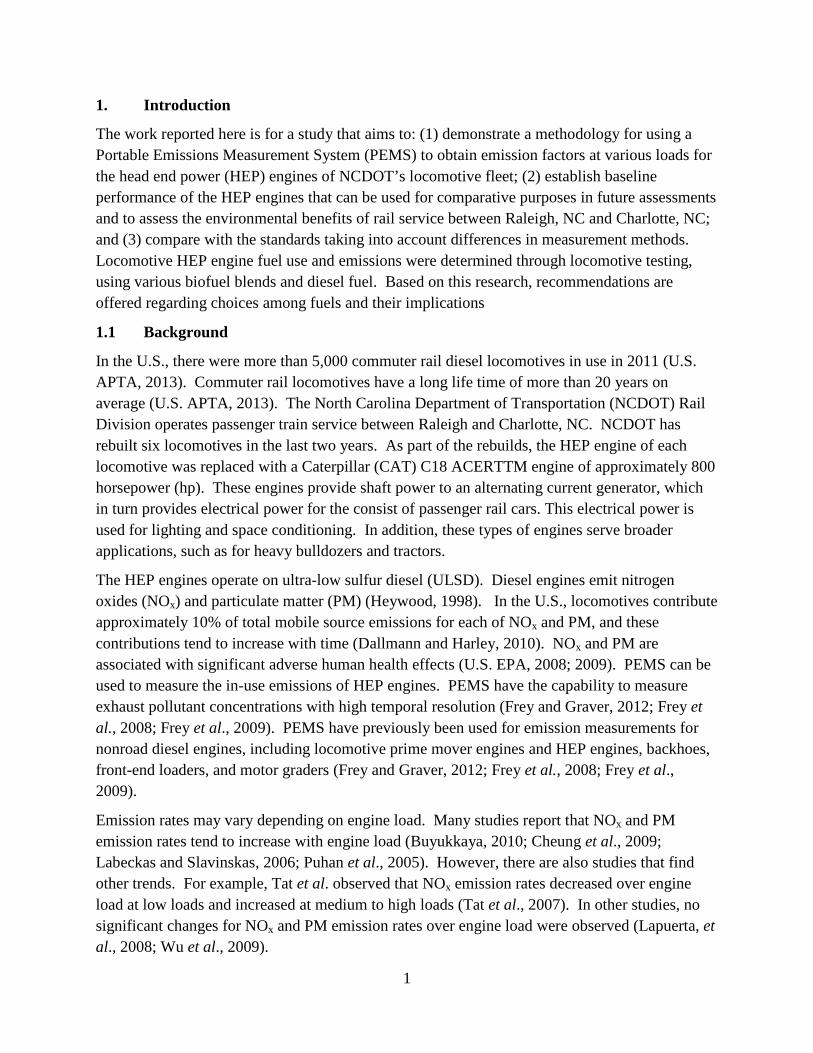
1. Introduction
The work reported here is for a study that aims to: (1) demonstrate a methodology for using a Portable Emissions Measurement System (PEMS) to obtain emission factors at various loads for the head end power (HEP) engines of NCDOT’s locomotive fleet; (2) establish baseline performance of the HEP engines that can be used for comparative purposes in future assessments and to assess the environmental benefits of rail service between Raleigh, NC and Charlotte, NC; and (3) compare with the standards taking into account differences in measurement methods. Locomotive HEP engine fuel use and emissions were determined through locomotive testing, using various biofuel blends and diesel fuel. Based on this research, recommendations are offered regarding choices among fuels and their implications
1.1 Background
In the U.S., there were more than 5,000 commuter rail diesel locomotives in use in 2011 (U.S. APTA, 2013). Commuter rail locomotives have a long life time of more than 20 years on average (U.S. APTA, 2013). The North Carolina Department of Transportation (NCDOT) Rail Division operates passenger train service between Raleigh and Charlotte, NC. NCDOT has rebuilt six locomotives in the last two years. As part of the rebuilds, the HEP engine of each locomotive was replaced with a Caterpillar (CAT) C18 ACERTTM engine of approximately 800 horsepower (hp). These engines provide shaft power to an alternating current generator, which in turn provides electrical power for the consist of passenger rail cars. This electrical power is used for lighting and space conditioning. In addition, these types of engines serve broader applications, such as for heavy bulldozers and tractors.
The HEP engines operate on ultra-low sulfur diesel (ULSD). Diesel engines emit nitrogen oxides (NOx) and particulate matter (PM) (Heywood, 1998). In the U.S., locomotives contribute approximately 10% of total mobile source emissions for each of NOx and PM, and these contributions tend to increase with time (Dallmann and Harley, 2010). NOx and PM are associated with significant adverse human health effects (U.S. EPA, 2008; 2009). PEMS can be used to measure the in-use emissions of HEP engines. PEMS have the capability to measure exhaust pollutant concentrations with high temporal resolution (Frey and Graver, 2012; Frey et al., 2008; Frey et al., 2009). PEMS have previously been used for emission measurements for nonroad diesel engines, including locomotive prime mover engines and HEP engines, backhoes, front-end loaders, and motor graders (Frey and Graver, 2012; Frey et al., 2008; Frey et al., 2009).
Emission rates may vary depending on engine load. Many studies report that NOx and PM emission rates tend to increase with engine load (Buyukkaya, 2010; Cheung et al., 2009; Labeckas and Slavinskas, 2006; Puhan et al., 2005). However, there are also studies that find other trends. For example, Tat et al. observed that NOx emission rates decreased over engine load at low loads and increased at medium to high loads (Tat et al., 2007). In other studies, no significant changes for NOx and PM emission rates over engine load were observed (Lapuerta, et al., 2008; Wu et al., 2009).

2
The same model HEP engine emissions were measured at low loads by connecting passenger cars and operating their lighting and space conditioning (Frey and Graver, 2012). However, the loads on the HEP engines were only approximately 80 hp based on power demand for up to four passenger rail cars. In addition, the emission certification test requires the engine to operate at higher loads. For example, a steady-state duty cycle used for engine dynamometer certification tests of non-road constant speed engines, the ISO 8178 D2 5-mode test cycle, requires the engine to operate at each of 10%, 25%, 50%, 75%, and 100% loads (U.S. EPA, 2004). Thus, the emissions need to be measured at loads comparable to those used in emissions certification measurements to give better understanding of trend in emissions with respect to load.
NCDOT has been using B20 biodiesel, based on a blend of 20 vol-% soybean-based biodiesel and 80 vol-% ULSD, for some of its onroad diesel engines (Frey and Graver, 2012). However, NCDOT has not yet introduced biodiesel as a fuel of choice for its railroad locomotives. Biodiesel can lead to lower carbon monoxide (CO), hydrocarbon (HC), and PM emission rates compare to ULSD (Canakci, 2007; Hass et al., 2001; Qi et al., 2009; U.S. EPA, 2002). The NOx emission rate may be higher or lower for biodiesel versus ULSD, depending on engine type, load condition, and the quality of biodiesel (Canakci, 2007; Hass et al., 2001; Qi et al., 2009; U.S. EPA, 2002).
The exhaust composition of HC, such as the distribution between aromatic and straight-chain HCs, and the speciation between nitric oxide (NO) and nitrogen dioxide (NO2) can vary depending on engine load and fuel. For example, with the use of biodiesel, decrease in aromatic HCs and increase in straight-chain HCs were observed compared to the use of diesel for diesel engines with 100 to 210 hp (Ballesteros, et al., 2008; Turrio-Baldassarri et al., 2004; Xue et al., 2011). For an 80 hp diesel engine, with increasing engine load, the NO concentrations tended to increase while the NO2 concentrations remained approximately constant (Labeckas and Slavinskas, 2006). Aromatic HCs are considered toxic (ATSDR, 2013). NO2 is a criteria pollutant, and is associated with adverse human health effects (U.S. EPA, 2008). Therefore, information regarding speciation of HC and NOx with respect to engine load and fuel provides insight regarding implications for human health. However, no such data was found for the HEP or similar engines.
The U.S. Environmental Protection Agency (EPA) has set emission standards to regulate nonroad diesel engines (U.S. EPA, 2013). The HEP engines installed in the NCDOT locomotives conform to 2009 U.S. EPA regulations for large nonroad compression-ignition engines. However, the emissions measured during certification tests with an engine dynamometer may not be representative of in-use emissions. An emission inventory can be developed based on measurements of in-use locomotive HEP engines.
There is variability in emissions with respect to engines. For example, the U.S. EPA assessed emissions for more than 40 diesel engines operated on each of biodiesel and ULSD (U.S. EPA, 2002). However, the average percent differences for biodiesel versus ULSD do not include confidence intervals that account for inter-engine variability. Significant inter-engine variability

3
was also observed for measurements on diesel engines for heavy-duty trucks, backhoes, front-end loaders, and motor graders (Frey et al., 2008; Sandhu and Frey, 2012). The emission rates were higher for some engines and lower for the other engines even though these studies each include multiple similar engines. Therefore, quantifying the inter-engine variability enables assessment on statistical significance of results and can provide insight regarding what sample size is needed to obtain robust results.
1.2 Objectives
The specific research objectives are to: (1) evaluate the effect of engine load on emission rates of CO, HC, NOx, and PM and on exhaust composition for HC and NOx; (2) compare B20 versus ULSD with respect to emission rates of CO, HC, NOx, and PM and on exhaust composition for HC and NOx; (3) compare to emission standards taking into account differences in measurement methods; (4) evaluate the inter-engine variability in emission rates; and (5) estimate an emission inventory of CO, HC, NOx, and PM for the HEP engines.
1.3 Scope
The scope of work completed includes the following:
• Measurements were made for CO2, CO, HC, NOx, and PM using PEMS.
• Measurements were made on six NCDOT owned locomotive HEP engines, including locomotive numbers NC 1755, NC 1797, NC 1810, NC 1859, NC 1869, and NC 1893. NC 1755, NC 1797, and NC 1893, have 831 rated hp HEP engines. NC 1810, NC 1859, and NC 1869, have 766 rated hp HEP engines. The two engine groups differ in turbocharger configuration.
• For all locomotive HEP engines, measurements were made on ULSD and B20.
• Typically less than one percent of total data collected were excluded after quality assurance screening.
The work here focused on specific diesel locomotive HEP engines for passenger rail service, and thus did not include a variety of other locomotive HEP engines that are in service in the United States. Although the study involved measurements of locomotives over a period of time, the time frame of the study is not sufficient to establish the long-term effects of biofuels on engine durability or performance.
4
2. Method
Measurements were made on six in-use locomotive HEP engines at the NCDOT Capital Rail Yard in Raleigh, NC. The methodology includes study design, instruments, data collection, quality assurance and quality check, and data analysis.
2.1 Study Design
The six locomotives were categorized into two groups, depending on rated HEP engine output. Three locomotives, NC 1755, NC 1797, and NC 1893, have 831 rated hp HEP engines. Three locomotives, NC 1810, NC 1859, and NC 1869, have 766 rated hp HEP engines. The two engine groups differ in turbocharger configuration. For each locomotive HEP engine, field measurements were conducted for both ULSD and B20 biodiesel.
Rail yard stationary test was used for this study. The locomotives were located in the NCDOT rail yard in Raleigh, NC. The HEP engines were tested at idle and under various load operated by NCDOT personnel. The PEMS were located on a convenient surface near the engine and sufficiently far away to avoid overheating from thermal radiation.
For each measurement, the loads on the HEP engine were controlled by a commercial load box. For safety and to protect the HEP engines, the load box was restricted from operating above 500 kW. The load box was operated at each of 10 kW, 15 kW, 25 kW, 50 kW, 125 kW, 250 kW, 375 kW, and 500 kW to simulate a wide range of the loads. At each load, the engine was held at steady state for at least 5 minutes.
For each measurement, three replications of the test cycle were conducted, which enables evaluation of the repeatability of the measurements.
2.2 Instruments
The following instruments were used during the measurements:
• Two PEMS • A Caterpillar “Electronic Technician” (Cat ET) electronic control unit (ECU) data
logger • An Avtron Model K580 load box
More details on each of the key instruments are given below.
2.2.1 Portable Emission Measurement System
Two PEMS, the OEM-2100 Axion PEMS manufactured by GlobalMRV and the SEMTECH-DS PEMS manufactured by Sensors, Inc., were used to measure the exhaust composition. The Axion PEMS was used to develop emission rates and the SEMTECH-DS PEMS was used to measure the exhaust composition of HC and NOx and subsequently bias correct the Axion measured HC and NOx concentrations. Figure 2-1 shows pictures of the two PEMS.

5
Figure 2-1 Pictures of the Axion and SEMTECH-DS Portable Emission Measurement Systems.
The Axion system is comprised of two parallel five-gas analyzers, a PM measurement system and an on-board computer. The two parallel gas analyzers simultaneously measure the exhaust volume percentage of CO, carbon dioxide (CO2), and HC using non-dispersive infrared (NDIR) , and NO and oxygen (O2) using electrochemical cell. The PM measurement is based on a laser light scattering detector and a sample conditioning system, with measurements ranging from ambient levels to low double digits opacity (CATI, 2008).
Battelle (2003) compared the Axion PEMS with a reference method and reported that the concentrations for CO2, CO, and NO were within 10% between the Axion and the reference method. The HC concentrations were biased low by a factor of approximately 2 due to difference in detection method (Battelle, 2003).
The Axion System is designed to measure emissions during the actual use of the vehicle or equipment in its regular daily operation, but it can be used under any operating conditions as long as it is possible to obtain an exhaust gas sample. The monitoring system weighs approximately 35 lbs. The system typically runs on 12V DC vehicle electricity. The power consumption is 5 to 8 Amps. The Axion system was connected to a shore-based power supply using a power converter.

6
Figure 2-2 Caterpillar "Electronic Technician" Communication Adapter and the Laptop Connected for Logging Engine Control Unit Data.
The SEMTECH-DS is capable of measuring HC using both NDIR and flame ionization detection (FID). Total HC can be detected using FID. The average HC response of NDIR is expected to be biased low (Stephens et al., 1996). For example, the ratios of NDIR to FID measurements for straight-alkanes, such as propane and hexane, are close to 1. But for aromatics, such as toluene and xylene, the ratios of NDIR to FID measurements decrease to approximately 0.2 (Singer et al., 1998). The ratio of FID measured HC to NDIR measured HC (FID/NDIR ratio) can be inferred by comparing FID and NDIR measurements. The SEMTECH-DS is also capable of measuring both NO and NO2 using non-dispersive ultraviolet (NDUV) detection, from which the ratio of NOx to NO (NOx/NO ratio) can be inferred.
The SEMTECH-DS system weighs approximately 80 lbs. The system typically runs on 12 V DC. The power consumption is approximately 30 Amps. The SEMTECH-DS system was connected to a shore-based power supply using a power converter.
2.2.2 Caterpillar “Electronic Technician”
A CAT ET ECU data logger was used to log key engine data from the ECU. The CAT ET system includes a communication adapter connected to the HEP engine communication port, logging data to a laptop. Key engine variables that the CAT ET recorded include fuel flow rate (gal/h), engine speed (rpm), intake air temperature (°F), engine load factor (%), engine coolant temperature (°F), and boost pressure (psi). All data were collected at a rate of 1Hz. Pictures of the CAT ET communication adapter connected to the HEP engine and the laptop that connected to the adapter to log ECU data are shown in Figure 2-2.

7
Figure 2-3 Pictures of the Load Box, Connection Cables to the Locomotive, Digital Control Panel, and Load Control Switches.
2.2.3 Load Box
An Avtron Model K580 load box was used to control the electrical output of the HEP engine. The load box has a control panel that can control the load to a precision of 5 kW. The control panel also shows the current load output via a digital panel screen. It takes a few seconds to switch the load from a level to another level. The pictures of the load box used in the measurements are shown in Figure 2-3.
8
2.3 Data Collection
Data collection includes the following main steps: (1) Preparation; (2) system setup and instruments warm up; (3) data collection; and (4) decommissioning.
2.3.1 Preparation
Preparations for data collection include verification of the status of the PEMS and Cat ET and that all necessary parts and consumables are available and calibration of the PEMS.
Both the Axion and the SEMTECH-DS PEMS utilize a two-point calibration system that includes “span” calibration and “zero” calibration. Span calibration was performed using a BAR-97 low concentration calibration gas mixture, which has a known gas composition. The calibration gas includes a mixture of known concentrations of CO2, CO, NO, and hydrocarbons, with the balance being N2. Span calibration was performed for both PEMS before each measurement.
Zero calibration was performed using ambient air at frequent intervals. Although zero-air stored in bottles or generated using an external zero-air generator can be used, it is believed that the ambient air pollutant levels are negligible compared to those found in undiluted exhaust; therefore, ambient air is viewed as sufficient for most conditions. For zero calibration purposes, it is assumed that ambient air contains 20.9 vol-% oxygen, and no NO, HC, or CO. CO2 levels in ambient air are approximately 300 to 400 ppm, which are negligible compared to the typical levels of CO2 in exhaust gases. Zero calibration was performed using ambient air every 10 minutes for the Axion PEMS and every hour for the SEMTECH-DS PEMS, as recommended in the user manual, during the field measurements.
2.3.2 System Setup and Instrument Warm Up
Instruments were setup before a scheduled test. The Axion and the SEMTECH-DS PEMS were deployed side-by-side and secured on a table near the locomotive. Exhaust sampling lines were customized for use with the exhaust stack of the HEP engines. This included fabricating a replaceable fitting with a sampling port that could be installed on the exhaust duct of the HEP engine. Since the exhaust gas and the duct operate at very high temperature, especially at high engine load, it was not possible to directly insert the exhaust sample hose for the Axion system directly to the sampling port on the exhaust duct. A 1.5 meter metal pipe was connected to the sampling por.t The exhaust gas sampling lines were directly connected to both PEMS. Figure 2-4 shows the deployment and the PEMS, the fabricated exhaust sampling line, and the connection of the exhaust sampling line between the PEMS and the locomotive HEP engine exhaust gas duct.
As part of installation, the Axion and SEMTECH-DS PEMS were warmed up for about 1 hour. The locomotive HEP engine was warmed up for about 30 minutes.

9
Figure 2-4 Deployment of the Instruments and Connection of the Exhaust Sampling Lines
2.3.3 Data Collection
During data collection, the load box was operated to control the load on the HEP engine. For safety and to protect the HEP engines, the load box was restricted from operating above 500 kW. The load box was operated at each of the 9 load settings, shown in Table 2-1, to simulate a wide range of the loads. Weighting factors of 0.10, 0.30, 0.30, 0.25, and 0.05 are assigned to the controlled loads of 50 kW, 125 kW, 250 kW, 375 kW, and 500 kW, respectively, to estimate the cycle average rates. These weighting factors are similar to a reference ISO 8178 D2 5-mode cycle (U.S. EPA, 2004).
At each load, the engine was held at steady-state for at least 5 minutes.

10
Table 2-1 Test Cycle Used in Head-End Power (HEP) Engine Rail Yard Measurement
Mode Number
Engine Speed
Load Box Output (kW)
Time in Mode (minutes)
Weighting Factorsa
1 Rated 0 5 n/a 2 Rated 10 5 n/a 3 Rated 15 5 n/a 4 Rated 25 5 n/a 5 Rated 50 5 0.10 6 Rated 125 5 0.30 7 Rated 250 5 0.30 8 Rated 375 5 0.25 9 Rated 500 5 0.05
a The weighting factors were used for developing a cycle average fuel use and emission rates for each HEP engine to enable comparison to the standard.
During testing, periodic checks of the system status were conducted. For example, if the CO2 gas concentrations were very low, then there might be a leakage in the sampling line and, therefore, inspection and repositioning of the sampling line is necessary. The exhaust sampling lines were blown out to remove any carbon that was blocking exhaust flow. When that did not work, new exhaust sampling lines were used, and normal CO2 gas concentrations were observed.
For measurement on B20 fuels, a 50 gal tank with B20 fuel was placed near the locomotive. B20 fuel was routed to the HEP engine via tubing. Prior to each B20 measurement, the HEP engine was warmed up with B20 fuel for sufficient time.
For each measurement, three replications of the test cycle were conducted, which enables quantification of the inter-test variability for each engine based on inter-test standard deviation.
2.3.4 Decommissioning
Decommissioning occurred after the end of the test period for each measurement. During decommissioning, data collection was discontinued; data that were collected were saved, the PEMS were powered down, and the exhaust sample lines, power cable, and data cable were removed.
2.4 Quality Assurance
The data measured from the PEMS and the CAT ET were synchronized and combined. For quality assurance purposes, the combined data set was screened to check for errors or possible problems (Sandhu and Frey, 2013). The errors were either corrected or the errant data records were not used for data analysis.
11
Typical errors include negative emissions values. Because of random measurement errors, on occasion some of the measured concentrations had negative values that were not statistically different from zero or a small positive value. Diesel engines typically produce far lower HC and CO emissions than gasoline engines (Durbin et al., 2000). Thus, it was frequently the case that the exhaust HC and CO concentrations were very low and not statistically significantly different from zero. A distinction was made between negative values of concentration that were not significantly different from zero, versus such values that were significantly below zero. For the former, they were set to zero. For the latter, they were excluded from the final database.
2.5 Data Analysis
Data analysis includes estimating actual engine load of the HEP engines based on measured engine load factors from the CAT ET software; estimating fuel use and emission rates; compare to the standards; investigate inter-engine variability, and estimating an emission inventory.
2.5.1 Estimating Engine Load
For each HEP engine and each replicate of the test of each engine, at each of the loads, the load percentage was recorded by the CAT ET. The engine manufacturer provides engine performance data for the CAT C18 ACERTTM Direct Injection Turbocharged-Aftercooled (DITA) engine, including load percentages between 10% to 100% and their corresponding engine hp. The relationships between engine power and load percentage from the performance data are summarized and plotted in Figure 2-5. Actual loads on the HEP engine in hp were estimated based on measured load percentages and the relationship between load percentages and engine hp inferred from manufacturer data.
2.5.2 Estimating Fuel Use and Emission Rates
The carbon in the fuel is emitted primarily as CO2, CO, and HC. Based on measured exhaust mole fractions of these components, the fraction of carbon as CO2 is estimated based on a carbon balance. The exhaust flow rate was estimated using fuel flow rate, density of fuel, weight percent of carbon in the fuel, and the fraction of carbon as CO2 in the exhaust. Molar ratios of CO, HC, and NOx to CO2 were estimated based on the exhaust composition, and the molecular weight of fuel and these pollutants were used to estimate the fuel-based emission rates in grams per gallon. The Axion reports PM concentrations in mg/m3. Fuel-based PM emission rates were estimated based on the PM concentrations and the exhaust flow rate.

12
Figure 2-5 Relationship between Engine Power and Load Percentage for the Two Types of Head End Power Engines
For each locomotive and each fuel, the NOx/NO ratios and the FID/NDIR ratios inferred based on the SEMTECH-DS were applied to the Axion measured concentrations to bias correct NOx and total HC emission rates. The actual PM emission rates were reported to be 5 to 20 times as high as the values developed based on the Axion PEMS (Frey and Choi, 2008). Therefore, a multiplicative correction factor of 5 was used to bias correct PM emission rates (Frey and Graver, 2012).
The fuel-based emission rate was multiplied with the fuel flow rate to estimate mass based emission rate (g/s). The mass based emission rate was divided by the estimated actual engine load to obtain g/bhp-hr emission factors. Cycle average emission rates were estimated based on a duty cycle similar to a reference ISO 8178 D2 5-mode cycle (U.S. EPA, 2004). Weighting factors of 0.10, 0.30, 0.30, 0.25, and 0.05 are assigned to the controlled loads of 50 kW, 125 kW, 250 kW, 375 kW, and 500 kW, respectively.
2.5.3 Comparing to Standards
EPA defined Tier 2 non-road diesel engine emission standards for CO, NOx, and PM (U.S. EPA, 2013). The HC emission standards for non-road diesel engines are not specified for Tier 2 engines, but are specified for Tier 1 engines. The emission standards for the HEP engine tested (hp ≥ 750) are summarized in Table 2-2.

13
Table 2-2 Summary of EPA Non-Road Diesel Engine Emission Standards
Tier CO (g/bhp-hr)
HC (g/bhp-hr)
NOx (g/bhp-hr)
PM (g/bhp-hr)
Tier 1 8.5 1.0 6.9 0.4 Tier 2 2.6 -- 4.8 0.15
2.5.4 Investigate inter-engine variability
To investigate the fuel use and emission rates with respect to different engine loads and fuels, the measurements on 6 locomotive HEP engines on each of ULSD and B20 were stratified into 4 groups: Group 1 – 766 hp HEP engines (NC 1810, NC 1859, NC 1969) on ULSD; Group 2 – 831 hp HEP engines (NC 1755, NC 1797, NC 1893) on ULSD; Group 3 – 766 hp HEP engines on B20; and Group 4 – 831 hp HEP engines on B20. For each group, average fuel use and emission rates, Coefficient of Variation (CV), which is the ratio of the standard deviation over mean, and 95% confidence intervals (CIs) on the mean were developed for each of the loads. In addition, within each group, the inter-engine variability in fuel use and emission rates was quantified based on the inter-engine CV, which is the mean and standard deviation in fuel use and emission rates for the 3 engines.
2.5.5 Estimating emission inventory
The cycle average emission rates were used to estimate an annual emission inventory for the NCDOT locomotive fleet HEP engines. There are three roundtrips between Raleigh and Charlotte each day according to current NCDOT railroad service schedule. Assuming that one locomotive is used for each roundtrip and the there is an equal frequency of usage for each of the 6 locomotives; each HEP engine will be used for approximately 180 roundtrips during a year. Assuming that each roundtrip lasts for approximately 7 hours, during which the average load on HEP engines is 80 hp, the total annual emissions of CO, HC, NOx, and PM for an HEP engine were estimated by multiplying the corresponding cycle average emission rates with each of 80 hp, 7 hours per round trip, and 180 roundtrips. An emission inventory for the NCDOT locomotive fleet HEP engines was estimated based on the sum of total annual emissions from all 6 engines.

14
3. Results
For each HEP engine on each fuel, approximately 3 hours of 1 Hz data were collected. Typically over 99% of the collected data were valid. However, there was lack of precise control of engine loads for loads of less than 50 kW from the load box. The logged engine load percentages and fuel use rates were approximately constant for loads of less than 50 kW. Therefore, the results for loads of less than 50 kW are considered unreliable and are not reported here, but are reported in the appendices.
The typical trends in fuel use and emission rates versus engine loads are illustrated based on results for the HEP engine of NC 1755 operated on ULSD. An emission inventory is developed for this example HEP engine. A synthesis summary of fuel use and emission rates developed for each locomotive HEP engine and each fuel is shown. A synthesis summary of trends in fuel use and emission rates versus engine loads is reported for all locomotive HEP engines and fuels. Comparisons of B20 versus ULSD with respect to fuel use and emission rates are illustrated based on results from all locomotive HEP engines and fuels. The measured results are compared with the EPA standards, taking into consideration of differences in measurement methods. Inter-engine variability is investigated. An emission inventory is estimated for each of the measured locomotive HEP engine, as well as for the NCDOT locomotive fleet.
3.1 Example Detailed Results for NC 1755 Head End Power Engine on Ultra-Low Sulfur Diesel
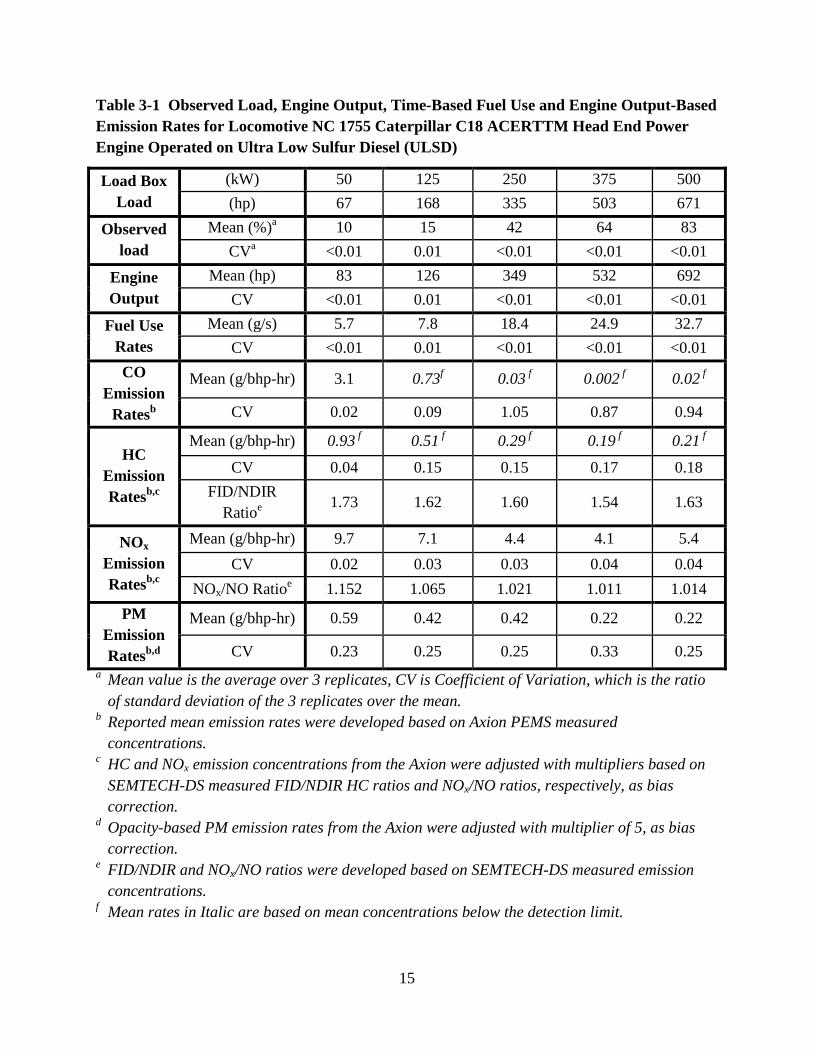
Results for one of the HEP engines operated on ULSD are selected to illustrate typical trends in fuel use and emission rates versus engine load. Table 3-1 summarizes the observed load, engine output, time-based fuel use and engine-output based emission rates for each engine load for the HEP engine of NC 1755.
Engine output increases from 83 hp to 692 hp. Although the observed engine outputs are slightly different than the load box, they are highly repeatable at a given load among the three replicates, with CVs of 0.01 or less. Fuel use rate increases from 5.7 g/s to 32.7 g/s. The observed fuel use rates at a given load are highly repeatable, with CVs of 0.01 or less.
The CO emission rate at 83 hp load is 0.31 g/bhp-hr and is highly repeatable. CO emission rates for the other loads are 0.73 g/bhp-hr or less. However, these later are based on measured average concentrations less than the instrument detection limit. Therefore, although the trend in CO emission rates tends to decrease with increasing loads, the trend is not conclusive due to random variation in CO concentrations for most of the loads.
For HC, the FID/NDIR ratios developed based on the SEMTECH-DS range from 1.54 to 1.73, depending on load. Although a generally decreasing trend is observed for HC emission rates over loads, the measured average HC concentrations are below the detection limit for all loads. Therefore, the trend is not conclusive and is subject to random variation.
15
Table 3-1 Observed Load, Engine Output, Time-Based Fuel Use and Engine Output-Based Emission Rates for Locomotive NC 1755 Caterpillar C18 ACERTTM Head End Power Engine Operated on Ultra Low Sulfur Diesel (ULSD)
Load Box Load
(kW) 50 125 250 375 500 (hp) 67 168 335 503 671
Observed load
Mean (%)a 10 15 42 64 83 CVa <0.01 0.01 <0.01 <0.01 <0.01
Engine Output
Mean (hp) 83 126 349 532 692 CV <0.01 0.01 <0.01 <0.01 <0.01
Fuel Use Rates
Mean (g/s) 5.7 7.8 18.4 24.9 32.7 CV <0.01 0.01 <0.01 <0.01 <0.01
CO Emission
Ratesb
Mean (g/bhp-hr) 3.1 0.73f 0.03 f 0.002 f 0.02 f
CV 0.02 0.09 1.05 0.87 0.94
HC Emission Ratesb,c
Mean (g/bhp-hr) 0.93 f 0.51 f 0.29 f 0.19 f 0.21 f
CV 0.04 0.15 0.15 0.17 0.18 FID/NDIR
Ratioe 1.73 1.62 1.60 1.54 1.63
NOx
Emission Ratesb,c
Mean (g/bhp-hr) 9.7 7.1 4.4 4.1 5.4 CV 0.02 0.03 0.03 0.04 0.04
NOx/NO Ratioe 1.152 1.065 1.021 1.011 1.014 PM
Emission Ratesb,d
Mean (g/bhp-hr) 0.59 0.42 0.42 0.22 0.22
CV 0.23 0.25 0.25 0.33 0.25 a Mean value is the average over 3 replicates, CV is Coefficient of Variation, which is the ratio
of standard deviation of the 3 replicates over the mean. b Reported mean emission rates were developed based on Axion PEMS measured
concentrations. c HC and NOx emission concentrations from the Axion were adjusted with multipliers based on
SEMTECH-DS measured FID/NDIR HC ratios and NOx/NO ratios, respectively, as bias correction.
d Opacity-based PM emission rates from the Axion were adjusted with multiplier of 5, as bias correction.
e FID/NDIR and NOx/NO ratios were developed based on SEMTECH-DS measured emission concentrations.
f Mean rates in Italic are based on mean concentrations below the detection limit.

16
The NOx emission concentrations measured from the Axion are bias corrected based on the NOx/NO ratios developed based on the SEMTECH-DS for each of the loads. After correction, NOx emission rates decrease from 9.7 g/bhp-hr at 83 hp load to 4.1 g/bhp-hr at 530 hp load, and subsequently increase to 5.4 g/bhp-hr at 690 hp load. The trend is repeatable as the CVs for NOx emission rates are 0.08 or less at a given load.
For PM, a generally decreasing trend is observed as load increases. However, there is moderate inter-replicate variability in PM emission rates at a given load. The CVs range from 0.23 to 0.33, depending on load.
The cycle average CO, HC, NOx, and PM emission rates are 0.18 g/bhp-hr, 0.28 g/bhp-hr, 4.8 g/bhp-hr, and 0.32 g/bhp-hr, respectively. For this HEP engine operated on ULSD, annual emissions for CO, HC, NOx, and PM are approximately 18 kg, 28 kg, 490 kg, and 32 kg, respectively.
3.2 Results for FID/NDIR HC and NOx/NO Ratios
Results for FID/NDIR HC and NOx/NO ratios reported here are summarized as synthesis based on the four groups. Detailed results for each locomotive HEP engine on each fuel are provided in the appendices.
Figure 3-1 shows the FID/NDIR ratios versus engine load for each of the 4 groups. The FID/NDIR ratios are higher for approximately 100 hp load compared to the other loads. For the observed loads higher than 100 hp, no obvious trend with respect to load is observed. Because the responses for NDIR and FID for straight-alkanes agree with each other well, but the responses for NDIR for aromatics are substantially lower than FID (Singer et al., 1998), a higher FID/NDIR ratio indicates a higher fraction of aromatics and a lower fraction of straight-alkanes. The results for the locomotive HEP engines indicate that at approximately 100 hp load, the HC is comprised of a higher fraction of aromatics and a lower fraction of straight-chain HC compared to higher loads. For a given load, the FID/NDIR ratios are lower for B20 than for ULSD, which is expected as the proportion of aromatics decreases with the use of biodiesel (Ballesteros, et al., 2008; Turrio-Baldassarri et al., 2004; Xue et al., 2011).
Figure 3-2 shows the NOx/NO ratios versus engine load for each of the 4 groups. The NOx/NO ratios decrease with load. As load increases, the peak flame temperature increases, and the chemical equilibrium between NO and NO2 favors NO (Heywood, 1998). For a given load, the NOx/NO ratios for B20 are slightly lower than for ULSD. The use of B20 can increase peak flame temperature and provide increased oxygen availability, which results in higher NO concentrations and lower NOx/NO ratios (Ballesteros, et al., 2008; Heywood, 1998; Turrio-Baldassarri et al., 2004; Xue et al., 2011).
17
Figure 3-1 Ratios of Flame Ionization Detection (FID) to Non-Dispersive Infrared (NDIR) for Hydrocarbon for Four Locomotive Head End Power and Fuel Groups. Error Bars Indicate Standard Deviation Within Each Group.
Figure 3-2 Ratios of Nitrogen Oxides (NOx) to Nitric Oxide (NO) for Four Locomotive Head End Power and Fuel Groups. Error Bars Indicate Standard Deviation Within Each Group.
0.0
0.5
1.0
1.5
2.0
2.5
3.0
0 100 200 300 400 500 600 700 800 900
FID
/ND
IR H
C R
atio
Measured Engine Load (hp)
Group 1Group 2Group 3Group 4
1.00
1.05
1.10
1.15
1.20
0 100 200 300 400 500 600 700 800 900
NO
x/N
O R
atio
Measured Engine Load (hp)
Group 1Group 2Group 3Group 4
18
3.3 Summary of Fuel Use and Emission Rates
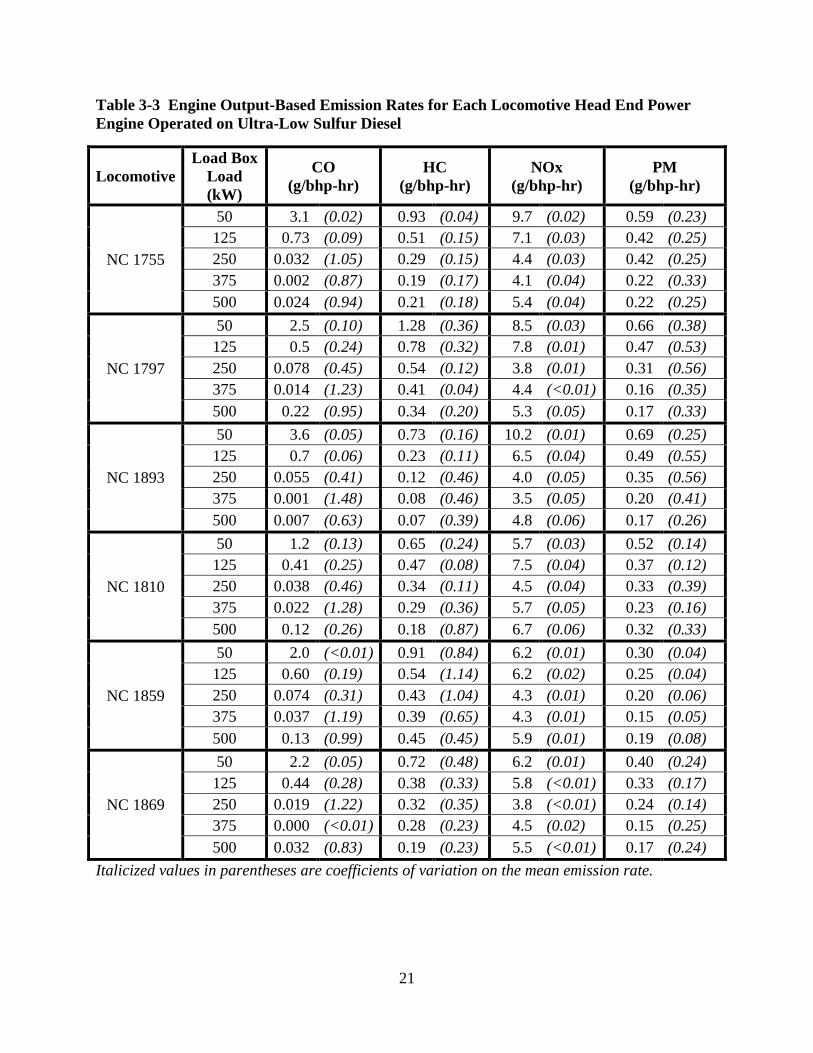
Table 3-2 summarizes the measured engine load percentage, engine load output, and time-based fuel use rates for each locomotive HEP engine operated on ULSD. Table 3-3 summarizes the measured engine-output based emission rates of CO, HC, NOx, and PM for each locomotive HEP engine operated on ULSD. The HC and NOx emission rates are bias corrected based on the FID/NDIR ratio and the NOx/NO ratio developed from the SEMTECH-DS results. The PM emission rates are bias corrected by a factor of 5 (Frey and Choi, 2008; Frey and Graver, 2012). Similarly, the results for measured engine load percentage, engine load output, time-based fuel use rates, and engine-output based emission rates for each locomotive HEP engine operated on B20 biodiesel are summarized in Tables 3-4 and 3-5.
Detailed results for each locomotive and fuel are provided in appendices. Table 3-6 indicates the location of results for specific combinations of locomotive HEP engine and fuel.
Given the synthesis summary of the measured fuel use and emission rates for each locomotive on each of the two fuels, the average fuel use and emission rates and the corresponding standard deviations are estimated for each of the four engine and fuel groups. Trends in fuel use and emission rates, as well as the comparison between B20 and ULSD, are analyzed and shown on the basis of the four groups.
3.3.1 Trends in Fuel Use and Emission Rates versus Load
Figure 3-3 shows the time-based fuel use rates versus load for each of the 4 groups. Fuel use rates increase monotonically with engine load. The trends are repeatable. For a given fuel type, the 831 rated hp HEP engines have slightly higher fuel use than the 766 hp HEP engines, which is expected. For a given HEP engine, the fuel use is slightly higher for B20 than for ULSD. This is expected as more fuel is needed to compensate the lower heating value for B20.
Figures 3-4, 3-5, 3-6, and 3-7 show the engine output-based CO, HC, NOx, and PM emission rates, respectively, versus load for each of the 4 groups. A sharp decrease is observed for CO emission rates over engine load at loads less than 200 hp. For higher loads, CO emission rates are less than 0.2 g/bhp-hr except for Group 4 at 750 hp load. For Group 4, the NC 1797 HEP engine operated on B20 had CO emission rates of 0.9 g/bhp-hr at the highest load. However, the measured average CO concentrations are below the detection limit for all loads for four of the locomotive HEP engines, regardless of fuel. Therefore, the trends in CO emission rates over load are subject to substantial random variation and are not conclusive.
HC emission rates tend to decrease monotonically over engine load. However, for 4 of the 6 HEP engines, the measured HC concentrations for most loads are below the detection limit. Therefore, trends in HC emission rates over load are not conclusive.
NOx emission rates tend to decrease over load for loads less than 400 hp, and increase over load for higher loads. For each of the four groups, within the range of observed engine load, the trend in NOx emission rates versus engine load can be described as a “U” shape. The lowest NOx
19
emission rates are observed between 300 hp and 400 hp. A similar trend was observed by Tat et al. (Tat et al., 2007). The timing for the start of injection and the start of combustion may be a reason for the trend. A similar “U” shape trend was observed for start of injection with respect to engine load (Tat et al., 2007). At light and high load compared to medium load, the start of combustion is earlier, resulting in a more advanced start of combustion timing, which in turn increases the temperature and NOx emissions. For each of the 6 engines, the inter-replicate variability is small, as the CVs range from 0.01 to 0.09, depending on load. Within each of the 4 groups, the inter-engine CVs range from 0.05 to 0.16, depending on load.
PM emission rates slightly decrease from approximately 0.5 g/bhp-hr at 100 hp to approximately 0.2 g/bhp-hr at 700 hp. For each of the 6 engines, the inter-replicate CVs range from 0.03 to 0.76, depending on load. Within each of the 4 groups, the inter-engine CVs range from 0.08 to 0.38, depending on load. For each of the four groups, within the range of observed engine load, the trend in PM emission rates versus engine load can be well described with a power model. For ULSD, a typical fit is 0.42.6PMm Load −= × , with R2 of approximately 0.8 or higher. For
B20, a typical fit is 0.67.6PMm Load −= × , with R2 of approximately 0.9 or higher.

20
Table 3-2 Observed Load, Engine Output, and Time-Based Fuel Use Rates for Each Locomotive Head End Power Engine Operated on Ultra-Low Sulfur Diesel
Locomotive Load Box Load (kW)
Observed Load (%)
Engine Output (hp)
Time-Based Fuel Use Rates (g/s)
NC 1755
50 10 (<0.01) 83 (<0.01) 5.7 (<0.01) 125 15 (0.01) 126 (0.01) 7.8 (0.01) 250 42 (<0.01) 349 (<0.01) 18.4 (<0.01) 375 64 (<0.01) 532 (<0.01) 24.9 (<0.01) 500 83 (<0.01) 692 (<0.01) 32.7 (<0.01)
NC 1797
50 10 (<0.01) 83 (<0.01) 5.8 (<0.01) 125 19 (0.01) 158 (0.01) 9.7 (0.02) 250 45 (0.01) 378 (0.01) 18.8 (0.02) 375 65 (<0.01) 544 (<0.01) 23.5 (0.01) 500 89 (0.02) 742 (0.02) 32.9 (0.02)
NC 1893
50 9 (0.02) 73 (0.02) 5.9 (<0.01) 125 14 (0.02) 115 (0.02) 6.9 (0.03) 250 41 (<0.01) 341 (<0.01) 17.8 (<0.01) 375 63 (<0.01) 525 (<0.01) 24.4 (<0.01) 500 83 (<0.01) 688 (<0.01) 32.5 (<0.01)
NC 1810
50 12 (<0.01) 132 (<0.01) 5.4 (<0.01) 125 21 (<0.01) 197 (<0.01) 10.1 (<0.01) 250 48 (<0.01) 391 (<0.01) 20.3 (<0.01) 375 68 (<0.01) 529 (<0.01) 24.6 (<0.01) 500 91 (0.01) 698 (0.01) 33.7 (0.02)
NC 1859
50 12 (<0.01) 129 (<0.01) 5.5 (<0.01) 125 16 (<0.01) 157 (<0.01) 7.4 (<0.01) 250 42 (<0.01) 344 (<0.01) 16.5 (<0.01) 375 61 (<0.01) 480 (<0.01) 21.7 (<0.01) 500 79 (<0.01) 612 (<0.01) 29.7 (<0.01)
NC 1869
50 10 (0.01) 114 (<0.01) 5.9 (<0.01) 125 17 (<0.01) 168 (<0.01) 8.5 (<0.01) 250 44 (<0.01) 359 (<0.01) 17.8 (<0.01) 375 66 (<0.01) 516 (<0.01) 23.7 (<0.01) 500 90 (<0.01) 692 (<0.01) 33.4 (<0.01)
Italicized values in parentheses are coefficients of variation on the mean emission rate.
21
Table 3-3 Engine Output-Based Emission Rates for Each Locomotive Head End Power Engine Operated on Ultra-Low Sulfur Diesel
Locomotive Load Box
Load (kW)
CO (g/bhp-hr)
HC (g/bhp-hr)
NOx (g/bhp-hr)
PM (g/bhp-hr)
NC 1755
50 3.1 (0.02) 0.93 (0.04) 9.7 (0.02) 0.59 (0.23) 125 0.73 (0.09) 0.51 (0.15) 7.1 (0.03) 0.42 (0.25) 250 0.032 (1.05) 0.29 (0.15) 4.4 (0.03) 0.42 (0.25) 375 0.002 (0.87) 0.19 (0.17) 4.1 (0.04) 0.22 (0.33) 500 0.024 (0.94) 0.21 (0.18) 5.4 (0.04) 0.22 (0.25)
NC 1797
50 2.5 (0.10) 1.28 (0.36) 8.5 (0.03) 0.66 (0.38) 125 0.5 (0.24) 0.78 (0.32) 7.8 (0.01) 0.47 (0.53) 250 0.078 (0.45) 0.54 (0.12) 3.8 (0.01) 0.31 (0.56) 375 0.014 (1.23) 0.41 (0.04) 4.4 (<0.01) 0.16 (0.35) 500 0.22 (0.95) 0.34 (0.20) 5.3 (0.05) 0.17 (0.33)
NC 1893
50 3.6 (0.05) 0.73 (0.16) 10.2 (0.01) 0.69 (0.25) 125 0.7 (0.06) 0.23 (0.11) 6.5 (0.04) 0.49 (0.55) 250 0.055 (0.41) 0.12 (0.46) 4.0 (0.05) 0.35 (0.56) 375 0.001 (1.48) 0.08 (0.46) 3.5 (0.05) 0.20 (0.41) 500 0.007 (0.63) 0.07 (0.39) 4.8 (0.06) 0.17 (0.26)
NC 1810
50 1.2 (0.13) 0.65 (0.24) 5.7 (0.03) 0.52 (0.14) 125 0.41 (0.25) 0.47 (0.08) 7.5 (0.04) 0.37 (0.12) 250 0.038 (0.46) 0.34 (0.11) 4.5 (0.04) 0.33 (0.39) 375 0.022 (1.28) 0.29 (0.36) 5.7 (0.05) 0.23 (0.16) 500 0.12 (0.26) 0.18 (0.87) 6.7 (0.06) 0.32 (0.33)
NC 1859
50 2.0 (<0.01) 0.91 (0.84) 6.2 (0.01) 0.30 (0.04) 125 0.60 (0.19) 0.54 (1.14) 6.2 (0.02) 0.25 (0.04) 250 0.074 (0.31) 0.43 (1.04) 4.3 (0.01) 0.20 (0.06) 375 0.037 (1.19) 0.39 (0.65) 4.3 (0.01) 0.15 (0.05) 500 0.13 (0.99) 0.45 (0.45) 5.9 (0.01) 0.19 (0.08)
NC 1869
50 2.2 (0.05) 0.72 (0.48) 6.2 (0.01) 0.40 (0.24) 125 0.44 (0.28) 0.38 (0.33) 5.8 (<0.01) 0.33 (0.17) 250 0.019 (1.22) 0.32 (0.35) 3.8 (<0.01) 0.24 (0.14) 375 0.000 (<0.01) 0.28 (0.23) 4.5 (0.02) 0.15 (0.25) 500 0.032 (0.83) 0.19 (0.23) 5.5 (<0.01) 0.17 (0.24)
Italicized values in parentheses are coefficients of variation on the mean emission rate.

22
Table 3-4 Observed Load, Engine Output, and Time-Based Fuel Use Rates for Each Locomotive Head End Power Engine Operated on B20 Biodiesel
Locomotive Load Box Load (kW)
Observed Load (%)
Engine Output (hp)
Time-Based Fuel Use Rates (g/s)
NC 1755
50 10 (0.03) 81 (0.03) 5.8 (0.01) 125 18 (0.04) 148 (0.04) 9.7 (0.05) 250 43 (<0.01) 358 (<0.01) 19.3 (<0.01) 375 65 (<0.01) 540 (<0.01) 25.7 (<0.01) 500 86 (<0.01) 713 (<0.01) 34.3 (<0.01)
NC 1797
50 9 (0.05) 78 (0.05) 6.0 (0.02) 125 19 (<0.01) 160 (<0.01) 9.9 (<0.01) 250 46 (<0.01) 383 (<0.01) 19.4 (<0.01) 375 67 (<0.01) 553 (<0.01) 24.4 (0.01) 500 93 (0.02) 770 (0.02) 34.8 (0.02)
NC 1893
50 8 (0.04) 70 (0.04) 6.0 (0.01) 125 17 (0.02) 138 (0.02) 8.9 (0.02) 250 40 (0.01) 337 (0.01) 17.7 (0.02) 375 64 (<0.01) 530 (<0.01) 25.1 (<0.01) 500 84 (<0.01) 701 (<0.01) 33.6 (<0.01)
NC 1810
50 11 (0.01) 125 (<0.01) 5.7 (0.01) 125 21 (0.01) 195 (0.01) 10.2 (<0.01) 250 47 (<0.01) 383 (<0.01) 20.0 (<0.01) 375 67 (<0.01) 524 (<0.01) 24.6 (0.01) 500 92 (<0.01) 705 (<0.01) 34.7 (0.01)
NC 1859
50 11 (<0.01) 123 (<0.01) 5.7 (<0.01) 125 15 (<0.01) 151 (<0.01) 6.9 (<0.01) 250 42 (0.01) 348 (0.01) 17.2 (0.02) 375 61 (<0.01) 484 (<0.01) 22.1 (<0.01) 500 81 (<0.01) 624 (<0.01) 30.6 (<0.01)
NC 1869
50 9 (<0.01) 109 (<0.01) 6.1 (<0.01) 125 19 (0.03) 184 (0.02) 9.9 (0.03) 250 45 (<0.01) 365 (<0.01) 18.5 (<0.01) 375 66 (<0.01) 520 (<0.01) 24.3 (<0.01) 500 92 (<0.01) 701 (<0.01) 34.4 (<0.01)
Italicized values in parentheses are coefficients of variation on the mean emission rate.

23
Table 3-5 Engine Output-Based Emission Rates for Each Locomotive Head End Power Engine Operated on B20 Biodiesel
Locomotive Load Box
Load (kW)
CO (g/bhp-hr)
HC (g/bhp-hr)
NOx (g/bhp-hr)
PM (g/bhp-hr)
NC 1755
50 1.9 (0.13) 1.59 (0.53) 7.7 (0.03) 0.58 (0.14) 125 0.27 (0.60) 0.80 (0.46) 6.6 (0.05) 0.37 (0.20) 250 0.034 (1.02) 0.51 (0.38) 3.8 (<0.01) 0.21 (0.12) 375 0.003 (0.59) 0.28 (0.39) 3.5 (0.01) 0.17 (0.07) 500 0.16 (0.57) 0.27 (0.59) 4.7 (0.01) 0.19 (0.03)
NC 1797
50 2.6 (0.10) 1.14 (0.35) 8.4 (0.04) 0.53 (0.13) 125 0.4 (0.24) 0.68 (0.23) 7.4 (0.02) 0.33 (0.30) 250 0.072 (0.75) 0.42 (0.07) 3.6 (0.01) 0.20 (0.28) 375 0.058 (0.56) 0.24 (0.60) 4.0 (0.01) 0.10 (0.15) 500 0.89 (0.28) 0.17 (0.34) 4.6 (0.02) 0.13 (0.06)
NC 1893
50 2.6 (0.15) 1.30 (0.23) 10.0 (0.06) 0.70 (0.08) 125 0.4 (0.50) 0.53 (0.15) 7.4 (0.03) 0.54 (0.74) 250 0.093 (0.73) 0.37 (0.23) 4.3 (0.02) 0.35 (0.76) 375 0.043 (0.90) 0.22 (0.17) 3.8 (0.02) 0.23 (0.50) 500 0.056 (0.27) 0.17 (0.08) 5.2 (0.03) 0.22 (0.27)
NC 1810
50 1.3 (0.14) 0.46 (0.77) 5.1 (0.09) 0.28 (0.38) 125 0.30 (0.31) 0.33 (0.87) 6.5 (0.06) 0.28 (0.60) 250 0.052 (0.88) 0.23 (0.89) 3.8 (0.05) 0.24 (0.75) 375 0.045 (0.85) 0.14 (0.86) 4.7 (0.06) 0.15 (0.64) 500 0.14 (0.65) 0.12 (0.45) 5.7 (0.03) 0.15 (0.29)
NC 1859
50 1.8 (0.07) 0.85 (0.32) 6.4 (0.03) 0.27 (0.14) 125 0.37 (0.58) 0.58 (0.61) 6.2 (0.01) 0.21 (0.16) 250 0.029 (0.92) 0.40 (0.35) 4.3 (0.03) 0.16 (0.18) 375 0.028 (0.96) 0.33 (0.40) 4.3 (0.01) 0.11 (0.14) 500 0.16 (0.36) 0.38 (0.43) 5.8 (0.02) 0.13 (0.06)
NC 1869
50 1.9 (0.08) 0.47 (0.19) 6.7 (<0.01) 0.33 (0.12) 125 0.48 (0.27) 0.20 (0.20) 7.3 (0.03) 0.22 (0.12) 250 0.111 (0.07) 0.15 (0.08) 4.2 (0.01) 0.17 (0.17) 375 0.021 (0.67) 0.10 (0.23) 5.0 (0.01) 0.11 (0.15) 500 0.077 (1.23) 0.07 (0.14) 6.1 (0.01) 0.15 (0.16)
Italicized values in parentheses are coefficients of variation on the mean emission rate.

24
Table 3-6 Guide to Detailed Results in Appendices for Each Locomotive Head End Power (HEP) Engine on Each of Ultra-Low Sulfur Diesel (ULSD) and B20 Biodiesel
Locomotive HEP Engine Fuel Appendix
NC 1755 ULSD Appendix A, Section A.1 B20 Appendix A, Section A.2
NC 1797 ULSD Appendix B, Section B.1 B20 Appendix B, Section B.2
NC 1893 ULSD Appendix C, Section C.1 B20 Appendix C, Section C.2
NC 1810 ULSD Appendix D, Section D.1 B20 Appendix D, Section D.2
NC 1859 ULSD Appendix E, Section E.1 B20 Appendix E, Section E.2
NC 1869 ULSD Appendix F, Section F.1 B20 Appendix F, Section F.2
Figure 3-3 Time-based Fuel Use Rates versus Measured Engine Load for Locomotive Head End Power Engines Operated on Ultra-Low Sulfur Diesel (ULSD) and B20 Biodiesel. Error Bars Indicate Standard Deviation Within Each Group.
05
10152025303540
0 100 200 300 400 500 600 700 800
Fuel
Use
Rat
es (g
/s)
Measured Engine Load (hp)
Group 1Group 2Group 3Group 4

25
Figure 3-4 Engine Output-based Carbon Monoxide (CO) Emission Rates versus Measured Engine Load for Locomotive Head End Power Engines Operated on Ultra-Low Sulfur Diesel (ULSD) and B20 Biodiesel. Error Bars Indicate Standard Deviation Within Each Group.
Figure 3-5 Engine Output-based Hydrocarbon (HC) Emission Rates versus Measured Engine Load for Locomotive Head End Power Engines Operated on Ultra-Low Sulfur Diesel (ULSD) and B20 Biodiesel. Error Bars Indicate Standard Deviation Within Each Group.
0.0
1.0
2.0
3.0
4.0
0 100 200 300 400 500 600 700 800
CO
Em
issi
on R
ates
(g/b
hp-h
r)
Measured Engine Load (hp)
Group 1Group 2Group 3Group 4
0.0
0.5
1.0
1.5
2.0
0 100 200 300 400 500 600 700 800
HC
Em
issi
on R
ates
(g/b
hp-h
r)
Measured Engine Load (hp)
Group 1Group 2Group 3Group 4

26
Figure 3-6 Engine Output-based Nitrogen Oxides (NOx) Emission Rates versus Measured Engine Load for Locomotive Head End Power Engines Operated on Ultra-Low Sulfur Diesel (ULSD) and B20 Biodiesel. Error Bars Indicate Standard Deviation Within Each Group.
Figure 3-7 Engine Output-based Particulate Matter (PM) Emission Rates versus Measured Engine Load for Locomotive Head End Power Engines Operated on Ultra-Low Sulfur Diesel (ULSD) and B20 Biodiesel. Error Bars Indicate Standard Deviation Within Each Group.
0
2
4
6
8
10
12
0 100 200 300 400 500 600 700 800NO
x E
mis
sion
Rat
es (g
/bhp
-hr)
Measured Engine Load (hp)
Group 1Group 2Group 3Group 4
0.0
0.2
0.4
0.6
0.8
1.0
0 100 200 300 400 500 600 700 800
PM E
mis
sion
Rat
es (g
/bhp
-hr)
Measured Engine Load (hp)
Group 1Group 2Group 3Group 4

27
3.3.2 Comparison of B20 versus ULSD
To compare the effect of B20 versus ULSD, cycle average emission rates with 95% CIs on the mean are summarized in Table 3-7 for the each of the four groups. For example, on average for the 766 hp HEP engines, the cycle average CO emission rate is 0.165 g/bhp-hr for B20, which is 4% lower compared to 0.172 g/bhp-hr for ULSD. However, the 95% CIs are wide enough that the CIs overlap, and the difference here is not statistically significant.
On average of all 6 measured HEP engines, cycle average CO and HC emissions rates are slightly lower for B20 than ULSD and the difference is not statistically significant. The results obtained agree qualitatively with previous studies (Canakci, 2007; Hass et al., 2001; Qi et al., 2009; U.S. EPA, 2002). However, the differences of 3% and 6% for CO and HC, respectively, are quantitatively lower compared to 10% to 30% for CO and 20% to 60% for HC reported elsewhere (Canakci, 2007; Hass et al., 2001; Qi et al., 2009; U.S. EPA, 2002). Here, a substantial proportion of measured CO and HC concentrations are below the detection limit, which can obscure differences. Similar findings were made elsewhere (Labeckas and Slavinskas, 2006; Lapuerta et al., 2008).
Cycle average NOx emissions rates for B20 are 3% higher than for ULSD, but the difference is not statistically significant. Nevertheless, the percentage of difference is comparable to many studies. For example, NOx emission rates were reported to increase by 0.5% to 2% for B20 versus ULSD (Qi et al., 2009; U.S. EPA, 2002; Xue et al., 2011).
Cycle average PM emission rates for B20 are 28% and 18% lower than ULSD for the average of 766 hp and 831 hp HEP engines, respectively, and the differences are statistically significant. The differences in cycle average PM emission rates are comparable with previous studies, in which 10% to 50% lower PM emission rates were reported for B20 versus ULSD (Canakci, 2007; Qi et al., 2009; Xue et al., 2011).

28
Table 3-7 Comparison of Cycle Average Engine Output-Based Emission Rates for Each Pollutant Measured by Locomotive Head End Power (HEP) Engine and Fuel
Pollutant Fuel Descriptive Statistics Unit 766 hp
Enginesa 831 hp
Enginesb All Engines
CO
ULSD Mean
St.Dev. 95% CIe
g/bhp-hr
0.172 0.045
0.125 to 0.228
0.184 0.002
0.174 to 0.191
0.178 0.029
0.154 to 0.202
B20 Mean
St.Dev. 95% CIe
g/bhp-hr
0.165 0.023
0.141 to 0.191
0.181 0.077
0.105 to 0.279
0.173 0.051
0.138 to 0.214 B20 vs. ULSD -4% -2% -3%
HCc
ULSD Mean
St.Dev. 95% CIe
g/bhp-hr
0.37 0.073
0.29 to 0.46
0.31 0.19
0.12 to 0.58
0.34 0.14
0.23 to 0.45
B20 Mean
St.Dev. 95% CIe
g/bhp-hr
0.25 0.14
0.12 to 0.43
0.38 0.066
0.31 to 0.46
0.32 0.12
0.22 to 0.42 B20 vs. ULSD -31% +25% -6%
NOxc
ULSD Mean
St.Dev. 95% CIe
g/bhp-hr
5.05 0.58
4.40 to 5.73
4.68 0.33
4.17 to 5.05
4.87 0.47
4.52 to 5.22
B20 Mean
St.Dev. 95% CIe
g/bhp-hr
4.97 0.29
4.48 to 5.33
4.50 0.24
4.14 to 4.74
4.74 0.35
4.48 to 5.00 B20 vs. ULSD +2% +4% +3%
PMd
ULSD Mean
St.Dev. 95% CIe
g/bhp-hr
0.24 0.059
0.18 to 0.31
0.29 0.027
0.26 to 0.32
0.26 0.050
0.22 to 0.31
B20 Mean
St.Dev. 95% CIe
g/bhp-hr
0.17 0.030
0.14 to 0.21
0.24 0.070
0.17 to 0.33
0.20 0.061
0.16 to 0.25 B20 vs. ULSD -28%f -18%f -22%f
a Average of head end power engine emission rates for NC 1810, NC 1859, and NC 1869. b Average of head end power engine emission rates for NC 1755, NC 1797, and NC 1893. c HC and NOx emission rates from the Axion are adjusted with multipliers based on SEMTECH-
DS measured FID/NDIR HC ratios and NOx/NO ratios, respectively, as bias correction. d Opacity-based PM emission rates from the Axion are adjusted with multipliers of 5, as bias
correction. e 95% CI is 95% confidence interval on the mean, which is estimated based on bootstrap
simulation. f Percentage difference in italic indicate statistical significance.

29
3.4 Comparison to U.S. EPA Standards
Table 3-8 summarizes the cycle average emission rates of CO, HC, NOx, and PM, based on the weighing factors specified previously, for each locomotive HEP engine on each fuel. The cycle average emission rates are used to compare with the U.S. EPA standards for Tier-2 nonroad diesel engines (U.S. EPA, 2013). However, the measured cycle average emission rates cannot be used to assess compliance with the standards, as the measurement methods are difference.
For CO, the measured cycle average rates are much lower compared to the EPA Tier-2 standards of 2.6 g/bhp-hr, for all locomotive HEP engines on both fuels. The highest CO cycle average emission rate is observed for NC 1797 operated on B20 biodiesel, which is 0.26 g/bhp-hr, 90% lower compared to the EPA standards.
For HC, the EPA Tier-2 standard is not available. The measured cycle average rates are lower compared to the EPA Tier-1 standards of 1.0 g/bhp-hr, for all locomotive HEP engines on both fuels. The highest HC cycle average emission rate is observed for NC 1797 operated on ULSD biodiesel, which is 0.51 g/bhp-hr, 49% lower compared to the EPA standards.
For NOx, the measured cycle average rates are lower compared to the EPA Tier-2 standards of 4.8 g/bhp-hr, except for NC 1797 on ULSD, NC 1810 on ULSD, and NC 1869 on B20, for which the cycle average NOx emission rates are 4.9 g/bhp-hr, 5.7 g/bhp-hr, and 5.3 g/bhp-hr, respectively. However, the measured cycle average rates cannot be used to assess compliance with the standard. The measurements on NOx are based on electrochemical cells, which is not the same as the reference method. The test cycle is also not exactly the same as the reference test cycle.
For PM, the measured cycle average rates are typically higher compared to the EPA Tier-2 standards of 0.15 g/bhp-hr, except for NC 1859 on B20, for which the cycle average PM emission rate is 0.15 g/bhp-hr. However, the measured cycle average rates cannot be used to assess compliance with the standard. The measurements on based on a laser light-scattering detection method, which is not the same as the filter-based method used to determine engine certification or compliance.

30
Table 3-8 Cycle Average Emission Rates for Each Locomotive Head End Power (HEP) Engine on Each of Ultra-Low Sulfur Diesel (ULSD) and B20 Biodiesel Compared to U.S. Environmental Protection Agency Standards
Locomotive HEP Engine
CO (g/bhp-hr)
HCa (g/bhp-hr)
NOxa,c
(g/bhp-hr) PMb,c
(g/bhp-hr)
ULSD B20 ULSD B20 ULSD B20 ULSD B20 NC 1755 0.18 0.11 0.28 0.46 4.8 4.2 0.32 0.22 NC 1797 0.19 0.26 0.51 0.37 4.9 4.5 0.27 0.18 NC 1893 0.18 0.17 0.13 0.33 4.3 4.7 0.29 0.32 NC 1810 0.14 0.15 0.34 0.21 5.7 4.8 0.30 0.21 NC 1859 0.22 0.16 0.45 0.41 4.8 4.8 0.19 0.15 NC 1869 0.15 0.19 0.31 0.14 4.6 5.3 0.21 0.16
EPA Tier-1 Standards 8.5 1.0 6.9 0.4 EPA Tier-2 Standards 2.6 -- 4.8 0.15 a HC and NOx emission rates from the Axion are adjusted with multipliers based on SEMTECH-
DS measured FID/NDIR HC ratios and NOx/NO ratios, respectively, as bias correction b Opacity-based PM emission rates from the Axion are adjusted with multipliers of 5, as bias
correction c Values in Italic are higher compare to the corresponding U.S. EPA Tier-2 standards.
However, the numbers cannot be compared to assess compliance with the standard. The measurements on NOx are based on electrochemical cells, which is not the same as the reference method. The measurements on PM are based on a laser light-scattering detection method, which is not the same as the filter-based method used to determine engine certification or compliance.

31
3.5 Inter-Engine Variability
There are inter-engine variations in emission rates even though these engines are the same model. The inter-engine variability is evaluated based on the variations on the mean values between engines. Within each of the four groups, the values for mean and standard deviation in emission rates for the 3 HEP engines are shown in Table 3-7. In particular, there is substantial inter-engine variability in CO and HC emission rates. Measured CO and HC concentrations below the detection limit is a reason for the variations. The inter-engine variability in NOx and PM cycle average emission rates is relatively small.
Inter-engine variability can be used to determine target sample sizes for future measurements. For example, to compare NOx emission rates between B20 and ULSD for Group 1, assuming that the means remain at 5.05 g/bhp-hr for ULSD and 4.97 g/bhp-hr for B20 and the standard deviations remain at 0.58 g/bhp-hr for ULSD and 0.29 g/bhp-hr for B20, measurements on about 250 engines would be needed to have a statistically significant difference in the mean emission rates for the comparison based on student t-test. The estimated sample size of 250 is large because the mean values obtained in this study are close to each other and the standard deviations of the two fuel statistical samples are much larger than the mean difference. For PM emission rates for Group 1, the estimated sample size to obtain a robust finding of differences between fuels is only 5 engines. Statistical significance should not be the only factor considered in assessing what sample size is needed. If a small difference is not of practical or policy significance, then it may not be necessary to seek a statistically significant comparison.
3.6 Estimating Emission Inventory
The cycle average emission rates for each locomotive HEP engine are used for developing emission inventories for the fleet of NCDOT locomotive HEP engines. Table 3-9 summarizes the estimated annual CO, HC, NOx, and PM emissions. For each locomotive on each fuel, the estimated annual emissions are based on 180 days of service per year, 7 hours operation per day, and an average of 80 hp per day. For example, for NC 1755 on ULSD, the CO cycle average rate is 0.18 g/bhp-hr. This cycle average rate is multiplied by 560 hp-hr (80 hp × 7 hrs) per day and 180 days per year, resulting in approximately 18 kg of annual CO.
For the NCDOT fleet, including the six measured locomotive HEP engines, the annual CO, HC, NOx, and PM emissions are estimated to be approximately 108 kg, 205 kg, 2940 kg, and 160 kg, respectively, by using ULSD. If B20 is used for the fleet, the annual reduction in CO, HC, NOx, and PM emissions are approximately 3 kg, 12 kg, 80 kg, and 36 kg, respectively. If a locomotive operates for a longer time per day or with higher demand for HEP engine load, the total emissions would increase, as would the magnitude of the differences between the fuels.

32
Table 3-9 Estimated Annual Emission Inventory for Each Locomotive Head End Power (HEP) Engine on Each of Ultra-Low Sulfur Diesel (ULSD) and B20 Biodiesel
Locomotive HEP Engines
CO (kg) HC (kg) NOx (kg) PM (kg) ULSD B20 ULSD B20 ULSD B20 ULSD B20
NC 1755 18 11 28 46 488 428 32 22 NC 1797 19 27 52 37 494 455 27 18 NC 1893 19 17 13 33 433 477 29 32 NC 1810 14 15 35 21 575 484 31 21 NC 1859 23 16 46 42 487 485 19 15 NC 1869 15 19 32 14 465 535 22 16
All Engines 108 105 205 193 2940 2860 160 124 For each locomotive on each fuel, the estimated annual emissions are based on measured cycle average engine output-based emission rate multiplied by 180 days of service per year, 7 hours operation per day, and an average of 80 hp per day.

33
4. Conclusions
Fuel use and emission rates are evaluated with respect to selected engine loads and fuel. Time-based fuel use rates increase with engine load, and are slightly higher for B20 versus ULSD. Trends in CO and HC emission rates with respect to engine load and fuel are not conclusive because a substantial proportion of measured concentrations are below the detection limit. Engine output-based NOx emission rates tend to follow a “U” shape trend over engine load. Use of B20 tends to have slightly higher cycle average NOx emission rates than ULSD but this difference was not statistically significant. Engine output-based PM emission rates tend to gradually decrease over engine load, and the cycle average PM emission rates were lower by approximately 20% for B20 versus ULSD.
The FID/NDIR ratios and NOx/NO ratios measured here have implications on the composition of HC and NOx for diesel exhaust. Use of B20 leads to lower FID/NDIR and NOx/NO ratios, which indicates lower proportions of aromatic HCs and NO2. Measurements for speciated HCs could enable further evaluation of the composition of HC with respect to engine load and fuel.
Cycle average emission rates are developed for both ULSD and B20 and are used to estimate an emission inventory for the NCDOT locomotive fleet. The difference in estimated emission inventories for each of B20 and ULSD for a given pollutant can be used as references for NCDOT or other agencies to identify emission benefits from use of B20.
Inter-engine variability is observed within each of the four groups. The quantification of the inter-engine variability provides insights regarding study design for future measurements, such as the sample size needed to obtain statistically significant differences when comparing fuels. Inter-engine variability also affects the confidence interval on the mean emissions.
Overall, a method is demonstrated for measuring fuel use and emission rates for in-use locomotive HEP engines using commercially available PEMS, an engine activity data logger, and a load box. This methodology can be applied to further research. Examples include: (a) evaluation of alternative fuels, such as different proportions of soybean-based biodiesel blends (e.g., B40), and different biodiesel feedstock (e.g., waste cooking oil based biodiesel); (b) evaluation of HEP engines that are subjected to more stringent emission standards; (c) evaluation of emissions for other non-road engines; and (d) development and validation of a fuel use and emission model for locomotive HEP engines.
NCDOT’s Rail Division can use the measured emission rates of the rebuilt locomotives to compare with applicable standards and as a basis for comparison to future measurements that could be made in the rail yard, such as with other fuels. The results obtained benefit the department by providing a methodology and detailed results regarding a relatively low cost method for comparative assessment of locomotive engine emissions that could be promoted and adopted industry-wide as complementary to more expensive and rigorous certification test methods. A key benefit of the PEMS-based approach is that it is flexible, because it is deployable in settings that include an engine dynamometer, rail yard stationary test, and over-

34
the-rail testing, thereby enabling comparisons of standardized and real-world operating conditions.

35
5. References
ATSDR. Case Studies in Environmental Medicine: Toxicity of Polycyclic Aromatic Hydrocarbons (PAHs). Agency for Toxic Substances and Disease Registry, Centers for Disease Control and Prevention, Atlanta, GA, 2013.
Ballesteros, R., J.J. Hernandez, L.L. Lyons, B. Cabanas, and A. Tapia. Speciation of the Semivolatile Hydrocarbon Engine Emissions from Sunflower Biodiesel. Fuel, 2008, 87(10-11): 1835-1843.
Battelle. Environmental Technology Verification Report: Clean Air Technologies International, Inc., Remote On-Board Emissions Monitor. Prepared by Battelle for U.S. Environmental Protection Agency, Ann Arbor, MI, 2003.
Buyukkaya, E. Effect of Biodiesel on a DI Diesel Engine Performance, Emission and Combustion Characteristics. Fuel, 2010, 89(10): 3099-3105.
Canakci, M. Combustion Characteristics of a Turbocharged DI Compression Ignition Engine Fueled with Petroleum Diesel Fuels and Biodiesel. Bioresource Technology, 2007, 98(6): 1167-1175.
CATI. OEM-2100AX Axion System Operation Manual. Clean Air Technologies International, Inc., Buffalo, NY, 2008.
Cheung, C.S., L. Zhu, and Z. Huang. Regulated and Unregulated Emissions from a Diesel Engine Fueled with Biodiesel and Biodiesel Blended with Methanol. Atmospheric Environment, 2009, 43(32): 4865-4872.
Dallmann, T.R. and R.A. Harley. Evaluation of Mobile Source Emission Trends in the United States. Journal of Geophysical Research: Atmospheres, 2010, 115(D14), Article D14305.
Durbin, T.D., J.M. Norbeck, R.D. Wilson, and H.A. Galdamez. Effect of Payload on Exhaust Emissions from Light Heavy-Duty Diesel and Gasoline Trucks. Environmental Science & Technology, 2000, 34(22): 4708-4713.
Frey, H.C., A. Unal, N.M. Rouphail, and J.D. Colyar. On-Road Measurement of Vehicle Tailpipe Emissions Using a Portable Instrument. Journal of the Air & Waste Management Association, 2003, 53(8): 992-1002.
Frey, H.C. and B.M. Graver. Measurement and Evaluation of Fuels and Technologies for Passenger Rail Service in North Carolina. Final Report HWY-2010-12, Prepared by North Carolina State University for North Carolina Department of Transportation, Raleigh, NC, 2012.
Frey, H.C. and H.W. Choi. Baseline Emission Rates for F59 and GP40 Locomotives Operated on Ultra Low Sulfur Diesel. Technical Assistance Project No. 2008-15, Prepared by North Carolina State University for the North Carolina Department of Transportation, Raleigh, NC, 2008.
36
Frey, H.C., H.W. Choi, and K. Kim. Measurement of the Energy Use and Emissions of Passenger Rail Locomotives using a Portable Emission measurement System. Proceedings of 102nd Annual Conference and Exhibition of Air & Waste Management Association, Detroit, MI, June 16-19, 2009.
Frey, H.C., W. Rasdorf, K. Kim, S.H. Pang, and P. Lewis. Comparison of Real-World Emissions of B20 Biodiesel Versus Petroleum Diesel for Selected Nonroad Vehicles and Engine Tiers. Transportation Research Record: Journal of the Transportation Research Board, 2008, 2058: 33-42.
Hass, M.J., K.M. Scott, T.L. Alleman, and R.L. McCormick. Engine Performance of Biodiesel Fuel Prepared from Soybean Soapstock: A High Quality Renewable Fuel Produced from a Waste Feedstock. Energy & Fuels, 2001, 15(5): 1207-1212.
Heywood, J.B. Internal Combustion Engine Fundamentals. Vol. 930, McGraw-Hill, New York, 1998.
Labeckas, G. and S. Slavinskas. The Effect of Rapeseed Oil Methyl Ester on Direct Injection Diesel Engine Performance and Exhaust Emissions. Energy Conversion and Management, 2006, 47(13-14): 1954-1967.
Lapuerta, M., J.M. Herreros, L.L. Lyons, R.Garcia-Contreras, and Y. Briceno. Effect of the Alcohol Type Used in the Production of Waste Cooking Oil Biodiesel on Diesel Performance and Emissions. Fuel, 2008, 87(15-16): 3161-3169.
Puhan, S., N. Vedaraman, G. Sankaranarayanan, and B.V. Bharat Ram. Performance and Emission Study of Mahua Oil (Madhuca Indica Oil) Ethyl Ester in a 4-Stroke Natural Aspirated Direct Injection Diesel Engine. Renewable Energy, 2005, 30(8): 1269-1278.
Qi, D.H., L.M. Geng, H. Chen, Y.Z. Bian, J. Liu, and X.C. Ren. Combustion and Performance Evaluation of a Diesel Engine Fueled Biodiesel Produced from Soybean Crude Oil. Renewable Energy, 2009, 34(12): 2706-2713.
Sandhu, G.S. and H.C. Frey. Effects of Errors on Vehicle Emission Rates from Portable Emission Measurement Systems. Transportation Research Record: Journal of the Transportation Research Board, 2013, 2340: 10-19.
Sandhu G.S. and H.C. Frey. Real-World Measurement and Evaluation of Duty Cycles, Fuels, and Emission Control Technologies of Heavy-Duty Trucks. Transportation Research Record: Journal of the Transportation Research Board, 2012, 2270: 180-187.
Singer, B.C., R.A. Harley, D. Littlejohn, J. Ho, and T. Vo. Scaling of Infrared Remote Sensor Hydrocarbon Measurements for Motor Vehicle Emission Inventory Calculations. Environmental Science & Technology, 1998, 32(21): 3241-3248.
Stephens, R.D., P.A. Mulawa, M.T. Giles, K.G. Kennedy, P.J. Grobiicki, S.H. Cadle, and K.T. Knapp. An Experimental Evaluation of Remote Sensing-Based Hydrocarbon
37
Measurements: A Comparison to FID Measurements. Journal of the Air & Waste Management Association, 1996, 46(2): 148-158.
Tat, M.E., J.H. Van Gerpen, and P.S. Wang. Fuel Property Effects on Injection Timing, Ignition Timing and Oxides of Nitrogen Emissions from Biodiesel-Fueled Engines. Transactions of the American Society of Agricultural and Biological Engineers, 2007, 50(4): 1123-1128.
Turrio-Baldassarri, L., C.L. Battistelli, L. Conti, R. Crebelli, B.De Berardis, A.L. Iamiceli, M. Gambino, S. Iannaccone. Emission Comparison of Urban Bus Engine Fueled with Diesel Oil and Biodiesel Blend. Science of the Total Environment. 2004, 327(1-3): 147-162.
U.S. APTA. 2013 Public Transportation Fact Book, 64th Edition. U.S. American Public Transportation Association, October 2013.
U.S. EPA. 2008 Final Report: Integrated Science Assessment for Oxides of Nitrogen – Health Criteria, EPA-600-R-08-071. U.S. Environmental Protection Agency, Washington, D.C., 2008.
U.S. EPA. 2009 Final report: Integrated Science Assessment for Particulate Matters, EPA-600-R-08-139F. U.S. Environmental Protection Agency, Washington, D.C., 2009.
U.S. EPA, A Comprehensive Analysis of Biodiesel Impacts on Exhaust Emissions, Draft Technical Report. U.S. Environmental Protection Agency, Washington, D.C., EPA420-P-02-001, 2002.
U.S. EPA. Control of Emissions of Air Pollution from Nonroad Diesel Engines and Fuel. U.S. Environmental Protection Agency, Federal Register, Vol. 69, No. 124, 29 June 2004, pp. 39251.
U.S. EPA. Nonroad Compression-Ignition Engines – Exhaust Emission Standards. U.S. Environmental Protection Agency, Washington, D.C., 2013.
Wu, F. J. Wang, W. Chen, and S. Shuai. A Study on Emission Performance of a Diesel Engine Fueled with Five Typical Methyl Ester Biodiesels. Atmospheric Environment, 2009, 43(7): 1481-1485.
Xue, J., T.E. Grift, and A.C. Hansen. Effect of Biodiesel on Engine Performances and Emissions. Renewable and Sustainable Energy Reviews, 2011, 15(2): 1098-1116.

A-1
Appendix A. Results for NC 1755 HEP Engine
A1 NC 1755 on ULSD
Figure A-1 shows the comparison between the estimated engine output and the load box load. A linear relationship was observed with R2 of 0.99.
Table A-1 summarizes the observed load, engine output, and time-based fuel use and emission rates for each of the load setting for locomotive NC 1755 on ULSD. The mean value is the average over 3 replicates. The Coefficient of Variation (CV) is the ratio of standard deviation of the 3 replicates over the mean.
Tables A-2, A-3, and A-4 show the engine output-based emission rates, fuel-based emission rates, and engine activities, respectively, for NC 1755 on ULSD.
The observed loads were highly repeatable, with CVs of 0.01 or less, except for the 15 kW load box load, for which the CV was 0.87. For the 15 kW load box load, the observed load was 0 for the first replicate and approximately 6% for the other two replicates, resulting in an observed 4% load on average of the 3 replicates.
Engine output increased from 0 at idle to approximately 700 hp at an observed 83% load. The observed engine outputs at a given load setting were highly repeatable, with CVs of 0.01 or less, except for the observed 4% load, for which the CV was 0.87.
Fuel use rates ranged from 5.7 g/s to 7.1 g/s at idle to observed 10% load. However, there was lack of precise control of the engine load at low loads. Fuel use rates subsequently increased to approximately 33 g/s at an observed 83% load. The observed fuel use rates at a given load setting were highly repeatable, with CVs of 0.05 or less.
CO2 emission rates were approximately 20 g/s at idle to observed 10% load. However, there was lack of precise control of the engine load at low loads. CO2 emission rates subsequently increased to approximately 100 g/s at an observed 83% load. The observed CO2 emission rates at a given load setting were highly repeatable, with CVs of 0.05 or less.
CO emission rates decreased from 0.24 g/s at idle to 0.03 g/s at an observed 15% load and remained at less than 0.01 g/s through observed 83% load. The observed CO emission rates were highly repeatable from idle to observed 15% load, with CVs of 0.09 or less. Large variations were observed for the other observed load settings as the CVs range from 0.87 to 1.05, depending on load settings.
HC emission rates were approximately 0.06 g/s at an observed 0% load, decreased to approximately 0.02 g/s at an observed 15% load, and increased to 0.04 g/s at an observed 83% load. The observed HC emission rates were highly repeatable for observed 4%, 7%, and 10% load, with CVs of 0.07 or less. Moderate variations were observed for the other observed load settings as the CVs range from 0.11 to 0.19, depending on load settings.
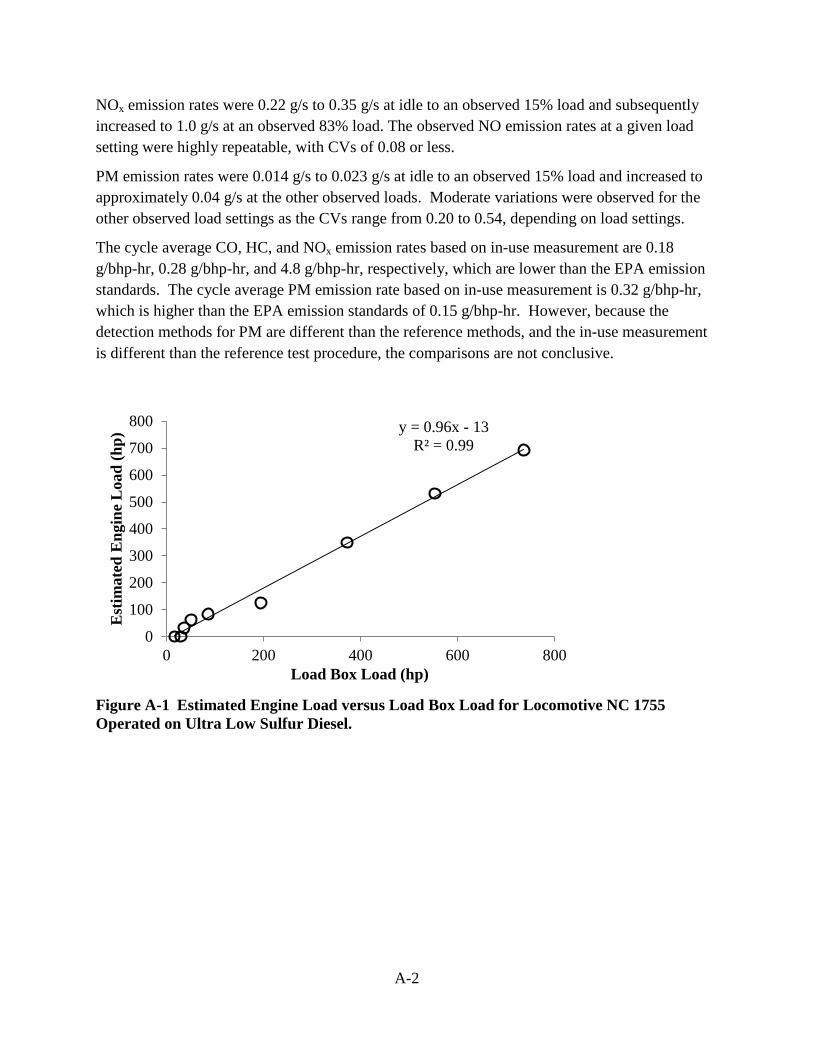
A-2
NOx emission rates were 0.22 g/s to 0.35 g/s at idle to an observed 15% load and subsequently increased to 1.0 g/s at an observed 83% load. The observed NO emission rates at a given load setting were highly repeatable, with CVs of 0.08 or less.
PM emission rates were 0.014 g/s to 0.023 g/s at idle to an observed 15% load and increased to approximately 0.04 g/s at the other observed loads. Moderate variations were observed for the other observed load settings as the CVs range from 0.20 to 0.54, depending on load settings.
The cycle average CO, HC, and NOx emission rates based on in-use measurement are 0.18 g/bhp-hr, 0.28 g/bhp-hr, and 4.8 g/bhp-hr, respectively, which are lower than the EPA emission standards. The cycle average PM emission rate based on in-use measurement is 0.32 g/bhp-hr, which is higher than the EPA emission standards of 0.15 g/bhp-hr. However, because the detection methods for PM are different than the reference methods, and the in-use measurement is different than the reference test procedure, the comparisons are not conclusive.
Figure A-1 Estimated Engine Load versus Load Box Load for Locomotive NC 1755 Operated on Ultra Low Sulfur Diesel.
y = 0.96x - 13 R² = 0.99
0
100
200
300
400
500
600
700
800
0 200 400 600 800
Est
imat
ed E
ngin
e L
oad
(hp)
Load Box Load (hp)
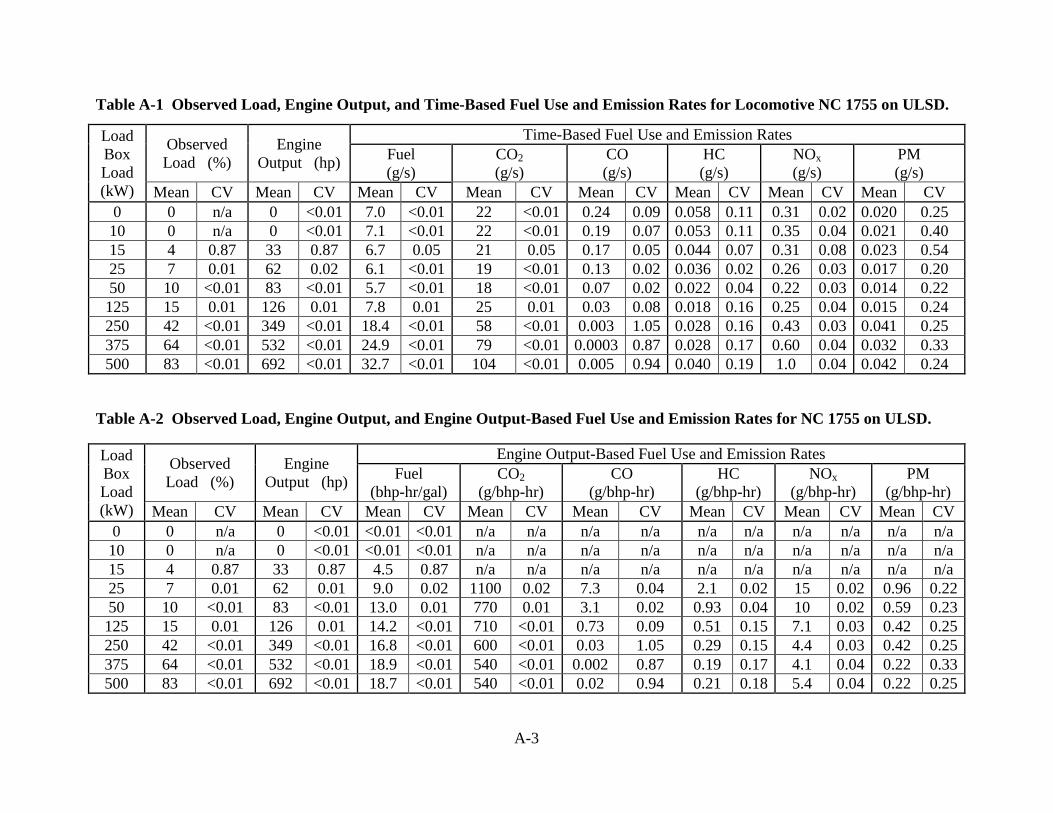
A-3
Table A-1 Observed Load, Engine Output, and Time-Based Fuel Use and Emission Rates for Locomotive NC 1755 on ULSD.
Load Box Load (kW)
Observed Load (%)
Engine Output (hp)
Time-Based Fuel Use and Emission Rates Fuel (g/s)
CO2 (g/s)
CO (g/s)
HC (g/s)
NOx (g/s)
PM (g/s)
Mean CV Mean CV Mean CV Mean CV Mean CV Mean CV Mean CV Mean CV 0 0 n/a 0 <0.01 7.0 <0.01 22 <0.01 0.24 0.09 0.058 0.11 0.31 0.02 0.020 0.25 10 0 n/a 0 <0.01 7.1 <0.01 22 <0.01 0.19 0.07 0.053 0.11 0.35 0.04 0.021 0.40 15 4 0.87 33 0.87 6.7 0.05 21 0.05 0.17 0.05 0.044 0.07 0.31 0.08 0.023 0.54 25 7 0.01 62 0.02 6.1 <0.01 19 <0.01 0.13 0.02 0.036 0.02 0.26 0.03 0.017 0.20 50 10 <0.01 83 <0.01 5.7 <0.01 18 <0.01 0.07 0.02 0.022 0.04 0.22 0.03 0.014 0.22 125 15 0.01 126 0.01 7.8 0.01 25 0.01 0.03 0.08 0.018 0.16 0.25 0.04 0.015 0.24 250 42 <0.01 349 <0.01 18.4 <0.01 58 <0.01 0.003 1.05 0.028 0.16 0.43 0.03 0.041 0.25 375 64 <0.01 532 <0.01 24.9 <0.01 79 <0.01 0.0003 0.87 0.028 0.17 0.60 0.04 0.032 0.33 500 83 <0.01 692 <0.01 32.7 <0.01 104 <0.01 0.005 0.94 0.040 0.19 1.0 0.04 0.042 0.24
Table A-2 Observed Load, Engine Output, and Engine Output-Based Fuel Use and Emission Rates for NC 1755 on ULSD.
Load Box Load (kW)
Observed Load (%)
Engine Output (hp)
Engine Output-Based Fuel Use and Emission Rates Fuel
(bhp-hr/gal) CO2
(g/bhp-hr) CO
(g/bhp-hr) HC
(g/bhp-hr) NOx
(g/bhp-hr) PM
(g/bhp-hr) Mean CV Mean CV Mean CV Mean CV Mean CV Mean CV Mean CV Mean CV
0 0 n/a 0 <0.01 <0.01 <0.01 n/a n/a n/a n/a n/a n/a n/a n/a n/a n/a 10 0 n/a 0 <0.01 <0.01 <0.01 n/a n/a n/a n/a n/a n/a n/a n/a n/a n/a 15 4 0.87 33 0.87 4.5 0.87 n/a n/a n/a n/a n/a n/a n/a n/a n/a n/a 25 7 0.01 62 0.01 9.0 0.02 1100 0.02 7.3 0.04 2.1 0.02 15 0.02 0.96 0.22 50 10 <0.01 83 <0.01 13.0 0.01 770 0.01 3.1 0.02 0.93 0.04 10 0.02 0.59 0.23 125 15 0.01 126 0.01 14.2 <0.01 710 <0.01 0.73 0.09 0.51 0.15 7.1 0.03 0.42 0.25 250 42 <0.01 349 <0.01 16.8 <0.01 600 <0.01 0.03 1.05 0.29 0.15 4.4 0.03 0.42 0.25 375 64 <0.01 532 <0.01 18.9 <0.01 540 <0.01 0.002 0.87 0.19 0.17 4.1 0.04 0.22 0.33 500 83 <0.01 692 <0.01 18.7 <0.01 540 <0.01 0.02 0.94 0.21 0.18 5.4 0.04 0.22 0.25

A-4
Table A-3 Observed Load, Engine Output, and Fuel-Based Fuel Use and Emission Rates for NC 1755 on ULSD.
Load Box Load (kW)
Observed Load (%)
Engine Output (hp)
Fuel-Based Emission Rates CO2
(g/gal) CO
(g/gal) HC
(g/gal) NOx
(g/gal) PM
(g/gal) Mean CV Mean CV Mean CV Mean CV Mean CV Mean CV Mean CV
0 0 n/a 0 <0.01 9940 <0.01 108 0.09 26 0.12 142 0.02 13 0.24 10 0 n/a 0 <0.01 9976 <0.01 84 0.07 24 0.11 155 0.04 13 0.40 15 4 0.87 33 0.87 9983 <0.01 81 0.01 21 0.12 147 0.03 15 0.48 25 7 0.01 62 0.01 10010 <0.01 65 0.02 19 0.02 135 0.03 12 0.20 50 10 <0.01 83 <0.01 10053 <0.01 41 0.02 12 0.04 125 0.03 11 0.22 125 15 0.01 126 0.01 10104 <0.01 10 0.09 7.3 0.14 101 0.03 8.4 0.25 250 42 <0.01 349 <0.01 10122 <0.01 0.54 1.05 4.9 0.15 74 0.03 10 0.25 375 64 <0.01 532 <0.01 10124 <0.01 0.03 0.87 3.6 0.17 77 0.04 5.9 0.33 500 83 <0.01 692 <0.01 10123 <0.01 0.46 0.94 3.9 0.18 102 0.04 5.8 0.25
Table A-4 Observed Load, Engine Output, and Engine Activities for NC 1755 on ULSD
Load Box Load (kW)
Observed Load (%)
Engine Activity Engine
Output (hp) Load Box
Output (kW) Engine
Speed (rpm) IAT (°C)
Boost Pressure (kPa)
MAP (kPa)
Mean CV Mean CV Mean CV Mean CV Mean CV Mean CV Mean CV 0 0 n/a 0 <0.01 12 <0.01 1800 <0.01 21 0.10 14 <0.01 114 <0.01 10 0 n/a 0 <0.01 22 <0.01 1800 <0.01 21 0.10 14 0.03 114 <0.01 15 4 0.87 33 0.87 27 0.01 1800 <0.01 21 0.09 17 0.02 117 <0.01 25 7 0.01 62 0.01 38 <0.01 1800 <0.01 21 0.09 21 <0.01 121 <0.01 50 10 <0.01 83 <0.01 64 <0.01 1800 <0.01 21 0.08 27 <0.01 127 <0.01 125 15 0.01 126 0.01 145 <0.01 1800 <0.01 22 0.07 53 0.01 153 <0.01 250 42 <0.01 349 <0.01 278 <0.01 1800 <0.01 25 0.06 125 0.01 225 0.01 375 64 <0.01 532 <0.01 412 <0.01 1800 <0.01 31 0.05 191 <0.01 291 <0.01 500 83 <0.01 692 <0.01 549 <0.01 1800 <0.01 35 0.04 229 <0.01 329 <0.01

A-5
A2 NC 1755 on B20
Figure A-2 shows the comparison between the estimated engine output and the load box load. A linear relationship was observed with R2 of 0.996.
Table A-5 summarizes the observed load, engine output, and time-based fuel use and emission rates for each of the load setting for locomotive NC 1755 on B20. The mean value is the average over 3 replicates. The Coefficient of Variation (CV) is the ratio of standard deviation of the 3 replicates over the mean.
Tables A-6, A-7, and A-8 show the engine output-based emission rates, fuel-based emission rates, and engine activities, respectively, for NC 1755 on B20.
The observed loads were highly repeatable, with CVs of 0.04 or less, except for the 10 kW load box load, for which CV was 0.87. For 10 kW load box load, the observed load was 0 for the first replicate and approximately 6% for the other two replicates, resulting in an observed 4% load on average of the 3 replicates.
Engine output increased from 0 hp at idle to approximately 710 hp at ab observed 86% load. The observed engine outputs at a given load setting were highly repeatable, with CVs of 0.04 or less, except for the observed 4% load, for which the CV was 0.87.
Fuel use rates ranged from 5.8 g/s to 7.1 g/s at idle to an observed 10% load. However, there was lack of precise control of the engine load at low loads. Fuel use rates subsequently increased to approximately 34 g/s at an observed 86% load. The observed fuel use rates at a given load setting were highly repeatable, with CVs of 0.05 or less.
CO2 emission rates were approximately 20 g/s at idle to an observed 10% load. However, there was lack of precise control of the engine load at low loads. CO2 emission rates subsequently increased to approximately 100 g/s at an observed 86% load. The observed CO2 emission rates at a given load setting were highly repeatable, with CVs of 0.05 or less.
CO emission rates decreased from 0.18 g/s at idle to 0.04 g/s at an observed 10% load and remained at less than 0.04 g/s through an observed 86% load. The observed CO emission rates were highly repeatable at idle and an observed 7% and 8% loads, with CVs of 0.10 or less. Moderate to large variations were observed for the other observed load settings as the CVs range from 0.16 to 1.03, depending on load settings.
HC emission rates were 0.074 g/s at an observed 0% load, decreased to approximately 0.04 g/s at an observed 10% load, and increased to approximately 0.053 g/s at an observed 86% load. Moderate variations were observed for the other observed load settings as the CVs range from 0.36 to 0.76, depending on load settings.

A-6
NOx emission rates were 0.17 g/s to 0.27 g/s at idle to an observed 10% load and subsequently increased to 0.94 g/s at an observed 86% load. The observed NOx emission rates at a given load setting were highly repeatable, with CVs of 0.11 or less.
PM emission rates were 0.013 g/s to 0.018 g/s at idle to an observed 18% load and increased to approximately 0.037 g/s at an observed 86% load. The observed PM emission rates at observed 65% and 86% loadd were highly repeatable, with CVs of 0.06 and 0.02, respectively. Moderate variations were observed for the other observed load settings as the CVs range from 0.12 to 0.34, depending on load settings.
The cycle average CO, HC, and NOx emission rates based on in-use measurement are 0.11 g/bhp-hr, 0.46 g/bhp-hr, and 4.2 g/bhp-hr, respectively, which are lower than the EPA emission standards. The cycle average PM emission rate based on in-use measurement is 0.22 g/bhp-hr, which is slightly higher than the EPA emission standards of 0.15 g/bhp-hr. However, because the detection methods for PM are different than the reference methods, and the in-use measurement is different than the reference test procedure, the comparisons are not conclusive.
Figure A-2 Estimated Engine Load versus Load Box Load for Locomotive NC 1755 Operated on B20 Biodiesel.
y = 0.97x - 1.7 R² = 0.996
0
100
200
300
400
500
600
700
800
0 200 400 600 800
Est
imat
ed E
ngin
e L
oad
(hp)
Load Box Load (hp)

A-7
Table A-5 Observed Load, Engine Output, and Time-Based Fuel Use and Emission Rates for Locomotive NC 1755 on B20.
Load Box Load (kW)
Observed Load (%)
Engine Output (hp)
Time-Based Fuel Use and Emission Rates Fuel (g/s)
CO2 (g/s)
CO (g/s)
HC (g/s)
NOx (g/s)
PM (g/s)
Mean CV Mean CV Mean CV Mean CV Mean CV Mean CV Mean CV Mean CV 0 0 n/a 0 <0.01 7.2 <0.01 22 <0.01 0.18 0.10 0.074 0.68 0.27 0.04 0.018 0.33 10 4 0.87 32 0.87 6.7 0.05 20 0.05 0.14 0.17 0.056 0.76 0.25 0.11 0.018 0.34 15 7 0.04 54 0.04 6.4 0.01 19 0.01 0.12 0.08 0.056 0.68 0.22 0.01 0.018 0.26 25 8 0.03 64 0.03 6.2 0.01 19 0.01 0.09 0.04 0.059 0.36 0.20 0.02 0.017 0.21 50 10 0.03 81 0.03 5.8 0.01 18 0.01 0.04 0.16 0.035 0.51 0.17 0.01 0.013 0.17 125 18 0.04 148 0.04 9.7 0.05 30 0.05 0.01 0.58 0.033 0.48 0.27 0.08 0.015 0.15 250 43 <0.01 358 <0.01 19.3 <0.01 59 <0.01 0.003 1.03 0.051 0.38 0.37 <0.01 0.021 0.12 375 65 <0.01 540 0.01 25.7 0.01 79 0.01 0.0004 0.59 0.042 0.39 0.53 0.02 0.026 0.06 500 86 0.01 713 0.01 34.3 0.01 105 0.01 0.03 0.57 0.053 0.59 0.94 0.01 0.037 0.02
Table A-6 Observed Load, Engine Output, and Engine Output-Based Fuel Use and Emission Rates for NC 1755 on B20.
Load Box Load (kW)
Observed Load (%)
Engine Output (hp)
Engine Output-Based Fuel Use and Emission Rates Fuel
(bhp-hr/gal) CO2
(g/bhp-hr) CO
(g/bhp-hr) HC
(g/bhp-hr) NOx
(g/bhp-hr) PM
(g/bhp-hr) Mean CV Mean CV Mean CV Mean CV Mean CV Mean CV Mean CV Mean CV
0 0 n/a 0 <0.01 <0.01 <0.01 n/a n/a n/a n/a n/a n/a n/a n/a n/a n/a 10 4 0.87 32 0.87 4.4 0.87 n/a n/a n/a n/a n/a n/a n/a n/a n/a n/a 15 7 0.04 54 0.04 7.6 0.04 1300 0.043 7.7 0.05 3.7 0.68 15 0.05 1.2 0.24 25 8 0.03 64 0.03 9.3 0.03 1100 0.033 4.9 0.02 3.3 0.38 11 0.04 0.93 0.19 50 10 0.03 81 0.03 12.5 0.04 790 0.040 1.9 0.13 1.6 0.53 7.7 0.03 0.58 0.14 125 18 0.04 148 0.04 13.6 0.01 720 0.010 0.27 0.60 0.80 0.46 6.6 0.05 0.37 0.20 250 43 <0.01 358 <0.01 16.7 <0.01 590 <0.01 0.034 1.02 0.51 0.38 3.8 <0.01 0.21 0.12 375 65 <0.01 540 <0.01 18.8 <0.01 520 <0.01 0.003 0.59 0.28 0.39 3.5 0.01 0.17 0.07 500 86 0.01 713 0.01 18.7 <0.01 530 <0.01 0.16 0.57 0.27 0.59 4.7 0.01 0.19 0.03

A-8
Table A-7 Observed Load, Engine Output, and Fuel-Based Fuel Use and Emission Rates for NC 1755 on B20.
Load Box Load (kW)
Observed Load (%)
Engine Output (hp)
Fuel-Based Emission Rates CO2
(g/gal) CO
(g/gal) HC
(g/gal) NOx
(g/gal) PM
(g/gal) Mean CV Mean CV Mean CV Mean CV Mean CV Mean CV Mean CV
0 0 n/a 0 <0.01 9720 <0.01 81 0.10 33 0.68 123 0.04 11 0.33 10 4 0.87 32 0.87 9749 <0.01 65 0.12 28 0.78 119 0.07 12 0.29 15 7 0.04 54 0.04 9757 <0.01 58 0.09 28 0.68 111 0.01 12 0.27 25 8 0.03 64 0.03 9774 <0.01 46 0.04 31 0.36 106 0.01 12 0.22 50 10 0.03 81 0.03 9816 <0.01 24 0.17 20 0.50 96 0.01 10 0.18 125 18 0.04 148 0.04 9856 <0.01 3.7 0.61 11 0.45 90 0.04 6.9 0.21 250 43 <0.01 358 <0.01 9864 <0.01 0.57 1.03 8.5 0.38 63 <0.01 4.8 0.12 375 65 <0.01 540 <0.01 9868 <0.01 0.05 0.60 5.3 0.39 67 0.01 4.5 0.07 500 86 0.01 713 0.01 9864 <0.01 2.9 0.57 5.0 0.59 88 0.01 4.8 0.03
Table A-8 Observed Load, Engine Output, and Engine Activities for NC 1755 on B20
Load Box Load (kW)
Observed Load (%)
Engine Activity Engine
Output (hp) Load Box
Output (kW) Engine
Speed (rpm) IAT (°C)
Boost Pressure (kPa)
MAP (kPa)
Mean CV Mean CV Mean CV Mean CV Mean CV Mean CV Mean CV 0 0 n/a 0 <0.01 12 <0.01 1800 <0.01 31 0.09 14 <0.01 114 <0.01 10 4 0.87 32 0.87 22 <0.01 1800 <0.01 31 0.08 14 <0.01 114 <0.01 15 7 0.04 54 0.04 27 <0.01 1800 <0.01 31 0.07 14 0.01 114 <0.01 25 8 0.03 64 0.03 38 <0.01 1800 <0.01 31 0.07 19 0.03 119 <0.01 50 10 0.03 81 0.03 65 <0.01 1800 <0.01 31 0.06 26 0.03 126 0.01 125 18 0.04 148 0.04 144 <0.01 1800 <0.01 32 0.06 48 <0.01 148 <0.01 250 43 <0.01 358 <0.01 277 <0.01 1800 <0.01 35 0.06 124 <0.01 224 <0.01 375 65 <0.01 540 <0.01 412 <0.01 1800 <0.01 38 0.04 188 0.01 288 <0.01 500 86 0.01 713 0.01 549 <0.01 1800 <0.01 41 0.02 227 <0.01 327 <0.01
A-9
Appendix B. Results for NC 1797 HEP Engine
B1 NC 1797 on ULSD
Figure B-1 shows the comparison between the estimated engine output and the load box load. A linear relationship was observed with R2 of 0.996.
Table B-1 summarizes the observed load, engine output, and time-based fuel use and emission rates for each of the load setting for locomotive NC 1797 on ULSD. The mean value is the average over 3 replicates. The Coefficient of Variation (CV) is the ratio of standard deviation of the 3 replicates over the mean.
Tables B-2, B-3, and B-4 show the engine output-based emission rates, fuel-based emission rates, and engine activities, respectively, for NC 1797 on ULSD.
The observed loads were highly repeatable, with CVs of 0.01 or less, except for the target 3% load, for which the observed load was 5% and the CV was 0.35.
Engine output increased from 0 hp at idle to approximately 740 hp at an observed 89% load. The observed engine outputs at a given load setting were highly repeatable, with CVs of 0.02 or less, except for the observed 5% load, for which the CV was 0.35.
Fuel use rates ranged from 5.8 g/s to 7.1 g/s at idle to an observed 10% load. However, there was lack of precise control of the engine load at low loads. Fuel use rates subsequently increased to approximately 33 g/s at an observed 89% load. The observed fuel use rates at a given load setting were highly repeatable, with CVs of 0.03 or less.
CO2 emission rates were approximately 20 g/s at idle to an observed 10% load. However, there was lack of precise control of the engine load at low loads. CO2 emission rates subsequently increased to approximately 100 g/s at an observed 89% load. The observed CO2 emission rates at a given load setting were highly repeatable, with CVs of 0.03 or less.
CO emission rates decreased from 0.18 g/s at idle to 0.06 g/s at an observed 10% load and remained at less than 0.06 g/s through an observed 89% load. The observed CO emission rates were highly repeatable at observed 0%, 5%, and 8% loads, with CVs of 0.09 or less. Moderate to large variations were observed for the other observed load settings as the CVs range from 0.11 to 1.23, depending on load settings.
HC emission rates were 0.061 g/s at idle, decreased to approximately 0.030g/s at an observed 10% load, and increased to 0.069 g/s at an observed 89% load. The observed HC emission rates were highly repeatable for an observed 75% load, with CVs of 0.05. Moderate variations were observed for the other observed load settings as the CVs range from 0.13 to 0.58, depending on load settings.

A-10
NOx emission rates were 0.20 g/s to 0.34 g/s at idle to an observed 10% load and subsequently increased to 1.1 g/s at an observed 89% load. The observed NOx emission rates at a given load setting were highly repeatable, with CVs of 0.03 or less.
PM emission rates were 0.015 g/s to 0.035 g/s, depending on load settings. The observed PM emission rate at an observed 8% load was highly repeatable, with CV of 0.08. Moderate variations were observed for the other load settings as the CVs range from 0.11 to 0.55, depending on load settings.
The cycle average CO, and HC emission rates are 0.19 g/bhp-hr and 0.51 g/bhp-hr, respectively, which are lower than the EPA emission standards. The cycle average NOx and PM emission rate are 4.9 g/bhp-hr and 0.27 g/bhp-hr, respectively, which are higher than the EPA emission standards of 4.8 g/bhp-hr and 0.15 g/bhp-hr. However, because the detection methods for NOx and PM are different than the reference methods, and the in-use measurement is different than the reference test procedure, the comparisons are not conclusive.
Figure B-1 Estimated Engine Load versus Load Box Load for Locomotive NC 1797 Operated on Ultra Low Sulfur Diesel.
y = 1.01x - 10 R² = 0.996
0
100
200
300
400
500
600
700
800
0 200 400 600 800
Est
imat
ed E
ngin
e L
oad
(hp)
Load Box Load (hp)

A-11
Table B-1 Observed Load, Engine Output, and Time-Based Fuel Use and Emission Rates for Locomotive NC 1797 on ULSD.
Load Box Load (kW)
Observed Load (%)
Engine Output (hp)
Time-Based Fuel Use and Emission Rates Fuel (g/s)
CO2 (g/s)
CO (g/s)
HC (g/s)
NOx (g/s)
PM (g/s)
Mean CV Mean CV Mean CV Mean CV Mean CV Mean CV Mean CV Mean CV 0 0 n/a 0 <0.01 7.1 <0.01 22 <0.01 0.18 0.02 0.061 0.58 0.34 0.03 0.021 0.45 10 0 n/a 0.03 <0.01 7.1 <0.01 22 <0.01 0.14 0.02 0.051 0.58 0.34 0.02 0.021 0.40 15 5 0.35 38 0.35 6.6 0.03 21 0.03 0.14 0.09 0.058 0.52 0.27 0.03 0.027 0.11 25 8 <0.01 65 0.01 6.2 <0.01 19 <0.01 0.10 0.06 0.044 0.40 0.24 0.02 0.023 0.08 50 10 <0.01 83 <0.01 5.8 <0.01 18 <0.01 0.06 0.11 0.030 0.36 0.20 0.03 0.015 0.39 125 19 0.01 158 0.01 9.7 0.02 31 0.02 0.02 0.24 0.034 0.33 0.34 0.02 0.021 0.54 250 45 0.01 378 0.01 18.8 0.02 60 0.02 0.01 0.45 0.056 0.13 0.40 0.03 0.032 0.55 375 65 0.01 544 0.01 23.5 0.01 75 0.01 0.002 1.23 0.061 0.05 0.67 0.02 0.025 0.35 500 89 0.02 742 0.02 32.9 0.02 104 0.02 0.05 0.96 0.069 0.22 1.1 0.03 0.035 0.32
Table B-2 Observed Load, Engine Output, and Engine Output-Based Fuel Use and Emission Rates for NC 1797 on ULSD.
Load Box Load (kW)
Observed Load (%)
Engine Output (hp)
Engine Output-Based Fuel Use and Emission Rates Fuel
(bhp-hr/gal) CO2
(g/bhp-hr) CO
(g/bhp-hr) HC
(g/bhp-hr) NOx
(g/bhp-hr) PM
(g/bhp-hr) Mean CV Mean CV Mean CV Mean CV Mean CV Mean CV Mean CV Mean CV
0 0 n/a 0 <0.01 <0.01 <0.01 n/a n/a n/a n/a n/a n/a n/a n/a n/a n/a 10 0 n/a 0 <0.01 <0.01 <0.01 n/a n/a n/a n/a n/a n/a n/a n/a n/a n/a 15 5 0.35 38 0.35 5.2 0.38 2100 0.31 14 0.35 6.4 0.66 27 0.31 2.7 0.29 25 8 <0.01 65 <0.01 9.3 0.01 1100 0.01 5.5 0.06 2.4 0.40 13 0.03 1.3 0.08 50 10 <0.01 83 <0.01 12.8 0.01 790 0.01 2.5 0.10 1.3 0.36 8.5 0.03 0.66 0.38 125 19 0.01 158 0.01 14.5 0.01 700 0.01 0.50 0.24 0.78 0.32 7.8 0.01 0.47 0.53 250 45 0.01 378 0.01 17.8 0.01 570 0.01 0.078 0.45 0.54 0.12 3.8 0.01 0.31 0.56 375 65 0.01 544 0.01 20.4 <0.01 500 <0.01 0.014 1.23 0.41 0.04 4.4 0.01 0.16 0.35 500 89 0.02 742 0.02 19.9 <0.01 510 <0.01 0.22 0.95 0.34 0.20 5.3 0.05 0.17 0.33

A-12
Table B-3 Observed Load, Engine Output, and Fuel-Based Fuel Use and Emission Rates for NC 1797 on ULSD.
Load Box Load (kW)
Observed Load (%)
Engine Output (hp)
Fuel-Based Emission Rates CO2
(g/gal) CO
(g/gal) HC
(g/gal) NOx
(g/gal) PM
(g/gal) Mean CV Mean CV Mean CV Mean CV Mean CV Mean CV Mean CV
0 0 n/a 0 <0.01 9973 <0.01 82 0.02 28 0.58 151 0.03 14 0.45 10 0 n/a 0 <0.01 10004 <0.01 64 0.02 23 0.58 151 0.02 14 0.40 15 5 0.35 38 0.35 9999 <0.01 66 0.07 27 0.51 129 <0.01 19 0.12 25 8 <0.01 65 <0.01 10025 <0.01 51 0.06 23 0.40 122 0.02 17 0.08 50 10 <0.01 83 <0.01 10061 <0.01 32 0.11 16 0.36 109 0.02 12 0.39 125 19 0.01 158 0.01 10103 <0.01 7.3 0.25 11 0.32 113 0.01 9.5 0.52 250 45 0.01 378 0.01 10114 <0.01 1.4 0.45 10 0.11 69 0.01 7.7 0.56 375 65 0.01 544 0.01 10117 <0.01 0.29 1.22 8.3 0.04 91 0.01 4.7 0.35 500 89 0.02 742 0.02 10113 <0.01 4.3 0.95 6.7 0.20 106 0.05 4.8 0.34
Table B-4 Observed Load, Engine Output, and Engine Activities for NC 1797 on ULSD
Load Box Load (kW)
Observed Load (%)
Engine Activity Engine
Output (hp) Load Box
Output (kW) Engine
Speed (rpm) IAT (°C)
Boost Pressure (kPa)
MAP (kPa)
Mean CV Mean CV Mean CV Mean CV Mean CV Mean CV Mean CV 0 0 n/a 0 <0.01 12 <0.01 1801 <0.01 29 0.08 14 0.03 114 <0.01 10 0 n/a 0 <0.01 22 <0.01 1801 <0.01 29 0.06 14 <0.01 114 <0.01 15 5 0.35 38 0.35 27 <0.01 1801 <0.01 29 0.06 16 0.14 116 0.02 25 8 <0.01 65 <0.01 37 <0.01 1801 <0.01 29 0.03 19 0.11 119 0.02 50 10 <0.01 83 <0.01 64 0.01 1801 <0.01 30 0.04 25 0.16 125 0.03 125 19 0.01 158 0.01 145 <0.01 1801 <0.01 30 0.04 47 0.06 147 0.02 250 45 0.01 378 0.01 278 <0.01 1801 <0.01 36 0.02 124 0.07 224 0.04 375 65 0.01 544 0.01 413 <0.01 1801 <0.01 42 0.02 176 0.08 276 0.05 500 89 0.02 742 0.02 550 <0.01 1801 <0.01 49 0.01 215 0.08 315 0.05

A-13
B2 NC 1797 on B20
Figure B-2 shows the comparison between the estimated engine output and the load box load. A linear relationship was observed with R2 of 0.996.
Table B-5 summarizes the observed load, engine output, and time-based fuel use and emission rates for each of the load setting for locomotive NC 1797 on B20. The mean value is the average over 3 replicates. The Coefficient of Variation (CV) is the ratio of standard deviation of the 3 replicates over the mean.
Tables B-6, B-7, and B-8 show the engine output-based emission rates, fuel-based emission rates, and engine activities, respectively, for NC 1755 on B20.
The observed loads were highly repeatable, with CVs of 0.06 or less, except for the 10 kW load box load, for which the CV was 0.87. For the 10 kW load box load, the observed load was 0 for the first replicate and approximately 5% for the other two replicates, resulting in an observed 3% load on average of the 3 replicates.
Engine output increased from 0 hp at idle to approximately 770 hp at an observed 93% load. The observed engine outputs at a given load setting were highly repeatable, with CVs of 0.06 or less, except for the observed 3% load, for which the CV was 0.87.
Fuel use rates ranged from 6.0 g/s to 7.2 g/s at idle to an observed 9% load. However, there was lack of precise control of the engine load at low loads. Fuel use rates subsequently increased to approximately 35 g/s at an observed 93% load. The observed fuel use rates at a given load setting were highly repeatable, with CVs of 0.04 or less.
CO2 emission rates were approximately 20 g/s at idle to an observed 9% load. However, there was lack of precise control of the engine load at low loads. CO2 emission rates subsequently increased to approximately 110 g/s at an observed 93% load. The observed CO2 emission rates at a given load setting were highly repeatable, with CVs of 0.04 or less.
CO emission rates decreased from 0.18 g/s at idle to 0.01 g/s at an observed 67% load and increased to 0.19 g/s at an observed 93% load. The observed CO emission rates were highly repeatable from idle to an observed 9% load, with CVs of 0.10 or less. Moderate to large variations were observed for the other observed load settings as the CVs range from 0.24 to 0.75, depending on load settings.
HC emission rates were 0.061 g/s at idle, decreased to approximately 0.0301 g/s at an observed 9% load, and increased to 0.069 g/s through an observed 93% load. The observed HC emission rates were highly repeatable at idle and an observed 46% load, with CVs of 0.09 and 0.07, respectively. Moderate variations were observed for the other observed load settings as the CVs range from 0.22 to 0.60, depending on load settings.

A-14
NOx emission rates decreased from 0.31 g/s at idle to 0.18 g/s at an observed 9% load and subsequently increased to 1.0 g/s at an observed 93% load. The observed NOx emission rates at a given load setting were highly repeatable, with CVs of 0.03 or less, except for the observed 3% load, for which the CV was 0.13.
PM emission rates were 0.012 g/s to 0.016 g/s at idle to an observed 19% load and increased to approximately 0.028 g/s at an observed 89% loads. The observed PM emission rates at an observed 93% load were highly repeatable, with CV of 0.05. Moderate variations were observed for the other load settings as the CVs range from 0.14 to 0.35, depending on load settings.
The cycle average CO, HC, and NOx emission rates are 0.26 g/bhp-hr, 0.37 g/bhp-hr, and 4.5 g/bhp-hr, respectively, which are lower than the EPA emission standards. The cycle average PM emission rate is 0.18 g/bhp-hr, which is higher than the EPA emission standards of 0.15 g/bhp-hr. However, because the detection methods for PM are different than the reference methods, and the in-use measurement is different than the reference test procedure, the comparisons are not conclusive.
Figure B-2 Estimated Engine Load versus Load Box Load for Locomotive NC 1797 Operated on B20 Biodiesel.
y = 1.04x - 7.7 R² = 0.996
0100200300400500600700800900
0 200 400 600 800
Est
imat
ed E
ngin
e L
oad
(hp)
Load Box Load (hp)

A-15
Table B-5 Observed Load, Engine Output, and Time-Based Fuel Use and Emission Rates for Locomotive NC 1797 on B20.
Load Box Load (kW)
Observed Load (%)
Engine Output (hp)
Time-Based Fuel Use and Emission Rates Fuel (g/s)
CO2 (g/s)
CO (g/s)
HC (g/s)
NOx (g/s)
PM (g/s)
Mean CV Mean CV Mean CV Mean CV Mean CV Mean CV Mean CV Mean CV 0 0 n/a 0 <0.01 7.2 <0.01 22 <0.01 0.18 0.06 0.065 0.09 0.31 0.03 0.016 0.31 10 3 0.87 29 0.87 6.9 0.04 21 0.04 0.15 0.07 0.050 0.31 0.27 0.13 0.016 0.27 15 6 0.03 48 0.03 6.6 0.01 20 0.01 0.12 0.08 0.049 0.56 0.25 0.02 0.016 0.35 25 7 0.06 60 0.06 6.4 0.01 19 0.01 0.10 0.10 0.036 0.45 0.22 0.02 0.014 0.27 50 9 0.05 78 0.05 6.0 0.02 18 0.01 0.06 0.06 0.025 0.33 0.18 0.02 0.012 0.18 125 19 0.01 160 0.01 9.9 0.01 30 0.01 0.02 0.24 0.030 0.22 0.33 0.03 0.014 0.31 250 46 0.01 383 0.01 19.4 0.01 59 0.01 0.01 0.75 0.044 0.07 0.38 0.01 0.021 0.27 375 67 0.01 553 0.01 24.4 0.01 75 0.01 0.01 0.57 0.037 0.60 0.62 0.02 0.016 0.14 500 93 0.02 770 0.02 34.8 0.02 106 0.02 0.19 0.29 0.036 0.35 1.0 0.03 0.028 0.05
Table B-6 Observed Load, Engine Output, and Engine Output-Based Fuel Use and Emission Rates for NC 1797 on B20.
Load Box Load (kW)
Observed Load (%)
Engine Output (hp)
Engine Output-Based Fuel Use and Emission Rates Fuel
(bhp-hr/gal) CO2
(g/bhp-hr) CO
(g/bhp-hr) HC
(g/bhp-hr) NOx
(g/bhp-hr) PM
(g/bhp-hr) Mean CV Mean CV Mean CV Mean CV Mean CV Mean CV Mean CV Mean CV
0 0 n/a 0 <0.01 <0.01 <0.01 n/a n/a n/a n/a n/a n/a n/a n/a n/a n/a 10 3 0.87 29 0.87 3.8 0.87 n/a n/a n/a n/a n/a n/a n/a n/a n/a n/a 15 6 0.03 48 0.03 6.5 0.04 1500 0.04 9.3 0.12 3.6 0.54 18 0.05 1.2 0.39 25 7 0.06 60 0.06 8.5 0.07 1200 0.07 5.9 0.08 2.2 0.49 13 0.06 0.83 0.21 50 9 0.05 78 0.05 11.8 0.07 830 0.07 2.6 0.10 1.1 0.35 8.4 0.04 0.53 0.13 125 19 0.01 160 0.01 14.4 <0.01 680 <0.01 0.44 0.24 0.68 0.23 7.4 0.02 0.33 0.30 250 46 0.01 383 0.01 17.7 <0.01 560 <0.01 0.072 0.75 0.42 0.07 3.6 0.01 0.20 0.28 375 67 0.01 553 0.01 20.3 <0.01 490 <0.01 0.058 0.56 0.24 0.60 4.0 0.01 0.10 0.15 500 93 0.02 770 0.02 19.8 <0.01 500 <0.01 0.89 0.28 0.17 0.34 4.6 0.02 0.13 0.06

A-16
Table B-7 Observed Load, Engine Output, and Fuel-Based Fuel Use and Emission Rates for NC 1797 on B20.
Load Box Load (kW)
Observed Load (%)
Engine Output (hp)
Fuel-Based Emission Rates CO2
(g/gal) CO
(g/gal) HC
(g/gal) NOx
(g/gal) PM
(g/gal) Mean CV Mean CV Mean CV Mean CV Mean CV Mean CV Mean CV
0 0 n/a 0 <0.01 9717 <0.01 82 0.06 29 0.09 142 0.03 10 0.31 10 3 0.87 29 0.87 9741 <0.01 70 0.03 23 0.34 128 0.09 10 0.23 15 6 0.03 48 0.03 9755 <0.01 61 0.08 24 0.56 120 0.01 11 0.35 25 7 0.06 60 0.06 9776 <0.01 50 0.10 18 0.45 112 0.02 10 0.28 50 9 0.05 78 0.05 9811 <0.01 30 0.06 13 0.32 99 0.04 8.7 0.20 125 19 0.01 160 0.01 9852 <0.01 6.4 0.24 10 0.22 107 0.02 6.5 0.31 250 46 0.01 383 0.01 9864 <0.01 1.3 0.75 7.4 0.06 63 0.01 4.8 0.28 375 67 0.01 553 0.01 9867 <0.01 1.2 0.56 4.9 0.60 82 0.01 2.8 0.15 500 93 0.02 770 0.02 9842 <0.01 18 0.28 3.3 0.33 91 0.01 3.6 0.06
Table B-8 Observed Load, Engine Output, and Engine Activities for NC 1797 on B20
Load Box Load (kW)
Observed Load (%)
Engine Activity Engine
Output (hp) Load Box
Output (kW) Engine
Speed (rpm) IAT (°C)
Boost Pressure (kPa)
MAP (kPa)
Mean CV Mean CV Mean CV Mean CV Mean CV Mean CV Mean CV 0 0 n/a 0 <0.01 12 <0.01 1801 <0.01 33 0.06 12 0.05 112 0.01 10 3 0.87 29 0.87 22 <0.01 1800 <0.01 33 0.06 14 <0.01 114 <0.01 15 6 0.03 48 0.03 27 <0.01 1801 <0.01 33 0.06 14 <0.01 114 <0.01 25 7 0.06 60 0.06 38 <0.01 1801 <0.01 33 0.05 14 0.08 114 0.01 50 9 0.05 78 0.05 65 <0.01 1800 <0.01 33 0.03 21 <0.01 121 <0.01 125 19 0.01 160 0.01 144 <0.01 1800 <0.01 34 0.03 41 <0.01 141 <0.01 250 46 0.01 383 0.01 277 <0.01 1800 <0.01 38 0.02 107 0.01 207 0.01 375 67 0.01 553 0.01 413 <0.01 1800 <0.01 43 0.02 151 0.01 251 0.01 500 93 0.02 770 0.02 550 <0.01 1800 <0.01 50 0.02 190 0.01 290 0.01

A-17
Appendix C. Results for NC 1893 HEP Engine
C1 NC 1893 on ULSD
Figure C-1 shows the comparison between the estimated engine output and the load box load. A linear relationship was observed with R2 of 0.99.
Table A-1 summarizes the observed load, engine output, and time-based fuel use and emission rates for each of the load setting for locomotive NC 1893 on ULSD. The mean value is the average over 3 replicates. The Coefficient of Variation (CV) is the ratio of standard deviation of the 3 replicates over the mean.
Tables C-2, C-3, and C-4 show the engine output-based emission rates, fuel-based emission rates, and engine activities, respectively, for NC 1893 on ULSD.
The observed loads were highly repeatable, with CVs of 0.02 or less, except for the 15 kW load box load, for which the CV was 1.73. For the 15 kW load box load, the observed load was 0 for the first two replicates and 1.2% for the third replicate, resulting in an observed 0.4% load on average of the 3 replicates.
Engine output increased from 0 at idle to approximately 700 hp at an observed 83% load. The observed engine outputs at a given load setting were highly repeatable, with CVs of 0.02 or less, except for the observed 0.4% load, for which the CV was 1.72.
Fuel use rates ranged from 5.9 g/s to 7.1 g/s at idle to observed 9% load. However, there was lack of precise control of the engine load at low loads. Fuel use rates subsequently increased to approximately 33 g/s at an observed 83% load. The observed fuel use rates at a given load setting were highly repeatable, with CVs of 0.03 or less.
CO2 emission rates were approximately 20 g/s at idle to observed 9% load. However, there was lack of precise control of the engine load at low loads. CO2 emission rates subsequently increased to approximately 100 g/s at an observed 83% load. The observed CO2 emission rates at a given load setting were highly repeatable, with CVs of 0.03 or less.
CO emission rates decreased from 9.2 g/bhp-hr at an observed 7% load to approximately 0.01 g/bhp-hr at an observed 83% load. High variations were observed for 41%, 63%, and 83% observed load, as the CVs for these load settings were 0.41, 1.48, and 0.63, respectively. The CO emission rates for the other load settings was highly repeatable, with CV of 0.09 or less.
HC emission rates decreased from 1.5 g/bhp-hr at an observed 7% load to approximately 0.1 g/bhp-hr at an observed 83% load. Small to moderate variations were observed for all load settings as the CVs range from 0.08 to 0.46, depending on load settings.
NOx emission rates were approximately 16 g/bhp-hr at an observed 7% load and decreased to approximately 3 to 10 g/bhp-hr for the rest load settings. The observed NOx emission rates at a given load setting were highly repeatable, with CV of 0.13 or less.
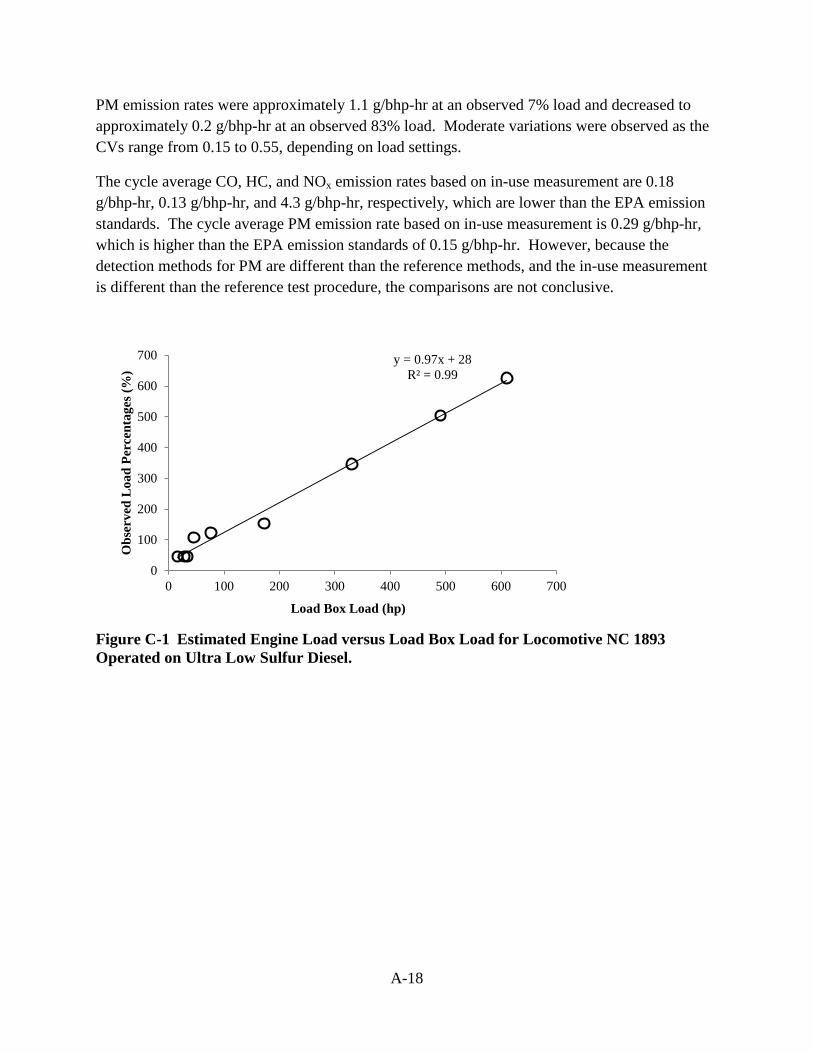
A-18
PM emission rates were approximately 1.1 g/bhp-hr at an observed 7% load and decreased to approximately 0.2 g/bhp-hr at an observed 83% load. Moderate variations were observed as the CVs range from 0.15 to 0.55, depending on load settings.
The cycle average CO, HC, and NOx emission rates based on in-use measurement are 0.18 g/bhp-hr, 0.13 g/bhp-hr, and 4.3 g/bhp-hr, respectively, which are lower than the EPA emission standards. The cycle average PM emission rate based on in-use measurement is 0.29 g/bhp-hr, which is higher than the EPA emission standards of 0.15 g/bhp-hr. However, because the detection methods for PM are different than the reference methods, and the in-use measurement is different than the reference test procedure, the comparisons are not conclusive.
Figure C-1 Estimated Engine Load versus Load Box Load for Locomotive NC 1893 Operated on Ultra Low Sulfur Diesel.
y = 0.97x + 28 R² = 0.99
0
100
200
300
400
500
600
700
0 100 200 300 400 500 600 700
Obs
erve
d L
oad
Perc
enta
ges (
%)
Load Box Load (hp)

A-19
Table C-1 Observed Load, Engine Output, and Time-Based Fuel Use and Emission Rates for Locomotive NC 1893 on ULSD.
Load Box Load (kW)
Observed Load (%)
Engine Output (hp)
Time-Based Fuel Use and Emission Rates Fuel (g/s)
CO2 (g/s)
CO (g/s)
HC (g/s)
NOx (g/s)
PM (g/s)
Mean CV Mean CV Mean CV Mean CV Mean CV Mean CV Mean CV Mean CV 0 0 n/a 0 <0.01 7.1 <0.01 22 <0.01 0.25 0.09 0.042 0.08 0.30 0.06 0.018 0.27 10 0 n/a 0 <0.01 7.1 <0.01 22 <0.01 0.21 0.04 0.035 0.16 0.31 0.06 0.020 0.22 15 0 1.73 3 1.72 7.0 0.01 22 0.01 0.19 0.03 0.030 0.03 0.31 0.05 0.023 0.17 25 7 0.02 54 0.02 6.3 <0.01 20 <0.01 0.14 0.04 0.022 0.11 0.24 0.05 0.016 0.15 50 9 0.02 73 0.02 5.9 <0.01 19 <0.01 0.07 0.04 0.015 0.16 0.21 0.03 0.014 0.26 125 14 0.02 115 0.02 6.9 0.03 22 0.03 0.02 0.08 0.007 0.12 0.21 0.06 0.016 0.57 250 41 0.01 341 0.01 17.8 0.01 56 0.01 0.01 0.41 0.012 0.46 0.38 0.06 0.033 0.57 375 63 0.01 525 0.01 24.4 <0.01 78 <0.01 0.00 1.48 0.012 0.45 0.51 0.06 0.029 0.42 500 83 <0.01 688 <0.01 32.5 <0.01 103 <0.01 0.00 0.63 0.014 0.39 0.92 0.06 0.032 0.27
Table C-2 Observed Load, Engine Output, and Engine Output-Based Fuel Use and Emission Rates for NC 1893 on ULSD.
Load Box Load (kW)
Observed Load (%)
Engine Output (hp)
Engine Output-Based Fuel Use and Emission Rates Fuel
(bhp-hr/gal) CO2
(g/bhp-hr) CO
(g/bhp-hr) HC
(g/bhp-hr) NOx
(g/bhp-hr) PM
(g/bhp-hr) Mean CV Mean CV Mean CV Mean CV Mean CV Mean CV Mean CV Mean CV
0 0 n/a 0 <0.01 <0.01 <0.01 n/a n/a n/a n/a n/a n/a n/a n/a n/a n/a 10 0 n/a 0 <0.01 <0.01 <0.01 n/a n/a n/a n/a n/a n/a n/a n/a n/a n/a 15 0 1.73 3 1.72 0.4 1.718 n/a n/a n/a n/a n/a n/a n/a n/a n/a n/a 25 7 0.02 54 0.02 7.6 0.02 1322 0.02 9.2 0.06 1.5 0.13 16 0.03 1.1 0.14 50 9 0.02 73 0.02 10.9 0.02 920 0.02 3.6 0.05 0.73 0.16 10 0.01 0.69 0.25 125 14 0.02 115 0.02 14.7 0.01 686 0.01 0.72 0.06 0.23 0.11 6.5 0.04 0.49 0.55 250 41 0.01 341 0.01 17.0 <0.01 596 <0.01 0.05 0.41 0.12 0.46 4.0 0.05 0.35 0.56 375 63 0.01 525 0.01 19.0 <0.01 532 <0.01 0.001 1.48 0.082 0.46 3.5 0.05 0.20 0.41 500 83 <0.01 688 <0.01 18.8 <0.01 540 <0.01 0.01 0.63 0.072 0.39 4.8 0.06 0.17 0.26

A-20
Table C-3 Observed Load, Engine Output, and Fuel-Based Fuel Use and Emission Rates for NC 1893 on ULSD.
Load Box Load (kW)
Observed Load (%)
Engine Output (hp)
Fuel-Based Emission Rates CO2
(g/gal) CO
(g/gal) HC
(g/gal) NOx
(g/gal) PM
(g/gal) Mean CV Mean CV Mean CV Mean CV Mean CV Mean CV Mean CV
0 0 n/a 0 <0.01 9935 <0.01 114 0.09 19 0.08 137 0.06 11.2 0.27 10 0 n/a 0 <0.01 9970 <0.01 93 0.04 16 0.16 141 0.06 12.6 0.22 15 0 1.73 3 1.72 9982 <0.01 85 0.04 14 0.03 140 0.05 14.5 0.16 25 7 0.02 54 0.02 10009 <0.01 69 0.03 11 0.11 123 0.05 11.4 0.15 50 9 0.02 73 0.02 10058 <0.01 40 0.04 8.0 0.16 111 0.04 10.7 0.27 125 14 0.02 115 0.02 10107 <0.01 11 0.05 3.5 0.10 95 0.04 10.3 0.54 250 41 0.01 341 0.01 10124 <0.01 0.9 0.41 2.1 0.46 67 0.05 8.3 0.56 375 63 0.01 525 0.01 10126 <0.01 0.02 1.48 1.6 0.46 67 0.06 5.3 0.41 500 83 <0.01 688 <0.01 10126 <0.01 0.1 0.64 1.4 0.39 90 0.06 4.5 0.26
Table C-4 Observed Load, Engine Output, and Engine Activities for NC 1893 on ULSD
Load Box Load (kW)
Observed Load (%)
Engine Activity Engine
Output (hp) Load Box
Output (kW) Engine
Speed (rpm) IAT (°C)
Boost Pressure (kPa)
MAP (kPa)
Mean CV Mean CV Mean CV Mean CV Mean CV Mean CV Mean CV 0 0 n/a 0 <0.01 12 <0.01 1800 <0.01 18 0.07 14 0.02 114 <0.01 10 0 n/a 0 <0.01 23 <0.01 1800 <0.01 17 0.06 18 0.02 118 <0.01 15 0 1.73 3 1.72 28 <0.01 1800 <0.01 18 0.07 20 0.01 120 <0.01 25 7 0.02 54 0.02 38 <0.01 1800 <0.01 18 0.06 21 <0.01 121 <0.01 50 9 0.02 73 0.02 66 <0.01 1800 <0.01 18 0.05 28 <0.01 128 <0.01 125 14 0.02 115 0.02 146 <0.01 1800 <0.01 18 0.05 55 <0.01 155 <0.01 250 41 0.01 341 0.01 280 <0.01 1800 <0.01 22 0.04 127 <0.01 227 <0.01 375 63 0.01 525 0.01 415 <0.01 1800 <0.01 27 0.03 196 <0.01 296 <0.01 500 83 <0.01 688 <0.01 554 <0.01 1800 <0.01 32 0.03 233 <0.01 333 <0.01
A-21
C2 NC 1893 on B20
Figure C-2 shows the comparison between the estimated engine output and the load box load. A linear relationship was observed with R2 of 0.995.
Table C-5 summarizes the observed load, engine output, and time-based fuel use and emission rates for each of the load setting for locomotive NC 1893 on B20. The mean value is the average over 3 replicates. The Coefficient of Variation (CV) is the ratio of standard deviation of the 3 replicates over the mean.
Tables C-6, C-7, and C-8 show the engine output-based emission rates, fuel-based emission rates, and engine activities, respectively, for NC 1893 on B20.
The observed loads were highly repeatable, with CVs of 0.04 or less, except for the 10 kW load box load, for which the CV was 0.87. For the 10 kW load box load, the observed load was 0 for the first replicate and approximately 5% for the other two replicates, resulting in an observed 3% load on average of the 3 replicates.
Engine output increased from 0 hp at idle to approximately 700 hp at an observed 84% load. The observed engine outputs at a given load setting were highly repeatable, with CVs of 0.04 or less, except for an observed 3% load, for which the CV was 0.87.
Fuel use rates ranged from 6.0 g/s to 7.2 g/s at idle to an observed 8% load. However, there was lack of precise control of the engine load at low loads. Fuel use rates subsequently increased to approximately 34 g/s at an observed 84% load. The observed fuel use rates at a given load setting were highly repeatable, with CVs of 0.04 or less.
CO2 emission rates were approximately 20 g/s at idle to an observed 8% load. However, there was lack of precise control of the engine load at low loads. CO2 emission rates subsequently increased to approximately 100 g/s at an observed 84% load. The observed CO2 emission rates at a given load setting were highly repeatable, with CVs of 0.04 or less.
CO emission rates decreased from 0.18 g/s at idle to approximately 0.01 g/s at an observed 84% load. The observed CO emission rates were highly repeatable for observed 3% and 6% load, with CVs of 0.09 and 0.04, respectively. Moderate to large variations were observed for the other observed load settings as the CVs range from 0.14 to 0.91, depending on load settings.
HC emission rates were 0.058 g/s at idle, decreased to approximately 0.021 g/s at an observed 17% load, and increased to approximately 0.033 g/s through an observed 84% load. The observed HC emission rates were highly repeatable at an observed 84% load, with CV of 0.08. Moderate variations were observed for the other observed load settings as the CVs range from 0.13 to 0.30, depending on load settings.
NOx emission rates decreased from 0.31 g/s at idle to 0.20 g/s at an observed 8% load and subsequently increased to 1.0 g/s at an observed 84% load. The observed NOx emission rates at a given load setting were highly repeatable, with CVs of 0.07 or less.
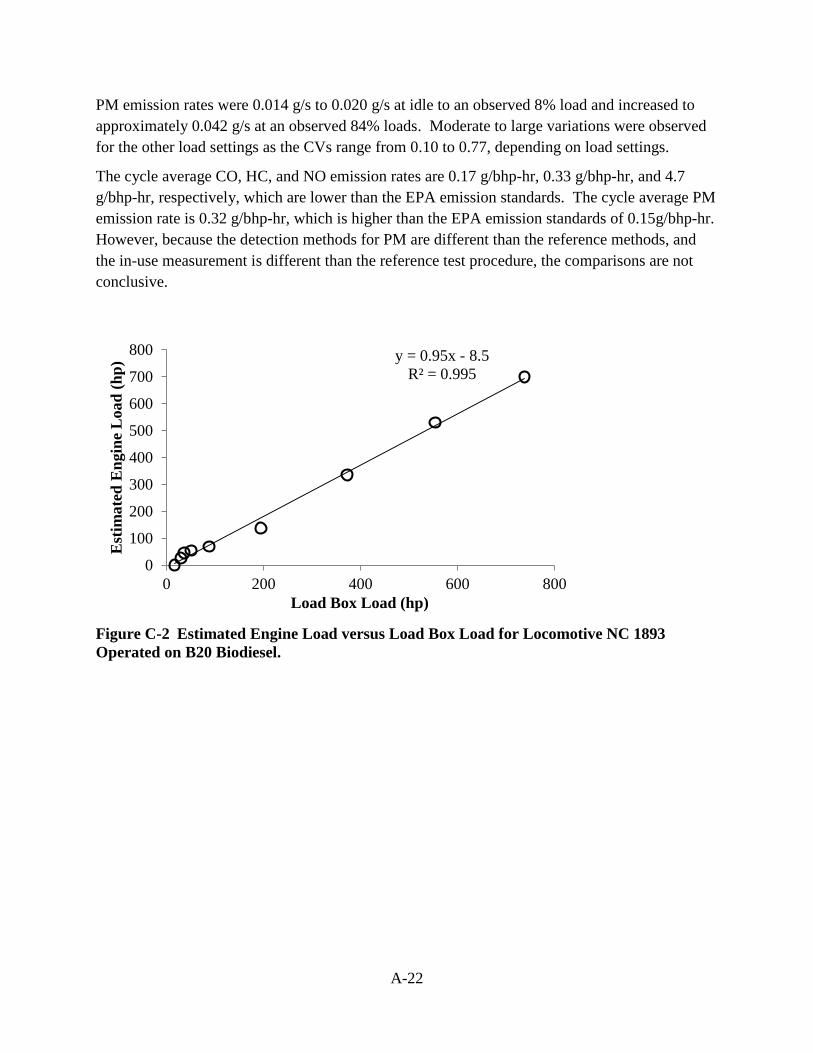
A-22
PM emission rates were 0.014 g/s to 0.020 g/s at idle to an observed 8% load and increased to approximately 0.042 g/s at an observed 84% loads. Moderate to large variations were observed for the other load settings as the CVs range from 0.10 to 0.77, depending on load settings.
The cycle average CO, HC, and NO emission rates are 0.17 g/bhp-hr, 0.33 g/bhp-hr, and 4.7 g/bhp-hr, respectively, which are lower than the EPA emission standards. The cycle average PM emission rate is 0.32 g/bhp-hr, which is higher than the EPA emission standards of 0.15g/bhp-hr. However, because the detection methods for PM are different than the reference methods, and the in-use measurement is different than the reference test procedure, the comparisons are not conclusive.
Figure C-2 Estimated Engine Load versus Load Box Load for Locomotive NC 1893 Operated on B20 Biodiesel.
y = 0.95x - 8.5 R² = 0.995
0
100
200
300
400
500
600
700
800
0 200 400 600 800
Est
imat
ed E
ngin
e L
oad
(hp)
Load Box Load (hp)

A-23
Table C-5 Observed Load, Engine Output, and Time-Based Fuel Use and Emission Rates for Locomotive NC 1893 on B20.
Load Box Load (kW)
Observed Load (%)
Engine Output (hp)
Time-Based Fuel Use and Emission Rates Fuel (g/s)
CO2 (g/s)
CO (g/s)
HC (g/s)
NOx (g/s)
PM (g/s)
Mean CV Mean CV Mean CV Mean CV Mean CV Mean CV Mean CV Mean CV 0 0 n/a 0 <0.01 7.2 <0.01 22 <0.01 0.18 0.18 0.058 0.30 0.31 0.04 0.019 0.10 10 3 0.87 27 0.87 6.9 0.04 21 0.04 0.14 0.09 0.048 0.18 0.28 0.07 0.020 0.26 15 6 0.04 47 0.04 6.6 0.01 20 0.01 0.11 0.04 0.042 0.13 0.25 0.02 0.017 0.16 25 7 0.04 56 0.04 6.4 0.01 19 0.01 0.086 0.17 0.033 0.22 0.23 0.03 0.016 0.12 50 8 0.04 70 0.04 6.0 0.01 18 0.01 0.051 0.14 0.025 0.20 0.20 0.02 0.014 0.11 125 17 0.02 138 0.02 8.9 0.02 27 0.02 0.016 0.49 0.021 0.16 0.28 0.05 0.021 0.72 250 40 0.01 337 0.01 17.7 0.02 54 0.02 0.009 0.74 0.035 0.22 0.40 0.01 0.033 0.77 375 64 <0.01 530 0.01 25.1 0.01 77 0.01 0.006 0.91 0.032 0.17 0.56 0.02 0.033 0.50 500 84 0.01 701 0.01 33.6 0.01 103 0.01 0.011 0.28 0.033 0.08 1.0 0.03 0.042 0.26
Table C-6 Observed Load, Engine Output, and Engine Output-Based Fuel Use and Emission Rates for NC 1893 on B20.
Load Box Load (kW)
Observed Load (%)
Engine Output (hp)
Engine Output-Based Fuel Use and Emission Rates Fuel
(bhp-hr/gal) CO2
(g/bhp-hr) CO
(g/bhp-hr) HC
(g/bhp-hr) NOx
(g/bhp-hr) PM
(g/bhp-hr) Mean CV Mean CV Mean CV Mean CV Mean CV Mean CV Mean CV Mean CV
0 0 n/a 0 <0.01 <0.01 <0.01 n/a n/a n/a n/a n/a n/a n/a n/a n/a n/a 10 3 0.87 27 0.87 3.6 0.87 n/a n/a n/a n/a n/a n/a n/a n/a n/a n/a 15 6 0.04 47 0.04 6.4 0.05 1500 0.05 8.8 0.01 3.3 0.17 19 0.06 1.3 0.12 25 7 0.04 56 0.04 7.8 0.05 1300 0.05 5.5 0.17 2.1 0.25 15 0.07 1.1 0.08 50 8 0.04 70 0.04 10.4 0.05 940 0.05 2.6 0.15 1.3 0.23 10 0.06 0.70 0.08 125 17 0.02 138 0.02 13.9 <0.01 710 <0.01 0.41 0.50 0.53 0.15 7.4 0.03 0.54 0.74 250 40 0.01 337 0.01 17.1 <0.01 580 <0.01 0.093 0.73 0.37 0.23 4.3 0.02 0.35 0.76 375 64 <0.01 530 <0.01 19.0 <0.01 520 <0.01 0.043 0.90 0.22 0.17 3.8 0.02 0.23 0.50 500 84 0.01 701 0.01 18.7 <0.01 530 <0.01 0.056 0.27 0.17 0.08 5.2 0.03 0.22 0.27

A-24
Table C-7 Observed Load, Engine Output, and Fuel-Based Fuel Use and Emission Rates for NC 1893 on B20.
Load Box Load (kW)
Observed Load (%)
Engine Output (hp)
Fuel-Based Emission Rates CO2
(g/gal) CO
(g/gal) HC
(g/gal) NOx
(g/gal) PM
(g/gal) Mean CV Mean CV Mean CV Mean CV Mean CV Mean CV Mean CV
0 0 n/a 0 <0.01 9724 <0.01 82 0.18 26 0.30 139 0.04 12 0.10 10 3 0.87 27 0.87 9749 <0.01 67 0.07 23 0.22 131 0.03 13 0.22 15 6 0.04 47 0.04 9767 <0.01 56 0.05 21 0.12 123 0.02 12 0.17 25 7 0.04 56 0.04 9790 <0.01 43 0.18 16 0.21 117 0.03 11 0.13 50 8 0.04 70 0.04 9818 <0.01 27 0.14 14 0.19 105 0.01 10 0.13 125 17 0.02 138 0.02 9858 <0.01 5.8 0.50 7.4 0.15 102 0.03 10 0.74 250 40 0.01 337 0.01 9866 <0.01 1.6 0.73 6.3 0.23 74 0.03 8.1 0.75 375 64 <0.01 530 <0.01 9869 <0.01 0.81 0.90 4.1 0.16 72 0.01 5.9 0.50 500 84 0.01 701 0.01 9870 <0.01 1.0 0.27 3.1 0.08 98 0.02 5.6 0.27
Table C-8 Observed Load, Engine Output, and Engine Activities for NC 1893 on B20
Load Box Load (kW)
Observed Load (%)
Engine Activity Engine
Output (hp) Load Box
Output (kW) Engine
Speed (rpm) IAT (°C)
Boost Pressure (kPa)
MAP (kPa)
Mean CV Mean CV Mean CV Mean CV Mean CV Mean CV Mean CV 0 0 n/a 0 <0.01 12 <0.01 1800 <0.01 28 0.11 14 <0.01 114 <0.01 10 3 0.87 27 0.87 22 <0.01 1800 <0.01 29 0.09 14 0.03 114 <0.01 15 6 0.04 47 0.04 27 <0.01 1800 <0.01 29 0.08 18 <0.01 118 <0.01 25 7 0.04 56 0.04 38 <0.01 1800 <0.01 29 0.07 21 <0.01 121 <0.01 50 8 0.04 70 0.04 65 0.01 1800 <0.01 29 0.06 28 <0.01 128 <0.01 125 17 0.02 138 0.02 145 <0.01 1800 <0.01 30 0.05 49 0.01 149 <0.01 250 40 0.01 337 0.01 278 <0.01 1800 <0.01 33 0.05 122 0.01 222 <0.01 375 64 <0.01 530 <0.01 413 <0.01 1800 <0.01 39 0.04 192 <0.01 292 <0.01 500 84 0.01 701 0.01 550 <0.01 1800 <0.01 43 0.03 230 <0.01 330 <0.01

A-25
Appendix D. Results for NC 1810 HEP Engine
D1 NC 1810 on ULSD
Table D-1 summarizes the observed load, engine output, and time-based fuel use and emission rates for each of the load setting for locomotive NC 1810 on ULSD. The mean value is the average over 3 replicates. The Coefficient of Variation (CV) is the ratio of standard deviation of the 3 replicates over the mean.
Tables D-2, D-3, and D-4 show the engine output-based emission rates, fuel-based emission rates, and engine activities, respectively, for NC 1810 on ULSD.
The observed loads were highly repeatable, with CV of 0.01 or less.
Engine output increased from 46 hp at idle to approximately 700 hp at observed 91% load. The observed engine outputs at a given load setting were highly repeatable, with CV of 0.01 or less.
Fuel use rate was low at idle, increased to the highest of 22 bhp-hr/gal at observed 12% load, and decreased and remained at approximately 18 bhp-hr/gal through observed 91% load. The observed fuel use rates at a given load setting were highly repeatable, with CV of 0.01 or less.
CO2 emission rates were approximately 1740 g/bhp-hr at idle, decreased and remained at approximately 500 g/bhp-hr from observed 8% to 91% load. The observed CO2 emission rates at a given load setting were highly repeatable, with CV of 0.01 or less.
CO emission rates decreased from 11 g/bhp-hr at idle to approximately 0.1 g/bhp-hr at observed 91% load. High variations were observed for 48% and observed 68% load, as the CVs for these load settings were 0.46 and 1.28, respectively. The CO emission rates at the other load settings were repeatable, with CVs less than 0.26.
HC emission rates decreased from 5.8 g/bhp-hr at idle to approximately 0.2 g/bhp-hr at observed 91% load. Moderate variations were observed for most load settings as the CVs range from 0.24 to 0.87, depending on load settings, except for observed 21% and 48% load, for which the CVs were 0.08 and 0.11, respectively.
NOx emission rates were 18 g/bhp-hr at idle, decreased and remained at approximately 4 to 8 g/bhp-hr for the rest load settings. The observed NOx emission rates at a given load setting were highly repeatable, with CV of 0.11 or less.
PM emission rates decreased from 2.0 g/bhp-hr at idle to approximately 0.3 g/bhp-hr at observed 91% load. Small to moderate variations were observed as the CVs range from 0.08 to 0.39, depending on load settings.
The cycle average CO, and HC emission rates based on in-use measurement are 0.14 g/bhp-hr and 0.34 g/bhp-hr, respectively, which are lower than the EPA emission standards. The cycle average NOx and PM emission rate based on in-use measurement are 5.7 g/bhp-hr and 0.32 g/bhp-hr, respectively, which are higher than the EPA emission standards of 4.8 g/bhp-hr and

A-26
0.15 g/bhp-hr. However, because the detection methods for NOx and PM are different than the reference methods, and the in-use measurement is different than the reference test procedure, the comparisons are not conclusive.

A-27
Table D-1 Observed Load, Engine Output, and Time-Based Fuel Use and Emission Rates for Locomotive NC 1810 on ULSD.
Load Box Load (kW)
Observed Load (%)
Engine Output (hp)
Time-Based Fuel Use and Emission Rates Fuel (g/s)
CO2 (g/s)
CO (g/s)
HC (g/s)
NOx (g/s)
PM (g/s)
Mean CV Mean CV Mean CV Mean CV Mean CV Mean CV Mean CV Mean CV 0 0 n/a 46 <0.01 7.1 <0.01 22 <0.01 0.14 0.09 0.074 0.50 0.34 0.11 0.026 0.27 10 8 <0.01 102 <0.01 6.2 <0.01 19 <0.01 0.12 0.04 0.059 0.39 0.28 0.06 0.021 0.24 15 8 <0.01 104 <0.01 6.1 <0.01 19 <0.01 0.10 0.08 0.053 0.32 0.26 0.05 0.023 0.07 25 10 <0.01 117 <0.01 5.8 <0.01 18 <0.01 0.08 0.08 0.023 0.63 0.24 0.05 0.022 0.10 50 12 <0.01 132 <0.01 5.4 <0.01 17 <0.01 0.04 0.13 0.024 0.24 0.21 0.04 0.019 0.14 125 21 <0.01 197 <0.01 10.1 <0.01 32 <0.01 0.02 0.25 0.026 0.08 0.41 0.04 0.020 0.12 250 48 <0.01 391 <0.01 20.3 <0.01 64 <0.01 0.00 0.46 0.037 0.11 0.49 0.04 0.036 0.39 375 68 <0.01 529 <0.01 24.6 <0.01 78 <0.01 0.00 1.28 0.043 0.36 0.84 0.06 0.034 0.17 500 91 0.01 698 0.01 33.7 0.02 107 0.02 0.02 0.26 0.084 0.87 1.29 0.08 0.063 0.32
Table D-2 Observed Load, Engine Output, and Engine Output-Based Fuel Use and Emission Rates for NC 1810 on ULSD.
Load Box Load (kW)
Observed Load (%)
Engine Output (hp)
Engine Output-Based Fuel Use and Emission Rates Fuel
(bhp-hr/gal) CO2
(g/bhp-hr) CO
(g/bhp-hr) HC
(g/bhp-hr) NOx
(g/bhp-hr) PM
(g/bhp-hr) Mean CV Mean CV Mean CV Mean CV Mean CV Mean CV Mean CV Mean CV
0 0 n/a 46 <0.01 5.7 <0.01 1740 <0.01 11 0.09 5.8 0.50 27 0.11 2.0 0.27 10 8 <0.01 102 <0.01 14.6 <0.01 685 <0.01 4.3 0.04 2.1 0.38 10 0.06 0.75 0.24 15 8 <0.01 104 <0.01 15.2 <0.01 659 <0.01 3.5 0.07 1.8 0.32 8.9 0.05 0.79 0.08 25 10 <0.01 117 <0.01 17.7 <0.01 567 <0.01 2.4 0.08 0.70 0.63 7.6 0.05 0.67 0.10 50 12 <0.01 132 <0.01 21.5 <0.01 467 0.01 1.2 0.13 0.65 0.24 5.7 0.03 0.52 0.14 125 21 <0.01 197 <0.01 17.3 <0.01 584 <0.01 0.41 0.25 0.47 0.08 7.5 0.04 0.37 0.12 250 48 <0.01 391 <0.01 17.1 <0.01 592 <0.01 0.04 0.46 0.34 0.11 4.5 0.04 0.33 0.39 375 68 <0.01 529 <0.01 19.0 <0.01 532 <0.01 0.02 1.28 0.29 0.36 5.7 0.05 0.23 0.16 500 91 0.01 698 0.01 18.3 <0.01 552 <0.01 0.12 0.26 0.18 0.87 6.7 0.06 0.32 0.33

A-28
Table D-3 Observed Load, Engine Output, and Fuel-Based Fuel Use and Emission Rates for NC 1810 on ULSD.
Load Box Load (kW)
Observed Load (%)
Engine Output (hp)
Fuel-Based Emission Rates CO2
(g/gal) CO
(g/gal) HC
(g/gal) NOx
(g/gal) PM
(g/gal) Mean CV Mean CV Mean CV Mean CV Mean CV Mean CV Mean CV
0 0 n/a 46 <0.01 9998 <0.01 63 0.09 33 0.50 153 0.11 16 0.27 10 8 <0.01 102 <0.01 10000 <0.01 62 0.04 31 0.39 142 0.06 16 0.24 15 8 <0.01 104 <0.01 10014 <0.01 54 0.07 28 0.32 136 0.05 17 0.07 25 10 <0.01 117 <0.01 10046 <0.01 43 0.08 12 0.63 134 0.05 17 0.10 50 12 <0.01 132 <0.01 10071 <0.01 25 0.12 14 0.24 123 0.04 16 0.13 125 21 <0.01 197 <0.01 10105 <0.01 7.0 0.25 8.2 0.08 130 0.04 9.0 0.12 250 48 <0.01 391 <0.01 10118 <0.01 0.7 0.46 5.9 0.11 77 0.04 7.9 0.40 375 68 <0.01 529 <0.01 10120 <0.01 0.4 1.28 5.6 0.36 109 0.05 6.2 0.16 500 91 0.01 698 0.01 10119 <0.01 2.1 0.27 3.4 0.87 122 0.06 8.4 0.34
Table D-4 Observed Load, Engine Output, and Engine Activities for NC 1810 on ULSD
Load Box Load (kW)
Observed Load (%)
Engine Activity Engine
Output (hp) Load Box
Output (kW) Engine
Speed (rpm) IAT (°C)
Boost Pressure (kPa)
MAP (kPa)
Mean CV Mean CV Mean CV Mean CV Mean CV Mean CV Mean CV 0 0 n/a 46 <0.01 n/a n/a 1800 <0.01 32 0.14 n/a n/a n/a n/a 10 8 <0.01 102 <0.01 n/a n/a 1800 <0.01 31 0.10 n/a n/a n/a n/a 15 8 <0.01 104 <0.01 n/a n/a 1800 <0.01 30 0.08 n/a n/a n/a n/a 25 10 <0.01 117 <0.01 n/a n/a 1800 <0.01 30 0.07 n/a n/a n/a n/a 50 12 <0.01 132 <0.01 n/a n/a 1800 <0.01 31 0.05 n/a n/a n/a n/a 125 21 <0.01 197 <0.01 n/a n/a 1800 <0.01 31 0.06 n/a n/a n/a n/a 250 48 <0.01 391 <0.01 n/a n/a 1800 <0.01 35 0.05 n/a n/a n/a n/a 375 68 <0.01 529 <0.01 n/a n/a 1800 <0.01 40 0.04 n/a n/a n/a n/a 500 91 0.01 698 0.01 n/a n/a 1794 0.01 44 0.06 n/a n/a n/a n/a

A-29
D2 NC 1810 on B20
Figure D-1 shows the comparison between the estimated engine output and the load box load. A linear relationship was observed with R2 of 0.996.
Table D-5 summarizes the observed load, engine output, and time-based fuel use and emission rates for each of the load setting for locomotive NC 1810 on B20. The mean value is the average over 3 replicates. The Coefficient of Variation (CV) is the ratio of standard deviation of the 3 replicates over the mean.
Tables D-6, D-7, and D-8 show the engine output-based emission rates, fuel-based emission rates, and engine activities, respectively, for NC 1810 on B20.
The observed loads were highly repeatable, with CVs of 0.02 or less, except for the target idle, for which the CV was 1.73. For the target idle, the observed load was 0 for the first and second replicates and approximately 5% for the third replicates, resulting in an observed 2% load on average of the 3 replicates.
Engine output increased from 59 hp at an observed 2% load to approximately 700 hp at an observed 92% load. The observed engine outputs at a given load setting were highly repeatable, with CVs of 0.01 or less, except for the observed 2% load, for which the CV was 0.37.
Fuel use rates ranged from 5.7 g/s to 7.0 g/s at an observed 2% load to an observed 11% load. However, there was lack of precise control of the engine load at low loads. Fuel use rates subsequently increased to approximately 35 g/s at an observed 92% load. The observed fuel use rates at a given load setting were highly repeatable, with CVs of 0.04 or less.
CO2 emission rates were approximately 20 g/s at an observed 2% load to an observed 11% load. However, there was lack of precise control of the engine load at low loads. CO2 emission rates subsequently increased to approximately 110 g/s at an observed 92% load. The observed CO2 emission rates at a given load setting were highly repeatable, with CVs of 0.04 or less.
CO emission rates decreased from 0.15 g/s at an observed 2% load to approximately 0.01 g/s at an observed 67% load and increased to approximately 0.03 g/s at an observed 92% load. The observed CO emission rates were highly repeatable at observed 2%, 7%, 8%, and 9% loads, with CVs of 0.07 or less. Moderate to large variations were observed for the other observed load settings as the CVs range from 0.15 to 0.88, depending on load settings.
HC emission rates were 0.051 g/s at an observed 2% load, decreased to approximately 0.016 g/s at an observed 11% load, and increased to approximately 0.068 g/s through an observed 92% load. Moderate to large variations were observed at any given observed load settings as the CVs range from 0.15 to 0.89, depending on load settings.
NOx emission rates decreased from 0.27 g/s at an observed 2% load to 0.18 g/s at an observed 11% load and subsequently increased to 1.1 g/s at an observed 92% load. The observed NOx emission rates at a given load setting were highly repeatable, with CV of 0.10 or less.

A-30
PM emission rates were 0.010 g/s to 0.015 g/s at an observed 2% load to an observed 21% load and increased to approximately 0.030 g/s at an observed 92% loads. Moderate to large variations were observed for the other load settings as the CVs range from 0.28 to 0.75, depending on load settings.
The cycle average CO, HC, and NOx emission rates are 0.15 g/bhp-hr, 0.21 g/bhp-hr, and 4.8 g/bhp-hr, respectively, which are lower than the EPA emission standards. The cycle average PM emission rate is 0.21 g/bhp-hr, which is slightly higher than the EPA emission standards of 0.15 g/bhp-hr. However, because the detection methods for PM are different than the reference methods, and the in-use measurement is different than the reference test procedure, the comparisons are not conclusive.
Figure D-1 Estimated Engine Load versus Load Box Load for Locomotive NC 1810 Operated on B20 Biodiesel.
y = 0.86x + 56 R² = 0.996
0
100
200
300
400
500
600
700
800
0 200 400 600 800
Est
imat
ed E
ngin
e L
oad
(hp)
Load Box Load (hp)

A-31
Table D-5 Observed Load, Engine Output, and Time-Based Fuel Use and Emission Rates for Locomotive NC 1810 on B20.
Load Box Load (kW)
Observed Load (%)
Engine Output (hp)
Time-Based Fuel Use and Emission Rates Fuel (g/s)
CO2 (g/s)
CO (g/s)
HC (g/s)
NOx (g/s)
PM (g/s)
Mean CV Mean CV Mean CV Mean CV Mean CV Mean CV Mean CV Mean CV 0 2 1.73 59 0.37 7.0 0.04 21 0.04 0.15 0.07 0.080 0.66 0.23 0.08 0.014 0.46 10 7 <0.01 96 <0.01 6.4 <0.01 19 <0.01 0.13 0.01 0.070 0.15 0.20 0.10 0.015 0.75 15 8 0.02 102 0.01 6.3 <0.01 19 <0.01 0.11 0.07 0.065 0.33 0.19 0.09 0.013 0.63 25 9 0.01 110 0.01 6.0 0.01 18 0.01 0.082 0.07 0.053 0.56 0.18 0.09 0.011 0.48 50 11 0.01 125 0.01 5.7 0.01 17 0.01 0.047 0.15 0.031 0.77 0.17 0.08 0.010 0.39 125 21 0.01 195 0.01 10.2 <0.01 31 <0.01 0.016 0.31 0.039 0.87 0.36 0.07 0.015 0.58 250 47 <0.01 383 <0.01 20.0 0.01 61 0.01 0.006 0.88 0.057 0.89 0.42 0.05 0.026 0.75 375 67 0.01 524 0.01 24.6 0.01 75 0.01 0.007 0.85 0.049 0.86 0.72 0.06 0.021 0.63 500 92 0.01 705 0.01 34.7 0.01 106 0.01 0.028 0.65 0.068 0.46 1.2 0.04 0.030 0.28
Table D-6 Observed Load, Engine Output, and Engine Output-Based Fuel Use and Emission Rates for NC 1810 on B20.
Load Box Load (kW)
Observed Load (%)
Engine Output (hp)
Engine Output-Based Fuel Use and Emission Rates Fuel
(bhp-hr/gal) CO2
(g/bhp-hr) CO
(g/bhp-hr) HC
(g/bhp-hr) NOx
(g/bhp-hr) PM
(g/bhp-hr) Mean CV Mean CV Mean CV Mean CV Mean CV Mean CV Mean CV Mean CV
0 2 1.73 59 0.37 7.6 0.41 1400 0.34 10 0.30 5.2 0.80 15 0.32 1.0 0.65 10 7 <0.01 96 <0.01 13.5 0.01 720 0.01 4.9 0.01 2.6 0.15 7.4 0.10 0.54 0.75 15 8 0.02 102 0.01 14.6 0.02 670 0.02 3.8 0.06 2.3 0.34 6.9 0.10 0.45 0.62 25 9 0.01 110 0.01 16.4 0.01 600 0.01 2.7 0.07 1.7 0.56 6.0 0.09 0.36 0.47 50 11 0.01 125 0.01 19.8 0.02 500 0.02 1.3 0.14 0.89 0.77 4.8 0.09 0.28 0.38 125 21 0.01 195 0.01 17.1 0.01 580 0.01 0.30 0.31 0.71 0.87 6.7 0.06 0.28 0.60 250 47 <0.01 383 <0.01 17.2 <0.01 570 <0.01 0.052 0.88 0.54 0.89 4.0 0.05 0.24 0.75 375 67 0.01 524 0.01 19.1 <0.01 520 <0.01 0.045 0.85 0.33 0.86 4.9 0.06 0.15 0.64 500 91 0.01 698 0.01 18.3 <0.01 540 <0.01 0.14 0.65 0.35 0.45 6.0 0.03 0.15 0.29

A-32
Table D-7 Observed Load, Engine Output, and Fuel-Based Fuel Use and Emission Rates for NC 1810 on B20.
Load Box Load (kW)
Observed Load (%)
Engine Output (hp)
Fuel-Based Emission Rates CO2
(g/gal) CO
(g/gal) HC
(g/gal) NOx
(g/gal) PM
(g/gal) Mean CV Mean CV Mean CV Mean CV Mean CV Mean CV Mean CV
0 2 1.73 59 0.37 9742 <0.01 71 0.09 37 0.66 105 0.08 8.9 0.43 10 7 <0.01 96 <0.01 9750 <0.01 66 0.01 36 0.15 100 0.10 10 0.75 15 8 0.02 102 0.01 9768 <0.01 56 0.07 33 0.32 100 0.08 9.2 0.64 25 9 0.01 110 0.01 9789 <0.01 44 0.08 28 0.55 98 0.08 8.1 0.48 50 11 0.01 125 0.01 9823 <0.01 27 0.16 18 0.76 95 0.07 7.7 0.40 125 21 0.01 195 0.01 9860 <0.01 5.1 0.31 12 0.87 115 0.07 6.6 0.59 250 47 <0.01 383 <0.01 9868 <0.01 0.89 0.88 9.3 0.89 68 0.05 5.7 0.75 375 67 0.01 524 0.01 9870 <0.01 0.87 0.85 6.3 0.86 94 0.05 3.9 0.64 500 92 0.01 705 0.01 9867 <0.01 2.6 0.65 6.3 0.45 109 0.03 3.8 0.29
Table D-8 Observed Load, Engine Output, and Engine Activities for NC 1810 on B20
Load Box Load (kW)
Observed Load (%)
Engine Activity Engine
Output (hp) Load Box
Output (kW) Engine
Speed (rpm) IAT (°C)
Boost Pressure (kPa)
MAP (kPa)
Mean CV Mean CV Mean CV Mean CV Mean CV Mean CV Mean CV 0 2 1.73 59 0.37 12 <0.01 1800 <0.01 26 0.10 14 <0.01 114 <0.01 10 7 <0.01 96 <0.01 22 <0.01 1800 <0.01 26 0.13 14 0.04 114 <0.01 15 8 0.02 102 0.01 27 <0.01 1800 <0.01 26 0.11 17 0.03 117 <0.01 25 9 0.01 110 0.01 38 <0.01 1800 <0.01 26 0.11 21 <0.01 121 <0.01 50 11 0.01 125 0.01 65 0.01 1800 <0.01 26 0.10 27 0.01 127 <0.01 125 21 0.01 195 0.01 145 <0.01 1800 <0.01 27 0.09 48 <0.01 148 <0.01 250 47 <0.01 383 <0.01 280 <0.01 1800 <0.01 31 0.07 125 <0.01 225 <0.01 375 67 0.01 524 0.01 416 <0.01 1800 <0.01 36 0.06 174 <0.01 274 <0.01 500 92 0.01 705 0.01 555 <0.01 1800 <0.01 41 0.07 219 <0.01 319 <0.01

A-33
Appendix E. Results for NC 1859 HEP Engine
E1 NC 1859 on ULSD
Figure E-1 shows the comparison between the estimated engine output and the load box load. A linear relationship was observed with R2 of 0.99.
Table E-1 summarizes the observed load, engine output, and time-based fuel use and emission rates for each of the load setting for locomotive NC 1859 on ULSD. The mean value is the average over 3 replicates. The Coefficient of Variation (CV) is the ratio of standard deviation of the 3 replicates over the mean.
Tables E-2, E-3, and E-4 show the engine output-based emission rates, fuel-based emission rates, and engine activities, respectively, for NC 1859 on ULSD.
The observed loads were highly repeatable, with CVs less than 0.01.
Engine output increased from 46 hp at low load to approximately 610 hp at an observed 79% load. The observed engine outputs at a given load setting were highly repeatable, with CVs less than 0.01.
Fuel use rates ranged from 5.5 g/s to 7.1 g/s at idle to an observed 12% load. However, there was lack of precise control of the engine load at low loads. Fuel use rates subsequently increased to approximately 30 g/s at an observed 79% load. The observed fuel use rates at a given load setting were highly repeatable, with CVs of 0.01 or less.
CO2 emission rates were approximately 20 g/s at idle to an observed 12% load. However, there was lack of precise control of the engine load at low loads. CO2 emission rates subsequently increased to approximately 90 g/s at an observed 79% load. The observed CO2 emission rates at a given load setting were highly repeatable, with CVs of 0.01 or less.
CO emission rates decreased from 0.21 g/s at idle to 0.01 g/s at an observed 61% load and increased to 0.02 g/s at an observed 79% load. The observed CO emission rates were highly repeatable from idle to an observed 12% load, with CVs of 0.04 or less. Moderate to large variations were observed for the other observed load settings as the CVs range from 0.19 to 1.19, depending on load settings.
HC emission rates were 0.081 g/s at an observed 0% load, decreased to approximately 0.024 g/s at an observed 16% load, and increased to approximately 0.077 g/s through an observed 79% load. Moderate to large variations were observed for a given observed load setting as the CVs range from 0.19 to 1.14, depending on load settings.
NOx emission rates were 0.35 g/s at an observed 0% load, decreased to 0.22 g/s at an observed 12% load, and subsequently increased to 1.0 g/s at an observed 79% load. The observed NOx emission rates at a given load setting were highly repeatable, with CV of 0.03 or less.

A-34
PM emission rates were 0.011 g/s to 0.013 g/s at idle to an observed 16% load and increased to approximately 0.032 g/s at an observed 79% loads. The observed PM emission rates at a given load setting were highly repeatable, with CV of 0.08 or less.
The cycle average CO, HC, and NOx are 0.22 g/bhp-hr, 0.45 g/bhp-hr, and 4.8 g/bhp-hr, respectively, which are lower than the EPA emission standards. The cycle average PM emission rate based on in-use measurement is 0.19 g/bhp-hr, which is slightly higher than the EPA emission standards of 0.15 g/bhp-hr. However, because the detection methods for PM are different than the reference methods, and the in-use measurement is different than the reference test procedure, the comparisons are not conclusive.
Figure E-1 Estimated Engine Load versus Load Box Load for Locomotive NC 1859 Operated on Ultra Low Sulfur Diesel.
y = 0.89x + 36 R² = 0.99
0
100
200
300
400
500
600
700
0 100 200 300 400 500 600 700
Est
imat
ed E
ngin
e L
oad
(hp)
Load Box Load (hp)

A-35
Table E-1 Observed Load, Engine Output, and Time-Based Fuel Use and Emission Rates for Locomotive NC 1859 on ULSD.
Load Box Load (kW)
Observed Load (%)
Engine Output (hp)
Time-Based Fuel Use and Emission Rates Fuel (g/s)
CO2 (g/s)
CO (g/s)
HC (g/s)
NOx (g/s)
PM (g/s)
Mean CV Mean CV Mean CV Mean CV Mean CV Mean CV Mean CV Mean CV 0 0 n/a 46 <0.01 7.1 <0.01 22 <0.01 0.21 0.02 0.081 0.53 0.33 0.03 0.011 0.04 10 0 n/a 46 <0.01 7.1 <0.01 22 <0.01 0.18 0.05 0.070 0.42 0.35 0.02 0.012 0.01 15 0 n/a 46 <0.01 7.0 <0.01 22 <0.01 0.17 0.02 0.077 0.25 0.36 0.02 0.013 0.02 25 9 <0.01 113 <0.01 5.9 <0.01 18 <0.01 0.12 0.04 0.066 0.19 0.26 0.02 0.011 0.02 50 12 <0.01 129 <0.01 5.5 <0.01 17 <0.01 0.072 0.01 0.033 0.85 0.22 0.01 0.011 0.04 125 16 <0.01 157 <0.01 7.4 0.01 24 0.01 0.026 0.19 0.024 1.14 0.27 0.02 0.011 0.04 250 42 <0.01 344 <0.01 16.5 0.01 53 <0.01 0.007 0.31 0.039 1.04 0.41 0.01 0.019 0.06 375 61 <0.01 480 <0.01 21.7 <0.01 69 <0.01 0.005 1.19 0.045 0.65 0.58 0.01 0.020 0.05 500 79 <0.01 612 <0.01 29.7 <0.01 94 <0.01 0.022 0.99 0.065 0.45 1.0 0.01 0.032 0.08
Table E-2 Observed Load, Engine Output, and Engine Output-Based Fuel Use and Emission Rates for NC 1859 on ULSD.
Load Box Load (kW)
Observed Load (%)
Engine Output (hp)
Engine Output-Based Fuel Use and Emission Rates Fuel
(bhp-hr/gal) CO2
(g/bhp-hr) CO
(g/bhp-hr) HC
(g/bhp-hr) NOx
(g/bhp-hr) PM
(g/bhp-hr) Mean CV Mean CV Mean CV Mean CV Mean CV Mean CV Mean CV Mean CV
0 0 n/a 46 <0.01 5.7 <0.01 1700 <0.01 17 0.02 6.4 0.53 26 0.03 0.89 0.04 10 0 n/a 46 <0.01 5.8 <0.01 1700 <0.01 14 0.05 5.5 0.42 28 0.02 0.96 0.01 15 0 n/a 46 <0.01 5.8 <0.01 1700 <0.01 13 0.02 6.0 0.25 28 0.02 1.0 0.02 25 9 <0.01 113 <0.01 16.9 <0.01 590 <0.01 3.9 0.04 2.1 0.19 8.3 0.02 0.37 0.02 50 12 <0.01 129 <0.01 20.7 <0.01 490 0.01 2.0 0.01 0.91 0.84 6.2 0.01 0.30 0.04 125 16 <0.01 157 <0.01 18.7 0.01 540 0.01 0.60 0.19 0.54 1.14 6.2 0.02 0.25 0.04 250 42 <0.01 344 <0.01 18.4 <0.01 550 <0.01 0.074 0.31 0.43 1.04 4.3 0.01 0.20 0.06 375 61 <0.01 480 <0.01 19.6 <0.01 520 <0.01 0.037 1.19 0.39 0.65 4.3 0.01 0.15 0.05 500 79 <0.01 612 <0.01 18.2 <0.01 560 <0.01 0.13 0.99 0.45 0.45 5.9 0.01 0.19 0.08

A-36
Table E-3 Observed Load, Engine Output, and Fuel-Based Fuel Use and Emission Rates for NC 1859 on ULSD.
Load Box Load (kW)
Observed Load (%)
Engine Output (hp)
Fuel-Based Emission Rates CO2
(g/gal) CO
(g/gal) HC
(g/gal) NOx
(g/gal) PM
(g/gal) Mean CV Mean CV Mean CV Mean CV Mean CV Mean CV Mean CV
0 0 n/a 46 <0.01 9946 <0.01 97 0.02 37 0.53 150 0.03 7.2 0.04 10 0 n/a 46 <0.01 9973 <0.01 81 0.05 31 0.42 159 0.02 7.8 0.01 15 0 n/a 46 <0.01 9978 <0.01 75 0.02 35 0.25 162 0.02 8.2 0.02 25 9 <0.01 113 <0.01 9992 <0.01 66 0.04 36 0.19 140 0.02 8.8 0.02 50 12 <0.01 129 <0.01 10043 <0.01 42 0.01 19 0.85 128 0.02 8.7 0.04 125 16 <0.01 157 <0.01 10098 <0.01 11.2 0.20 10 1.14 116 0.02 6.7 0.04 250 42 <0.01 344 <0.01 10116 <0.01 1.36 0.31 7.9 1.04 80 0.01 5.3 0.06 375 61 <0.01 480 <0.01 10118 <0.01 0.72 1.19 7.6 0.65 85 0.01 4.2 0.05 500 79 <0.01 612 <0.01 10115 <0.01 2.4 0.99 8.2 0.45 108 0.01 4.8 0.08
Table E-4 Observed Load, Engine Output, and Engine Activities for NC 1859 on ULSD
Load Box Load (kW)
Observed Load (%)
Engine Activity Engine
Output (hp) Load Box
Output (kW) Engine
Speed (rpm) IAT (°C)
Boost Pressure (kPa)
MAP (kPa)
Mean CV Mean CV Mean CV Mean CV Mean CV Mean CV Mean CV 0 0 n/a 46 <0.01 12 <0.01 1800 <0.01 28 0.07 14 <0.01 114 <0.01 10 0 n/a 46 <0.01 21 <0.01 1800 <0.01 28 0.06 14 <0.01 114 <0.01 15 0 n/a 46 <0.01 25 <0.01 1800 <0.01 28 0.06 15 0.04 115 0.01 25 9 <0.01 113 <0.01 34 0.02 1800 <0.01 28 0.05 20 0.02 120 <0.01 50 12 <0.01 129 <0.01 58 0.01 1800 <0.01 28 0.05 25 0.01 125 <0.01 125 16 <0.01 157 <0.01 129 <0.01 1800 <0.01 28 0.06 47 0.02 147 <0.01 250 42 <0.01 344 <0.01 247 <0.01 1800 <0.01 31 0.05 110 <0.01 210 <0.01 375 61 <0.01 480 <0.01 366 <0.01 1800 <0.01 35 0.04 169 <0.01 269 <0.01 500 79 <0.01 612 <0.01 488 <0.01 1800 <0.01 39 0.04 212 <0.01 312 <0.01

A-37
E2 NC 1859 on B20
Figure E-2 shows the comparison between the estimated engine output and the load box load. A linear relationship was observed with R2 of 0.99.
Table E-5 summarizes the observed load, engine output, and time-based fuel use and emission rates for each of the load setting for locomotive NC 1859 on B20. The mean value is the average over 3 replicates. The Coefficient of Variation (CV) is the ratio of standard deviation of the 3 replicates over the mean.
Tables E-6, E-7, and E-8 show the engine output-based emission rates, fuel-based emission rates, and engine activities, respectively, for NC 1859 on B20.
The observed loads were highly repeatable, with CV of 0.02 or less, except for the 10 kW load box load and 15 kW load box load, for which the CV was 1.73 and 0.81, respectively. For the 10 kW load box load, the observed load was 0 for the first and second replicates and approximately 7% for the third replicate, resulting in an observed 2% load on average of the 3 replicates. For the 15 kW load box load, the observed load was 0.4% for the first replicate and approximately 7.5% for the other two replicates, resulting in an observed 5% load on average of the 3 replicates.
Engine output increased from 46 hp at idle to approximately 620 hp at an observed 81% load. The observed engine outputs at a given load setting were highly repeatable, with CVs of 0.01 or less, except for observed 2% and 5% load, for which the CVs were 0.46 and 0.36, respectively.
Fuel use rates ranged from 5.7 g/s to 7.2 g/s at idle to an observed 11% load. However, there was lack of precise control of the engine load at low loads. Fuel use rates subsequently increased to approximately 31 g/s at an observed 81% load. The observed fuel use rates at a given load setting were highly repeatable, with CVs of 0.07 or less.
CO2 emission rates were approximately 20 g/s at idle to an observed 11% load. However, there was lack of precise control of the engine load at low loads. CO2 emission rates subsequently increased to approximately 90 g/s at an observed 81% load. The observed CO2 emission rates at a given load setting were highly repeatable, with CVs of 0.07 or less.
CO emission rates decreased from 0.18 g/s at idle to approximately 0.01 g/s at an observed 61% load and increased to 0.03 g/s at an observed 81% load. The observed CO emission rates were highly repeatable at idle and an observed 11% load, with CVs of 0.04 and 0.07, respectively. Moderate to large variations were observed for the other observed load settings as the CVs range from 0.12 to 0.91, depending on load settings.
HC emission rates were 0.084 g/s at idle, decreased to approximately 0.024 g/s at an observed 15% load, and increased to approximately 0.065 g/s through an observed 81% load. Moderate to large variations were observed for a given observed load setting as the CVs range from 0.23 to 0.61, depending on load settings.

A-38
NOx emission rates decreased from approximately 0.35 g/s at idle to 0.22 g/s at an observed 11% load and subsequently increased to 1.0 g/s at an observed 81% load. The observed NO emission rates at a given load setting were highly repeatable, with CV of 0.03 or less, except for observed 2% and 5% loads, for which the CVs were 0.13 and 0.15, respectively.
PM emission rates decreased from 0.013 g/s at idle to 0.009 g/s at an observed 15% and increased to approximately 0.022 g/s at an observed 81% loads. The observed PM emission rates at idle and an observed 81% load were highly repeatable, with CVs of 0.04 and 0.05, respectively. Moderate variations were observed for the other load settings as the CVs range from 0.14 to 0.29, depending on load settings.
The cycle average CO, HC, NO, and PM emission rates are 0.16 g/bhp-hr, 0.41 g/bhp-hr, 4.8 g/bhp-hr, and 0.15 g/bhp-hr, respectively, which are lower than the EPA emission standards. However, because the detection methods are different than the reference methods, and the in-use measurement is different than the reference test procedure, the comparisons are not conclusive.
Figure E-2 Estimated Engine Load versus Load Box Load for Locomotive NC 1859 Operated on B20 Biodiesel.
y = 0.89x + 43 R² = 0.99
0
100
200
300
400
500
600
700
0 100 200 300 400 500 600 700
Est
imat
ed E
ngin
e L
oad
(hp)
Load Box Load (hp)

A-39
Table E-5 Observed Load, Engine Output, and Time-Based Fuel Use and Emission Rates for Locomotive NC 1859 on B20.
Load Box Load (kW)
Observed Load (%)
Engine Output (hp)
Time-Based Fuel Use and Emission Rates Fuel (g/s)
CO2 (g/s)
CO (g/s)
HC (g/s)
NOx (g/s)
PM (g/s)
Mean CV Mean CV Mean CV Mean CV Mean CV Mean CV Mean CV Mean CV 0 0 n/a 46 <0.01 7.2 <0.01 22 <0.01 0.18 0.04 0.14 0.23 0.28 0.01 0.013 0.04 10 2 1.73 63 0.46 6.9 0.06 21 0.06 0.15 0.14 0.13 0.38 0.29 0.13 0.011 0.29 15 5 0.81 82 0.36 6.6 0.07 20 0.07 0.13 0.14 0.11 0.41 0.26 0.15 0.011 0.28 25 9 0.02 108 0.01 6.1 0.01 18 0.01 0.10 0.12 0.086 0.40 0.22 0.02 0.010 0.20 50 11 0.01 123 <0.01 5.7 <0.01 17 <0.01 0.062 0.07 0.061 0.32 0.20 0.03 0.009 0.14 125 15 0.01 151 <0.01 6.9 0.01 21 0.01 0.016 0.57 0.057 0.61 0.26 0.01 0.009 0.16 250 42 0.01 348 0.01 17.2 0.02 52 0.02 0.003 0.91 0.098 0.36 0.43 0.01 0.016 0.17 375 61 0.01 484 0.01 22.1 <0.01 67 <0.01 0.004 0.96 0.12 0.41 0.61 0.01 0.015 0.14 500 81 0.01 624 0.01 30.6 0.01 93 <0.01 0.028 0.36 0.18 0.44 1.0 0.01 0.022 0.05
Table E-6 Observed Load, Engine Output, and Engine Output-Based Fuel Use and Emission Rates for NC 1859 on B20.
Load Box Load (kW)
Observed Load (%)
Engine Output (hp)
Engine Output-Based Fuel Use and Emission Rates Fuel
(bhp-hr/gal) CO2
(g/bhp-hr) CO
(g/bhp-hr) HC
(g/bhp-hr) NOx
(g/bhp-hr) PM
(g/bhp-hr) Mean CV Mean CV Mean CV Mean CV Mean CV Mean CV Mean CV Mean CV
0 0 n/a 46 <0.01 5.7 <0.01 1700 <0.01 14 0.04 11 0.23 22 0.01 1.0 0.04 10 2 1.73 63 0.46 8.3 0.53 1400 0.41 9.7 0.45 7.7 0.14 19 0.45 0.74 0.55 15 5 0.81 82 0.36 11.5 0.40 990 0.52 6.3 0.57 4.9 0.31 13 0.61 0.57 0.74 25 9 0.02 108 0.01 15.9 0.02 610 0.02 3.3 0.12 2.9 0.41 7.4 0.02 0.32 0.19 50 11 0.01 123 <0.01 19.3 0.01 510 0.01 1.8 0.07 1.8 0.32 5.7 0.03 0.27 0.14 125 15 0.01 151 <0.01 19.5 0.01 510 0.01 0.37 0.58 1.4 0.61 6.1 0.01 0.21 0.16 250 42 0.01 348 0.01 18.2 0.01 540 0.01 0.029 0.92 1.0 0.35 4.5 0.03 0.16 0.18 375 61 0.01 484 0.01 19.7 <0.01 500 <0.01 0.028 0.96 0.90 0.40 4.5 0.01 0.11 0.14 500 81 0.01 624 0.01 18.3 <0.01 540 <0.01 0.16 0.36 1.0 0.43 6.0 0.02 0.13 0.06

A-40
Table E-7 Observed Load, Engine Output, and Fuel-Based Fuel Use and Emission Rates for NC 1859 on B20.
Load Box Load (kW)
Observed Load (%)
Engine Output (hp)
Fuel-Based Emission Rates CO2
(g/gal) CO
(g/gal) HC
(g/gal) NOx
(g/gal) PM
(g/gal) Mean CV Mean CV Mean CV Mean CV Mean CV Mean CV Mean CV
0 0 n/a 46 <0.01 9712 <0.01 79 0.04 63 0.23 128 0.01 7.9 0.04 10 2 1.73 63 0.46 9731 <0.01 68 0.08 62 0.45 134 0.08 7.0 0.25 15 5 0.81 82 0.36 9745 <0.01 61 0.10 54 0.45 128 0.09 7.2 0.21 25 9 0.02 108 0.01 9765 <0.01 53 0.12 46 0.41 118 0.02 7.1 0.21 50 11 0.01 123 <0.01 9799 <0.01 35 0.07 34 0.32 111 0.03 7.1 0.14 125 15 0.01 151 <0.01 9848 <0.01 7.3 0.58 26 0.60 119 0.01 5.6 0.16 250 42 0.01 348 0.01 9863 <0.01 0.54 0.92 18 0.35 82 0.04 4.0 0.19 375 61 0.01 484 0.01 9864 <0.01 0.54 0.96 18 0.40 89 0.01 3.0 0.14 500 81 0.01 624 0.01 9859 <0.01 2.9 0.36 19 0.43 110 0.02 3.2 0.06
Table E-8 Observed Load, Engine Output, and Engine Activities for NC 1859 on B20
Load Box Load (kW)
Observed Load (%)
Engine Activity Engine
Output (hp) Load Box
Output (kW) Engine
Speed (rpm) IAT (°C)
Boost Pressure (kPa)
MAP (kPa)
Mean CV Mean CV Mean CV Mean CV Mean CV Mean CV Mean CV 0 0 n/a 46 <0.01 11 0.05 1800 <0.01 32 0.02 14 0.07 114 0.01 10 2 1.73 63 0.46 20 <0.01 1800 <0.01 33 0.04 16 0.21 116 0.03 15 5 0.81 82 0.36 25 <0.01 1800 <0.01 33 0.03 16 0.24 116 0.03 25 9 0.02 108 0.01 34 <0.01 1800 <0.01 32 0.02 19 0.07 119 0.01 50 11 0.01 123 <0.01 58 <0.01 1800 <0.01 32 0.03 24 0.12 124 0.02 125 15 0.01 151 <0.01 128 <0.01 1800 <0.01 32 0.03 46 0.04 146 0.01 250 42 0.01 348 0.01 247 <0.01 1800 <0.01 35 0.02 111 0.03 211 0.01 375 61 0.01 484 0.01 366 <0.01 1800 <0.01 40 0.03 170 0.01 270 0.01 500 81 0.01 624 0.01 487 <0.01 1800 <0.01 44 0.02 213 0.01 313 0.01
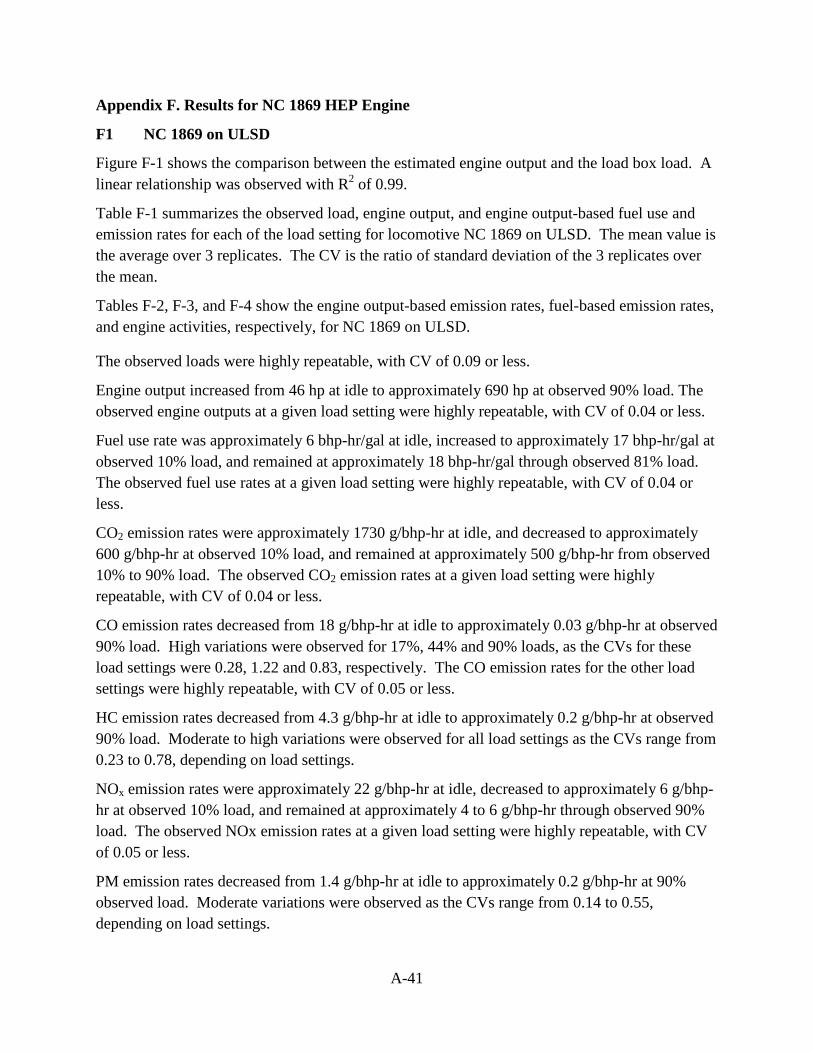
A-41
Appendix F. Results for NC 1869 HEP Engine
F1 NC 1869 on ULSD
Figure F-1 shows the comparison between the estimated engine output and the load box load. A linear relationship was observed with R2 of 0.99.
Table F-1 summarizes the observed load, engine output, and engine output-based fuel use and emission rates for each of the load setting for locomotive NC 1869 on ULSD. The mean value is the average over 3 replicates. The CV is the ratio of standard deviation of the 3 replicates over the mean.
Tables F-2, F-3, and F-4 show the engine output-based emission rates, fuel-based emission rates, and engine activities, respectively, for NC 1869 on ULSD.
The observed loads were highly repeatable, with CV of 0.09 or less.
Engine output increased from 46 hp at idle to approximately 690 hp at observed 90% load. The observed engine outputs at a given load setting were highly repeatable, with CV of 0.04 or less.
Fuel use rate was approximately 6 bhp-hr/gal at idle, increased to approximately 17 bhp-hr/gal at observed 10% load, and remained at approximately 18 bhp-hr/gal through observed 81% load. The observed fuel use rates at a given load setting were highly repeatable, with CV of 0.04 or less.
CO2 emission rates were approximately 1730 g/bhp-hr at idle, and decreased to approximately 600 g/bhp-hr at observed 10% load, and remained at approximately 500 g/bhp-hr from observed 10% to 90% load. The observed CO2 emission rates at a given load setting were highly repeatable, with CV of 0.04 or less.
CO emission rates decreased from 18 g/bhp-hr at idle to approximately 0.03 g/bhp-hr at observed 90% load. High variations were observed for 17%, 44% and 90% loads, as the CVs for these load settings were 0.28, 1.22 and 0.83, respectively. The CO emission rates for the other load settings were highly repeatable, with CV of 0.05 or less.
HC emission rates decreased from 4.3 g/bhp-hr at idle to approximately 0.2 g/bhp-hr at observed 90% load. Moderate to high variations were observed for all load settings as the CVs range from 0.23 to 0.78, depending on load settings.
NOx emission rates were approximately 22 g/bhp-hr at idle, decreased to approximately 6 g/bhp-hr at observed 10% load, and remained at approximately 4 to 6 g/bhp-hr through observed 90% load. The observed NOx emission rates at a given load setting were highly repeatable, with CV of 0.05 or less.
PM emission rates decreased from 1.4 g/bhp-hr at idle to approximately 0.2 g/bhp-hr at 90% observed load. Moderate variations were observed as the CVs range from 0.14 to 0.55, depending on load settings.

A-42
The cycle average CO, HC, and NOx emission rates are 0.15 g/bhp-hr, 0.31 g/bhp-hr, and 4.6 g/bhp-hr, respectively, which are lower than the EPA emission standards. The cycle average PM emission rates based on in-use measurement is 0.21 g/bhp-hr, respectively, which is slightly higher than the EPA emission standards of 0.15 g/bhp-hr. However, because the detection methods for PM are different than the reference methods, and the in-use measurement is different than the reference test procedure, the comparisons are not conclusive.
Figure F-1 Estimated Engine Load versus Load Box Load for Locomotive NC 1869 Operated on Ultra Low Sulfur Diesel.
y = 0.86x + 40 R² = 0.99
0
100
200
300
400
500
600
700
800
0 100 200 300 400 500 600 700 800
Est
imat
ed E
ngin
e L
oad
(hp)
Load Box Load (hp)

A-43
Table F-1 Observed Load, Engine Output, and Time-Based Fuel Use and Emission Rates for Locomotive NC 1869 on ULSD.
Load Box Load (kW)
Observed Load (%)
Engine Output (hp)
Time-Based Fuel Use and Emission Rates Fuel (g/s)
CO2 (g/s)
CO (g/s)
HC (g/s)
NOx (g/s)
PM (g/s)
Mean CV Mean CV Mean CV Mean CV Mean CV Mean CV Mean CV Mean CV 0 0 n/a 46 <0.01 7.1 <0.01 22 <0.01 0.23 0.04 0.055 0.45 0.29 0.05 0.017 0.35 10 5 0.09 79 0.04 6.7 <0.01 21 <0.01 0.18 0.02 0.050 0.58 0.26 0.02 0.014 0.51 15 6 0.04 88 0.02 6.5 <0.01 21 <0.01 0.16 0.02 0.044 0.59 0.25 0.01 0.014 0.49 25 7 0.02 97 0.01 6.3 <0.01 20 <0.01 0.13 0.04 0.030 0.78 0.23 0.01 0.013 0.43 50 10 0.01 114 0.01 5.9 <0.01 19 <0.01 0.07 0.05 0.023 0.48 0.20 0.02 0.013 0.23 125 17 <0.01 168 <0.01 8.5 <0.01 27 <0.01 0.02 0.28 0.018 0.33 0.27 0.01 0.015 0.17 250 44 <0.01 359 <0.01 17.8 0.01 56 0.01 0.00 1.22 0.032 0.36 0.37 0.01 0.024 0.14 375 66 <0.01 516 <0.01 23.7 0.01 75 0.01 0.00 n/a 0.040 0.23 0.64 0.02 0.021 0.25 500 90 0.01 692 0.01 33.4 0.01 106 0.01 0.01 0.83 0.036 0.23 1.1 0.01 0.032 0.24
Table F-2 Observed Load, Engine Output, and Engine Output-Based Fuel Use and Emission Rates for NC 1869 on ULSD.
Load Box Load (kW)
Observed Load (%)
Engine Output (hp)
Engine Output-Based Fuel Use and Emission Rates Fuel
(bhp-hr/gal) CO2
(g/bhp-hr) CO
(g/bhp-hr) HC
(g/bhp-hr) NOx
(g/bhp-hr) PM
(g/bhp-hr) Mean CV Mean CV Mean CV Mean CV Mean CV Mean CV Mean CV Mean CV
0 0 n/a 46 <0.01 5.7 0.000 1730 0.001 18 0.04 4.3 0.45 22 0.05 1.4 0.35 10 5 0.09 79 0.04 10.4 0.041 961 0.042 8.3 0.04 2.3 0.57 12 0.02 0.67 0.55 15 6 0.04 88 0.02 11.8 0.024 844 0.025 6.4 0.03 1.8 0.58 10 0.01 0.56 0.51 25 7 0.02 97 0.01 13.7 0.014 730 0.015 4.7 0.05 1.1 0.78 8.6 0.01 0.50 0.44 50 10 0.01 114 0.01 17.2 0.009 585 0.010 2.2 0.05 0.72 0.48 6.2 0.01 0.40 0.24 125 17 <0.01 168 <0.01 17.5 0.002 576 0.002 0.44 0.28 0.38 0.33 5.8 0.01 0.33 0.17 250 44 <0.01 359 <0.01 17.9 0.003 567 0.003 0.02 1.22 0.32 0.35 3.8 0.00 0.24 0.14 375 66 <0.01 516 <0.01 19.3 0.004 525 0.004 0.00 n/a 0.28 0.23 4.5 0.02 0.15 0.25 500 90 0.01 692 0.01 18.3 0.000 552 0.000 0.03 0.83 0.19 0.23 5.5 0.00 0.17 0.24

A-44
Table F-3 Observed Load, Engine Output, and Fuel-Based Fuel Use and Emission Rates for NC 1869 on ULSD.
Load Box Load (kW)
Observed Load (%)
Engine Output (hp)
Fuel-Based Emission Rates CO2
(g/gal) CO
(g/gal) HC
(g/gal) NOx
(g/gal) PM
(g/gal) Mean CV Mean CV Mean CV Mean CV Mean CV Mean CV Mean CV
0 0 n/a 46 <0.01 9950 <0.01 102 0.04 25 0.45 129 0.05 11.0 0.35 10 5 0.09 79 0.04 9976 <0.01 86 0.02 24 0.59 125 0.02 9.7 0.51 15 6 0.04 88 0.02 9992 <0.01 76 0.02 21 0.59 123 0.01 9.3 0.48 25 7 0.02 97 0.01 10015 <0.01 64 0.04 15 0.78 117 0.01 9.7 0.43 50 10 0.01 114 0.01 10058 <0.01 37 0.05 12 0.48 107 0.02 9.7 0.23 125 17 <0.01 168 <0.01 10109 <0.01 7.7 0.28 6.7 0.33 101 0.01 8.1 0.17 250 44 <0.01 359 <0.01 10122 <0.01 0.3 1.22 5.8 0.35 67 <0.01 6.0 0.14 375 66 <0.01 516 <0.01 10123 <0.01 0 n/a 5.4 0.23 86 0.01 4.1 0.25 500 90 0.01 692 0.01 10123 <0.01 0.6 0.82 3.5 0.23 102 <0.01 4.3 0.24
Table F-4 Observed Load, Engine Output, and Engine Activities for NC 1869 on ULSD
Load Box Load (kW)
Observed Load (%)
Engine Activity Engine
Output (hp) Load Box
Output (kW) Engine
Speed (rpm) IAT (°C)
Boost Pressure (kPa)
MAP (kPa)
Mean CV Mean CV Mean CV Mean CV Mean CV Mean CV Mean CV 0 0 n/a 46 <0.01 12 <0.01 1800 <0.01 26 0.03 14 <0.01 114 <0.01 10 5 0.09 79 0.04 22 <0.01 1800 <0.01 26 0.01 14 <0.01 114 <0.01 15 6 0.04 88 0.02 27 <0.01 1800 <0.01 26 0.01 16 0.04 116 0.01 25 7 0.02 97 0.01 37 <0.01 1800 <0.01 26 0.02 21 <0.01 121 <0.01 50 10 0.01 114 0.01 65 0.02 1800 <0.01 26 0.02 27 0.01 127 <0.01 125 17 <0.01 168 <0.01 145 <0.01 1800 <0.01 26 0.02 48 <0.01 148 <0.01 250 44 <0.01 359 <0.01 280 <0.01 1800 <0.01 29 0.02 126 0.02 226 0.01 375 66 <0.01 516 <0.01 415 <0.01 1800 <0.01 33 0.02 180 <0.01 280 <0.01 500 90 0.01 692 0.01 555 <0.01 1800 <0.01 38 0.01 227 <0.01 327 <0.01

A-45
F2 NC 1869 on B20
Figure F-2 shows the comparison between the estimated engine output and the load box load. A linear relationship was observed with R2 of 0.996.
Table F-5 summarizes the observed load, engine output, and time-based fuel use and emission rates for each of the load setting for locomotive NC 1869 on B20. The mean value is the average over 3 replicates. The Coefficient of Variation (CV) is the ratio of standard deviation of the 3 replicates over the mean.
Tables F-6, F-7, and F-8 show the engine output-based emission rates, fuel-based emission rates, and engine activities, respectively, for NC 1869 on B20.
The observed loads were highly repeatable, with CVs of 0.02 or less, except for the target idle, for which the CV was 0.87. For the target idle, the observed load was 0 for the first replicate and approximately 3% for the rest two replicates, resulting in an observed 2% load on average of the 3 replicates.
Engine output increased from 63 hp at an observed 2% load to approximately 700 hp at an observed 92% load. The observed engine outputs at a given load setting were highly repeatable, with CVs of 0.02 or less, except for the observed 2% load, for which the CV was 0.24.
Fuel use rates ranged from 6.1 g/s to 7.0 g/s at an observed 2% load to an observed 9% load. However, there was lack of precise control of the engine load at low loads. Fuel use rates subsequently increased to approximately 34 g/s at an observed 92% load. The observed fuel use rates at a given load setting were highly repeatable, with CVs of 0.03 or less.
CO2 emission rates were approximately 20 g/s at an observed 2% load to an observed 9% load. However, there was lack of precise control of the engine load at low loads. CO2 emission rates subsequently increased to approximately 110 g/s at an observed 92% load. The observed CO2 emission rates at a given load setting were highly repeatable, with CVs of 0.04 or less.
CO emission rates decreased from 0.19 g/s at an observed 2% load to approximately 0.01 g/s at an observed 92% load. The observed CO emission rates were highly repeatable at observed 2%, 5%, 6%, 7%, 9%, and 45% loads, with CVs of 0.10 or less. Moderate to large variations were observed for the other observed load settings as the CVs range from 0.28 to 1.23, depending on load settings.
HC emission rates were 0.045 g/s at idle, decreased to approximately 0.010 g/s at an observed 19% load, and increased to approximately 0.015 g/s through an observed 92% load. The observed HC emission rates were highly repeatable at observed 5%, 6%, and 45% loads, with CV of 0.09 or less. Moderate variations were observed for the other observed load settings as the CVs range from 0.13 to 0.23, depending on load settings.

A-46
NOx emission rates decreased from 0.29 g/s at an observed 2% load to 0.20 g/s at an observed 9% load and subsequently increased to 1.2 g/s at an observed 92% load. The observed NOx emission rates at a given load setting were highly repeatable, with CV of 0.06 or less.
PM emission rates were 0.010 g/s to 0.013 g/s at an observed 2% load to an observed 19% load and increased to approximately 0.029 g/s at an observed 92% loads. Moderate variations were observed for a given load setting as the CVs range from 0.11 to 0.20, depending on load settings.
The cycle average CO, and HC emission rates are 0.19 g/bhp-hr and 0.14 g/bhp-hr, respectively, which are lower than the EPA emission standards. The cycle average NOx and PM emission rates based on in-use measurement are 5.3 g/bhp-hr and 0.16 g/bhp-hr, respectively, which are slightly higher than the EPA emission standards of 4.8 g/bhp-hr and 0.15 g/bhp-hr. However, because the detection methods for NOx and PM are different than the reference methods, and the in-use measurement is different than the reference test procedure, the comparisons are not conclusive.
Figure F-2 Estimated Engine Load versus Load Box Load for Locomotive NC 1869 Operated on B20 Biodiesel.
y = 0.86x + 44 R² = 0.996
0
100
200
300
400
500
600
700
800
0 200 400 600 800
Est
imat
ed E
ngin
e L
oad
(hp)
Load Box Load (hp)

A-47
Table F-5 Observed Load, Engine Output, and Time-Based Fuel Use and Emission Rates for Locomotive NC 1869 on B20.
Load Box Load (kW)
Observed Load (%)
Engine Output (hp)
Time-Based Fuel Use and Emission Rates Fuel (g/s)
CO2 (g/s)
CO (g/s)
HC (g/s)
NOx (g/s)
PM (g/s)
Mean CV Mean CV Mean CV Mean CV Mean CV Mean CV Mean CV Mean CV 0 2 0.87 63 0.24 7.0 0.03 21 0.03 0.19 0.10 0.045 0.20 0.29 0.04 0.013 0.20 10 5 0.02 83 0.01 6.7 <0.01 20 <0.01 0.15 0.03 0.038 0.07 0.27 0.01 0.012 0.15 15 6 0.01 88 0.01 6.6 <0.01 20 <0.01 0.14 <0.01 0.030 0.09 0.26 <0.01 0.013 0.16 25 7 0.01 95 <0.01 6.5 <0.01 20 <0.01 0.10 0.09 0.024 0.13 0.24 0.01 0.012 0.15 50 9 0.01 109 <0.01 6.1 <0.01 18 <0.01 0.056 0.08 0.014 0.18 0.20 <0.01 0.010 0.12 125 19 0.03 184 0.02 9.9 0.03 30 0.03 0.025 0.28 0.010 0.22 0.37 0.06 0.011 0.11 250 45 <0.01 365 <0.01 18.5 <0.01 56 <0.01 0.011 0.07 0.015 0.08 0.42 0.02 0.017 0.17 375 66 <0.01 520 <0.01 24.3 <0.01 74 <0.01 0.003 0.67 0.014 0.23 0.73 0.02 0.016 0.14 500 92 <0.01 701 <0.01 34.4 <0.01 105 <0.01 0.015 1.23 0.013 0.14 1.2 0.01 0.029 0.16
Table F-6 Observed Load, Engine Output, and Engine Output-Based Fuel Use and Emission Rates for NC 1869 on B20.
Load Box Load (kW)
Observed Load (%)
Engine Output (hp)
Engine Output-Based Fuel Use and Emission Rates Fuel
(bhp-hr/gal) CO2
(g/bhp-hr) CO
(g/bhp-hr) HC
(g/bhp-hr) NOx
(g/bhp-hr) PM
(g/bhp-hr) Mean CV Mean CV Mean CV Mean CV Mean CV Mean CV Mean CV Mean CV
0 2 0.87 63 0.24 8.2 0.26 1300 0.30 11 0.24 2.6 0.09 18 0.31 0.79 0.49 10 5 0.02 83 0.01 11.0 0.01 880 0.01 6.5 0.03 1.7 0.08 12 0.01 0.53 0.16 15 6 0.01 88 0.01 11.8 0.01 820 0.01 5.6 <0.01 1.3 0.09 11 <0.01 0.51 0.16 25 7 0.01 95 <0.01 13.2 0.01 740 <0.01 3.9 0.09 0.91 0.13 9.1 0.01 0.45 0.15 50 9 0.01 109 <0.01 16.1 <0.01 610 0.01 1.9 0.08 0.47 0.19 6.7 <0.01 0.33 0.12 125 19 0.03 184 0.02 16.7 0.01 590 0.01 0.48 0.27 0.20 0.20 7.3 0.03 0.22 0.12 250 45 <0.01 365 <0.01 17.7 <0.01 560 <0.01 0.11 0.07 0.15 0.08 4.2 0.01 0.17 0.17 375 66 <0.01 520 <0.01 19.2 <0.01 510 <0.01 0.021 0.67 0.10 0.23 5.0 0.01 0.11 0.15 500 92 <0.01 701 <0.01 18.3 <0.01 540 <0.01 0.077 1.23 0.07 0.14 6.1 0.01 0.15 0.16

A-48
Table F-7 Observed Load, Engine Output, and Fuel-Based Fuel Use and Emission Rates for NC 1869 on B20.
Load Box Load (kW)
Observed Load (%)
Engine Output (hp)
Fuel-Based Emission Rates CO2
(g/gal) CO
(g/gal) HC
(g/gal) NOx
(g/gal) PM
(g/gal) Mean CV Mean CV Mean CV Mean CV Mean CV Mean CV Mean CV
0 2 0.87 63 0.24 9714 <0.01 87 0.11 21 0.22 136 0.02 8.1 0.17 10 5 0.02 83 0.01 9739 <0.01 72 0.03 18 0.07 128 0.01 8.1 0.15 15 6 0.01 88 0.01 9751 <0.01 66 0.01 15 0.09 126 <0.01 8.4 0.16 25 7 0.01 95 <0.01 9777 <0.01 51 0.08 12 0.13 120 0.01 8.3 0.15 50 9 0.01 109 <0.01 9815 <0.01 30 0.08 7.6 0.19 108 <0.01 7.4 0.12 125 19 0.03 184 0.02 9855 <0.01 8.1 0.27 3.3 0.19 122 0.02 5.0 0.13 250 45 <0.01 365 <0.01 9866 <0.01 1.96 0.07 2.7 0.08 74 0.01 4.2 0.17 375 66 <0.01 520 <0.01 9870 <0.01 0.41 0.67 1.9 0.23 97 0.01 2.9 0.15 500 92 <0.01 701 <0.01 9870 <0.01 1.41 1.23 1.3 0.14 112 0.01 3.7 0.16
Table F-8 Observed Load, Engine Output, and Engine Activities for NC 1869 on B20
Load Box Load (kW)
Observed Load (%)
Engine Activity Engine
Output (hp) Load Box
Output (kW) Engine
Speed (rpm) IAT (°C)
Boost Pressure (kPa)
MAP (kPa)
Mean CV Mean CV Mean CV Mean CV Mean CV Mean CV Mean CV 0 2 0.87 63 0.24 12 <0.01 1800 <0.01 27 0.08 14 <0.01 114 <0.01 10 5 0.02 83 0.01 22 <0.01 1800 <0.01 26 0.06 14 <0.01 114 <0.01 15 6 0.01 88 0.01 27 0.01 1800 <0.01 26 0.06 14 0.06 114 0.01 25 7 0.01 95 <0.01 38 <0.01 1800 <0.01 27 0.06 20 0.01 120 <0.01 50 9 0.01 109 <0.01 65 <0.01 1800 <0.01 27 0.06 27 0.02 127 <0.01 125 19 0.03 184 0.02 145 <0.01 1800 <0.01 27 0.06 48 <0.01 148 <0.01 250 45 <0.01 365 <0.01 280 <0.01 1800 <0.01 30 0.06 124 <0.01 224 <0.01 375 66 <0.01 520 <0.01 415 <0.01 1800 <0.01 35 0.06 178 <0.01 278 <0.01 500 92 <0.01 701 <0.01 555 <0.01 1800 <0.01 40 0.04 225 <0.01 325 <0.01