Embed Size (px)
Citation preview
Measurement of Line Characteristics and of Track Irregularities by Means of DGPSand INS
Th. Luck1, B. Eissfeller1, C. Kreye1 & P. Meinke2
1 Institute of Geodesy and Navigation,University FAF Munich, Neubiberg, Germany.
2 Computer und Kommunikation GmbH, Starnberg, Germany.
BIOGRAPHY
Thorsten Luck is a research associate at the Institute ofGeodesy and Navigation at the University of the FederalArmed Forces Munich. He studied Electrical Engineeringat the universities of Stuttgart and Bochum. Since 1998his research area has been the integration of inertial navi-gation system with differential GPS.
Prof. Dr.-Ing. Bernd Eissfeller is Full Professor andVice-Director of the Institute of Geodesy and Navigationat the University of the Federal Armed Forces Munich.He is responsible for teaching and research in the fieldof GPS/GLONASS and inertial technology. Until the endof 1993 he worked in industry as a project manager inthe development of GPS/INS navigation systems. From1994-2000 he was head of the GNSS Laboratory.
Christian Kreye received a diploma in Geodesy in 1998from the University of Hannover. He has started as aresearch associate at the Institute of Geodesy and Nav-igation of the Federal Armed Forces in 1999. His re-search area has been different applications of integratedGNSS/INS systems, with special emphasis on low-costINS.
ABSTRACT
The evaluation of existing line characteristics and geo-metric track irregularities, being perhaps dangerous fordynamic safety of railway systems, becomes more andmore evident with rising use of tilting trains like the Ger-man ICE3 or ICT, as the resulting irregularities may leadto the danger of train derailment. To identify track de-fects, a new approach of measuring technique using dif-ferential GPS and an inertial navigation system to deter-mine the absolute position and ultrasonic devices to deter-mine the peculiar properties of the geometric track qualitywas developed.
By combination of differential GPS (DGPS) and iner-tial navigation system (INS) the position and the rigidbody motions of a measurement platform at a self pro-pelled draisine is determined. This platform is used ad-ditionally as a base for measuring the relative position ofthe left and right railhead vertically and laterally by ultra-
sonic sensors, so that their position can be described in anearth fixed co-ordinate system.
The basic principles of this measurement system areexplained as well as the results of railway field tests(together with the Austrian RailwaysOBB) are demon-strated. An accuracy in the millimeter range has beenproven. The speed of the measurement draisine was up to50 km/h. Wavelengths of up to 200 m can be determined.
1 INTRODUCTION
For a long time the European railways are interested inthe determination of the response of fast railways on longwavelength track irregularities and in the identification ofsignificant defects and their influence on the potential ofderailment [7]. Within an expert group (C 210) foundedby the European Rail Research Institute (ERRI) in partic-ular the correlation between railway response and trackdefects was discussed.
Since then within the European research projectDYSAF (DYnamisc SAFty) the endangerment for derail-ment especially for tilting trains like the German ICE3 orICT is considered. One aim within this project is to iden-tify track defects with wavelength of 2 up to 150m withinmillimeter accuracy. The system was tested with respectto accuracy and repeatability on a test track of about 20kmlength at up to 40km/h velocity thus leading to a geomet-ric sample rate of at least 20cm.
2 TRACK IRREGULARITY MEASUREMENTSYSTEM (TIMS)
The system design is based on the integration of Differ-ential GPS (DGPS) with an Inertial Navigation System(INS) for positioning. The primary task of the system isto acquire high-precision data for post-processing (Figure2).
To determine the higher dynamics of the measurementplatform, a precise inertial navigation system (SIGMA30,SAGEM, France) is used. The INS position is then aug-mented using carrier phase positions of the differentialGPS system to eliminate inertial errors.
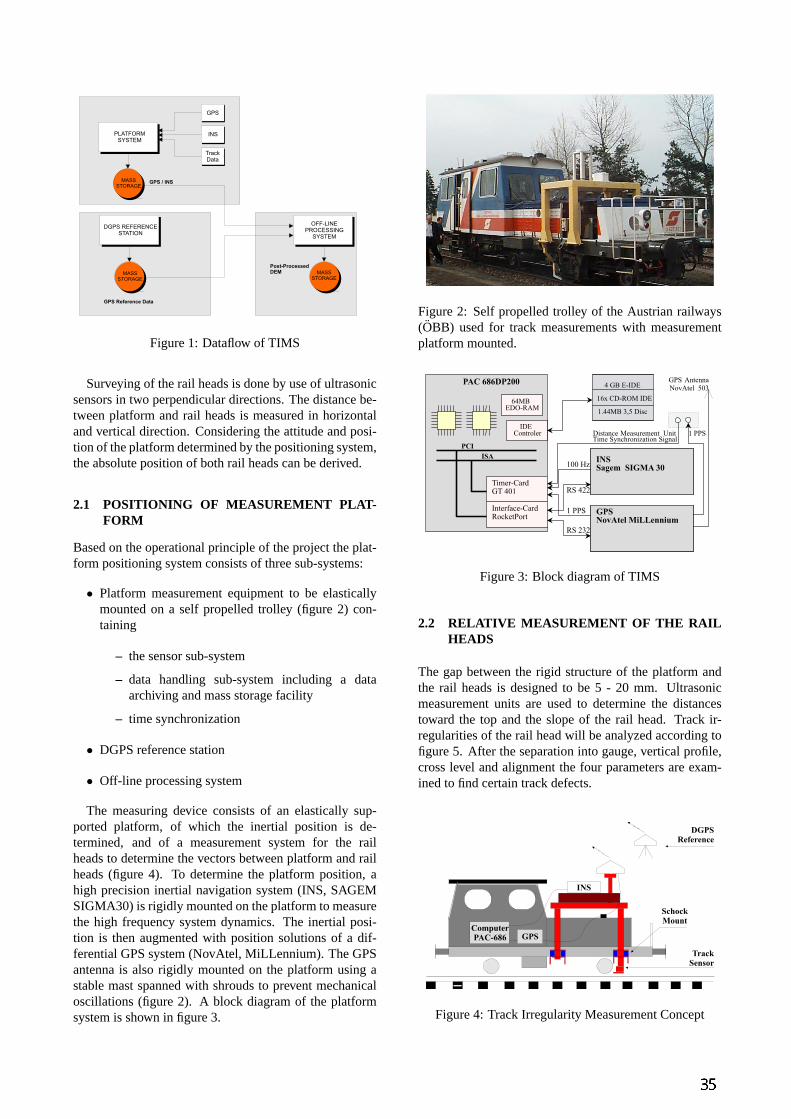
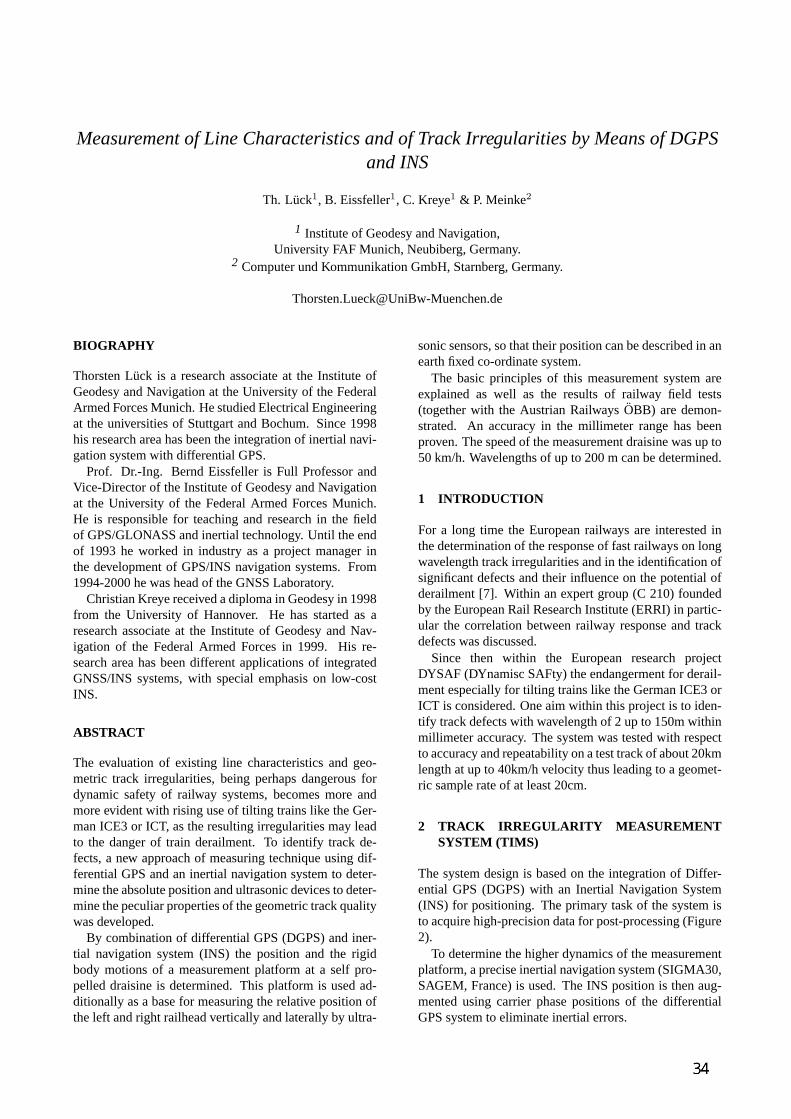
Figure 1: Dataflow of TIMS
Surveying of the rail heads is done by use of ultrasonicsensors in two perpendicular directions. The distance be-tween platform and rail heads is measured in horizontaland vertical direction. Considering the attitude and posi-tion of the platform determined by the positioning system,the absolute position of both rail heads can be derived.
2.1 POSITIONING OF MEASUREMENT PLAT-FORM
Based on the operational principle of the project the plat-form positioning system consists of three sub-systems:
• Platform measurement equipment to be elasticallymounted on a self propelled trolley (figure 2) con-taining
– the sensor sub-system
– data handling sub-system including a dataarchiving and mass storage facility
– time synchronization
• DGPS reference station
• Off-line processing system
The measuring device consists of an elastically sup-ported platform, of which the inertial position is de-termined, and of a measurement system for the railheads to determine the vectors between platform and railheads (figure 4). To determine the platform position, ahigh precision inertial navigation system (INS, SAGEMSIGMA30) is rigidly mounted on the platform to measurethe high frequency system dynamics. The inertial posi-tion is then augmented with position solutions of a dif-ferential GPS system (NovAtel, MiLLennium). The GPSantenna is also rigidly mounted on the platform using astable mast spanned with shrouds to prevent mechanicaloscillations (figure 2). A block diagram of the platformsystem is shown in figure 3.
Figure 2: Self propelled trolley of the Austrian railways(OBB) used for track measurements with measurementplatform mounted.
Figure 3: Block diagram of TIMS
2.2 RELATIVE MEASUREMENT OF THE RAILHEADS
The gap between the rigid structure of the platform andthe rail heads is designed to be 5 - 20 mm. Ultrasonicmeasurement units are used to determine the distancestoward the top and the slope of the rail head. Track ir-regularities of the rail head will be analyzed according tofigure 5. After the separation into gauge, vertical profile,cross level and alignment the four parameters are exam-ined to find certain track defects.
Figure 4: Track Irregularity Measurement Concept
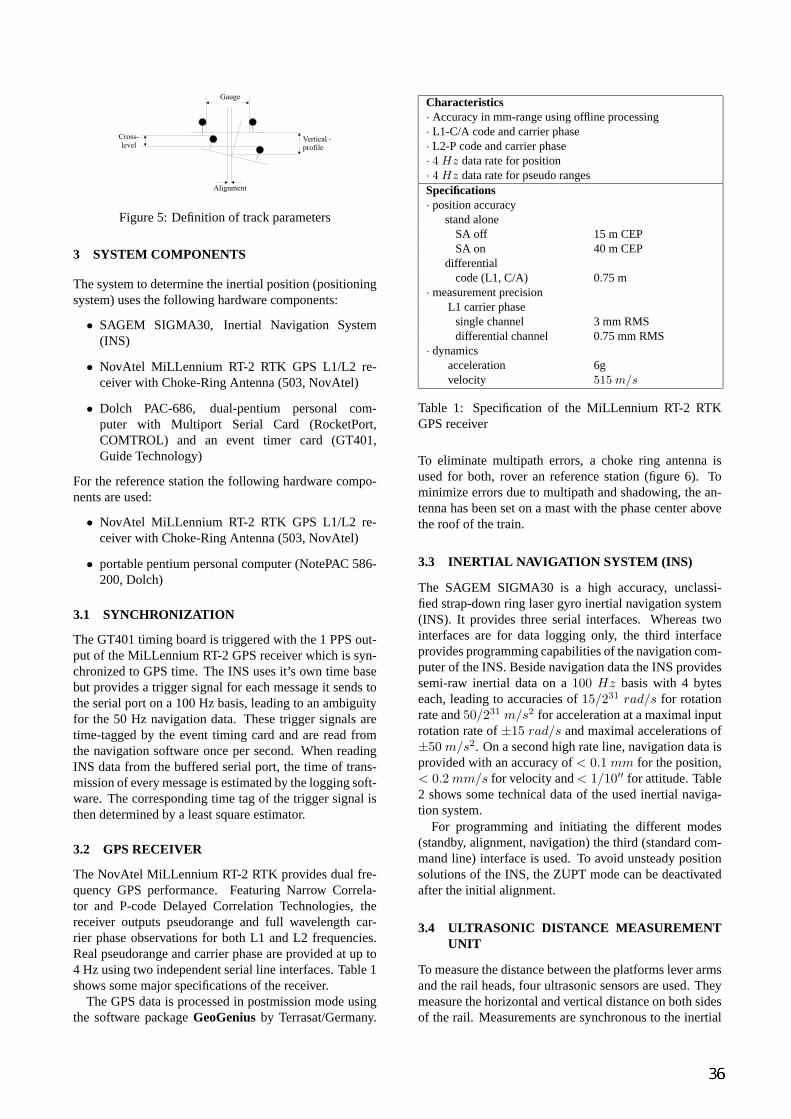
Figure 5: Definition of track parameters
3 SYSTEM COMPONENTS
The system to determine the inertial position (positioningsystem) uses the following hardware components:
• SAGEM SIGMA30, Inertial Navigation System(INS)
• NovAtel MiLLennium RT-2 RTK GPS L1/L2 re-ceiver with Choke-Ring Antenna (503, NovAtel)
• Dolch PAC-686, dual-pentium personal com-puter with Multiport Serial Card (RocketPort,COMTROL) and an event timer card (GT401,Guide Technology)
For the reference station the following hardware compo-nents are used:
• NovAtel MiLLennium RT-2 RTK GPS L1/L2 re-ceiver with Choke-Ring Antenna (503, NovAtel)
• portable pentium personal computer (NotePAC 586-200, Dolch)
3.1 SYNCHRONIZATION
The GT401 timing board is triggered with the 1 PPS out-put of the MiLLennium RT-2 GPS receiver which is syn-chronized to GPS time. The INS uses it’s own time basebut provides a trigger signal for each message it sends tothe serial port on a 100 Hz basis, leading to an ambiguityfor the 50 Hz navigation data. These trigger signals aretime-tagged by the event timing card and are read fromthe navigation software once per second. When readingINS data from the buffered serial port, the time of trans-mission of every message is estimated by the logging soft-ware. The corresponding time tag of the trigger signal isthen determined by a least square estimator.
3.2 GPS RECEIVER
The NovAtel MiLLennium RT-2 RTK provides dual fre-quency GPS performance. Featuring Narrow Correla-tor and P-code Delayed Correlation Technologies, thereceiver outputs pseudorange and full wavelength car-rier phase observations for both L1 and L2 frequencies.Real pseudorange and carrier phase are provided at up to4 Hz using two independent serial line interfaces. Table 1shows some major specifications of the receiver.
The GPS data is processed in postmission mode usingthe software packageGeoGeniusby Terrasat/Germany.
Characteristics· Accuracy in mm-range using offline processing· L1-C/A code and carrier phase· L2-P code and carrier phase· 4 Hz data rate for position· 4 Hz data rate for pseudo rangesSpecifications· position accuracy
stand aloneSA off 15 m CEPSA on 40 m CEP
differentialcode (L1, C/A) 0.75 m
·measurement precisionL1 carrier phase
single channel 3 mm RMSdifferential channel 0.75 mm RMS
· dynamicsacceleration 6gvelocity 515 m/s
Table 1: Specification of the MiLLennium RT-2 RTKGPS receiver
To eliminate multipath errors, a choke ring antenna isused for both, rover an reference station (figure 6). Tominimize errors due to multipath and shadowing, the an-tenna has been set on a mast with the phase center abovethe roof of the train.
3.3 INERTIAL NAVIGATION SYSTEM (INS)
The SAGEM SIGMA30 is a high accuracy, unclassi-fied strap-down ring laser gyro inertial navigation system(INS). It provides three serial interfaces. Whereas twointerfaces are for data logging only, the third interfaceprovides programming capabilities of the navigation com-puter of the INS. Beside navigation data the INS providessemi-raw inertial data on a100 Hz basis with 4 byteseach, leading to accuracies of15/231 rad/s for rotationrate and50/231 m/s2 for acceleration at a maximal inputrotation rate of±15 rad/s and maximal accelerations of±50 m/s2. On a second high rate line, navigation data isprovided with an accuracy of< 0.1 mm for the position,< 0.2mm/s for velocity and< 1/10′′ for attitude. Table2 shows some technical data of the used inertial naviga-tion system.
For programming and initiating the different modes(standby, alignment, navigation) the third (standard com-mand line) interface is used. To avoid unsteady positionsolutions of the INS, the ZUPT mode can be deactivatedafter the initial alignment.
3.4 ULTRASONIC DISTANCE MEASUREMENTUNIT
To measure the distance between the platforms lever armsand the rail heads, four ultrasonic sensors are used. Theymeasure the horizontal and vertical distance on both sidesof the rail. Measurements are synchronous to the inertial
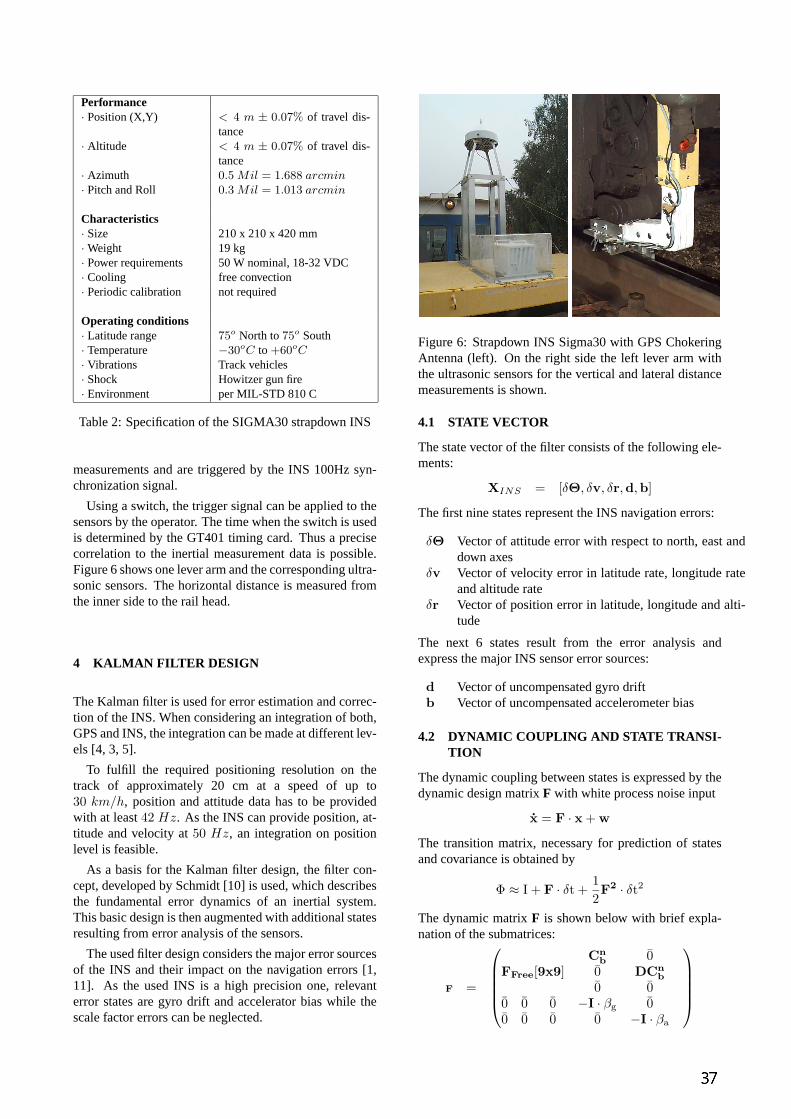
Performance· Position (X,Y) < 4 m ± 0.07% of travel dis-
tance· Altitude < 4 m ± 0.07% of travel dis-
tance· Azimuth 0.5 Mil = 1.688 arcmin· Pitch and Roll 0.3 Mil = 1.013 arcmin
Characteristics· Size 210 x 210 x 420 mm·Weight 19 kg· Power requirements 50 W nominal, 18-32 VDC· Cooling free convection· Periodic calibration not required
Operating conditions· Latitude range 75o North to75o South· Temperature −30oC to +60oC· Vibrations Track vehicles· Shock Howitzer gun fire· Environment per MIL-STD 810 C
Table 2: Specification of the SIGMA30 strapdown INS
measurements and are triggered by the INS 100Hz syn-chronization signal.
Using a switch, the trigger signal can be applied to thesensors by the operator. The time when the switch is usedis determined by the GT401 timing card. Thus a precisecorrelation to the inertial measurement data is possible.Figure 6 shows one lever arm and the corresponding ultra-sonic sensors. The horizontal distance is measured fromthe inner side to the rail head.
4 KALMAN FILTER DESIGN
The Kalman filter is used for error estimation and correc-tion of the INS. When considering an integration of both,GPS and INS, the integration can be made at different lev-els [4, 3, 5].
To fulfill the required positioning resolution on thetrack of approximately 20 cm at a speed of up to30 km/h, position and attitude data has to be providedwith at least42 Hz. As the INS can provide position, at-titude and velocity at50 Hz, an integration on positionlevel is feasible.
As a basis for the Kalman filter design, the filter con-cept, developed by Schmidt [10] is used, which describesthe fundamental error dynamics of an inertial system.This basic design is then augmented with additional statesresulting from error analysis of the sensors.
The used filter design considers the major error sourcesof the INS and their impact on the navigation errors [1,11]. As the used INS is a high precision one, relevanterror states are gyro drift and accelerator bias while thescale factor errors can be neglected.
Figure 6: Strapdown INS Sigma30 with GPS ChokeringAntenna (left). On the right side the left lever arm withthe ultrasonic sensors for the vertical and lateral distancemeasurements is shown.
4.1 STATE VECTOR
The state vector of the filter consists of the following ele-ments:
XINS = [δΘ, δv, δr,d,b]
The first nine states represent the INS navigation errors:
δΘ Vector of attitude error with respect to north, east anddown axes
δv Vector of velocity error in latitude rate, longitude rateand altitude rate
δr Vector of position error in latitude, longitude and alti-tude
The next 6 states result from the error analysis andexpress the major INS sensor error sources:
d Vector of uncompensated gyro driftb Vector of uncompensated accelerometer bias
4.2 DYNAMIC COUPLING AND STATE TRANSI-TION
The dynamic coupling between states is expressed by thedynamic design matrixF with white process noise input
x = F · x + w
The transition matrix, necessary for prediction of statesand covariance is obtained by
Φ ≈ I + F · δt +12F2 · δt2
The dynamic matrixF is shown below with brief expla-nation of the submatrices:
F =
Cn
b 0FFree[9x9] 0 DCn
b
0 00 0 0 −I · βg 00 0 0 0 −I · βa
The 9x9 submatrixFFree is taken from [10]. β are thethree dimensional correlation coefficients of the gyros (in-dex g) and accelerometers (index a) error models.I is the3x3 unity matrix.
The Cnb Matrix is the transformation matrix between
body and navigation frame and is needed to relate sensorerrors, normally defined in body coordinates to the navi-gation errors defined in local horizon frame.
Cnb=
cos γ cos β cos γ sin β sinα cosα sin β cos γ
cos β sin γ− sin γ cosα
sin γ sin β sinα
+ sin γ sinα
cosα sin β sin γ
− sin β+ cos γ cosα
cos β sinα
− sinα cos γ
cosα cos β
with
α Rollβ Pitchγ Azimuth
.
The scaling MatrixD transforms linear velocity to lati-tude or longitude rate.
D =
1R 0 00 1
R cos Φ 00 0 −1
4.3 OBSERVATIONS
Six different observations are used to update the Kalmanfilter:
• Three dimensional carrier-phase position
• Three dimensional instantaneous Doppler velocity
The observation, used to update the filter, is the differencebetween INS and GPS computed position:
rINS − rGPS = δr + n
withr position vectorδr vector of position error (states)n white noise
The velocity error is derived by differencing INSand GPS velocity:
vINS − vGPS = D−1δv + n
The velocity difference has to be related to the velocityerror state via the scaling matrixD described above.
4.4 SMOOTHING
Due to the analysis of the measurement data in post pro-cessing, all data of a complete set of measurements canbe taken into account for the calculation of the positionwithin the Kalman filter. Using the so calledoptimalsmoother, all data is processed in positive time axis andafterwards - with the knowledge of all error states andcovariances - in backward direction. This allows a fur-ther reduction of the variances of the position solution.[2].Figure 7 show the principal of the so calledoptimalsmoother.
Figure 7: Principal of theOptimal Smoother
5 EVALUATION OF THE PROTOTYPE TIMS
On two successive days in September 2000 several testruns were performed on a auxiliary route of the Austrianrailways (OBB) near St. Polten. Below first of all thesetup and surveying of the measurement platform will bedescribed following first results from the test runs.
5.1 SETUP AND SURVEYING OF THE MEA-SUREMENT PLATFORM
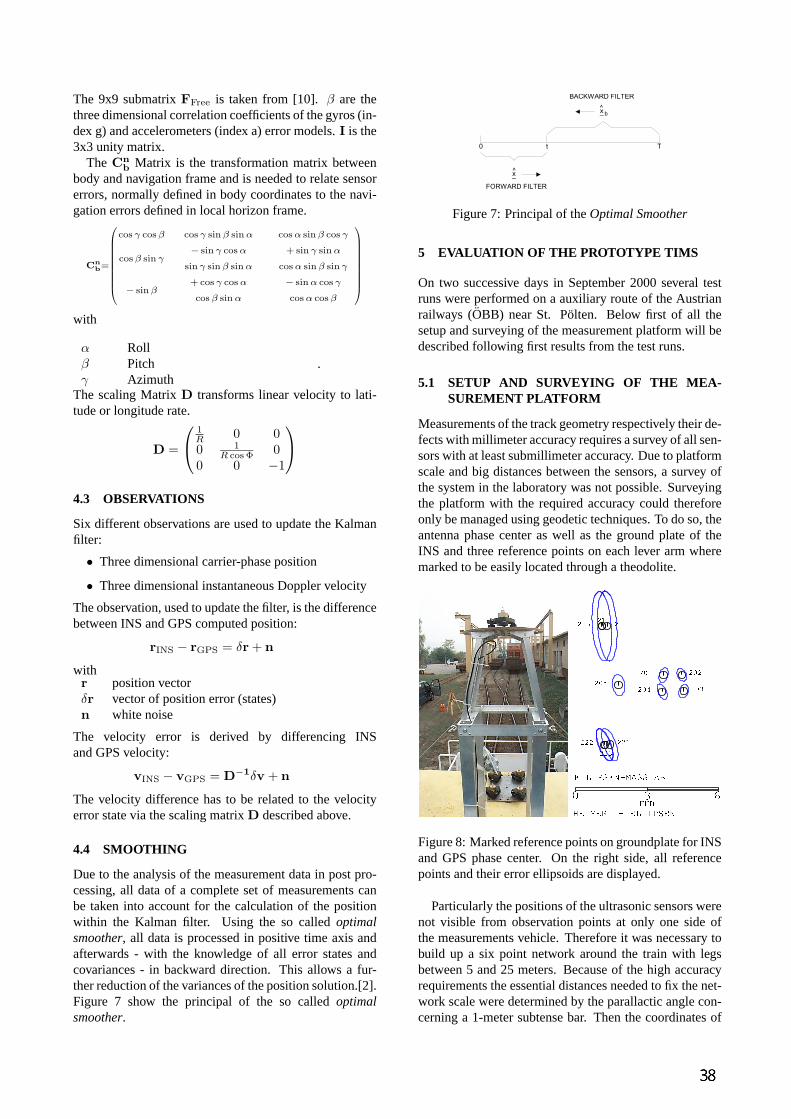
Measurements of the track geometry respectively their de-fects with millimeter accuracy requires a survey of all sen-sors with at least submillimeter accuracy. Due to platformscale and big distances between the sensors, a survey ofthe system in the laboratory was not possible. Surveyingthe platform with the required accuracy could thereforeonly be managed using geodetic techniques. To do so, theantenna phase center as well as the ground plate of theINS and three reference points on each lever arm wheremarked to be easily located through a theodolite.
����������
�����
��� �� �������
����� �����
�������������� �
!#"$"&%('*)+!(,.-0/213)$)5461#7
8$9;:+<;9$=#>@?A9#:$:CB5D*E+9(F
G H IJKJ
Figure 8: Marked reference points on groundplate for INSand GPS phase center. On the right side, all referencepoints and their error ellipsoids are displayed.
Particularly the positions of the ultrasonic sensors werenot visible from observation points at only one side ofthe measurements vehicle. Therefore it was necessary tobuild up a six point network around the train with legsbetween 5 and 25 meters. Because of the high accuracyrequirements the essential distances needed to fix the net-work scale were determined by the parallactic angle con-cerning a 1-meter subtense bar. Then the coordinates of
the target points defining the mutual 3D-position of thethree different sensors could be determined by the spa-tial intersection of the lines of sight from the observingtheodolites (measurement of horizontal and vertical an-gles concerning two observation points) in the local net-work system.
An additional stabilization of the network geometrywas possible by the double-sided determination of the tar-get points defining the INS ground plane and the phasecenter of the GPS antenna. Using a free network 3D-adjustment optimized concerning the object points witha reliability of 0.61, the vectors between the differentsensors could be determined with an accuracy of 0.3 to1.7 mm depending on the particular observation geome-try. Finally the transformation of the vectors in the coor-dinate system of the INS was carried out.
5.2 TEST RUNS
Data of a total distance of approximately 120 km wereacquired by successive travels over the test range, whichhad a total length of about 20 km. Figure 14 shows a partof the test range between rail station Traisen/Markt viaTraisen and Wilhelmsburg to Spratzern. In addition theposition of the reference station is marked.
The accuracy of the GPS carrier phase position solutionwas in the range of< 3mm for the horizontal componentsand< 5mm for the vertical under well conditions (figure9).
After compensation of systematic errors the accuracyof the INS was better than 0.3mm. Figure 10 shows thedrift of the free running INS in a period of 10 seconds aswell as the residuals after compensation with a polyno-mial of third order.
48.07777541
48.07777542
48.07777543
48.07777544
48.07777545
48.07777546
48.07777547
48.07777548
48.07777549
0 2 4 6 8 10-0.8
-0.6
-0.4
-0.2
0
0.2
0.4
0.6
0.8
Latit
ude
[o ]
Res
iduu
m [m
m]
�
Time [s]
RMS of residuals: 0.323518 mm
INS Nav Dataf(x)=a3x3+a2x2+a1x1+a0
Residuum
Figure 10: The position accuracy of the INS is - aftercompensation of systematic errors - in the range of 0.3mmRMS (0.3mm/s2 acceleration error)
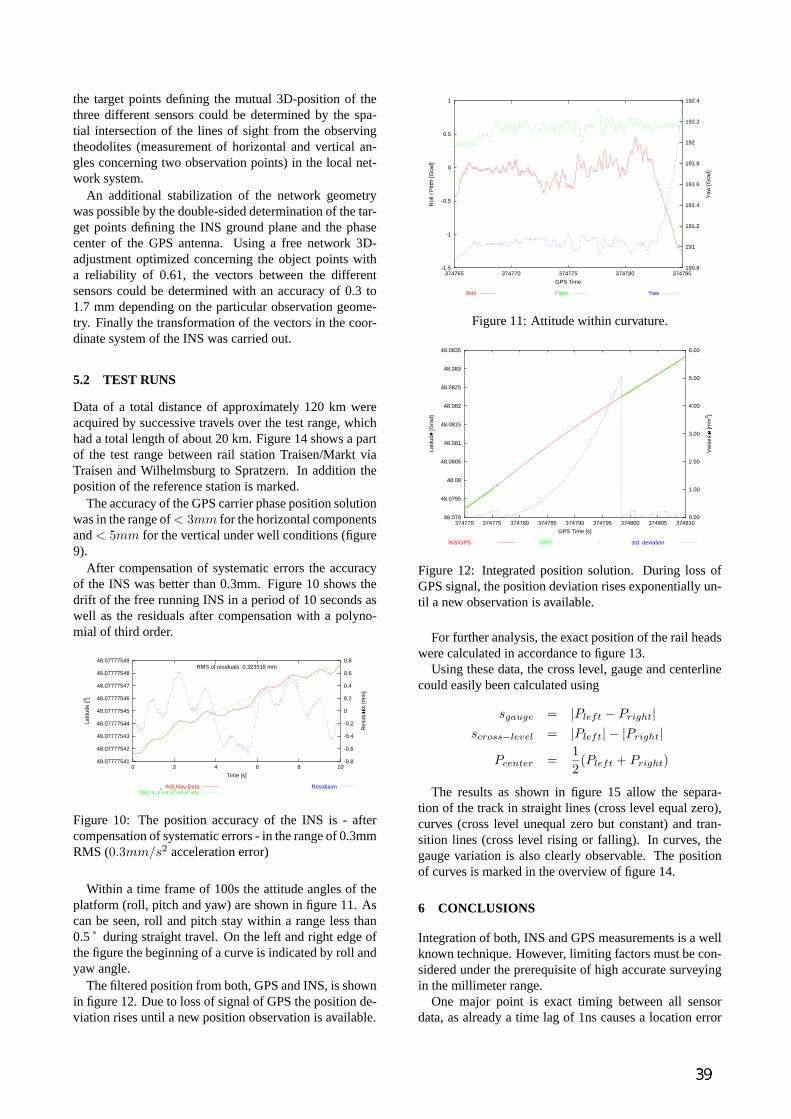
Within a time frame of 100s the attitude angles of theplatform (roll, pitch and yaw) are shown in figure 11. Ascan be seen, roll and pitch stay within a range less than0.5 ˚ during straight travel. On the left and right edge ofthe figure the beginning of a curve is indicated by roll andyaw angle.
The filtered position from both, GPS and INS, is shownin figure 12. Due to loss of signal of GPS the position de-viation rises until a new position observation is available.
-1.5
-1
-0.5
0
0.5
1
374765 374770 374775 374780 374785190.8
191
191.2
191.4
191.6
191.8
192
192.2
192.4
Rol
l / P
itch
[Gra
d]
�
Yaw
[Gra
d]
GPS Time
Roll Pitch Yaw
Figure 11: Attitude within curvature.
48.079
48.0795
48.08
48.0805
48.081
48.0815
48.082
48.0825
48.083
48.0835
374770 374775 374780 374785 374790 374795 374800 374805 3748100.00
1.00
2.00
3.00
4.00
5.00
6.00
Latit
ude
[Gra
d]�
Var
ianc
e [m
m
�
2 ]
GPS Time [s]
INS/GPS GPS std. deviation
Figure 12: Integrated position solution. During loss ofGPS signal, the position deviation rises exponentially un-til a new observation is available.
For further analysis, the exact position of the rail headswere calculated in accordance to figure 13.
Using these data, the cross level, gauge and centerlinecould easily been calculated using
sgauge = |Pleft − Pright|scross−level = |Pleft| − |Pright|
Pcenter =12
(Pleft + Pright)
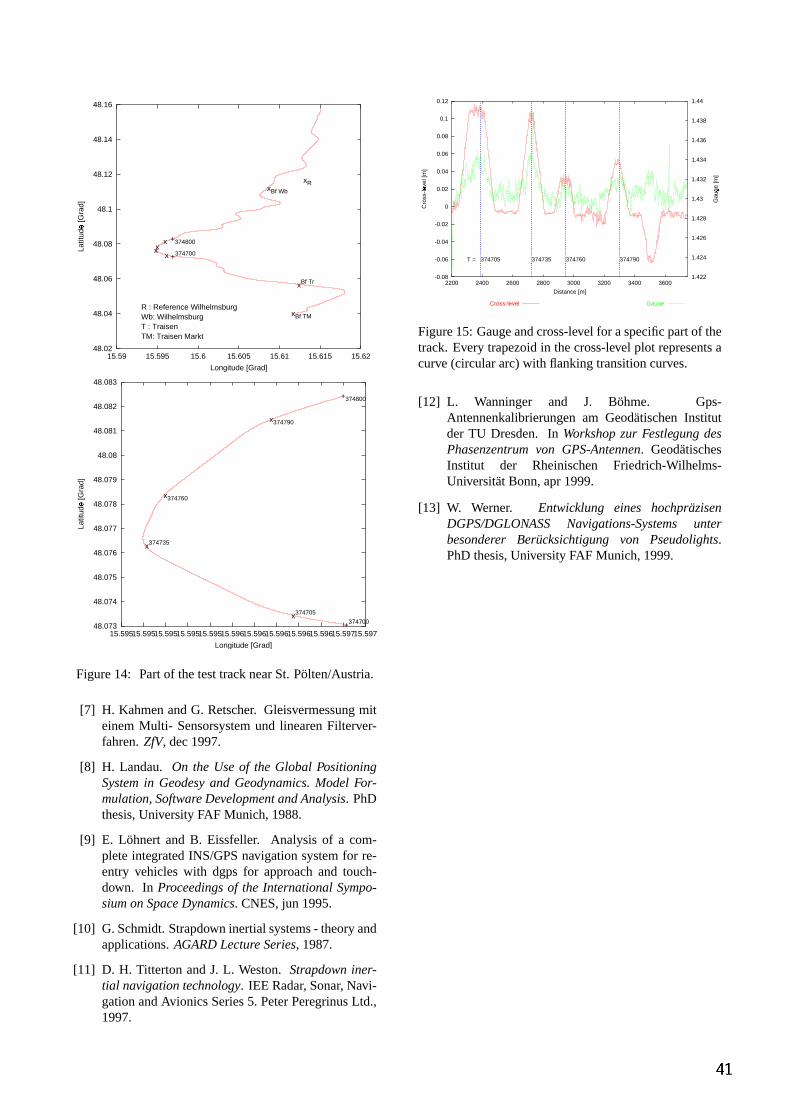
The results as shown in figure 15 allow the separa-tion of the track in straight lines (cross level equal zero),curves (cross level unequal zero but constant) and tran-sition lines (cross level rising or falling). In curves, thegauge variation is also clearly observable. The positionof curves is marked in the overview of figure 14.
6 CONCLUSIONS
Integration of both, INS and GPS measurements is a wellknown technique. However, limiting factors must be con-sidered under the prerequisite of high accurate surveyingin the millimeter range.
One major point is exact timing between all sensordata, as already a time lag of 1ns causes a location error
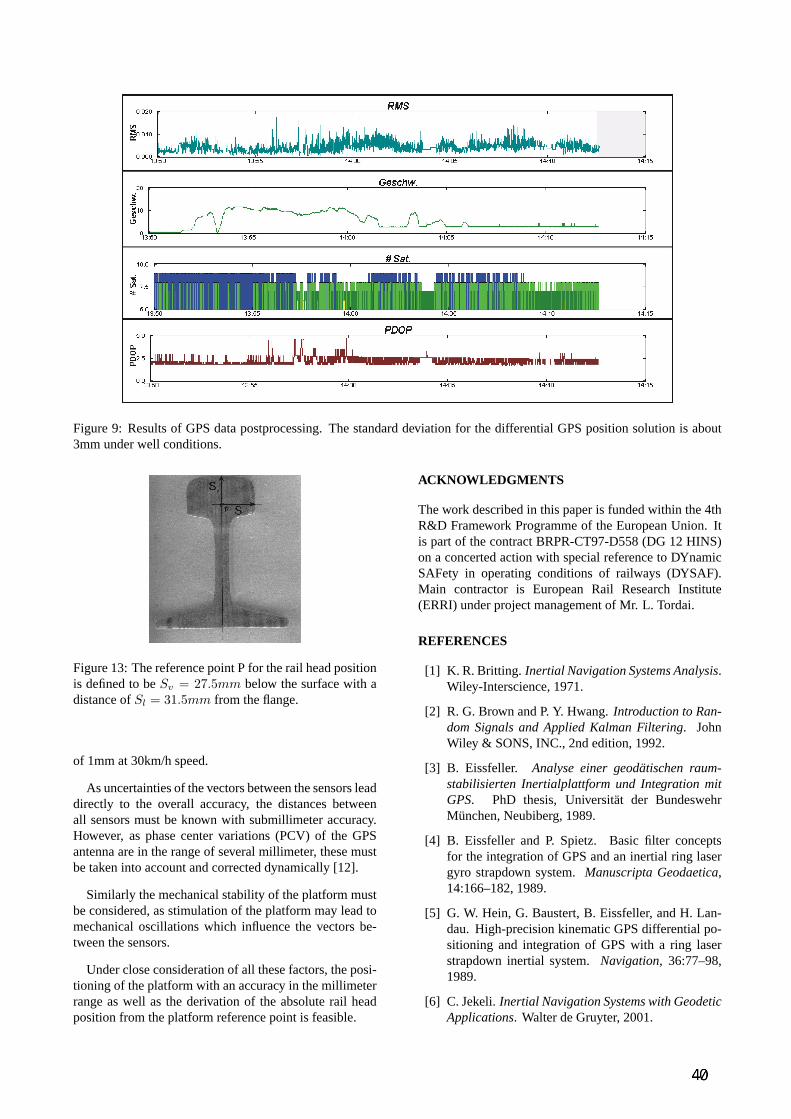
Figure 9: Results of GPS data postprocessing. The standard deviation for the differential GPS position solution is about3mm under well conditions.
Figure 13: The reference point P for the rail head positionis defined to beSv = 27.5mm below the surface with adistance ofSl = 31.5mm from the flange.
of 1mm at 30km/h speed.
As uncertainties of the vectors between the sensors leaddirectly to the overall accuracy, the distances betweenall sensors must be known with submillimeter accuracy.However, as phase center variations (PCV) of the GPSantenna are in the range of several millimeter, these mustbe taken into account and corrected dynamically [12].
Similarly the mechanical stability of the platform mustbe considered, as stimulation of the platform may lead tomechanical oscillations which influence the vectors be-tween the sensors.
Under close consideration of all these factors, the posi-tioning of the platform with an accuracy in the millimeterrange as well as the derivation of the absolute rail headposition from the platform reference point is feasible.
ACKNOWLEDGMENTS
The work described in this paper is funded within the 4thR&D Framework Programme of the European Union. Itis part of the contract BRPR-CT97-D558 (DG 12 HINS)on a concerted action with special reference to DYnamicSAFety in operating conditions of railways (DYSAF).Main contractor is European Rail Research Institute(ERRI) under project management of Mr. L. Tordai.
REFERENCES
[1] K. R. Britting. Inertial Navigation Systems Analysis.Wiley-Interscience, 1971.
[2] R. G. Brown and P. Y. Hwang.Introduction to Ran-dom Signals and Applied Kalman Filtering. JohnWiley & SONS, INC., 2nd edition, 1992.
[3] B. Eissfeller. Analyse einer geodatischen raum-stabilisierten Inertialplattform und Integration mitGPS. PhD thesis, Universitat der BundeswehrMunchen, Neubiberg, 1989.
[4] B. Eissfeller and P. Spietz. Basic filter conceptsfor the integration of GPS and an inertial ring lasergyro strapdown system.Manuscripta Geodaetica,14:166–182, 1989.
[5] G. W. Hein, G. Baustert, B. Eissfeller, and H. Lan-dau. High-precision kinematic GPS differential po-sitioning and integration of GPS with a ring laserstrapdown inertial system.Navigation, 36:77–98,1989.
[6] C. Jekeli.Inertial Navigation Systems with GeodeticApplications. Walter de Gruyter, 2001.
48.02
48.04
48.06
48.08
48.1
48.12
48.14
48.16
15.59 15.595 15.6 15.605 15.61 15.615 15.62
Latit
ude
[Gra
d]
�
Longitude [Grad]
xxx
x
xRxBf Wb
xBf Tr
xBf TM
+374700
+374800
R : Reference WilhelmsburgWb: WilhelmsburgT : TraisenTM: Traisen Markt
48.073
48.074
48.075
48.076
48.077
48.078
48.079
48.08
48.081
48.082
48.083
15.59515.59515.59515.59515.59515.59615.59615.59615.59615.59615.59715.597
Latit
ude
[Gra
d]
�
Longitude [Grad]
x374705
x374735
x374760
x374790
+374700
+374800
Figure 14: Part of the test track near St. Polten/Austria.
[7] H. Kahmen and G. Retscher. Gleisvermessung miteinem Multi- Sensorsystem und linearen Filterver-fahren.ZfV, dec 1997.
[8] H. Landau. On the Use of the Global PositioningSystem in Geodesy and Geodynamics. Model For-mulation, Software Development and Analysis. PhDthesis, University FAF Munich, 1988.
[9] E. Lohnert and B. Eissfeller. Analysis of a com-plete integrated INS/GPS navigation system for re-entry vehicles with dgps for approach and touch-down. InProceedings of the International Sympo-sium on Space Dynamics. CNES, jun 1995.
[10] G. Schmidt. Strapdown inertial systems - theory andapplications.AGARD Lecture Series, 1987.
[11] D. H. Titterton and J. L. Weston.Strapdown iner-tial navigation technology. IEE Radar, Sonar, Navi-gation and Avionics Series 5. Peter Peregrinus Ltd.,1997.
-0.08
-0.06
-0.04
-0.02
0
0.02
0.04
0.06
0.08
0.1
0.12
2200 2400 2600 2800 3000 3200 3400 36001.422
1.424
1.426
1.428
1.43
1.432
1.434
1.436
1.438
1.44
Cro
ss-le
vel [
m]
�
Gau
ge [m
]
�
Distance [m]
T = 374705 374735 374760 374790
Cross-level Gauge
Figure 15: Gauge and cross-level for a specific part of thetrack. Every trapezoid in the cross-level plot represents acurve (circular arc) with flanking transition curves.
[12] L. Wanninger and J. Bohme. Gps-Antennenkalibrierungen am Geodatischen Institutder TU Dresden. InWorkshop zur Festlegung desPhasenzentrum von GPS-Antennen. GeodatischesInstitut der Rheinischen Friedrich-Wilhelms-Universitat Bonn, apr 1999.
[13] W. Werner. Entwicklung eines hochprazisenDGPS/DGLONASS Navigations-Systems unterbesonderer Berucksichtigung von Pseudolights.PhD thesis, University FAF Munich, 1999.