Embed Size (px)
Citation preview

Transaction
Paper
Introduction
The design of stope support in South Africangold mines has traditionally been carried outby rock mechanics personnel on mines as partof their responsibility in terms of the Code ofPractice to Combat Rock burst and Rock FallAccidents on Mines (COP). In the guideline forthe compilation of a mandatory COP to combatrock fall and rock burst accidents in tabularmetalliferous mines (DME, 2007), therequirement is clearly stated, ‘Support designmethodologies used must be properlymotivated and documented.’ This is also aresponsibility expected of rock mechanicspersonnel by their employers. The design ofstope support expected by the COP commonlytakes into account a mass of rockcorresponding with 95% of the expected heightof rock fall, determined from documentedrecords of rock falls on the mine (Jager andRyder, 1999). Static and, if appropriate,dynamic loads, and the capacities of supportelements, are taken into account indetermining the required spacings of thesupport elements. This design procedure is
commonly applied in the tabular stopingenvironment in gold mines (Jager and Ryder,1999).
In the design process outlined above, noaccount is taken of the actual sizes of rockblocks, slabs and wedges that might be presentin the stope hangingwall (the empirical rockfall data required in the COP do take account ofobserved fall thickness on a statistical basis,but not the lateral dimensions of the blocks).Rock falls can occur only if blocks are definedby natural joints (including bedding or partingplanes) or a combination of such joints andstress induced fractures. Although the goldmining industry acknowledges the existence ofnatural joints and bedding planes in the rockmass, their effect on stability of excavations isnot routinely and specifically taken intoaccount in traditional approaches. It wasindicated by Stacey (1989) that there were nopublished records of systematic mapping ofjoint characteristics in gold mine stopes, andthis appears still to be the case as far as SouthAfrican literature is concerned. Stacey (1989)showed that there is a significant probabilityof occurrence of rock falls defined by stress-induced fractures and natural joints.Significantly, he showed that, if a singleelongate in a 1 m x 1 m pattern was to be lost,the probability of occurrence of potential rockfalls increased from 5% to 26%. As a result ofthis work, the recommendation was made thatinvestigations should be instigated to gatherinformation on the characteristics of joints. Nosuch information has been collected untilrecently (Gumede, 2006). It is to be noted thatthe presence of faults will exacerbate thestability situation. They need to be taken intoaccount on an individual basis and aretherefore not considered here.
Measurement of typical joint characteristicsin South African gold mines and the use ofthese characteristics in the prediction ofrock fallsby H. Gumede*,and T.R. Stacey*
Synopsis
The occurrence of fracturing due to high stress levels is a majorfactor in hangingwall stability in deep level gold mine stopes.However, rock falls cannot be the result of these fractures alone.Rock falls can result only from the occurrence of unstable rockblocks defined by the interaction of the stress induced fractures andnaturally occurring geological planes of weakness. These planesinclude bedding planes and joint set planes. However, there is ageneral lack of information on the characteristics of these planes(orientations, spacings and lengths)—it does not appear that anysuch systematic and quantified information, if collected, has beenpublished. To remedy this situation to some extent, joint mappingexercises have been carried out in several geological environmentsin two gold mines. The data collected on joint geometry includedorientation, spacing and length, and this information is included inthe paper. In addition, the paper describes the use of the datacollected to evaluate the potential for rock falls and the probabilityof failure of stope support
* School of Mining Engineering, University of theWitwatersrand.
© The Southern African Institute of Mining andMetallurgy, 2007. SA ISSN 0038–223X/3.00 +0.00. Paper received Sep. 2006; revised paperreceived Apr. 2007.
335The Journal of The Southern African Institute of Mining and Metallurgy VOLUME 107 REFEREED PAPER MAY 2007 ▲

Measurement of typical joint characteristics in South African gold mines
In this paper, the systematic measurement of jointinggeometries (orientations, spacings and lengths) in two goldmines is described, and the interpreted data are presented(Gumede, 2006). These data are used to predict theprobability of occurrence of rock falls, and the probability offailure in supported stopes.
Characteristics of rock joints
Since this paper deals with the collection and use of jointdata, it is considered appropriate to reiterate briefly some ofthe terms that are relevant to this topic.
Rock joints
Joints are planar discontinuities of geological origin in a rockmass, along which there is no discernible or visible lateraldisplacement. Joints are planes of weakness in a rock massand hence they directly or indirectly influence the stability ofthe rock mass. Bedding planes are considered as joints in thispaper.
Joint geometrical properties
Joint geometrical properties considered important are jointorientation, joint length and joint spacing. Although jointsurface properties, which determine joint shear strength, areimportant to stability, only joint geometry is dealt with in thispaper.
Joint orientation
Joint orientation describes the attitude of the joint in space.Orientation is the most important joint property since jointsthat are favourably orientated with regard to stabilityeffectively neutralize the effects of other properties. A joint’sorientation is uniquely described by its dip and dip directionangles. In most cases, joints are found to be clustered instatistically preferred directions, and an individual cluster ofthese joints defines a joint set. Joints that do not fall withinthe defined sets are known as random joints. Jointorientations are typically normally distributed (Robertson,1977; Barton, 1976; Baecher et al., 1977; and Kulatilake et al., 1995).
Joint length
The length of a joint describes the length of the potentialfailure plane. Discontinuous joints result in a relativelystronger rock mass since, for failure to develop along thisplane, rupture must occur through intact rock.
It is not easy to measure the absolute length of jointssince the entire joint surface is usually not exposed. Hencejoint trace lengths are measured in ‘exposures’ and theoverall length can be statistically predicted thereafter.Accurate measurement of joint lengths is more challengingthan measurement of other joint properties mainly because ofsize bias and truncation or censoring. Size bias occursbecause larger joints have a higher probability of beingsampled than smaller joints. The sampling error introducedby the size bias can be as much as double the true tracelength of the population (Einstein et al., 1983). Joint lengthsmay be censored above, or truncated below, certain lengthsthat cannot be measured practically. In field mapping it is
common to measure joints from a given minimum length(truncation) and this truncation error results in the overesti-mation of joint lengths. Some joints tend to extend into or outof the excavation face, resulting in the impossibility ofmeasuring their actual full lengths. It is therefore commonnot to measure joint lengths that are above a given length(censoring), and this has the effect of underestimating theactual joint length.
Evaluation of extensive data has shown that thefrequency distribution of discontinuity trace lengths may bedescribed by either a log-normal distribution or a negativeexponential distribution (Robertson, 1977; Barton, 1976;Baecher et al., 1977; and Kulatilake et al., 1995).
Joint spacing
Joint spacing is a measure of jointing intensity in a rockmass, that is, the number of joints per unit distance normalto the orientation of the set. It is taken as the perpendiculardistance between adjacent joints. In general, joint spacingvalues are positively skewed and can be approximated bynegative exponential or lognormal functions—mostresearchers (Call et al., 1976; Priest and Hudson, 1976;Wallis and King, 1981; and Kulatilake et al., 1995) haveconcluded that a negative exponential distribution isapplicable for joint spacings, while others indicate alognormal distribution (Steffen et al., 1975; and Bridges,1975). In practice there is little difference between theassumption of a negative exponential or log normal distri-bution.
Joint surveys
Joint surveying techniques that can be used for undergroundmapping are cell or area mapping, scan line mapping, andinterpretation of joint data from orientated drill core. Thesemethods are all well established (for example, Nicholas andSims, 2000). Cell mapping involves systematically dividingthe face to be mapped into zones of equal lengths called cells.Structural data are then mapped in areas called cell windows(hence the name window mapping). The actual mappinginvolves visually identifying joints within the cell windowand recording their orientations, lengths, spacings, andsurface characteristics.
The scan-line mapping technique involves measuring allthe joints that intersect a scan-line along its length. Ameasuring tape is usually used as a scan-line and theproperties of only those joints that cross the tape arerecorded.
Both cell and scan-line mapping techniques have thedisadvantage of mapping only exposed surfaces, thus theycannot be used in determining the structural behaviourbehind the exposed surface. In scan-line mapping, lessjudgement is required during the actual data collection, hencenot much geological mapping experience is required.Although more data are collected over larger areas in cellmapping, data from scan-line mapping represent moredetailed information per specific location. The mapping datareported in this paper were obtained from the scan-linemapping technique only.
The latest developments in joint mapping include the useof the photogrammetric principles (Feng et al., 2001; Beer etal., 1999; Harrison, 1993; GIS Du et al., 2001), and common
▲
336 MAY 2007 VOLUME 107 REFEREED PAPER The Journal of The Southern African Institute of Mining and Metallurgy
photographs (Hadjigeorgiou et al., 2003). Sirovision (CSIRO,2004) is a structural mapping technique used for a completerock structure analysis using imaging, laser scanning andphotogrammetric techniques.
Joint mapping in underground gold mines
Most of the work relevant to joint mapping data forunderground gold mines was documented and published inthe late 1970s and early 1980s. In most cases joint mappingwas done as a secondary procedure, the primary aim andemphasis being to map fractures ahead of the mining face.As such, most mapping was done from drill cores, and jointproperties such as lengths were not recorded. In fact, allpublished papers indicate that the mapping was limited tojoint orientations (Kersten, 1969; Van Proctor, 1978; Adamsand Jager, 1980; Hagan, 1980; Brummer, 1987; and Quayeand Guler, 1998). Hagan (1980) gave a relatively detaileddescription of joint properties, referring to the verticalorientation of quartz filled joints and estimating their spacingto be between 0.2 m and 2 m. However, there was nomention of other properties, but he did acknowledge that theinteractions of joints (including bedding planes and minorfaults) and stress induced fractures were responsible for thehangingwall instability at the then Western Deep Levels goldmine. Van Proctor (1978) mentioned the tendency for stressinduced fractures in the quartzite hangingwall to followquartzite filled joints. Besides this information, it appearsthat no other published information on joint properties inSouth African gold mines is available, in spite of theirimportant influence on underground stability. It also appearsthat there is no systematic measurement of jointing carriedout on gold mines as input to stability evaluation and supportdesign.
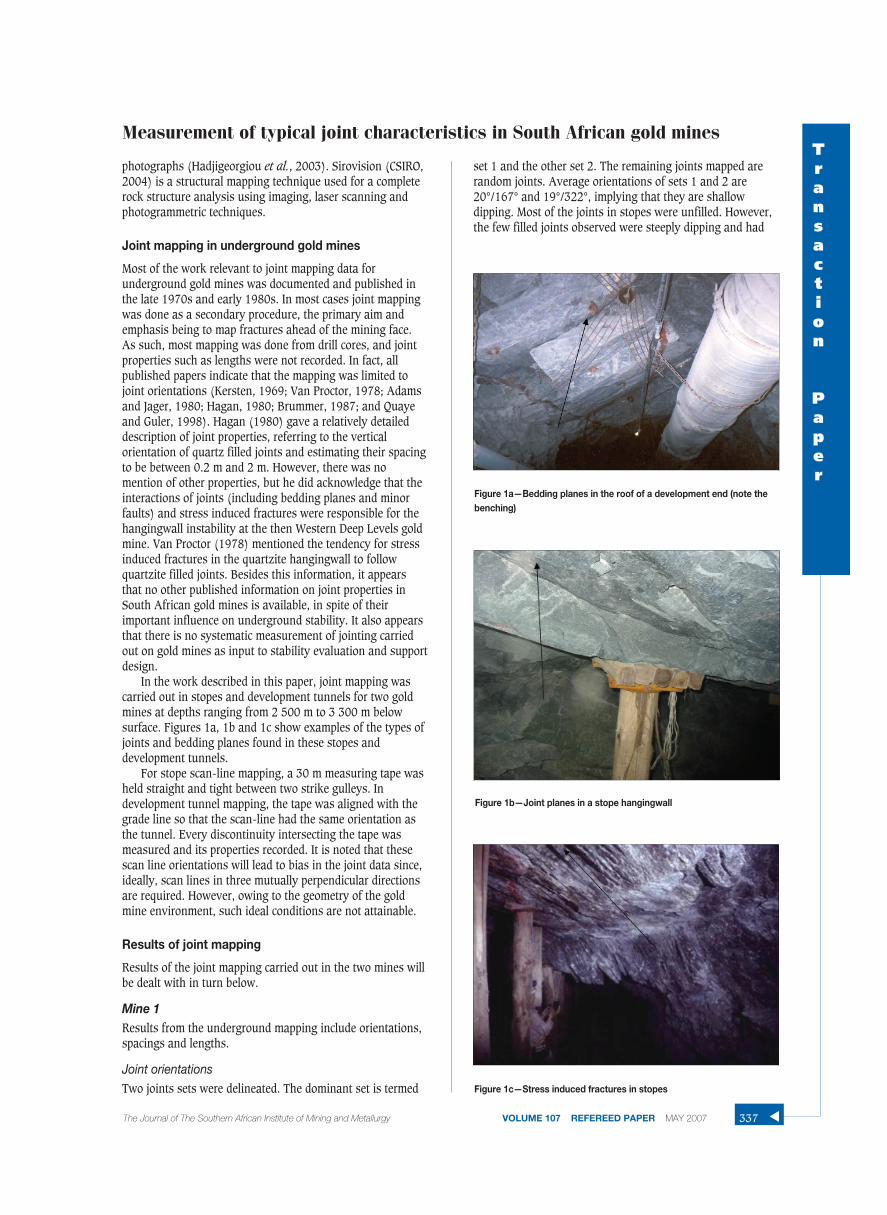
In the work described in this paper, joint mapping wascarried out in stopes and development tunnels for two goldmines at depths ranging from 2 500 m to 3 300 m belowsurface. Figures 1a, 1b and 1c show examples of the types ofjoints and bedding planes found in these stopes anddevelopment tunnels.
For stope scan-line mapping, a 30 m measuring tape washeld straight and tight between two strike gulleys. Indevelopment tunnel mapping, the tape was aligned with thegrade line so that the scan-line had the same orientation asthe tunnel. Every discontinuity intersecting the tape wasmeasured and its properties recorded. It is noted that thesescan line orientations will lead to bias in the joint data since,ideally, scan lines in three mutually perpendicular directionsare required. However, owing to the geometry of the goldmine environment, such ideal conditions are not attainable.
Results of joint mapping
Results of the joint mapping carried out in the two mines willbe dealt with in turn below.
Mine 1Results from the underground mapping include orientations,spacings and lengths.
Joint orientationsTwo joints sets were delineated. The dominant set is termed
set 1 and the other set 2. The remaining joints mapped arerandom joints. Average orientations of sets 1 and 2 are20°/167° and 19°/322°, implying that they are shallowdipping. Most of the joints in stopes were unfilled. However,the few filled joints observed were steeply dipping and had
Measurement of typical joint characteristics in South African gold minesTransaction
Paper
337The Journal of The Southern African Institute of Mining and Metallurgy VOLUME 107 REFEREED PAPER MAY 2007 ▲
Figure 1a—Bedding planes in the roof of a development end (note thebenching)
Figure 1b—Joint planes in a stope hangingwall
Figure 1c—Stress induced fractures in stopes

Measurement of typical joint characteristics in South African gold mines
rough quartzite as the filling material, with a thicknessranging between 2 cm and 5 cm. Stress fractures wereobserved to follow the direction of quartz filled joints. Thisalignment of stress induced fractures parallel to quartz filledjoints was also observed by Van Proctor (1978) duringfracture mapping in Doornfontein Gold Mine.
Statistical distributions of joint orientations wereobserved to be normal, as shown in Figure 2 for joint set 1 (acomparison between means and medians indicated a smalldifference between the two, which is a characteristic featureof a normal distribution). The results correspond with theconclusions of most researchers about joint orientation distri-butions.
A single shallow dipping dominant joint set occurs indevelopment tunnels, which represents a cluster of beddingplanes. Quite a few of these bedding planes are filled, usuallywith a phyllonite or quartzite infill approximately 2 to 3 cm inthickness. The phyllonite infill is soapy and very smooth.Failure observations in tunnels indicated that failures mostcommonly result from a combination of these bedding planesand stress induced fractures.
Joint spacings and lengths
An example of the results of analyses of the statistical distri-butions of measured joint spacings is shown for set 1 inFigure 3.
Discussion of results
A statistical analysis of hangingwall and footwall jointproperties confirms a normal distribution for orientation, anda negative exponential distribution for trace lengths. Bothnegative exponential and lognormal distributions can befitted for spacings. Only a single joint set is delineated infootwall development tunnels and these joints are thebedding planes. Most of them are not filled and the few thatare generally have a soapy phyllonite filling material. Thebedding planes showed consistent statistical characteristics,with their orientation distributions being nearly ideal.
Two joint sets are found in stope hangingwalls. Both setsare shallow dipping, but they have opposing dip directions.
Stress induced fractures in the hangingwall were moreclosely spaced (5–15 cm) than footwall fractures (30–40 cm)observed in the development tunnel. Combinations of steeplydipping stress induced fractures and the shallow dippinghangingwall joints are the main cause of rock falls in stopes.The hangingwall joints have quartzite as their filling material.
Hangingwall joints do not show the same level of statisticaluniformity as the joints in development ends (footwall). Thiscan be partly attributed to the fact that bedding planesgenerally show more conformity and persistence than otherjoints. Also, in development mapping there is a longermapping span (continuous) available, while in stopehangingwall mapping, the mapping length is limited to astope face length of 30 m. Table I below gives an overallsummary of results.
Mine 2
Joint orientations, spacings and lengths
The analysis of results followed the same procedure as abovefor Mine 1.
▲
338 MAY 2007 VOLUME 107 REFEREED PAPER The Journal of The Southern African Institute of Mining and Metallurgy
Figure 2—Distribution of hangingwall set 1 dip angles
Figure 3—Set 1 spacing in the hangingwall lava showing both thenegative exponential and lognormal probability distributions
Table I
Overall joint set data for Mine 1
Hangingwall lavaLocation Set Orientation Spacing Semi trace length
(dip/dip direction)
A 1 23/170 2.5 22 12/05 3.4 2
B 1 20/325 6.2 3.5
C 1 27/156 6.2 5.32 50/154 2.5 0.63 77/336 2.4 1.3
D 1 51/218 5.2 3.92 10/2533 69/564 88/136
Overall 1 20/170 3.6 22 19/322 5 2.5
Random* 65–85/160–200 1.9 1.6
Footwall
E 1 25/131 5 2
F 1 28/1512 28/315
G 1 3/123
Overall 1 28/130 4.3 3.3
Random* 60–80/140–200 5 2.6
*Random representation of random joints

The dominant joint set (set 1) is a steeply dipping(88°/292°) quartz filled joint set. The quartzite infillthickness ranges between 1 cm and 5 cm. Set 2 joints areshallow dipping (26°/186°). Minor sets (joint sets 3 and 4)are probably an extension of set 1. However, in the analysisof other joint properties such as spacing and length, set 1 andthe minor sets (3 and 4) are combined.
Jointing in footwall tunnels for Mine 2 is similar in manyaspects to that of Mine 1. It is characterized by a dominantshallow dipping bedding plane set, and the random jointsmake up about 45% of the joints (compared with 37% forMine 1).
Statistical distributions for spacings and lengths demon-strated similar trends to those of Mine 1.
Discussion of results
Two sets are delineated in the quartzite hangingwall. Of thetwo, a steeply dipping and quartzite filled joint set is the mostdominant, while the less dominant one is shallow dipping.The interaction of these two sets with random joints andstress induced fractures results in the formation of unstableblocks in stope hangingwalls. A negative exponential distri-bution was fitted to joint lengths and both exponential andlognormal distributions could be fitted to joint spacings. 60%of hangingwall joints were random compared with about 45%encountered in the footwall. Footwall joints (bedding planes)are usually unfilled and their properties demonstrate a closestatistical uniformity. Table II below is a summary of jointproperties for Mine 2.
Comparison of data from the two mines
A comparison of the joint mapping results from the twomines reveals the following:
➤ From the numbers of random joints mapped in the twohangingwalls it can be concluded that in thin reef goldoperations, about 60% of the joints are random
➤ Both mines have shallow dipping joint sets in thehangingwall
➤ Footwall joints in both mines were consistent in theircharacteristics and gave nearly ideal statistical distrib-utions. These footwall joints/bedding planes areusually unfilled, although in Mine 1 some beddingplanes were observed to contain a soapy phyllonitefilling material. Those in Mine 2 are not filled.
➤ Random joints in the footwall make up about 40% ofthe joints. In both the hangingwall and footwall,random joints are usually steeply dipping. With thisorientation, random joints increase the likelihood ofunstable block formation, hence enhancing theprobability of occurrence of rock falls.
Use of the joint set statistical data to determineprobabilities of occurrence of rock falls
The availability of measured joint properties in the minesprovides the opportunity to use these data for engineeringpurposes, namely, the quantification of the probabilities ofoccurrence of potentially unstable rock blocks of varioussizes. Two such approaches will be dealt with.
Haines (1984) described a two-dimensional technique forthe generation of joint traces using statistical distributions ofjoint properties obtained from field mapping data. Thesuperimposition of an excavation geometry onto the jointtraces allows potentially unstable block geometries to beidentified. This interpretation is a manual process which,though time consuming, provides a very good ‘feel’ for therock mass. Repetition of this process many times then allowsthe probability of occurrence of potentially unstable blocks tobe determined. Similarly, the probabilities of occurrence ofpotentially unstable blocks of certain sizes (both area andvolume) and, of particular relevance here, of the height ofrock fall, can be determined. The application of this procedurehas been described by Stacey and Haines (1984), Butcher(2000) and Stacey et al. (2005) and has been shown toprovide satisfactory results. It therefore provides a powerfultool for the analysis of potential stability in gold mine stopesusing measured joint data, and this application is describedbelow.
Another example of probabilistic three-dimensionalmodelling tools in jointed rocks is JBlock, developed byEsterhuizen (2003). JBlock was used simulate the occurrenceof keyblocks in excavation hangingwalls. Simulated blockswere then used to determine the likelihood of failure fordifferent support layouts in hangingwall excavations.
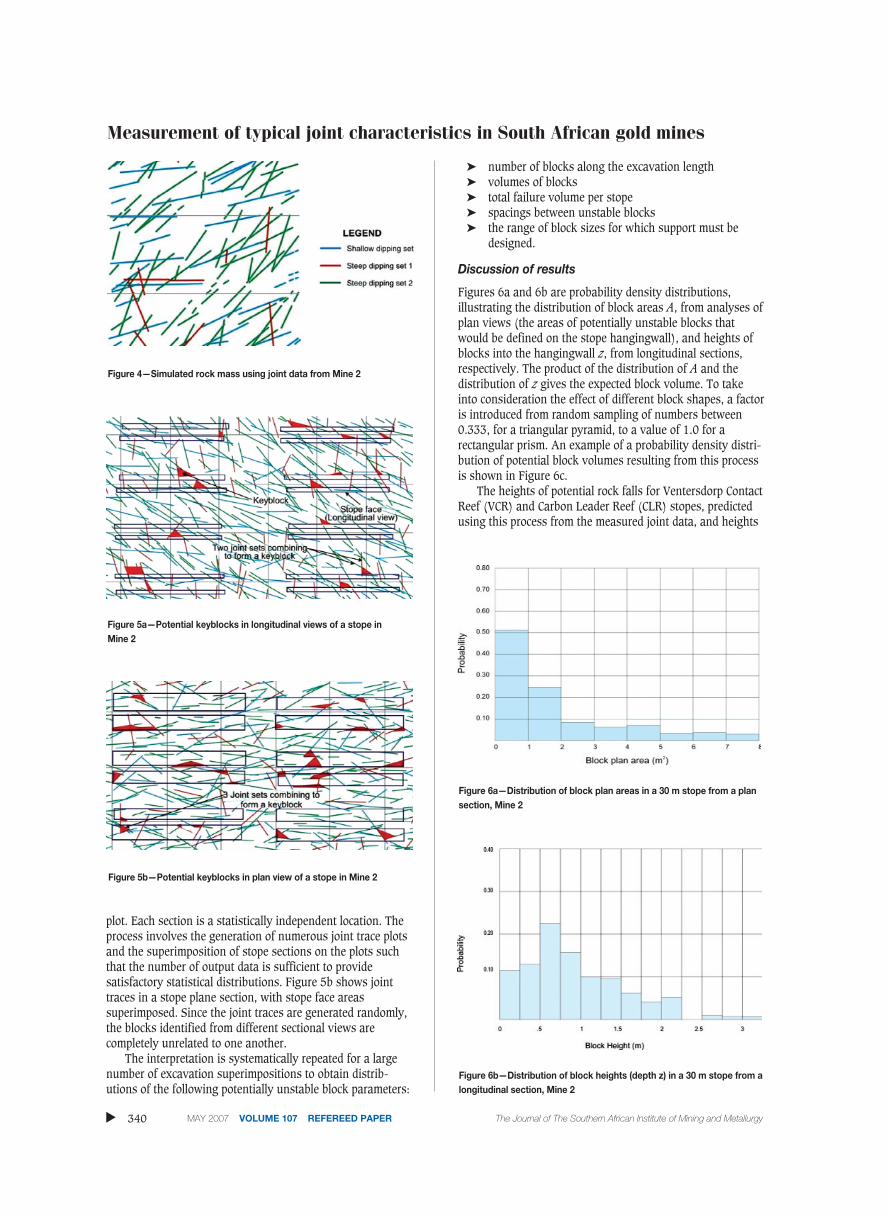
Figure 4 illustrates a simulated joint trace model of therock mass using measured joint data for the Mine 2hangingwall. The different colours in the trace modelrepresent different joint sets.
Excavation geometries (in plan and section) aresuperimposed on simulated trace models and potentiallyunstable wedges and blocks identified. The identification ofkeyblocks involves visual analysis of the interaction betweenthe excavation geometry and the trace model and then identi-fication of joints that intersect, in a critical manner, to formpotential keyblocks. In Figures 5a ‘vertical’ sections throughstopes are shown superimposed on the joint trace plot. Manysuch sections can be superimposed on a single joint trace
Measurement of typical joint characteristics in South African gold minesTransaction
Paper
The Journal of The Southern African Institute of Mining and Metallurgy VOLUME 107 REFEREED PAPER MAY 2007 339 ▲Table II
Overall joint set data for Mine 2
Hangingwall quartziteLocation Set Orientation Spacing Semi-trace length
(dip/dip direction)
H 1 87/291J 2 22/175K 2 19/216 L 1 86/287Overall 1 88/292 5. 2.3
2 26/186 3.9 3.6Random* 40–80/150–180 2.1 2.4
Quartzite footwallM 1 28/130N 1 30/174P 1 28/151
2 28/315Q RandomOverall 1 23/139 3.9 4
Random* 30–50/170–190 3.9 2.6
*Random representation of random joints
Measurement of typical joint characteristics in South African gold mines
plot. Each section is a statistically independent location. Theprocess involves the generation of numerous joint trace plotsand the superimposition of stope sections on the plots suchthat the number of output data is sufficient to providesatisfactory statistical distributions. Figure 5b shows jointtraces in a stope plane section, with stope face areassuperimposed. Since the joint traces are generated randomly,the blocks identified from different sectional views arecompletely unrelated to one another.
The interpretation is systematically repeated for a largenumber of excavation superimpositions to obtain distrib-utions of the following potentially unstable block parameters:
➤ number of blocks along the excavation length➤ volumes of blocks➤ total failure volume per stope➤ spacings between unstable blocks➤ the range of block sizes for which support must be
designed.
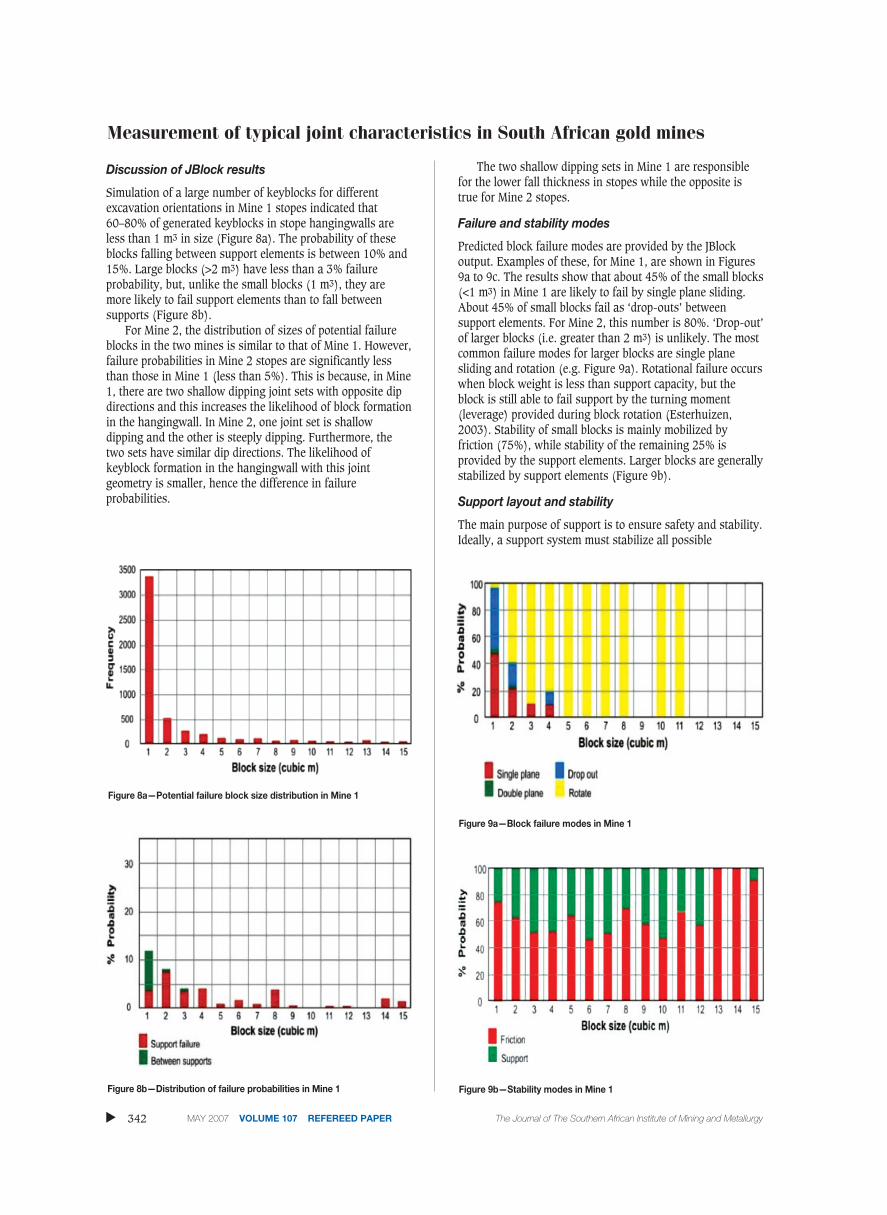
Discussion of results
Figures 6a and 6b are probability density distributions,illustrating the distribution of block areas A, from analyses ofplan views (the areas of potentially unstable blocks thatwould be defined on the stope hangingwall), and heights ofblocks into the hangingwall z, from longitudinal sections,respectively. The product of the distribution of A and thedistribution of z gives the expected block volume. To takeinto consideration the effect of different block shapes, a factoris introduced from random sampling of numbers between0.333, for a triangular pyramid, to a value of 1.0 for arectangular prism. An example of a probability density distri-bution of potential block volumes resulting from this processis shown in Figure 6c.
The heights of potential rock falls for Ventersdorp ContactReef (VCR) and Carbon Leader Reef (CLR) stopes, predictedusing this process from the measured joint data, and heights
▲
340 MAY 2007 VOLUME 107 REFEREED PAPER The Journal of The Southern African Institute of Mining and Metallurgy
Figure 4—Simulated rock mass using joint data from Mine 2
Figure 5a—Potential keyblocks in longitudinal views of a stope in Mine 2
Figure 5b—Potential keyblocks in plan view of a stope in Mine 2
Figure 6a—Distribution of block plan areas in a 30 m stope from a plansection, Mine 2
Figure 6b—Distribution of block heights (depth z) in a 30 m stope from alongitudinal section, Mine 2

from empirical data, are shown in Figures 7a and 7b. It canbe seen that the agreement between the predicted thicknessat the 95% probability and the corresponding published dataon empirically determined thicknesses is good for the VCRstopes (1.8 m predicted, 1.4 m empirically determined byRoberts, 1999). In this case there is a substantial set ofempirical data (50 rock falls). The summarized updatedempirical data presented by Daenhke et al. (2001) indicate aheight for rock falls of 1.2 m and a height for rockbursts of1.8 m. The joint trace model interpretation above does notdifferentiate between static and dynamic conditions, simplypredicting potentially unstable blocks. Therefore, theagreement between observed and predicted heights of falls isexcellent. For the CLR stopes, a 1.0 m thickness is empiricallydetermined (Roberts, 1999) and 2.2 m is predicted. In thiscase, however, the empirical data set is limited, containingonly 23 rockfalls, and its validity is therefore somewhatdoubtful. Updated empirical data from Daehnke et al. (2001)indicate a height of fall of 2.2 m for rockburst conditions.Again therefore, there is excellent agreement between theempirical data and the joint trace model prediction.
Although the method described above may appear to becumbersome, it provides a ‘feeling’ for the rock mass thatwould not be obtained were the method more of a ‘black box’approach. The design parameters obtained can be used forsupport design in new areas and in situations in which thereare inadequate records of actual rock falls, particularlyconsidering the comparable results obtained. This wouldrequire real joint data to be obtained in advance for such newareas as input to the joint trace analysis. In conclusion, themethod can be used together with existing support designcriteria to improve the support of underground excavations.
The next section demonstrates the use of statistical dataon joint characteristics to obtain some of the aboveparameters and other additional parameters that could not beobtained from the joint trace modelling tool.
Excavation stability analysis using the JBlockprogram
JBlock (Esterhuizen, 2003) is used both in the probabilisticassessment of gravity driven rockfalls and the evaluation ofsupport effectiveness. The analyses use joint set statistical
data to generate potential keyblocks in the hangingwall andthese are then randomly ‘placed’ in an excavation with aknown support element layout. The program then determineswhether the identified keyblock will cause failure of thesupport elements and the corresponding failure mode, or fallbetween them (Esterhuizen, 2003).
The process is repeated many times and the output givesa plot of the probability of failure versus the unstable blockvolume. Using this method, simulations were carried out withdifferent support elements commonly used in gold minesranging from point supports (elongates) to line support(point supports with headboards). The simulation runs werecarried out for a predefined area within 15 m from the stopeface and five thousand blocks were generated in eachsimulation. The generated blocks were saved and used in thereanalysis of excavation stability with each support systemand support layout. The variation of support elements andlayouts was applicable for the first three rows of supportelements.
Measurement of typical joint characteristics in South African gold minesTransaction
Paper
The Journal of The Southern African Institute of Mining and Metallurgy VOLUME 107 REFEREED PAPER MAY 2007 341 ▲
Figure 6c—Distribution of block potential failure volumes in the stope,Mine 2
Figure 7a—Comparison of rock fall thicknesses calculated using thejoint trace procedure with empirically determined fall thicknesses fromRoberts (1999) and Daehnke et al. (2001) for VCR stopes
Figure 7b—Comparison of rock fall thicknesses calculated using thejoint trace procedure with empirically determined fall thicknesses fromRoberts (1999) for CLR stopes
Measurement of typical joint characteristics in South African gold mines
Discussion of JBlock results
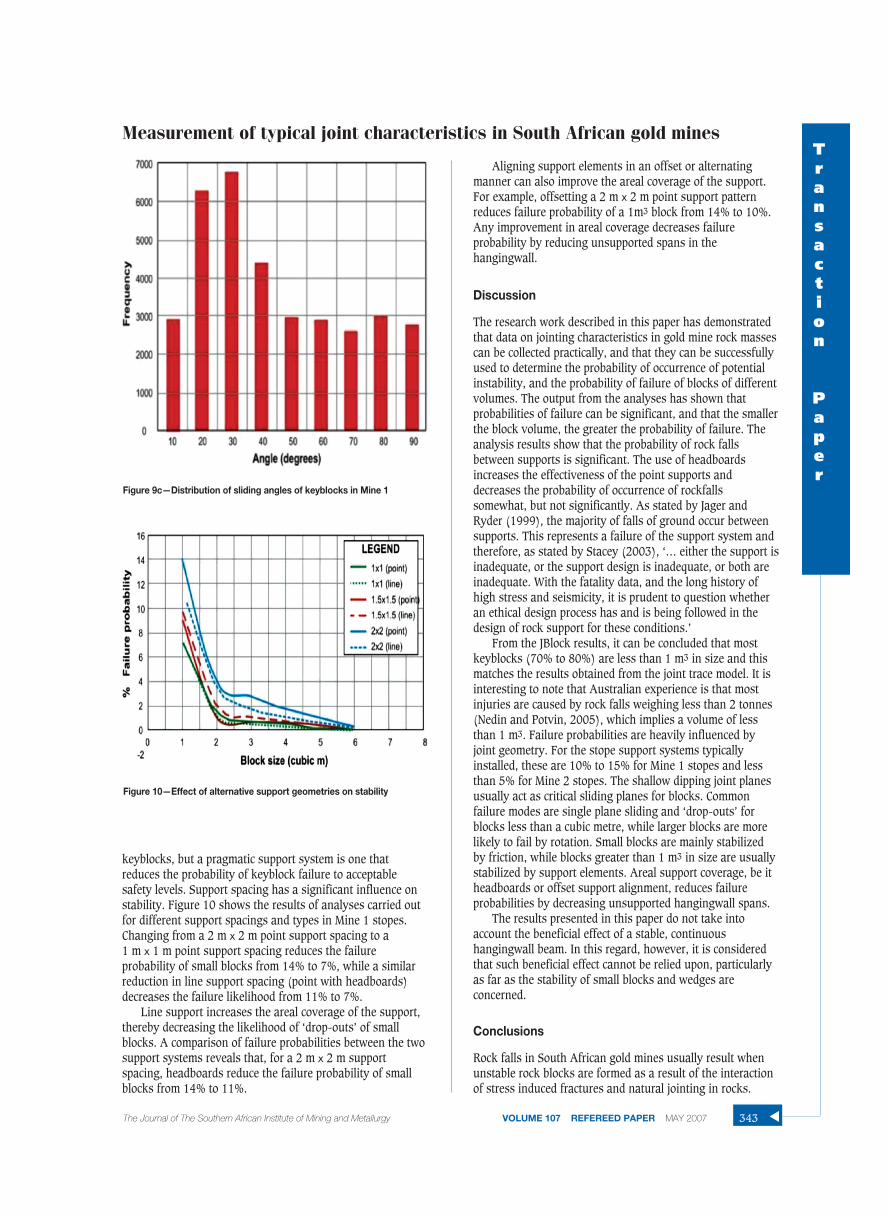
Simulation of a large number of keyblocks for differentexcavation orientations in Mine 1 stopes indicated that60–80% of generated keyblocks in stope hangingwalls areless than 1 m3 in size (Figure 8a). The probability of theseblocks falling between support elements is between 10% and15%. Large blocks (>2 m3) have less than a 3% failureprobability, but, unlike the small blocks (1 m3), they aremore likely to fail support elements than to fall betweensupports (Figure 8b).
For Mine 2, the distribution of sizes of potential failureblocks in the two mines is similar to that of Mine 1. However,failure probabilities in Mine 2 stopes are significantly lessthan those in Mine 1 (less than 5%). This is because, in Mine1, there are two shallow dipping joint sets with opposite dipdirections and this increases the likelihood of block formationin the hangingwall. In Mine 2, one joint set is shallowdipping and the other is steeply dipping. Furthermore, thetwo sets have similar dip directions. The likelihood ofkeyblock formation in the hangingwall with this jointgeometry is smaller, hence the difference in failureprobabilities.
The two shallow dipping sets in Mine 1 are responsiblefor the lower fall thickness in stopes while the opposite istrue for Mine 2 stopes.
Failure and stability modes
Predicted block failure modes are provided by the JBlockoutput. Examples of these, for Mine 1, are shown in Figures9a to 9c. The results show that about 45% of the small blocks(<1 m3) in Mine 1 are likely to fail by single plane sliding.About 45% of small blocks fail as ‘drop-outs’ betweensupport elements. For Mine 2, this number is 80%. ‘Drop-out’of larger blocks (i.e. greater than 2 m3) is unlikely. The mostcommon failure modes for larger blocks are single planesliding and rotation (e.g. Figure 9a). Rotational failure occurswhen block weight is less than support capacity, but theblock is still able to fail support by the turning moment(leverage) provided during block rotation (Esterhuizen,2003). Stability of small blocks is mainly mobilized byfriction (75%), while stability of the remaining 25% isprovided by the support elements. Larger blocks are generallystabilized by support elements (Figure 9b).
Support layout and stability
The main purpose of support is to ensure safety and stability.Ideally, a support system must stabilize all possible
▲
342 MAY 2007 VOLUME 107 REFEREED PAPER The Journal of The Southern African Institute of Mining and Metallurgy
Figure 8a—Potential failure block size distribution in Mine 1
Figure 8b—Distribution of failure probabilities in Mine 1
Figure 9a—Block failure modes in Mine 1
Figure 9b—Stability modes in Mine 1
keyblocks, but a pragmatic support system is one thatreduces the probability of keyblock failure to acceptablesafety levels. Support spacing has a significant influence onstability. Figure 10 shows the results of analyses carried outfor different support spacings and types in Mine 1 stopes.Changing from a 2 m x 2 m point support spacing to a 1 m x 1 m point support spacing reduces the failureprobability of small blocks from 14% to 7%, while a similarreduction in line support spacing (point with headboards)decreases the failure likelihood from 11% to 7%.
Line support increases the areal coverage of the support,thereby decreasing the likelihood of ‘drop-outs’ of smallblocks. A comparison of failure probabilities between the twosupport systems reveals that, for a 2 m x 2 m supportspacing, headboards reduce the failure probability of smallblocks from 14% to 11%.
Aligning support elements in an offset or alternatingmanner can also improve the areal coverage of the support.For example, offsetting a 2 m x 2 m point support patternreduces failure probability of a 1m3 block from 14% to 10%.Any improvement in areal coverage decreases failureprobability by reducing unsupported spans in thehangingwall.
Discussion
The research work described in this paper has demonstratedthat data on jointing characteristics in gold mine rock massescan be collected practically, and that they can be successfullyused to determine the probability of occurrence of potentialinstability, and the probability of failure of blocks of differentvolumes. The output from the analyses has shown thatprobabilities of failure can be significant, and that the smallerthe block volume, the greater the probability of failure. Theanalysis results show that the probability of rock fallsbetween supports is significant. The use of headboardsincreases the effectiveness of the point supports anddecreases the probability of occurrence of rockfallssomewhat, but not significantly. As stated by Jager andRyder (1999), the majority of falls of ground occur betweensupports. This represents a failure of the support system andtherefore, as stated by Stacey (2003), ‘… either the support isinadequate, or the support design is inadequate, or both areinadequate. With the fatality data, and the long history ofhigh stress and seismicity, it is prudent to question whetheran ethical design process has and is being followed in thedesign of rock support for these conditions.’
From the JBlock results, it can be concluded that mostkeyblocks (70% to 80%) are less than 1 m3 in size and thismatches the results obtained from the joint trace model. It isinteresting to note that Australian experience is that mostinjuries are caused by rock falls weighing less than 2 tonnes(Nedin and Potvin, 2005), which implies a volume of lessthan 1 m3. Failure probabilities are heavily influenced byjoint geometry. For the stope support systems typicallyinstalled, these are 10% to 15% for Mine 1 stopes and lessthan 5% for Mine 2 stopes. The shallow dipping joint planesusually act as critical sliding planes for blocks. Commonfailure modes are single plane sliding and ‘drop-outs’ forblocks less than a cubic metre, while larger blocks are morelikely to fail by rotation. Small blocks are mainly stabilizedby friction, while blocks greater than 1 m3 in size are usuallystabilized by support elements. Areal support coverage, be itheadboards or offset support alignment, reduces failureprobabilities by decreasing unsupported hangingwall spans.
The results presented in this paper do not take intoaccount the beneficial effect of a stable, continuoushangingwall beam. In this regard, however, it is consideredthat such beneficial effect cannot be relied upon, particularlyas far as the stability of small blocks and wedges areconcerned.
Conclusions
Rock falls in South African gold mines usually result whenunstable rock blocks are formed as a result of the interactionof stress induced fractures and natural jointing in rocks.
Measurement of typical joint characteristics in South African gold minesTransaction
Paper
The Journal of The Southern African Institute of Mining and Metallurgy VOLUME 107 REFEREED PAPER MAY 2007 343 ▲
Figure 9c—Distribution of sliding angles of keyblocks in Mine 1
Figure 10—Effect of alternative support geometries on stability

Measurement of typical joint characteristics in South African gold mines
Bedding planes will usually provide release planes, allowingthese blocks to fall. The importance of the natural joints andbedding planes in defining the instability has not been giventhe attention that it deserves, to the extent that there are nodocumented, published data available on joint set character-istics. This is perhaps an indication that such data do notexist on the mines. This is surprising since, to evaluaterealistically the probable dimensions of potentially unstableblocks and the probability of occurrence of rock falls, and tobe able to carry out a satisfactory design of support to caterfor the identified potentially unstable blocks, data on jointcharacteristics are essential. The work described in this paperand the joint set data that have resulted, are a contributiontowards this goal.
It has been demonstrated that measured joint data can beused successfully to determine the probability of occurrenceof rock falls and the probability of failure of stope supportdue to unstable blocks. It is considered that measured jointdata are an essential input for satisfactory design of supportfor underground stope excavations in the gold mines. It isagain recommended that such joint data should be measuredsystematically on mines so that they can be used forsatisfactory support design. The application of joint data inthe evaluation of risk is described in a companion paper, alsopublished in this volume (Stacey and Gumede, 2007).
Acknowledgements
The research described in this paper was carried out by thefirst author for an MSc Eng dissertation. The research wasfunded through a bursary provided by SIMRAC, the Safety inMines Research Advisory Committee, and this funding isgratefully acknowledged. The assistance of Tau Tona andSouth Deep Mines is appreciated.
References
ADAMS, G.R. and JAGER, A. J. Petroscopic observations of rock fracturing aheadof stope faces in deep-level gold mines, Jl S. Afr. Inst. Min. Metall., vol. 80, 1980. pp. 204–209.
BAECHER, G.B., LANNEY, N.A., and EINSTEIN, H.H. Statistical description of rockproperties and sampling, Proc. 18th U.S. Symposium on Rock Mechanics,5 C 1977. pp. 1–8.
BARTON, N.R. The shear strength of rock and rock joints, Int. J. Rock Mech.Min. Sci. and Geomech. Abstr., vol. 13, no. 9, 1976. pp. 255–279.
BEER, G., OPPIESSNIG, G., GOSLER, H., FASCHING, A., and GAICH, A. Geotechnicaldata acquisition, numerical simulation and visualization on site, Proc. 9thInt. Cong. Int. Soc. Rock Mech., Balkema, 1999. pp. 1333–1338.
BRIDGES, M.C. Presentation of fracture data for rock mechanics. 2nd Australia—New Zealand Conf. on Geomechanics, Brisbane, 1975. pp. 144–148.
BRUMMER, R.K. Fracturing and deformation at the edges of tabular gold miningexcavations and the development of a numerical model describing suchphenomena, PhD thesis, Rand Afrikaans University. 1987.
BUTCHER, R.J. A modelling method for predicting block cave cavability, initialfragmentation and production tonnage at a scoping study level, MScEngThesis, University of the Witwatersrand. 2000.
CALL, R.B., SAVELY, J., and NICHOLAS, D.E. Estimation of joint set characteristicsfrom surface mapping data, Proc. 17th U S Symposium on RockMechanics, 1976, pp. 2B2-1–2B2-9.
CSIRO www.em.csiro.au/mine_environment_imaging/capabilities/ 2004.DAEHNKE, A., VAN ZYL, M., and ROBERTS, M.K.C. Review and application of stope
support design criteria, Jl S. Afr. Inst. Min. Metall., vol. 101, 2001. pp. 135–164.
DME Guideline for the compilation of a mandatory Code of Practice to combatrock fall and rockburst accidents in tabular metalliferous mines, Ref. No.DME 16/3/2/1-A3, Last Revision Date 1 February 2002,www.dme.gov.za. 2007.
DU, S.J., ESAKI, T., MITANI, Y., and ZHOU, G.Y. A numerical simulation andvisualisation of shear process of rock masses by using GeographicInformation Systems, Rock Mechanics in National Interest, vol. 1, Proc.38th U.S. Rock Mechanics Symposium, 2001. pp. 895–900.
EINSTEIN, H.H., BAECHER, G.B., and O’REILLY, K.J. The effect of discontinuitypersistence on rock slope stability, International Journal of RockMechanics and Mining Science, vol. 20, 1983. pp. 227–236
ESTERHUIZEN, G.S. JBLOCK user manual, Pretoria. 2003.FENG, Q., STEPHANSSON, O., and BOBERG, A. Fracture mapping at exposed rock
faces by using close range digital photogrammetry and geodetic totalstation, Rock Mechanics in National Interest, vol. 1, Proc. 38th U.S. RockMechanics Symposium, 2001. pp. 829–836.
GUMEDE, H. Development of data sets on joint characteristics and considerationof associated instability for a typical South African gold mine, MSc EngDissertation, University of the Witwatersrand. 2006.
HADJIGEORGIOU, J., LENNY, F., COTE, P., and MALDGUE, X. Evaluation of ImageAnalysis Algorithms for constructing discontinuity trace maps, RockMechanics and Rock Engineering, vol. 36, 2003. pp. 163–179.
HAGAN, T.O. A photogrametric study of mining induced fracture phenomenaand instability on a deep level long wall stope face with variable laglengths, MSc thesis, Rand Afrikaans University. 1980.
HAINES, A. The application of generated rock mass discontinuity patterns, Proc.8th Regional Conference for Africa on Soil Mechanics and FoundationEngineering, Harare, Zimbabwe, 1984. pp. 13–21.
HARRISON. J.P. Improved analysis of rock mass geometry using mathematicaland photogrammetric methods, PhD thesis, Imperial College, London.1993.
JAGER, A.J. and RYDER, J.A. A Handbook on Rock Engineering Practice forTabular Hardrock Mines, Safety in Mines Research Advisory Committee,South Africa. 1999.
KERSTEN, R.W.O. Structural analysis of fractures around undergroundexcavations on a Witwatersrand Gold Mine, MSc thesis, PretoriaUniversity, Pretoria. 1969.
KULATILAKE, P.H.S.W., CHEN J., TENG, J. PAN, G., and SHUFANG, X. Discontinuitynetwork modelling of the rock mass around a tunnel close to the proposedpermanent shiplock area of the three gorges dam site in China, Proc. 35thU.S. Rock Mechanics Symposium, Daemen and Schultz (eds.), 1995. pp. 807–812.
NEDIN, P. and POTVIN, Y. Australian Rockfall Research Phase II, Minerals andEnergy Research Institute of Western Australia, Australian Centre forGeomechanics, 2005. 55 pp.
NICHOLAS, D.E. and SIMS, D.B. Collection and using geological data for slopedesign, International conference on slope stability in surface mining,Hustrulid, McCarter and Van Zyl (eds.), SMME, 2000. pp. 11–21.
PRIEST, S.D. and HUDSON, J.A. Estimation of discontinuity spacing and tracelength using scan line surveys, Int. J. Rock Mech. Min. Sci. & Geomech.Abstr., vol. 18, 1981. pp. 183–197.
PRIEST, S.D. and HUDSON, J.A. Discontinuity spacings in rocks, Int. J. Rock Mech.Min. Sci., vol. 13, 1976. pp. 135–148.
QUAYE, G.B. and GULER, G. The importance of both geological structures andmining induced stress fractures on the hangingwall stability in a deeplevel gold mine, Jl S. Afr. Inst. Min. Metall., vol. 98, no. 2, 1998. pp. 157–162.
ROBERTS, M.K.C. The design of support systems in South African gold andplatinum mines, PhD thesis, University of the Witwatersrand, 1999. 173 p.
ROBERTSON, A.M. The determination of the stability of slopes in jointed rockwith particular reference the determination of strength parameters andmechanics of failure, PhD thesis, University of Witwatersrand. 1977.
STACEY, T.R. Potential rockfalls in conventionally supported stopes—a simpleprobabilistic approach, Jl S. Afr. Inst. Min. Metall., vol. 89, no. 4, April1989, pp. 111–115.
STACEY, T.R. Rock engineering—good design or good judgement? Jl S. Afr. Inst.Min. Metall., vol. 103, no. 7, 2003. pp. 411–421.
STACEY, T.R. and GUMEDE, H. Evaluation of risk of rock fall accidents in goldmine stopes based on measured joint data, Jl S. Afr. Inst. Min. Metall., vol. 107, no. 5, 2007. pp. 345–350.
STACEY, T.R., WESSELOO, J., and BELL, G. Predicting the stability of rockpassesfrom the geological structure, Jl S. Afr. Inst. Min. Metall., vol. 105, no. 11,2005. pp. 803–808.
STEFFEN, O.K.H., KERRICH, J.E., and JENNINGS, J.E. Recent developments ininterpretation of data from joint surveys in rock masses, Proc. 6thRegional Conference on Soil Mechanics and Foundation engineering,Durban, vol. 2, 1975. pp. 17–26.
VAN PROCTOR, R.J. An investigation of the nature and mechanism of rockfracture around long wall faces in a deep gold mine, MSc thesis, Universityof the Witwatersrand. 1978.
WALLIS, P.F. and KING, M.S. Discontinuity spacings in a crystalline rock, Int. J.Rock Mech. Min. Sci., vol. 17, 1981. pp. 63–66. ◆
▲
344 MAY 2007 VOLUME 107 REFEREED PAPER The Journal of The Southern African Institute of Mining and Metallurgy