Embed Size (px)
Citation preview

Measurement of BB Angular Correlations based on Secondary Vertex Reconstruction
in Proton-Proton Collisions at √s = 7 TeV
Lukas WehrliETHZ PhD Defense
19.8.2011

• Introduction to Beauty Physics and Motivation• The LHC and the CMS experiment• B-tagging and Vertex Reconstruction• Inclusive Vertex Finder• B anti-B Correlation Analysis• Systematic Uncertainties• Results• Conclusion and Outlook
Outline
1

• Standard Model: elementary particles (quarks, leptons) and fundamental interactions(weak, electromagnetic, strong)
• Quantum Chromodynamics: Quantum field theory of strong interaction. Confinement: free quarks not observed, quarks form hadrons.
• Beauty physics: b quarks or hadrons containing b quarks involved.
Standard Model of Particle Physics
2
Weak: W+, W-, Z0Weak: W+, W-, Z0
Electromagnetic: Electromagnetic:
Strong: gluonsStrong: gluonsQuarks
Charged
Leptons
Neutral L
eptons
u c td s b
e
e
Weak: W+, W-, Z0Weak: W+, W-, Z0
Electromagnetic: Electromagnetic:
Strong: gluonsStrong: gluonsQuarks
Charged
Leptons
Neutral L
eptons
u c td s b
e
e

Beauty Physics at LHC
• Large bb cross section (b produced in pairs through strong interaction) studies with early data possible.
• b quarks are a key ingredient at LHC as signal (top, low mass Higgs, new physics). as background to new physics searches.
• Measure b production (cross section). bb pair dynamics.
3

Proton-Proton Scattering
4
b
b
Hard Scattering
B
B
Hadronization
b-jetb-jet
b-jetb-jet
Bunches of particles: Jets
Protons
Measured in detector

Angular CorrelationsBB production can be divided into three mechanisms:
• Flavor Creation (FCR)• Flavor excitation (FEX)• Gluon splitting (GSP)
Angular correlations allow to study different productions: FCR: Momentum conservation requires b/bto be back-to-back in azimuthal angle.GSP: b/b produced with small opening angle. Need to find B hadrons with good
angular resolution
R between B hadrons
LO NLO
FCRGSP
BB production and angular correlation study: Dynamics of hard scattering process within pQCD. Test of pQCD LO and NLO cross sections. Hadronization properties of heavy quarks.
5
22 R

Large Hadron Collider
6
SPS(7km)
LHC(27km)
CMS
LHCbALICE
ATLAS
Machine parameter Design Achieved
Center-of-mass energy (TeV) 14 7
Inst. Luminosity (cm-2s-1) 1034 2.1 * 1033
Protons per bunch 1.15*1011 1.25*1011
Average Pile Up events 25 10
• Proton-proton collisions since 2009• 27 km long ring tunnel (from LEP)• 4 experiments• Nov. 23, 2009:
first collisions at 900 GeV• Since March 30, 2010:
collisions at 7 TeV• Integrated Luminosity (CMS): 2.4 fb-1

Compact Muon Solenoid
7
Steel return yoke (2T) instrumented with Muon spectrometer: Drift Tube Chambers, Cathode Strip Chambers, Resistive Plate Chambers
Data reduction (not all collision events stored):Trigger: Level 1: 40‘000 kHz 100 kHz High-Level-Trigger: 100 kHz 100 Hz
Diameter: 15 m Length: 21.6 m Weight: 12000 tMagnet: 3.8 T
Tracking: Silicon Strips and Pixels
Calorimeter: ECAL: PbWO4 crystals + preshowerHCAL: Brass absorber and scintillators

p p collisionB hadronsOther (D) hadrons: cylindrical coordinates: polar angle: pseudorapidity
B hadrons are long living particles (cabout 500m)…8
B Correlation Analysis
Goal: Measure between two B hadrons. (or , angle in 3D).22 R

B Correlation Analysis
9
B hadrons???B jets???

• Identify jets originating from b quarks.
• Associate real number, a “discriminator” d to each jet.
• Different algorithms exploit long life time of B, semi-leptonic decay mode, high B mass,…
• Input: Jets, Tracks, Primary Vertex, Leptons.
• For first data: Simple Secondary Vertex (SSV)Track Counting (TC)
• SSV: Reconstructs the B decay vertex using an adaptive vertex fitter. Vertex decay length significance sSV used for d.
B-tagging
10
0.67
0.22
0.78
0.16 Discriminators
Jets
b-tagging
PVSV
dsv

2.513.04
-1
-1
-1
-1
-1
-1
11
B Correlation Analysis
-1: no vertex reconstructed >2: likely a B jet
B hadrons

Small Opening Angles
SV
PV
SV
SVSV
PV
large opening angle small
22 R
12
2 B in one Jet
• For small opening angle between B in pair: both B merged into one single jet.
• GSP contribution expected to be large.
Measure angle between B flight directions(not jets). Flight direction: Vector from primary to
secondary Vertex.

Primary Vertex
Secondary Vertices(from B hadron decays)
13
B Correlation Analysis

Primary Vertex
Secondary Vertices(from B hadron decays)
Angle
13
B Correlation Analysis

Two steps: - Vertex finding (cluster tracks with common origin)
- Vertex fitting (computation of best vertex parameters).
Adaptive Vertex Reconstructor (AVR):•Use all tracks for finding PV. •One cluster of tracks per jet (R < 0.3 between track and jet axis).
Adaptive Vertex Fitter (AVF): •Iterative re-weighted Kalman Filter.•Outlying tracks down-weighted.
Vertex Reconstruction
14
AVRAVF

Standard Vertex Finder (AVR): •Clusters tracks in cone around jet axis (R = 0.3).•Secondary vertices reconstructed with high efficiency.
Jets containing two B hadrons: •AVF used iteratively, reconstruction of several vertices
per cluster possible. •But: jet direction is no good estimate for B flight direction.
Need vertex finder independent of any jet direction: „Inclusive Vertex Finder“.
Jets with Two B
15
standard track acceptance cone

• Inclusive Vertex Finder (IVF) does not use jet directions as input, designed to be able to reconstruct both B also for small bb separation angle.
• Algorithm: Seeds: start with good tracks with high impact parameter and impact parameter significance. Cluster tracks compatible to make a vertex with the seed track. Use AVF and AVR for vertex fitting. Clean up duplicates.
• IVF can be used also in other analyses (e.g. Higgsbb).
Inclusive Vertex Finder
16
1. Seed tracks with high IP significance
PV
2. Cluster tracks compatible with seed
3. Fit Secondary Verticesusing the AVF and AVR

Analysis OverviewTrigger & event selection
•Single jet trigger above 15, 30 and 50 GeV. •Hardest anti-kt jet: ||<3.0, corrected pT such
that HLT efficiency > 99%: 56, 84, 120 GeV.
Analysis strategy•Apply cuts to select B vertices.
•Combine vertices from BDX decays into a single B candidate.
•Select events with exactly two B candidates (scalar mass sum > 4.5 GeV).
160, 380 and 1038 events in total for three leading jet pT regions
BB
PV
DB
PV
COMBINE KEEP
p
17

Resolution and Efficiency
18
• RVV versus RBB (left) RVV - RBB and (right)
• Below 4 % of events out of diagonal (|RVV-RBB | > 0.2)
• R resolution (0.02) much smaller than bin width (0.4).
• Calculate efficiency and purity on MC as function of leading jet pT and R and apply correction bin-wise.
Leading jet pT > 84 GeV
BB
SV
SV
RBB
Rvv

Measured B Candidate Properties
19
• Vertex mass (left) and 3D flight distance significance (right)
• All selection cuts applied (apart from those on shown quantities)
• Simulation normalized to number of data events
• Very nice agreement between MC and data
• Small excess in data mass distribution at 1.7 GeV (16 %) larger charm contribution in data?
Leading jet pT > 84 GeV

• Uncertainties on the shape and on the absolute normalization treated separately.
• Normalization uncertainties large (43 %). Dominant contribution: uncertainty on efficiency of B hadron reconstruction (20 % for one vertex, estimated from standard b-tagging efficiency studies 40 % for two vertices).
• Shape uncertainties around 16 %. Dominant contributions from MC statis-tical uncertainty (13 %) and uncertainty on phase space correction (8 %).
• Statistical and systematic uncertainties added in quadrature.
• Possible way to reduce normalization uncertainties: Comparison of SV based analysis to jet based analysis for well separated B hadrons (R > 1.0).
Systematic Uncertainties
20
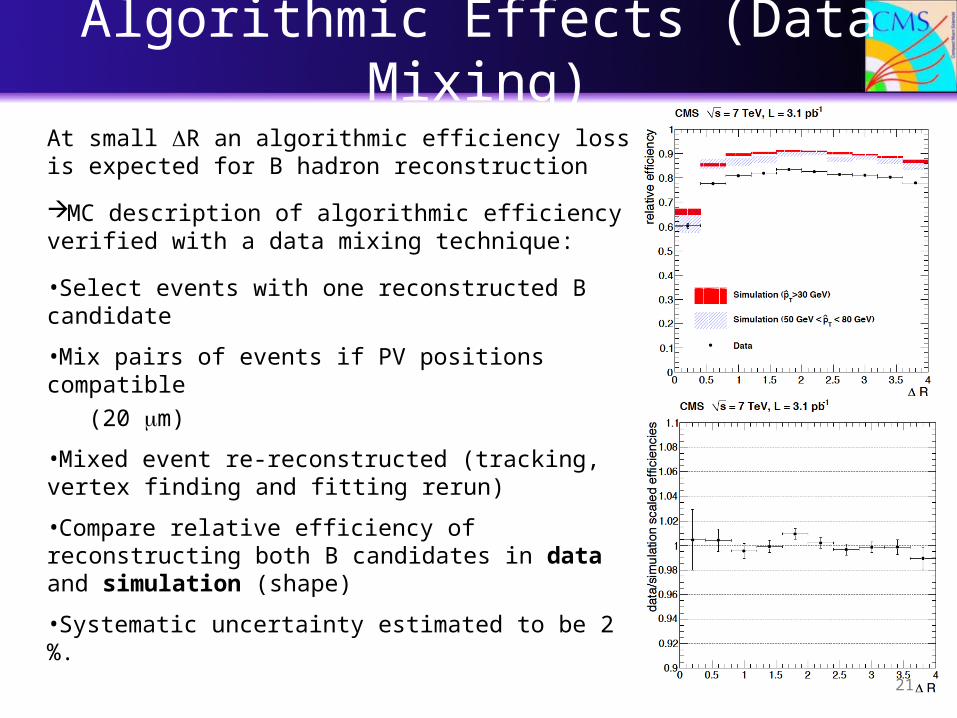
At small R an algorithmic efficiency loss is expected for B hadron reconstruction
MC description of algorithmic efficiency verified with a data mixing technique:
•Select events with one reconstructed B candidate
•Mix pairs of events if PV positions compatible (20 m)
•Mixed event re-reconstructed (tracking, vertex finding and fitting rerun)
•Compare relative efficiency of reconstructing both B candidates in data and simulation (shape)
•Systematic uncertainty estimated to be 2 %.
Algorithmic Effects (Data Mixing)
21
Results
22
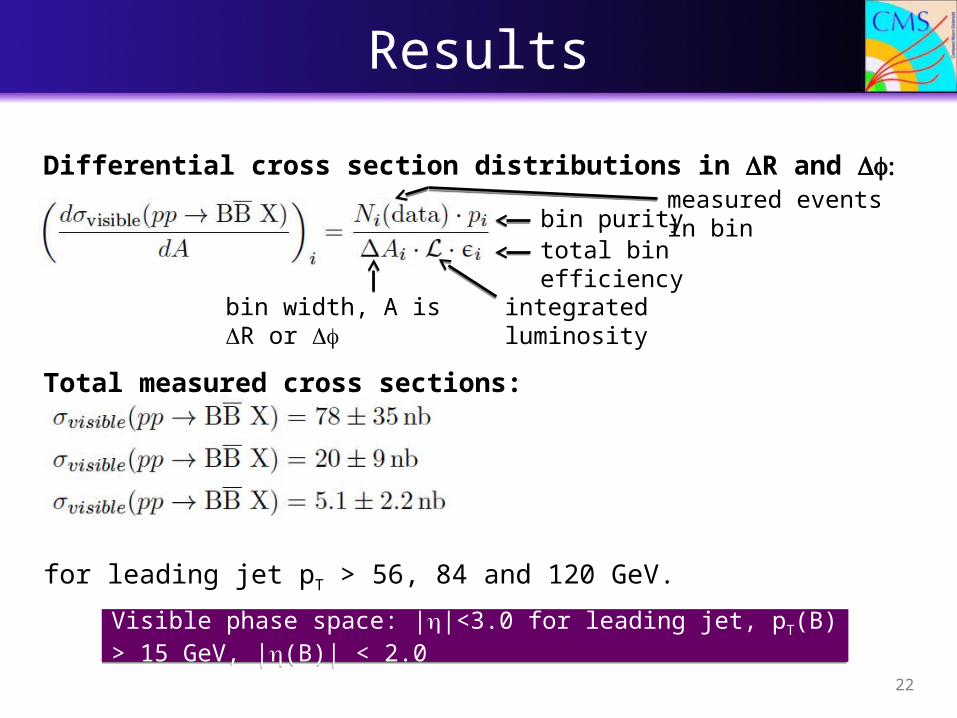
Differential cross section distributions in R and
Total measured cross sections:
for leading jet pT > 56, 84 and 120 GeV.
Visible phase space: ||<3.0 for leading jet, pT(B) > 15 GeV, |(B)| < 2.0Visible phase space: ||<3.0 for leading jet, pT(B) > 15 GeV, |(B)| < 2.0
bin width, A is R or integrated luminosity
total bin efficiencybin purity
measured events in bin

Results
23
Ratio: R<0.8/R>2.4 (GSP/FCR region)
•Relative amount of GSP with respect to FCR for different event energy scales.
•Symbols plotted at the mean leading jet pT of the bin.
•GSP significantly exceeds FCR.
•Relative amount of FCR and GSP changes with event energy scale.
•General trend described by MC.
•Pythia: overestimation of back-to-back contribution. MadGraph: overestimation of collinear contribution.
JHEP 1103 (2011) 136

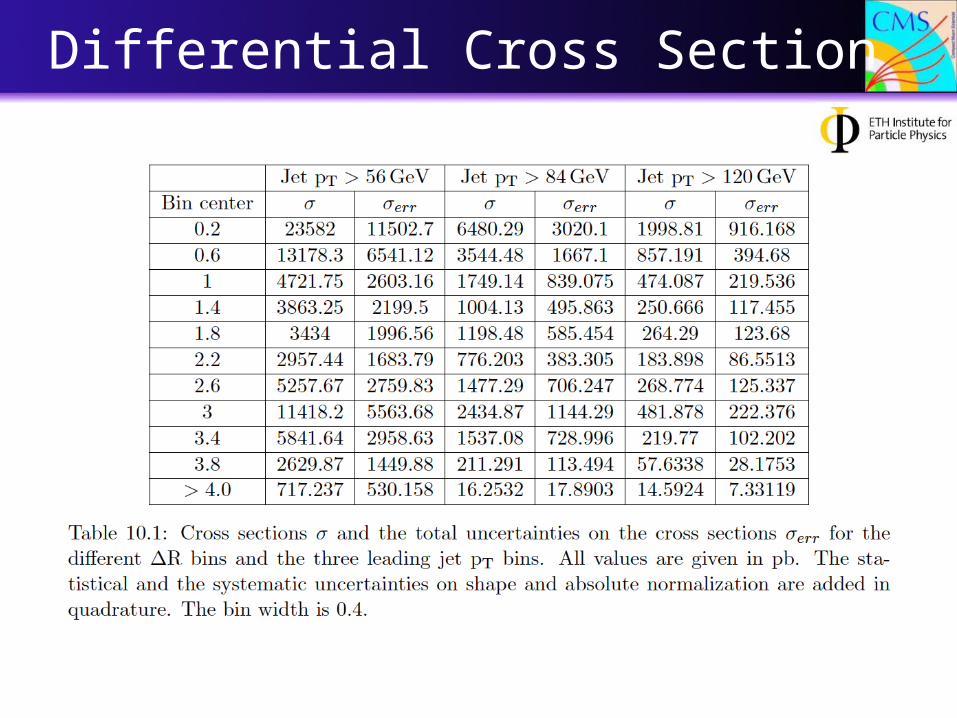
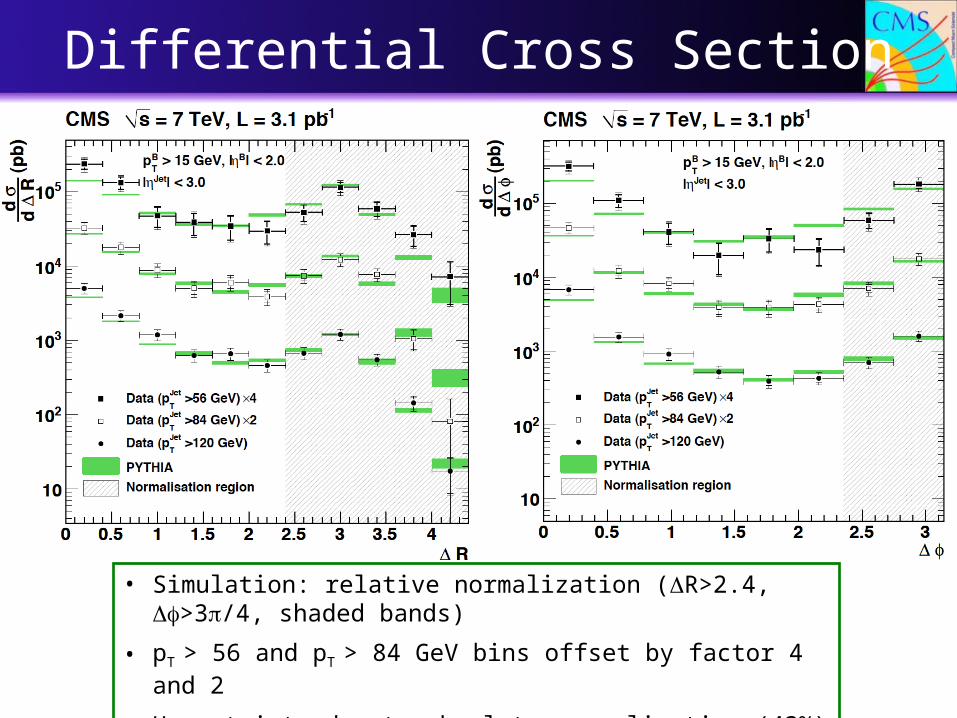
Differential Cross Section
24
• Data and Pythia compared for three leading jet pT regions
• Simulation: relative normalization (see below)
• pT > 56 and pT > 84 GeV bins offset by factor 4 and 2
• Uncertainty due to absolute normalization (43%) not included
Normalization to FCR region: normalize to cross section in R > 2.4 (>3/4)(back-to-back topology, LO dominated). Systematic uncertainties on absolute normalization irrelevant.
Normalization to FCR region: normalize to cross section in R > 2.4 (>3/4)(back-to-back topology, LO dominated). Systematic uncertainties on absolute normalization irrelevant.

Comparison to Theoretical Predictions
25
• Data and different predictions (MC@NLO, MadGraph, Cascade) normalized to Pythia prediction.
• Relative normalization (R>2.4, >3/4, shaded)
• No model matches data very well
• Data in between Pythia and MadGraph for small angles
• Cascade and MC@NLO under-estimate contribution at small R
• MC@NLO prediction for pretty accurate (not shown)

• First measurement of B anti-B angular correlations at 7 TeV.
• Measure correlations using secondary vertices in full angular range, accessing collinear region.
• Novel vertex finding technique independent of jet reconstruction developed. The Inclusive Vertex Finder is well suited for any kind of study using secondary vertices.
• Collinear B production is a sizable fraction of the total cross section. The relative amount is increasing with the event energy scale.
• General prescription of pQCD confirmed. None of the LO or NLO predictions describes the data very well. Input for theory and MC event generators.
Conclusion and Outlook
26
…everybody who contributed to this work.
•My supervisors•People in our group at the IPP •People from University of Zurich•People from the CMS collaboration•CERN staff•Many more…
Special thanks to…
27

Backup

MC Event Generation
•Hard event scattering (black)
•Initial state parton shower (blue)
•Final state parton shower (green)
•Parton density functions (red)
•Cluster/String formation (purple)
•Hadron decay (brown)
MC Event Generation

MC event generator settings:
MC Event Generators
Pythia: all-order multipurpose programm. ME at LO, PS for more activityMC@NLO: NLO QCD massive matrix element calculations matched with PS (Herwig). MadGraph: Hybrid solution between 22 and NLO simulations, matching scheme to avoid double counting (PS).Cascade: based on LO ME using high-energy factorization, convoluted with unintegrated parton distributions.

• Silicon pixel detector (66 Mio. pixels, size: 100x150m ATLAS: 50x400m).• Three barrel layers, two endcap disks covering ||<2.5. • 100 million particles per cm2 and s at full luminosity. • Analog readout
(charge sharing better spatial resolution).
• Lifetime barrel layers: 2, 5 and 10 years. • Full readout impossible.
Upgrade: • Improve pixel vertexing in large PU events
3 layers to 4 layers • Shift material budget to high η and use CO2 cooling
smaller impact parameter & less γ conversion• Modify ROC to operate at 2x1034 efficiently
reduce data loss as go beyond LHC luminosities
CMS Silicon Pixel Detector
measured position resolution:rϕ = 12.7μm +/ 2.3μ‐ m (ATLAS: 19m)z = 28.2μm +/ 1.9μ‐ m (ATLAS: 115m) measured impact parameter (10GeV)δ (rϕ) = 25μm δ (z) = 45μm

Digitized hits
Seed finding: Pixel pairs and triplets, pixel-less.
Pattern recognition: Combinatorial Track Finder, combinatorial Kalman filter method, tree of possible trajectories.
Ambiguity resolution: Remove duplicates with shared hits.
Final track fitting: Kalman filter.
CMS tracking: Iterative approach, five steps.
Track Reconstruction
local reconstructed hits.

• Identify jets originating from b quarks.
• Associate real number, a “discriminator” d to each jet.
• Different algorithms exploit long life time of B, semi-leptonic decay mode, high B mass,…
• Input: Jets, Tracks, PV, Leptons.
• For first data: Simple Secondary Vertex (SSV)Track Counting (TC)
• TC: Ordered list of signed impact parameter significance of tracks. d is significance of the Nth track (N = 2 for high efficiency or N = 3 for high purity).
• SSV: Reconstructs the B decay vertex using an adaptive vertex fitter. Vertex decay length significance used for d.
B-tagging
0.67
0.22
0.78
0.16 Discriminators
Jets
b-tagging
Vertex
Track
Jet axis
linearized Trackminimum distanceIP
rjet
rIP
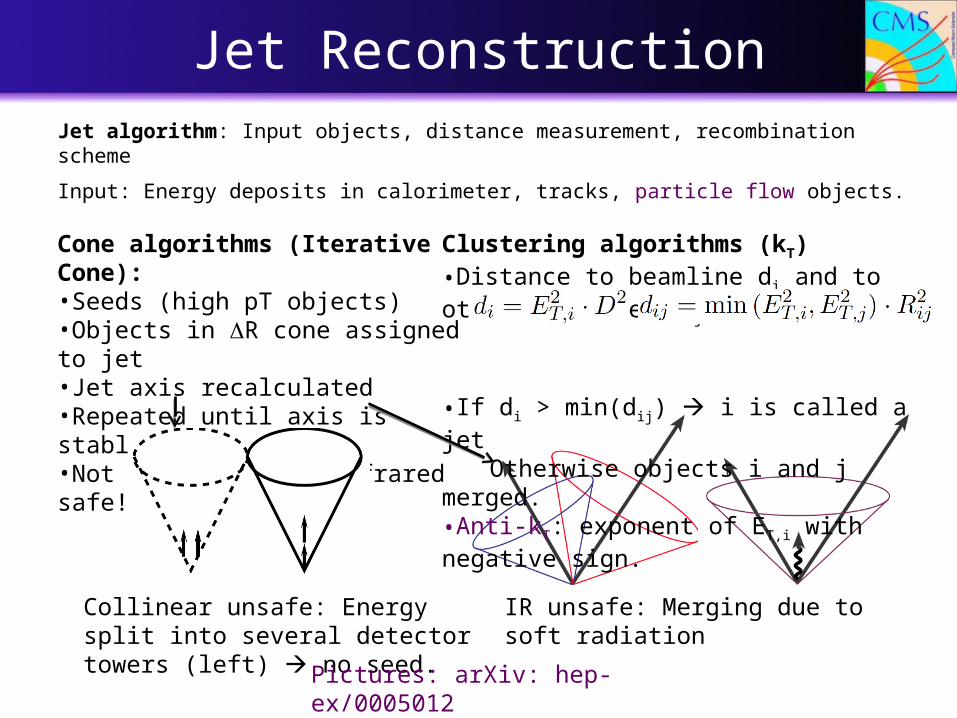
Jet algorithm: Input objects, distance measurement, recombination scheme
Input: Energy deposits in calorimeter, tracks, particle flow objects.
Jet Reconstruction
Cone algorithms (Iterative Cone): •Seeds (high pT objects)•Objects in R cone assigned to jet•Jet axis recalculated•Repeated until axis is stable•Not collinear and infrared safe!
Clustering algorithms (kT)•Distance to beamline di and to other particles dij
•If di > min(dij) i is called a jetOtherwise objects i and j merged.
•Anti-kT: exponent of ET,i with negative sign.
IR unsafe: Merging due to soft radiation Collinear unsafe: Energy split into several detector towers (left) no seed.
Pictures: arXiv: hep-ex/0005012

Adaptive Vertex Fitter (AVF): Iterative re-weighted Kalman Filter•Outlying tracks down-weighted (wi).
•“Temperature” T controls shape of weights.•wi for initial position (FSMW)
Calculate Vertex Position Repeat until convergence
Fraction-of Sample Mode with Weights: •Find crossing points of tracks (algorithmic mean of PCA of two tracks)•Weight assigned to crossing points (w = (d+10m)-0.5 d: distance betw. Tracks)•Mode of crossing points in 3D found: •Search shortest interval containing points with weight sum > 40 % of total weight sum procedure repeated on interval found until at most two points left. •Mode is average of coordinates of remaining points.
Vertex Reconstruction

• Enlarge track acceptance cone size in AVR (to 0.8 and 1.0). Efficiency increase for small R. Very low purity for small R. Reason: almost identical vertices. Problem of inefficiency at low R not solved.
Enlarging Track Acceptance Cone
2 SV with m > 1.4 GeVpT > 8 GeV|| < 2.0S3D > 5|RBB–RVV|< 0.1

• Seeding: tracks with IP > 0.005 cm and sIP > 1.5
• Clustering: seed-track separation distance and significance: ds,t < 500 mm, ss,t < 3
cos t > 0.5, cos s > 0.5 cos ts > 0.5
ds,t * c < fdensity * dPV, seed (c = 1, fdensity = 0.05)
• Fitting: c(first) = 1 c(others) = 3 S3D > 0.5 S2D > 2.5 norm. 2 < 10 cos v > 0.98
• Merging: remove one vertex if pair with distance significance < 2 sharing > 70 % of tracks
• Arbitration: all SV tracks with pT > 0.4 GeV assigned to SV or PV (on basis of impact parameter of tracks with respect to SV and PV and their significances).
• Merging: again, distance significance < 10 sharing > 20 % of tracks• Filter: < 65 % tracks shared with PV 0.1 cm < d2D < 2.5 cm
S2D > 3 ntracks > 3 mSV < 6.5 GeV Rflight direction, momentum < 0.1
• Selection: S3D > 5 || < 2.0 pT > 8 GeV mSV > 1.4 GeV
pair scalar mass sum > 4.5 GeV
IVF Parameters
PVSV
psv = pi
dsv
PVPCA
PCA
ds,tt
s
seed

IVF Performance
2 SV with m > 1.4 GeVpT > 8 GeV|| < 2.0S3D > 5|RBB–RVV|< 0.1

• Require primary vertex: |z| < 24 cm < 2 cm > 25% tracks high quality• Filter beam-wall and beam halo using timing criteria (BSC, BPTX):
– BPTX signal for both beams– At least one hit in BSC on both sides– None of the four BSC halo trigger bits fired– BSC splash trigger bit fired for both sides or no side
• Events faking high energy in calorimeter filtered based on pulse shape and hit multiplicity.
• JetMETTau, JetMET datasets used.
Event Selection

Data / MC SamplesDataset Run range > 56 GeV (/b) > 84 GeV (/b) > 120 GeV (/b)
MinimumBias 132596 - 135735 7875.384 7875.384 7875.384
JetMETTau 136080-137028 4924.282 4924.282 4924.282
JetMETTau 137437-139558 4267.647 61382.381 61382.381
JetMETTau 139779-140160 2872.436 35501.087 117168.272
JetMETTau 140160-140338 1082.178 10821.781 63807.257
JetMETTau 140399-141882 758.211 7582.106 41099.764
JetMET 141950-143731 6800.299 136005.976 1430000.290
JetMET 143732-144114 2459.059 49181.187 1342896.529
TOTAL 31’031 313’151 3’069’03`
MC DATASET Min. pthat Max. pthat (pb)
Events Factor (scale to 1/pb)
/QCD_Pt15/ 15 3o 876215000 6090500 143.9
/QCD_Pt30/ 30 80 60411000 4989664 12.10
/QCD_Pt80/ 80 170 923821 2971800 0.3109
/QCD_Pt170/ 170 300 25474.9 3091950 0.008239
/QCD_Pt300 300 --- 1256 2852665 0.0004403
/InclusiveBB_Pt30 30 --- 41400000 1017541 ---

Merging procedure for vertices (high with low mass first) •RVV < 0.4
•Pair invariant mass < 5.5 GeV•cos > 0.99
BDX Cleaning
SV SV
pi
PV

Fiducial Phase Space
• Most B hadrons with low pT
• Vertex reconstruction efficiency small • for soft B• if B decay products outside silicon tracker
Fiducial phase space:
pT(B) > 15 GeV
|(B)| < 2.0(for both B hadrons)

Eta, Phi and PT Correlation
Combined Pythia sample (pthat>15 GeV): = 41 b+ leading jet pT > 56 GeV: = 0.5 b+ fiducial phase space (pT > 15 GeV, ||<2.0): 116 nb (28 nb and 7 nb for leading jet pT >84 GeV and > 120 GeV, respectively)
FCR: 5.9 % 17.8%FEX: 35.3 % 28.2 %GSP: 58.8 % 54.0 %

B candidate reconstruction efficiency determined by two effects:
•pT of softer B (softer B harder to reconstruct)
At given event energy scale (leading jet pT), pT(B) becomes a function of opening angle (larger pT for back-to-back, smaller pT for collinear)
efficiency determined as function of R, independently for each leading jet pT bin.
•At small R an algorithmic efficiency loss is expected for B hadron reconstruction
MC description of algorithmic efficiency verified with a data mixing technique.
Efficiency Correction
Small R Large R
pTB ~ ½ pT
leading Jet pTB ~ pT
leading Jet

• A purity correction is derived from MC and applied bin by bin, taking into account the following:o Bin migrationo Background from events with 2 vertices from bc, bl, cc, clo Background from events with more than 2 B
• Multiplicative factor correction is chosen (instead of number of events subtraction) because all contribution scale with Secondary Vertex reconstruction efficiency
• As the goal of this analysis is the measurement of the differential cross section (rather than the absolute value) it is important that the purity correction is reasonably flat
• From MC simulation we obtain purity within 80-90%
• The limited MC statistics introduce an uncertainty in the final purity/efficiency correction that can be mitigated with variable binning:o The largest between half bin-to-bin fluctuation and bin stat uncertainty is taken as
systematic (13%)
Purity Correction

Correction

B Candidate Properties: pT, dSV
• pT (left) and 3D flight distance (right)
• All selection cuts applied (apart from those on shown quantities)
• Simulation normalized to number of data events
• Very nice agreement between MC and data
Leading jet pT > 84 GeV
small excessIn data (13 %)

Systematic Uncertainties on Shape
Source of systematic uncertainty on Shape Change of ratio R
Leading jet pT
> 56 GeV > 84 GeV > 120 GeV
Algorithmic effects (data mixing) 2 % 2 % 2 %
B-hadrons kinematics (pT of softer B) 8 % 7 % 4 %
Jet Energy Scale 6 % 6 % 6 %
Phase space correction 2.8 % 2.8 % 2.8 %
Bin migration from resolution 0.6 % 1.3 % 2.1 %
Subtotal shape uncertainty 10.6 % 9.9 % 8.3 %
MC statistical uncertainty 13.0 % 13.0 % 13.0 %
Total shape uncertainty 16.8 % 16.4 % 15.4 %

B Hadron Kinematics: pT of softer B• Efficiency determination from MC can suffer from bad simulation of B
hadron kinematics.• Check on data that kinematic is correct for the reconstructed events.
• pT of softer reconstructed B.
• pT distribution of the softer B vs. R.
• Systematic uncertainty due to this estimated to be 8 %, 7 % and 4 % (convolution of difference between MC and data and pT dependent efficiency).

Phase Space Correction
• Phase space correction to ||<2.0 and B hadron pT > 15 GeV: • Cut on reconstructed B pT > 8 GeV varied (to 10 GeV) to estimate uncertainty arising
from choice of cut on reconstructed pT (MC correction recomputed and final measurement repeated).
• Shape deformation within 2.8%. Leading jet pT > 56 GeV

Systematic Uncertainties on Shape
• Jet Energy Scale: •JES uncertainty affects leading jet pT cut.
•GSP/FCR ratio depending on leading jet pT.
•Shape affected by this JES uncertainty.•Uncertainty on JES below 3 %. Uncertainty of 5 %
added due to difference for jet energy corrections between b and light jets 6 % uncertainty.
•Uncertainty of 6 % on JES corresponds to uncertainty of 6 % on ratio.
• Bin migration from Resolution•Largest amount of off-diagonal evens at R around •Determine migration from R < 0.8 to R > 2.4, take 50 % (increase by 50 % GSP contribution).
• MC statistics uncertainty•Statistics for efficiency and purity correction limited. Take maximum of MC statistical uncertainty or half of the largest bin-to-bin fluctuation in cf 13 %.
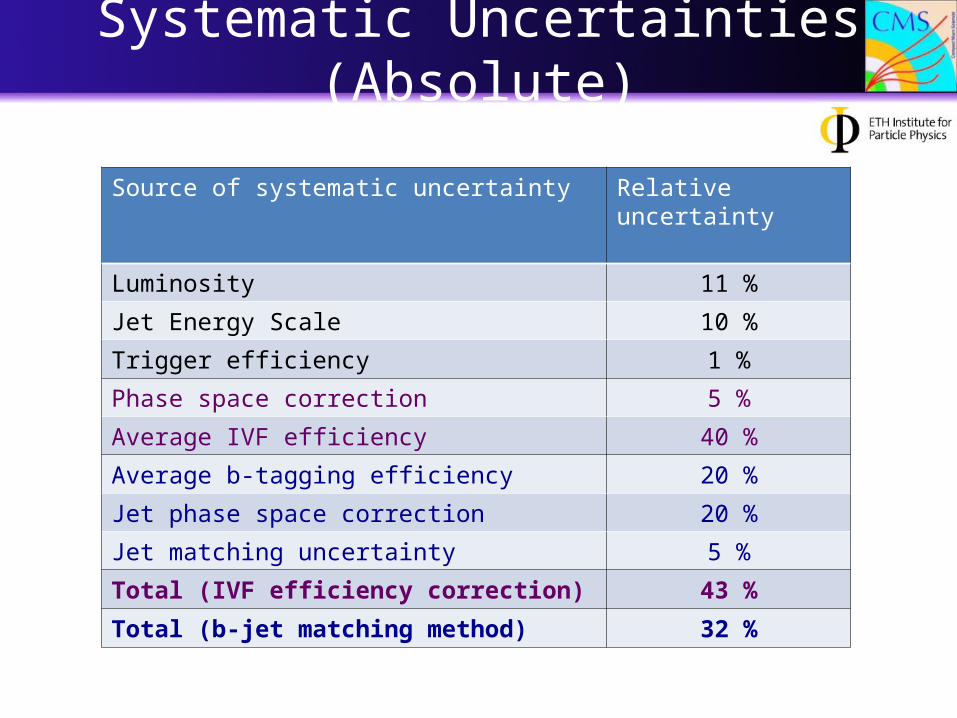
Systematic Uncertainties (Absolute)
Source of systematic uncertainty Relative uncertainty
Luminosity 11 %
Jet Energy Scale 10 %
Trigger efficiency 1 %
Phase space correction 5 %
Average IVF efficiency 40 %
Average b-tagging efficiency 20 %
Jet phase space correction 20 %
Jet matching uncertainty 5 %
Total (IVF efficiency correction) 43 %
Total (b-jet matching method) 32 %

Systematic Uncertainties (Absolute)• Jet Energy Scale:
• Leading jet pT spectrum falling
• Uncertainty of 5% on JES corresponds to uncertainty of 10% on total cross section.
• Phase space correction • see uncertainty on shape• Uncertainty on absolute value 5%
• Average IVF efficiency• Uncertainty on IVF absolute efficiency estimated using standard b-tagging efficiency studies.• Same level of data/MC agreement observed in BTV-10-001 and for IVF.• Uncertainty of 20% for one B, resulting in 40% uncertainty on overall scale (require 2 B).• Standard b-tagging efficiency can probably be better controlled (10%), absolute scale matching to
region R>1 could improve this uncertainty.

• Measure angle between two b-tagged jets (SSVHP discriminator) in data.
• B-tagging: 30 GeV jet required correct to phase space with pT(B) > 15 GeV
(uncertainty 15-20%, taken from MC comparing Madgraph and Pythia predictions).
• Both methods agree in R > 1 region (SV/jet between 0.8 and 0.95 for R > 1).
• Average efficiency for jet based method taken from BTV group (20% uncertainty in double tag).
• Additional uncertainty on varying region where IVF and b-tag results are matched (from R>1 to R>2.4): 5%.
Jet Based Analysis (b-tagging)
First bin suppressed!jet/SV between 0.73 and 0.55 in full R range!

Differential Cross Section (Absolute)
• pT > 56 and pT > 84 GeV bins offset by factor 4 and 2
• Uncertainty due to absolute normalization (43%): yellow band
Normalization to same luminosity: statistical and combined (statistical, systematic) uncertainty shown.Normalization to same luminosity: statistical and combined (statistical, systematic) uncertainty shown.
Differential Cross Section

Differential Cross Section

Total Cross Section
Total Cross Sections [nb]
Data 78 20 5.1Pythia 116 28 7MC@NLO 66 18 4.7Madgraph 63 17 3.9
Differential Cross Section
• Simulation: relative normalization (R>2.4, >3/4, shaded bands)
• pT > 56 and pT > 84 GeV bins offset by factor 4 and 2
• Uncertainty due to absolute normalization (43%) not included

Comparison to Theoretical Predictions
• Relative normalization (R>2.4, >3/4, shaded)• No model matches data very well• Data in between Pythia and MadGraph for small angles• Cascade and MC@NLO underestimate contribution at small R• MC@NLO prediction for pretty accurate