Embed Size (px)
Citation preview

Alternative and Renewable Fuel and Vehicle Technology Program
FINAL PROJECT REPORT
Prepared for: California Energy Commission
Prepared by: California Department of Food and Agriculture Division of Measurement Standards
MONTH YEAR
CEC‐XXX‐XXXX‐XXX
MEASUREMENT AND STANDARDS REQUIREMENTS FOR HYDROGEN AND BIODIESEL USED AS A TRANSPORTATION FUEL

Prepared by: Primary Author(s):
Volume 1: John Mough Kevin Schnepp Pamela Fitch
Volume 2: R. Norman Ingram Pamela Fitch
Volume 3: Samuel Ferris Pamela Fitch
California Department of Food and Agriculture, Division of Measurement Standards 6790 Florin-Perkins Road, Suite 100 Sacramento, CA 95828-1812 (916) 229-3000 www.cdfa.ca.gov Contract Number: 600-09-015 Prepared for: California Energy Commission Tobias Muench, Sarah K. Williams Contract Managers John P. Butler, II Office Manager Emerging Fuels and Technologies Office Randy Roesser Deputy Director Transportation Division Robert P. Oglesby Executive Director
DISCLAIMER
This report was prepared as the result of work sponsored by the California Energy Commission. It does not necessarily represent the views of the Energy Commission, its employees or the State of California. The Energy Commission, the State of California, its employees, contractors and subcontractors make no warrant, express or implied, and assume no legal liability for the information in this report; nor does any party represent that the uses of this information will not infringe upon privately owned rights. This report has not been approved or disapproved by the California Energy Commission nor has the California Energy Commission passed upon the accuracy or adequacy of the information in this report.

i
ACKNOWLEDGEMENTS
This project was made possible by the contributions of the individuals listed below. The authors
wish to express their gratitude to them.
Volume 1 Hydrogen Fuel Quality: California Department of Food and
Agriculture
Kristin Macey
R. Allan Morrison, Jr.
Kevin Batchelor
Steven Cook
Ron Nies
Roger Macey
Karen Green
Rebecca Bland
Amber Schaffner
Tammy Sulli
Ramsey Airada
California Fuel Cell Partnership
Jennifer Hamilton
Catherine Dunwoody
California State University, Los Angeles
David Blekhman
California Air Resources Board
Michael Kashuba
Gerhard Achtelik
Lotus Consulting
Randy Cook
Edward Cook
Bruker Daltonics, Inc.
Ed Nygren
Toyota Motor Corporation
Jackie Birdsall
iCONNECT
Chris Petty
Robert Miller
California Energy Commission
Jean Baronas
Jim McKinney
Pat Perez
Randy Roesser
John Butler
ASTM D03 Committee

ii
Volume 2 Hydrogen Metrology Standards:
California Department of Food
and Agriculture
Kristin Macey
Steven Cook
R. Allan Morrison, Jr.
Ron Nies
Kevin Batchelor
David Hawkins
Roger Macey
Greg Boers
Dan Reiswig
John Roach
Van Thompson
Janice Price
Jennifer Crow
Karen Green
Rebecca Bland
Amber Schaffner
Tammy Sulli
California Energy Commission
Jean Baronas
Jim McKinney
Pat Perez
Randy Roesser
John Butler
National Renewable Energy Laboratory
Chad Blake
Robert Burgess
Marc Butler
William Buttner
Kevin Harrison
Michael Peters
Matthew Post
Carl Rivkin
Carrieann McDonough
Joanne Greeley
National Institute of Standards and
Technology Office of Weights and
Measures
Members of U.S. National Work Group for
the Development of Hydrogen
Measurement Technology

iii
Volume 3 Physical and Chemical Analysis of Biodiesel Fuel: California Department of Food and Agriculture
Kristin Macey
R. Allan Morrison, Jr.
Kevin Batchelor
Steven Cook
Ron Nies
Richard Uyehara
David Hawkins
Karen Green
Rebecca Bland
Amber Schaffner
Tammy Sulli
Roger Macey
California Energy Commission
Jean Baronas
Akasha Kaur Khalsa
Jim McKinney
Pat Perez
Randy Roesser
John Butler

iv
PREFACE
The Alternative and Renewable Fuel and Vehicle Technology Program (ARFVTP) of the
California Energy Commission supports the development and deployment of alternative and
renewable fuels and advanced transportation technologies. This program supports the state’s
climate change and clean air policies. Projects in this program include alternate and renewable
fuels such as hydrogen and biodiesel, physical measurement and metering systems, and the
development of testing and certification protocols. The expanded use of alternative fuels such as
hydrogen and biodiesel will not only reduce the emissions of greenhouse gases, but also
improve air quality and reduce dependence on petroleum.
Under California’s Business and Professions Code (BPC), the Division of Measurement
Standards regulates the sale of transportation fuels in California and is responsible for the
enforcement of fuel quality standards. By law, the state adopts test procedures and fuel quality
standards published by recognized independent consensus standards organizations. The
Energy Commission entered into Contract 600‐09‐015, “Measurement and Standards
Requirements for Hydrogen and Biodiesel” with the Department of Food and Agriculture to
address the need for new regulations and test procedures to support the expanded use of
hydrogen fuel and biodiesel in California.
SAE International has published a specification for hydrogen fuel as “Surface Vehicle Standard
J2719 ‐ “Hydrogen Fuel Quality for Fuel Cell Vehicles”. This standard has been adopted for
California by the Department of Food and Agriculture. To be enforceable, this specification
must be supported by validated test methods recognized by these standards groups. Existing
test methods for hydrogen purity have been developed for such industries as food, chemical
production, and metallurgy. These methods do not have the extremely high sensitivity and
robustness required to support the specifications in J2719. This project was undertaken to
review techniques available for the analysis of hydrogen, select the most promising approaches,
and develop test methods sufficiently sensitive and reliable to support the hydrogen fuel
industry. Volume 1 of this report describes analytical approaches and instrumentation selected
for evaluation. A proposed scheme for the analysis of hydrogen fuel is presented. The results of
this project will be submitted to ASTM International to begin the development of consensus test
methods to support commercialization of hydrogen fuel.
A rapid growth curve for fuel cell electric vehicles (FCEVs) is expected once they are available
for sale to consumers in California, beginning in 2015. Sales of FCEVs must be supported by a
significant expansion of the state’s hydrogen refueling infrastructure. California law requires
that commercial fuel dispensing devices be approved by the California Department of Food and
Agriculture (CDFA) Division of Measurement Standards (DMS) to insure they meet all
metrological specifications. At the start of this project, no specifications or tolerances for
hydrogen dispensers had been developed. Volume 2 of this report describes the specifications,
tolerances, and method of sale that have been adopted by California through this effort. The test
standards and test procedures for hydrogen fuel dispensing devices that have been developed
are also discussed.

v
The California BPC Division 5, Chapter 14, Section 13450 requires the CDFA to establish and
enforce quality specifications for compression ignition engine fuel in California. Section 13450
requires the CDFA to adopt standard specifications for compression ignition engine fuels
published by ASTM International or other recognized consensus organizations. ASTM
International has published standard specifications for diesel fuel (ASTM D975), pure (neat)
biodiesel blendstock (ASTM D6751), and a biodiesel blends between 6 and 20 volume percent
biodiesel with diesel fuel (ASTM D7467), along with a suite of validated test methods for
establishing compliance with these standards.
Currently, there are no standard specifications or validated test methods for biodiesel blends
above 20 volume percent. Such specifications and test methods are needed to support
commercialization of higher biodiesel blends in California. When such specifications do not
exist, the CDFA may be required to develop interim specifications. In the absence of standard
specifications, transportation fuels may be sold in California only with a developmental fuel
variance from the CDFA. This is currently the case for biodiesel blends of higher than 20
volume percent. The CDFA/DMS was contracted and funded by the ARFVTP to evaluate
existing diesel and biodiesel test methods for blends with concentrations above 20 volume
percent.
This report was prepared by the California CDFA/DMS for the California Energy Commission
as part of the Energy Commission Contract 600‐09‐015, “Measurement and Standards
Requirements for Hydrogen and Biodiesel.”

vi
ABSTRACT
This project was funded by a contract of the California Energy Commission with the
CDFA/DMS as part of its Alternative and Renewable Fuel and Vehicle Technology Program.
This program aims to develop and deploy alternative and renewable fuels and advanced
transportation technologies in California to promote the stateʹs climate change and clean air
goals, and reduce petroleum dependence. This report has three volumes, which address
Hydrogen Fuel Quality, Development of Measurement Standards for Gaseous Hydrogen Fuel
Sold at retail in California, and the Physical and Chemical Analysis of Biodiesel.
One of the goals of this program is to promote a substantial increase in the number of FCEVs in
California. Major automobile manufacturers are introducing hydrogen‐powered FCEVs. An
expansion of the hydrogen refueling infrastructure will be needed to service these cars. New
codes and regulations, and approved hydrogen dispensers are required for the retail sale of
hydrogen in California.
The CDFA oversees the sale of transportation fuels in California. California Business and
Professions Code Division 5, Chapter 14, Sections 13446 and 13450 require the Department to
establish and enforce quality specifications for hydrogen fuel and biodiesel, respectively. The
sale of hydrogen fuel in California will also require the CDFA to develop specifications and
tolerances for commercial hydrogen fuel dispensers. Reference metrology standards are needed
for field‐testing and type evaluation of these dispensers, as required by state law.
A second goal of the program is to increase the use of biodiesel in California to improve air
quality and reduce dependence on petroleum products. Existing standards and specifications
support the sale of biodiesel in blends up to 20 percent, as well as 100 % biodiesel. This project
was designed to produce data to support new specifications and test methods for quality to
cover the range between 20 and 100 percent.
The Energy Commission provided funding for the development of standards and specifications
for hydrogen dispensers, hydrogen fuel, and biodiesel. The results described in this report will
be shared with consensus standards development organizations and other stakeholders.
Keywords: California Energy Commission, California Department of Food and Agriculture/
Division of Measurement Standards, National Conference on Weights and Measures, National
Institute of Standards and Technology, metrology, method of sale, SAE International, ASTM
International, hydrogen fuel, hydrogen dispensers, type evaluation, type testing, National
Renewable Energy Laboratory, hydrogen test methods, , alternative fuels, biodiesel,
Please use the following citation for this report:
Samuel Ferris, R. Norman Ingram, John Mough , Kevin Schnepp, and Pamela Fitch, California
Department of Food and Agriculture Division of Measurement Standards. 2013. Measurement
and Standards Requirements for Hydrogen and Biodiesel Used as a Transportation Fuel .
California Energy Commission. Publication Number: CEC‐600‐XX‐XXX.
vii
TABLE OF CONTENTS
Acknowledgements ............................................................................................................................... i
PREFACE .............................................................................................................................................. iv
ABSTRACT ........................................................................................................................................... vi
TABLE OF CONTENTS .................................................................................................................... vii
LIST OF TABLES .................................................................................................................................. xi
LIST OF FIGURES ............................................................................................................................. xiii
EXECUTIVE SUMMARY ..................................................................................................................... 1
VOLUME 1: Hydrogen Fuel Quality: Methods for the Analysis of Contaminants in Gaseous
Hydrogen Fuel .................................................................................................................................. 5
Volume 1 Summary ......................................................................................................................... 7
Chapter 1: Introduction and Overview ......................................................................................... 9
1.1 Properties of Hydrogen ........................................................................................................... 10
1.2 Safety Considerations for Hydrogen ..................................................................................... 11
1.3 Production of Hydrogen ......................................................................................................... 11
1.4 Introduction of Fuel Cell Vehicles ......................................................................................... 13
1.5 Hydrogen Fuel Specifications and Test Methods ................................................................ 16
1.6 Project Objectives ..................................................................................................................... 19
Chapter 2: Analysis of Hydrogen Fuel Quality ......................................................................... 21
2.1 Challenges in Hydrogen Fuel Analysis................................................................................. 21
2.2 Survey of Existing Methods for the Analysis of Contaminants in Hydrogen ................ 21
2.3 Equipment and Apparatus Overview ................................................................................... 22
2.4 Preparation of Standards ......................................................................................................... 24
2.5 Sampling Apparatus and Method ......................................................................................... 25
2.6 System 1 Instrumentation ....................................................................................................... 26
2.7 System 2 Instrumentation ....................................................................................................... 30
2.8 FTIR Spectrometer .................................................................................................................... 33
2.9 Cavity Ring Down Spectrometer ........................................................................................... 34

viii
CHAPTER 3: Results and Discussion ......................................................................................... 36
3.1 System 1: Determination of Oxygen, Sulfur Compounds, and Halogenates .................. 36
3.2 System 2: Determination of Helium, Argon, Oxygen, Nitrogen, Carbon Dioxide, Total
Hydrocarbons, and Methane ........................................................................................................ 44
3.3 IC: Evaluation for NH3 ............................................................................................................ 55
3.4 FTIR: Determination of CO, CO2, NH3, H2O, and Hydrocarbons ....................................... 57
3.5 CRDS: Determination of H2O, NH3, and Formaldehyde .................................................... 72
3.6 Field Sampling of Hydrogen Fuel at Dispensers ................................................................. 72
CHAPTER 4: Summary, Discussion, and Future Work ............................................................ 74
4.1 Project Summary ..................................................................................................................... 74
4.2 Considerations for Future Work ............................................................................................ 76
4.3 Summary of DMS Approach to Hydrogen Fuel Analysis .................................................. 77
4.4 Lessons Learned ....................................................................................................................... 79
VOLUME 2 Development of Measurement Standards for Gaseous Hydrogen Fuel Sold at
Retail in California ......................................................................................................................... 81
Volume 2 Summary ....................................................................................................................... 83
Chapter 1: Introduction and Overview ....................................................................................... 85
1.1 Metrology and Transportation Fuels in California ............................................................ 85
1.2 Fuel Cell Vehicles in California .............................................................................................. 86
1.3 Properties of Hydrogen and Safety Considerations ............................................................ 87
1.4 Existing Hydrogen Fuel Infrastructure in California .......................................................... 89
Chapter 2: Development of Hydrogen Fuel Dispensers Specifications and Standards ....... 91
2.1 Project Objectives ..................................................................................................................... 91
2.2 Development of Specifications, Procedures, and Model Codes
for Hydrogen Dispensers .............................................................................................................. 92
2.3 Design and Development of Working Standards for Type Evaluation and Field Testing
of Hydrogen Dispensers ................................................................................................................ 97
2.4 HFS Testing and Generation of Control Chart Data at NREL ......................................... 103
2.5 Generation of Control Charts ............................................................................................... 104

ix
2.6 Installation of the HFS at DMS ............................................................................................. 114
Chapter 3: Evaluation of Control Charts and HFS Field Testing .......................................... 116
3.1 Challenges in HFS Design, Fabrication, and Testing ........................................................ 116
3.2 Assessment of HFS Control Chart Data .............................................................................. 116
3.3 Installation and Field Testing of the HFS ........................................................................... 119
Chapter 4: Discussion, Recommendations and Future Work ................................................ 121
4.1 Project Accomplishments ...................................................................................................... 121
4.2 Challenges, Lessons Learned, and Recommendations ..................................................... 122
4.3 Future Work ............................................................................................................................ 122
VOLUME 3 Physical and Chemical Analysis of Biodiesel .......................................................... 125
Volume 3 Summary ..................................................................................................................... 127
Chapter 1. Introduction to Biodiesel Fuel ................................................................................. 131
1.1 Biodiesel and Air Quality in California ............................................................................... 131
1.2 Production and Testing of Biodiesel Fuels ......................................................................... 134
1.3 Use of Biodiesel Fuel in Diesel‐Powered Vehicles ............................................................. 138
1.4 Specifications for Biodiesel Fuels ......................................................................................... 139
CHAPTER 2. Objectives, Experimental Design and Results .................................................. 142
2.1 Project Objectives ................................................................................................................... 142
2.2 Project Design ......................................................................................................................... 143
2.3 Preparation of Biodiesel Blends ........................................................................................... 145
2.4 Test Equipment ....................................................................................................................... 145
2.5 ASTM Test Methods Evaluated in this Study .................................................................... 146
CHAPTER 3. Results and Discussion ........................................................................................ 154
3.1 Cloud Point ‐ ASTM D5773‐10 and D2500‐09 ..................................................................... 152
3.2 Low‐Temperature Flow Test ‐ ASTM D4539‐10 ................................................................ 157
3.3 Cold Filter Plugging Point – ASTM D6371‐05 .................................................................... 159
3.4 Flash Point ‐ ASTM D93‐10a ................................................................................................. 162
3.5 Automatic Atmospheric Distillation – ASTM D86‐10a ..................................................... 166

x
3.6 Automatic Reduced Pressure Distillation ASTM D1160‐06 ............................................. 167
3.7 Biodiesel Content in Diesel Fuel by Mid Infrared Spectroscopy (FTIR) – ASTM D7371‐
07 ..................................................................................................................................................... 169
3.8 Water and Sediment Contamination – ASTM D2709‐96 .................................................. 171
3.9 Free and Total Glycerin Content – ASTM D6584‐10a ....................................................... 172
3.10 Kinematic Viscosity ‐ D445‐10 ............................................................................................ 172
3.11 Microdistillation ASTM D7345‐08 ..................................................................................... 174
Chapter 4. Discussion, Recommendations and Future Work ................................................ 177
APPENDIX A Timeline for Fuel Cell Vehicles and California Hydrogen Infrastructure ..... 181
APPENDIX B DMS Hydrogen Laboratory SOP #1 for Preparation of Standards for
Hydrogen Analysis ........................................................................................................................... 183
APPENDIX C DMS Hydrogen Laboratory SOP #2 for Cleaning of Sampling and Standard
Containers .......................................................................................................................................... 186
APPENDIX D Instrumental Details for Hydrogen Fuel Quality Analysis ............................... 189
APPENDIX E Traceability Certificates for Dynacal Sulfur Permeation Tubes ........................ 191
APPENDIX F California Laws and Regulations Pertaining to Hydrogen Fuel ....................... 195
APPENDIX G CDFA Field Reference Manual Section 3.39 – Hydrogen Gas‐Measuring
Devices ................................................................................................................................................ 198
APPENDIX H NIST Handbook 130 Regulations for the Retail Sale of Hydrogen Fuel ............ 220
APPENDIX I Hydrogen Field Standard Parts and Identification List ...................................... 221
APPENDIX J Certificates of Analysis of Biodiesel and No. 2 Diesei Blend Stocks .................. 223
ACRONYMS ..................................................................................................................................... 228
GLOSSARY ....................................................................................................................................... 230
REFERENCES .................................................................................................................................... 233

xi
LIST OF TABLES
Volume 1
Table 1: SAE J2719 Specifications for Hydrogen Fuel……………………………………..17
Table 2: Analytical Options for Hydrogen Fuel Analysis…………………………………23
Table 3: System 1 Detectors and Analytes ………………………………………………….27
Table 4: System 2 Detectors and Analytes…………………………………………………..29
Table 5: Halogenates Tested by GC/MS…………………………………………………….34
Table 6: Sulfur Compounds Tested …………………………………………………………38
Table 7: Sulfur Compound Calibration Mixtures …………………………………………39
Table 8: Sulfur Compound Peak Areas and Response Factors from the Initial
Calibration ………………………………………………………………………………..40
Table 9: Sulfur Compound Calibration Equation Coefficients…………………………. 41
Table 10: Sulfur Compound MDL Peak Areas ……………………………………………41
Table 11: Sulfur Compound Measured MDL Concentrations…………………………..42
Table 12: Sulfur Compound MDL Calculation Results …………………………………43
Table 13: Helium Calibration Standards………………………………………………….44
Table 14: Calibration Mixture Concentrations for System 2 FID ………………………48
Table 15: Calibration Mixture Concentrations for System 2 PDHID ………………….48
Table 16: System 2 MDL Calculations ……………………………………………………52
Table 17: System 2 MDLs and SAE J2719 Reporting Limits……………………………55
Table 18: Analysis Parameters as a Function of Number of Scans ……………………60
Table 19: Sensitivity and Analysis Time vs. Resolution ………………………………60
Table 20: Calibration Mixture Concentrations for FTIR………………………………..62
Table 21: MDL for CO2 in Hydrogen by FTIR………………………………………….69
Table 22: MDL for CO in Hydrogen by FTIR……………………………………………70
Table 23: MDL for Methane in Hydrogen by FTIR …………………………………….70
Table 24: MDL for NH3 in Hydrogen by FTIR ……………………………………….. 71
Table 25: MDLs and Proposed Reporting Limits for FTIR Analysis…………………72

xii
Table 26: DMS Validated Methods and MDLS………………………………………74
Table 27: SAE J2719 Analytes Requiring Additional Work …………………………75
Volume 2
Table 28: Public Hydrogen Refueling Stations Operating in California in
October 2013 ………………………………………………………………………..90
Table 29: Proposed Accuracy Classes and Tolerances for Hydrogen
Gas‐Measuring Devices……………………………………………………………95
Table 30: Selected Fill Data from 10/23/2013 …………………………………………112
Table 31: 2 kg (35 MPa) Measurement Uncertainty …………………………………117
Table 32: 2 kg (35 MPa) Expanded Uncertainty for a 95% C.I.……………………..118
Table 33: 4 kg (70 MPa) Measurement Uncertainty …………………………………118
Table 34: 4 kg (70 MPa) Expanded Uncertainty for a 95% C.I. ……………………..118
Volume 3
Table 35: ASTM Diesel Test Methods Evaluated ……………………………………128
Table 36: Emissions Reductions with Biodiesel Fuels ………………………………132
Table 37: ASTM Standards for Diesel and Biodiesel Fuels………………………… 134
Table 38: Vehicle Manufacturers Approving Biodiesel by Blend Concentration ..141
Table 39: Sources for B100 Biodiesel and Feedstocks……………………………….144
Table 40: Instrumentation Purchased ………………………………………………..145
Table 41: ASTM Test Methods Evaluated in This Study …………………………..146
Table 42: ASTM D5773‐10 Cloud Point Temperature (°C) ………………………..155
Table 43: ASTM D4539‐10 Minimum LTFT Pass Temperature (°C)……………...158
Table 44: ASTM D6371‐05 CFPP Temperature (°C)………………………………..159
Table 45: ASTM D93‐10a Flash Point Temperature (°C) versus % Biodiesel……163
Table 46: ASTM D86‐10 Atmospheric Distillation Temperature (°C) ……………167
Table 47: ASTM D1160‐06 Reduced Pressure Distillation Temperature (°C) …..168
Table 48: % Biodiesel by FTIR in Blends of S‐871 Soy …………………………….170
Table 49: % Biodiesel by FTIR in Blends of S‐870 Saff/Can ……………………….170

xiii
Table 50: % Biodiesel by FTIR in Blends of A‐66 Yellow Grease …………….171
Table 51: % Biodiesel by FTIR in Blends of A‐67 Yellow Grease …………….171
Table 52: Kinematic Viscosity of Standard Fuel, Diesel Fuel,
and Biodiesel Fuel Blends in mm2/s ………………………………………..173
Table 53: Microdistillation of B30 Yellow Grease………………………………175
Table 54: Microdistillation of B50 Soy …………………………………………..176
Table 55: Summary of ASTM Test Method Results for Biodiesel Blends …..179

xiv
LIST OF FIGURES
Volume 1
Figure 1: Standards Preparation Apparatus ………….……………………….25
Figure 2: Hydrogen Quality Sampling Apparatus ……………………………26
Figure 3: System 1 Sample Flow Path (PFFD and Mass Spectrometer)……. 27
Figure 4: System 2 Sample Flow Path (PDHID, FID, and TCD) …………….31
Figure 5: Nicolet FTIR with Heated Gas Cell and Sample Interface………..34
Figure 6: GC/MS Chromatogram of Halogenated Standards ………………37
Figure 7: PFPD Chromatogram of Sulfur Compounds ……………………...39
Figure 8: System 2 TCD Chromatogram for Helium…………………………45
Figure 9: TCD Calibration Report for Helium ……………………………… 46
Figure 10: System 2 FID Chromatogram…………………………………….. 47
Figure 11: FID Calibration Report for Total Hydrocarbons ……………….49
Figure 12: FID Calibration Report for Methane …………………………….50
Figure 13: FID Calibration Report for Carbon Dioxide …………………… 51
Figure 14: PDHID Calibration Report for Nitrogen………………………..53
Figure 15: PDHID Calibration Report for Argon…………………………... 54
Figure 16: IC/CD Chromatogram of Cation Mix at 0.1 ppb………………..56
Figure 17: Background Infrared Absorption of an Empty Cell with
Increasing Number of Scans …………………………………………….58
Figure 18: Baseline Noise as a Function of Scan Number ………………..59
Figure 19: Effect of Resolution on Sensitivity ……………………………..61
Figure 20: FTIR Spectrum of Fixed Gas Calibration Mixture at the
Maximum Concentrations Allowed in J2719 ………………………...63
Figure 21: FTIR Calibration Report for Carbon Monoxide………………64
Figure 22: FTIR Calibration Report for Carbon Dioxide ………………..65
Figure 23: FTIR Calibration Report for Methane…………………………66
Figure 24: FTIR Calibration Report for Ammonia ………………………67

xv
Figure 25: FTIR Calibration Report for Water ………………………….68
Figure 26: Field Collection of Hydrogen Fuel Quality Sample……….73
Figure 27: Hydrogen Fuel Quality Sample Flow Chart ………………78
Volume 2
Figure 28: DMS Hydrogen Field Standard (HFS) …………………….101
Figure 29: View of DMS HFS Fill Tanks ……………………………….102
Figure 30: Gravimetric Standard Control Chart (35 MPa) …………..106
Figure 31: PVT Standard Control Chart (35 MPa) …………………..107
Figure 32: Master Meter Standard Control Chart (35 MPa) ……….108
Figure 33: Gravimetric Standard Control Chart (70 MPa) …………109
Figure 34: PVT Standard Control Chart (70 MPa) …………………..110
Figure 35: Master Meter Standard Control Chart (35 MPa)………..111
Figure 36: SpaceKap Service Body Mounted on DMS Truck ……..114
Figure 37: SpaceKap Housing for the HFS …………………………115
Figure 38: HFS Mounted in the Shell ……………………………….115
Figure 39: HFS Checkout at the UCB Richmond Field Station …..120
Figure 40: HFS Field Testing at AC Transit in Emeryville ……….120
Volume 3
Figure 41: Fatty Acid and Triglyceride Structures ………………..135
Figure 42: Transesterification of a Triglyceride with Methanol …136
Figure 43: Cloud Point vs. % Blend ‐ S‐870 Saff/Can …………….154
Figure 44: Cloud Point vs. % Blend ‐ S‐871 Soy ………………….156
Figure 45: Cloud Point vs. % Blend ‐ S‐66 Yellow Grease ………156
Figure 46: Cloud Point vs. % Blend ‐ S‐67 Yellow Grease ………157
Figure 47: LFTP vs. % Blend ‐ S‐67 Yellow Grease and Soy ……158
Figure 48: CFPP vs. % Blend ‐ S‐871 Soy………………………… 160
Figure 49: CFPP vs. % Blend ‐ A‐66 Yellow Grease ……………. 161

xvi
Figure 50: CFPP vs. % Blend ‐ A‐67 Yellow Grease ………….161
Figure 51: CFPP vs. % Blend ‐ S‐870 A/B Saff/Can …………..162
Figure 52: Flash Point vs. % Blend ‐ S‐870 Saff/Can …………164
Figure 53: Flash Point vs. % Blend ‐ S‐871 Soy ……………….164
Figure 54: Flash Point vs. % Blend ‐ A‐66 Yellow Grease……165
Figure 55: Flash Point vs. % Blend ‐ A‐67 Yellow Grease……165
Figure 56: Kinematic Viscosity of Blends……………………….174
Figure 57: Sample Spreadsheet for Standard Mixture
Preparation……………………………………………………186
Figure 58: Canister Cleaning System …………………………..188
Figure 59: Summa Canisters in the Cleaning Oven …………..189
Figure 60: Sample Containers in the Cleaning Oven …………190

1
EXECUTIVE SUMMARY
The Energy Commission and the Air Resources Board have set goals to improve air quality and
reduce petroleum dependence in California. These include a reduction of petroleum fuel use to
15 percent below 2003 levels by 2020 and the reduction of greenhouse gas emissions to 80
percent below 1990 levels by 2050. To achieve these goals, alternative fuels are targeted to reach
20 percent of all fuel consumed in California by 2020.
Hydrogen used to power fuel cell vehicles and biodiesel fuel for compression ignition engines
will play critical roles in meeting California’s alternative fuel use goals. However, significantly
expanding the use of these fuels will require changes to the codes and regulations that govern
the retail sale of transportation fuels in California. In addition, the sale of large numbers of fuel
cell passenger cars will require a significant expansion of the State’s hydrogen refueling
infrastructure.
This project was undertaken by the CDFA/DMS with funding from the Energy Commission.
Three separate tasks were identified: first, the development of standards and regulations
required for retail hydrogen fuel dispensers in California; second, the evaluation of methods for
testing hydrogen fuel quality; and third, the evaluation of test methods for biodiesel blends
above 20 volume percent. A brief overview of each of these tasks is given below. The full
reports for each task follow as separate volumes of this report.
Volume 1: Hydrogen Fuel Quality: Methods for the Analysis of Contaminants in Gaseous Hydrogen Fuel
Chapter 14, Section 13446 of the Business and Professions Code requires the Division of
Measurement Standards to establish and enforce quality specifications for transportation fuels
in California. Section 13401 of the Code classifies hydrogen for vehicles as a transportation fuel,
making the CDFA responsible for regulating the quality of hydrogen fuel in the state.
A very high purity grade of hydrogen is required to protect the catalysts used in fuel cell
engines. A wide range of contaminants can adversely affect the fuel cell performance, even at
extremely low concentrations. Existing analytical methods for hydrogen gas lack the high
sensitivity and robustness required for reliable measurements at very low levels, and may be
subject to various interferences. Quality standards for hydrogen fuel were published in 2011 as
SAE International’s Surface Vehicle Standard J2719 ‐ Hydrogen Fuel Quality for Fuel Cell Vehicles.
J2719 has been adopted by reference by the Department of Food and Agriculture in California
Code of Regulations Title 4, Division 9, Chapter 6, Article 8, Section 4181. Standard J2719 sets
maximum contaminant levels for impurities of concern specifically for hydrogen fuel.
Contaminants in hydrogen fuel not only reduce fuel cell efficiency, but also can rapidly and
irreversibly degrade the catalyst, requiring an expensive replacement.
To be enforceable, the specifications of SAE J2719 must be supported by validated test methods
that can be used to demonstrate compliance. Such methods are published by consensus

2
standards organizations such as ASTM International. Existing hydrogen test methods were
developed for industries such as food and metallurgy. Fuel cells have more stringent purity
requirements than those applications. Current test methods generally do not have sufficient
sensitivity and robustness for the analysis of hydrogen for fuel cells. Therefore, they cannot
support regulatory enforcement by the CDFA. In some cases, validated consensus methods for
the analysis of SAE J2719 contaminants in hydrogen gas do not exist.
The development of hydrogen fuel quality test methods under this project had three
components. First, a survey and evaluation of existing test methods for assessing hydrogen fuel
purity was conducted. Second, existing methods that are adequate for the analysis of hydrogen
fuel quality were validated. Finally, areas in which further work is needed to develop adequate
test methods were identified. The results of this work have been shared with ASTM members
and other stakeholders to promote the development of a suite of consensus test methods to
support regulation of quality standards for hydrogen fuel in California. In turn, this will
promote the development of the hydrogen infrastructure essential for the acceptance of fuel cell
vehicles by consumers.
Volume 2: Development of Measurement Standards for Gaseous Hydrogen Fuel Sold at Retail in California
Hydrogen fuel cells are used to power a wide range of vehicles. Growing numbers of transit
systems throughout California are using fuel cell buses. Large numbers of fuel cell forklifts and
similar vehicles are in use in industrial and warehouse settings. A limited number of fuel cell
passenger cars are currently leased to consumers in California in demonstration programs.
Several manufacturers plan to begin selling fuel cell passenger cars between 2015 and 2017.
A handful of hydrogen refueling stations have been constructed to service these vehicles. Most
of these are privately owned and offer limited or no public access. The manufacturers of leased
fuel cell cars provide refueling as part of their lease agreements. Public access to a greatly
expanded hydrogen‐refueling infrastructure is essential to support the retail sale of fuel cell
vehicles in California.
California BPC, Division 5, Section 12500.5 requires that commercial fuel dispensing devices be
approved by the Division of Measurement Standards of the California Department of Food and
Agriculture to ensure they meet all metrological requirements. BPC Section 12107 requires the
Department to adopt by reference the latest specifications and tolerances for all commercial fuel
dispensing devices. It also requires that device specifications and tolerances developed by the
National Conference on Weights and Measures be adopted when published by the National
Institute of Standards and Technology in its Handbook 44 Specifications, Tolerances, and Other
Technical Requirements for Weighing and Measuring Devices.
Prior to 2007, no specifications or tolerances for hydrogen fuel dispensers had been developed.
For such situations, Handbook 44 provides procedures for their approval as unclassified devices.
However, without device‐specific protocols, there is the possibility that different evaluators
might require different performance measures. Because of this situation, and the limited market
3
for commercial hydrogen dispensers, device manufacturers have been reluctant to invest in
their development. This represents an obstacle to the sale of fuel cell vehicles in California.
To address the need for clear specifications and tolerances for hydrogen dispensers, the Energy
Commission provided funding to the CDFA for the development of testing and certification
protocols for hydrogen dispensers. Volume 2 of this report, Development of Measurement
Standards for Gaseous Hydrogen Fuel Sold at Retail in California, describes the specifications,
tolerances, and method of sale that have been adopted by California and nationally as part of
this project.
In addition, three metrological standards (gravimetric, volumetric, and master meter) for the
testing and type evaluation of hydrogen fuel dispensers were developed and tested as part of
this project. These standards were designed and constructed under an agreement with the
National Renewable Energy Laboratory in Golden, Colorado. These standards were
incorporated into one mobile device, the Hydrogen Field Standard. Test data from the
Hydrogen Field Standard showed that the gravimetric standard met the required tolerances for
type evaluation of hydrogen dispensers. The volumetric and master meter standards failed to
meet the required tolerances. Testing of dispensers at retail stations throughout California is
underway using the gravimetric standard of the Hydrogen Field Standard. Data is also being
collected with the volumetric and master meter standards to better understand their
performance. Results of this testing, with confidential business information removed, will be
shared with stakeholders.
Volume 3: Physical and Chemical Analysis of Biodiesel
Our economy runs largely on diesel power. Fuel tax figures from the Board of Equalization
show that California’s monthly consumption of diesel fuel averages over 200 million gallons.
The combustion of petroleum‐based diesel fuel is a leading source of greenhouse gas and toxic
emissions in California and around the world. These emissions are major contributors to global
warming and climate change, and have many significant adverse public health impacts.
Biodiesel fuel is a renewable fuel that can substitute for No. 2 diesel fuel in compression ignition
engines. Although these engines can run on pure biodiesel fuel, it is usually blended with
petroleum diesel. Biodiesel blends significantly reduce greenhouse gas and most toxic tailpipe
emissions compared to petroleum diesel. Increased use of biodiesel blends in California will
reduce dependence on petroleum products. At concentrations up to 5%, biodiesel has no
deleterious effects on the required specifications of diesel fuel. As a result, these low‐level
blends may be marketed with no special labeling or other requirements.
California BPC Division 5, Chapter 14, Section 13450 requires the Division of Measurement
Standards to establish and enforce quality specifications for compression ignition engine fuel in
California. Section 13450 requires the Department to adopt standard specifications for diesel
fuel published by ASTM International or another recognized consensus organizations. ASTM
International has published standard specifications for pure (neat) biodiesel (ASTM D6751), and

4
blends between 6 and 20 volume percent biodiesel with petroleum diesel fuel (ASTM D746),
along with a suite of validated test methods for establishing compliance with these standards.
Currently, there are no standard specifications or validated test methods for biodiesel blends
above 20 volume percent. Such specifications and test methods are needed to support
commercialization of higher biodiesel blends in California. When such specifications do not
exist, the CDFA may be required to develop interim specifications. In the absence of standard
specifications, transportation fuels may be sold in California only with a developmental fuel
variance from the CDFA.
Biodiesel has very different physical and chemical characteristics than conventional diesel fuel.
Analytical methods developed for petroleum diesel may not be appropriate for biodiesel blends
above 20 volume percent. Research is needed to identify which of the existing methods can be
applied to higher biodiesel blends and which methods need modifications.
The activities reported in Volume 3 were designed to evaluate existing diesel and biodiesel test
methods for blends with concentrations above 20 volume percent. Each blend stock was mixed
with petroleum diesel fuel to prepare a series of blends covering the range of 20 – 90% biodiesel.
Each blend, along with the neat blend stocks, was tested using ten ASTM diesel and biodiesel
test methods to determine the suitability of the methods over the entire concentration range of
blends. Eight of the methods tested worked for all blends tested. Two distillation test methods
failed for most of the blend concentrations. Possible alternative test methods have been
identified as replacements for these two tests.
ASTM approved the establishment of a new workgroup to develop standard specifications for
biodiesel blends above B20 at its June 2013 meeting in Montreal. Allan Morrison, Senior
Environmental Scientist at DMS is taking a lead role in this effort. The results of this project will
be shared with this workgroup and with other stakeholders in the biodiesel industry.

MONTH YEAR
CEC ‐XXX ‐XXXX ‐XXX
Alternat ive and Renewable Fuel and Vehic le Technology Program
FINAL PROJECT REPORT: VOLUME 1
Prepared for: California Energy Commission
Prepared by: California Department of Food and Agriculture Division of Measurement Standards
HYDROGEN FUEL QUALITY
Methods for the Analysis of Contaminants in Gaseous Hydrogen Fuel

6

7
VOLUME 1 SUMMARY
Assembly Bill 118 (Núñez, Chapter 750, Statutes of 2007) created the California Energy
Commissionʹs Alternative and Renewable Fuel and Vehicle Technology Program and the Air
Quality Improvement Program of the California Air Resources Board (CARB). The goals set by
the Energy Commission and the CARB include the reduction of petroleum fuel use to 15
percent below 2003 levels by 2020 and the reduction of greenhouse gas emissions to 80 percent
below 1990 levels by 2050. A target for increased use of alternative fuels to 26 percent of all fuel
consumed by 2022 has been set to help attain these goals and reduce petroleum dependence. AB
118, as subsequently amended by Assembly Bill 109 (Núñez, Chapter 313, Statutes of 2008),
authorizes the Energy Commission to develop and deploy alternative and renewable fuels and
advanced transportation technologies as part of the stateʹs climate change, clean air, and energy
strategies. The CARB has established the Advanced Clean Car Program, which includes
regulations to increase the number of zero emissions vehicles on California’s highways.
Hydrogen fuel cell vehicles (FCEVs) will play an essential role in reaching these goals. FCEVs
will be available to the general public in California beginning in 2015. These vehicles have no
greenhouse gas or nitrogen oxides tailpipe emissions. Expanded use of hydrogen as a
transportation fuel will reduce the state’s dependence on petroleum and help meet the
alternative fuel use goal.
A very high purity grade of hydrogen is required for optimal vehicle performance and
protection of fuel cell catalysts. A wide range of contaminants can adversely affect the fuel cells,
some at extremely low concentrations. Contaminants may reduce fuel cell efficiency and may
irreversibly degrade the fuel cell stack, resulting in a premature and expensive replacement.
Existing analytical methods for hydrogen gas lack the high sensitivity and robustness required
for reliable measurements at very low levels, and may be subject to various interferences.
Hydrogen for fuel cell vehicles is classified as a transportation fuel in the California Business
and Professions Code (BPC), Division 5, Chapter 14, Section 13401. Section13446 of this code
requires the Division of Measurement Standards of the Department of Food and Agriculture to
establish and enforce quality specifications for hydrogen fuel in California. SAE International
Surface Vehicle Standard J2719 ‐ Hydrogen Fuel Quality for Fuel Cell Vehicles sets quality standards
for hydrogen fuel. J2719 was published in 2011, and has been adopted by reference by the
Department in California Code of Regulations Title 4, Chapter 6, Article 8, Section 4181. To be
enforceable, these standards must be supported by test methods to demonstrate compliance
published by consensus standards organizations such as ASTM International.

8
Regulation of the commercial sale of hydrogen fuel protects consumers and ensures a level
playing field for producers, suppliers, and retailers. The work reported here was undertaken to
support the development of a viable market for hydrogen fuel in California. The project had
three parts: first, a survey and evaluation of existing test methods for assessing hydrogen fuel
purity; second, the validation of existing methods that may be adequate for the analysis of
hydrogen fuel quality; and third, the identification of areas in which further work is needed to
develop adequate test methods.
Existing hydrogen test methods were developed for industries such as food and metallurgy.
Fuel cells have more stringent purity requirements than those applications. Current test
methods generally do not have sufficient sensitivity and robustness for the analysis of hydrogen
for fuel cells. Therefore, they cannot support regulatory enforcement by the CDFA. In other
cases, there are no existing methods for the analysis of SAE J2719 contaminants in hydrogen
gas.
The results of this work will be shared with stakeholders to promote the development of a suite
of consensus test methods adequate to support enforcement of quality standards for hydrogen
fuel in California. In turn, this will promote the development of the hydrogen infrastructure
essential for the acceptance of fuel cell vehicles by consumers.

9
CHAPTER 1: Introduction and Overview
Yes, my friends, I believe that water will one day be employed as
fuel, that hydrogen and oxygen which constitute it, used singly or
together, will furnish an inexhaustible source of heat and light, of
an intensity of which coal is not capable. … I believe, then, that
when the deposits of coal are exhausted we shall heat and warm
ourselves with water. Water will be the coal of the future. Cyrus Harding, in The Mysterious Island by Jules Verne, 1874
Hydrogen fuel cells, which use the electrochemical reaction of oxygen and hydrogen to generate
electricity, will play an essential role in reaching California’s goals for clean air and a
sustainable energy supply. Much more energy efficient than conventional combustion engines,
fuel cells produce only water and a small amount of heat as by‐products at the point of use.
One important application of fuel cells is in the transportation sector. Applications of fuel cell
technology in both automobiles and heavy‐duty vehicles can help achieve the state’s air quality
and energy goals. Vehicles powered by FCEVs produce no emissions of particulates, carbon
dioxide, or the potent greenhouse gas nitrous oxide. Expanded use of hydrogen as a
transportation fuel will also reduce the state’s dependence on petroleum, and so help to meet
mandated alternative fuel use goals.
Under its Alternative and Renewable Fuel and Vehicle Technology Program (ARFVTP), the
California Energy Commission supports the development of alternative and renewable fuels and
advanced transportation technologies to help implement the stateʹs climate change and clean air
policies. The Energy Commission and the CARB have set the following goals:
A reduction in greenhouse gas emissions to 80 percent below 1990 levels by 20501 2
A decrease in petroleum fuels usage to 15 percent below 2003 levels by 20203
1 CARB (CARB) Climate Change Programs http://www.arb.ca.gov/cc/cc.htm accessed 10/01/13
2 California Office of the Governor, Arnold Schwarzenegger Executive Order S‐3‐05, June 1, 2005.
3 Reducing California’s Petroleum Dependence, CARB and Energy Commission joint agency report
publication #P600‐03‐005, August 2003.

10
An increase in the use of alternative transportation fuels to 20 percent of all fuel
consumed by 2020 and 30 percent by 20304
A reduction of emissions of nitrogen oxides to 80 percent of 2010 levels by 2023 to meet
current Federal ozone standards5
FCEVs are a proven technology in use around the world. In California, a limited number of fuel
cell passenger cars are currently leased to consumers by manufacturers in demonstration
programs. Growing numbers of transit systems are using fuel cell buses. Increasingly, fuel cell
forklifts and similar vehicles are in use in industrial and warehouse settings. In response to
mandates to increase vehicle fuel efficiency and decrease tailpipe emissions, many major
automakers plan to begin commercial sale of FCEVs in California in 2015.
To support wider use of FCEVs, a greatly expanded hydrogen infrastructure is needed.
Consumer acceptance of FCEVs will largely depend on the establishment of a convenient and
reliable distribution system that delivers consistently high quality fuel. Quality specifications
for hydrogen fuel and test methods to enforce compliance with these standards are needed. The
work reported in this volume was undertaken to:
Evaluate available test methods for assessing hydrogen fuel purity.
Validate existing methods that are adequate for the analysis of hydrogen fuel.
Identify areas in which further work is needed to develop adequate analytical methods.
1.1 Properties of Hydrogen
Hydrogen is the most abundant element in the universe and is thought to account for 90 percent
of its known mass.6 Molecular hydrogen (two hydrogen atoms joined by a chemical bond) is too
light to be retained in the earth’s atmosphere by its gravitational force. So on earth, hydrogen
occurs naturally only in combination with heavier elements. Bound to oxygen to form water,
hydrogen comprises almost eleven percent of the mass of the oceans.7 Smaller quantities of
4 California Energy Commission 2003 Integrated Energy Policy Report
http://www.energy.ca.gov/reports/100‐03‐019F.PDF accessed 9/19/13.
5 Vision for Clean Air: A Framework for Air Quality and Climate Planning, Public Review Draft CARB, the
South Coast Air Quality Management District and the San Joaquin Valley Unified Air Pollution Control
District, page 10, June 27, 2012. Available online at
http://www.arb.ca.gov/planning/vision/docs/vision_for_clean_air_public_review_draft.pdf.
6 Los Alamos National Laboratory http://www.periodic.lanl.gov/1.shtml accessed 6/20/13.
7 Abundance of the Chemical Elements, ChemEurope website,
http://www.chemeurope.com/en/encyclopedia/Abundance_of_the_chemical_elements.html accessed
6/20/13

11
hydrogen are found in minerals and various other hydrides, and account for 0.14 percent of the
mass of the earth’s crust.8
In fuel cells, molecular hydrogen is an energy carrier, not a fuel or direct energy source. A fuel
cell releases the chemical energy stored in the hydrogen molecule and converts it to electricity.
Hydrogen has the highest energy content per unit weight of any element. One kilogram of
hydrogen has approximately the same energy content as one gallon of gasoline. However, since
hydrogen is also the lightest element, it has a low energy density by volume at standard
temperature and atmospheric pressure.9 Therefore, a given volume of hydrogen contains only a
small amount of energy under ambient conditions. Hydrogen tanks in FCEVs are highly
pressurized to increase the fuel density so that a FCEV can achieve an acceptable driving range
of at least 300 miles.
1.2 Safety Considerations for Hydrogen
Hydrogen does have unique characteristics that require special handling precautions for safety.
However, this does not mean that hydrogen is less safe than other transportation fuels. In fact,
overall, hydrogen may be safer than conventional fuels. Hydrogen has long been an industrial
commodity in many industries with an excellent safety record.10 A 1997 report on hydrogen
vehicle safety prepared for the U.S. Department of Energy concluded, “Overall, we judge the
safety of a hydrogen FCEV system to be potentially better than the demonstrated safety record
of gasoline or propane, and equal to or better than that of natural gas.”11
Vapors of all transportation fuels are flammable within some range of concentrations in air. For
hydrogen, this range is roughly 4 – 75%, quite wide compared to that of conventional petroleum
fuels. However, even lower concentrations of gasoline (1%), diesel (0.6%), and propane (2.2%)
will support combustion. In the event of a leak, both petroleum‐based fuels and hydrogen can
burn if an ignition source is present. In the event of a leak, hydrogen will rapidly diffuse
upwards because of its lighter‐than‐air buoyancy. This will be true even if the hydrogen has
been ignited. Consequently, hydrogen fires remain narrow, vertical, concentrated, and dissipate
quickly. This reduces the risk that surrounding objects and buildings will be ignited. Vapors of
gasoline and diesel fuel, on the other hand, are heavier than air. They will spread low to the
8 Steven Dutch, Department of Natural and Applied Sciences, University of Wisconsin ‐ Green Bay.
http://www.uwgb.edu/dutchs/PLANETS/Geochem.htm accessed 6/20/13.
9 Elert, Glenn, editor. The Physics Factbook™, entries 187 and 190, http://hypertextbook.com/facts/index‐
topics.shtml. Accessed 10/29/13.
10 Ibid.
11 Ford Motor Company Direct‐Hydrogen Fueled Proton‐Exchange Membrane Fuel Cell System for
Transportation Applications Hydrogen Vehicle Safety Report DOE/CE/50389‐502 prepared for the U. S.
Department of Energy, May 1997. Available online at
www.directedtechnologies.com/publications/storage/H2VehicleSafetyReport97‐05.pdf. Accessed 7/5/13.

12
ground if there is a fuel leak, increasing the fire risk to the surroundings. In this sense, hydrogen
is safer than conventional fuels.
1.3 Production of Hydrogen
Since there is no terrestrial source of molecular hydrogen, it must be manufactured using a
hydrogen‐rich compound as the raw material. According to the U.S. Energy Information
Administration, the domestic annual production of hydrogen is about nine million metric tons.
The electricity that could potentially be produced from this amount could power at least 20
million cars.12 However, hydrogen is used today mainly as a feedstock in the petrochemical,
food, electronics and metallurgical processing industries. The National Aeronautics and Space
Administration’s space program currently uses liquid hydrogen fuel for rocket propulsion and
for fuel cells onboard spacecraft to produce power, heat, and water. The use of hydrogen in fuel
cells in the transportation sector is expected to grow rapidly in the coming years.
Today, roughly 95% of the hydrogen produced comes from reforming of natural gas.13 Most of
the remainder is produced by electrolysis of water. A small amount is produced by gasification
of coal or biomass, largely for research and development efforts. Since hydrogen must be
continually contained in a closed system, its method of production determines what impurities
it is likely to contain. The three major production methods used today are:
Steam methane reforming:
High‐temperature steam is combined with natural gas in the presence of a catalyst to
produce hydrogen. This energy intensive process is the most common and least‐
expensive method of production in use today.
12 U.S. Energy Information Administration, Hydrogen Explained – The Production of Hydrogen,
http://www.eia.gov/energyexplained/index.cfm?page=hydrogen_production. Accessed 10/29/13.
13 ibid.
Production of Hydrogen by Steam Reforming of Methane Steam-Methane Reforming Reaction: catalyst
CH4 + H
2O CO + 3 H
2
Water-Gas Shift Reaction CO + H
2O CO
2 + H
2 + heat

13
Electrolysis:
An electric circuit with two electrodes immersed in water is used to split the
water into its constituent elements hydrogen and oxygen. This process is the
reverse of that which occurs in a fuel cell. Electrolysis is a more expensive
process than steam reforming, but it can be scaled down in size easily.
Electrolysis units can be powered by solar or wind energy for off‐the‐grid
applications.
Gasification:
Heat is applied to coal or biomass in a controlled oxygen environment to produce a gas
that is further separated using steam to produce hydrogen. In the nineteenth century,
early gasification technology with coal and coke was used for gas lighting for streets,
homes, and businesses.
1.4 Introduction to Fuel Cell Vehicles
1.4.1 Historical Background
The first recorded observation of hydrogen is in a paper published in 1671 by the English
scientist Robert Boyle. Boyle observed that the action of an acid on iron filings produced a
Production of Hydrogen by Gasification
3C (coal) + O2 + H2O H2 + 3CO
Water-Gas Shift Reaction:
CO + H2O CO2 + H2 + heat
Production of Hydrogen by Electrolysis A voltage applied across two electrodes drives the reactions:
Oxidation: 2 H2O(l) O2(g) + 4 H+(aq) + 4e−
Reduction: 2 H+(aq) + 2e− H2(g)
The overall reaction is:
2 H2O(l) 2 H2(g) + O2(g) + heat
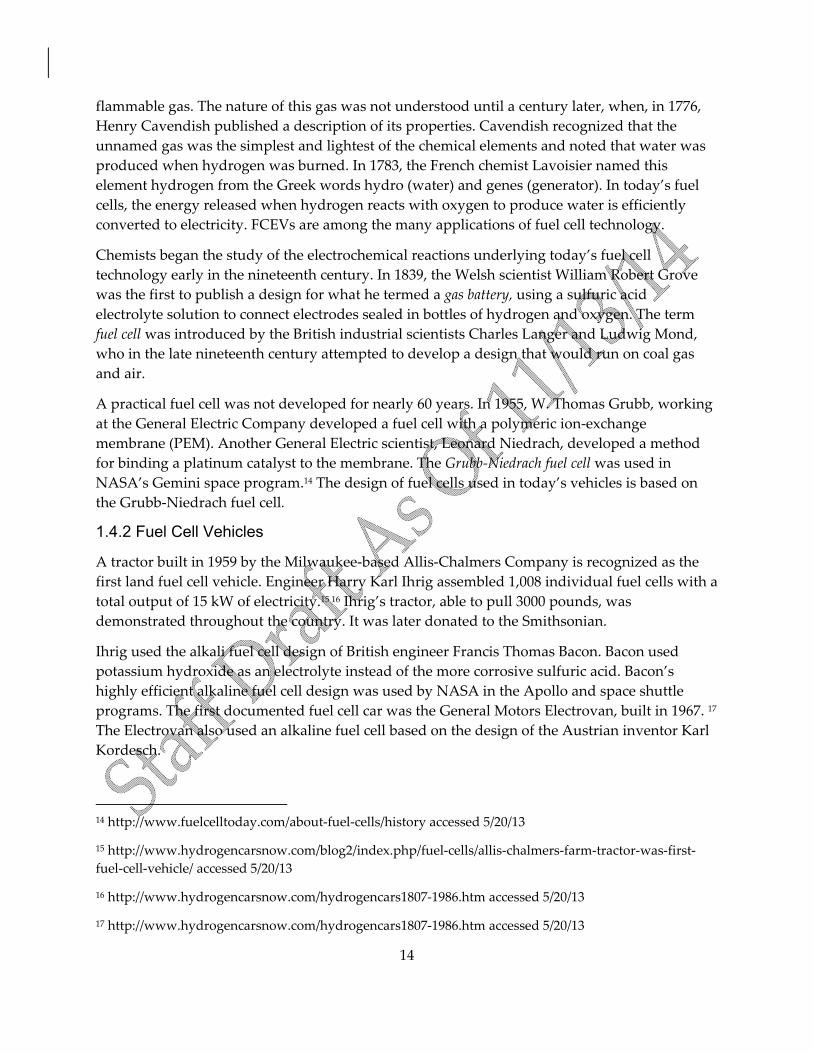
14
flammable gas. The nature of this gas was not understood until a century later, when, in 1776,
Henry Cavendish published a description of its properties. Cavendish recognized that the
unnamed gas was the simplest and lightest of the chemical elements and noted that water was
produced when hydrogen was burned. In 1783, the French chemist Lavoisier named this
element hydrogen from the Greek words hydro (water) and genes (generator). In today’s fuel
cells, the energy released when hydrogen reacts with oxygen to produce water is efficiently
converted to electricity. FCEVs are among the many applications of fuel cell technology.
Chemists began the study of the electrochemical reactions underlying today’s fuel cell
technology early in the nineteenth century. In 1839, the Welsh scientist William Robert Grove
was the first to publish a design for what he termed a gas battery, using a sulfuric acid
electrolyte solution to connect electrodes sealed in bottles of hydrogen and oxygen. The term
fuel cell was introduced by the British industrial scientists Charles Langer and Ludwig Mond,
who in the late nineteenth century attempted to develop a design that would run on coal gas
and air.
A practical fuel cell was not developed for nearly 60 years. In 1955, W. Thomas Grubb, working
at the General Electric Company developed a fuel cell with a polymeric ion‐exchange
membrane (PEM). Another General Electric scientist, Leonard Niedrach, developed a method
for binding a platinum catalyst to the membrane. The Grubb‐Niedrach fuel cell was used in
NASA’s Gemini space program.14 The design of fuel cells used in today’s vehicles is based on
the Grubb‐Niedrach fuel cell.
1.4.2 Fuel Cell Vehicles
A tractor built in 1959 by the Milwaukee‐based Allis‐Chalmers Company is recognized as the
first land fuel cell vehicle. Engineer Harry Karl Ihrig assembled 1,008 individual fuel cells with a
total output of 15 kW of electricity.15 16 Ihrig’s tractor, able to pull 3000 pounds, was
demonstrated throughout the country. It was later donated to the Smithsonian.
Ihrig used the alkali fuel cell design of British engineer Francis Thomas Bacon. Bacon used
potassium hydroxide as an electrolyte instead of the more corrosive sulfuric acid. Bacon’s
highly efficient alkaline fuel cell design was used by NASA in the Apollo and space shuttle
programs. The first documented fuel cell car was the General Motors Electrovan, built in 1967. 17
The Electrovan also used an alkaline fuel cell based on the design of the Austrian inventor Karl
Kordesch.
14 http://www.fuelcelltoday.com/about‐fuel‐cells/history accessed 5/20/13
15 http://www.hydrogencarsnow.com/blog2/index.php/fuel‐cells/allis‐chalmers‐farm‐tractor‐was‐first‐
fuel‐cell‐vehicle/ accessed 5/20/13
16 http://www.hydrogencarsnow.com/hydrogencars1807‐1986.htm accessed 5/20/13
17 http://www.hydrogencarsnow.com/hydrogencars1807‐1986.htm accessed 5/20/13

15
In spite of these early successes, alkaline fuel cells are considered impractical for widespread
use in land vehicles because of their relatively low power density. 18 In addition, the catalyst in
alkaline fuel cells is extremely sensitive to poisoning by CO2, and so requires not only
extremely pure hydrogen, but highly pure oxygen as well. 19
Automobile manufacturers have turned instead to proton exchange membrane (PEM) fuel cells
of the type first developed at General Electric. (These are also called polymeric electrolyte
membrane fuel cells.) PEM fuel cells operate at roughly 175 °F (80 °C), compared to a minimum
of 300 °F (150 °C) for alkaline fuel cells.20
PEM fuel cells today remain the technology of choice of automobile manufacturers. Fuel cell
design is rapidly evolving, with improvements continually being made in power density and
catalyst loading. These and other changes are continuing to reduce manufacturing costs.
A timeline that includes other key events in the history of hydrogen and fuel cell vehicles in
California is presented in Appendix A.
1.5 Hydrogen Fuel Specifications and Test Methods The California Legislature has determined that regulation of motor vehicle fuels offered for sale
in California is necessary for public safety and consumer protection. DMS has the responsibility
for establishing and enforcing quality standards for gasoline, diesel fuel, and alternative engine
fuels sold in California. The authority for these activities is established by the California Oil
Substitution Act, as enacted in 1931 (Statutes of 1931, Chapter 609) and subsequently amended.
The provisions of this legislation are found in the BPC, Division 5, Chapters 14 (Petroleum) and
15 (Automotive Products). Motor fuels produced and offered for sale in California are sampled
and tested in the CDFA laboratories in Sacramento and Anaheim to verify that they meet the
quality, performance, and drivability standards established in state law.
Senate Bill 76 (Statutes of 2005, Chapter 91) defined hydrogen as a motor vehicle fuel. This
definition is included in BPC Division 5, Chapter 14, Section 13401. Section 13446 of this
legislation made DMS responsible for enforcing quality standards for hydrogen fuel in
California. This required CDFA, with the concurrence of CARB, to adopt standards by
regulation for hydrogen fuel used in both fuel cells and internal combustion engines, until an
organization typically accredited by the American National Standards Institute (ANSI) formally
adopts standards. When this law was enacted, only a handful of standards applying to
hydrogen had been promulgated. These were not applicable to the very high purity
requirements of fuel cell applications. The Compressed Gas Association’s Standard G5.3
established specifications for lower purity hydrogen gas for industrial applications such as
welding. A US Department of Defense standard, MIL‐PRF‐27201D, was developed for
18 http://www.che.sc.edu/centers/PEMFC/about_fuelcell_1.html accessed 5/20/13
19 U.S. DOE EERE www1.eere.energy.gov/hydrogenandfuelcells/fuelcells/fc_types.html accessed 5/20/13
20 U.S. DOE EERE www1.eere.energy.gov/hydrogenandfuelcells/mypp/pdfs/fuel_cells.pdf
16
hydrogen used as a propellant; however, this standard did not include all of the contaminants
relevant to hydrogen used as fuel for FCEV. Technical Information Report (TIR) J2719 from SAE
International, an ANSI‐accredited standards developer, did provide specifications specifically
for hydrogen for fuel cells; however, this document was advisory only and could not serve as a
basis for regulation in California. To comply with Section 13446, the Department adopted
regulations in CCR Title 4, Division 9, Chapter 6, Article 8, Section 4181 establishing interim
standards for hydrogen fuel. These interim standards were developed by DMS working with
the Fuel Cell Standards Committee of SAE, and conformed closely to the advisory specifications
of TIR J2719. This development work was funded in part by an interagency agreement between
CDFA DMS and CARB (Agreement Number 05‐612).
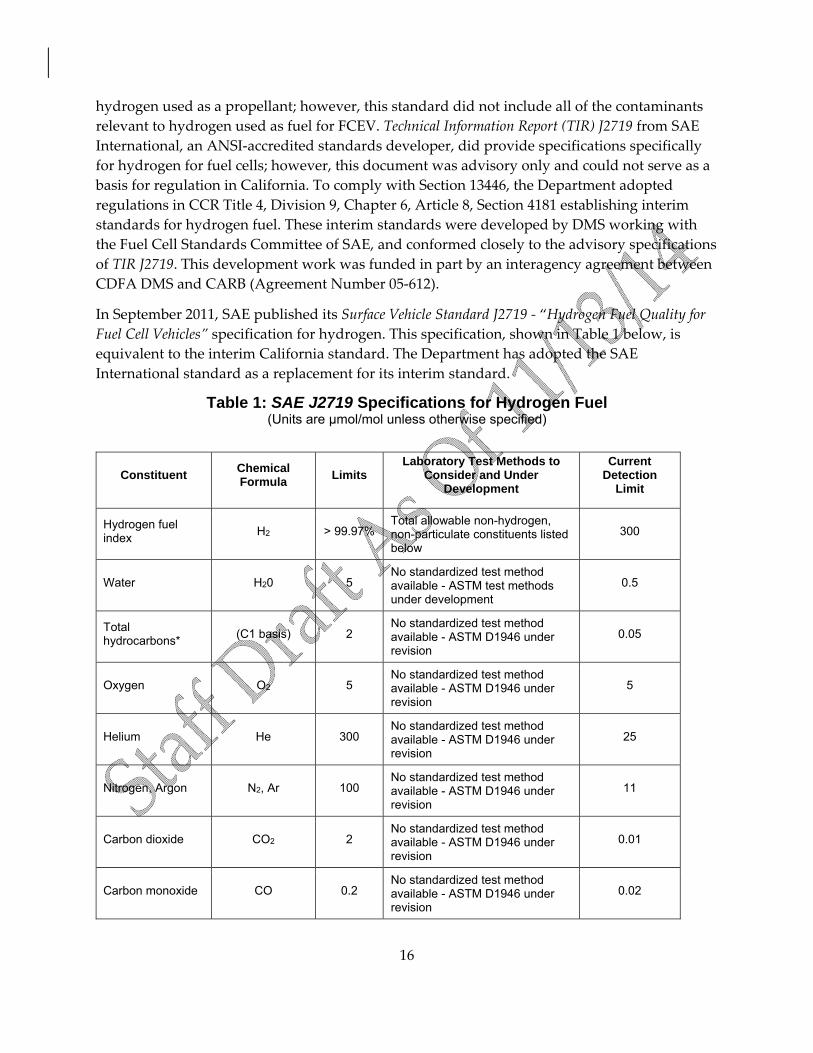
In September 2011, SAE published its Surface Vehicle Standard J2719 ‐ “Hydrogen Fuel Quality for
Fuel Cell Vehicles” specification for hydrogen. This specification, shown in Table 1 below, is
equivalent to the interim California standard. The Department has adopted the SAE
International standard as a replacement for its interim standard.
Table 1: SAE J2719 Specifications for Hydrogen Fuel (Units are μmol/mol unless otherwise specified)
Constituent Chemical Formula
Limits Laboratory Test Methods to
Consider and Under Development
Current Detection
Limit
Hydrogen fuel index
H2 > 99.97% Total allowable non-hydrogen, non-particulate constituents listed below
300
Water H20 5 No standardized test method available - ASTM test methods under development
0.5
Total hydrocarbons*
(C1 basis) 2 No standardized test method available - ASTM D1946 under revision
0.05
Oxygen O2 5 No standardized test method available - ASTM D1946 under revision
5
Helium He 300 No standardized test method available - ASTM D1946 under revision
25
Nitrogen, Argon N2, Ar 100 No standardized test method available - ASTM D1946 under revision
11
Carbon dioxide CO2 2 No standardized test method available - ASTM D1946 under revision
0.01
Carbon monoxide CO 0.2 No standardized test method available - ASTM D1946 under revision
0.02
17
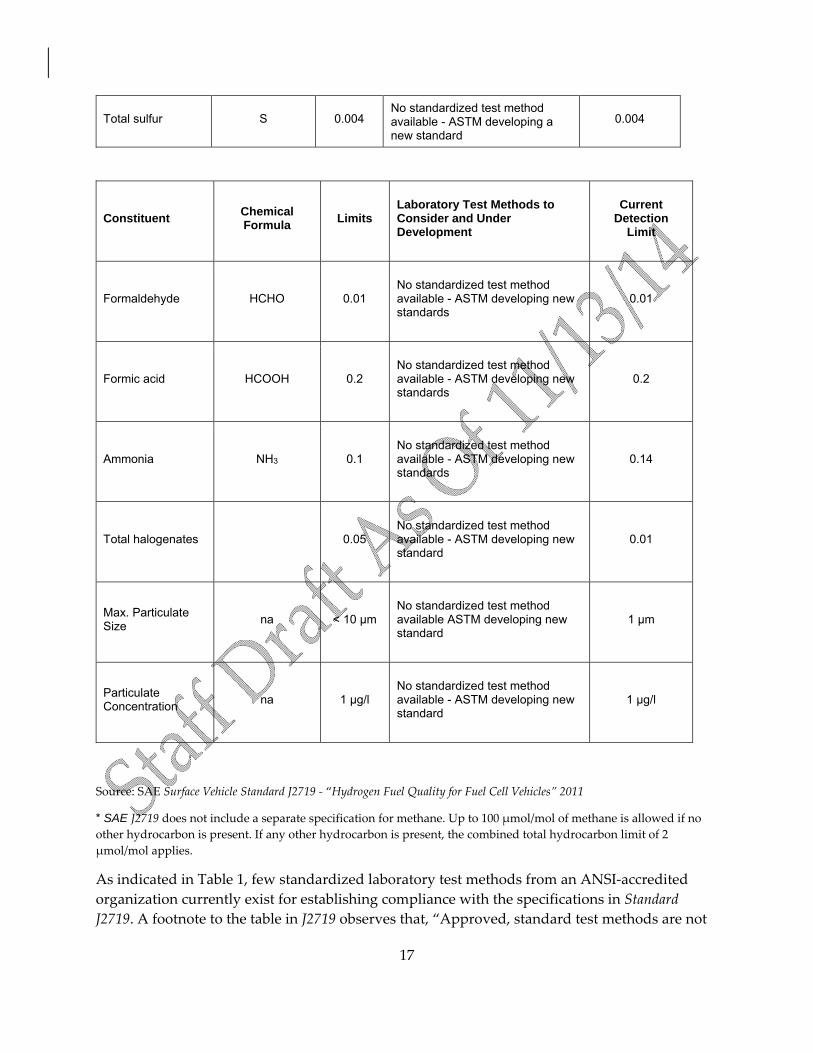
Source: SAE Surface Vehicle Standard J2719 ‐ “Hydrogen Fuel Quality for Fuel Cell Vehicles” 2011
* SAE J2719 does not include a separate specification for methane. Up to 100 μmol/mol of methane is allowed if no
other hydrocarbon is present. If any other hydrocarbon is present, the combined total hydrocarbon limit of 2
μmol/mol applies.
As indicated in Table 1, few standardized laboratory test methods from an ANSI‐accredited
organization currently exist for establishing compliance with the specifications in Standard
J2719. A footnote to the table in J2719 observes that, “Approved, standard test methods are not
Total sulfur S 0.004 No standardized test method available - ASTM developing a new standard
0.004
Constituent Chemical Formula
Limits Laboratory Test Methods to Consider and Under Development
Current Detection
Limit
Formaldehyde HCHO 0.01 No standardized test method available - ASTM developing new standards
0.01
Formic acid HCOOH 0.2 No standardized test method available - ASTM developing new standards
0.2
Ammonia NH3 0.1 No standardized test method available - ASTM developing new standards
0.14
Total halogenates 0.05 No standardized test method available - ASTM developing new standard
0.01
Max. Particulate Size
na < 10 μm No standardized test method available ASTM developing new standard
1 μm
Particulate Concentration
na 1 μg/l No standardized test method available - ASTM developing new standard
1 μg/l

18
available for detecting many of the non‐hydrogen constituents at the levels cited.” ASTM
D1946‐90 Standard Practice for Analysis of Reformed Gas by Gas Chromatography applies to the
compositional analysis of mixtures of hydrogen, oxygen, nitrogen, carbon monoxide, carbon
dioxide, methane, ethane, and ethylene. It was not developed for the determination of
ultra‐trace levels of these gases as impurities, and it does not include all of the contaminants of
interest for hydrogen fuel. No current ASTM method applies to the ultra‐trace analysis of
impurities in hydrogen.
There are some independent laboratories that can perform hydrogen analysis at the levels cited
using non‐standardized test methods and procedures. Standards development organizations
such as ASTM are in the process of developing consensus‐based test methods to analyze for
non‐hydrogen constituents at the low concentrations specified in Table 1. Several test methods
are under development by ASTM working groups. Other test methods have been adopted by
ASTM. However, these have not undergone full interlaboratory validation to demonstrate
adequate reproducibility and robustness. Without tested and approved analytical test methods,
the specifications in J2719 are unenforceable by regulatory agencies. This creates a critical
obstacle to the development of a viable hydrogen infrastructure. Impurities in hydrogen fuel
not only reduce fuel cell efficiency and compromise safety, but also can rapidly and irreversibly
degrade the fuel cell stack. All stakeholders need to have confidence in the quality, reliability,
and fairness of the hydrogen marketplace. The work reported here will promote these factors by
identifying a suite of test methods adequate for demonstrate compliance of a fuel sample with
SAE J2719.
1.6 Project Objectives
The work described in this report was undertaken by DMS as a first step in the development of
test methods to be adopted by ASTM International (ASTM, formerly known as the American
Society for Testing and Materials) to provide a foundation for construction of a hydrogen
infrastructure. The project was funded by the Energy Commission under Contract 600‐09‐015
with CDFA/DMS. The project involved several steps:
A survey of available test methods for the required analytes in hydrogen
A selection of the most promising of the available methods for evaluation
The purchase and installation of the equipment required to carry out the selected
methods
The evaluation of the selected test methods
The identification of gaps in analytical capability exposed in testing
The development of recommendations for future work to address these gaps
The presentation of results and recommendations to the Energy Commission, ASTM,
and other stakeholders

19
The end goal of this work is the development of a set of robust analytical methods to detect and
quantify impurities in hydrogen fuel as specified in SAE J2719. This set of methods is intended
to form a basis for the regulation of hydrogen fuel quality at some point in the future. Therefore,
it was necessary to consider from the outset such factors as cost, time, complexity, and
minimization of sample quantity for a complete analysis of a fuel sample. This project includes
the separation, identification, and quantification of contaminants present in hydrogen samples
above, at, and below the proposed reporting limits. However, it is not sufficient to develop
individual methods for each analyte in isolation. The goal is a set of analyses to be run as a
group for a complete determination of contaminants that may be present in a sample of
hydrogen fuel. Minimizing total analysis time and conserving as much of the original sample as
possible are very important for a set of methods that are applicable to regulatory enforcement.
1.6.1 Specification for Particulates
Particulates pose potential hazards in any liquid or gaseous fuel stream. Deposition of particles
can cause plugging of small orifices, filters, or screens as well as erosion of parts and assemblies
within the fuel delivery train.
SAE International published the first Technical Information Report (TIR) J2719 for hydrogen
fuel in November 2005. It set an upper limit of 1 μg/L for particulate quantity, with a maximum
size for all particulates of 10 μm. These specifications were adopted into California Code of
Regulations (CCR Title 4, Division 9, Chapter 6, Article 8, Section 4181) in September 2008.
In January 2010, CDFA/DMS chemist John Mough attended a joint SAE/International Standards
Organization (ISO) meeting in San Francisco, California. Official representatives of both the
SAE Fuel Cell Standard Committee and ISO Technical Committee 197 Working Group 12 were
present, along with representatives of FCEV manufacturers. Data21 from analytical work done
on hydrogen fuel samples collected in California was presented and discussed. This data
showed that in 68 sampling events, all samples passed the particulate quantity specification.
However, every sample failed the particulate size requirement. Based on these results, a change
in the particulate quantity specification from 1 μg/L to 1 mg/kg was adopted by the SAE and
ISO representatives present. This change was consistent with the method of sale for hydrogen
(by the kg rather than the L). It also lowered the quantity specification by a factor of 11 (11 μg/L
= 1 mg/kg).
Although the data supported lowering the specification to 0.1 mg/kg, all parties agreed that
there was no technical rationale for this level. It was also agreed that the fuel delivery systems
and nozzles would be exposed to uncontrollable environmental variables that could lead to
particulate contamination. Therefore, it was agreed that the particulate size requirement would
best be controlled by the automotive manufacturers with appropriate filters on board the
vehicle.
21 The data on particulates in hydrogen fuel samples discussed at this meeting is confidential business
information and is proprietary.

20
This was the status when the contract between the Energy Commission and DMS covering the
work reported here was signed in June 2010. Three months later, in Sept 2010, ASTM published
test method ASTM D7650‐10 Standard Test Method for Sampling of Particulate Matter in High
Pressure Hydrogen used as a Gaseous Fuel with an In‐Stream Filter, reflecting the consensus reached
at the January 2010 SAE/ISO meeting. A year later, in Sept 2011, SAE published Surface Vehicle
Standard J2719 – Hydrogen Fuel Quality for Fuel Cell Vehicles. With a consensus method in place, it
was not necessary for DMS to develop a method for the determination of particulates in
hydrogen fuel. This document is from an ANSI‐accredited Standards Development
Organization, and so has been adopted as the particulate specification for hydrogen in
California. In light of these developments, no work on particulates was performed by DMS
under this contract.
More recently, particulates have been found in some hydrogen fuel samples in California. Such
particulates have caused performance problems in vehicles without filters. Depending on
measures taken by hydrogen industry and vehicle manufacturers, future work to validate
ASTM D7650‐10 may be necessary.

21
CHAPTER 2: Analysis of Hydrogen Fuel Quality 2.1 Challenges in Hydrogen Fuel Analysis
Many well‐established standard test methods exist for the analytes specified in SAE J2719.
However, there are several challenges to their application to hydrogen fuel analysis:
The very low concentrations that must be reliably detected (less than 20 parts per billion
for most of the contaminants)
The physical characteristics of the hydrogen matrix, a high pressure, flammable gas that
is incompatible with many common materials
The need to draw a representative sample from storage tanks and dispensers
The need to deliver the required quantity of sample to an analyzer without changing its
composition
2.2 Survey of Existing Methods for the Analysis of Contaminants in Hydrogen
The complex matrix of impurities listed in SAE J2719 precludes the use of any single instrument
or method for hydrogen fuel quality analysis. The chemical contaminants vary widely in
physical and chemical properties. The maximum contamination levels range over
approximately five orders of magnitude. No one analytical technique can cover this range of
testing for all of the J2719 analytes. The goal of the survey of existing test methods was to
identify a minimum number of methods that apply to all the analytes and:
Have sufficient sensitivity.
Require minimum analysis times.
Use readily available and affordable laboratory equipment and apparatus.
Do not require exceptional expertise to perform.
To the extent possible, provide secondary methods for confirmation of findings.
These goals were formulated to provide gas suppliers, station operators, and regulators with
analytical methods that are fast, inexpensive, and reliable to ensure that hydrogen fuel offered
for sale meets the specifications of J2719.
Working groups of ASTM and the International Organization for Standardization (ISO) have
identified a suite of analytical methods with potential application to the analysis of impurities in
hydrogen fuel. Based on these lists and the criteria given above, the following methods were
considered for evaluation in this project:
GC‐Mass Spectrometry (GC‐MS) for the analysis of oxygen, nitrogen, argon, carbon
monoxide, carbon dioxide, hydrocarbons, and halogenates
GC‐Pulsed Discharge Helium Ionization Detector (GC‐PDHID) for the analysis of argon,
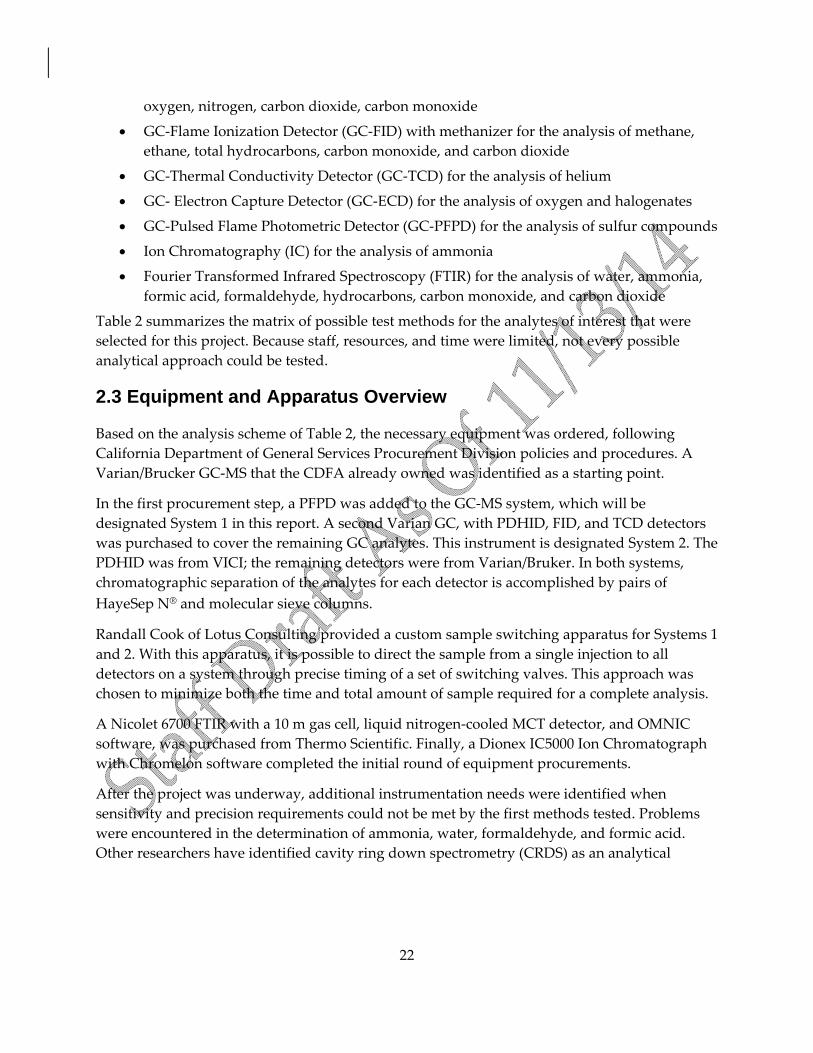
22
oxygen, nitrogen, carbon dioxide, carbon monoxide
GC‐Flame Ionization Detector (GC‐FID) with methanizer for the analysis of methane,
ethane, total hydrocarbons, carbon monoxide, and carbon dioxide
GC‐Thermal Conductivity Detector (GC‐TCD) for the analysis of helium
GC‐ Electron Capture Detector (GC‐ECD) for the analysis of oxygen and halogenates
GC‐Pulsed Flame Photometric Detector (GC‐PFPD) for the analysis of sulfur compounds
Ion Chromatography (IC) for the analysis of ammonia
Fourier Transformed Infrared Spectroscopy (FTIR) for the analysis of water, ammonia,
formic acid, formaldehyde, hydrocarbons, carbon monoxide, and carbon dioxide
Table 2 summarizes the matrix of possible test methods for the analytes of interest that were
selected for this project. Because staff, resources, and time were limited, not every possible
analytical approach could be tested.
2.3 Equipment and Apparatus Overview
Based on the analysis scheme of Table 2, the necessary equipment was ordered, following
California Department of General Services Procurement Division policies and procedures. A
Varian/Brucker GC‐MS that the CDFA already owned was identified as a starting point.
In the first procurement step, a PFPD was added to the GC‐MS system, which will be
designated System 1 in this report. A second Varian GC, with PDHID, FID, and TCD detectors
was purchased to cover the remaining GC analytes. This instrument is designated System 2. The
PDHID was from VICI; the remaining detectors were from Varian/Bruker. In both systems,
chromatographic separation of the analytes for each detector is accomplished by pairs of
HayeSep N® and molecular sieve columns.
Randall Cook of Lotus Consulting provided a custom sample switching apparatus for Systems 1
and 2. With this apparatus, it is possible to direct the sample from a single injection to all
detectors on a system through precise timing of a set of switching valves. This approach was
chosen to minimize both the time and total amount of sample required for a complete analysis.
A Nicolet 6700 FTIR with a 10 m gas cell, liquid nitrogen‐cooled MCT detector, and OMNIC
software, was purchased from Thermo Scientific. Finally, a Dionex IC5000 Ion Chromatograph
with Chromelon software completed the initial round of equipment procurements.
After the project was underway, additional instrumentation needs were identified when
sensitivity and precision requirements could not be met by the first methods tested. Problems
were encountered in the determination of ammonia, water, formaldehyde, and formic acid.
Other researchers have identified cavity ring down spectrometry (CRDS) as an analytical

23
method sensitive enough to determine both ammonia and water in hydrogen fuel.22 This
emerging technology can accurately determine the concentration of a specific analyte in this gas
phase by measuring the time required for decay of a characteristic frequency of light absorbed
by that analyte. A tuned laser and detector calibrated for a specific absorption frequency yields
a timed response that is a direct function of concentration. CRDS has been successfully applied
to the determination of water vapor in gaseous hydrogen samples down to 0.100 ppm. Recent
advances have led to CRDS instruments capable of analyzing ammonia in hydrogen down to
0.004 ppm. A CRDS gas analyzer configured for these analytes was purchased from Tiger
Optics after a test of a loaner instrument demonstrated adequate sensitivity. A module for
formaldehyde analysis was added later.
Table 2 –Analytical Options for Hydrogen Fuel Analysis
22 Andrew S. Brown et al, National Physical Laboratory Report AS 64 Methods for the analysis of trace‐level
impurities in hydrogen for fuel cell applications, August 2011.
Analytes
Detectors
Methanizer- GC- GC- GC- GC- GC- FTIR IC FID ECD PDHID PFPD TCD MS
water
hydrocarbons
oxygen
helium
nitrogen
argon carbon dioxide
carbon monoxide
sulfur compounds
formaldehyde
formic acid
ammonia
halogenates

24
A laboratory information management system (LIMS) was required for sample tracking, data
review, report generation, and data archiving. To meet this need, a second license was obtained
for the STARLIMS® system already in place at the CDFA Center for Analytical Chemistry. A
contract was signed with C&G Technology Services Inc. to customize the STARLIMS® system
for this project and to create a firewall between the two programs using the CDFA STARLIMS®
server. Custom software was written for DMS to allow the automatic uploading of data files
from the laboratory instruments to the STARLIMS® system, to eliminate typographical and
transcription errors arising from manual data entry. A barcode system was included to provide
tracking of the sample containers. Tracking of a sample chain of custody was also incorporated
in the customized STARLIMS® system. STARLIMS® is a web‐based application, so that future
expansion of the system can include sample logging in the field.
2.4 Preparation of Standards
Validated standards of the contaminants of interest in a hydrogen matrix are not commercially
available at this time. Therefore, laboratory staff designed an apparatus and developed
procedures to prepare the calibration and quality assurance standards required for this project.
Test standards were prepared from pure neat materials and diluted with ultra high‐purity
hydrogen. The preparation of standards is detailed in Hydrogen Laboratory Standard
Operating Procedure #3 ‐ for Preparation of Gaseous Hydrogen Standards. The complete SOP
may be found in Appendix B. A brief summary will be presented here.
Standard mixtures are prepared in 6 L SUMMA canisters. These canisters have electro‐polished
stainless steel interiors passivated with a coating of Silonite™ to reduce analyte adsorption.
Canisters were obtained from either Restek (catalog # 24142), or Entech Instruments Inc.
(catalog # 29‐10622G). In addition, a Model 3108 Canister Cleaner was purchased from Entech.
This cleaning system uses a combination of heat and vacuum to prevent cross‐contamination.
Figure 59 in Appendix C shows Summa canisters in the cleaning oven.
Figure 1 illustrates the valve and meter assembly used to introduce hydrogen and analytes into
the canisters. The unit consists of a pressure gauge, a septum‐equipped introduction tee, an
isolation valve, a hydrogen introduction valve, and an evacuation valve. This apparatus allows
for the evacuation of the standards preparation assembly, the introduction into the standards
container of an aliquot of neat material, using gas tight syringes, and dilution with ultra high
purity hydrogen.
The maximum working pressure for the SUMMA canisters is 40 psig. A pressure differential
between the canister and the inlet of the GC is required for the flow of sample to the instrument.
These considerations limit the volume of standard that can be prepared at one time to about 16
useable liters (L): 40 psi / 14.7 psi x 6L = 16.3 L (1 atm ~ 14.7 psi).
All standards that are purchased or prepared in the laboratory are assigned an S‐XXX or SHS‐
XXX number, respectively, to ensure traceability. An identification system and spreadsheet

25
Figure 1: Standards Preparation Apparatus (Photo Credit: DMS Hydrogen Laboratory)
were developed to track and record
standards receiving and preparation. The
numbering system for neat standards is S‐
XXX, where S stands for Sacramento and
XXX is a sequential number. The numbering
system for laboratory prepared standards is
SHS‐XXX, where SHS stands for Sacramento
Hydrogen Standard, and XXX is a sequential
number. These numbers are included in the
final laboratory analysis reports to document
the standards used for calibration. Examples
of these analytical reports are included in the
discussion below.
Most of the standards prepared are in the
low‐ to mid‐ppm range. The required volume
of an analyte is found using an Excel
‘Standard Prep Template’ that calculates the
volume required based on the target
concentration and pressure of the standard.
(Photo Credit: DMS Hydrogen Laboratory)
This spreadsheet calculates the volume of neat material necessary to produce a given final
volume and pressure. All standards that are received or prepared are assigned an S‐XXX or
SHS‐XXX number to ensure traceability. An example of the spreadsheet is found in Appendix B.
2.5 Sampling Apparatus and Method
Collecting a representative hydrogen fuel sample from a dispenser and maintaining it with no
change in composition throughout collection, transport, storage, and analysis poses a significant
challenge. A gaseous sample such as hydrogen fuel is homogenized through rapid diffusion of
the components within a container. However, trace impurities may be adsorbed on the surfaces
of the sampling interface, causing them to be under‐determined. Avoiding contamination
through the sampling process itself is also a challenge.
ASTM began the development of a test method for the sampling of high‐pressure hydrogen fuel
in 2008. The method was adopted as ASTM standard D7606‐11 Standard Practice for Sampling of
High Pressure Hydrogen and Related Fuel Cell Feed Gases in September 2011. D7606‐11gives
detailed instructions for the construction of a sampling apparatus for hydrogen fuel and for the
sample collection procedure. Figure 2 shows the hydrogen quality sampling apparatus (HQSA)
used for work reported here. The HQSA was designed according to the specifications of D7606‐

26
1231e. A container used to collect a hydrogen fuel sample can be seen in Figure 2 the attached to
the HQSA. These containers, from Entech Instruments Inc., were passivated before use. They
are rated for pressures up to1800 psi, and are filled to roughly 1000 psi in use.
Figure 2: Hydrogen Quality Sampling Apparatus
Photo Credit: DMS Hydrogen Laboratory
2.6 System 1 Instrumentation
System 1 is used for the analysis of oxygen, sulfur compounds, and halogenates. It consists of a
Bruker 450 GC equipped with a multi‐port auto‐sampling valve and three detectors (ECD,
PFPD, and a SCION SQ MS). The detectors and their target analytes are shown in Table 3. While
the MS detector is able to detect all analytes except helium, for this project, it was evaluated
only for those analytes listed in Table 3.
23 ASTM publications are protected by copyright, so details of D7606‐11 may not be reproduced in this
report. ASTM test methods are available for purchase from the ASTM website at
www.astm.org/Standard/index.shtml.

27
A schematic diagram of the sample flow path for System 1 is shown in Figure 3. A container of
the hydrogen gas sample or calibration mixture is connected through heated stainless steel gas
lines to the GC auto‐sampler. Sample introduction is controlled by the instrument software
interface. Three separate sampling loops concentrate and direct the sample to the appropriate
detectors through a series of carefully timed valve switching operations. The sample loops are
purged for 0.95 minutes at the start of each run to sweep out any impurities and ensure that
representative samples are obtained.
Figure 3: System 1 Sample Flow Path (ECD, PFPD, and Mass Spectrometer)
16-positionAutomated
Sampler Valve
Sample Pressure Regulator
Sample Path Switch
Sulfur Trap Isolation
Cryofocus Trap for Sulfur Compounds
CP5 CapillaryColumn
PFPD: Sulfur Compounds
MS TrapIsolation
Cryofocus Trap for Halogenates
CP 624Capillary Column
MS: Halogenates
Sample Path Switch
Sample Path Switch
HayeSep N® (remove CO2)
ECD:O2
Carboxen 1010 PLOT

30
Table 3: System 1 Detectors and Analytes
For oxygen analysis, the sample is injected onto HayeSep N® and Carboxen 1010 PLOT capillary
columns connected in series. The HayeSep N® column is used to retain CO2 and heavier
compounds from entering and contaminating the PLOT column. A valve is mounted between
the two columns and is switched to back flush the CO2 and other impurities out of the system
before the next injection.
The other two sample loops are mounted in separate cold traps held at ‐180 oC with liquid
nitrogen. These loops are purged for six minutes to concentrate the target sulfur and halogen
compounds at the sample inlet. After sample concentration, one sample loop is directed to a
Varian dimethylsiloxane CP5 CB capillary column connected to a PFPD for the determination of
total sulfur compounds. Total sulfur content is determined by summing individual analyte
peaks.
The third sample loop is directed to an Agilent CP 624 capillary column and the mass
spectrometer for the determination of halogenated compounds. The total halogenates is
determined by summing individual analyte peaks.
Key instrument parameters for System 1are listed in Appendix D.
2.7 System 2 Instrumentation
System 2 is used for the analysis of He, N2, Ar/O2, methane, total hydrocarbons (THC), CO and
CO2. It consists of a Bruker 450 GC equipped with a multi‐port auto‐sampling valve and 4
separate gas sampling loops serving 3 detectors. Table 4 lists the analytes seen by each of the
detectors in System 2.
A schematic diagram of the sample flow path for System 2 is shown in Figure 4. The sample
introduction interface is similar to that of System 1. There are four sample loops, which are
purged for 0.95 minutes to sweep out any impurities and ensure a representative sample for
each detector loop. A series of carefully timed valve switching operations then directs the
sample from each injection loop through the desired analytical path.
Detector Analytes
ECD O2
PFPD Sulfur compounds
MS Halogenates

31
Figure 4: System 2 Sample Flow Path (PDHID, FID, and TCD)
CO, CO2 HayeSep N®
(remove CO2) HayeSep N®
(remove > C1) HayeSep N®
(remove CO2)
16-positionAutomated
Sampler Valve
Sample Pressure Regulator
Sample Path Switch
Direct Injection to FID
FID - THC
Molecular Sieve
TCD: He PDHID: Ar, N2, O2
Methanizer
FID: CO, CO2 as Methane
FID: Methane
Molecular Sieve
MolecularSieve

32
Table 4: System 2 Detectors and Analytes
One sample loop goes directly to the FID for THC determination with no chromatographic
separation. J2719 requires a determination of methane separately from any other hydrocarbons
that may be present. This is accomplished by the second sample loop, which also goes to the
FID. Methane in a sample passes through a HayeSep N® column and a molecular sieve to the
detector. The HayeSep N® column retains CO, CO2, and any heavier hydrocarbons. CO and CO2
are flushed from the HayeSep N® to a methanizer that converts them to methane for detection
by the FID. The HayeSep N® is then isolated and back flushed to remove heavier hydrocarbons
and any other contaminants from the system before the next injection.
Both of the other two sample loops also pass through a HayeSep N® column followed by a
molecular sieve column. Between the two column types is a switching valve that can operate
the columns in series or bypass. The HayeSep N® column is used to separate and trap CO2 to
prevent contamination of the molecular sieves. The remaining sample is separated into its
components by the molecular sieve and carried forward to the individual detectors for
identification and quantification.
CO2 is detected and quantified by purging the HayeSep N® column in the FID sample loop
through a methanizer in which CO2 is converted to CH4 and then detected by the FID. CO can
also be detected by conversion to CH4 through the methanizer; however, the sensitivity was too
low to meet the reporting limit required by SAE J2719.
The remaining analytes in each sample loop are detected after chromatographic separation but
are chemically unaltered. Key instrument settings for System 2 are listed in Appendix D.
Detector Analytes
FID (direct inj.) Total hydrocarbons
FID Methane
Methanizer/FIDCO and CO2 (as methane)
PDHID Ar, N2, O2
TCD He

33
2.8 FTIR Spectrometer
Fourier Transform Infrared spectroscopy (FTIR) was evaluated for the analysis of
hydrocarbons, carbon dioxide, carbon monoxide, ammonia, and water. FTIR was chosen as one
on the starting points for this study due to its relatively short analysis times, readily available
commercial instruments, and ease of operation. FTIR is based on the characteristic frequencies
of vibrations of the atomic bonds within a molecule. An infrared beam passing through a
sample is attenuated when the frequency of the radiation matches a characteristic vibrational
frequency of an analyte. This attenuation is measured over a range of frequencies, typically 4000
to 400 cm‐1 (equivalent to a wavelength range of 25 to 2.5 μm), to produce an infrared spectrum.
The infrared spectrum of gases consists of a set of sharp peaks.
Most molecules have a characteristic infrared spectrum, which serves as a molecular
fingerprint. Completely symmetrical molecules, such as oxygen and nitrogen, and monatomic
species, including helium and argon, do not absorb mid‐infrared radiation. With these
exceptions, FTIR has the potential to be applicable the contaminants in SAE J2719. U.S. EPA
Method 320 “Measurement of Vapor Phase Organic and Inorganic Emissions by Extractive
Fourier Transform Infrared (FTIR) Spectroscopy”24 and U.S. EPA Method 8000C “Determinative
Chromatographic Separations”25 were used as a starting point for method development.
A Nicolet 6700 FTIR spectrometer, shown in Figure 5 was purchased for this study. It is
equipped with a 10 m heated gas cell, purged optical bench, and a liquid nitrogen‐cooled
mercury cadmium telluride (MCT) detector. Proprietary OMNIC software from Thermo‐
Scientific OMNIC operates the instrument and does the data collection and processing. Key
instrument parameters for the FTIR are included in Appendix D.
The sample interface for the FTIR had to meet several requirements. The pressure of the
hydrogen in the sample canister is much higher than is normally encountered in gas analysis.
Since the extremely low levels of detection were required, adsorption of analytes on transfer
lines or in the gas cell was of particular concern. An interface meeting these requirements was
not commercially available, so DMS laboratory staff designed and constructed a custom
interface, seen on the right in Figure 5. This interface includes:
An oven to heat the sample containers.
Heated transfer lines to a multi‐port selector valve.
A heated pressure regulator to reduce the incoming sample pressure to avoid over‐
pressurizing the gas cell.
Temperature controllers for the heated lines and regulator.
24 U.S. EPA Method 320 “Measurement of Vapor Phase Organic and Inorganic Emissions by Extractive Fourier
Transform Infrared (FTIR) Spectroscopy” epa.gov/ttn/emc/promgate/m‐320.pdf. Accessed online 7/22/13.
25 U.S. EPA Method 8000C “Determinative Chromatographic Separations”
epa.gov/osw/hazard/testmethods/pdfs/8000c_v3.pdf. Accessed online 7/29/13.

34
Pressure transducer and read‐out to monitor the gas cell pressure.
Rotameter for visual indication of flow.
Associated electronics for monitoring and control.
Key instrument settings for System 2 are listed in Appendix D.
Figure 5: Nicolet FTIR with Heated Gas Cell and Sample Interface
Photo Credit: DMS Hydrogen Laboratory
2.9 Cavity Ring Down Spectrometer: Cavity ring‐down spectroscopy (CRDS) was evaluated for the analysis of water and ammonia.
It may also be applicable to the analysis of formaldehyde and oxygen. CRDS is an emerging
technology that can accurately determine the concentration of a specific analyte based on the
time required for the decay, or ring down, of an optical signal due to absorption of a molecule’s
characteristic absorption frequency. A tuned laser and detector calibrated for the specific
frequency yields a timed response that is a direct function of concentration. This technology has
been demonstrated to be applicable to trace analysis in gas samples. It can be used for the
determination of water (H 2O) vapor in gaseous hydrogen down to 0.100 ppm. Recent
innovations have produced CRDS instruments capable of analyzing ammonia in hydrogen
down to 0.004 ppm. A CRDS instrument with modules for ammonia and water analysis was

35
brought to the DMS Hydrogen Laboratory for evaluation. Proof‐of‐concept experiments
established that CRDS is a viable method for the quantitative determination of ammonia in
hydrogen fuel samples. Based on this testing, a Tiger Optics Laser Trace 3X CRDS system for
ammonia was purchased. A CRDS module for the determination of formaldehyde was added
later.
Key instrument settings for the CRDS are included in Appendix D.

36
CHAPTER 3: Results and Discussion
3.1 System 1: Determination of oxygen, sulfur compounds, and halogenates
3.1.1 Halogenates
EPA Method TO‐15 was used as a guide in developing this analysis. 26A commercial calibration
mixture of halogenated and aromatic standards in nitrogen27 was used to identify compounds
that could be detected with sufficient sensitivity. Although this calibration mixture included
aromatic hydrocarbons, these were not included in the GC/MS analysis as part of this project. If
present in a hydrogen fuel sample, aromatics would be observed in the GC/MS chromatogram
and could be identified by their mass spectrum. The halogenated compounds in this mixture
are shown in Table 5. The nominal concentration for all analytes in the mixture was 1.00 ppm;
Table 5: Halogenates Tested by GC/MS
Halogenated Compounds Tested
Freon-12 1,1-Dichloroethane 1,2,4-Trichlorobenzene
Chloromethane 1,1,1-Trichloroethane Hexachloro-1,3-butadiene
Freon-114 Carbon tetrachloride cis-1,2- Dichloroethene
Vinyl chloride 1,2,-Dichloropropane Chloroform
Bromomethane Trichloroethylene 1,2-Dichloroethane
Chloroethane Chlorobenzene trans-1,2-Dichlorpropene
Freon-11 1,1,2,2-Tetrachloroethane cis-1,2-Dichlorpropene
1,1-Dichloroethene 1,2-Dichlorobenzene 1,1,2-Trichloroethane
Methylene chloride 1,3-Dichlorobenzene Tetrachloroethane
Freon-113 1,4-Dichlorobenzene 1,2-Dibromoethane
26 A pdf file of this EPA method can be found at http://www.epa.gov/ttn/amtic/files/ambient/airtox/to‐
15r.pdf . Accessed 2/4/14. 27 Restek TO‐14A Calibration Mix Catalog #34400

37
the NIST traceable certified concentrations ranged from 0.96 to 1.06 ppm. Calibrations were
determined over the range 2.5 – 30.0 ppb. This range was chosen to ensure that individual and
total analyte concentrations could be determined with the required sensitivity. For most
analytes, values of the correlation coefficient (R2) was greater than 0.9. Method detection limits
were not generated for these compounds because of the time required. These can be done in the
future for specific compounds that are detected in field samples.
A representative chromatogram of the standards mixture is shown in Figure 6. For clarity, not
all peaks are labeled.
Figure 6: GC/MS Chromatogram of Halogenated Standards (source DMS Hydrogen Laboratory)
TIC; ICAL Level 5, Inj 2, 12-4-2013, 02-09-44.xms
0
100
200
300
400
500
Retention time (minutes)
Det
ecto
r si
gnal
(M
Cps
)
20 30 40 50 60 70
12.4
29 -
Dic
hlor
odifl
uoro
met
hane
(F
reon
-12)
16.5
79 -
Chl
orom
etha
ne
16.6
09 -
1,2
-Dic
hlor
o-1,
1,2,
2-te
traf
luor
oeth
ane
19.5
05 -
Vin
yl c
hlor
ide
24.2
90 -
Chl
oroe
than
e 24
.428
- B
rom
omet
hane
28.9
59 -
Tric
hlor
omon
oflu
orom
etha
ne (
Fre
on-1
1)
32.9
50 -
1,1
-Dic
hlor
oeth
ene
33.6
19 -
1,1
,2-T
richl
oro-
1,2,
2-tr
ifluo
roet
hane
(F
reon
-113
)
36.5
98 -
Met
hyle
ne c
hlor
ide
39.9
78 -
1,1
-Dic
hlor
oeth
ane
45.0
58 -
Car
bon
Tet
rach
lorid
e 46
.379
- 1
,2-D
ichl
oroe
than
e
48.8
23 -
Tric
hlor
oeth
ene
49.7
29 -
1,2
-dic
hlor
opro
pane
57.8
54 -
1,2
-Dib
rom
oeth
ane
60.0
56 -
Chl
orob
enze
ne 65
.332
- 1
,1,2
,2-T
etra
chlo
roet
hane
67.6
94 -
1,3
-Dic
hlor
oben
zene
68.8
12 -
1,2
-Dic
hlor
oben
zene
72.5
45 -
1,2
,4-T
richl
orob
enze
ne
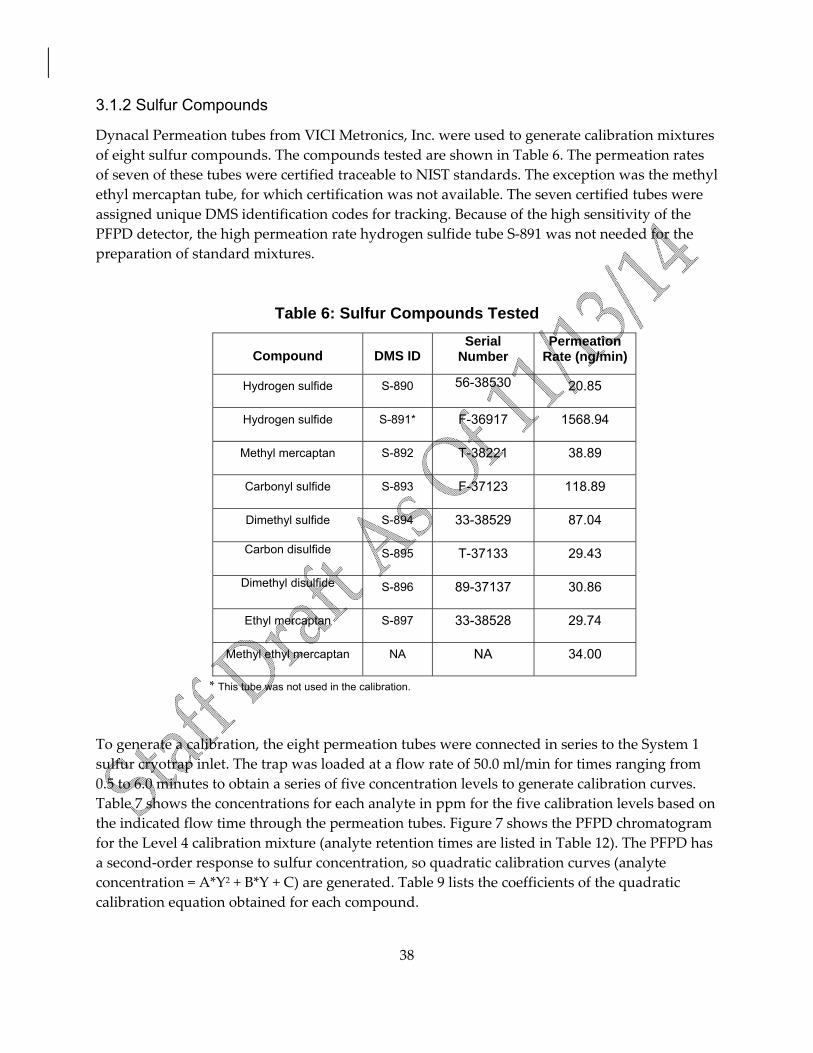
38
3.1.2 Sulfur Compounds
Dynacal Permeation tubes from VICI Metronics, Inc. were used to generate calibration mixtures
of eight sulfur compounds. The compounds tested are shown in Table 6. The permeation rates
of seven of these tubes were certified traceable to NIST standards. The exception was the methyl
ethyl mercaptan tube, for which certification was not available. The seven certified tubes were
assigned unique DMS identification codes for tracking. Because of the high sensitivity of the
PFPD detector, the high permeation rate hydrogen sulfide tube S‐891 was not needed for the
preparation of standard mixtures.
Table 6: Sulfur Compounds Tested
Compound DMS ID Serial
Number Permeation
Rate (ng/min)
Hydrogen sulfide S-890 56-38530 20.85
Hydrogen sulfide S-891* F-36917 1568.94
Methyl mercaptan S-892 T-38221 38.89
Carbonyl sulfide S-893 F-37123 118.89
Dimethyl sulfide S-894 33-38529 87.04
Carbon disulfide S-895 T-37133 29.43
Dimethyl disulfide S-896 89-37137 30.86
Ethyl mercaptan S-897 33-38528 29.74
Methyl ethyl mercaptan NA NA 34.00
* This tube was not used in the calibration.
To generate a calibration, the eight permeation tubes were connected in series to the System 1
sulfur cryotrap inlet. The trap was loaded at a flow rate of 50.0 ml/min for times ranging from
0.5 to 6.0 minutes to obtain a series of five concentration levels to generate calibration curves.
Table 7 shows the concentrations for each analyte in ppm for the five calibration levels based on
the indicated flow time through the permeation tubes. Figure 7 shows the PFPD chromatogram
for the Level 4 calibration mixture (analyte retention times are listed in Table 12). The PFPD has
a second‐order response to sulfur concentration, so quadratic calibration curves (analyte
concentration = A*Y2 + B*Y + C) are generated. Table 9 lists the coefficients of the quadratic
calibration equation obtained for each compound.

39
Figure 7: PFPD Chromatogram of Sulfur Compounds
Table 7: Sulfur Compound Calibration Mixtures (Concentrations in ppm)
Compound Level 1:
6 minutes Level 2:
3 minutes Level 3:
2 minutes Level 4: 1 minute
Level 5: 0.5 minute
Hydrogen sulfide 0.0626 0.0313 0.0209 0.0104 0.0052
Carbonyl sulfide 0.2025 0.1012 0.0675 0.0337 0.0169
Methyl mercaptan 0.0827 0.0413 0.0276 0.0138 0.0069
Ethyl mercaptan 0.0490 0.0245 0.0163 0.0082 0.0041
Carbon disulfide 0.0395 0.0198 0.0132 0.0066 0.0033
Dimethyl sulfide 0.1433 0.0717 0.0478 0.0239 0.0119
Methyl ethyl mercaptan
0.0457 0.0228 0.0152 0.0076 0.0038
Dimethyl disulfide 0.0395 0.0198 0.0132 0.0066 0.0033

40
Table 8: Sulfur Compound Peak Areas and Response Factors from the Initial Calibration
Peak Areas from Initial Calibration
Compound Level 1 Level 2 Level 3 Level 4 Level 5
Hydrogen sulfide 8448 2643 800 180 144
Carbonyl sulfide 367000 251113 82333 41540 15715
Methyl mercaptan 29301 11770 4833 762 323
Ethyl mercaptan 21438 5883 2777 518 350
Carbon disulfide 223994 57542 19344 4916 1365
Dimethyl sulfide 69633 19530 7977 2195 488
Methyl ethyl mercaptan
19761 6706 3129 794 130
Dimethyl disulfide 97203 21033 9109 1933 417

41
Table 9: Sulfur Compound Calibration Equation Coefficients
Analyte A B C
Hydrogen sulfide 1.82E+06 2.44E+04 -8.64E+03
Carbonyl sulfide 4.28E+06 9.40E+05 -3.66E+05
Methyl mercaptan 1.65E+06 2.46E+05 -31543.7
Ethyl mercaptan 8.05E+06 4.61E+04 -21585.25
Carbon disulfide 1.46E+08 -9.17E+04 -224961.56
Dimethyl sulfide 3.02E+06 5.88E+04 -70542.64
Methyl ethyl mercaptan 5.76E+06 1.88E+05 -20599.77
Dimethyl disulfide 9.85E+07 -4.32E+05 -96081
An MDL study was performed using concentration Level 4. Table 10 shows the observed peak
areas, and Table 11 shows the calculated concentration for each data point. Note that the peak
area for MDL 1 for carbonyl sulfide appears to be an outlier, and so was omitted from the MDL
calculation. Table 12 shows the retention time, calculated MDL, standard deviation, and Student
t‐test statistic for each analyte. The t‐test value for carbonyl sulfide is based on seven and not
eight data points, and so is higher than that of the other analytes.
Response Factors from Initial Calibration
Compound RF1 RF2 RF3 RF4 RF5 RSD
Hydrogen sulfide 134973.75 84454.46 38344.82 17255.17 27608.27 80.78
Carbonyl sulfide 1812509.35 2480352.38 1219858.31 1230925.97 931343.36 40.25
Methyl mercaptan 354308.64 284646.44 175322.38 55284.77 46868.72 74.50
Ethyl mercaptan 437770.55 240265.34 170121.58 63466.32 85765.29 75.50
Carbon disulfide 5664416.50 2910273.08 1467527.78 745902.25 414221.55 95.57
Dimethyl sulfide 485846.93 272531.43 166972.60 91890.40 40858.78 83.33
Methyl ethyl mercaptan
432672.03 293659.09 205530.71 104308.97 34156.59 73.35
Dimethyl disulfide 2900257.36 1255128.20 815358.92 346050.89 149304.94 100.39

42
Table 10: Sulfur Compound MDL Peak Areas
Hydrogen
sulfide Carbonyl sulfide
Methyl mercaptan
Ethyl mercaptan
MDL 1 380 4989 882 861
MDL 2 400 10732 764 764
MDL 3 521 12544 1383 1188
MDL 4 470 11207 1120 873
MDL 5 725 9105 1057 680
MDL 6 531 10761 1010 669
MDL 7 443 13053 1168 732
MDL 8 546 11214 1276 685

43
Carbon
disulfide Dimethyl sulfide
Methyl ethyl mercaptan
Dimethyl disulfide
MDL 1 9015 3532 1047 3029
MDL 2 8401 3305 1103 3320
MDL 3 11274 4226 1808 4544
MDL 4 9601 3726 1359 3428
MDL 5 6545 2825 806 2904
MDL 6 6562 2854 1003 2696
MDL 7 6428 2812 875 2644
MDL 8 5937 2625 839 2457
Table 11: Sulfur Compound Measured MDL Concentrations
Calculated Concentration in ppm
Analyte MDL 1 MDL 2 MDL 3 MDL 4
Hydrogen sulfide 0.0122 0.0125 0.0141 0.0134
Carbonyl sulfide -- 0.0099 0.0117 0.0104
Methyl mercaptan 0.0118 0.0127 0.0135 0.0126
Ethyl mercaptan 0.0087 0.0082 0.0103 0.0087
Carbon disulfide 0.0086 0.0083 0.0095 0.0088
Dimethyl sulfide 0.0298 0.0289 0.0326 0.0306
Methyl ethyl mercaptan 0.0080 0.0082 0.0106 0.0091
Dimethyl disulfide 0.0071 0.0074 0.0085 0.0075

44
Calculated Concentration in ppm
Analyte MDL 5 MDL 6 MDL 7 MDL 8
Hydrogen sulfide 0.0167 0.0143 0.0131 0.0145
Carbonyl sulfide 0.0083 0.0099 0.0121 0.0104
Methyl mercaptan 0.0124 0.0122 0.0128 0.0132
Ethyl mercaptan 0.0077 0.0076 0.0080 0.0077
Carbon disulfide 0.0075 0.0075 0.0074 0.0072
Dimethyl sulfide 0.0070 0.0068 0.0067 0.0065
Methyl ethyl mercaptan 0.0072 0.0079 0.0074 0.0073
Dimethyl disulfide 0.0070 0.0068 0.0067 0.0065
Table 12: Sulfur Compound MDL Calculation Results
Ret. Time (Minutes) MDL-PPM Std. Dev.
t-test VALUE
Hydrogen sulfide 9.908 0.0042 0.00141 2.998
Carbonyl sulfide 11.133 0.0040 0.00126 3.143
Methyl mercaptan 22.046 0.0016 0.00054 2.998
Ethyl mercaptan 30.102 0.0027 0.00091 2.998
Carbon disulfide 31.670 0.0025 0.00082 2.998
Dimethyl sulfide 32.249 0.0071 0.00238 2.998
Methyl ethyl mercaptan 39.271 0.0035 0.00115 2.998
Dimethyl disulfide 48.173 0.0019 0.00063 2.998

45
3.1.3 Oxygen
Although the ECD has adequate sensitivity for this analysis, a satisfactory calibration could not
be obtained because of inconsistent detector response between successive injections. A
replacement ECD exhibited similar behavior. The cause of this unstable response has not been
determined. Future work will be required to determine whether an ECD method for the
analysis of oxygen in hydrogen fuel can be developed.
The sensitivity of the PDHID for oxygen is not sufficient to achieve the MDL required by the
specification in J2719. Mass spectrometry is one possible alternative analytical approach for
oxygen analysis. Recently, a CRDS module for oxygen has been introduced. In view of the
successful application of CRDS to the determination of water and ammonia, this is another
potential alternative method for the determination of oxygen in hydrogen.
3.2 System 2: Determination of Helium, Argon, Oxygen, Nitrogen, Carbon Dioxide, Total Hydrocarbons, and Methane
3.2.1 Helium by GC-TCD
Figure 8 shows a representative TCD chromatogram for helium. Table 13 lists the helium
concentrations used for the initial calibration. The TCD calibration report for He is shown in
Figure 9. A correlation coefficient of 0.992 was obtained for the He calibration.
Table 13: Helium Calibration Standards
Level Standard ID Conc. (ppm)
Level 1 SHS-143 48.5
Level 2 SHS-144 193
Level 3 SHS-145 301
Level 4 SHS-146 400
Level 5 SHS-147 608
3.2.2 CO, CO2, Methane, and THC by GC-FID
Figure 10 shows an FID chromatogram for CO, CO2, Methane, and THC. The upsets in the
baseline during the first three minutes of the run are due to changes in the GC column pressure
that occur as the valves in the sampling system are switched. The elution time for carbon
monoxide is approximately 8.15 minutes. However, as the chromatogram shows, the FID
detector signal is too weak to identify carbon monoxide at the levels required.
Table 14 lists the concentrations used for the initial FID calibration. Propane was used in the
calibration mixtures as a surrogate non‐methane hydrocarbon. The THC concentration at each
level is the sum of the methane and propane concentrations.

46
Figure 8: System 2 TCD Chromatogram for Helium
5.877 Helium
Hydrogen 7.035

47
Figure 9: TCD Calibration Report for Helium

48
Figure 10: System 2 FID Chromatogram

49
Table 14: Calibration Mixture Concentrations for System 2 FID
Analyte Concentrations
Level Standard ID Methane Propane THC CO2 CO
Level 1 SHS-159 0.5 ppm 0.5 ppm 2.0 ppm 0.5 ppm .05 ppm
Level 2 SHS-158 1.0 ppm 1.0 ppm 4.0 ppm 1.0 ppm 0.1 ppm
Level 3 SHS-157 2.0 ppm 2.0 ppm 8.0 ppm 2.0 ppm 0.2 ppm
Level 4 SHS-156 3.0 ppm 3.0 ppm 12.0 ppm 3.0 ppm 0.3 ppm
Level 5 SHS-155 5.0 ppm 5.0 ppm 20.0 ppm 5.0 ppm 0.5 ppm
The FID calibration reports for Total Hydrocarbons, CH4, and CO2 are shown in Figures 11‐13.
As the graphs show, highly precise and stable calibrations were obtained, with correlation
coefficients greater than 0.99 for all three analytes.
3.2.3 GC-PDHID: Nitrogen and Argon
Figure 14 shows a PDHID chromatogram for Nitrogen, Argon, and Oxygen. Table 15 lists the
concentrations used for the initial PDHID calibration. The calibration reports for nitrogen and
argon are shown in Figures 14‐15. The PDHID sensitivity for oxygen is too low to reach the
detection limit required by J2719.
Table 15: Calibration Mixture Concentrations for System 2 PDHID
Calibration Level
Standard ID
Analyte Concentrations (ppm)
Nitrogen Argon O2 Argon+O2
Level 1 SHS-190 25 25 1 26
Level 2 SHS-189 50 50 2 52
Level 3 SHS-194 97 97 5 102
Level 4 SHS-192 200 200 10 210
Level 5 SHS-193 398 418 20 418
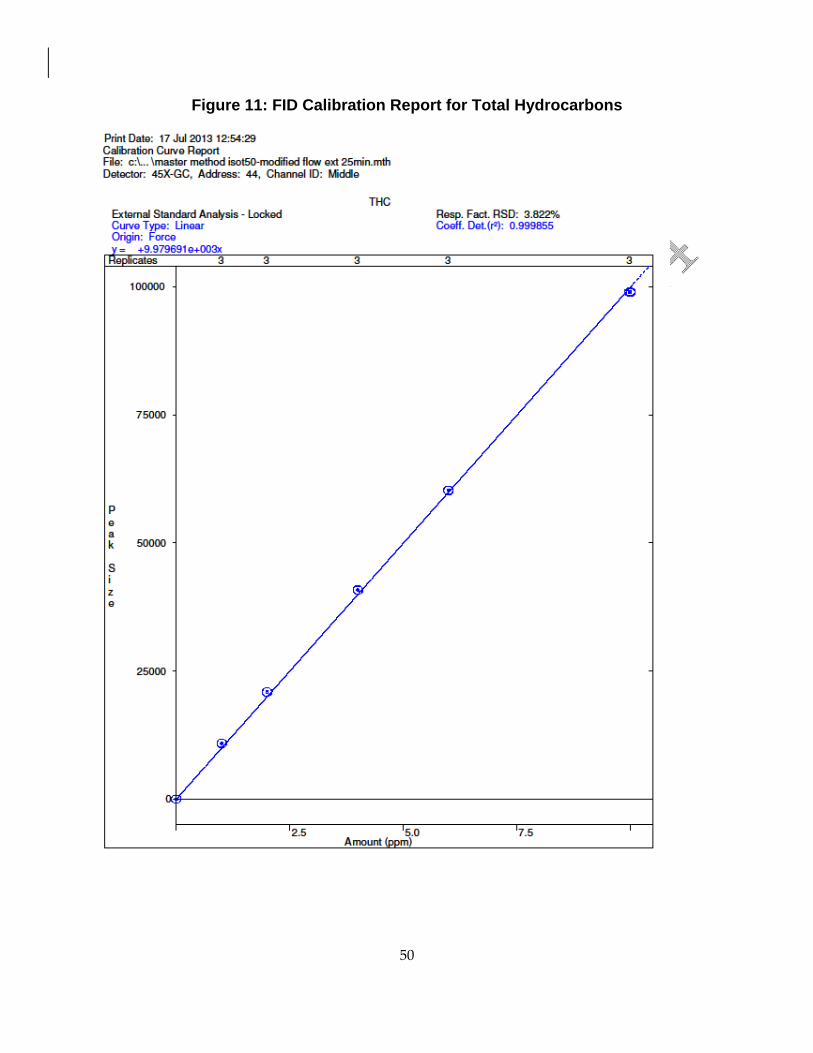
50
Figure 11: FID Calibration Report for Total Hydrocarbons

51
Figure 12: FID Calibration Report for Methane

52
Figure 13: FID Calibration Report for Carbon Dioxide

53
With the analytical columns used, Ar and O2 co‐elute. However, the PDHID sensitivity for O2 is
much lower than for Ar, so that there is not a significant interference from the oxygen in the
calibration standard mixtures. N2 can be reliably identified and quantified at the required levels
using the PDHID. Helium can be reliably identified and quantified at the required levels
utilizing TCD. THC, Methane, and CO2 can be reliably identified and quantified at the required
levels utilizing FID. Carbon monoxide is not detectable at the required levels under the GC‐FID
conditions utilized in the laboratory studies. Method detection limits were determined in
accordance with procedures outlined in US EPA 40 CFR Section 136 Appendix D. The
calculated method detection limits (MDL) for the System 2 analytes are shown in Table 16.
Table 17 lists the J2719 specifications along with these MDLs.
Table 16: System 2 MDL Calculations
Calc. Conc. (ppm) 19.87 19.87 0.41 0.41 0.41 29.80
PDHID
FID
TCD
MDL Argon Nitrogen THC CO2 Methane Helium
1 27.59 72.41 0.17 0.75 0.37 44.67
2 27.62 72.37 0.18 0.8 0.41 43.49
3 27.83 72.17 0.18 0.87 0.43 36.42
4 27.39 72.61 0.18 0.89 0.41 42.50
5 27.51 72.49 0.18 0.99 0.37 36.16
6 27.69 72.31 0.18 0.92 0.40 36.36
7 27.47 72.53 0.18 0.98 0.34 36.37
8 28.01 71.99 0.18 0.87 0.42 34.63
9 27.6 72.4 0.18 0.86 0.45 34.3
Mean 27.63 72.36 0.18 0.88 0.40 38.32
ST DEV 3.826 3.826 0.004 0.081 0.035 6.990
MDL 11.08 11.08 0.012 0.23 0.10 20.25
The PDHID calibration reports for nitrogen and argon are shown in Figures 14 and 15.
Correlation coefficients of 0.952for nitrogen and 0.990 for argon were obtained. As noted above,
the PDHID sensitivity for oxygen was too low to meet the J2719 specification.

54
Figure 14: PDHID Calibration Report for Nitrogen

55
Figure 15: PDHID Calibration Report for Argon

56
Table 17: System 2 MDLs and SAE J2719 Reporting Limits
Analyte Detector MDL
SAE J2719 limits
Ar PDHID 11.08 ppm 100 ppm
N2 PDHID 11.08 ppm 100 ppm
CH4 FID 0.044 ppm 2 ppm
CO2 FID 0.234 ppm 2 ppm
THC FID 0.012 ppm 2 ppm
He TCD 20.24 ppm 300 ppm
CO* above RL 2 ppm
O2** above RL 5 ppm
* CO could not be detected at the J2719 RL.
** O2 could not be resolved from Ar.
3.3 IC: Evaluation for NH3
ASTM method D7550‐09 was developed for the determination of cations in fuel cell feed gases
using ion chromatography with a conductivity detector (IC/CD). This method was validated
over a concentration range of 0.1 to 2.0 ppm ammonium ion. However, when SAE J2719 was
issued two years later, in September 2011, the maximum allowable concentration for ammonia
in hydrogen fuel was set at 0.1 ppm, the bottom of the calibration range. An effort was made to
extend the calibration range by modifying the procedure outlined in D7550‐09. A lower
calibration limit of at least 0.02 ppm is needed for the determination of ammonia at 0.1 ppm
with sufficient precision for future regulatory enforcement.
Standards were prepared to test the sensitivity of the IC/CD system at the level required. Figure
16 shows an ion chromatogram of a mixture of cations at 0.1 ppb.
Samples of hydrogen gas containing ammonia were connected to a sparger tube assembly with
the fritted glass diffusion tip submersed in a dilute sulfuric acid solution (10.0 ml of 0.01N
H2SO4). The gas was bubbled into the acid sample at a rate of ~ 50ml/min as indicated on a
calibrated flow meter corrected for hydrogen. After a timed interval of sparging (gas diffusion
into liquid), the gas sparger tube was removed and samples of the acid trapping solution were
analyzed by IC/DC on a Dionex 5000. Known concentrations of ammonia in hydrogen were
used as samples and the IC results were contrasted with the known concentrations.
Experimental results were less than optimal for an analytical determination of ammonia. The

57
Figure 16: IC/CD Chromatogram of Cation Mixture at 0.1 ppb
calculated trapping efficiency (IC concentration / known concentration x 100%) varied from
sample to sample. Initial samples of highly concentrated ammonia (400 ppmv) in hydrogen
demonstrated a trapping efficiency of ~ 85%. Samples of hydrogen with 50 ppmv ammonia
demonstrated ~ 78% efficiency. Samples at low levels – but still double the SAE J‐2719 reporting
limit of 0.200 ppmv ammonia in hydrogen, resulted in no detectable ammonium ion in the
trapping solution.
In another test, 10.0 ml of acid solution were charged into a clean (sampled and tested by IC to
contain no residual ammonium ion) trapping bottle. The gas sparging apparatus was connected
to the gas cylinder containing reference standard SHS‐52 with 0.4 ppmv ammonia in hydrogen.
The sample was sparged into the trapping solution at a rate of 46.7ml/min for 3.0 minutes
representing 140.1ml of total gas volume sparged into acid trap. The acid trap solution was then

58
analyzed by IC. The resulting ion chromatogram indicated no detectable level of ammonia
present. If the trapping were 100% efficient, this sample would be equivalent to 4.5 ppb of
ammonia in hydrogen, as shown in the sample calculation below:
Gasml.1.140 x
Gasml
mlNHx
.
10400.0 36
x 3
33
104.22
1
mlNHx
gasmoleNH x
3
4
1
1
molNH
moleNH
x
4
40.18
molNH
gNH x
ml0.10
1=
ml
gx 91050.4
= 4.5 ppb
Standard ionic solutions containing ammonium have been prepared down to 0.76 ppb of
ammonia. Ammonia in solution is both identifiable and quantifiable by IC using the current
system method. However, there does not appear to be any way to quantitatively transfer
ammonia entrained in a gaseous sample to the IC eluant. Therefore, IC cannot be applied to the
analysis of hydrogen fuel. Since the IC investigation of ammonia failed, the determination of
formaldehyde by IC was not pursued.
3.4 FTIR: Determination of CO, CO2, NH3, H2O, and Hydrocarbons
The FTIR was evaluated for the identification and quantification of carbon monoxide (CO),
carbon dioxide (CO2), methane (CH4) and related hydrocarbons, ammonia (NH3), and water
vapor (H2O). Each indicated impurity or analyte has a distinguishable infrared spectrum that
differentiates it from other compounds. The amount of infrared absorption is directly
proportional to the concentration each analyte. EPA Method 320 give general guidance on
analytical protocols and data interpretation, but specific information regarding instrumental
settings depends upon the matrix being tested. A series of experiments was undertaken to
determine the optimal parameters for hydrogen fuel analysis. Figure 17 show the background
absorption in the cell was recorded at a fixed resolution of 0.25 cm‐1 averaged over a number of
scans ranging from 32 to 512. The peaks are due to water vapor and CO2. Figure 18 shows a
region with no background absorption so that the differences in baseline noise may be seen
more clearly. The plots in Figure 17 are all on the same scale, so it is apparent that increasing the
number of scans decreases the baseline noise. Lower baseline noise increases sensitivity, so that
analytes can be detected at lower levels; however, increasing the number of scans from 32 to
1,512 has increases the analysis time from 1:36 to 25:47 minutes.

59
Figure 17: Background Infrared Absorption of the Cell with Increasing Number of Scans

60
Figure 18: Baseline Noise as a Function of Scan Number

61
Table 18 shows the Peak‐Peak (P‐P), Root Means Square (RMS) noise, maximum CO2
absorbance, signal‐to‐noise ratio, and analysis time as a function of the number of scans
collected from the data above:
Table 18: Analysis Parameters as a Function of Number of Scans
Number of Scans P-P noise RMS noise
Maximum CO2 Absorbance S/N
Analysis Time (min)
32 Scans 0.001395 0.0002081 0.0021 10.1 1:36
64 Scans 0.001123 0.0001527 0.0033 21.6 3:13
128 Scans 0.0007577 0.0001091 0.0060 55.0 6:26
256 Scans 0.0005583 0.00007469 0.0090 120.5 12:53
512 Scans 0.0003893 0.00005354 0.024 444.4 25:47
Another series of experiments was undertaken to determine the optimal parameters for sample
analysis. A hydrogen‐filled cell was analyzed with a fixed number of scans and various
resolution settings on the spectrometer as shown in Figure 19. All spectra are plotted on a
common scale, so it is clear that increasing the resolution from 4cm ‐1 to 0.125 cm ‐1 gives a dramatic increase to sensitivity. Increasing the resolution also increases the collection time for
an analysis, from 0:39 at 4 cm ‐1 to 6:06 for 0.125 cm ‐1, as shown in Table 19.
Table 19: Sensitivity and Analysis Time vs. Resolution
Resolution (cm -1) Maximum
Absorbance (AU) Analysis
Time (min)
4.0 0.010 0:39
1.0 0.040 1:44
0.5 0.057 1:46
0.25 0.093 3:13
0.125 0.17 6:06
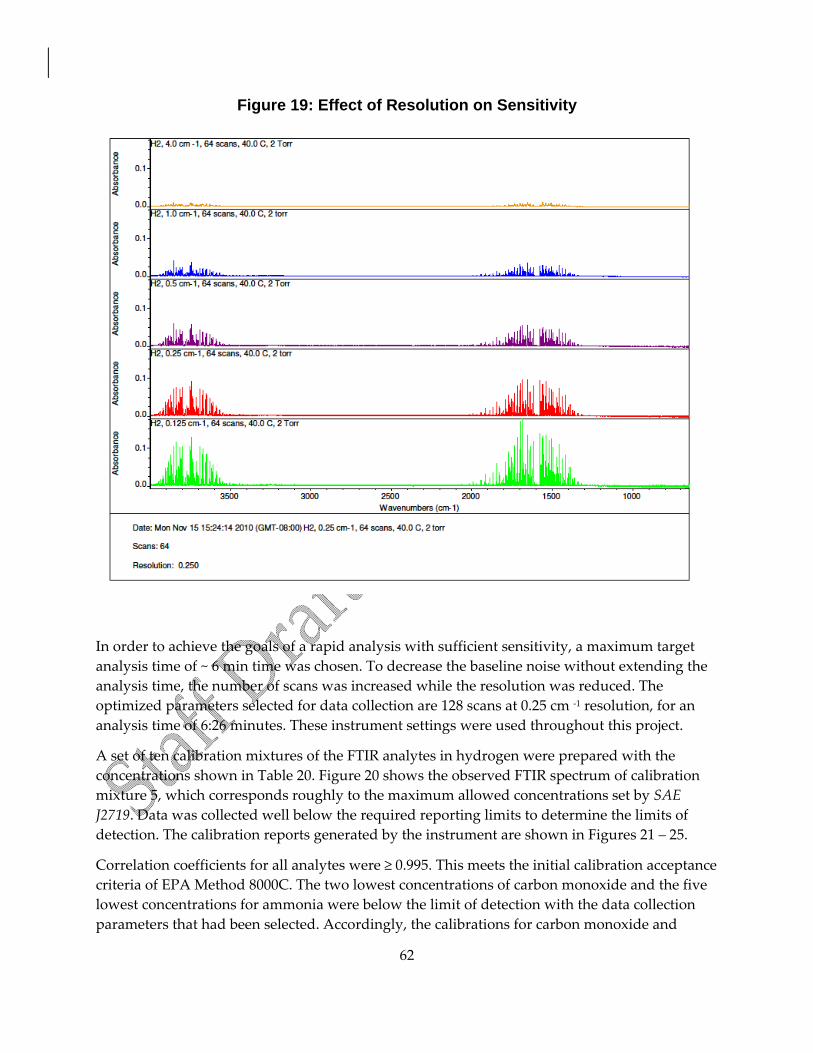
62
Figure 19: Effect of Resolution on Sensitivity
In order to achieve the goals of a rapid analysis with sufficient sensitivity, a maximum target
analysis time of ~ 6 min time was chosen. To decrease the baseline noise without extending the
analysis time, the number of scans was increased while the resolution was reduced. The
optimized parameters selected for data collection are 128 scans at 0.25 cm ‐1 resolution, for an
analysis time of 6:26 minutes. These instrument settings were used throughout this project.
A set of ten calibration mixtures of the FTIR analytes in hydrogen were prepared with the
concentrations shown in Table 20. Figure 20 shows the observed FTIR spectrum of calibration
mixture 5, which corresponds roughly to the maximum allowed concentrations set by SAE
J2719. Data was collected well below the required reporting limits to determine the limits of
detection. The calibration reports generated by the instrument are shown in Figures 21 – 25.
Correlation coefficients for all analytes were ≥ 0.995. This meets the initial calibration acceptance
criteria of EPA Method 8000C. The two lowest concentrations of carbon monoxide and the five
lowest concentrations for ammonia were below the limit of detection with the data collection
parameters that had been selected. Accordingly, the calibrations for carbon monoxide and
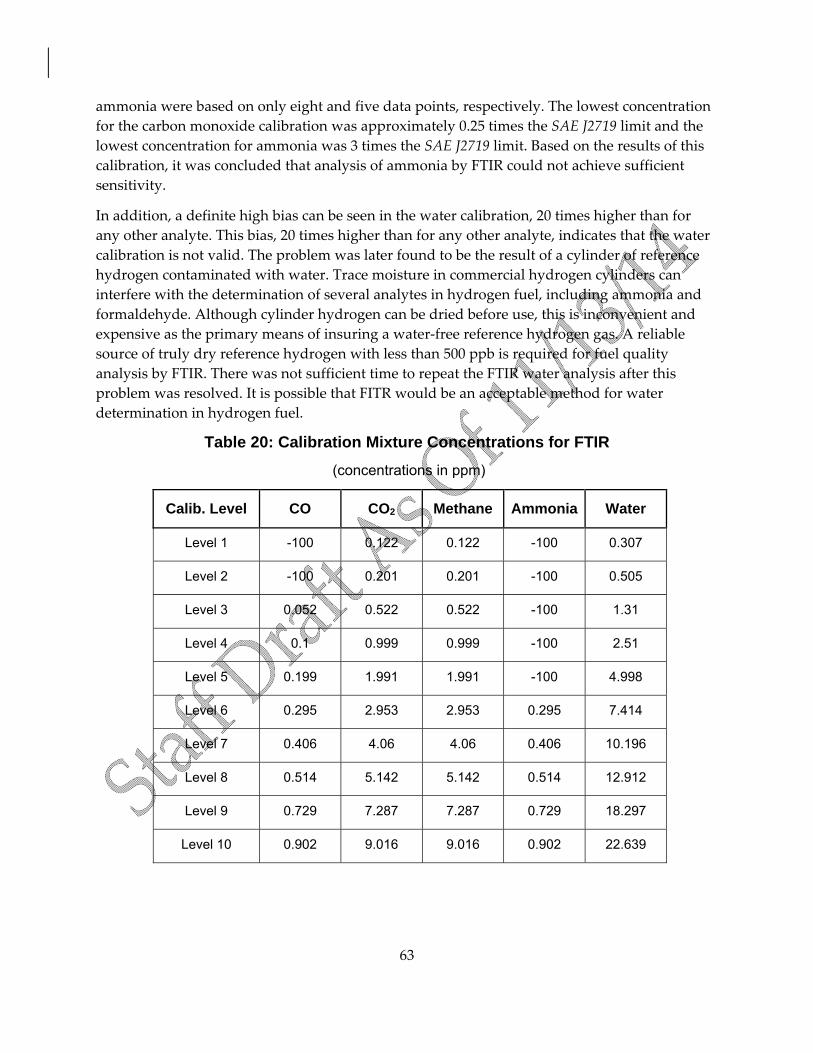
63
ammonia were based on only eight and five data points, respectively. The lowest concentration
for the carbon monoxide calibration was approximately 0.25 times the SAE J2719 limit and the
lowest concentration for ammonia was 3 times the SAE J2719 limit. Based on the results of this
calibration, it was concluded that analysis of ammonia by FTIR could not achieve sufficient
sensitivity.
In addition, a definite high bias can be seen in the water calibration, 20 times higher than for
any other analyte. This bias, 20 times higher than for any other analyte, indicates that the water
calibration is not valid. The problem was later found to be the result of a cylinder of reference
hydrogen contaminated with water. Trace moisture in commercial hydrogen cylinders can
interfere with the determination of several analytes in hydrogen fuel, including ammonia and
formaldehyde. Although cylinder hydrogen can be dried before use, this is inconvenient and
expensive as the primary means of insuring a water‐free reference hydrogen gas. A reliable
source of truly dry reference hydrogen with less than 500 ppb is required for fuel quality
analysis by FTIR. There was not sufficient time to repeat the FTIR water analysis after this
problem was resolved. It is possible that FITR would be an acceptable method for water
determination in hydrogen fuel.
Table 20: Calibration Mixture Concentrations for FTIR
(concentrations in ppm)
Calib. Level CO CO2 Methane Ammonia Water
Level 1 -100 0.122 0.122 -100 0.307
Level 2 -100 0.201 0.201 -100 0.505
Level 3 0.052 0.522 0.522 -100 1.31
Level 4 0.1 0.999 0.999 -100 2.51
Level 5 0.199 1.991 1.991 -100 4.998
Level 6 0.295 2.953 2.953 0.295 7.414
Level 7 0.406 4.06 4.06 0.406 10.196
Level 8 0.514 5.142 5.142 0.514 12.912
Level 9 0.729 7.287 7.287 0.729 18.297
Level 10 0.902 9.016 9.016 0.902 22.639

64
Figure 20: – FTIR Spectrum of Fixed Gas Calibration Mixture At the Maximum Concentrations Allowed in J2719
H2O
NH3
CO
CO2
H2O
CH4

65
Figure 21: FTIR Calibration Report for Carbon Monoxide

66
Figure 22: FTIR Calibration Report for Carbon Dioxide
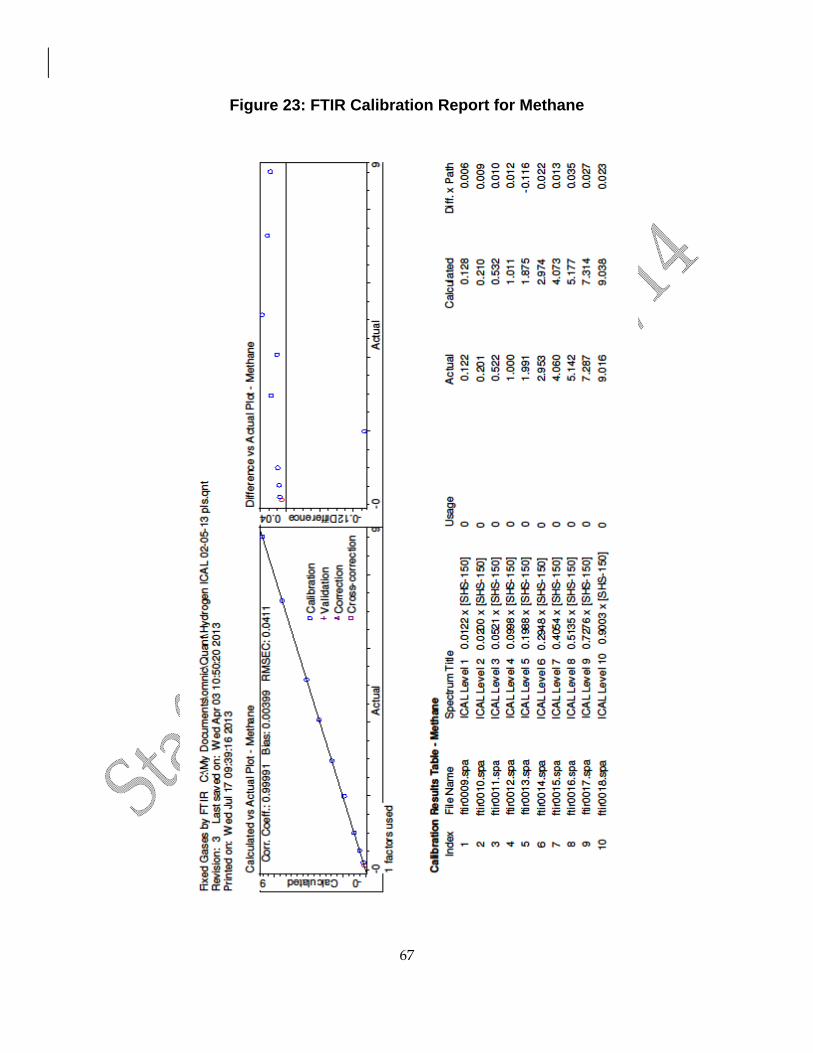
67
Figure 23: FTIR Calibration Report for Methane

68
Figure 24: FTIR Calibration Report for Ammonia

69
Figure 25: FTIR Calibration Report for Water
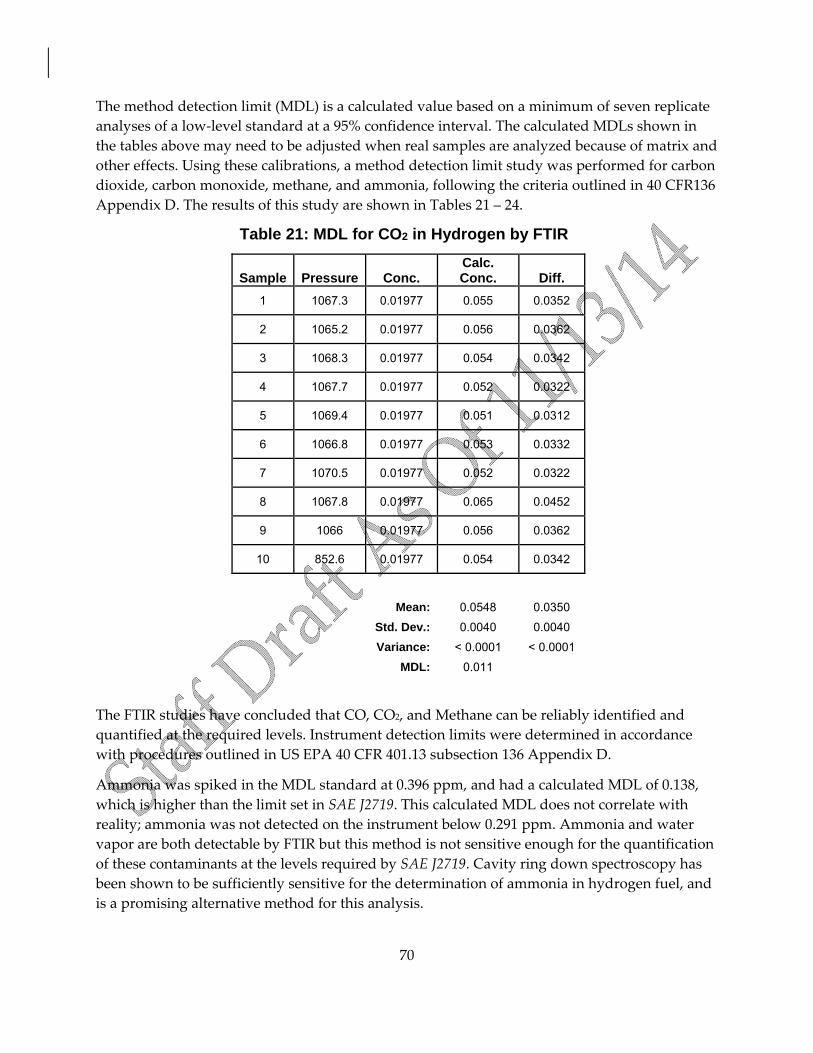
70
The method detection limit (MDL) is a calculated value based on a minimum of seven replicate
analyses of a low‐level standard at a 95% confidence interval. The calculated MDLs shown in
the tables above may need to be adjusted when real samples are analyzed because of matrix and
other effects. Using these calibrations, a method detection limit study was performed for carbon
dioxide, carbon monoxide, methane, and ammonia, following the criteria outlined in 40 CFR136
Appendix D. The results of this study are shown in Tables 21 – 24.
Table 21: MDL for CO2 in Hydrogen by FTIR
Sample Pressure Conc. Calc. Conc. Diff.
1 1067.3 0.01977 0.055 0.0352
2 1065.2 0.01977 0.056 0.0362
3 1068.3 0.01977 0.054 0.0342
4 1067.7 0.01977 0.052 0.0322
5 1069.4 0.01977 0.051 0.0312
6 1066.8 0.01977 0.053 0.0332
7 1070.5 0.01977 0.052 0.0322
8 1067.8 0.01977 0.065 0.0452
9 1066 0.01977 0.056 0.0362
10 852.6 0.01977 0.054 0.0342
Mean: 0.0548 0.0350
Std. Dev.: 0.0040 0.0040
Variance: < 0.0001 < 0.0001
MDL: 0.011
The FTIR studies have concluded that CO, CO2, and Methane can be reliably identified and
quantified at the required levels. Instrument detection limits were determined in accordance
with procedures outlined in US EPA 40 CFR 401.13 subsection 136 Appendix D.
Ammonia was spiked in the MDL standard at 0.396 ppm, and had a calculated MDL of 0.138,
which is higher than the limit set in SAE J2719. This calculated MDL does not correlate with
reality; ammonia was not detected on the instrument below 0.291 ppm. Ammonia and water
vapor are both detectable by FTIR but this method is not sensitive enough for the quantification
of these contaminants at the levels required by SAE J2719. Cavity ring down spectroscopy has
been shown to be sufficiently sensitive for the determination of ammonia in hydrogen fuel, and
is a promising alternative method for this analysis.

71
Table 22: MDL for CO in Hydrogen by FTIR
Table 23: MDL for Methane in Hydrogen by FTIR
Sample Pressure Conc. Calc. Conc. Diff.
1 1067.3 0.0742 0.103 0.0288
2 1065.2 0.0742 0.095 0.0208
3 1068.3 0.0742 0.100 0.0258
4 1067.7 0.0742 0.113 0.0388
5 1069.4 0.0742 0.111 0.0368
6 1066.8 0.0742 0.110 0.0358
7 1070.5 0.0742 0.111 0.0368
8 1067.8 0.0742 0.102 0.0278
9 1066 0.0742 0.101 0.0268
10 852.6 0.0742 0.093 0.0188
Mean: 0.104 0.030
Std. Dev.: 0.0070 0.0070
Variance: 0.0000 0.0000
MDL: 0.020
Sample Pressure Conc. Calc. Conc. Diff.
1 1067.3 0.0989 0.193 0.0941
2 1065.2 0.0989 0.185 0.0861
3 1068.3 0.0989 0.192 0.0931
4 1067.7 0.0989 0.164 0.0651
5 1069.4 0.0989 0.169 0.0701
6 1066.8 0.0989 0.181 0.0821
7 1070.5 0.0989 0.195 0.0961
8 1067.8 0.0989 0.159 0.0601
9 1066 0.0989 0.160 0.0611
10 852.6 0.0989 0.158 0.0591

72
Table 24: MDL for NH3 in Hydrogen by FTIR
Methane MDL Statistics:
Mean: 0.176 0.077
Std. Dev.: 0.0152 0.0152
Variance: 0.0002 0.0002
MDL: 0.044
Sample Pressure Conc. Calc. Conc. Diff.
1 1067.3 0.3955 0.325 -0.0705
2 1065.2 0.3955 0.386 -0.0095
3 1068.3 0.3955 0.441 0.0455
4 1067.7 0.3955 0.448 0.0525
5 1069.4 0.3955 0.475 0.0795
6 1066.8 0.3955 0.434 0.0385
7 1070.5 0.3955 0.470 0.0745
8 1067.8 0.3955 0.410 0.0145
9 1066 0.3955 0.466 0.0705
10 852.6 0.3955 0.474 0.0785
Mean: 0.433 0.037
Std. Dev.: 0.0478 0.0478
Variance: 0.0023 0.0023
MDL: 0.138

73
Table 25: MDLs and Proposed Reporting Limits for FTIR Analytes
Analyte MDL Proposed RL J2719 limit
CO 0.0204 ppm 0.200 ppm 0.2 ppm
CO2 0.0115 ppm 2.000 ppm 2 ppm
Methane 0.0439 ppm 2.000 ppm 2 ppm
Ammonia 0.1385 ppm 0.100 ppm * 0.1 ppm
Water indeterminate 5.00 ppm ** 5 ppm
* MDL > RL ** Results too variable for MDL determination
3.5 CRDS: Determination of H2O, NH3, and Formaldehyde
Because of the problems encountered with ammonia and water analysis by FTIR, CRDS was
evaluated as an alternative method for the determination of these analytes. As described in
Section 2.9 above, CRDS uses the decay time of a laser pulse tuned to the analyte of interest to
calculate the concentration of the analyte based on its extinction coefficient and the volume of
the sample. CRDS makes an absolute determination of concentration based on Beer’s Law, and
so does not require any calibration.
CRDS was demonstrated successfully for water and ammonia. A standard for formaldehyde
was not available, so evaluation of CRDS for the determination of formaldehyde was not done.
3.6 Field Sampling of Hydrogen Fuel at Dispensers
In November 2013, hydrogen fuel samples were collected from five of the public stations in
California. Figure 26 shows DMS Staff Environmental Scientist John Mough collecting a sample
using the Hydrogen Fuel Quality Sampling Apparatus discussed in Section 2.5. The dispenser
nozzle is seen connected to the sampling apparatus. The orange coil at the bottom of the
photograph is the connection grounding the dispenser to the sampling apparatus. The hose
leading from the left side of the apparatus is connected to the vent stack (not shown) that
releases hydrogen from the apparatus at a safe height above the ground.

74
These field samples were successfully analyzed using the methods discussed above. Four of the
samples had no detectable contaminants. Several contaminants were found in the sample from
the fifth station. After reviewing the DMS data, that station shut down its dispenser for an
investigation, and took corrective action to resolve the issues found.
Figure 26: Field Collection of Hydrogen Fuel Quality Sample
Photo Credit: DMS Hydrogen Laboratory

75
CHAPTER 4: Summary, Discussion, and Future Work
4.1 Project Summary
A basis for a robust and reliable scheme for the analysis of hydrogen fuel quality for the
specifications of SAE J2719 has been developed. The methods presented in Chapter 3, when run
in combination, provide for the determination of most of the J2719 analytes with the required
sensitivity. Table 26 summarizes the methods and detection limits that have been validated by
DMS.
Table 26: DMS Validated Methods and MDLs
Analyte Analytical Method SAE J2719 Limit (ppm)
DMS MDL (ppm)
Total hydrocarbons*
GC-FID (System 2) and FTIR 2 0.012
Helium GC-TCD (System 2) 300 20
Nitrogen GC-PDHID (System 2) 100 11
Argon GC-PDHID (System 2) 100 11
Carbon dioxide GC-FID (System 2) and FTIR 2 0.23 (FID)
0.011 (FTIR)
Carbon monoxide
FTIR 0.2 0.020
Sulfur compounds
GC-PFPD (System 1) 0.004 0.0106 -
0.0071 **
Total halogenates
GC/MS (System 1) 0.05 †

76
Table 26 notes:
** As listed in Table 12, each sulfur compound tested had a different MDL. The SAE
J2719 maximum concentration of 0.004 ppm is ambiguous since it does not specify a
reference compound or response factor to be used in MDL calculations. Therefore, the
range of values listed in Table 12 is reported in Table 26. These results will be
presented to SAE for use in revising the sulfur contaminant specification in J2719.
† Because of time limitations, MDL studies for all of the halogenates were not
completed. However, the sensitivity of the GC/MS analysis is expected to be adequate
to meet the specifications of SAE J2719 for all compounds.
The set of methods listed in Table 26 comprise a practical scheme for the analysis of hydrogen
fuel quality. However, this list is not intended to be exhaustive or exclusive. It should not be
interpreted to imply that other analytical methods and detector combinations are not equally
feasible. It is hoped that the work described in this report provides a useful starting point for
others in this field.
Method development for several of the J2719 analytes is incomplete. In some cases, different
analytical approaches will be required. Analytes needing additional work are shown in Table
27, along with possible alternative methods for their analysis. The analytes listed in Table 27 are
discussed in more detail in Section 4.2.
Table 27: SAE J2719 Analytes Requiring Additional Work
Analyte Proposed Analytical
Method(s) SAE J2719 Limit (ppm)
Water CRDS 5
Ammonia CRDS 0.1
Formaldehyde CRDS 0.01
Formic acid GC/MS 0.2
Oxygen ECD, GC/MS, CRDS 5

77

78
4.2 Considerations for Future Work
Water:
CRDS has been shown to have sufficient sensitivity for the specifications of J2719 for water and
ammonia. However, the precision of the method for these analytes has not been established.
Therefore, water is listed in Table 27. Since CRDS is a direct measurement method that does not
depend on a calibration, useable data can generated on samples even though this method has
not been fully validated.
Ammonia:
Neither FTIR nor IC was successful for the analysis of ammonia. While ammonia can be seen by
FTIR, the detection limit of the instrument as configured and tested at DMS did not meet the
specification of J2719. IC was found to be unsuitable for ammonia in spite of its extremely high
sensitivity because a robust and reliable method to transfer the analyte to the liquid IC eluant
could not be developed.
FTIR might be used to confirm high levels of ammonia. With the issue of water in the reference
hydrogen gas resolved, the detection limit for ammonia by FTIR could be determined.
CRDS has been shown to have sufficient sensitivity for the specifications of J2719 for ammonia.
A validation for ammonia could not be completed because of the issue of water contamination
in the reference hydrogen gas. Since this issue has been resolved, it is expected that a
satisfactory validation can be done.
Formic Acid and Formaldehyde:
The problems encountered with the IC for ammonia would also occur in the determination of
formic acid and formaldehyde. A CRDS module for formaldehyde is expected to be sensitive
enough to meet the specification of J2719, and has been procured. However, a commercial
standard of formaldehyde in hydrogen is not available. A permeation tube is needed to prepare
calibration standards for formaldehyde as was done for the sulfur compounds. CRDS is not
applicable to formic acid at this time.
GC/MS analysis of formic acid and formaldehyde is possible, but may not have enough
sensitivity to meet the specifications of J2719. It should be possible to validate the determination
of by GC/MS and include these analytes with the halogenated compounds. A means of
preparing calibration standards for formic acid in hydrogen must be validated before a method
can be developed.
If the issue of background water interference in the FTIR can be resolved, this method may be
applicable to the determination of formaldehyde, and formic acid as well as ammonia. This
would be worth pursuing in order to have confirmation methods for these analytes included in
the analytical scheme. If analysis by FTIR is found to be sensitive enough, it could possibly
eliminate the need for a re‐analysis of a sample in which one or more contaminants was
identified at levels above J2719 limits.

79
Oxygen:
GC‐ECD has been shown to have adequate sensitivity for the determination of oxygen in
hydrogen fuel. However, as discussed in Section 3.1.3 above, the reproducibility from injection
to injection was unacceptable. Additional laboratory work in consultation with the detector
manufacturer might resolve this problem. Recently, a CRDS module for oxygen has been
introduced. In view of the successful application of CRDS to the determination of water and
ammonia, this is a potential alternative method for the determination of oxygen in hydrogen.
Particulates:
As discussed above in Section 1.6.1, in Sept 2010, ASTM published test method ASTM D7650 ‐
10 Standard Test Method for Sampling of Particulate Matter in High Pressure Hydrogen used as a
Gaseous Fuel with an In‐Stream Filter. With an approved test method in place, no work on
particulate determination was done for this project. If particulates are found in hydrogen fuel
sold in California, it may be necessary to evaluate method D7650 – 10.
4.3 Summary of DMS Methods for Hydrogen Fuel Analysis
Analysis of hydrogen fuel sampled at a commercial dispenser might be expected to show
particulate contamination arising from environmental contamination and repeated use of the
nozzle assembly by customers. An analysis of particulates in a hydrogen sample could result in
false positives, disrupting the sale of fuel. A previous proposal to incorporate a particle filter in
the vehicle fuel line may be a preferable approach.
The full‐profile analysis of hydrogen gas for fuel cells requires multiple instruments and
methods to quantify all potential actionable impurities in the sample gas matrix. Not all
potential contaminants of concern are likely to be present in a given hydrogen source and
industry producers may want to focus on testing and addressing impurities common to their
particular hydrogen production process.
For normal production work at DMS, up to six samples can be completed in about a day and a
half with the GC‐MS running overnight. Throughput is limited by the capacity of the sample
switching assembly to connect the canisters to each instrument in turn.
To minimize the amount of fuel sample used in testing, only one canister is used for a given
sample. This minimizes the cost of samples taken for testing. The sample switching assembly
must be moved manually between instrument systems to the next to complete the testing.
Figure 27 shows a schematic flow chart for sample in the DMS laboratory.

80
Figure 27: Hydrogen Fuel Quality Sample Laboratory Flow Chart
Record sample data in receiving log. Create sample ID and print labels in LIMS.
Assign sample tests to analysts
Analyze sample by FTIR
Determine CO2, CO, CH4, and possibly CH2O and high levels of H2O and NH3
30 - 45 minutes
1.0 hour, not including instrument prep or re-runs of out-of-spec results.
Review Test Results Verify QC’s Upload Data into LIMS. Produce report for review by supervisor.
Analyze sample by CRDS
Determine NH3, CH2O , H2O, and possibly O2.
Analyze sample by GC
Determine CO2, CH4,
THC, N2, Ar, Helium
High level CO detection possible.
30 - 45 minutes.
Instrument prep is concurrent with FTIR analysis. Re-analysis of out-of-spec samples (if needed) will extend time.
1.5 hours
2.0 hour instrument prep and standards run concurrently with previous tests. Re-analysis of out-of-spec samples (if needed) will extend time.
3.0 hours
2.0 hour instrument prep and standards run concurrent with GC analysis. Re-analysis of out-of-spec samples (if needed) will extend time.
1.0 - 1.5 hours
Hydrogen Sample Received
Analyze by GC-MS
Determine O2, Sulfur Compounds, Total Halogenates.

81
4.4 Lessons Learned
In the course of this work, many lessons were learned that might be of value to other analysts.
These are presented here.
4.4.1 Reference Hydrogen Quality
UHP hydrogen (0.99999 or better) is required as a matrix for calibration standards and a
reference for instrument blanks. Cylinders of UHP Hydrogen are readily available from many
suppliers; however, experience at DMS has shown that contamination of cylinders with water
(and possibly other substances) does occur. Quality verification of all UHP hydrogen received,
especially for water content, is an essential first step in achieving acceptable analytical results.
Out‐of‐specification reference hydrogen containing water will interfere with the CRDS used for
the determination of ammonia and formaldehyde. The CRDS provides a convenient method to
ensure that an excessive concentration of water is not present in the reference hydrogen gas.
4.4.2 Argon Purity for the Determination of Helium
Helium in hydrogen is determined by GC‐TCD with argon as a carrier gas. Early tests showed
baseline variability in the TCD detector baseline that altered the integration of the helium peak
from sample to sample. Frequently a negative peak was displayed at the elution point of
helium. It was determined that trace helium was present in the argon carrier gas at levels
greater than prepared standards. Cylinder argon was replaced with a Dewar supply of liquid
argon to generate the reference gas. This stabilized the baseline and eliminated negative peaks
in the helium chromatogram.
4.4.3 Consideration for GC Inlet Design
Field samples of hydrogen fuel are collected and analyzed at much higher pressures than the
laboratory samples and standards used for method development and calibration. All analytical
instruments require high pressure sample inlets and selector valves rated for at least 1800 psi,
the rated pressure of the high pressure sample containers used for this work. To meet this
requirement, an upgrade of a standard GC inlet is needed.
Cleaning and baking out of columns in the GC of System 2 required extensive labor as the
maximum temperature rating for the of the Hayesep N® is much lower than the ideal bake‐out
temperature for the molecular sieve columns. This meant that regenerating the molecular sieves
required the removal of the Hayesep N® columns. Reassembling all of the connectors in the
system was challenging and time‐consuming because of the leaks introduced.
To address these issues, a redesigned GC system was added. It was equipped with a sample
selector valve rated for high pressures and step‐down regulator. In addition, separate column
ovens and thermal controls for the Hayesep N® and the molecular sieve columns were included
to make system maintenance easier.

82
4.4.4 FTIR Sensitivity to Ambient Water Vapor
The FTIR is highly sensitive to moisture and atmospheric contaminants. A high volume
continuous purge of filtered dry nitrogen is required to maintain a clean optical bench for the
instrument. Heating sample lines and sample ovens are also necessary to minimize moisture
accumulation in the sampling system and reduce interferences from water vapor. However,
even with these measures taken, a background sufficiently clean for the analysis of ammonia in
hydrogen fuel could not be achieved by the DMS laboratory. FTIR is an attractive technique for
hydrogen fuel quality analysis since it is very sensitive to so many of the SAE J2917
contaminants. A practical means of further reducing the background from ambient water vapor
would permit more analytes to be determined by FTIR, and provide analytical confirmation
without a need to rerunning a sample.
4.3.5 IC/CD Issues
The analysis of ammonia by IC/CD requires its transformation into ammonium ion in solution.
While the detection limits and sensitivity were excellent with this instrument, the quantitative
trapping and conversion of ammonia from the gas phase to solution was not successful in spite
of repeated efforts. The variability in recovery does not support the required level of confidence
in the measured results. In spite of the extremely high sensitivity of the IC/CD, it does not
appear to be applicable to the analysis of hydrogen fuel.
4.4.6 CRDS
Water vapor detection in hydrogen gas is both reliable and robust with this relatively new
technology. Analysis of other analytes such as ammonia, formaldehyde, and oxygen is also
possible with CRDS. However, the presence of water above specified concentrations can
interfere with the determination of other analytes. Water levels above 10 ppm invalidate any
reading for formaldehyde and water levels above 15 ppm invalidate the readings for ammonia.
Therefore, it is essential to establish that a sample meets the SAE J2719 specification for water
before analyses known to be susceptible to water interference are run.

Alternative and Renewable Fuel and Vehicle Technology Program
FINAL PROJECT REPORT: VOLUME 2
MONTH YEAR
CEC‐XXX‐XXXX‐XXX
Prepared for: California Energy Commission
Prepared by: California Department of Food and Agriculture Division of Measurement Standards
HYDROGEN MEASUREMENT STANDARDS
Development of Measurement Standards for Gaseous Hydrogen Fuel Sold at Retail in California

83
VOLUME 2 SUMMARY
Existing California statutes and regulations govern the commercial sale of all transportation
fuels in California to protect consumers and ensure a level playing field among suppliers. Fuel
dispensers for commercial refueling stations must be type evaluated by the California
Department of Food and Agriculture/ Division of Measurement Standards (CDFA/DMS) to
insure they meet all required metrological specifications. Currently, no hydrogen fuel
dispensers have been approved for retail use in California. The direct sale of hydrogen fuel to
consumers requires the development of standards and procedures specifically to test and
approve hydrogen fuel dispensers at retail outlets. The work described in this report was
undertaken to fill this need.
The first phase of this project was the development of specifications, tolerances, and a method
of sale requirement for the commercial measurement of hydrogen fuel delivery equipment. In
the United States, this is a multi‐step process. It starts with the development of model
regulatory language by the National Conference on Weights and Measures (NCWM). The
Conference is a consensus organization whose membership is open to Federal, state, and local
weights and measures officials, equipment manufacturers, industry representatives, and any
other interested parties.
In response to a recognized need for new regulations to address changes in technology and
marketplace conditions, the NCWM Specifications and Tolerances Committee meets to reach
consensus on model language. This language is then published by the U.S. Department of
Commerce National Institute of Standards and Technology (NIST) in its Handbook 44:
Specifications and Tolerances and Other Technical Requirements for Weighing and Measuring Devices.
States may then adopt this code in their law or regulations. The staff of the CDFA played a
leading role in the development of the model language needed for hydrogen regulations. The
latest version of NIST Handbook 44 is automatically adopted each year by reference in Division 5
of the California Business and Professions Code (BPC). Through California’s rulemaking
procedure, the CDFA has proposed modifications to the language in Handbook 44 for California.
Procedures for type evaluation and field testing of hydrogen dispensers have also been
developed. Type evaluation is the process used to evaluate new weighing and measuring
devices for accuracy, precision, reliability, and compliance with all applicable codes and
regulations. Type evaluation is required before a new device can legally be used in commerce.
With the necessary regulatory language in place, the following step in the project was the
fabrication and evaluation of reference standards for testing of hydrogen dispensers. Three
standards, gravimetric, volumetric, and master meter, were incorporated into one device for
field testing. This device was designed and constructed under an agreement with the National
Renewable Energy Laboratory (NREL) in Golden, Colorado. After testing, the gravimetric
standard met the required tolerances and was accepted for use by the CDFA for type evaluation
and field testing. The volumetric and master meter standards did not meet the required
tolerances and will be used only for data collection.

85
CHAPTER 1: Introduction and Overview
1.1 Metrology and Transportation Fuels in California
Making measurements was one of the first activities of some human societies. From the earliest
times, accepted standards of weight and volume were needed to support equitable trade and
combat fraud. Such standards remain vital to commerce in today’s world. Metrology, the
science of measurement, encompasses all that is necessary for the accuracy and precision of
measurements to be reliable and accepted in commercial transactions. Metrology is essential to
the maintenance of a fair and transparent market place today.
There are three components to any measurement: a unit of measure, the quantity determined by
the measurement, and the uncertainty associated with the measurement. In commercial
transactions, each of these components is subject to regulation for the protection of both buyers
and sellers. Many measurements must be codified to support public health and safety,
consumer protection, and to provide a level playing field for commercial activity. These aspects
of measurement science make up the field of metrology.
NIST defines metrology as “the practice and process of applying regulatory structure and
enforcement” to measurements. 28 29 Metrology creates a regulatory framework through which
all parties can rely on the accuracy and reliability of commercial measurements. These
measurements are made according to established procedures and specifications. The units and
devices used are traceable to recognized international standards and meet accepted
specifications. Adherence to the principles and protocols of metrology by sellers, buyers, and
regulators supports transparent and equitable trade and commerce. Metrology codes and
standards are written to ensure the accuracy of commercial measurements, enhance consumer
protection, foster competition, and facilitate state and national economic growth and trade.
BPC Division 5, Chapter 14 (Petroleum) assigns oversight of the retail sale of transportation
fuels in California to CDFA. In 2005, Senate Bill 76 (Statutes of 2005, Chapter 91) amended BPC
Section 13401 to add hydrogen as a motor vehicle fuel. Through this amendment, all codes and
regulations for the retail sale of motor vehicle fuels apply to hydrogen fuel. The text of the BPC
sections relating to the regulation of fuels may be found in Appendix F.
28 NIST Home > PML > Weights and Measures > International Legal Metrology Program
http://www.nist.gov/pml/wmd/ilmg/index.cfm accessed 8/29/2013.
29 For more information on legal metrology, see OIML D 1 2012 Considerations for a Law on Metrology ,
issued by the intergovernmental International Organization of Legal Metrology.
http://www.oiml.org/en/files/pdf_d/d001‐e12.pdf accessed 10/20/13.

86
BPC, Section12500.5 requires that commercial fuel dispensing devices be approved by DMS
through the California Type Evaluation Program (CTEP).30 CTEP defines type evaluation as
“The examination of a weighing or measuring instrument for the legal purpose of certifying
that its design and performance complies with all applicable weights and measures
requirements.”31 A motor fuel dispenser must receive a Certificate of Approval from DMS
before it may be used in commerce in California. BPC Section 12107 further requires that the
requirements for commercial fuel dispensing devices be adopted by reference to model codes
published by the NIST in its Handbook 44 Specifications Tolerances, and Other Technical
requirements for Weighing and Measuring Devices. With the inclusion of hydrogen as a motor
vehicle fuel in BPC Section 13401, commercial hydrogen dispensers are subject to the
requirements of BPC Sections 12500.5 and 12107.
Prior to 2007, no specifications or tolerances for hydrogen fuel dispensers had been developed.
In such situations, NIST Handbook 44 provides procedures for the approval of unclassified
devices. However, without device‐specific protocols, manufacturers face uncertainty about the
requirements that a weights and measures official might impose on a device. Because of this
uncertainty, and the limited market for commercial hydrogen dispensers, device manufacturers
have been reluctant to invest in obtaining type approval for hydrogen dispensers. To date, no
retail hydrogen fuel dispensers have been approved for commercial use in California. The work
described in this report was undertaken to develop the standards and procedures needed for
the testing and evaluation of hydrogen dispensers.
1.2 Fuel Cell Vehicles in California
California faces continuing challenges in achieving clean air and an adequate and sustainable
energy supply. The California Air Resources Board (CARB) has set the following goals for the
state:
A reduction in greenhouse gas emissions to 80 percent below 1990 levels by 205032 33
A decrease in petroleum fuels usage to 15 percent below 2003 levels by 202034
30 More information about the California Type Evaluation Program can be found at
http://cdfa.ca.gov/dms/programs/ctep/ctep.html. accessed 10/21/13.
31 California Type Evaluation Program Information Guide, available on the DMS website at
http://cdfa.ca.gov/dms/programs/ctep/ctep.html.
32 CARB website Climate Change Programs http://www.arb.ca.gov/cc/cc.htm accessed 10/01/13
33 California Office of the Governor, Arnold Schwarzenegger Executive Order S‐3‐05, June 1, 2005.
34 Reducing California’s Petroleum Dependence, CARB and Energy Commission joint agency report
publication #P600‐03‐005, August 2003.

87
An increase in the use of alternative transportation fuels to 20 percent of all fuel
consumed by 2020 and 30 percent by 203035
A reduction of emissions of nitrogen oxides to 80 percent of 2010 levels by 2023 to meet
current Federal ozone standards.36
New technologies and new approaches in many areas are needed to meet these challenges. The
California Energy Commissionʹs Alternative and Renewable Fuel and Vehicle Technology
Program (ARFVTP) was created in 2007 to support innovation in the transportation sector. This
program was established by Assembly Bill 118 (Núñez, Chapter 750, Statutes of 2007) and
subsequent amendments. The development of hydrogen fuel cell vehicles (FCEVs) is one of the
efforts supported by this program.
Fuel cells are clean and efficient sources of energy that have found a wide range of applications.
Fuel cells use the electrochemical reaction of oxygen and hydrogen to generate electricity. Such
electrochemical reactions are much more energy efficient than the combustion of petroleum
fuels. FCEVs have no tailpipe emissions of greenhouse gases or nitrogen oxides. Water and a
small amount of heat are the only by‐products of fuel cells, eliminating pollution from tailpipe
emissions at the point of use. Expanded use of hydrogen as a transportation fuel will reduce the
state’s dependence on petroleum, reduce toxic tailpipe emissions, and help meet alternative fuel
goals. Hydrogen fuel cell vehicles (FCEVs) will play an essential role in reaching California’s
goal of a sustainable energy supply.
Growing numbers of transit systems throughout California are using fuel cell buses. Large
numbers of fuel cell forklifts and similar vehicles are in use in industrial and warehouse
settings. A limited number of fuel cell passenger cars are currently leased to consumers in
California by manufacturers in demonstration programs. In response to mandates to increase
fleet fuel efficiency and decrease tailpipe emissions, many major automakers plan to begin
commercial sale of FCEVs in California in 2015 ‐ 2017.
Highlights of the history of hydrogen fuel and fuel cell vehicles are presented in the Time Line
in Appendix A.
1.3 Properties of Hydrogen and Safety Considerations
Hydrogen is the most abundant element in the universe. However, the diatomic molecular form
of hydrogen needed to power fuel cells does not occur naturally on earth since it is too light to
35 California Energy Commission 2003 Integrated Energy Policy Report
http://www.energy.ca.gov/reports/100‐03‐019F.PDF accessed 9/19/13.
36 Vision for Clean Air: A Framework for Air Quality and Climate Planning, Public Review Draft CARB, the
South Coast Air Quality Management District and the San Joaquin Valley Unified Air Pollution Control
District, page 10, June 27, 2012. Available online at
http://www.arb.ca.gov/planning/vision/docs/vision_for_clean_air_public_review_draft.pdf.

88
be retained by the earth’s gravitational force. Earth’s supply of hydrogen is found in
combination with other elements, mostly in water bonded to oxygen. Smaller amounts of
hydrogen are found in minerals and other hydrides.
With no terrestrial source of molecular hydrogen, the very high purity hydrogen required by
fuel cells must be manufactured, most often from methane by steam reformation:
CH4 + H2O → CO + 3 H2.
Molecular hydrogen can also be produced from water by electrolysis:
2 H2O → 2 H2 + O2.
These endothermic reactions require an input of energy, some of which is stored in the chemical
bond of the hydrogen molecule. In a fuel cell, this stored energy is released as electricity by a
reverse reaction:
2 H2 + O2 → 2 H2O.
Fuel cells are clean and efficient sources of energy that have found a wide range of applications.
Hydrogen‐powered fuel cell vehicles will have a crucial role in a clean and sustainable energy
economy in California and the nation.
Hydrogen has long been used in large quantities in the petroleum, chemical, metallurgy, and
food industries. Hydrogen has unique characteristics that require special handling precautions
for safety. The safety records of the diverse industrial applications demonstrate that hydrogen
need not pose an undue risk as a vehicle fuel. In fact, overall, hydrogen may be safer than
conventional petroleum transportation fuels. Vapors of all fuels are flammable within some
range of concentrations in air. For hydrogen, this range is roughly 4 – 75% .This is quite wide
compared to that of conventional petroleum fuels. However, even lower concentrations of
gasoline (1%), diesel (0.6%), and propane (2.2%) will support combustion. Both petroleum‐
based fuels and hydrogen can explode if there are leaks and ignition sources present.
Because of its lighter than air buoyancy, hydrogen will rapidly diffuse upwards in the event of a
leak. This is true even if the hydrogen has been ignited. Consequently, hydrogen fires are
concentrated, vertical, narrow, and dissipate rapidly. Gasoline and diesel vapors and liquids, on
the other hand, are heavier than air. They will remain low and spread along the ground if there
is a fuel leak, and seek lower elevations such as basements, creeks, and gullies, increasing the
fire risk to the surrounding buildings and objects. In this sense, hydrogen may be considered
safer than conventional fuels.
Hydrogen has the highest energy content per unit weight of any element. It is also the lightest
element known. As a result, it has a very low energy density under normal ambient conditions.
Hydrogen tanks in fuel cell vehicles must be pressurized to 10,000 pounds/ square inch (psi) so
that the vehicle can carry enough fuel to achieve an acceptable driving range. The construction
of cylinders and tanks for the safe storage and handling of compressed gases is well

89
understood. The principles and safety guidelines already in place for industrial applications can
be directly applied to the requirements for infrastructure for the hydrogen fuel industry.
1.4 Existing Hydrogen Fuel Infrastructure in California
In late 2013, approximately 125 FCEVs have been leased to Californians by automobile
manufacturers for research and testing purposes. Currently, vehicle manufacturers and dealers
contract with a limited number of hydrogen station operators to provide refueling to customers
as part of their vehicle leases. A similar situation exists in other states where fuel cell vehicles
have been introduced.
At least two manufacturers plan to begin retail sales of FCEVs in the state in 2015. Other
manufacturers will introduce their FCEV models in 2016 and 2017. California drivers are
expected to purchase or lease an estimated 53,000 FCEVs by 2017.37 Retail sales of FCEVs in
California will begin in 2015. The Energy Commission and CARB have forecast that sales will
quickly grow to tens of thousands of FCEVs annually. Such rapid acceptance of FCEVs by
consumers will depend in large part on the anticipated availability of a network of convenient
and reliable hydrogen refueling stations. Drivers are dependent on the highly distributed
network of retail outlets for the direct sale of gasoline. The abundance of gasoline stations is
largely taken for granted. It is likely that California’s drivers will want the same level of
convenience if they purchase a FCEV.
The first adopters of FCEVs are clustered mainly in southern California. Table 28 lists the public
hydrogen refueling stations currently operating in the state. Seven are in the greater Los
Angeles area, one is in Thousand Palms near Indio, and one is in San Francisco Bay Area city of
Emeryville. Seventeen more stations are under development. In addition, thirteen private and
demonstration stations are now in operation.38
The California Fuel Cell Partnership (CaFCP) is a collaborative group bringing together
governmental agencies, energy providers, vehicle manufacturers, and technology companies to
promote the commercialization of FCEVs. The Energy Commission, the CARB, and the CDFA
are all members of the Partnership. For more information about the CaFCP, contact by e‐mail at
[email protected] or visit its website at http://caCaFCP.org. The CaFCP maintains an up‐to‐
date list of hydrogen stations in California on its website. This list includes public and
demonstration stations, along with locations under development. It may be accessed at
http://caCaFCP.org/index.php?q=stationmap.
37 Vision for Clean Air: A Framework for Air Quality and Climate Planning, Public Review Draft CARB, the
South Coast Air Quality Management District and the San Joaquin Valley Unified Air Pollution Control
District, page 10, June 27, 2012. Available online at
http://www.arb.ca.gov/planning/vision/docs/vision_for_clean_air_public_review_draft.pdf.
38 California Fuel Cell Partnership Q3 2013 Status Report. For a copy of the report, contact the CAFCP:
Phone: (916) 371‐2870 Fax: (916) 375‐2008 e‐mail: [email protected].
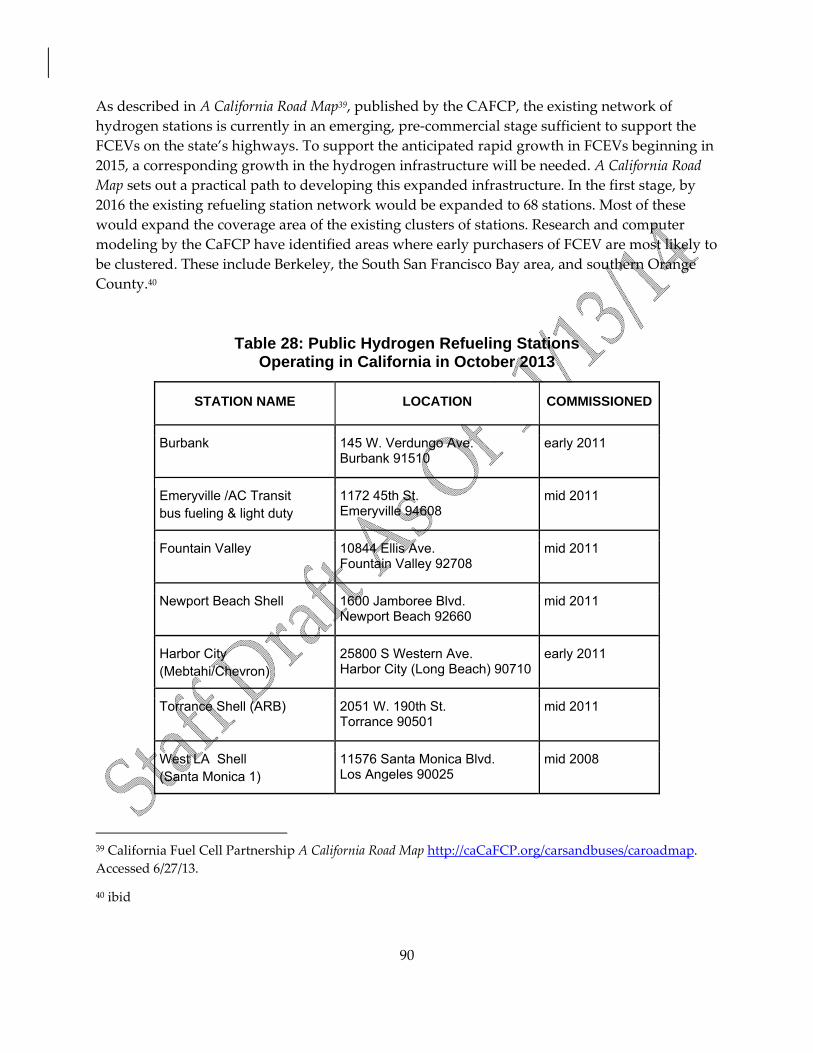
90
As described in A California Road Map39, published by the CAFCP, the existing network of
hydrogen stations is currently in an emerging, pre‐commercial stage sufficient to support the
FCEVs on the state’s highways. To support the anticipated rapid growth in FCEVs beginning in
2015, a corresponding growth in the hydrogen infrastructure will be needed. A California Road
Map sets out a practical path to developing this expanded infrastructure. In the first stage, by
2016 the existing refueling station network would be expanded to 68 stations. Most of these
would expand the coverage area of the existing clusters of stations. Research and computer
modeling by the CaFCP have identified areas where early purchasers of FCEV are most likely to
be clustered. These include Berkeley, the South San Francisco Bay area, and southern Orange
County.40
Table 28: Public Hydrogen Refueling Stations Operating in California in October 2013
STATION NAME LOCATION COMMISSIONED
Burbank 145 W. Verdungo Ave. Burbank 91510
early 2011
Emeryville /AC Transit bus fueling & light duty
1172 45th St. Emeryville 94608
mid 2011
Fountain Valley 10844 Ellis Ave. Fountain Valley 92708
mid 2011
Newport Beach Shell 1600 Jamboree Blvd. Newport Beach 92660
mid 2011
Harbor City (Mebtahi/Chevron)
25800 S Western Ave. Harbor City (Long Beach) 90710
early 2011
Torrance Shell (ARB) 2051 W. 190th St. Torrance 90501
mid 2011
West LA Shell (Santa Monica 1)
11576 Santa Monica Blvd. Los Angeles 90025
mid 2008
39 California Fuel Cell Partnership A California Road Map http://caCaFCP.org/carsandbuses/caroadmap.
Accessed 6/27/13.
40 ibid

91
STATION NAME LOCATION COMMISSIONED
Thousand Palms (U.S. DOE – Sunline Transit)
32505 Harry Oliver Trail Thousand Palms 92776
early 2000
UC Irvine 19172 Jamboree Blvd. Irvine 92616
early 2003

92
CHAPTER 2: Development of Hydrogen Fuel Dispenser Specifications and Standards
2.1 Project Objectives
As explained in Chapter 1, DMS has regulatory oversight of the fueling infrastructure
and commercial sale of transportation fuels, including hydrogen, in California. BPC
Section 12107 41 requires DMS to adopt specifications and tolerances for dispensing
equipment. Fuel dispensers for commercial hydrogen refueling stations must be
evaluated by DMS to ensure they meet metrological specifications.
Specifications and test methods for transportation fuels and devices are developed by
the National Conference on Weights and Measures (NCWM) and consensus standards‐
setting organizations, such as SAE International42 (SAE). They are then published by
NIST and NCWM in handbooks for use by weights and measures regulators. SAE
International also promulgates standards. Since hydrogen is a new alternative fuel,
many of the required specifications and standards did not exist at the start of this
project. This situation presented a significant obstacle to the development of hydrogen
infrastructure because of the legal requirements governing the retail sale of all
transportation fuels.
To address this problem, the Energy Commission contracted with DMS through Energy
Commission Agreement 600‐09‐015 to develop the needed specifications, tolerances,
and procedures, and to explore metrological standards for the required type testing of
hydrogen dispensers. As part of this agreement, DMS was to accomplish the following
tasks:
Develop Specifications and Tolerances for the commercial measurement of
hydrogen fuel delivery equipment for adoption by National Conference
Weights Measures (NCWM).
Develop type evaluation test procedures for the certification of dispensers
and other measuring equipment used in commercial measurement.
Research necessary test equipment to conduct type evaluation of Hydrogen
Retail Motor Fuel Dispensers.
41 The text of this regulation can be found in Appendix A.
42 This organization was founded in 1905 as the Society of Automobile Engineers. In 1916, it changed its
name to the Society of Automotive Engineers to emphasize its broad focus on all self‐propelled
(‘automotive’) vehicles. In 2006, the name changed again to SAE International.

93
Develop field test procedures for dispensers and other measuring
equipment used in commercial hydrogen measurement.
Develop method of sale requirements for dispensers for adoption by
NCWM.
Explore three types of reference standards that will be used to develop test
procedures that can be used for type evaluation and field testing:
gravimetric, volumetric and master meter standards.
Division of Measurement Standards (DMS) will purchase the needed
equipment and supplies to accomplish the goals stated above. DMS will
release a competitive solicitation following the State Contracting Procedures
to select and hire a test equipment fabrication company as a Subcontractor.
In addition, DMS plans to retrofit existing space for equipment.
To accomplish the project objectives, DMS worked with NIST, NCWM, consensus standards
organizations, fuel suppliers, manufacturers, and other stakeholders from across the hydrogen
fuel industry.
The activities and outcomes for each of these tasks are discussed in the following sections of this
report.
2.2 Development of Specifications, Procedures, and Model Codes for Hydrogen Dispensers
From the earliest stages of FCEV development, all stakeholders recognized that the uniform
national standards and specifications were required, along with normalization with
international standards. Although hydrogen has long been an industrial commodity around the
globe, existing codes, standards, and practices do not cover the needs of the emerging market in
hydrogen fuel. A set of uniform, fair, and appropriate metrological standards for hydrogen
refueling equipment for use across the country was clearly necessary.
The U.S. Department of Energy (DOE) requested the NIST Office of Weights and Measures43
(OWM) to work with stakeholders on the development of such standards. In 2003, DOE asked
OWM to evaluate metrological standards as they apply to hydrogen fuel and identify gaps.
OWM received funding from DOE to promote development of metrology standards for
hydrogen refueling equipment. DOE, along with the National Hydrogen Association and the
U.S. Fuel Cell Council formed the National Hydrogen and Fuel Cell Codes and Standards
Coordinating Committee (NHFCCSCC). This committee, made up of a group of public and
private stakeholders, was established to coordinate the development and implementation of
hydrogen‐related codes safety and standards for the hydrogen fuel industry.
43 This office was previously called the Weights and Measures Division. The new name became official in
October of 2011.

94
To further this effort, the U.S. National Work Group (USNWG) for the Development of
Hydrogen Measurement Standards was established under the sponsorship of NIST in October
of 2007. The USNWG is comprised of a broad range of stakeholders. These include staff from
DMS and NIST, other state regulatory officials, meter and dispenser manufacturers, industrial
gas suppliers, standards and testing organizations, type evaluation laboratories, and other
interested parties. DMS director Kristin Macey and DMS Measurement Standards Specialist III
Robert (Norman) Ingram have played a leading role in the USNWG, contributing draft
language and procedures, and providing review of final documents. Two subcommittees were
established, one to develop equipment standards and test procedures, and one to develop fuel
specification requirements. Director Macey serves as the Device Subcommittee Chairperson.
The goal of the USNWG was to develop a comprehensive set of model metrology standards for
the commercial measurement of hydrogen fuel for vehicles and related applications. Specific
areas addressed by the USNWG include:
Device design, accuracy, installation, and use requirements.
Method of sale requirements.
Test procedures.
Fuel quality standards.
The accomplishments of the USNWG to date include:
The implementation of a tentative code in NIST Handbook 44 Specifications, Tolerances, and
Other Technical Requirements for Weighing and Measuring Devices.
Adoption of the method of sale requirement in NIST Handbook 130 Uniform Laws and
Regulations in the Areas of Legal Metrology and Engine Fuel Quality.
A checklist published in the NCWM National Type Evaluation Program (NTEP),
Publication 14© to verify and document that hydrogen meters and dispensers meet the
requirements of type evaluation and applicable regulations.
Development of a draft examination procedures outline (EPO) for publication by NIST for
field officials to use in routine regulatory compliance inspections of hydrogen fuel
dispensers.
As provided in state law, these documents and procedures have been adopted into California’s
codes and regulations. Each of these items is discussed in more detail in the following sections.
2.2.1 NIST Handbook 44 Section 3.39 Hydrogen Gas-Measuring Devices – Tentative Code
One of the specific goals of the USNWG was the development of a comprehensive set of
metrology standards for commercial hydrogen dispensers. These standards cover device
design, accuracy, installation, use requirements, and tests procedures. Kristin Macey, Director
of DMS, was the Device Subcommittee Chairperson leading this effort. The USNWG drew on
the experience of its members from DMS and NIST with standards for compressed natural gas
95
motor fuel dispensing in drafting specifications and tolerances for hydrogen dispensers. Input
was also received from industry representatives. In July 2010, the USNWG’s draft code for
hydrogen measuring devices was adopted by the National Conference on Weights and
Measures. It was then published in the 2011 edition of NIST Handbook 44 Section 3.39 as a
‘tentative code’. Language included in Section 3.39 states that as tentative code: [it] “has only
trial or experimental status and is not intended to be enforced. The requirements are designed
for study prior to the development and adoption of a final code.”44 The code in Section 3.39 does
not apply to wholesale deliveries of hydrogen fuel or to the sale of hydrogen where the amount
dispensed does not affect the price to the customer (e.g., the current refueling model for leased
FCEVs in California). Subsection N. prescribes the procedures to be followed for testing of retail
hydrogen dispensers.
The latest edition of NIST Handbook 44 is automatically adopted by reference in California,
along with any deletions and additions that have been approved through the state’s rulemaking
process. Accordingly, the tentative code in Handbook 44 Section 3.39 is included in the California
Code of Regulations (CCR), Title 4, Division 9, Chapter 1, Article 1.
The requirements that DMS adopts from Handbook 44 are intended to prevent inaccurate
quantities being delivered by commercial weighing and measuring devices. All mechanical
devices have some error in their indications, so for each class of device, an accuracy tolerance is
established. The accuracy tolerance is the acceptable error in the indicated delivery of a device.
The accuracy tolerance must be small enough that neither the buyer nor the seller suffers
economic harm in a transaction.
Two types of accuracy tolerances are established for weighing and measuring devices. The
acceptance tolerance applies during type evaluation and initial testing after installation or
repair. The acceptance tolerance is typically smaller than the maintenance tolerance, which is
applied during routine testing after the device has been in service for more than 30 days.
Subsection T.2 in Section 3.39 sets an acceptance tolerance of 1.5 % and a maintenance tolerance
of 2.0% on the indicated delivery of the hydrogen fuel measuring devices. After Section 3.39
was accepted by the USNWG, some industry representatives expressed a concern that these
tolerances were too restrictive given the unique properties of hydrogen gas and the cost needed
to design and build high‐accuracy devices. In their view, the limited market for hydrogen
dispensers did not justify the capital investment needed to achieve the tolerances in Section
3.39.
In November 2013, DMS posted its proposed deletions and additions to Section 3.39 of the CCR
for the required public comment period. The most significant of the proposed modifications
was a temporary relaxation of the accuracy tolerances specified in Subsection T2. In February
2014, the rulemaking package was submitted to the Office of Administrative Law (OAL). Final
44 NIST Handbook 44 Specifications, Tolerances, and Other Technical Requirements for Weighing and Measuring
Devices 2013. Section 3.39.

96
approval was obtained from OAL and the regulation became effective on June 16, 2014, making
Section 3.39 enforceable in California. The adopted additions and deletions to Section 3.39 are
presented in Appendix G. Proposed additions are shown in gray boxes, and proposed deletions
are marked by a strikeout of the text. These changes are to the CCR only, not NIST Handbook 44,
and therefore will be effective only in California.
The regulation establishes three additional accuracy classes, as shown in Table 29. The
underlined entries in Table 29 are proposed additions to the tentative code. Dispensers in
Accuracy Class 10.0 will be accepted if installed in California before the end of 2017; after this
date all new hydrogen dispensers must meet the tolerances in Accuracy Class 5.0 or better. New
dispensers installed after January 1, 2020 must meet Accuracy Class 2.0. It is expected that
improvements in technology will enable all new dispensers to meet the requirements of
Accuracy Class 2.0 by 2020.
Table 29: Proposed Accuracy Classes and Tolerances for Hydrogen Gas-Measuring Devices in California
Accuracy Class
Application or Commodity Being Measured
Acceptance Tolerance
Maintenance Tolerance
2.0
Hydrogen gas as a vehicle fuel
1.5 % 2.0 %
3.0 1 2.0 % 3.0 %
5.0 1 4.0 % 5.0 %
10.0 2 5.0 % 10.0 %
1 The tolerance values for Accuracy Classes 3.0 and 5.0 hydrogen gas‐measuring devices
are applicable to devices installed prior to January 1, 2020.
2 The tolerance values for Accuracy Class 10.0 hydrogen gas‐measuring devices are
applicable to devices installed prior to January 1, 2018.
2.2.2 NIST Handbook 130 ‐ Adoption of Method of Sale Requirements for Hydrogen Dispensers
The method of sale of a commodity refers to the number, volume, or weight for which a unit
price is set. Establishing a uniform method of sale for a commodity ensures that sellers
advertise and deliver a product using a single unit of measurement. This enables consumers to
make value comparisons quickly and simply.
In October 2007, the USNWG recommended the kilogram unit of mass as the retail method of
sale for hydrogen. One kilogram of hydrogen has an energy value comparable to that of a
97
gallon of gasoline. As a result, the kilogram is an acceptable method of sale from both a
metrological and consumer standpoint.
The USNWG recommendation also included a definition for “hydrogen fuel” developed by
DMS, which reads, “A fuel composed of molecular hydrogen intended for consumption in a
surface vehicle or electricity production device with an internal combustion engine or fuel
cell.”45
In 2010, regulations governing the method of sale of hydrogen fuel and the DMS definition of
“hydrogen fuel” were added to NIST Handbook 130 (Handbook 130 – 2013 2.32 Retail Sale of
Hydrogen Fuel (H)). The complete text of these regulations is given in Appendix H.
The method of sale requirements for transportation fuels also specify dispenser labeling and
signage at retail outlets. Handbook 130 specifies that the unit price of hydrogen fuel be expressed
in whole cents per kilogram. Both hydrogen dispensers and signage and retail stations must be
labeled with the unit price and the delivery pressure in units of bars or MPa.
2.2.3 NCWM Publication 14© Checklist for the Type Evaluation of Retail Hydrogen Dispensers
The NCWM administers the National Type Evaluation Program (NTEP). As discussed in
Chapter 1, all commercial weighing and measuring devices must undergo type evaluation to
show they conform to NIST Handbook 44 requirements. Type evaluations are conducted by
officials from laboratories participating in NTEP46. Devices that meet Handbook 44 requirements
receive Certificates of Conformance and are then legal for use in commerce in the forty‐six
states that require NTEP Certificates47. The NCWM publishes checklists to assist weights and
measures officials when conducting type evaluations. These are published in NCWM
Publication 14© Technical Policy, Checklists and Test Procedures48.
Within California, DMS oversees a parallel program, the California Type Evaluation Program
(CTEP). DMS is also an active participating laboratory in NTEP, and is a member of National
45 NIST Handbook 130 Uniform Laws and Regulations in the areas of legal metrology and engine fuel quality
2014edition Section 2.32.1, page 133.
46 Besides DMS, the following are participating laboratories in NTEP: Grain Inspection Packers and
Stockyard Administration (GIPSA), Washington, D.C.; Maryland Department of Agriculture, Annapolis,
MD; NIST Force Group, Gaithersburg, MD; New York State Bureau of Weights & Measures, Albany, NY;
North Carolina Department of Agriculture , Raleigh, NC; Ohio Department of Agriculture,
Reynoldsburg, OH; and Measurement Canada, Ottawa, Canada.
47 As of 2010, North Dakota, Rhode Island, Texas, Vermont, and the Virgin Islands do not require an
NTEP certificate before a weights and measures device is placed in service. Scale Manufacturers
Association website: http://www.scalemanufacturers.org/PDF/NTEPmaps.pdf. Accessed 10/29/31.
48 NCWM Publication 14© is protected under copyright laws, and excerpts may not be reproduced in this
report. NCWM publications may be purchased at http://www.ncwm.net/publications.

98
Type Evaluation Technical Committees (NTETC or sectors) formed to develop or revise type
evaluation checklists. These technical committees also work to maintain consistency between
NTEP checklists and Handbook 44 requirements.
BPC Section 12500.5 requires that all commercial weighing and measuring devices be approved
before they can be sold and installed in California. Section 12500.8 authorizes CTEP to recognize
NTEP Certificates of Conformance. Generally, DMS uses the checklists of Publication 14© for
type evaluation of devices in California. However, CTEP develops and uses its own type
evaluation checklists if a device type is not covered in Handbook 44(e.g., watt‐hour meters).
At the start of this project, there was no official type evaluation checklist for hydrogen
dispensers, either in California or nationally. DMS had developed a draft checklist for hydrogen
dispensers in 2008; however, the adoption of NIST Handbook 44 Section 3.39 was required before
a code‐specific checklist could be written for Publication 14©.
In 2010, the National Type Evaluation Technical Committee (NTETC) – Measuring Sector
established a subcommittee made up of DMS staff members Robert (Norman) Ingram, Dan
Reiswig, and Van Thompson to update and complete the draft DMS checklist for national use.
The USNWG also reviewed the checklist during its meetings in September and October 2010. At
its annual meeting in 2011, the NTETC ‐ Measuring Sector unanimously agreed to send a
proposal to the NCWM NTEP Committee to include the new checklist in Publication 14©. The
recommendation was approved the NCWM NTEP Committee at its January 2012 meeting and
the checklist was included in the 2012 Edition of Publication 14©.49
2.2.4 Field Test Procedures – EPO No. 29
An Examination Procedure Outline (EPO) is followed by weights and measures officials to
conduct routine inspection of a device and may be used as a reference in a type evaluation.
Since hydrogen fuel dispensers represented a new device class in Handbook 44, a new EPO had
to be developed for use in type evaluation and field testing.
The Weights and Measures Division of NIST drafted Examination Procedure Outline (EPO) No. 29
for Hydrogen Gas (H2 Gas) Retail Vehicle Fuel Dispensers (EPO No. 29) with guidance from the
USNWG. EPO 29 includes inspection and field test procedures, with code references to NIST
Handbook 44. The draft of EPO 29 was sent to government and industry stakeholders for
comment and evaluation. When its review is completed, EPO 29 will be accepted by NIST for
future publication. A draft version of EPO No. 29 is now available to weights and measures
officials for type evaluation and testing of hydrogen dispensers.
49 NCWM 2012 Annual Meeting Archives, available online at
https://www.ncwm.net/resources/dyn/files/980580z63c8ef1e/_fn/2012_Pub16_LR.pdf. This site requires a
free registration and log in to access documents. Accessed 10/29/13.

99
DMS will publish the hydrogen device EPO as a policy document when the hydrogen device
regulations become effective. This means that California weights and measures officials will
soon be able to use this EPO for enforcement purposes.
2.3 Design and Development of Working Standards for Type Evaluation and Field Testing of Hydrogen Dispensers
Prior to this project, much of the existing data on high‐pressure hydrogen dispensing equipment
was the property of dispenser and flow meter manufacturers. To develop and enforce the codes
and regulations necessary for the retail sale of hydrogen fuel, DMS needed verifiable information
on dispenser performance, as well as equipment to certify hydrogen dispensers. In order to test
the accuracy of hydrogen dispensers, a physical reference standard was necessary; however, no
recognized physical standards had been yet identified. The final component of the hydrogen
dispenser project called for DMS staff to explore three types of working standards that might be
suitable for type evaluations and field testing of hydrogen dispensers.
As used here, the term working standard refers to a physical apparatus used to evaluate, verify,
and test the performance of a commercial device. Under this project, three types of working
standards were investigated:
Gravimetric Standard: Hydrogen gas is dispensed into tanks similar to those installed in
fuel cell vehicles. The tanks are weighed on a scale before and after filling. The
difference between the two measurements is the mass of hydrogen dispensed.
Volumetric or Pressure‐Volume‐Temperature (PVT) Standard: Hydrogen gas is
dispensed into tanks similar to those installed in fuel cell vehicles. The density of the gas
in the tank is calculated from pressure and temperature measurements on the gas using
the NIST equation of state values. By multiplying the density by the tank’s known
internal volume, the mass of hydrogen dispensed into the field reference standard can
be calculated.
Master Meter Standard: A master meter standard is a direct one‐to‐one comparison of
the readings of a standard and a test device. For testing hydrogen dispensers, a flow
meter that has been thoroughly characterized in a calibration laboratory is placed
between the dispenser and the vehicle tank. After the tank is filled, the total flow from
this master meter is compared to the dispenser reading.
DMS did not have resources or equipment for the design or fabrication of standards. As called
for under the contract with the Energy Commission, a request for proposal was issued through
the California Department of General Services to solicit competitive bids for fabrication of the
standards. The contract was awarded to the National Renewable Energy Laboratory (NREL) in
Golden, Colorado.

100
After the contract was signed in February 2012, DMS and NREL representatives met to review
the scope of work and detailed plans to establish requirements and criteria for the physical
standards to be fabricated. NREL proposed incorporating all three standards into one package,
the Hydrogen Field Standard (HFS). The DMS/NREL agreement called for test trials at
hydrogen dispensing stations throughout California. The purpose of these tests was to validate
standards and compare the uncertainties of the three standards in the HFS. As explained in
Section 2.4 below, it was later agreed that validation testing should be conducted at NREL’s
facility, where the required controlled conditions could be maintained.
2.3.1 Design Considerations for Hydrogen Fill Tanks and Dispensers
Compressed natural gas (CNG) is an established gaseous alternative transportation fuel. Like
CNG, hydrogen fuel is stored and dispensed as a high pressure gas. Consequently, there are
many similarities between the storage and delivery systems for hydrogen and CNG. Many of
the hydrogen codes and regulations were modeled on the corresponding language for CNG.
However, the unique properties of hydrogen call for special considerations in the design and
fabrication of storage tanks and dispensers.
The maximum pressure of CNG fuel systems is typically 3,600 psi or less. Because of the lower
energy density by volume of hydrogen, hydrogen fuel systems must operate at much higher
pressures, either 5,000 psi (35 MPa) or, more commonly today, 10,000 psi (70 MPa). At these
pressures, vehicles can store enough fuel on‐board for an acceptable driving range of at least
300 miles. Bulk storage tanks at hydrogen stations are pressurized to 13,000 psi so that they can
deliver the required fill pressures.
Because of its extremely small size, a molecule of hydrogen can diffuse through many materials,
both metallic and non‐metallic. This property is a challenge in the design of storage containers
for hydrogen. The molecular bond in hydrogen can be broken at the surface of many metals,
releasing free hydrogen atoms. These atoms can rapidly diffuse into the bulk metal where they
produce defects that can lead to fracturing in a process known as hydrogen embrittlement. All
materials and components in contact with hydrogen must be specifically rated for hydrogen
service. The use of incompatible materials will cause excessive leakage, and may lead to a
failure of component or storage vessel.
The dispenser nozzle provides an electronic interface for communication between the vehicle
and dispenser controllers and a secure grounding connection. During refueling, the internal
temperature of the storage tanks rises as the hydrogen is compressed. These tanks have a
maximum temperature rating, so the rate of fill must be controlled to prevent overheating.
When a FCEV is refueled, sensor data from the vehicle storage tanks is transmitted through the
nozzle interface so that the dispenser will automatically shut off if an unsafe condition
develops.
The HFS is equipped with a standard receptacle that accepts a hydrogen dispenser nozzle.
However, the HFS does not have an electronic communications interface. The tanks in the HFS

101
have temperature sensors that are continuously monitored by the system controller. If a
temperature set point is exceeded, the controller will automatically abort the test in progress.
2.3.2 HFS – Description and Specifications
Critical design requirements for the HFS included an apparatus that is transportable by an
available vehicle, such as an industrial van or truck, and with no special power requirements
(e.g., standard 125 VAC or battery‐power). A purge system provides a controlled release of
hydrogen following a fill test from the pressurized tanks. Certified weights covering the range
of the balance are used to provide in‐field validation of the balance accuracy.
The major components of the HFS are:
The three working standards (gravimetric, volumetric, and master meter)
A programmable logic controller (PLC)
Data acquisition and display electronics
Two hydrogen fill tanks
Piping and valves connecting the tanks, standards, and hydrogen source
A supporting framework for mounting and transport
The HFS has two storage tanks connected in parallel, each with a capacity of 2 kg.
Since the HFS was designed for transport on a van or truck, commercial hydrogen‐compatible
Composite Overwrap Pressure Vessels (COPV) constructed with carbon fiber tape were
specified to reduce the weight of the apparatus. Tanks of this construction are also used in
FCEVs to minimize weight. Each fill tank is fitted with a certified high‐pressure transducers and
three certified temperature sensors to track and record internal conditions of the tank.
The original contract between DMS and NREL specified one 2 kg and one 4 kg storage tank for
the HFS. COPV tanks are manufactured in limited quantities and are used in many applications,
including the storage of compressed natural gas. The tanks needed for the HFS were in short
supply across the country when the components of the HFS were ordered and no 4 kg COPV
tanks were available. Consequently, two different types of 2 kg tanks were accepted for the
HFS.
Figure 28 shows the front view of the assembled HFS. Hydrogen Fill Tank 1 can be seen on the
left in Figure 28 and Fill Tank 2 on the right. Hydrogen fuel dispensers operate at 5000 and
10,000 psi (35 and 70 MPa) and both fill tanks are certified for operation at 10,000 psi (70 MPa).

102
Fill Tank 1 is a Type III high‐pressure storage cylinder as defined by ANSI/AGA Standard
NGV2‐2000.50 It was manufactured by Dynetek Industries51, weighs 54.55 kg and has a water Figure 28: DMS Hydrogen Field Standard (HFS)
Photo Credit: DMS Hydrogen Laboratory
volume52 of 57.9 L at zero pressure. It consists of an aluminum liner wrapped in carbon fiber
composite tape. Fill Tank 2 was manufactured by Lincoln Composites, Inc. It is a Type IV
storage cylinder weighing 54.55 kg with a water volume of 65.0 L at zero pressure. Tank 2 has a
50 The fill tanks conform to ANSI/AGA Standard NGV2‐2000, developed for on‐board storage for
compressed natural gas vehicles. A discussion of safety standards and specifications for on‐board storage
tanks can be found at An Overview of NGV Cylinder Safety Standards, Production and In‐Service Requirements,
Mark Trudgeon, July 2005.
http://www.apvgn.pt/documentacao/overview_of_cng_cylinder_safety_standards.pdf, accessed 10/7/13.
51 A complete Parts and Identification list for the HFS can be found in Appendix I.
52 The effective working volume of a vessel is determined by filling it with water. From the weight of the
water, and knowing the temperature and pressure inside the vessel, its volume may be determined from
tables of water density.
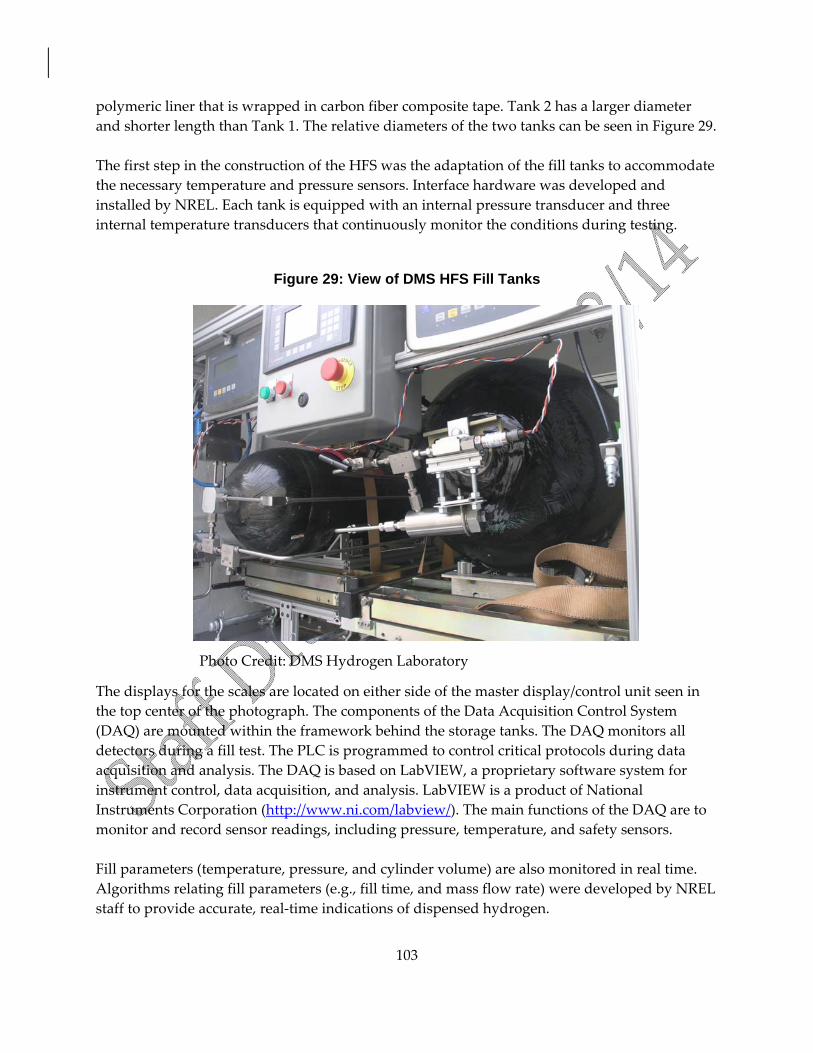
103
polymeric liner that is wrapped in carbon fiber composite tape. Tank 2 has a larger diameter
and shorter length than Tank 1. The relative diameters of the two tanks can be seen in Figure 29.
The first step in the construction of the HFS was the adaptation of the fill tanks to accommodate
the necessary temperature and pressure sensors. Interface hardware was developed and
installed by NREL. Each tank is equipped with an internal pressure transducer and three
internal temperature transducers that continuously monitor the conditions during testing.
Figure 29: View of DMS HFS Fill Tanks
Photo Credit: DMS Hydrogen Laboratory
The displays for the scales are located on either side of the master display/control unit seen in
the top center of the photograph. The components of the Data Acquisition Control System
(DAQ) are mounted within the framework behind the storage tanks. The DAQ monitors all
detectors during a fill test. The PLC is programmed to control critical protocols during data
acquisition and analysis. The DAQ is based on LabVIEW, a proprietary software system for
instrument control, data acquisition, and analysis. LabVIEW is a product of National
Instruments Corporation (http://www.ni.com/labview/). The main functions of the DAQ are to
monitor and record sensor readings, including pressure, temperature, and safety sensors.
Fill parameters (temperature, pressure, and cylinder volume) are also monitored in real time.
Algorithms relating fill parameters (e.g., fill time, and mass flow rate) were developed by NREL
staff to provide accurate, real‐time indications of dispensed hydrogen.

104
Pneumatic valves control both the filling of the tanks and the controlled emptying of the tank
following a test. Critical safety features, including pressure relief devices and other elements
(bypass and other release systems) were built into the tank pneumatic system. Automatic
emergency protocols are designed to safely halt a test in the event of an out‐of‐range condition
(e.g., excessive pressure or temperature) .The system includes many safety features, including
Pressure Relief Devices (PRDs) for emergency depressurization, and control systems for user‐
initiated purging of pressurized cylinders.
2.3.3 Gravimetric Working Standard - Description
The Gravimetric Working Standard uses two precision temperature‐compensated, calibrated
platform scales to measure the change in the weight of its two tanks during a hydrogen fill. The
scales have a resolution of one gram. The high resolution of the scales ensures that their
contribution to the uncertainty of the measurement of the mass of hydrogen dispensed is
negligible. Thus, errors in the scale readings will be negligible compared to other uncertainties
in the measurement. The mounting of the storage tanks on the scales was designed to isolate the
dispensing interface so that it does not contribute to the determination of the weight of
hydrogen dispensed. The accuracy of the scales was validated at the NREL metrology
laboratory using NIST traceable standards.
2.3.4 Master Meter Working Standard - Description
The Master meter standard uses a Coriolis meter that measures the displacement of flow tubes
as hydrogen passes through.
2.4.4 Volumetric Working Standard - Description
The Volumetric Working Standard uses data from the internal temperature and pressure
transducers in the storage tanks along with the previously determined tank volumes to
determine the mass of hydrogen dispensed during a fill.
Algorithms to convert sensor and empirical parameters (P, T, ΔVCYL) to hydrogen mass were
developed. Multiple internal temperature sensors were installed to track temporal temperature
gradients. Temporal monitoring of internal temperature facilitates recognition of thermal
steady‐state conditions. This was confirmed in the on‐site testing. Analysis for delivered
hydrogen is based on the NIST equation of state data for hydrogen already in use within
NREL’s hydrogen and fuel cell technologies program. Corrections for pressure‐induced changes
in cylinder volume were developed. Prior to use, sensor and transducer accuracy was validated
using NIST traceable methods at the NREL metrology laboratory.
2.4 HFS Testing and Generation of Control Chart Data at NREL

105
Following full system integration, the HFS was extensively tested on‐site at NREL using the
existing Wind‐to‐Hydrogen production, storage, and dispensing capabilities. A final safety
review of the HFS and operating protocols was held prior to system testing. Since the HFS was
designed for permanent installation in a vehicle, the system was mounted on similar supports
for the testing at NREL. The HFS was designed to operate in wind conditions of up to 20‐30
mph. To assess the impact of wind on stability and accuracy of the HFS, environmental data,
including wind speed and ambient temperature, barometric pressure, and relative humidity
were recorded during testing.
Originally, it was planned that system validation and the generation of control chart data would
be conducted as part of field testing by DMS in California. However, in the course of the testing
at NREL, it was recognized that the validation process demanded precisely controlled quantity
and flow conditions that could not be maintained in the field. In addition, the generation of
control chart data would interfere with the operation of a retail station and would require
significant quantities of hydrogen that could not be recovered. Accordingly, the agreement
between DMS and NREL was modified to allow the validation and control chart data to be
generated at NREL. A high volume stationary 70 MPa storage tank had to be installed at NREL
so that high pressure testing could be performed.
One of the goals of this research project was to develop a working standard for determining the
delivery in kilograms of a hydrogen dispenser. As used here, the word ‘standard’ means a
physical device used to test a weighing or measuring device. Three different standards ‐
gravimetric, master meter, and pressure‐volume‐temperature (PVT) ‐ were evaluated to
determine their suitability for use as a working standard.
For this application, the gravimetric method was the only procedure that could be directly
traced to the kilogram reference standard. Therefore, the standard mass used to verify the
gravimetric working standard was also used as a reference for the master meter and PVT
working standards to establish control charts.
The validation work was delayed when the first tank ordered failed to meet quality
specifications during testing at the fabricator.
2.5 Generation of Control Charts
Control charts were generated with two objectives: first, to demonstrate attainment of statistical
control of the measurement process of the HFS and second, to evaluate the pressure‐volume‐
temperature and master meter standards relative to the known gravimetric measurement
incorporated in the HFS. A detailed guide to control charts and the associated statistics may be
found in NIST/SEMATECH e‐Handbook of Statistical Methods April 2012
(http://www.itl.nist.gov/div898/handbook/).
A minimum of 7 – 12 independent measurements are required to establish an initial control
chart. No two data points can be determined on the same day. Replicate test made on the same
106
day estimated the short‐term standard deviation and may not indicate the actual variability of
the process. A control chart with 25 to 30 independent data points is required to make
statistically valid decisions and to calculate uncertainties.
For this project, the three standards were tested with drafts of 2 kg at 35 MPa and 4 kg at 70
MPa. Section 3.2 Tolerances of Standards in NIST Handbook 44 Appendix A recommends that the
accuracy of standards used in testing commercial weights and measures devices be no more
than one‐third the applicable device tolerance if the standard is used without a correction. The
acceptance tolerance for hydrogen dispensers established in Section 3.39 is ±1.5 % of the
indicated quantity, or 0.030 kg (30 g) and 0.060 kg (60 g) for the 2 kg and 4 kg drafts,
respectively. Therefore, after applying a factor of one‐third, the combined error plus the
uncertainty for each standard must be less than 10 g for the 2 kg drafts, and 20 g for the 4 kg
drafts.
To minimize both the amount of hydrogen and the time required for validation, the test plan
evaluated the three standards simultaneously. The gravimetric method used two temperature‐
compensated balances with a resolution of 1 g. For the volumetric method, the computer
program NIST Standard Reference Database 23 “NIST Reference Fluid Thermodynamic and
Transport Properties Database (REFPROP): Version 8.0 was used to determine the volume.
Finally, a temperature‐compensated master meter was read directly by the HFS control module.
Range (R) charts with a subgroup size of n=2 were developed for each of the three standards for
the 2 kg drafts, taken at 35 MPa and the 4 kg drafts taken at 70 MPa. R charts were developed. S
charts were not used, because the subgroup size was less than eleven. R charts evaluated the
uncertainty associated with the measurement process of replicate tests. For a detailed
explanation of R and S charts, see Section 6.3.2.1 in NIST/SEMATECH e‐Handbook of Statistical
Methods at http://www.itl.nist.gov/div898/handbook/pmc/section3/pmc321.htm.
Two replicate tests were made each day. Table 30 shows representative data collected on Day 15
of the collection process. Data was collected at approximately 200 individual time points for
each replicate. Table 30 includes readings spaced throughout the first test of Day 15. The
absolute differences between each day’s replicate tests were used to calculate the range with
one degree of freedom per replicate test. The range was divided by the square root of 2 (n=2) to
give an estimate of the standard deviation of the normal distribution.
Control charts were constructed by plotting the average of the range, observed values for each
day, upper warning limit (UWL), and upper control limit (UCL). With a sub‐grouping of n=2,
the lower control limit (LCL) and lower warning limit (LWL) are equal to zero. The UWL is
calculated by multiplying the average of the range by 2.512 and the UCL by 3.267. These limits
are critical values of the t‐test parameter for confidence intervals of 95% and 99.7% based on a
sample size of 30 (values from NIST Technical Note 1297). Observations plotted on the control
chart falling outside the UCL would indicate a decrease in precision leading to possible
problems with the standard or process.
The control charts for each of the standards at 35 and 70 MPa are shown in Figures 30‐35.

107
Figure 30: Gravimetric Standard Control Chart (35 MPa)
0
0.005
0.01
0.015
0.02
0.025
0.03
kg
Date
State of California, Department of Food & AgricultureDivisionof Measurement Standards Metrology Laboratory
35 MPa Gravimetric Graph
UpperAction Limit
UpperWarningLimitAverage R
Observation

108
Figure 31: PVT Standard Control Chart (35 MPa)
0
0.01
0.02
0.03
0.04
0.05
0.06
0.07
kg
Date
State of California, Department of Food & AgricultureDivision of Measurement Standards Metrology Laboratory
35 MPa PVT Graph
UpperActionLimit
UpperWarningLimit
AverageR
Observation

109
Figure 32: Master Meter Control Chart (35 MPa)
0
0.1
0.2
0.3
0.4
0.5
0.6
kg
Date
State of California, Department of Food & AgricultureDivision of Measurement Standards Metrology Laboratory
35 MPa Master Meter Graph
UpperActionLimit
UpperWarningLimit
AverageR
Observation

110
Figure 33: Gravimetric Standard Control Chart (70 MPa)
0
0.005
0.01
0.015
0.02
0.025
0.03
0.035
kg
Date
State of California, Department of Food & AgricultureDivisionof Measurement Standards Metrology Laboratory
70 MPa Gravimetric Graph
UpperAction Limit
UpperWarningLimit
Average R
Observation

111
Figure 34: PVT Standard Control Chart (70 MPa)
0
0.01
0.02
0.03
0.04
0.05
0.06
0.07
0.08
kg
Date
State of California, Department of Food & AgricultureDivisionof Measurement Standards Metrology Laboratory
70 MPa PVT Graph
UpperActionLimit
UpperWarningLimit
AverageR
Observation

112
Figure 35: Master Meter Standard Control Chart (70 MPa)
0
0.1
0.2
0.3
0.4
0.5
0.6
0.7
kg
Date
State of California, Department of Food & AgricultureDivisionof Measurement Standards Metrology Laboratory
70 MPa Master Meter Graph
UpperActionLimit
UpperWarningLimit
AverageR
Observation

113
Table 30: Selected Fill Data from Day 15 (10/23/2013) R
ead
ing
213
2435
4658
6980
101
112
124
135
146
158
169
180
191
198
Tim
e (
Min
.)11
5411
5712
0112
0512
1012
3112
3512
4012
4716
1616
2016
2416
2917
0917
1417
1717
4717
48
Tim
e (
Se
c.)
5341
5817
651
5817
4813
4446
4838
5146
3713
Tan
k1 T
em
p0
(de
g C
)16
.241
.542
.546
.541
.234
.452
.360
.157
.238
.838
.344
.540
.239
.548
.359
.348
.148
.0
Tan
k1 T
em
p1
(de
g C
)16
.541
.542
.447
.341
.835
.051
.860
.357
.839
.039
.345
.440
.739
.848
.059
.948
.448
.3
Tan
k1 T
em
p2
(de
g C
)16
.943
.043
.348
.342
.335
.252
.561
.058
.440
.840
.146
.341
.240
.148
.460
.148
.848
.6
Tan
k1 T
em
p A
vg
(d
eg
C)
16.5
42.0
42.7
47.3
41.7
34.8
52.2
60.4
57.8
39.5
39.2
45.4
40.7
39.8
48.2
59.7
48.4
48.3
Tan
k1 P
ress
ure
(p
sig
)15
3.1
1386
.027
14.8
4018
.139
67.3
3919
.557
41.4
7876
.996
09.6
1017
.324
79.8
3873
.639
36.0
4603
.162
23.2
8711
.593
26.7
9321
.8
Tan
k1 M
ass
PV
T
(kg
)0.
055
0.40
70.
755
1.05
21.
057
1.06
71.
399
1.76
12.
055
0.30
60.
703
1.02
51.
053
1.20
51.
508
1.90
32.
054
2.05
4
Tan
k1 W
eig
ht
Sca
le (
kg)
0.00
00.
355
0.69
90.
999
2.00
61.
002
1.34
41.
703
2.00
40.
253
0.65
70.
977
1.00
41.
149
1.45
11.
853
3.00
62.
006
Tan
k2 T
em
p0
(de
g C
)15
.347
.147
.748
.243
.940
.347
.661
.558
.645
.342
.648
.843
.742
.351
.659
.951
.551
.4
Tan
k2 T
em
p1
(de
g C
)14
.153
.054
.263
.251
.842
.559
.866
.665
.651
.757
.362
.951
.345
.754
.968
.752
.952
.8
Tan
k2 T
em
p2
(de
g C
)14
.455
.957
.163
.652
.243
.761
.471
.866
.354
.258
.863
.251
.648
.157
.271
.853
.353
.2
Tan
k2 T
em
p A
vg
(d
eg
C)
14.6
52.0
53.0
58.3
49.3
42.1
56.2
66.6
63.5
50.4
52.9
58.3
48.8
45.3
54.5
66.8
52.5
52.4
Tan
k2 P
ress
ure
(p
sig
)15
9.8
1386
.027
09.0
3729
.536
13.7
3907
.657
19.4
7863
.383
96.8
1019
.624
76.9
3707
.435
89.6
4593
.662
10.2
8582
.180
49.5
8044
.9
Tan
k2 M
ass
PV
T
(kg
)0.
064
0.44
40.
823
1.07
61.
073
1.17
21.
553
1.95
12.
067
0.33
40.
759
1.07
11.
068
1.33
31.
668
2.08
62.
053
2.05
3
Tan
k2 W
eig
ht
Sca
le (
kg)
0.00
00.
369
0.74
21.
003
1.00
21.
097
1.47
11.
864
1.99
30.
262
0.69
01.
004
2.00
31.
258
1.58
22.
003
1.99
31.
993

114

115
Table 30 (cont.): Selected Fill Data from Day 15 (10/23/2013)

116

117
2.6 Installation of the HFS at DMS
The HFS was secured and crated for shipment to Sacramento following approval by DMS staff
of the control charts generated at NREL. A DMS 1996 Ford F 250 4X4 extended cab pickup truck
with an available cargo weight rating of 2,200 pounds was selected to house and transport the
HFS.
A custom fiberglass service body manufactured by SpaceKap was purchased to enclose the
truck bed to protect the HFS from wind and rain, and to provide security from theft and
vandalism when the truck is parked in locations around the state. A capped, passive vent was
installed at the high point of the roof of the SpaceKap to prevent any accumulation of hydrogen.
The service body was installed by DMS. Parts for mounting the HFS to the bed were fabricated
by Sacramento Capital Machine and Sacramento Custom Truck Accessories. Custom Truck
Accessories completed the installation of the HFS to the bed of the truck. The mounting is
similar to the way a fifth wheel trailer would mount to the bed of a pickup truck. The service
body has windows and LED lighting that provide sufficient light, and has sufficient clearance
for access to all sides of the HFS. DMS staff connected the truck’s electrical system to the service
body. Figure 36 shows the service body mounted on the DMS truck. Figure 37 shows the
interior of the service body before the HFS was installed.
Figure 36: SpaceKap Service Body Installed on DMS Truck
Photo Credit: DMS Hydrogen Laboratory

118
Figure 37: SpaceKap Shell Housing for the HFS
Photo Credit: DMS Hydrogen Laboratory
Figure 38: HFS Mounted in the SpaceKap Shell
Photo Credit: DMS Hydrogen Laboratory

119
CHAPTER 3: Evaluation of Control Charts and HFS Field Testing
3.1 Challenges in HFS Design, Fabrication, and Testing
The hydrogen fuel industry and its supporting technologies are in an early stage of
development. As a result, many challenges were encountered in the course of this project in the
design and fabrication of the HFS. Lessons learned by DMS and NREL may be instructive for
others involved with hydrogen fuel technology. Among the issues encountered were the
following:
It was recognized early in the project that the validation process and the generation of
control chart data required precisely controlled quantity and flow conditions that could
not be maintained in the field. In addition, this testing would interfere with the
operation of a retail hydrogen station. Therefore, it was agreed that the validation and
control chart data would be generated at NREL where full access and environmental
control could be maintained throughout the testing period.
Availability of on‐board storage tanks was found to be extremely limited since the
production of hydrogen tanks competes for manufacturing capacity with CNG tanks
that are currently in high demand. It was necessary to procure used tanks of two
different models in order to fabricate the HFS as scheduled. Storage tanks of 4 kg
capacity were not available, so the HFS was fabricated with two 2 kg tanks.
Procurement of the high volume stationary 70 MPa storage tank required for NREL to
complete the validation and generate control chart data was delayed when the first tank
ordered failed to meet quality and safety specifications during testing at the fabricator.
The master meter standard, using a Coriolis meter, did not meet the tolerances required
for Type Evaluation. It is possible that the HFS design of three combined standards
compromised the performance of the master meter standard in unforeseen ways. In the
future, improvements in standard design or metering technology (either Coriolis or
sonic) may enable a stand‐alone master meter standard to achieve the precision required
for type evaluation.
3.2 Assessment of HFS Control Chart Data
3.2.1 Assessment of Control Charts
Each control chart was evaluated in groups of ten independent data points (independent data
point equals one subgroup n=2). Each additional group of ten independent data points was
evaluated against the pooled data by using the statistical F‐test and Student t‐test to examine
the differences. (NIST/SEMATECH e‐Handbook of Statistical Methods April 2012 provides a
discussion of these tests at http://www.itl.nist.gov/div898/handbook/quantgal.htm.)
Populations were pooled if both the F‐test and the Student t‐test passed. By evaluating the data

120
in smaller groups, significant differences were more easily identified, along with possible
problems or trends. The pooled standard deviations were used to examine the measurement
uncertainty.
In the analysis of the 2 kg (35 MPa) drafts, thirty independent data points were evaluated for
each procedure and plotted in one control chart. After performing the F‐test and t‐test for the
gravimetric procedure, it was determined that only twenty data points would be used to
calculate the measurement uncertainty. The statistics associated with the first 10 data points
were judged unacceptable for this calculation. Since these were the first data acquired at NREL,
this may have arisen from how the scales were initially used, uncertainties in the procedure,
technician training and competency, or some other factor. For the PVT and master meter
procedure, the F‐test and t‐test evaluations did allow for all thirty data points to be used in the
determination of the measurement uncertainty as shown in Table 31.
Table 31: 2 kg (35 MPa) Measurement Uncertainty
Procedure Number of Data
points used R-bar Measurement Uncertainty
Gravimetric 20 2.8 g 2.4 g
Volume 30 18.4 g 15.5 g
Master Meter 30 144.3 g 144.4 g
The uncertainty of a result of a measurement may consist of several components, which may be
evaluated by statistical methods or by others means. In this research, the measurement process
uncertainty, calculated and evaluated through control charting, was considered as the largest
contributor and used in calculating the expanded uncertainty (total uncertainty). The
measurement process uncertainty was multiplied by a coverage factor, k, based on the degrees
of freedom to provide a level of confidence of approximately 95% as shown in Table 32.
To meet the fundamental considerations of NIST Handbook 44, the expanded uncertainty must
be less than 10 g (0.5% of tolerance). From Table 32, the gravimetric procedure is less than one‐
third or less than 10 g for the acceptance tolerance of the device under test, while the PVT and
master meter failed this criterion.
The 4 kg (70 MPa) was evaluated using the same method as for 2 kg (35 MPa) as shown in
Tables 33 and 34. For the gravimetric and master meter procedure, all thirty independent data
points were used. For the volume procedure, the first ten independent data points failed the F‐
test and t‐test and were not included in the determination of the measurement uncertainty. The
results in Table 34 show that the gravimetric procedure would meet the fundamental
considerations of less than 20 g while the PVT and master meter fail to meet this criterion.

121
Table 32: 2 kg (35 MPa) Expanded Uncertainty for a 95% C.I.
Table 33: 4 kg (70 MPa) Measurement Uncertainty
Procedure Number of Data
points used R-bar Measurement Uncertainty
Gravimetric 30 7.9 g 7.6 g
Volume 20 17.4 g 16.8 g
Master Meter 30 174 g 170 g
Procedure Degrees of
Freedom (n-1) Measurement Uncertainty Coverage Factor k
Expanded Uncertainty
Gravimetric 19 2.4 g 2 4.8 g
Volume 29 15.5 g 2 31 g
Master Meter 29 144.4 g 2 288.8 g

122
Table 34: 4 kg (70 MPa) Expanded Uncertainty for a 95% C.I.
Procedure Degrees of
Freedom (n-1) Measurement Uncertainty
Coverage Factor k
Expanded
Uncertainty
Gravimetric 29 7.6 g 2 15.2 g
Volume 19 16.8 g 2 33.6 g
Master Meter 29 170.0 g 2 340 g
Additional analysis was performed to examine the environmental effects on the measurements.
It was determined that changes in temperature, pressure, humidity, and air density did not
show any significant correlation with the testing results.
3.3 Installation and Field Testing of the HFS
The HFS was shipped to DMS in Sacramento and installed in a service body on a 1996 Ford
F250 truck for field testing. An initial checkout of the HFS was conducted at the UC Berkeley
Transportation Sustainability Research Center, Richmond California Field Station, shown in
Figure 39. The HFS checkout was conducted to confirm the HFS maintained operational and
performance integrity after shipment from NREL, installation into the truck, and a short road
test. The HFS performed well during the checkout and maintained operational and performance
integrity.
Several lessons were learned during the checkout:
The setup and breakdown times need to be reduced to accomplish all tasks required a
Type Evaluation at a retail station in the scheduled time.
The relatively limited space around the HFS in the SpaceKap shell made it difficult to set
up the HFS and make needed adjustments and repairs during field testing. Had a wider
truck bed been available, a larger shell would have made access to the HFS easier.
A more flexible vent configuration is necessary to reduce setup time and adapt to
specific conditions at each station.
A complete set of spare parts and tools for making field repairs on tubing, valves, and
various connectors is also necessary.
Following the HFS checkout at the Berkeley Field Station, a field test was conducted at AC
Transit in Emeryville, as shown in Figure 40. All drafts required for a type evaluation were
completed successfully. DMS Measurement Standards Specialist III Robert (Norman) Ingram
has begun testing and type evaluation of dispensers at the other public stations throughout

123
California. This work is expected to be completed in 2014. Data from this testing is part of the
working notes of DMS and is not subject to public records disclosure requests. The specific
tolerance data from testing at each station will remain confidential. As appropriate,
consolidated data will be shared with stakeholders and made available on the DMS website.
Figure 39: HFS Checkout at the UCB Richmond Field Station
Photo Credit: DMS Hydrogen Laboratory
Figure 40: HFS Field Testing

124
Photo Credit: M. Kashuba, CARB
CHAPTER 4: Discussion, Recommendations and Future Work
4.1 Project Accomplishments
4.1.1 Development of Hydrogen Fuel Dispenser Requirements for NIST Handbook 44 Section 3.39
DMS director Kristin Macey and DMS Measurement Standards Specialist III Robert (Norman)
Ingram were members of the USNWG that developed the hydrogen fuel dispenser
requirements. The Working Group’s draft code was adopted by the NCWM and published in
the 2011 edition of NIST Handbook 44 as Section 3.39 as a ‘tentative code’.
In addition, these requirements are now included in the DMS Field Reference Manual53 for future
use by state and county inspectors in California.
4.1.2 Development of Type Evaluation, Field Test Procedures, and Checklist for the Certification of Hydrogen Dispensers
An Examination Procedure Outline, EPO 29, and field test procedures for hydrogen dispensers
have been developed. An EPO is a written set of instructions laying out the procedure to use
when evaluating a device, in this case, a hydrogen dispenser. The NIST Weights and Measures
Division has accepted EPO 29 for future publication. A type evaluation checklist for the
certification of retail hydrogen dispensers was developed and has been published in NCWM
Publication 14©. These procedures and standards will provide a regulatory framework for the
development of hydrogen infrastructure in California and the nation. DMS will publish the
hydrogen device EPO as a policy document when the hydrogen device regulations become
effective.
4.1.3 Adoption of the Kilogram as the Method of Sale for Hydrogen Fuel – NIST Handbook 130
The USNWG recommended the kilogram mass unit as the retail method of sale for hydrogen in
October, 2007. The proposal also included a definition for “hydrogen fuel” developed by DMS,
which reads, “A fuel composed of molecular hydrogen intended for consumption in a surface
vehicle or electricity production device with an internal combustion engine or fuel cell.”54 In
2010, regulations governing the method of sale of hydrogen fuel and this definition were added
53 The DMS Field Reference Manual is available online at http://cdfa.ca.gov/dms/publications.html under
Regulations.
54 NIST Handbook 130 Uniform Laws and Regulations in the areas of legal metrology and engine fuel quality 2013
edition Section 2.32.1, page 131.

125
to NIST Handbook 130 (Handbook 130 – 2013 IV B 2.32 Retail Sale of Hydrogen Fuel (H). The
complete text of these regulations is given in Appendix H.
4.1.4 Design, Construction, and Testing of Reference Standards to Conduct Type Evaluation of Retail Hydrogen Fuel Dispensers
DMS Measurement Standards Specialist III Robert (Norman) Ingram worked with a team of
engineers and scientists at NREL to design, construct, and test three standards for the type
evaluation of retail hydrogen dispensers. The three types of standards, gravimetric, PVT, and
master meter, were combined in a single unit, the Hydrogen Field Standard, or HFS. The NREL
team collected data from these standards for control charts. DMS’ Principal State Metrologist
Greg Boers generated the control charts and reviewed the test performance data of the HFS
with Norman Ingram.
Control chart data showed that the gravimetric standard met the tolerances necessary for type
evaluation of retail hydrogen dispensers. This standard will be used by DMS in the type
evaluation and routine performance testing of dispensers. Type evaluation testing has begun at
retail stations throughout California.
Control chart data for the PVT and the master meter standards failed to meet the tolerances
necessary for type evaluation of retail hydrogen dispensers. However, data from these
standards will be collected as time permits when DMS conducts type evaluations and field
testing. . Further investigation would be needed to refine the design of the HFS to improve their
performance. It is possible that design modifications and improvements in meter sensor
technology could lead to the development of stand‐alone PVT or master meter standard able to
meet the specifications required for type evaluation for testing purposes.
4.2 Challenges, Lessons Learned, and Recommendations
The hydrogen fuel industry and its supporting technologies remain in an early stage of
development. As a result, many challenges were encountered in the course of this project to
fabricate standards. Lessons learned by DMS and NREL may be instructive for others involved
with hydrogen fuel technology. Among the issues encountered were the following:
There was limited availability of on‐board storage tanks for the project. In part, this was
because the production of hydrogen tanks competes for manufacturing capacity with
CNG tanks, which are currently in high demand. The original standards design called for
a 2 kg and a 4 kg tank; however, no new tanks in either size could be were available from
manufacturers. As a result, two previously used 2 kg tanks were used instead substituted.
Availability of hydrogen storage tanks is expected to remain limited for at least the near
future. Accordingly, procurement of tanks for construction of additional field reference
standards may take longer than expected.

126
The Coriolis meter in the master meter standard has a limited capability to measure gas
flows accurately at the high pressures and low densities encountered during test fills. The
placement of the master meter standard downstream of the dispenser also contributes to
in the high uncertainties in the master meter standard data. These factors would also be
limitations in a stand‐alone master meter standard.
The original project plan was for DMS to collect control chart data for the standards at
station locations throughout California. However, the validation process required data
at both 35 MPa and 70 MPa be collected twice a day on thirty successive days. Data
collection would interrupt station operation and consume a total of 8 kg of hydrogen
each day. In addition, it was recognized that variability in environmental and dispenser
conditions at different stations would be a significant source of error in control chart
data. Accordingly, it was agreed that this work would be done at NREL’s facility. In this
way, full access and control over hydrogen quantity, flow, and pressure could be
maintained throughout the testing period with no concerns about business disruption.
Procurement of a stationary high volume 70 MPa hydrogen storage tank needed for
validation testing of the HFS at NREL created a significant delay. The first tank ordered
failed to meet quality specifications during testing at the fabricator, and had to be
replaced. Availability of hydrogen storage tanks, both mobile and stationary, is expected
to remain limited at least in the near term. While this situation does not affect DMS
operations with the HFS, it could affect fabrication of another standard.
A larger truck bed to house the HFS, along with a larger enclosure would be desirable.
The limited space around the HFS in the SpaceKap shell made it difficult to set up the
HFS and make needed adjustments and repairs during field testing.
4.3 Future Work
With the successful deployment of gravimetric standard of the HFS, all of the project objectives
relating to the specification and field testing of hydrogen fuel dispensers have been met. DMS
now has the necessary tools to support device manufacturers and station operators in the
development of hydrogen infrastructure in California. Type evaluation and field testing of
dispensers throughout the state is underway. While protecting the confidential business
information of device manufacturers and station operators, DMS will make the information and
knowledge acquired through this testing available to stakeholders. DMS will continue to work
with the Energy Commission, CARB, and other partners to support the development of the
retail hydrogen industry in California.

Alternative and Renewable Fuel and Vehicle Technology Program
FINAL PROJECT REPORT: VOLUME 3
MONTH YEAR
CEC‐XXX‐XXXX‐XXX
Prepared for: California Energy Commission
Prepared by: California Department of Food and Agriculture Division of Measurement Standards
PHYSICAL AND CHEMICAL
ANALYSIS OF BIODIESEL FUEL
Analytical Methods for Biodiesel Blends
Above 20 Volume Percent

127
VOLUME 3 SUMMARY
Our economy runs largely on diesel power. Fuel tax figures from the California Board of
Equalization show that in 2012, the state’s monthly consumption of diesel fuel averaged over
217 million gallons.55 Diesel engines have higher efficiency and greater power than gasoline
engines. However, the combustion of petroleum‐based diesel fuel is a leading source of
greenhouse gas and toxic emissions in California. These emissions are major contributors to
global warming and climate change, and have many significant adverse public health impacts.
Biodiesel fuel is a renewable fuel that can supplement or replace No. 2 diesel fuel in
compression ignition (diesel) engines. Although some compression ignition engines can run on
pure biodiesel fuel, most often biodiesel is blended with petroleum diesel in concentrations up
to 20%. Biodiesel has excellent lubricating properties, and is used at low levels to meet the
lubricity requirements of California’s ultra‐low sulfur diesel fuel. Biodiesel blends can
significantly reduce greenhouse gas and most toxic tailpipe emissions. Increased use of
biodiesel blends in California will improve air quality, and reduce dependence on petroleum
products. Biodiesel in concentrations up to five volume percent is allowed in diesel fuel and
requires no special labeling at those levels.
The Department of Food and Agriculture (CDFA) regulates the sale of transportation fuels in
California. The California BPC Division 5, Chapter 14, Section 13450 requires the CDFA to
establish and enforce quality specifications for compression ignition engine fuel in California.
BPC Section 13450 requires the CDFA to adopt standard specifications for compression ignition
engine fuels published by ASTM International (ASTM) or other ANSI‐accredited standards
development organization. ASTM has published standard specifications for diesel fuel (ASTM
D975), pure (neat) biodiesel blendstock (ASTM D6751), and biodiesel blends between 6 and 20
volume percent biodiesel with diesel fuel (ASTM D7467), along with a suite of validated test
methods for establishing compliance with these standards.
Currently, there are no standard specifications or validated test methods for biodiesel blends
above 20 volume percent. Such specifications and test methods are needed to support
commercialization of biodiesel blends with more than 20 volume percent biodiesel in California.
When such specifications do not exist, the CDFA may be required to develop interim
specifications. In the absence of standard specifications, transportation fuels may be sold in
California only with a developmental fuel variance from the CDFA. This is currently the case
for biodiesel blends of higher than 20 volume percent.
Neat biodiesel has very different physical and chemical characteristics than the hydrocarbons
found in diesel fuel. Research on the application of ASTM’s published tests is needed to identify
methods that may be applied as written to blends above 20 volume percent and those that need
modification to be applied to higher biodiesel blends.
55 California Board of Equalization Fuel Taxes Statistics and Reports
http://boe.ca.gov/sptaxprog/spftrpts12.htm accessed 9/17/2013.

128
The Division of Measurement Standards of the CDFA of Food and Agriculture was contracted
and funded by the California Energy Commission to evaluate existing diesel and biodiesel test
methods for blends with concentrations above 20 volume percent. The blends tested were
prepared from four stocks of biodiesel produced from waste cooking oil, soy oil, and a mixture
of canola and safflower oils. These blend stocks were purchased from three biodiesel producers
in California. They were selected as representative of biodiesel commercially available in
California.
Each biodiesel blend stock was mixed with a CARB No. 2‐D S15 Diesel Fuel Oil that was
certified free of any biodiesel component to prepare a series of blends covering the range of 20 –
90% biodiesel. Each blend, along with the neat blend stocks, was tested using ASTM test
methods to determine the suitability of the methods over the entire concentration range. Table
35 lists the test methods evaluated.
With two exceptions, the methods listed in Table 35 worked for all blends tested. The conditions
of the distillation tests caused thermal degradation of the components of the biodiesel, resulting
in failure of the tests for most of the blends. The Automatic Atmospheric Distillation method
worked only for blends of 30 volume percent and lower. The Automatic Reduced Pressure
Distillation worked only for B90 and neat B100. A microdistillation test method has been
evaluated as an alternative for these two tests.
CDFA Senior Environmental Scientist Allan Morrison’s work with stakeholders through ASTM
led to the establishment of an industry workgroup to develop the framework for standard for
biodiesel blends above B20. CDFA took a lead role in this workgroup. The workgroup will
further develop the data necessary to establish an ASTM Work Item that will lead to the
development of a fuel standard for biodiesel blends above B20.
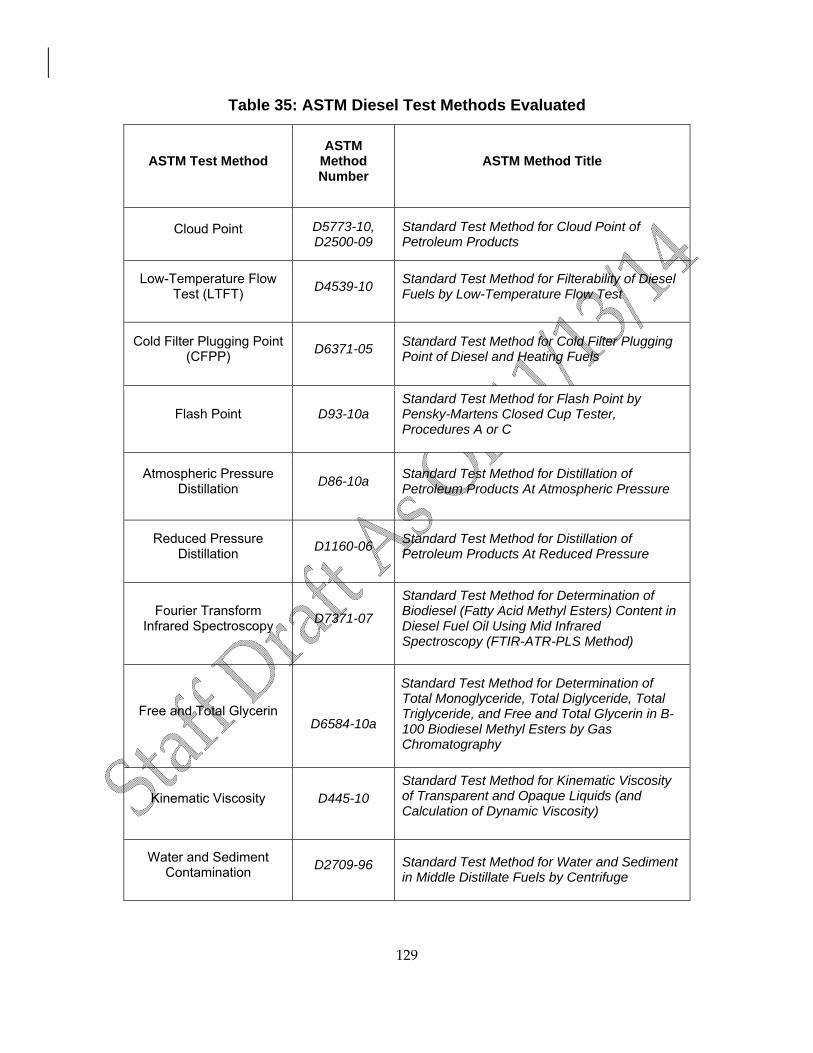
129
Table 35: ASTM Diesel Test Methods Evaluated
ASTM Test Method ASTM
Method Number
ASTM Method Title
Cloud Point D5773-10, D2500-09
Standard Test Method for Cloud Point of Petroleum Products
Low-Temperature Flow Test (LTFT)
D4539-10 Standard Test Method for Filterability of Diesel Fuels by Low-Temperature Flow Test
Cold Filter Plugging Point (CFPP)
D6371-05 Standard Test Method for Cold Filter Plugging Point of Diesel and Heating Fuels
Flash Point D93-10a Standard Test Method for Flash Point by Pensky-Martens Closed Cup Tester, Procedures A or C
Atmospheric Pressure Distillation
D86-10a Standard Test Method for Distillation of Petroleum Products At Atmospheric Pressure
Reduced Pressure Distillation
D1160-06 Standard Test Method for Distillation of Petroleum Products At Reduced Pressure
Fourier Transform Infrared Spectroscopy
D7371-07
Standard Test Method for Determination of Biodiesel (Fatty Acid Methyl Esters) Content in Diesel Fuel Oil Using Mid Infrared Spectroscopy (FTIR-ATR-PLS Method)
Free and Total Glycerin
D6584-10a
Standard Test Method for Determination of Total Monoglyceride, Total Diglyceride, Total Triglyceride, and Free and Total Glycerin in B-100 Biodiesel Methyl Esters by Gas Chromatography
Kinematic Viscosity D445-10 Standard Test Method for Kinematic Viscosity of Transparent and Opaque Liquids (and Calculation of Dynamic Viscosity)
Water and Sediment Contamination
D2709-96 Standard Test Method for Water and Sediment in Middle Distillate Fuels by Centrifuge


131
CHAPTER 1: Introduction to Biodiesel Fuel
“The use of plant oil as fuel may seem insignificant today.
But such products can in time become just as important
as kerosene and these coal‐tar‐products of today.”
Rudolf Diesel, inventor of the diesel engine, 1912
1.1 Biodiesel and Air Quality in California
Diesel engines have higher efficiency and power than gasoline engines. However, the
combustion of petroleum‐based diesel fuel is a leading source of greenhouse gas and toxic
emissions in California. These emissions are major contributors to global warming and climate
change,56 and have many significant adverse public health impacts.57 58 The California Air
Resources Board (CARB) has established ambient air quality standards to protect public health
governing particulate matter, nitrogen dioxide, and carbon monoxide emitted when petroleum
fuels are burned.59 Both diesel particulates and nitrogen dioxide pose particular health threats to
children and the elderly.60 61
Biodiesel fuel is produced from fats and oils from plant or animal sources. A sustainable and
renewable fuel, biodiesel can supplement or replace the fossil fuels used in compression
ignition engines. In 2002, a joint report of CARB and the U.S. Environmental Protection Agency
(U.S. EPA) compared emissions from biodiesel and low sulfur (300 ppm) petroleum diesel fuel
in compression ignition engines. For neat soy biodiesel and a 20 % soy biodiesel blend,
emissions of particulate matter, carbon monoxide, and unburned hydrocarbons were
significantly reduced compared to petroleum diesel fuel. In addition, sulfate emissions were
56 U.S. Energy Information Administration. eia.gov/oiaf/1605/ggccebro/chapter1.html accessed June 4,
2013
57 California Office of Health Hazard Assessment www.oehha.ca.gov/public_info/facts/dieselfacts.html
accessed June 4, 2013
58 Union of Concerned Scientists www.ucsusa.org/clean_vehicles/why‐clean‐cars/air‐pollution‐and‐
health/trucks‐buses‐and‐other‐commercial‐vehicles/diesel‐engines‐and‐public.html accessed 6/4/13
59 CARB arb.ca.gov/research/aaqs/caaqs/caaqs.htm. accessed 6/24/13
60 CARB arb.ca.gov/research/diesel/diesel‐health.htm. accessed 6/24/13
61 CARB arb.ca.gov/research/aaqs/caaqs/no2‐1/no2‐1.htm. accessed 6/24/13

132
nearly eliminated with 100 volume percent biodiesel because of its intrinsically low sulfur
content.62 The findings from this report are summarized in Table 36.
Table 36: Emissions Reductions with Biodiesel Fuels
In California, several legislative initiatives have established programs to reduce the use of
petroleum products and mitigate their adverse health and environmental impacts. Assembly
Bill 32 (Global Warming Solutions Act of 2006, Núñez, Chapter 488, Statutes of 2006)
established programs in the California Air Resources Board (CARB) “to achieve real,
quantifiable, cost‐effective reductions of greenhouse gases (GHG)”63 through a combination of
market‐based and regulatory actions. The Energy Commission’s Alternative and Renewable
Fuel and Vehicle Technology Program funds clean vehicle and equipment projects, research on
biofuels production and the air quality impacts of alternative fuels. Following Governor
Schwarzenegger’s Executive Order S‐1‐07, the CARB implemented a Low Carbon Fuel Standard
for California.64 The expanded use of biodiesel fuel has been identified as an important
component for the success of these programs.
Pure biodiesel is generally not used directly as a transportation fuel for compression engines.
Instead, it is blended with petroleum diesel fuel, with which it is completely miscible. The use
of biodiesel significantly reduces greenhouse gas and tailpipe emissions of particulates and
carbon monoxide. Nitrous oxide (NOX) emissions from blends with high biodiesel content
remain a concern. Research on ways to reduce NOX emissions from higher concentration blends
62 U.S. Environmental Protection Agency. “A Comprehensive Analysis of Biodiesel Impacts on
Exhaust Emissions,” EPA420‐P‐02‐001, October 2002,
http://www.epa.gov/otaq/models/analysis/biodsl/p02001.pdf accessed on January 26, 2012.
63 CARB website: http://www.arb.ca.gov/cc/cleanenergy/clean_fs4.htm. Accessed 2/7/14.
64 CARB website: arb.ca.gov/fuels/lcfs/lcfs‐background.htm. Accessed 7/8/13.
Percent Biodiesel
Particulate Matter
Carbon Monoxide
Unburned Hydrocarbons
100 percent -47 % -48 % -67 %
20 percent -12% -12 % -20 %

133
is ongoing. The specific composition of a biodiesel fuel, which is determined by the blend stock
used in its production, has been shown to affect the amount of both NOX and soot emissions.65
The designation “Bxx” indicates the volume percent biodiesel (xx) in a blend. The balance of the
blend is a petroleum‐based middle distillate fuel, typically No. 2 Diesel. For example, a blend of
90 volume percent biodiesel with 10 volume percent No. 2 Diesel is designated B90. Pure (or
neat) biodiesel containing no added petroleum diesel is designated B100. Neat biodiesel must
conform to the specifications established by ASTM International66 (ASTM), in D6751‐12,
Standard Specification for Biodiesel Fuel Blend Stock (B100) for Middle Distillate Fuels. ASTM
standards are copyrighted, and are available for purchase from the ASTM website at
http://www.astm.org/Standard/index.shtml.
All engine fuels sold in California must meet the minimum state specifications described in the
BPC, Division 5, Chapter 14, Sections 13450‐13451, and the California Code of Regulations
(CCR), Title 4, Division 9, Chapter 6, Section 4148(c). The Division of Measurement Standards
(DMS) of the California Department of Food and Agriculture (CDFA) is responsible for the
regulation of transportation fuels in California. The cited code sections require CDFA to adopt
standard specifications for fuels that are published by ASTM International or a similar
consensus group. When such standard specifications do not yet exist, CDFA may develop
interim specifications to be in effect pending the publication of standards by ASTM or another
consensus group. ASTM currently has standard specifications for petroleum diesel (including
blends containing up to five volume percent biodiesel), biodiesel blends between B5 and B20,
and neat B100 biodiesel. Table 37 lists the numbers and titles of these standards.
Lacking published standard specifications, biodiesel blends greater than B20 may currently be
sold in California only with a developmental engine fuel variance according to the provisions of
the BPC Division 5, Chapter 14, Section 13405 and the CCR Title 4, Division 9, Chapter 6,
Section 4144.67 Such a variance may be granted by DMS for fleet use when a public benefit can
be demonstrated and while a recognized consensus organization is developing standard
specifications. A new ASTM working group was established at the June 2013 ASTM meeting in
Montreal to develop specifications for biodiesel blends above B20. Allan Morrison of DMS is a
part of this workgroup. At the December 2013 ASTM meeting, the working group decided that
an industry task force should take the lead in developing a standard covering the range from
65 Ng, Hoon Kiat et al, “Simulation of biodiesel combustion in a light‐duty diesel engine using integrated
compact biodiesel–diesel reaction mechanism,” Applied Energy 102, 1275‐1287 2013. Abstract accessed on
line at http://www.sciencedirect.com/science/article/pii/S0306261912005041 7/5/13.
66 Until 2001, ASTM International was known as the American Society for Testing and Materials.
67 Information about developmental fuel variances is available at the DMS website, along with a list of
variances that have been granted for biodiesel fuel blends:
www.cdfa.ca.gov/dms/programs/petroleum/developmentalfuels/developmentalfuels.html

134
B20 to B100. As a first step in this effort, engine performance data with higher blends will be
collected by the task force.
Table 37: ASTM Standards for Diesel and Biodiesel Fuels
ASTM Standard Number ASTM Standard Title Biodiesel fuel blends
ASTM D975-10c Standard Specification for Diesel Fuel Oils Diesel and Diesel fuel containing up to 5 volume percent biodiesel (B5)
ASTM D7467-10 Standard Specification for Diesel Fuel Oil, Biodiesel Blend (B6 to B20).”
6 to 20 volume percent biodiesel ( B6 to B20)
ASTM D6751-12 Standard Specification for Biodiesel Fuel Blend
Stock (B100) for Middle Distillate Fuels B100 (neat)
1.2 Production and Testing of Biodiesel Fuels
The most widely used feedstock for biodiesel in the United States is soybean oil, which accounts
for over two‐thirds of the current domestic production.68 Biodiesel is also produced
domestically from waste cooking oil (WCO), called yellow grease in the rendering industry.
Other feedstocks include plant sources such as safflower, canola, and palm oils. Tallow
(rendered animal fat) is still being developed as a feedstock and is currently used on a much
smaller scale. The growing demand for biodiesel has stimulated research on potential new
feedstocks, including camelina, yellow mustard, jatropha, algae, and fungi.69 These new
feedstocks are not yet commercially significant in the United States.
The terms used cooking oil (UCO) and waste vegetable oil (WVO) are synonymous with WCO.
The ARB uses the term UCO in its low carbon fuel regulations. These interchangeable terms
refer to oil used in food preparation (most often frying) by restaurants, hotels, and other
businesses. This oil must be replaced frequently to maintain acceptable food quality. WCO is
classified as hazardous waste; its transport and disposal are subject to regulation. Typically, a
recycler will acquire WCO under contract and sell it in bulk to biodiesel producers. Therefore,
68 U.S. Energy Information Administration www.eia.gov/biofuels/biodiesel/production/table3.pdf
accessed June 4, 2013
69 Sergeeva, Y.E.; Galanina, L. A.; Andrianova, D. A.; Feofilova, E. P. (2008). “Lipids of filamentous fungi
as a material for producing biodiesel fuel.” Applied Biochemistry and Microbiology 44 (5): 523. abstract
doi: 10.1134/S0003683808050128 dx.doi.org/10.1134%2FS0003683808050128 Accessed June 4, 2013.

135
WCO can contain a variety of used oils from multiple suppliers, and differ in composition from
batch to batch.
The fats and oils in raw biodiesel feedstocks consist mostly of mixtures of various triglycerides.
A triglyceride molecule contains three long chain carboxylic acids, known as fatty acids because
they are found in fats and oils. These fatty acids are connected by ester bonds to the hydroxyl (–
OH) groups of a glycerin molecule. Fatty acids are classified base on the number of carbons and
carbon‐carbon double bonds in the molecule. The number of double bond is referred to as the
degree of unsaturation. A fatty acid with no double bond in saturated; with one double bond is
monounsaturated and with two or more is polyunsaturated. The common fatty acids found in
the fats and oils that compose the biodiesel feedstocks have 14 to 22 carbons atoms and may
contain up to three double bonds. The structure of a typical monounsaturated fatty acid, oleic
acid (chemical formula C18H34O2), is shown in Figure 41, along with a generic triglyceride
structure.
Figure 41: Fatty Acid and Triglyceride Structures
Oleic acid is the most common monounsaturated acid found in biodiesel feedstocks. Canola oil
and soy oil contain roughly 62% and 24% oleic acid by weight, respectively. Animal fats such as

136
beef tallow and lard contain about 40 % by weight oleic acid.70 71The unsaturated fatty acid
content of a feedstock determines various properties of its finished blendstock, including
volatility and low temperature behavior.
While the oils in a raw feedstock will burn in a compression ignition engine, they are much too
viscous for acceptable injector and engine performance. To reduce the viscosity, the
triglycerides in a feedstock are converted to a mixture of fatty‐acid esters by a transesterification
reaction. In this reaction, shown in Figure 42, the fatty acid groups are first cleaved from the
glycerin molecule in the presence of a catalyst (usually a strong base such as KOH). The free
fatty acid groups then react with a short chain alcohol. This reversible reaction is driven
towards completion by the use of excess quantities of the alcohol. Methanol is the most common
alcohol used for commercial biodiesel production, yielding a mixture of fatty acid methyl esters,
or FAME. To isolate and purify the desired biodiesel FAME, the excess alcohol and catalyst are
removed, along with the glycerin byproduct.
Figure 42: Transesterification of a Triglyceride with Methanol
Glycerin is used primarily in the personal care products and pharmaceutical industries. In the
early days of biodiesel development, the byproduct glycerin therefore had commercial value
that helped to support biodiesel manufacturers. The rapid expansion of the biodiesel industry
has led to a glut of glycerin on the world market, reducing its value. New uses for glycerin are
being sought to absorb this excess, including its use as an engine coolant.72 Alkyl glyceride
70 Gregg, Forest, companion site for SVO: Powering Your Vehicle with Straight Vegetable Oil ,New Society
Publishers, 2008. bunkum.us/svo/fatty_acid.html. accessed 7/3/13.
71 National Renewable Energy Laboratory, “ Biodiesel Analytical Methods August 2002–January 2004”,
2009, National Biodiesel Board < http://www.nrel.gov/docs/fy04osti/36240.pdf> accessed on January 31,
2014.
72 Hudgens, R., Hercamp, R., Francis, J., Nyman, D. et al., ʺAn Evaluation of Glycerin (Glycerol) as a
Heavy Duty Engine Antifreeze/Coolant Base,ʺ SAE Technical Paper 2007‐01‐4000, 2007, doi:10.4271/2007‐
01‐4000. http://papers.sae.org/2007‐01‐4000/
R may be any straight chain fatty acid

137
ethers have shown promise as oxygenated diesel fuel additives.73 Such additives may improve
combustion and low‐temperature performance of diesel and biodiesel fuel while improving the
economics of biodiesel production.
Biodiesel is a more homogeneous mixture than petroleum diesel fuel. Its esters consist of long
chains of carbon atoms (CH3(CH2)nCO2CH3) with varying degrees of unsaturation (the number
of carbon‐carbon double bonds along the chain). Most of the chains contain 16 to 18 carbon
atoms. Minor amounts of 14‐ and 20‐carbon chains occur in some feedstocks. These fatty acid
structures can be represented as XX:Y where XX is the number of carbon atoms and Y is the
number of double bonds. The distribution of these chains is determined by the particular
feedstock(s) used. Biodiesel from vegetable oil feedstocks consists mainly of esters of 18:1 (oleic
acid) and 18:2 (linoleic acid), with lower amounts of saturated 16:0 (palmitic acid) and 18:0
(stearic acid) chains. Canola oil also contains roughly 10 weight percent 18:3 (α‐linolenic acid)
methyl ester. Biodiesel from animal fats, including yellow grease, has relatively higher amounts
(roughly 40 weight percent) of the 16:0 and 18:0 saturated esters, along with a small amount of
the 14:0 (myristic acid ester).74
Because the structures of these fatty acid esters are so similar, their physical and chemical
properties are also similar. While the feedstock used determines the specific composition of a
given biodiesel, this does not significantly affect its combustion characteristics.75 Therefore,
ASTM specifications for finished biodiesel and biodiesel blends listed in Table 37 do not
differentiate among feedstocks. Some fuel parameters such as kinematic viscosity do vary
according to the FAME mixture of the fuel. Modeling of biodiesel parameters based on the
specific esters present is an active area of research.76 77
In contrast to the mixture of FAME in biodiesel, petroleum diesel is a complex mixture of many
different hydrocarbons with chain lengths of 11to 20 carbon atoms. Up to 90% of a typical
73 Beatrice, Carlo et al, “Technologies for energetic exploitation of biodiesel chain derived glycerol: Oxy‐
fuels production by catalytic conversion,” in Applied Energy 102, 63‐71 February 2013. Abstract on‐line at
sciencedirect.com/science/article/pii/S0306261912005752. accessed 7‐5‐13.
74 Gregg, Forest, companion site for SVO: Powering Your Vehicle with Straight Vegetable Oil ,New Society
Publishers, 2008. bunkum.us/svo/fatty_acid.html. accessed 7/3/13.
75 Gregg, Forest, companion site for SVO: Powering Your Vehicle with Straight Vegetable Oil ,New Society
Publishers, 2008. http://www.bunkum.us/svo/fuel_property.html. accessed 7/3/13.
76 Knothe, Gerhard “Improving biodiesel fuel properties by modifying fatty ester composition,” Energy Environ.
Sci., 2, 759‐766 2009. Abstract accessed at
http://pubs.rsc.org/en/content/articlelanding/2009/ee/b903941d/unauth. accessed 7/5/13.
77 Giakoumis, Evangelos G. “A statistical investigation of biodiesel physical and chemical properties, and
their correlation with the degree of unsaturation,” Renewable Energy 58, 858‐878, 2013. Abstract accessed at
http://www.sciencedirect.com/science/article/pii/S0960148112004752 7/5/13.

138
petroleum diesel is fully saturated, with the balance almost entirely aromatics.78 Reflecting their
structural differences, biodiesel and petroleum diesel vary significantly in their physical and
chemical properties. While they are completely miscible under typical ambient conditions, the
properties of a specific blend cannot be easily predicted. Blends up to B20 are in common use
around the world, and are well studied. Investigations of the properties of higher concentration
blends are ongoing.
1.3 Use of Biodiesel Fuel in Diesel-Powered Vehicles
Automobile and diesel engine manufacturers (OEM) support the expanded use of biodiesel
fuels, an essential part of California programs to improve air quality and reduce petroleum
dependence. To provide a warranty for their vehicles and engines, these OEMs must consider
the effects of biodiesel on engine performance and maintenance. For example, early adopters of
biodiesel found that its solvating properties dissolved some elastomeric materials used in seals.
This problem was easily solved by switching to a different material.
On the other hand, biodiesel fuel has superior lubricating properties compared to petroleum
diesel. B2 biodiesel provides enough lubricity to compensate for the low levels of sulfur
mandated by California’s ultra‐low sulfur fuel requirements. Biodiesel also has an inherently
high cetane number.
Automobiles and trucks are not the only diesel‐powered vehicles converting to biodiesel fuel
blends. Other on‐ and off‐road engines, along with stationary power generator engines, are also
operating with blends up to B20. School and public buses, farming and mining equipment, bus
fleets, marine vessels, stationary generators, and the military are all now successfully using
some blend of biodiesel fuel. Data from the National Biodiesel Board (NBB) show that these
conversions were accomplished with no noticeable reduction in either engine or vehicle
performance.79 A 2006 French study for the European Biodiesel Board followed twenty‐four
heavy and light duty vehicles running on rapeseed (canola) B50 over a twelve‐year period from
1993 to 2005. No adverse effects on engine performance or maintenance were noted compared
to reference vehicles using commercial petroleum diesel fuel.80
78 Agency for Toxic Substances and Disease Registry, U.S. Department of Health and Human Services,
www.atsdr.cdc.gov/toxprofiles/tp75‐c3.pdf. accessed 7/16/13.
79 National Biodiesel Board, “Biodiesel and the U.S. Diesel Vehicle Market,” 2012,
<http://www.biodiesel.org/docs/ffs‐engine_manufacturers/2012‐diesel‐vehicle‐list.pdf> accessed on May
1, 2012.
80 P. Gateau Twelve years of using 50% RME fuel mixture in heavy trucks and light vehicles LOiRE2iS,
http://www.ebb‐u.org/studiesreports/AEA2006_GATEAU%2050%25%2012%20years%20FRANCE.pdf
accessed 6/25/13

139
Table 38 lists manufacturers currently supporting the use of B5, B20, or B100 in their engines,
using the latest information available from the NBB.81 This list is continually expanding, and
additional manufacturers or models may have been added since the date of this report. The
warranties of most manufacturers require that:
all biodiesel blend stocks meet the specifications of ASTM D675.
all finished blends meet D975 requirements.
all biodiesel blend stocks are sourced from a BQ‐9000 Accredited Producer.
1.4 Specifications for Biodiesel Fuels
ASTM publishes standard specifications and test methods for many petroleum products and
middle distillate fuels such as motor oils, gasoline, and diesel fuels. Table 37 lists the ASTM
specifications for diesel and biodiesel fuels. The ASTM standards in Table 35 lists test methods
to be used to demonstrate compliance with the standard specifications. These tests are
published separately by ASTM. ASTM standards are regularly revised and updated. The
number and letter following a standard number show the year and version of the latest release.
ASTM publications are protected by copyright, and may not be reproduced here. They are
available for purchase from the ASTM website at astm.org/Standard/index.shtml.
ASTM test methods recommend that all test results be reported in the metric International
System of Units (SI). Other units may be included in parenthesis but are meant for reference
only. For clarity, only SI units are included in tables throughout this report. The text may
include additional parenthetical units where appropriate.
The Department of Food and Agriculture regulates the sale of transportation fuels in California.
The BPC Division 5, Chapter 14, Section 13450 requires the CDFA to establish and enforce
quality specifications for compression ignition engine fuel in California. Section 13450 requires
the CDFA to adopt standard specifications for diesel fuel published by ASTM International or
another recognized consensus organizations. ASTM International has published standard
specifications for pure (neat) biodiesel blendstock (ASTM D6751), and blends between 6 and 20
volume (ASTM D7467) percent biodiesel with petroleum diesel fuel, along with a suite of
validated test methods for establishing compliance with these standards.
Currently, there are no standard specifications or validated test methods for biodiesel blends
above 20 volume percent. Such specifications and test methods are needed to support
commercialization of higher biodiesel blends in California. When such specifications do not
exist, the CDFA may develop interim specifications. In the absence of standard specifications,
81 National Biodiesel Board. www.biodiesel.org/using‐biodiesel/oem‐information/oem‐statement‐
summary‐chart accessed 7/26/13
140
transportation fuels may be sold on California only with a developmental fuel variance from the
CDFA. This is currently the case for biodiesel blends of higher than 20 volume percent.
The lack of standard specifications and test methods for biodiesel blends greater than B20 is a
barrier to the expanded commercial use of these blends in California. The existing biodiesel
standards listed in Table 37 recognize that additional standards and test methods are needed to
establish the range of blends suitable for a specific engine or application.82
Because biodiesel and petroleum diesel have very different physical and chemical properties,
engine performance and behavior through test methods of higher blends cannot be extrapolated
directly from existing data. The primary goal of this research is to support the development of
standard specifications for blends between B21 and B99 by evaluating current diesel test
methods over this range.
82 Notes in Section 4.3 of ASTM D6751 state that,
“NOTE 2— A considerable amount of experience exists in the U.S. with a 20 % blend of biodiesel,
primarily produced from soybean oil, with 80 % diesel fuel (B20). Experience with biodiesel
produced from animal fat and other oils is similar. Experience with B20 and lower blends in other
applications is not as prevalent. Although biodiesel (B100) can be used, blends of over 20 %
biodiesel with diesel fuel (B20) should be evaluated on a case by case basis until further
experience is available.
NOTE 3—The user should consult the equipment manufacturer or owner’s manual regarding the
suitability of using biodiesel or biodiesel blends in a particular engine or application.”

141
Table 38: Vehicle Manufacturers Approving Biodiesel by Blend Concentration
OEMs Supporting B100 OEMs Supporting B20 OEMs Supporting B5
Case IH (selected models)
Deutz AG
Fairbanks Morse
New Holland
Arctic Cat
BlueBird (buses, selected models)
Buhler
Case Construction Equipment
(selected models)
Case IH (selected models)
Caterpillar (Tier 4 Interim/Stage IIIb
and later engines)
Chrysler (in Dodge Ram for fleets)
Cummins
Daimler Trucks, including:
∙ Detroit Diesel (by request)
∙ Freightliner (Cummins engines)
∙ Freightliner (selected Detroit
Diesel engines by request)
∙ Freightliner (Custom Chassis
Corporation)
∙ Thomas Built Buses (2010 and
later models)
∙ Western Star (selected models)
Ferris
Ford (2011 and later models)
General Motors (2011 and later
models)
HDT USA Motorcycles
Hino Trucks (2011 and later models)
International / Navistar (conditional)
Isuzu Commercial Trucks (2011 and
later models)
John Deere
Kubota
Mack Trucks
Perkins (selected models)
Tomcar
Toro
Volvo Trucks
Yanmar
Audi
BMW
Case Construction Equipment
(selected models)
Case IH (all models)
Chrysler (all other)
Daimler Trucks, including:
∙ Detroit Diesel
∙ Freightliner (Detroit Diesel
engines)
∙ Western Star (all)
Ford (2010 and earlier models)
General Motors (2010 and
earlier models)
Hino Trucks (2010 and earlier
models)
International / Navistar
(unconditional)
Isuzu Commercial Trucks
Mazda
Mercedes Benz
Mitsubishi
PACCAR, including:
∙ Kenworth
∙ Peterbilt
Perkins (all models)
UD Trucks
Volkswagen
Source: National Biodiesel Board (table last updated 7/26/13)

142
CHAPTER 2: Objectives, Experimental Design and Results
The California Energy Commission and the Air Resources Board have established programs to
reduce greenhouse gas and toxic emissions as well as petroleum dependence in the
transportation sector. Expanded use of biodiesel fuel can make a significant contribution to
these objectives. As explained in Chapter 1, CDFA must adopt enforceable fuel quality
specifications before transportation fuels can be sold in California. To be legally enforceable,
such specifications must be accompanied by validated test methods to demonstrate the
compliance of a sample.
As discussed above, biodiesel fuel quality specifications have been published only for B100, and
blends of B20 and lower. Increasing interest in biodiesel blends greater than B20 from
governmental, industry and environmental groups requires research to support standard
specifications for these fuels. The primary objective of this project is to evaluate the applicability
of current ASTM test methods to biodiesel blends between B20 and B100. Since the physical and
chemical properties of biodiesel and petroleum diesel are quite different, some of these methods
may not be applicable to high concentration blends. The identification of these gaps in biodiesel
test methods will be a basis for future work to develop test methods to support an expansion of
biodiesel sale in California. Currently, there is limited interest within the National Biodiesel
Board (NBB) and engine and vehicle manufacturers for the development of specifications for
high blend levels. The industry is focused on increasing the use of biodiesel blends up to B20,
which may generally be accomplished without extensive engine design modifications.
However, California’s Low Carbon Fuel Standard may create new opportunities for the sale of
higher biodiesel blends, requiring that specifications and regulations be in place.
2.1 Project Objectives
The contract between the Energy Commission and DMS included seven tasks for this research
project:
Develop and perform test methods to provide to federal organizations to assist with
the development of national standards for biodiesel blends greater than 20 percent
by volume.
Compare the applicability of atmospheric and reduced pressure distillation
techniques for high concentration biodiesel blends. Determine the optimal test
conditions and concentration levels for each technique at various blend levels.
Investigate the appropriateness of current cold temperature flow test methods for
higher concentration biodiesel blends and determine the correlation between those
methods. Determine which technique provides the best precision at various blend
levels.

143
Investigate the techniques for measuring free fatty acid and glycerin concentrations
at higher concentrations. Determine which technique (i.e., Infrared spectroscopy and
gas chromatography) is most appropriate and provides the best precision at various
concentration levels.
Investigate contaminant level effects on properties of fuel quality (distillation,
viscosity, flash point, and cetane).
Present CDFA findings to ASTM International to further their standards
development work and/or submit as an SAE International research paper.
The evaluation of the Cetane levels was not pursued because the apparatus for measuring the
cetane number was found to be prohibitively expensive. It was therefore not purchased.
2.2 Project Design
2.2.1 Acquisition of Biodiesel Blend Stock
For this study, B100 from three feedstocks representative of current domestic production was
chosen to prepare blends for investigation. These blend stocks were soy oil, a mixture of
safflower and canola oil, and WCO. The composition of WCO is more variable than other
feedstocks because it is a mixture from many sources. To investigate possible differences in
biodiesel blends from different WCO blend stocks, WCO from two different producers was
included in this project. A small amount of each of the four raw feedstocks was also purchased
to retain as a reference. Table 39 shows suppliers and amounts of the B100 and feedstocks
purchased, along with the internal IDs assigned for this study. Copies of the certificates of
Analysis provided with the B100 blend stocks are included in Appendix I.
American Biodiesel Inc. has operated its Community Fuels (www.communityfuels.com)
refinery at the Port of Stockton, California since 2008. This plant has a capacity of 13 million
gallons/year. It received BQ 9000 Producer certification in May 2012, and in March 2013 was the
first producer in the country to receive BQ 9000 Laboratory certification from the National
Biodiesel Accreditation Commission. Community Biofuels is a bulk supplier of biodiesel to the
petroleum industry. New Leaf Biofuel (newleafbiofuel.com) is a San Diego‐based producer
collecting waste cooking oil from over a thousand local restaurants and businesses in southern
California. Founded in 2006, New Leaf has a capacity of six million gallons/year. It operates its
fleet of trucks on its B100 product. Both Community Fuels and New Leaf Biofuel receive
funding from the Energy Commission.
Imperial Western Products (www.imperialwesternproducts.com) is a diversified corporation
that was founded in Coachella, California in 1966. Its Biotane Fuels Division was established in
2001, and today has a biodiesel production capacity of 12 million gallons/year. Since 2006, the
Biotane Pumping Division has collected waste cooking oil from restaurants from San Diego to
Fresno.

144
Table 39: Sources of B100 Biodiesel and Feedstocks Used
Refinery Feedstock DMS ID
Assigned Amount raw
feedstock Amount Neat
B100
American Biodiesel Inc.(Community Fuels)
Soy oil S-871B 1 liter 20 liters
American Biodiesel Inc.(Community Fuels)
Safflower/canola oil mixture
S-870 A/B 1 liter 20 liters
New Leaf Biofuel WCO – Yellow Grease A-66 2 liters 20 liters
Imperial Western Products
WCO – Yellow Grease A-67 2 liters 20 liters
Analysis of the biodiesel blend stocks for fatty acid compositions was not performed as part of
this project. However, earlier studies have shown that waste cooking oils are derived largely
from animal fats, and so are mostly saturated triglycerides, with the balance mostly
monounsaturated. Soybean oil contains roughly 60% polyunsaturated triglycerides with
significant amounts of saturated and monounsaturated triglycerides making up the balance.
Canola oil has roughly two‐thirds monounsaturated triglycerides, and one‐quarter
polyunsaturated triglycerides, with the balance saturated. The composition of safflower oil
varies with the variety of seed used, and may be either three‐quarters monounsaturated or
polyunsaturated. The specific composition of the safflower oil used in S870‐A/B and the
percentage of safflower in the blend are not known.
2.2.2 Acquisition of Petroleum-based Diesel
DMS staff purchased fifty‐five gallons of No. 2 Diesel fuel from G&M Chevron in Placentia, CA
for use throughout this study. This diesel batch was logged in as Sample #70 (2010/2011 Fiscal
Year). It was tested at the CDFA Anaheim Petroleum Laboratory for conformity to ASTM
standard specifications of distillation temperatures (ASTM D86) and flash point (ASTM D93).
Sample #70 was also tested for any trace of biodiesel using FTIR. The diesel fuel met ASTM
standard specifications, and contained no biodiesel. A copy of the Anaheim Lab test report is
included in Appendix I.
Use of a single lot of petroleum diesel eliminated the possibility that variability of different
petroleum‐diesel fuels might affect the results for this study. It is unlikely that minor differences
in a compliant No. 2 diesel fuel would affect the specifications or performance of a biodiesel
blend; however, that slight possibility cannot be excluded based on the work reported here.

145
2.3 Preparation of Biodiesel Blends
Nine test samples were prepared from each of the four B100 stocks. Using volumetric pipettes,
diesel fuel from Sample #70 was used to prepare the following series covering the concentration
range from B20 to B100: B20, B25, B30, B40, B50, B60, B70, B80, B90, and B100.
For convenience, the safflower/canola oil blend stock will be referred to as Saff/Can throughout
this report.
2.4 Test Equipment
New equipment and supplies were needed to meet the specific objectives of the project as
described above. All procurements were made following state and departmental policies and
procedures. Table 40 shows the major instrumentation purchased for this project.
Table 40: Instrumentation Purchased
ASTM Test Manufacturer Model
D2500-09 Cloud Point and D6371-05 Cold Filter Plugging Point
Lawler DR4-14L
D4539-10 Low-Temperature Flow Lawler DR4-14L
D86-10a Atmospheric Pressure Distillation
PAC OptiDist™ Analyzer
D1160-06 Reduced Pressure Distillation
PAC HDV 632
D6584-10a Free and Total Glycerin
Brucker 450 GC
D7371‐07 Biodiesel by FTIR Nicolet iS10 FTIR
D7345-08 Microdistillation PAC PMD 110
Tracking of biodiesel testing at both DMS laboratory locations (Sacramento and Anaheim) is
included in the STARLIMS® laboratory information management system described in Volume
1 of this report.

146
2.5 ASTM Test Methods Evaluated for This Project
The primary objective of this project was to evaluate the applicability of existing ASTM diesel
test methods to biodiesel blends across the concentration range from B20 to B100. Table 41
shows the tests that were investigated in this study. (Note – Table 41 is the same as Table 35
found in the Volume 3 Summary. The table is reproduced here for convenience.)
Tests for total acid number (unreacted fatty acids), sulfur, and cetane were not included in this
study. The petroleum diesel and B100 stocks used to prepare the blends met all the
specifications of ASTM D975‐10c and ASTM D6751‐12, respectively. Therefore, any blends of
these would also meet the specifications since the blending process could only dilute any free
acid or sulfur impurities present. As discussed above in Chapter 1, all FAME mixtures have a
higher cetane value than petroleum diesel. So all biodiesel blends made with a compliant No. 2
diesel will necessarily exceed the minimum cetane value.
Following ASTM guidelines, all testing is reported in SI units. Instruments used to collect data
for this research were configured to report in SI units. Other units may be included in
parenthesis throughout this report, but are meant for reference only. For sake of clarity and
simplicity, only the SI °C is included in the tables and figures in this report.
All ASTM standards and test methods are subject to copyright, and cannot be reproduced in
this report. The standards and methods referenced here can be purchased from the ASTM
website at www.astm.org/Standard/index.shtml.
Table 41: ASTM Test Methods Evaluated in This Study
ASTM Test Method ASTM
Method Number
ASTM Method Title
Cloud Point D5773-10, D2500-09
Standard Test Method for Cloud Point of Petroleum Products
Low-Temperature Flow Test (LTFT) D4539-10 Standard Test Method for Filterability of Diesel
Fuels by Low-Temperature Flow Test
Cold Filter Plugging Point (CFPP) D6371-05 Standard Test Method for Cold Filter Plugging
Point of Diesel and Heating Fuels
Flash Point D93-10a Standard Test Method for Flash Point by Pensky-Martens Closed Cup Tester, Procedures A or C
Atmospheric Pressure Distillation D86-10a Standard Test Method for Distillation of
Petroleum Products At Atmospheric Pressure
Reduced Pressure Distillation D1160-06 Standard Test Method for Distillation of
Petroleum Products At Reduced Pressure

147
ASTM Test Method ASTM
Method Number
ASTM Method Title
Fourier Transform Infrared Spectroscopy D7371-07
Standard Test Method for Determination of Biodiesel (Fatty Acid Methyl Esters) Content in Diesel Fuel Oil Using Mid Infrared Spectroscopy (FTIR-ATR-PLS Method)
Free and Total Glycerin D6584-10a
Standard Test Method for Determination of Total Monoglyceride, Total Diglyceride, Total Triglyceride, and Free and Total Glycerin in B-100 Biodiesel Methyl Esters by Gas Chromatography
Kinematic Viscosity D445-10 Standard Test Method for Kinematic Viscosity of Transparent and Opaque Liquids (and Calculation of Dynamic Viscosity)
Water and Sediment Contamination D2709-96 Standard Test Method for Water and Sediment in
Middle Distillate Fuels by Centrifuge
Most determinations were made in duplicate, and both results are included in the tabulated
data for the individual tests discussed below. Exceptions will be noted in the discussion for each
test below.
2.5.1 Cloud Point - ASTM D5773-10 and D2500-09
2.5.1.1 Overview
The cloud point of a diesel fuel is one indicator of its low temperature performance. The cloud
point is the temperature at which biodiesel methyl esters first begin to precipitate from solution
as the fuel cools. These esters appear as a waxy material, giving the fuel a cloudy appearance.
The small particles may plug filters, or sink in a storage tank, changing the liquid fuel’s
biocontent. The cloud point is a ‘report‐as‐tested’83 property for both petroleum diesel and
biodiesel fuels. An optional method for determining the cloud point of a sample visually was
also tested and found to be applicable to all blend stocks over the complete blend range.
2.5.1.2 Method Summary
The four blend stocks were tested over the range of B20 to B100 according to ASTM D5773‐10
Standard Test Method for Cloud Point of Petroleum Products (Constant Cooling Rate Method) and
D2500‐09, Standard Test Method for Cloud Point of Petroleum Products (Cloud Point). D5773 is an
automated method, while D2500 is a manual method. D2500 is the reference method for cloud
83 For certain fuel quality parameters such as cloud point, ASTM standards do not give a pass/fail value
or range. Instead, the value found in testing is reported for use by processors, sellers, and purchasers.

148
point determination. The instrument used was a Model DR4‐14L from the Lawler
Manufacturing Corporation. This instrument cools a fuel sample in a series of air baths and
measures light absorbance readings at each degree Celsius as the fuel is cooled. At the cloud
point, the instrument detects the formation of waxy crystals by detecting a change in light
absorbance readings between two sequential measurements. The cloud point is reported as the
temperature at which this occurs. As a reference, the No. 2 Diesel was also tested and found to
have a cloud point temperature of ‐16°C (3.2°F).
To evaluate the alternative non‐instrumental Cloud Point method ASTM D2500, visual
observations were made as the sample was chilled in the apparatus to detect the appearance of
a cloudy haze in the sample. Using this manual method, each feedstock blend was observed to
form an evenly distributed cloudy haze of wax crystals near the bottom of the test tube as the
cloud point temperature was reached.
2.5.2 Low-Temperature Flow Test - ASTM D4539-10
2.5.2.1 Overview
The low‐temperature flow test, ASTM D4539‐10, “Standard Test Method for Filterability of Diesel
Fuels by Low‐Temperature Flow Test (LTFT), is used to estimate the filterability of a fuel in diesel
equipment. It is an indicator of cold weather performance, especially for heavy‐duty
equipment. This test determines the lowest temperature at which a fuel sample will pass
through a filter under vacuum at specified conditions.
2.5.2.2 Method Summary
The instrument used was a Model 265‐12L liquid‐bath cooling unit from the Lawler
Manufacturing Corporation. Method D4539‐10 determines the lowest temperature at which a
200 mL fuel sample passes through a 17 μm stainless steel filter within 60 seconds, under a
constant reduced pressure. Measurements were made automatically at intervals of 1°C,
beginning at a temperature determined by the cloud point of the fuel sample. When the fuel no
longer filtered within 60 seconds, the trial was recorded as a “Failed” test. Data for each trial
was recorded until two consecutive “Failed” tests were observed. The temperature of the last
successful test was then reported as the “Minimum LTFT Pass Temperature.”
The LTFT was the last test to be run because of the large quantity of sample required by D4539‐
10. The initial supply of all B100 blend stocks was consumed by other testing. Additional stocks
were purchased to conduct the LTFT on blends of stocks comparable to A‐67 (Yellow Grease)
and S‐871 (Soy). A replenishment stock for A‐67 (Yellow Grease), assigned sample ID A‐67E,
was purchased from Imperial Western. A replenishment stock for S‐871 (Soy), assigned sample
ID S‐871B, was purchased from Community Fuels. A‐67E and S‐871B were refined in the same
way as the corresponding original B100 stocks, but were from different batch lots. Replacement
B100 stock for Yellow Grease A‐66 could not be obtained from New Leaf Biofuel. The Saff/Can
blend stock S‐870 A/B was a proprietary blend of biodiesel no longer produced by Community
Fuels after the initial supply was exhausted. Therefore, blends of these two stocks could not be
tested by the LTFT.

149
Because of the limited amount of blend stock available, only four blend levels were run for
blend stocks of Yellow Grease A‐67E and Soy S‐871B: B20, B50, B80, and B100.
2.5.3 Cold Filter Plugging Point – ASTM D6371-05
2.5.3.1 Overview
The cold filter plugging point (CFPP) is another indicator of cold weather performance. This test
determines the lowest temperature at which a specified volume of fuel will pass through a filter
under specified conditions. The CFPP test cools the sample rapidly, in contrast to the LFTF.
2.5.3.2 Method Summary
The four blend stock blends were tested over the range B20 to B100 according to ASTM D6371‐
05, Standard Test Method for Cold Filter Plugging Point of Diesel and Heating Fuels (CFPP). The
instrument used was a Model DR4‐14L, from Lawler Manufacturing Corporation. The CFPP
test determines the lowest temperature at which a blend passes through a 45 μm stainless steel
wire mesh gauze filter within 60 seconds, under a constant reduced pressure. Testing begins at
least 5°C above the cloud point of the sample, and the instrument decreases the temperature
1°C for each subsequent trial until the fuel no longer passes the test. The coldest temperature at
which the fuel samples did pass through the filter was returned by the instrument as the CFPP
temperature.
As a point of reference, the CFPP temperature for the No. 2 Diesel used for blending was
determined to be ‐16°C (3.2°F) using ASTM D6371‐05.
2.5.4 Flash Point - ASTM D93-10a
2.5.4.1 Overview
The flash point of a fuel is the lowest temperature at which there is a sufficient quantity of
vapor formed to ignite under specified conditions. The flash point is an indication of the
flammability hazard posed by a liquid fuel. ASTM Methods D975‐10c and D6751‐12 set
minimum flash point specifications of 52°C (126°F) and 93.0°C (199°F) for No. 2 diesel and
biodiesel, respectively. In general, the FAMEs in biodiesel are significantly less volatile than the
hydrocarbons in petroleum diesel.
2.5.4.2 Method Summary
Each series of blends was tested using ASTM D93‐10a, “Standard Test Method for Flash Point
by Pensky‐Martens Closed Cup Tester,” Procedures A or C (Flash Point). Procedure A was
written for middle distillate fuels, lubricating oils, and other homogeneous petroleum products,
while Procedure C was written specifically for B100 biodiesel fuel. The instrument used was the
Herzog MP‐330 Automatic Flash Point Analyzer.

150
2.5.5 Automatic Atmospheric Distillation – ASTM D86-10a
2.5.5.1 Overview
Petroleum products are mixtures of large numbers of different hydrocarbon compounds. These
mixtures are characterized by the boiling point range of their constituents as measured by a
batch distillation test, ASTM D86‐10a.
The Automatic Atmospheric Distillation Test requires a means of measuring the volume percent
of a sample recovered with increasing temperature as the distillation proceeds. ASTM D86‐10a
defines the parameter T90 as the maximum vapor temperature at 90 volume percent of sample
recovered. For a B20 biodiesel blend, ASTM D7467 specifies a maximum T90 of 343°C (649.4°F).
The complete blend range for all four blend stocks was tested to evaluate the suitability of the
atmospheric distillation test for biodiesel blends. As discussed below, the test failed for all
blends of B30 and higher.
2.5.5.2 Method Summary
All blends in each series were tested for atmospheric distillation temperatures using ASTM
D86‐10a, “Standard Test Method for Distillation of Petroleum Products at Atmospheric
Pressure.” The instrument used for this test was a Herzog OptiDist™ automatic atmospheric
distillation unit from PAC, International. The instrument heats a fuel sample at a specified rate
until its constituents have fully vaporized. The vapors are condensed in a condensation tube
and collected in a receiving cylinder from which the volume percent recovered can be
determined. Distillation temperatures are reported at the intervals specified by method D86‐10a.
2.5.6 Automatic Reduced Pressure Distillation ASTM D1160-06
2.5.6.1 Overview
The FAME making up a neat biodiesel blend stock are significantly less volatile than the major
fraction of the components of a conventional diesel fuel. In addition, these esters undergo
thermal degradation before they can be distilled at atmospheric pressure. Therefore, a reduced
pressure distillation method is used so that B100 samples will distill cleanly without excessive
charring. As in the atmospheric distillation test method D86‐10a described in section 2.5.5, the
temperature at which 90 volume percent of the sample is recovered is measured. This
temperature is converted to the atmospheric equivalent temperature at 90% recovery (AET90)
using a formula given in D1160‐06. The B100 specification D6751‐08 sets a maximum AET90 of
360°C (680.0°F) using the reduced pressure distillation test method.
2.5.6.2 Method Summary
All blends in each series were tested for reduced pressure distillation AET90 using ASTM D1160‐
06, “Standard Test Method for Distillation of Petroleum Products at Reduced Pressure.” The
instrument used was a Herzog HDV 632 automatic reduced pressure distillation unit from PAC
International. The reduced pressure distillation is similar to the atmospheric distillation but
with a constant vacuum applied to the sample in a sealed system to reduce the pressure. The

151
working pressures for the test method ranged from 0.13 kPa to 6.7 kPa (1 mmHg to 50 mmHg).
The instrument software converts temperature readings from the reduced pressure distillation
into atmospheric equivalent temperatures (AET) using the equation published in ASTM D1160‐
06.
2.5.7 Biodiesel Content in Diesel Fuel by Mid Infrared Spectroscopy (FTIR) – ASTM D7371-07
2.5.7.1 Overview
The molecular structure of the FAME in biodiesel differs from that of the hydrocarbon
constituents of conventional diesel fuel. This difference is reflected in the mid‐ infrared (IR)
absorption spectra of biodiesel blends. The frequencies in the mid‐IR region, 4000 through 650
cm‐1, correspond to the vibrations of molecular bonds. When the frequency of the radiation
matches the frequency of a particular chemical bond, it is absorbed by the molecule, reducing
the amount of energy reaching the detector. Measured over a range of wavelengths, this
generates the characteristic IR absorption spectrum of the molecule, which serves as a molecular
fingerprint for organic compounds. The ester linkage of the FAMEs in biodiesel, with its two
oxygen atoms, gives rise to absorption bands that are not seen in the spectra of the
hydrocarbons found in conventional diesel. By calibrating against a set of standard mixes of
known biodiesel content, the percent biodiesel in an unknown mix can be calculated based on
the relative intensity of the absorption peaks corresponding to the oxygen‐containing bonds.
In conventional absorption spectroscopy, the wavelength of light is tuned across the spectral
region of interest by a filter or diffraction grating. In an FTIR spectrometer, all wavelengths are
incident at once on the sample in a modulated beam that is then seen by the detector. A
mathematical operation, the Fourier Transform, is used to recover the absorption spectrum
from the detector signal.
2.5.7.2 Method Summary
All blends in each series were tested for biodiesel content using ASTM D7371‐07, “Standard
Test Method for Determination of Biodiesel (Fatty Acid Methyl Esters) Content in Diesel Fuel
Oil Using Mid Infrared Spectroscopy (FTIR‐ATR‐PLS Method).” This test method has been
validated for concentrations from1to 20 volume percent biodiesel. The method states that the
scope may be expanded to higher concentrations with appropriate modifications of the test
conditions.
The instrument used was a Nicolet iS10 FTIR spectrometer from Thermo Scientific using a 60°
Zinc‐Selenide (ZnSe) ATR (attenuated total reflectance) flow cell. A sample is introduced into
the ATR cell and an infrared beam is focused on the entrance of the cell. From the attenuation of
the beam, the instrument calculates the absorbance at each wavelength from 4000 through 650
cm‐1, giving a complete infrared spectrum of the sample fuel.

152
2.5.8 Water and Sediment Contamination – ASTM D2709-96
2.5.8.1 Overview
Excessive amounts of water and sediment in diesel fuel can cause corrosion, fouling and
plugging of fuel‐handling equipment and engines. ASTM D2709 – 96 uses a centrifuge to
separate water and sediment in a fuel sample so that the volume percent of each can be
calculated. Specifications in ASTM D7467 and ASTM D975‐10 for diesel and biodiesel set a
maximum level of 0.05 volume percent of water and sediment.
2.5.8.2 Method Summary
All four neat biodiesel blend stocks were tested for undissolved water and sediment
contamination using ASTM D2709 – 96, “Standard Test Method for Water and Sediment in
Middle Distillate Fuels by Centrifuge.” A Braun Corporation centrifuge was used for testing.
Two centrifuge test tubes readable to 0.005 mL were filled with 100 mL of sample and tested at
a relative centrifugal force of 800 for 10 minutes. Water and sediment were measured and
reported as volume percent of total sample by centrifuge.
2.5.9 Free and Total Glycerin Content – ASTM D6584-10a
2.5.9.1 Overview
ASTM D6584‐10a was written for the determination of glycerides and free and total glycerin in
neat B100 biodiesel fuel using gas chromatography with a flame ionization detector. Glycerin
and glycerides are contaminants in finished biodiesel. Excessive levels may indicate production
problems such as incomplete esterification or washing, or adulteration of the biodiesel.
Contamination of biodiesel fuel by glycerin, either free or bonded, can cause poor engine
performance because of injector fouling and the formation of deposits in the engine.
2.5.9.2 Method Summary
The four neat biodiesel blend stocks and selected blends were tested for free and total glycerin
in biodiesel fuel using ASTM D6584‐10a. This test method was developed to test neat biodiesel
fuel. Glycerin is a by‐product of biodiesel production and must be removed from the final
FAME product mixture. The maximum values of free and total glycerin allowed in B100 fuel as
published in ASTM D6751‐10 are 0.020 and 0.240 mass percent, respectively. As noted in
Appendix X1.13 of ASTM D7467‐10, “Standard Specification for Diesel Fuel Oil, Biodiesel Blend
(B6 to B20),” there is no specification or test method to measure free and total glycerin in a
finished biodiesel fuel blend. Hydrocarbon constituents of No. 2 Diesel fuel elute from the
column at or about the same time as free glycerin, masking low levels of glycerin.
The instrument used was a Varian 450 GC from Bruker Daltonics, Inc. with a flame ionization
detector (FID). A Restek MXT Biodiesel 15‐meter, 0.32 mm ID column with a 2‐meter, 0.53 mm
ID guard column was used. According to the test method, the range of detection for free
glycerin was 0.005 to 0.05 mass percent and total glycerin was from 0.05 to 0.5 mass percent.

153
2.5.10 Kinematic Viscosity - D445-10
2.5.10.1 Overview
The kinematic viscosity of a fuel is a measure of its resistance to flow under shear stress, and is a
critical parameter for fuel delivery systems and engine efficiency. It also determines how easily
the fuel can be pumped. Diesel with too low a viscosity may leak from various points in the fuel
handling system or cause excessive wear. An excessively high fuel viscosity will reduce engine
performance and may damage the fuel pump or filter.84
The kinematic viscosity of a given fuel will vary with temperature. Therefore, the kinematic
viscosity is measured at 40 °C (104 °F), above typical ambient range. ASTM D975‐10c and
D7467‐10 specify a range of kinematic viscosity of 1.9 – 4.1 mm2/s (sometimes stated as
centistokes or cSt) at 40 °C for No. 2 diesel fuel and biodiesel blends up to B20 with No. 2 diesel.
The FAME constituents of biodiesel have intrinsically higher kinematic viscosities than the
corresponding hydrocarbon chains because of stronger intermolecular interactions arising from
the polar ester bonds. The maximum kinematic viscosity for B100 as specified in ASTM D6751‐
10 is 6.0 mm2/s.85
ASTM D975‐10c and D7467‐10 specify a maximum kinematic viscosity of diesel fuel of the 4.1
mm2/s. A high biodiesel content blend might exceed this limit if it is prepared from a high
viscosity B100 fuel. Such a blend must be diluted with enough petroleum diesel to meet the
requirements of D975‐10c and D7467‐10.
2.5.10.2 Method Summary
All blends in each series were tested for kinematic viscosity using ASTM D445‐10, Standard Test
Method for Kinematic Viscosity of Transparent and Opaque Liquids (and Calculation of Dynamic
Viscosity). The instrument used was a calibrated glass capillary viscometer. The sample fuel was
heated to 40°C and drawn by vacuum into the capillary viscometer above the upper timing
mark. The vacuum was removed and time for the sample to flow between the timing marks was
recorded. Two trial times were averaged and multiplied by the calibration constant previously
determined for the capillary viscometer to report kinematic viscosity in mm2/s (cSt).
84 SAE International Standard J313 Diesel Fuels Section 5.6. 2004 Handbook, Warrendale PA. 2004.
85 The specification for B100 kinematic viscosity in Europe currently differs from that in ASTM D6751‐10.
The European Union standard specification EN14214 sets a range of 3.5 – 5.0 mm2/s for the kinematic
viscosity of B100. The higher minimum reflects the physical properties of FAME mixtures. A B100 sample
with a kinematic viscosity significantly lower than 3.5 mm2/s has likely been adulterated with a
petroleum product. See Knothe et al 2005 for data on the kinematic viscosity of biodiesel constituents and
mixtures.

154
CHAPTER 3: Results and Discussion
3.1 Cloud Point - ASTM D5773-10 and D2500-09
3.1.1 Results
For each blend stock, duplicate cloud point determinations were made at each blend level using
the automated ASTM D5773 test method. These results are reported in Table 42 below and are
shown graphically in Figures 43‐46. The applicability of the test method to all four blend stocks
over the complete blend range was established. Visual observations of the samples were also
made during the automated test to evaluate test method D2500‐09. The results from method
D2500 matched the results obtained from the automatic instrumental method within the 2°C
limit of repeatability of ASTM D5773‐10.
Figure 43: Cloud Point vs. % Blend - S-870 Saff/Can
-14
-12
-10
-8
-6
-4
10 20 30 40 50 60 70 80 90 100
Clo
ud
Po
int
°C
Volume Percent Biodiesel
Trial 1
Trial 2

155
Table 42: ASTM D5773-10 Cloud Point Temperature (°C)
The cloud point is correlated with the biodiesel concentration of the blends. The correlation
appears roughly linear, but with some inflection in the graphs between 40 and 50 %. The size of
the inflection was different for the two yellow grease samples, and this may reflect differences
in their composition. The ‐12°C value obtained for S‐871 Soy B20 blend is in reasonable
agreement with the ‐15±1°C result reported by Moser et al for a B20 soy biodiesel blend using a
Phase Technology PSA 70SAnalyzer. The Moser group used an ultralow sulfur diesel with a
measured cloud point of ‐20±1°C. The petroleum diesel used in for this work had a cloud point
of ‐16°C.
There is no evident explanation for the different behavior observed for the two Yellow Grease
blend stocks. The results for blend stock A‐67 may be more typical for WCO blend stocks given
the variety of oils and the number of trace constituents that might be found.
S‐870 A/B
(Saff/Can)
S‐871
(Soy)
A‐66
(Yellow Grease)
A‐67
(Yellow Grease)
Blend Trial 1 Trial 2 Trial 1 Trial 2 Trial 1 Trial 2 Trial 1 Trial 2
B20 -13 -13 -12 -12 -12 -12 -11 -11
B25 -12 -12 -11 -12 -11 -11 -11 -11
B30 -12 -12 -11 -11 -11 -11 -10 -10
B40 -8 -10 -6 -6 -9 -10 -9 -9
B50 -9 -10 -6 -8 -9 -9 -7 -4
B60 -9 -8 -5 -5 -6 -7 -2 -2
B70 -8 -8 -4 -4 -5 -5 -1 -1
B80 -7 -7 -3 -4 -4 -4 -1 -1
B90 -6 -6 -2 -2 -3 -3 0 0
B100 -4 -4 -1 -1 -2 -2 2 1
Note: The cloud point of the diesel fuel used was ‐16°C.

156
Figure 44: Cloud Point vs. % Blend - S-871 Soy
Figure 45: Cloud Point vs. % Blend - A-66 Yellow Grease
-14
-12
-10
-8
-6
-4
-2
0
10 20 30 40 50 60 70 80 90 100
Clo
ud
Po
int
°C
Volume Percent Biodiesel
Trial 1
Trial 2
-13
-11
-9
-7
-5
-3
-1
10 20 30 40 50 60 70 80 90 100
Clo
ud
Po
int
°C
Volume Percent Biodiesel
Trial 1
Trial 2

157
Figure 46: Cloud Point vs. % Blend - A-67 Yellow Grease
3.2 Low-Temperature Flow Test - ASTM D4539-10
3.2.1 Results
This test method was successfully applied to the eight blends tested. Minimum LTFT Pass
Temperatures in degrees Celsius and are reported in Table 43 and Figure 47.
3.2.2 Discussion
For the three blends of A‐67E (Yellow Grease) B100 stock tested, the Minimum LTFT Pass
Temperature was significantly higher than the corresponding cloud point temperatures
determined using the original A‐67 blend stock. This is likely due to minor differences in
composition of these two yellow greases. The presence of sterol glucosides in biodiesel at very
low concentrations has been associated with problems in low temperature performance even
when the specifications of D7436‐10 are met.86 87 Such impurities are a possible explanation for
these unexpected values. Sterol glucosides are found in vegetable oils, not animal fats.
86 Lee, Inmok, Lisa M. Pfalzgraf, George B. Poppe, Erica Powers and Troy Haines, “The Role of Sterol
Glucosides on Filter Plugging”, Biodiesel Magazine, April 6, 2007. Accessed online at
http://biodieselmagazine.com/articles/1566/the‐role‐of‐sterol‐glucosides‐on‐filter‐plugging/ on 7/17/13.
87 Duff Keegan , Jon Van Gerpen, Brian He, National Institute for Advanced Transportation
Technology, University of Idaho, Measurement and Control Strategies for Sterol Glucosides to
-12
-10
-8
-6
-4
-2
0
2
10 20 30 40 50 60 70 80 90 100
Clo
ud
Po
int
°C
Volume Percent Biodiesel
Trial 1
Trial 2

158
Table 43: ASTM D4539-10 Minimum LTFT Pass Temperature (°C)
Blend A-67E (Yellow Grease)
S-871B (Soy)
B20 -1 -12
B50 -2 -8
B80 2 -4
B100 7 -1
Figure 47: LFTP vs. % Blend - A-67E Yellow Grease and Soy S-871B
However, yellow grease mixtures may contain vegetable oils used in food preparation, as well
as other impurities that might lead to problems at low temperatures. Concentrations of sterol
glucosides as low as 50 ppm may cause agglomeration in biodiesels.88 The analysis of glucosides
Improve Biodiesel Quality, Final Report KLK755, January 2010. Accessed on line at
http://www.webpages.uidaho.edu/niatt/research/Final_Reports/KLK755_N10‐02.pdf 7/17/13.
88 Idem. page 2.
-14
-9
-4
1
6
10 20 30 40 50 60 70 80 90 100
LT
FP
Po
int
°C
Volume Percent Biodiesel
(YellowGrease)
(Soy)

159
and related natural products is complex, and well beyond the scope of this project. Future work
in this area should be considered for future work.
The LTFT pass temperature is a report‐as‐tested parameter according to ASTM 4539‐10. The
LTFT temperature of a given biodiesel blend is one predictor of its low temperature
performance.
3.3 Cold Filter Plugging Point – ASTM D6371-05
3.3.1 Results
The CFPP test method D6371‐05 was successfully applied to all blends in each series. Two trials
were made for each blend in each series (n = 20). The data are shown in Table 44 and displayed
graphically Figures 48‐51 below.
For all four blend stocks, the CFPP temperature is correlated with blend concentration.
Replicate determinations for all but one sample agreed to 1°C, well within the stated
repeatability of 1.76 °C of Method 6371‐10. For the 50% blend of Yellow Grease A‐66, the
difference between the replicate determinations was 2°C, equal to the method repeatability
rounded to one decimal place.
Table 44: ASTM D6371-05 CFPP Temperature (°C)
Blend
S‐871 A‐66 A‐67 S‐870 A/B
(Soy) (Yellow Grease) (Yellow Grease) (Saff/Can)
Trial 1 Trial 2 Trial 1 Trial 2 Trial 1 Trial 2 Trial 1 Trial 2
B20 ‐15 ‐15 ‐15 ‐15 ‐14 ‐14 ‐14 ‐14
B25 ‐15 ‐15 ‐15 ‐16 ‐11 ‐12 ‐13 ‐14
B30 ‐15 ‐14 ‐13 ‐13 ‐13 ‐12 ‐14 ‐14
B40 ‐14 ‐13 ‐10 ‐12 ‐12 ‐12 ‐14 ‐15
B50 ‐12 ‐12 ‐12 ‐10 ‐10 ‐11 ‐14 ‐14
B60 ‐12 ‐11 ‐9 ‐8 ‐9 ‐9 ‐14 ‐13
B70 ‐10 ‐9 ‐9 ‐9 ‐7 ‐7 ‐12 ‐12
B80 ‐8 ‐7 ‐7 ‐7 ‐6 ‐5 ‐9 ‐10
B90 ‐6 ‐6 ‐5 ‐6 ‐4 ‐3 ‐8 ‐9
B100 ‐4 ‐4 ‐4 ‐4 ‐1 ‐2 ‐7 ‐7

160
Figure 48: CFPP vs. % Blend - S-871 Soy
The CFPP temperature for the soy and A‐67 yellow grease blends varied roughly linearly with
concentration. The response for the A‐66 yellow grease was more irregular.
The averaged response for the safflower/canola blends showed relatively little change with
concentration between 20 and 60 volume percent. Between 60 and 100 volume percent, the
response was roughly linear.
3.3.2 Discussion
The CFPP temperature is a report‐as‐tested value rather than a standard specification. For
petroleum diesel, the CFPP is a predictor of its filterability at low temperatures, and so is an
indicator of its cold weather performance.
It is common practice in cold weather to blend in a portion of anti‐gelling additive or No. 1
Diesel to decrease the CFPP temperature of a diesel fuel. Testing of the effects of such additives
was beyond the scope of this project; however, the presence of low levels of additives would not
be expected to affect the results significantly.
-16
-14
-12
-10
-8
-6
-4
10 20 30 40 50 60 70 80 90 100
CF
PP
°C
Volume Percent Biodiesel
Trial 1
Trial 2

161
Figure 49: CFPP vs. % Blend - A-66 Yellow Grease
Figure 50: CFPP vs. % Blend - A-67 Yellow Grease
-18
-16
-14
-12
-10
-8
-6
-4
10 20 30 40 50 60 70 80 90 100
CF
PP
°C
Volume Percent Biodiesel
Trial 1
Trial 2
-15
-13
-11
-9
-7
-5
-3
-1
10 20 30 40 50 60 70 80 90 100
CF
PP
°C
Volume Percent Biodiesel
Trial 1
Trial 2

162
Figure 51: CFPP vs. % Blend - S-870 A/B Saff/Can
3.4 Flash Point - ASTM D93-10a
3.4.1 Results
Test method D93‐10a was successfully applied to all blends in each series. Replicate data from
two trials per blend in each series (n = 20) are shown in Table 45 and Figures 52‐55. All blends in
each series were tested using the automated Procedure A. Procedure C was also used to test
B80, B90, and B100 blends. These high biodiesel blends had flash point temperatures that
approached or exceeded 100°C (212°F). There were no significant differences in the flash point
temperatures obtained from Procedures A and C for B80 through B100. Automated Procedure
A of ASTM D93‐10a was adequate to safely test blends lower than B80 since flash point
temperatures did not approach or exceed 100°C (212°F).
-15
-13
-11
-9
-7
-5
10 20 30 40 50 60 70 80 90 100
CF
PP
°C
Volume Percent Biodiesel
Trial 1
Trial 2

163
Table 45: ASTM D93-10a Flash Point Temperature (°C) versus % Biodiesel
S-870 A/B (Saff/Can)
A-67 (Yellow Grease)
S-871 (Soy)
A-66 (Yellow Grease)
Blend Trial 1 Trial 2 Trial 1 Trial 2 Trial 1 Trial 2 Trial 1 Trial 2
B20 57 66 65 65 64 64 61 67
B25 66 66 68 67 65 66 67 66
B30 68 69 68 68 67 67 67 69
B40 71 72 72 72 69 69 73 70
B50 75 77 76 75 72 73 76 76
B60 81 82 82 82 76 76 79 82
B70 89 90 88 89 82 83 87 87
B80 102 102 99 99 85 84 94 97
B90 121 116 115 115 104 104 115 114
B100 182 174 168 168 114 114 154 148

164
Figure 52: Flash Point vs. % Blend - S-870 Saff/Can
Figure 53: Flash Point vs. % Blend - S-871 Soy
50
70
90
110
130
150
170
190
10 20 30 40 50 60 70 80 90 100
Fla
sh P
oin
t °
C
Volume Percent Biodiesel
Trial 1
Trial 2
60
70
80
90
100
110
120
10 20 30 40 50 60 70 80 90 100
Fla
sh
Po
int
°C
Volume Percent Biodiesel
Trial 1
Trial 2

165
Figure 54: Flash Point vs. % Blend - A-66 Yellow Grease
Figure 55: Flash Point vs. % Blend - A-67 Yellow Grease
60708090
100110120130140150160
10 20 30 40 50 60 70 80 90 100
Clo
ud
Po
int
°C
Volume Percent Biodiesel
Trial 1
Trial 2
60
80
100
120
140
160
180
10 20 30 40 50 60 70 80 90 100
Fla
sh P
oin
t °
C
Volume Percent Biodiesel
Trial 1
Trial 2

166
3.4.2 Discussion
For all four blend stocks, the flash point increased smoothly as a function of concentration. In all
cases, the response was non‐linear, rising more slowly over the range 20‐80 %, and much more
rapidly between 80 and 100% biodiesel. The repeatability of replicate determinations was
within acceptable limits for most of the blends. Repeatability for Method D93‐10a Procedure A
is given as a product of the flash point in °C and a constant equal to 0.029. Over the range of
observed flashpoints (roughly 60‐170 °C), this formula gives repeatabilities ranging from 1.74 to
4.93 °C, or 2 to 5 °C when rounded. Most the replicate determinations fell well within this
range.
3.5 Automatic Atmospheric Distillation – ASTM D86-10a
3.5.1 Results
Test method D86‐10a was not successful for blend concentrations at or above B30 for any of the
four blend stocks tested. Table 46 shows the averaged result of two trials for blends B20, B25,
and B30. The T90 and final boiling point (FBP) temperatures for each blend are reported in
degrees Celsius. The blend concentrations B20 and B25 of each series distilled successfully and
met ASTM D86 test specifications. However, blend concentrations above B30 cracked
(underwent thermal decomposition) during the distillation at or near a FBP of 350°C (662°F).
The decomposition of these blends was indicated by white smoke filling the distillation flask
and pouring into the sidearm and receiving cylinder. Immediately after white smoke appeared,
the vapor temperature dropped. That behavior implied the long chain FAME broke into
smaller, more volatile molecules distilling at temperatures lower than their parent esters. The
automatic test continued with heavy white smoke remaining in the distillation flask and
receiving cylinder. The FBP temperatures are not accurate. Moreover, the automatic optics of
the instrument could not detect the final recovery volume at or near the FBP because of the
lingering white smoke in the receiving cylinder. Because of these problems, the instrument
could not be run in automatic mode. Data for those blends is not reported in Table 46. Instead,
the entry “cracked” in the table indicates that thermal decomposition occurred for those
samples.
3.5.2 Discussion
As the concentration of biodiesel increased, the tendency for the sample to “crack” also
increased. No. 2 Diesel is less dense and made of more volatile organic compounds than
biodiesel, so it vaporized at lower temperatures than the biodiesel constituents did. As the
automatic atmospheric distillation progressed, the actual concentration of No. 2 Diesel
decreased while the relative concentration of biodiesel increased in the remaining sample.
When the vapor temperature approached or exceeded 350°C (662°F), the remaining biodiesel
constituents decomposed. There is a procedure written in ASTM D86 to report‐as‐tested the
temperature of a sample at the point it thermally decomposes (Procedure A steps 10.13 and
10.17). However, that is not a practical method to distill high concentration blends because
constant visual observation by a trained analyst would be required to detect the decomposition

167
point of a heavy blend fuel, and determine if decomposition occurred prior to the T90 recovery
point. If the T90 recovery point was met or exceeded prior to decomposition, then the results
could be used as reported. Otherwise, the method would still not be applicable to heavy
concentration biodiesel fuel blends. Having a technician does not solve the problem of excess
smoke pouring into the receiving cylinder and interfering with the optical detector that
measures the recovered volume.
Table 46: ASTM D86-10 Atmospheric Distillation Temperature (°C)
Blend Parameter S-870 A/B (Saff/Can)
A-67 (Yellow Grease)
S-871 (Soy)
A-66 (Yellow Grease)
B20 T90 333.7 334.2 333.8 334.3
FBP 341.9 343.1 342.5 344.3
B25 T90 335.3 335.3 335.0 335.6
FBP 342.0 344.0 342.1 343.8
B30 and above
T90 Cracked Cracked Cracked Cracked
FBP
Note: All blend concentrations above B30 cracked during distillation under conditions
of ASTM D86.
3.6 Automatic Reduced Pressure Distillation ASTM D1160-06
3.6.1 Observations and Discussion
None of the blends distilled smoothly under the reduced pressure conditions of test method
D1160‐06. During testing, each sample began bumping, or boiling erratically and violently, and
rising into the distillation column. Bumping was especially pronounced for blends below B50.
This vigorous boiling brought the liquid into contact with the vapor probe, resulting in
inaccurate vapor temperature readings. The boiling liquid then spilled over into the receiving
cylinder, increasing the apparent distillation rate detected by the instrument, which responded
by reducing the heating rate. Measurement and control of all three of the critical distillation
parameters, vapor temperature, distillation rate, and heating rate, became inaccurate. In some
cases, the automatic test continued to the 70% recovery point in spite of the erratic readings.
Pressure fluctuations in the apparatus from the bumping of the sample often exceeded the
instrument’s allowable limits, so that the test automatically aborted.
Multiple attempts to modify Method D1160‐06 to eliminate these problems were unsuccessful.
Automatic reduced pressure distillation is not an appropriate test method for biodiesel blends.

168
Microdistillation, a simulated distillation method using gas chromatography or some other
technique must be used instead. Table 47 shows the average of two trials for B100, B90, B70,
B50, and B40 and lighter blends in each series as AET90 temperatures in degrees Celsius. The
average final AET temperature (AETf) is also reported in degrees Celsius, with the
corresponding volume percent recovered at a predetermined distillation stop point. An entry of
“Spill‐Over” is used for any blend that did not distill properly or did not conform to the
specifications of the test method.
Table 47: ASTM D1160-06 Reduced Pressure Distillation Results
Note: Most blend concentrations up to B70 exhibited excessive bumping and spillover. All
B40, B30, B25, and B20 blends exhibited excessive bumping and spillover under the
conditions specified in ASTM D1160‐06.
Blend Level
Parameter Distillation Temperature (°C)
≤B40
AET90
Spill-Over Spill-Over Spill-Over Spill-Over
AETf
B50
AET90
Spill-Over
355.5
Spill-Over
355.2
AETf 425.7 @ 97% 376.0 @ 97%
B70
AET90 353.2 355.5
Spill-Over
356.1
AETf 356.9 @ 97% 364.8 @ 95% 368.3 @ 97%
B90
AET90 353.7 355.5 353.3 354.3
AETf 359.0 @ 97% 381.1 @ 97% 358.1 @ 97% 373.4 @ 97%
B100
AET90 354.9 356.0 353.9 355.9
AETf 361.3 @ 99% 363.3 @ 95% 357.7 @ 97% 362.5 @ 95%

169
3.6.2 Conclusion
ASTM D1160‐06, “Standard Test Method for Distillation of Petroleum Products at Reduced
Pressure” with the Herzog HDV 632 was an adequate method to test B80 or heavier blends for
all four blend stocks but was not adequate to test all blends in each series.
Trials for S‐870 A/B (Saff/Can) and S‐871 (Soy) began to exhibit signs of excessive bumping at
B50 and B70, respectively. The Yellow Grease blend stocks A‐67 and A‐66 exhibited signs of
excessive bumping for blends B40 or lower.
For biodiesel blends to distill properly, the conditions of the test method must accommodate the
dissimilar physical and chemical characteristics of both the biodiesel feedstock and No. 2 Diesel
fuel. As the concentration of biodiesel in the blend increases, the sample behaves more like neat
biodiesel and becomes prone to cracking near the end of the distillation. Conversely, when the
concentration of biodiesel in the blend decreases, its behavior tends toward that of diesel fuel.
Low biodiesel blend samples become prone to bumping under vacuum.
3.7 Biodiesel Content in Diesel Fuel by Mid Infrared Spectroscopy (FTIR) – ASTM D7371-07
3.7.1 Results
Test method D7371‐07 worked successfully for all blends in each series. Data from three trials
per sample are reported in Tables 48‐51. Repeatability values in the tables are calculated using
the equation given in Method D7371:
Repeatability (Vol. %) = 0.01505 * (Cf + 14.905)
where (Cf is the calculated concentration of the sample
Note that this equation has only been validated for blends up to B20, so these repeatability
values are estimates only.
3.7.2 Discussion
This test method provides a quick and reliable determination of the concentration of biodiesel
fuel in a blend with #2 Diesel.
ASTM D7371‐07states that the repeatability formula published for this method is precise up to
values of the differences of each of the three trials are well within the estimated acceptable
repeatability values for each blend type.
To prevent sample carry‐over in the FTIR cell, the manufacturer’s recommendations and good
laboratory practices should be followed in washing and drying the cell between samples.

170
Table 48: % Biodiesel by FTIR in Blends of S-871 Soy
Conc. Trial 1 Trial 2 Trial 3 Average Std. Dev Calc.
Repeat.
B20 19.78 19.83 19.96 19.86 0.09 0.523
B25 25.04 25.08 25.07 25.06 0.02 0.602
B30 30.11 30.29 30.18 30.19 0.09 0.679
B40 40.31 40.07 40.08 40.15 0.14 0.829
B50 50.71 50.78 50.67 50.72 0.06 0.988
B60 61.74 61.43 60.77 61.31 0.50 1.147
B70 71.69 71.36 70.6 71.22 0.56 1.296
B80 81.94 81.5 80.55 81.33 0.71 1.448
B90 92.1 91.27 90.33 91.23 0.89 1.597
B100 102.16 101.02 100.22 101.13 0.97 1.746
Table 49: % Biodiesel by FTIR in Blends of S-870 Saff/Can
Conc. Trial 1 Trial 2 Trial 3 Average Std. Dev Calc.
Repeat.
B20 20.34 20.65 20.32 20.44 0.19 0.532
B25 25.49 25.59 25.55 25.54 0.05 0.609
B30 30.49 30.53 30.65 30.56 0.08 0.684
B40 41.03 40.88 41.03 40.98 0.09 0.841
B50 50.91 50.47 50.8 50.73 0.23 0.988
B60 62.3 62.13 61.94 62.12 0.18 1.159
B70 71.5 72.19 71.98 71.89 0.35 1.306
B80 82.44 82.19 82 82.21 0.22 1.462
B90 92.45 92.24 91.98 92.22 0.24 1.612
B100 102.01 101.24 101.46 101.57 0.40 1.753

171
Table 50: % Biodiesel by FTIR in Blends of A-66 Yellow Grease
Conc. Trial 1 Trial 2 Trial 3 Average Std. Dev Calc.
Repeat.
B20 20.19 20.1 20.45 20.25 0.18 0.529
B25 25.18 25.1 25.26 25.18 0.08 0.603
B30 30.19 30.08 30.29 30.19 0.11 0.679
B40 40.75 40.52 40.58 40.62 0.12 0.836
B50 50.85 50.64 50.55 50.68 0.15 0.987
B60 61.41 61.12 60.7 61.08 0.36 1.144
B70 71.22 71.16 70.56 70.98 0.36 1.293
B80 81.22 81.06 80.39 80.89 0.44 1.442
B90 91.04 90.89 90.23 90.72 0.43 1.590
B100 100.94 100.72 99.97 100.54 0.51 1.737
Table 51: % Biodiesel by FTIR in Blends of A-67 Yellow Grease
Conc. Trial 1 Trial 2 Trial 3 Average Std. Dev Calc.
Repeat.
B20 19.77 19.74 20.07 19.86 0.18 0.523
B25 25.02 25.26 25.14 25.14 0.12 0.603
B30 29.85 30.32 30.53 30.23 0.35 0.679
B40 40.15 40.2 40.76 40.37 0.34 0.832
B50 50.47 50.88 51.02 50.79 0.29 0.989
B60 61.73 62.29 60.94 61.65 0.68 1.152
B70 71.96 72.25 70.94 71.72 0.69 1.304
B80 82.13 82.56 80.98 81.89 0.82 1.457
B90 91.97 92.3 90.82 91.70 0.78 1.604
B100 102.13 102.22 100.87 101.74 0.75 1.756
3.8 Water and Sediment Contamination – ASTM D2709-96
3.8.1 Results
Test method ASTM D2709 – 96 was successfully applied to all blends for each of the four blend
stocks. It is a quick, determinate test with little sample preparation needed. Observations from

172
two trials per blend resulted in no measureable undissolved water or sediment in any of the
blends of the four blend stocks.
Since all blend stocks were compliant with ASTM specifications, no water or sediment
contamination was expected in the blends tested. To test for added water, three drops of tap
water, approximately 0.10 mL, were added to a vial of neat S‐871 (Soy) and tested to determine
the content of undissolved water in it. The spiked sample showed approximately 0.09 volume
percent of undissolved water by that test method. A vial of neat S‐871 (Soy) showed no
measurable signs of undissolved water or sediment.
The extension of this work to blends prepared from biodiesel stocks known to contain
measurable water is recommended.
3.8.2 Discussion
In the laboratory, excess undissolved water or contaminants in biodiesel can interfere with the
results of other test methods causing invalid data. Test method ASTM D2709‐96 should be
performed before other laboratory tests to identify possible problems with other tests.
Biodiesel is hygroscopic and neat biodiesel or high concentration blends can absorb water in
storage. This can lead to oxidation of the ester bonds, and can cause corrosion and performance
problems. High amounts of water may even support microbial growth under some
circumstances. Physical damage of the pistons, piston rings, valves, valve seats, and cylinder
walls in the engine may result. Testing of a blend stock by method ASTM D2709–96 should be
performed before blending with petroleum to ensure that the blend stock is within
specifications.
3.9 Free and Total Glycerin Content – ASTM D6584-10a
3.9.1 Results
Test method D6584‐10a worked for all four neat biodiesel stocks, but not the blends.
Constituents of the diesel fuel co‐elute with glycerin, and so interfere with its detection by GC.
It is possible that a solid phase extraction method could be developed to remove the interfering
components of petroleum diesel. Alternatively, it might be possible to develop a liquid‐liquid
extraction method to separate the more polar blend components, including glycerin, from the
biodiesel blends. However, such work was outside the scope of the current project. Future work
in this area is recommended.
3.10 Kinematic Viscosity - D445-10
3.10.1 Results
Test method D445‐10 worked for all blends in each series. The data are shown in Table 52 and
Figure 56. The kinematic viscosity of S6, a standard reference fuel, was also measured as a check
of the method. Its result was 5.695 – 5.701 mm2/s, within the range specified in ASTM D‐445‐10.

173
Table 52: Kinematic Viscosity of Standard Fuel, Diesel Fuel, and Biodiesel Fuel Blends in mm2/s
Blend S6
Standard No. 2 Diesel
S-870 Saff/Can
S-871B Soy
A-66 Yellow Grease
A-67 Yellow Grease
S6 Standard
5.695-5.701
No. 2 Diesel
2.946
B25 3.158 3.136 3.246 3.274
B30 3.215 3.190 3.357 3.350
B40 3.332 3.284 3.482 3.509
B50 3.452 3.394 3.640 3.701
B60 3.576 3.515 3.807 3.865
B70 3.708 3.633 3.995 4.076
B80 3.858 3.769 4.195 4.274
B90 4.015 3.907 4.384 4.597
B100 4.298 4.058 4.654 4.762
ASTM D6751‐10T specifies a range is 1.9‐6.0 mm2/s for B100. The results for all of the blend
stocks were well below this limit.
ASTM D7467‐10 specifies a range for kinetic viscosity of 1.9 ‐ 4.1 mm2/s for B6‐B20 biodiesel fuel
blends. (This is the same range allowed for No. 2 Diesel by D975‐10.) This maximum value of
4.1 mm2/s is shown in Figure 56 as a dashed horizontal line. Among the B100 stocks, only the
soy fell below this limit. The values for the B80 and B90 yellow grease blends were also above
the maximum allowed in the specifications.
3.10.2 Conclusion
This method was quick and determinative for testing kinematic viscosity of all blends of all four
biodiesel stocks. Based on the data collected in this study, the ASTM D6751‐10 specification of
kinematic viscosity may be applied to all blends in each series. The kinematic viscosity values
increased proportionally as blend values increased throughout each series. Higher viscosity
values correlate with larger droplet sizes in fuel injectors and may add excessive coking in the
cylinder or increased particulate matter in the emissions of the engine.

174
Figure 56: Kinematic Viscosity of Blends
3.11 Microdistillation ASTM D7345-08
Neither ASTM D86‐10 nor ASTM D1160‐06 was found to be applicable for the full range of
biodiesel blends. Alternate distillation methods have been developed to address the limitations
of the existing distillation test methods. New distillation instruments have been developed that
use different methods of detection and are not subject to the limitations of the D86‐10. For
example, addition of a foam sensor has been used to allow more sensitive automatic
temperature control to minimize bumping in blend samples. However, based on the results
described in sections 3.5 and 3.6 above, it is unlikely that such modifications will be sufficient
for the analysis of the full range of biodiesel blends.
Microdistillation ASTM D7345‐08 is an alternate method for both diesel and B100 blendstocks,
but it has not been evaluated for biodiesel blends. DMS purchased a Model 110
Microdistillation instrument from PAC in December 2013. This instrument was tested on a
limited number of blends to determine if microdistillation might work for biodiesel blends.
3
3.25
3.5
3.75
4
4.25
4.5
4.75
5
20 30 40 50 60 70 80 90 100
Kin
emat
ic V
isco
sity
mm
2 /s
Volume Percent Biodiesel
Saff/Can
Soy
A‐66 YG
A‐67 YG

175
Preliminary results from this evaluation are very encouraging. Sample reports of the distillation
profile for the B30 Yellow Grease A‐67 blend and the B50 Soy blend are reproduced in Tables 53
and 54. These samples could not be analyzed by either atmospheric pressure or reduced
pressure distillation. In the tables, IBP and FBP are initial and final boiling points, respectively.
Table 53: Microdistillation of B30 Yellow Grease
% Recovered Temp. ° C
IBP 186.0
5% 211.4
10% 225.5
20% 246.4
30% 266.6
40% 284.6
50% 299.0
60% 311.4
70% 321.8
80% 330.6
90% 342.6
95% 350.7
FBP 354.2
%R 97.7
%r 1.9

176
Table 54: Microdistillation of B50 Soy
% Recovered Temp. ° C
IBP 195.7
5% 223.1
10% 239.0
20% 263.8
30% 288.5
40% 304.6
50% 316.8
60% 325.3
70% 331.6
80% 336.9
90% 344.1
95% 348.2
FBP 348.7
%R 97.7
%r 1.9

177
Chapter 4: Discussion, Recommendations and Future Work
The suite of existing ASTM test methods for diesel and biodiesel fuels has been evaluated over
the range B20 to B100 for four blend stocks, which represent the primary biodiesel feedstocks in
production today (soy oil, canola oil bended with safflower oil, and WCO). With the exception
of the distillation methods and the Low Flow Temperature Test (LFTT) D4539‐10, all methods
were found to be applicable to all of the blend stocks over the complete concentration range.
The data for the LFTT are incomplete only because the available sample to run this test was
depleted. D4539‐10 ran successfully on all the samples for which it could be tested (see Section
3.2 above). Since this test is based on the physical properties of a fuel sample, it would be
expected to work for all other biodiesel blends. Finishing the testing of D4539‐10 is
recommended as part of future work on the analysis of biodiesel blends.
As discussed in sections 3.5 and 3.6, the distillation methods ASTM D86‐1 and D1160‐06 are not
applicable to a useful range of biodiesel blends. Microdistillation method D7345‐08 is a
promising alternative method based on the limited results available. Complete testing of D7345‐
08 for different blendstocks over the full blend range is recommended as part of future work.
Table 55 summarizes the results of this work for all methods tested.. We conclude that the
ASTM methods tested could be used to support the development of new ASTM standard
specifications for biodiesel blends in the concentration range 20 – 100 volume percent. In turn,
such standards could support an expanded market for biodiesel by providing enforceable
quality standards.
The results of this project suggest that these test methods would be equally applicable to blends
from other feedstocks that are similar to those tested, such as flaxseed and cottonseed oils.
Currently, there is very little biodiesel produced domestically from such sources. However,
they may become more important in the future, at least regionally. Other less familiar
feedstocks such as jatropha are currently under investigation or development internationally
and may become more important in the future.
Feedstocks such as palm oil and coconut oil contain predominantly saturated fatty acids, and so
are significantly different from those tested in this project. It is likely that the methods tested
would apply to blends of these feedstocks as well. Palm oil and coconut oil are both important
feedstocks overseas, and may in the future be traded internationally. The verification of the
applicability of test methods to blends of these feedstocks is recommended for future work.
Polyunsaturated fatty acid esters with four or more double bonds are among the components
that are of concern in biodiesel blends. Not only are these compounds relatively high boiling,
they are less stable than the more saturated major components and so may cause problems in
stored fuel. The European biodiesel specification EN14214‐2008 specifies a maximum
concentration of 1% for these high polyunsaturated esters. While current ASTM standards do
not include a specification, it is possible that future revisions will be normalized with

178
international standards. Polyunsaturated esters are readily amenable to analysis by GC with
FID or MS detection. FTIR methods have also been proposed. European method CSN EN
1577989 90 uses GC to determine the four most important polyunsaturated esters. This method
has been validated over the concentration range 0.6% ‐ 1.5%.91 Future revisions of the method
are expected to extend this validation range. It is possible that either GC or FTIR techniques
could be simultaneously applied to the determination of glycerin and triglycerides.92 This is
another area recommended for future work. GC analysis could also be applied to the detection
and identification of additives and adulterants in biodiesel.
Effective quality testing for a broad range of biodiesel blends utilizing approved ASTM
methods has demonstrated promise for the expansion of these methods to support testing and
commercial introduction of biodiesel blends from B20 to B100 from established feedstocks. The
viability of additional feedstocks (jatropha, flaxseed, cottonseed, palm oil and coconut oil)
should be evaluated along with the associated test methods as their market presence becomes
more commonplace. The expansion of viable alternative feedstocks will also require additional
test method research and development to support quality verification by both industry
producers and public agencies.
89 This standard is available for purchase at www.en‐standard.eu/csn‐en‐15779‐petroleum‐products‐and‐
fat‐and‐oil‐derivates‐fatty‐acid‐methyl‐esters‐fame‐for‐diesel‐engines‐determination‐of‐polyunsaturated‐
4‐double‐bonds‐fatty‐acid‐methyl‐esters‐pufa‐by‐gas‐chromatography/
90 McCurry, James D. Agilent Application Note EN15779 – Gas Chromatographic Analysis of
Polyunstaruated FAME in Biodiesel Made from Algae and Marine Oils, 2011. Available online at
www.chem.agilent.com/Library/applications/5990‐8875EN.pdf. accessed 7/10/13.
91 Schober, Sugurd et al “A method for the determination of polyunsaturated fatty acid methyl esters in
biodiesel: Results of an interlaboratory study,” European Journal of Lipid Science and Technology,
published online 8/26.09. Abstract accessed online at
http://onlinelibrary.wiley.com/doi/10.1002/ejlt.200800266/abstract 7/10/13.
92 De Jong, Rob and Rik Suijker, “GC Analysis of Biodiesels: Compliance with International Standards
Using a Single System”, American Laboratory October 2012. Reprinted online at
http://www.paclp.com/content/documents/Press_Articles/ALM_October2012_web.pdf accessed 7/10/13.

179
Table 55: Summary of ASTM Test Method Results for Biodiesel Blends
ASTM Method
ASTM Method Title Summary of Results
D2500-09 Standard Test Method for Cloud Point of
Petroleum Products Method works for all blend stocks at all levels
D4539-10 Standard Test Method for Filterability of Diesel Fuels by Low-Temperature Flow
Test
Saff/Can and WCO A-66 were not tested because blend stocks were completely used in other testing.
Method worked for the three blends tested for Soy, with a highly linear correlation.
Method worked for the three blends tested for WCO A-67E, with a non-linear correlation.
Method works for all blends tested; additional work is needed.
D6371-05 Standard Test Method for Cold Filter
Plugging Point of Diesel and Heating Fuels
Method works for all blend stocks at all levels. Rough linear correlation for Soy and WCO blends. Biphasic response for Saff/Can blends.
D93-10a Standard Test Method for Flash Point by
Pensky-Martens Closed Cup Tester, Procedures A or C
Method works for all blend stocks at all levels. A non-linear response for all four feedstocks was observed.
D86-10a Standard Test Method for Distillation of
Petroleum Products At Atmospheric Pressure
Method did not work at or above B30 for any blend stock.
Atmospheric Pressure Distillation is not applicable to biodiesel blends above B20.
D1160-06 Standard Test Method for Distillation of
Petroleum Products At Reduced Pressure
Method works for B90.and B100.
Reduced Pressure Distillation by D1160-06 is not applicable to blends below B80.
D2709-96 Standard Test Method for Water and Sediment in Middle Distillate Fuels by Centrifuge
Method works for all blend stocks at all levels.

180
ASTM Method
ASTM Method Title Summary of Results
D7371-07
Standard Test Method for Determination of Biodiesel (Fatty Acid Methyl Esters) Content in Diesel Fuel Oil Using Mid Infrared Spectroscopy (FTIR-ATR-PLS Method)
Method works for all blend stocks at all levels.
D6584-10a
Standard Test Method for Determination of Total Monoglyceride, Total Diglyceride, Total Triglyceride, and Free and Total Glycerin in B-100 Biodiesel Methyl Esters by Gas Chromatography
Method works for all neat blend stocks.
Method did not work for any blends because of interference from petroleum diesel components.
D445-10
Standard Test Method for Kinematic Viscosity of Transparent and Opaque Liquids (and Calculation of Dynamic
Viscosity)
Method works for all blend stocks at all levels. A linear correlation of kinematic viscosity with blend level observed for all blend stocks.

181
Appendix A: Timeline for Fuel Cell Vehicles and California’s Hydrogen Infrastructure 1931 – The California Legislature enacted the Oil Substitution Act (Stats 1931, Chapter 609).This
Act sought to prevent fraud in the sale of transportation fuels in California and to ensure that all
fuels sold met accepted quality standards. The Division of Measurement Standards of the
Department of Food and Agriculture was given the responsibility for establishing and enforcing
the quality standards for transportation fuels sold in California. Products are sampled and
tested in the CDFA’s laboratories in Sacramento and Anaheim to verify that they meet the
quality, performance and drivability standards established in state law.
1949 ‐ California Agricultural Act ‐ Chapter 893 §2 was amended to require the Department of
Food and Agriculture to develop regulations for the testing of types or designs of weights,
measures, and weighing and measuring devices (type testing) used for commercial purposes.
This amendment gave the CDFA the authority to regulate transportation fuel dispensers in
California.
1989 ‐ The National Hydrogen Association (NHA) was formed in the United States with ten
members. Today, the NHA has nearly 100 members, including representatives from the
automobile and aerospace industries, all levels of government, universities, researchers,
utilities, and energy providers. The International Organization for Standardization’s Technical
Committee for Hydrogen Technologies was also created in 1989.
1990 ‐ California Air Resources Board (CARB) introduced the Zero Emission Vehicle (ZEV)
Mandate. The mandate was the first public policy aimed at the improvement of air quality
through new technologies instead of modifications of the internal combustion engine.
1999 – The California Fuel Cell Partnership is formed, bringing the CARB and California Energy
Commission together with DaimlerChrysler, the Ford Motor Company, Ballard Power Systems,
BP, Shell Hydrogen, and ChevronTexaco to promote fuel cell vehicle development. The
following year, the Partnership’s headquarters opened in West Sacramento, California.
2001 – The first 10,000 psi hydrogen tanks were demonstrated, increasing the driving range of
fuel cell vehicles while decreasing the size of on‐board storage tanks.
2003 ‐ President Bush announced the Hydrogen Fuel Initiative, a $1.2 billion federal program to
fund hydrogen technology development.

182
2003 – The California Energy Commission issued the 2003 Integrated Energy Policy Report, calling
for a reduction in petroleum fuel use in the transportation sector to 15 percent below 2003 levels
by 2020, and an increase in the use of nonpetroleum fuels to 20 percent of on‐road fuel
consumption by 2020 and 30 percent by 2030.93
2004 ‐ California Governor Arnold Schwarzenegger signs Executive Order S‐7‐04, committing
the state to the development of the California Hydrogen Highway. The goals of this ambitious
plan are yet to be fully realized. However, this order established California as a national leader
in the development of a hydrogen economy.
2005 – AB 1007 (Pavley) calls for the development of a program to promote alternative fuels and
vehicle technologies in California to reduce petroleum dependence and improve air quality.
2007 ‐ Assembly Bill 118 (Núñez) created the California Energy Commissionʹs Alternative and
Renewable Fuel and Vehicle Technology Program. The statute, subsequently amended by
Assembly Bill 109 (Núñez, Chapter 313, Statutes of 2008), authorized the Energy Commission to
develop and deploy alternative and renewable fuels and advanced transportation technologies
to help attain the stateʹs climate change and clean air policies.
2007 ‐ The U.S. National Work Group (USNWG) for the Development of Hydrogen
Measurement Standards was established in October of 2007 to assist stakeholders in promoting
the legal use of hydrogen dispensers for fuel cell vehicles in commerce.
2007 – General Motors launched Project Driveway to put 100 Chevy Equinox Fuel Cell SUVs on
the road in Los Angeles, Orange County, New York, and Washington DC as part of GM’s fuel
cell research program.
2009 – The annual Investment Plan for AB 118 provided $3.5 million for the Division of
Measurement Standards of the California Department of Food and Agriculture to research
hydrogen fuel dispensing device test standards and procedures, fuel sampling techniques and
laboratory methods for hydrogen fuel quality analysis.
2012 – California Governor Jerry Brown signs Executive Order 16‐2012, setting goals to increase
the number of Zero Emission Vehicles on the State’s highways and to develop the infrastructure
needed to support them.
2013 – The H2USA public‐private partnership is established under the sponsorship of the U. S.
Department of Energy to promote the development of hydrogen infrastructure.
2015‐2017 – Major automobile manufacturers plan to offer fuel cell vehicles for sale in
California.
93 California Energy Commission 2003 Integrated Energy Policy Report. Available online at
www.energy.ca.gov/reports/100‐03‐019F.PDF. accessed 6/14/13.

183
Appendix B: Preparation of Standards for Hydrogen Analysis Preparation of Gaseous Hydrogen Standards.
Procedure: Excel spreadsheets and logbooks are used to maintain traceability of all standards
and solutions prepared. All standards and solutions prepared are recorded in the Sacramento
Hydrogen Standards Logbook’. An Excel template may be used to determine the volumes of
standards required for the desired concentration of standard. Standard mixtures are numbered
sequentially using the format SHS‐XXX, where SHS stands for Sacramento Hydrogen Standard,
and XXX is the next number.
Determination of Standards volumes to use: Most of the standards prepared will be in the low
to mid‐ppm range. The volumes of analyte that are necessary can be calculated using the
‘Standard Prep Template’. A sample template is shown below in Figure 57. When the ‘Desired
Final Conc’ and ‘Desired Final Pressure’ are entered in the template, the volume needed is
automatically calculated.
The volume of neat material that will be required depends on the final container; this will
probably be 6 L, but other size containers can be used. The final pressure can be adjusted to
obtain manageable volumes. For example, the final pressure can be adjusted to give a volume
needed of 120.0 ml rather than 117.63 ml. Note: for safety reasons, the final pressure in the
SUMMA cans must not exceed 40 psig; this is a final gauge pressure of 2080 Torr. It should
also be noted that pressurizing the canister towards the maximum pressure will give more
standard that can be used since standards flow out of the canister by pressure and are not
evacuated by vacuum. A typical CCV analysis on the FTIR may use > 3 L. A standard canister
that contains more will last longer.
Most of the analytes that must be prepared are in the gaseous phase, a few will be in the liquid
phase. Most liquid analytes will require the preparation of an intermediate, high level parent (or
parent mixture). To calculate the volume of liquid standard to be used, the spreadsheet must be
modified in the ‘Volume needed’ column, to account for the molecular weight of the compound.
Canister preparation: First, obtain a clean 6 L summa canister; one that immediately prior held
the same mixture is preferred, as potential active sites within the canister are minimized. Ensure
the valve on the canister is closed, remove the brass cap and attach the canister snugly to the
bottom of the pressurization station. Familiarize yourself with the use of the gauge prior to
attempting to prepare standards. Also note that the gauge is a combination vacuum / pressure
gauge; it will read 0 T @ STP, and ‐760 T at full vacuum (0 T). This means it has a bias of 760 T,
which is accounted for in the calculations.
Fill and evacuate the pressurization station 8‐10 times using UHP hydrogen. The canister is now
ready for the standard. The following steps must all occur within the fume hood. Select the first
analyte to be added. Using the gas‐tight syringe that will be used to measure out the

184
Figure 57: Sample Spreadsheet for Standard Mixture Preparation
concentrated analyte, insert it through the septa. Then carefully back off the plunger to draw an
aliquot of standard into the syringe, remove the syringe, and allow it to vent to room pressure.
Quickly adjust the volume to the sample size needed, and introduce the syringe into the septa
in the pressurization station. The syringe should automatically expel its aliquot into the Summa
canister; if does not, depress the plunger. Remove the syringe as soon as it is empty.
FTIR Working Std
Prep Date: 11-8-13
Expiration Date:TBD
Std ID: SHS-219 Hydrogen Cylinder ID: 065553042
Carbon Dioxide Carbon Monoxide Methane
Desired Final Conc (ppmv) 20 2 20
Initial Conc (ppmv) 1994.75 199.47 1994.75
Initial pressure (torr) -760 -760 -760
Volume Needed (mL) 198.679 198.684 198.679
Actual Vol. Used (mL) 200.000 200.000 200.000
Actual Final Pressure (torr) 1729 1729 1729
Temp (Co) 26.5 26.5 26.5
Actual Final Conc. (ppmv) 20.30280 2.03023 20.30280
Standard ID Used (ppmv) SHS-218 SHS-218 SHS-218
Expiration Date TBD TBD TBD

185
Repeat this procedure for each analyte that is needed. When the final analyte has been added,
pressurize the Summa canister to the desired final pressure. Allow the canister to thermal
equilibrate for 12‐15 minutes, and then bring the pressure up to the desired final pressure. It is
almost impossible to exactly hit the desired final pressure, so record the actual final pressure
and volumes used into the standard prep spreadsheet.
Print the spreadsheet out and tape the spreadsheet into the logbook, and sign and date across
the tape. Print out a second copy of the spreadsheet, place it into a transparent job folder, and
zip‐tie it to the canister.
The specifications for impurities in fuel cell grade Hydrogen are in ppm v/v (parts per million
volume‐to‐volume). This means a 100 ppm specification is equal to 100 mL in 1,000,000 ml. This
is in contrast to more familiar units such as ug/L or ng/ml. The conversion can however easily
be done; A conversion can be based on the fact that 1 mole of any gas occupies a volume of
22,400 mL at 0o C and 760 T. A calculation for a 100 ppm Argon standard is shown.
100 mL Ar /106 mL H2 x 40 g Ar /22,400 mL Ar x 106 ug Ar /1 g Ar =
0.1785 ug Ar/ mL H2 @STP

186
Appendix C: Procedure for Cleaning Sampling and Standard Containers Summary of DMS Hydrogen Laboratory Procedure for Evacuation and Cleaning of Sampling and Standard Containers.
Scope: To cover the procedures necessary to ensure that sampling containers are clean prior to
being placed into service, and are cleaned between uses, in order to prevent cross‐
contamination.
Reason: Detectable amounts of analytes may be present in sample containers and standard
canisters in subsequent analyses of standard and sample bombs if high level contaminants
(above the Maximum Contaminant Level, MCL) were present in the container immediately
prior to use. To ensure sample and standard integrity, all containers must be cleaned following
this SOP. All standards and sample containers are cleaned using the Entech canister cleaning
system shown in Figure 58. The system consists of two ovens, vacuum pumps and control
module, and operating software. The use of two ovens allows standard canisters and sample
containers to be cleaned separately. This minimizes the chances of cross‐contamination.
Figure 58: Canister Cleaning System

187
Procedure:
1. Turn on the ovens. Start the Entech software, and choose ‘Close all valves’.
2. Record the Container ID#, Sample ID#, and date in the Canister Cleaning Log.
3. Vent all standard canisters and sample containers to atmospheric pressure inside the hood.
4. Attach 6 L SUMMA canisters to the manifold in the left hand oven. The oven will hold up to
eight canisters. Attach brass plugs to any manifold legs not used. Figure 59 shows two canisters
mounted in the cleaning oven.
Figure 59: Summa Canisters in the Cleaning Oven
5. For sample containers, place a brass cap on one of the two valves, and attach the other end to
one of the brass lines in the right hand oven. The oven can hold up to four cylinders. Attach
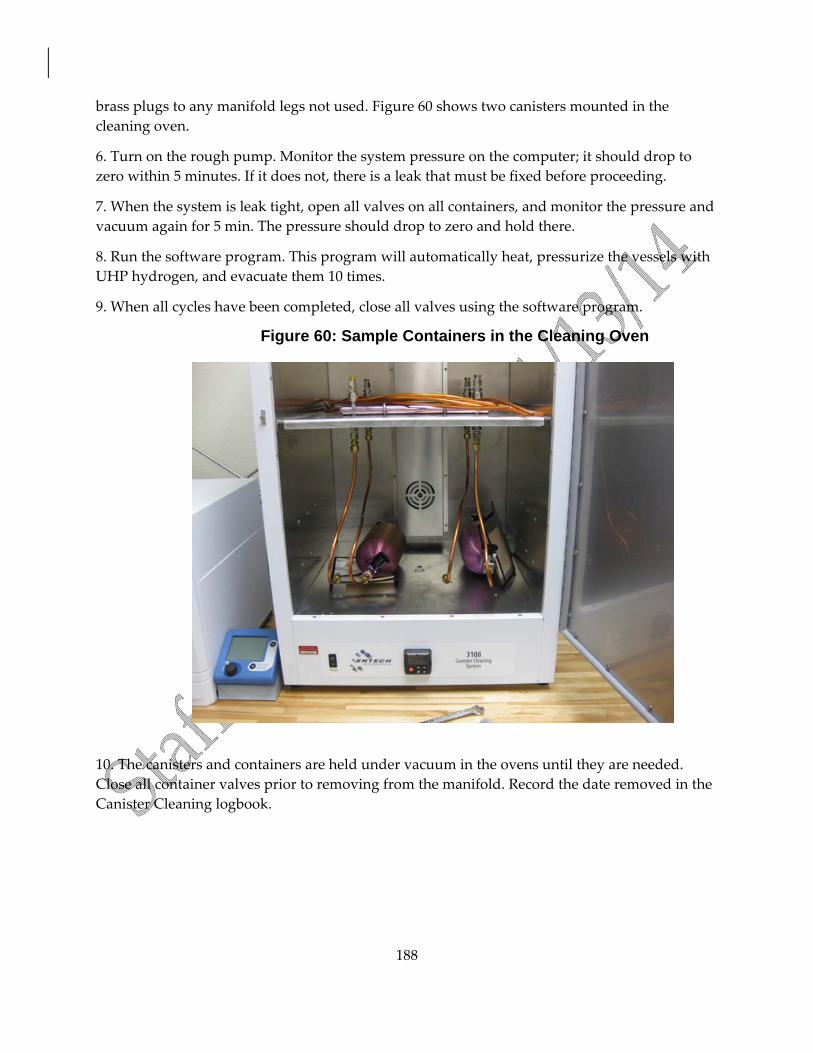
188
brass plugs to any manifold legs not used. Figure 60 shows two canisters mounted in the
cleaning oven.
6. Turn on the rough pump. Monitor the system pressure on the computer; it should drop to
zero within 5 minutes. If it does not, there is a leak that must be fixed before proceeding.
7. When the system is leak tight, open all valves on all containers, and monitor the pressure and
vacuum again for 5 min. The pressure should drop to zero and hold there.
8. Run the software program. This program will automatically heat, pressurize the vessels with
UHP hydrogen, and evacuate them 10 times.
9. When all cycles have been completed, close all valves using the software program.
Figure 60: Sample Containers in the Cleaning Oven
10. The canisters and containers are held under vacuum in the ovens until they are needed.
Close all container valves prior to removing from the manifold. Record the date removed in the
Canister Cleaning logbook.

189
Appendix D: Instrument Parameters for Hydrogen Fuel Quality Analysis
System 1:
GC/MS system Single quadropole, Electron impact
GC/MS scan range 16-250 Da
Column ramp (oC) -40/15 – 3 -100/0 – 9 -200/5
Injection Cryo-traps (oC) -180
Sample Lines (oC) 65
PFPD Temp / Gate delay/ Width 200 oC / 6 ms / 10 ms
ECD Temp / range 250 oC / 10
System 2:
Sample line temperature (oC) 65
Column temperature (oC) Isothermal @ 50
TCD / Filament temperatures (oC) 100 / 250
PDHID temperature (oC) 100
FID / Methanizer temperatures (oC) 120 / 380

190
FTIR:
Scan Range 4000 – 650 cm-1
Scan # / Resolution 128 scans / 0.25 cm-1
Gas Cell / Cell Windows 10 m Multi-pass / ZnSe windows
Gas Cell Temperature 110 oC
Detector Liquid nitrogen cooled MCT-A
Sample introduction Temperature controlled @ 60 0C, 1/8” Silonite coated stainless steel tubing, Silonite coated switching valve.
CRDS:
Flow Rate 250-1000 mL/min
Purge Gas Regulated UHP H2, purified, dried
Flow path Parallel

191
Appendix E: Traceability Certificates for Dynacal Sulfur Permeation Tubes

192

193

194

195
Appendix F: California Laws and Regulations Pertaining to Hydrogen Fuel
A link to the latest version of the complete Weights and Measures code sections and related
regulations can be found on the DMS homepage:
http://www.cdfa.ca.gov/dms/publications.html
California Business and Professions Code Division 5 Weights and Measures Pertaining to Hydrogen Fuel
Chapter 2 Administration
§ 12100. GENERAL SUPERVISION BY DEPARTMENT OF FOOD AND
AGRICULTURE
Where not otherwise provided by law, the Department of Food and Agriculture has
general supervision of the weights and measures and weighing and measuring
devices sold or used in the State.
Added Stats 1939 ch 43 § 1; Amended Stats 1989 ch 246 § 3.
§ 12107. ESTABLISHMENT OF TOLERANCES AND SPECIFICATIONS FOR
COMMERCIAL WEIGHING AND MEASURING APPARATUS: PROCEDURE:
PROHIBITION AGAINST VIOLATION OF REGULATIONS, ETC.
The secretary shall establish tolerances and specifications and other technical
requirements for commercial weighing and measuring. In doing so, the secretary shall adopt, by
reference, the latest standards as recommended by the National Conference on Weights and
Measures and published in the National Institute of Standards and Technology
Handbook 44 “Specifications, Tolerances, and other Technical Requirements for
Weighing and Measuring Devices,” except as specifically modified, amended, or
rejected by regulation adopted by the secretary.
The secretary may, by regulation, establish tolerances and specifications for
commercial weighing and measuring devices not included in Handbook 44.
Any regulation shall be adopted, amended, or repealed in conformity with Chapter 3.5
(commencing with Section 11340) of Part 1 of Division 3 of Title 2 of the Government
Code.
It shall be unlawful for any person to violate any of the rules, regulations, tolerances,
specifications, or standards established under this section.
Stats 1993 ch 621 § 1. Amended Stats 2012 ch 661 § 26.

196
§ 12107.1. ESTABLISHMENT OF COMMODITY STANDARDS, WEIGHTS,
MEASURES, AND COUNTS: PROCEDURE: UNLAWFUL SALES
The secretary, by regulation, may establish a standard or standards or net weight or
net measure, or net count of any commodity, except any manufactured commodity
consisting of four or more staple ingredients. These standards, whenever applicable,
shall be based upon published, official federal or state specifications and requirements
or, in the absence of any published official specifications, upon established and
accepted common usage. Any such regulation shall be adopted, amended, or repealed
in conformity with the provisions of Chapter 3.5 (commencing with Section 11340) of
Part 1 of Division 3 of Title 2 of the Government Code.
Whenever a standard, net weight, net measure, or net count has been established for
any commodity, it is unlawful to sell the commodity by, at, or for a quantity greater or
less than the standard.
Added Stats 1965 ch 948 § 2. Amended Stats 2012 ch 661 § 27.
CHAPTER 5 Weighing and Measuring Devices
§ 12500.5. APPROVAL AND CERTIFICATION OF COMMERCIAL
INSTRUMENTS: SALE OR USE FOR COMMERCIAL PURPOSES OF NON‐
APPROVED INSTRUMENTS
The secretary by rules and regulations shall provide for submission for approval of
types or designs of weights, measures, or weighing, measuring, or counting
instruments or devices, used for commercial purposes, and shall issue certificates of
approval of such types or designs as he or she shall find to meet the requirements of
this code and the tolerances and specifications thereunder.
It shall be unlawful to sell or use for commercial purposes any weight or measure, or
any weighing, measuring, or counting instrument or device, of a type or design that
has not first been so approved by the department; provided, however, that any such
weight, measure, instrument, or device in use for commercial purposes prior to the
effective date of this act may be continued in use unless and until condemned under
the provisions of this code.
Added Stats 1949 ch 893 § 2. Amended Stats 2012 ch 661 § 38.

197
CHAPTER 14 Petroleum § 13401. DEFINITIONS OF TERMS
(h) “Engine fuel” means any liquid or gaseous matter used for the generation of power
in an internal combustion engine or fuel cell. “Motor fuel” means “engine fuel” when
that term is used in this chapter.
(i) “Motor vehicle fuel” means any product intended for consumption in an internal
combustion engine or fuel cell to produce the power to self‐propel a vehicle designed
for transporting persons or property on a public street or highway.
(r) “Hydrogen” means a fuel composed of the chemical hydrogen intended for
consumption in an internal combustion engine or fuel cell.
Added Stats 1963 ch 2005 § 2; Amended Stats 1968 ch 1072 § 1; Stats 1970 ch 140 § 1; Stats
1975 ch 547 § 1; Amended Stats 1978 ch 753; Renumbered Stats 1980 ch 636; Amended Stats
1985 ch 167 § 1; Amended Stats 1993 ch 740 § 1; Amended Stats 1994 ch 521 § 1; Amended
Stats 2001 ch 596 § 1; Amended Stats 2005 ch 91 § 2.

198
Appendix G: Proposed California Regulations - Section 3.39 – Hydrogen Gas-Measuring Devices
The text of NIST Handbook 44 Section 3.39 as found in Barclays Official California Code of
Regulations is shown below with the additions and deletions proposed for California.
Proposed additions are shown in gray boxes, and proposed deletions are marked by strikeouts.
Title 4. Business Regulations
Division 9. Division of Measurement Standards, Department of Food and Agriculture
Chapter 1. Tolerances and Specifications for Commercial Weighing and Measuring Devices
Article 1. National Uniformity, Exceptions and Additions
§ 4000. Application.
Commercial weighing and measuring devices shall, except where noted below, conform to the latest requirements set forth in the National Institute of Standards and Technology Handbook 44 “Specifications, Tolerances, and Other Technical Requirements for Weighing and Measuring Devices”, which is herein incorporated by reference, and to the Additional Requirements listed herein. Copies of Handbook 44 may be purchased from the Superintendent of Documents, U.S. Government Printing Office, Washington, D.C. 20402.
§ 4001. Exceptions.
The following regulations in Handbook 44 are not adopted or incorporated by reference: The following regulations in Handbook 44 are not adopted or incorporated by reference: 3.39 Hydrogen Gas-Measuring Devices (Title)
Section 3.39. Hydrogen Gas-Measuring Devices – Tentative Code
A.4. Type Evaluation.
N.3. Test Drafts.
N.4.1. Master Meter (Transfer) Standard Test.
N.4.2. Gravimetric Tests.
N.4.3. PVT Pressure Volume Temperature Test.
N.6.1.1. Repeatability Tests.
T.2. Tolerances.
Table T.2.
T.3. Repeatability.
199
Appendix D. Definitions for:
Remanufactured Device.
Repaired Device.
Remanufactured Element.
Repaired Element.
Note: Authority cited: Sections 12027 and 12107, Business and Professions Code. Reference: Section 12107, Business and Professions Code.
§ 4002. Additional Requirements.
The following sections apply to devices in addition to the Handbook 44 requirements that are incorporated by reference. The number in parenthesis following the section number and section title refers to the related section in Handbook 44; i.e., 4002.1. General Code (1.10.) refers to Section 1.10. General Code in Handbook 44.
4002.9 Hydrogen Gas-Measuring Devices (3.39)
S.5.2. Location of Accuracy Class 3.0, 5.0, and 10.0 Information: An additional Accuracy Class statement shall be placed adjacent to the quantity display on the face for the dispenser and shall be conspicuously, legibly, and indelibly marked with a statement such as “The Accuracy Class of this dispenser is XX.0 and represents the accuracy of the delivery expressed as a plus or minus percentage of the delivered quantity”. The lettering shall be in Helvetica or Arial Bold font type, in all capitals, and no less than 3/16 inch (0.48 cm) height.
Note: The XX.0 is the Accuracy Class as stated on the certificate of approval issued by the California Department of Food and Agriculture after successful type evaluation, and is part of the identification information required in paragraph S.5. The rating represents the allowable limits of error expressed as a plus and minus value. For example, a dispenser approved and marked with a 3.0 Accuracy Class has an allowable maintenance tolerance in Table 2 ranging from plus three (+3) percent to minus three (-3) percent.

200
EXAMPLE:
N.3. Test Drafts. –The minimum test shall be one test draft at twice the declared minimum measured quantity and one test draft at approximately ten times the minimum measured quantity or 1 kg, whichever is greater. More tests may be performed over the range of normal quantities dispensed. (See T.3. Repeatability)
The test draft shall be made at flows representative of that during normal delivery. The pressure drop between the dispenser and the proving system shall not be greater than that for normal deliveries. The control of the flow (e.g., pipe work or valve(s) size, etc.) shall be such that the flow of the measuring system is maintained within the range specified by the manufacturer.
N.4.1. Master Meter (Transfer) Standard Test. –When comparing a measuring system with a calibrated transfer standard, the minimum test shall be one test draft at twice the declared minimum measured quantity and one test draft at approximately ten times the minimum measured quantity or 1 kg, whichever is greater. More tests may be performed over the range of normal quantities dispensed.
N.4.2. Gravimetric Tests. – The weight of the test drafts shall be equal to at least twice the amount delivered by the device at the declared minimum measured quantity and one test draft at approximately ten times the minimum measured quantity or 1 kg, whichever is greater. More tests may be performed over the range of normal quantities dispensed.
N.4.3 PVT Pressure Volume Temperature Test. – The minimum test with a calibrated volumetric standard shall be one test draft at twice the declared minimum measured quantity and one test draft at approximately ten times the minimum measured quantity or 1 kg, whichever is greater. More tests may be performed over the range of normal quantities dispensed.
N.6.1.1. Repeatability Tests. –Tests for repeatability should include a minimum of three consecutive test drafts of approximately the same size with no less than 1000 scale intervals (divisions), and be conducted under controlled conditions where variations in factors are reduced to minimize the effect on the results obtained.
THE ACCURACY CLASS OF THIS DISPENSER IS 3.0 AND REPRESENTS THE ACCURACY OF THE DELIVERY EXPRESSED AS A PLUS OR MINUS PERCENTAGE OF THE DELIVERED QUANTITY.

201
T.2. Tolerances. – The tolerances for hydrogen gas measuring devices are listed in Table T.2. Accuracy Classes and Tolerances for Hydrogen Gas-Measuring Devices.
Table T.2.
Accuracy Classes and Tolerances for Hydrogen Gas-Measuring Devices
Accuracy Class Application or Commodity
Being Measured Acceptance Tolerance
Maintenance Tolerance
2.0
Hydrogen gas as a vehicle fuel
1.5 % 2.0 %
3.0 1 2.0 % 3.0 %
5.0 1 4.0 % 5.0 %
10.0 2 5.0 % 10.0 %
1 The tolerance values for Accuracy Classes 3.0 and 5.0 hydrogen gas-measuring devices are applicable to devices installed prior to January 1, 2020.
2 The tolerance values for Accuracy Class 10.0 hydrogen gas-measuring devices are applicable to devices installed prior to January 1, 2018.
T.3. Repeatability. – When multiple tests are conducted at approximately the same flow rate and draft size greater than 1000 scale intervals (divisions), the range of the test results for the flow rate shall not exceed 40 % of the absolute value of the maintenance tolerance and the results of each test shall be within the applicable tolerance. See also Section 4002.9 - N.6.1.1. Repeatability Tests.
T.6. Tolerance –Minimum Measures Quantity (MMQ). The maximum error applicable to the minimum measured quantity is twice the applicable tolerance in Table T.2.
Note: Authority cited: Sections 12027 and 12107, Business and Professions Code. Reference: Section 12107, Business and Professions Code.
NOT ADOPTED Section 3.39. Hydrogen Gas-Measuring Devices – Tentative Code
This tentative code has only a trial or experimental status and is not intended to be enforced. The
requirements are designed for study prior to the development and adoption of a final code.
Requirements that apply to wholesale applications are under study and development by the U.S.
National Work Group for the Development of Commercial Hydrogen Measurement Standards.

202
Officials wanting to conduct an official examination of a device or system are advised to see
paragraph G‐A.3. Special and Unclassified Equipment.
(Tentative Code Added 2010)
4002.9. Section 3.39. Hydrogen Gas-Measuring Devices
A. Application
A.1. General. – This code applies to devices that are used for the measurement of hydrogen gas
in the vapor state used as a vehicle fuel.
A.2. Exceptions. – This code does not apply to: (a) Devices used solely for dispensing a product in connection with operations in which the
amount dispensed does not affect customer charges.
(b) The wholesale delivery of hydrogen gas.
(c) Devices used for dispensing a hydrogen gas with a hydrogen fuel index lower than 99.97 %
and concentrations of specified impurities that exceed level limits.
(d) Systems that measure pressure, volume, and temperature with a calculating device to
determine the mass of gas accumulated in or discharged from a tank of known volume.
A.3. Additional Code Requirements. – In addition to the requirements of this code, Hydrogen
Gas‐Measuring Devices shall meet the requirements of Section 1.10. General Code.
NOT ADOPTED A.4. Type Evaluation. – The National Type Evaluation Program
(NTEP) will accept for type evaluation only those devices that comply with all requirements of this
code.
S. Specifications
S.1. Indicating and Recording Elements.
S.1.1. Indicating Elements. – A measuring assembly shall include an indicating element
that continuously displays measurement results relative to quantity and total price. Indications
shall be clear, definite, accurate, and easily read under normal conditions of operation of the
device.
S.1.2. Vehicle Fuel Dispensers. – A hydrogen gas dispenser used to fuel vehicles shall be of the computing type and shall indicate the mass, the unit price, and the total price of each
delivery.

203
S.1.3. Units.
S.1.3.1. Units of Measurement. – Deliveries shall be indicated and recorded in
kilograms and decimal subdivisions thereof.
S.1.3.2. Numerical Value of Quantity‐Value Divisions. – The value of an interval (i.e.,
increment or scale division) shall be equal to:
(a) 1, 2, or 5; or
(b) a decimal multiple of submultiple of 1, 2, or 5.
Examples: quantity‐value divisions may be 10, 20, 50, 100; or 0.01, 0.02, 0.05; or 0.1,
0.2, or 0.5 etc.
S.1.3.3. Maximum Value of Quantity‐Value Divisions. – The maximum value of the
quantity‐value division shall be not greater than 0.5% of the minimum measured quantity.
S.1.3.4. Values Defined. – Indicated values shall be adequately defined by a sufficient
number of figures, words, symbols, or combinations thereof. A display of “zero” shall be
a zero digit for all displayed digits to the right of the decimal mark and at least one to the
left.
S.1.4. Value of Smallest Unit. – The value of the smallest unit of indicated delivery, and
recorded delivery if the device is equipped to record, shall not exceed the equivalent of:
(a) 0.001 kg on devices with a marked maximum flow rated of 30 kg/min or less;
or
(b) 0.01 kg on devices with a marked maximum flow rate of more than 30 kg/min. S.2. Operating Requirements.
S.2.1. Return to Zero.
(a) The primary indicating and the primary recording elements, if the device is
equipped to record, shall be provided with a means for readily returning the
indication to zero either automatically or manually.
(b) It shall not be possible to return primary indicating elements, or primary
recording elements, beyond the correct zero position. S.2.2. Indicator Reset Mechanism. – The reset mechanism for the indicating element shall
not be operable during a delivery. Once the zeroing operation has begun, it shall not be possible
to indicate a value other than the latest measurement, or “zeros” when the zeroing operation
has been completed.
S.2.3. Provision for Power Loss.

204
S.2.3.1. Transaction Information. – In the event of a power loss, the information needed
to complete any transaction in progress at the time of the power loss (such as the quantity
and unit price, or sales price) shall be determinable for at least 15 minutes at the dispenser
or at the console if the console is accessible to the customer.
S.2.3.2. User Information. – The device memory shall retain information on the quantity
of fuel dispensed and the sales price totals during power loss.
S.2.4. Display of Unit Price and Product Identity.
S.2.4.1. Unit Price. – A computing or money‐operated device shall be able to display on
each face the unit price at which the device is set to compute or to dispense.
S.2.4.2. Product Identity. – A device shall be able to conspicuously display on each side
the identity of the product being dispensed.
S.2.4.3. Selection of Unit Price. – When a product is offered for sale at more than on unit
price through a computing device, the selection of the unit price shall be made prior to
delivery using controls on the device or other customer‐activated controls. A system shall
not permit a change to the unit price during delivery of a product.
S.2.4.4. Agreement Between Indications. – All quantity, unit price, and total price
indications within a measuring system shall agree for each transaction.
S.2.5. Money-Value Computations. – A computing device shall compute the total sales
price at any single‐purchase unit price for which the product being measured is offered for sale
at any delivery possible within either the measurement range of the device or the range of the
computing elements, whichever is less.
S.2.5.1. Auxiliary Elements. – If a system is equipped with auxiliary indications, all
indicated money value and quantity divisions of the auxiliary element shall be identical
with those of the primary element.
S.2.5.2. Display of Quantity and Total Price. – When a delivery is completed, the total
price and quantity for that transaction shall be displayed on the face of the dispenser for at
least 5 minutes or until the next transaction is initiated by using controls on the device or
other user‐activated controls. S.2.6. Recorded Representations, Point of Sale Systems. – A printed receipt shall be available through a built‐in or separate recording element for transactions conducted with
point‐or‐sale systems or devices activated by debit cards, credit cards, and/or cash. The printed
receipt shall contain the following information for products delivered by the dispenser:

205
(a) the total mass of the delivery;
(b) the unit price;
(c) the total computed price; and
(d) the product identity by name, symbol, abbreviation, or code number.
S.2.7. Indication of Delivery. – The device shall automatically show on its face the initial
zero condition and the quantity delivered (up to the nominal capacity).
S.3. Design of Measuring Elements and Measuring Systems.
S.3.1. Maximum and Minimum Flow-Rates. – The ratio of the maximum to minimum
flow‐rates specified by the manufacturer for devices measuring gases shall be 10:1 or greater.
S.3.2. Adjustment Means. – An assembly shall be provided with means to change the
ratio between the indicated quantity and the quantity of gas measured by the assembly. A
bypass on the measuring assembly shall not be used for these means.
S.3.2.1. Discontinuous Adjusting Means. – When the adjusting means changes ratio
between the indicated quantity and the quantity of measured gas in a discontinuous
manner, the consecutive values of the ratio shall not differ by more than 0.1 %.
S.3.3. Provision for Sealing. – Adequate provision shall be made for an approved means
of security (e.g., data change audit trail) or physically applying security seals in such a manner
that no adjustment may be made of:
(a) each individual measurement element;
(b) any adjustable element for controlling delivery rate when such rate tends to affect the
accuracy of deliveries;
(c) the zero adjustment mechanism; and
(d) any metrological parameter that detrimentally affects the metrological integrity of the
device or system.
When applicable, the adjusting mechanism shall be readily accessible for purposes of affixing a
security seal. Audit trails shall use the format set forth in Table S.3.3. Categories of Device and
Methods of Sealing.

206
Table S.3.3.
Categories of Device and Methods of Sealing
Categories of Device Method of Sealing
Category 1: No remote
configuration capability.
Seal by physical seal or two event counters: one for
calibration parameters and one for configuration
parameters.
Category 2: Remote configuration
capability, but access is controlled by
physical hardware.
The device shall clearly indicate that it
is in the remote configuration mode
and record such message if capable of
printing in this mode or shall not
operate while in this mode.
The hardware enabling access for remote
communication must be on‐site. The hardware must
be sealed using a physical seal or an event counter for
calibration parameters and an event counter for
configuration parameters. The event counters may
be located either at the individual measuring device
or at the system controller; however, an adequate
number of counters must be provided to monitor the
calibration and configuration parameters of the
individual devices at a location. If the counters are
located in the system controller rather than at the
individual device, means must be provided to
generate a hard copy of the information through an
on‐site device.
Category 3: Remote configuration
capability access may be unlimited or
controlled through a software switch
(e.g., password).
The device shall clearly indicate that it
is in the remote configuration mode
and record such message if capable of
printing in this mode or shall not
operate while in this mode.
An event logger is required in the device; it must
include an event counter (000 to 999), the parameter
ID, the date and time of the change, and the new value
of the parameter. A printed copy of the information
must be available through the device or through
another on‐site device. The event logger shall have a
capacity to retain records equal to 10 times the number
of sealable parameters in the device, but not more than
1000 records are required. (Note: Does not require
1000 changes to be stored for each parameter.)
S.3.4. Automatic Density Correction.
(a) An automatic means to determine and correct for changes in product density shall be
incorporated in any hydrogen gas‐measuring system where measurements are
affected by changes in the density of the product being measured.
(b) Volume‐measuring devices with automatic temperature compensation used to
measure hydrogen gas as a vehicle fuel shall be equipped with an automatic means to
determine and correct for changes in product density due to changes in the
temperature, pressure, and composition of the product.

207
S.3.5. Pressurizing the Discharge Hose. – The discharge hose for hydrogen gas shall automatically pressurize to a pressure equal to or greater than the receiving vessel prior to the
device beginning to register the delivery. The indications shall not advance as a result of the
initial pressurization or the purging/bleeding of the discharge hose.
S.3.6. Zero-Set-Back Interlock, Retail Vehicle Fuel Devices.
(a) A device shall be constructed so that:
(1) when the device is shut‐off at the end of a delivery an automatic interlock prevents
a subsequent delivery until the indicating element and recording elements, if the
device is equipped and activated to record, have been returned to their zero
positions; and
(2) it shall not be possible to return the discharge nozzle to its start position unless the
zero set back interlock is engaged or becomes engaged.
(b) For systems with more than one:
(1) dispenser supplied by a single measuring element, an effective automatic
control valve in each dispenser prevents product from being delivered until
the indicating elements on that dispenser are in a correct zero position; or
(2) hose supplied by a single measuring element, effective automatic means
must be provided to prevent product from being delivered until the
indicating element(s) corresponding to each hose are in a correct zero
position. S.4. Discharge Lines and Valves.
S.4.1. Diversion of Measured Product. – No means shall be provided by which any
measured product can be diverted from the measuring device.
S.4.2. Directional Flow Valves. – If a reversal of flow could result in errors that exceed the tolerance for the minimum measured quantity, a valve or valves or other effective means,
automatic in operation (and equipped with a pressure limiting device, if necessary) to prevent
the reversal of flow shall be properly installed in the system. (See N.1. Minimum Measured
Quantity)
S.4.3. Other Valves. – Check valves and closing mechanisms that are not used to define the
measured quantity shall have relief valves (if necessary) to dissipate any abnormally high
pressure that may arise in the measuring assembly.

208
S.5. Markings. – A measuring system shall be conspicuously, legibly, and indelibly marked with the
following information:
(a) pattern approval mark (i.e., type approval number);
(b) name and address of the manufacturer or his trademark and, if required by the
weights and measures authority, the manufacturerʹs identification mark in addition
to the trademark;
(c) model designation or product name selected by the manufacturer;
(d) nonrepetitive serial number;
(e) the accuracy class of the device as specified by the manufacturer consistent with Table T.2.
Accuracy Classes and Tolerances for Hydrogen‐Gas Measuring Devices;
(f) maximum and minimum flow rates in kilograms per unit of time;
(g) maximum working pressure;
(h) applicable range of ambient temperature if other than –10 °C to + 50 °C;
(i) minimum measured quantity; and
(j) product limitations (such as fuel quality), if applicable.
S.5.1. Location of Marking Information; Hydrogen-Fuel Dispensers. – The marking information
required in General Code, paragraph G S.1. Identification shall appear as follows:
(a) within 60 cm (24 in) to 150 cm (60 in) from the base of the dispenser;
(b) either internally and/or externally provided the information is permanent and easily
read; and accessible for inspection; and
(c) on a portion of the device that cannot be readily removed or interchanged (i.e., not on
a service access panel).
Note: The use of a dispenser key or tool to access internal marking information is permitted for retail hydrogen-measuring devices.

209
S.6. Printer. – When an assembly is equipped with means for printing the measured quantity, the
printed information must agree with the indications on the dispenser for the transaction and the
printed values shall be clearly defined.
S.6.1. Printed Receipt. – Any delivered, printed quantity shall include an identification number, the time and date, and the name of the seller. This information may be printed by the
device or pre‐printed on the ticket.
S.7. Totalizers for Vehicle Fuel Dispensers. – Vehicle fuel dispensers shall be equipped with a
nonresettable totalizer for the quantity delivered through each separate measuring device.
4002.9 Hydrogen Gas‐Measuring Devices (3.39)
S.5.2. Location of Accuracy Class 3.0, 5.0, and 10.0 Information: An additional Accuracy Class
statement shall be placed adjacent to the
quantity display on the face for the dispenser
and shall be conspicuously, legibly, and
indelibly marked with a statement such as
“The Accuracy Class of this dispenser is
XX.0 and represents the accuracy of
the delivery expressed as a plus or
minus percentage of the delivered quantity”.
The lettering shall be in Helvetica or Arial
Bold font type, in all capitals, and no less than
3/16 inch (0.48 cm) height.
Note: The XX.0 is the Accuracy Class as stated on the certificate of approval issued by the
California Department of Food and Agriculture after successful type evaluation, and is part of the
identification information required in paragraph S.5. The rating represents the allowable limits of
error expressed as a plus and minus value. For example, a dispenser approved and marked with
a 3.0 Accuracy Class has an allowable maintenance tolerance in Table 2 ranging from plus three
(+3) percent to minus three (‐3) percent.
EXAMPLE:
THE ACCURACY CLASS OF THIS DISPENSER IS 3.0 AND
REPRESENTS THE ACCURACY OF THE DELIVERY EXPRESSED
AS A PLUS OR MINUS PERCENTAGE OF THE DELIVERED QUANTITY.

210
S.8. Minimum Measured Quantity. – The minimum measured quantity shall satisfy the conditions
of use of the measuring system as follows:
(a) Measuring systems having a maximum flow rate less than or equal to 4 kg/min
shall have a minimum measured quantity not exceeding 0.5 kg.
(b) Measuring systems having a maximum flow rate greater than 4 kg/min but not
greater than 12 kg/min shall have a minimum measured quantity not exceeding
1.0 kg.
N. Notes
N.1. Minimum Measured Quantity. – The minimum measured quantity shall be specified by the
manufacturer.
N.2. Test Medium. – The device shall be tested with the product commercially measured except
that, in a type evaluation examination, hydrogen gas as specified in NIST Handbook 130 shall be
used.
Note: Corresponding requirements are under development and this paragraph will be revisited.
NOT ADOPTED N.3. Test Drafts. – The minimum test shall be one test draft at the
declared minimum measured quantity and one test draft at approximately ten times the minimum
measured quantity or 1 kg, whichever is greater. More tests may be performed over the range of
normal quantities dispensed. (See T.3. Repeatability)
The test draft shall be made at flows representative of that during normal delivery. The pressure
drop between the dispenser and the proving system shall not be greater than that for normal
deliveries. The control of the flow (e.g., pipework or valve(s) size, etc.) shall be such that the flow
of the measuring system is maintained within the range specified by the manufacturer.
4002.9 Hydrogen Gas‐Measuring Devices (3.39)
N.3. Test Drafts. –The minimum test shall be one test draft at twice the declared minimum measured quantity and one test draft at approximately ten times the minimum measured quantity or 1 kg, whichever is greater. More tests may be performed over the range of normal quantities dispensed. (See T.3. Repeatability)
The test draft shall be made at flows representative of that during normal delivery. The pressure drop between the dispenser and the proving system shall not be greater than that for normal deliveries. The control of the flow (e.g., pipe work or valve(s) size, etc.) shall be such that the flow of the measuring system is maintained within the range specified by the manufacturer.

211
N.4. Tests.
NOT ADOPTED N.4.1. Master Meter (Transfer) Standard Test. – When comparing
a measuring system with a calibrated transfer standard, the minimum test shall be one test draft
at the declared minimum measured quantity and one test draft at approximately ten times the
minimum measured quantity or 1 kg, whichever is greater. More tests may be performed over
the range of normal quantities dispensed.
N.4.1.1. Verification of Master Metering Systems. – A master metering system used to
verify a hydrogen gas‐measuring device shall be verified before and after the verification
process. A master metering system used to calibrate a hydrogen gas‐measuring device shall
be verified before starting the calibration and after the calibration process.
NOT ADOPTED N.4.2. Gravimetric Tests. – The weight of the test drafts shall be equal to
at least the amount delivered by the device at the declared minimum measured quantity and one
test draft at approximately ten times the minimum measured quantity or 1 kg, whichever is greater.
More tests may be performed over the range of normal quantities dispensed.
4002.9 Hydrogen Gas‐Measuring Devices (3.39)
N.4.2. Gravimetric Tests. – The weight of the test drafts shall be equal to at least twice the
amount delivered by the device at the declared minimum measured quantity and one test draft
at approximately ten times the minimum measured quantity or 1 kg, whichever is greater. More
tests may be performed over the range of normal quantities dispensed.
4002.9 Hydrogen Gas‐Measuring Devices (3.39)
N.4.1. Master Meter (Transfer) Standard Test. –When comparing a measuring system with a
calibrated transfer standard, the minimum test shall be one test draft at twice the declared
minimum measured quantity and one test draft at approximately ten times the minimum
measured quantity or 1 kg, whichever is greater. More tests may be performed over the range
of normal quantities dispensed.

212
NOT ADOPTED N.4.3. PVT Pressure Volume Temperature Test. – The minimum test with
a calibrated volumetric standard shall be one test draft at the declared minimum measured quantity
and one test draft at approximately ten times the minimum measured quantity or 1 kg, whichever
is greater. More tests may be performed over the range of normal quantities dispensed.
4002.9 Hydrogen Gas‐Measuring Devices (3.39)
N.4.3 PVT Pressure Volume Temperature Test. – The minimum test with a calibrated
volumetric standard shall be one test draft at twice the declared minimum measured
quantity and one test draft at approximately ten times the minimum measured quantity or
1 kg, whichever is greater. More tests may be performed over the range of normal quantities
dispensed.
N.5. Minimum Measured Quantity. – The device shall be tested for a delivery equal to the declared minimum measured quantity when the device is likely to be used to make deliveries on
the order of the declared minimum measured quantity.
N.6. Testing Procedures.
N.6.1. General. – The device or system shall be tested under normal operating conditions
of the dispenser.
The test draft shall be made at flows representative of that during normal delivery. The pressure
drop between the dispenser and the proving system shall not be greater than that for normal
deliveries. The control of the flow (e.g., pipework or valve(s) size, etc.) shall be such that the
flow of the measuring system is maintained within the range specified by the manufacturer.
NOT ADOPTED N.6.1.1. Repeatability Tests. – Tests for repeatability should
include a minimum of three consecutive test drafts of approximately the same size and be conducted
under controlled conditions where variations in factors are reduced to minimize the effect on the
results obtained.
4002.9 Hydrogen Gas‐Measuring Devices (3.39)
N.6.1.1. Repeatability Tests. –Tests for repeatability should include a minimum of three
consecutive test drafts of approximately the same size with no less than 1000 scale intervals
(divisions), and be conducted under controlled conditions where variations in factors are
reduced to minimize the effect on the results obtained.

213
N.7. Density. – Temperature and pressure of hydrogen gas shall be measured during the test for
the determination of density or volume correction factors when applicable. For the thermophysical
properties of hydrogen the following publications shall apply: for density calculations at
temperatures above 255 K and pressures up to 120 MPa, a simple relationship may be used that is
given in the publication of Lemmon et al., J. Res. NIST, 2008. Calculations for a wider range of
conditions and additional thermophysical properties of hydrogen are available free of charge online
at the “NIST Chemistry WebBook” http://webbook.nist.gov/chemistry, or available for purchase
from NIST as the computer program NIST Standard Reference Database 23 “NIST Reference Fluid
Thermodynamic and Transport Properties Database (REFPROP): Version 8.0”
http://www.nist.gov/srd/nist23.cfm. These calculations are based on the reference Leachman, J.W.,
Jacobsen, R.T, Lemmon, E.W., and Penoncello, S.G. “Fundamental Equations of State for
Parahydrogen, Normal Hydrogen, and Orthohydrogenʺ to be published in the Journal of Physical
and Chemical Reference Data (http://www.nist.gov/manuscript‐publication‐
search.cfm?pub_id=832374). More information may be obtained from NIST online at
http://www.boulder.nist.gov/div838/Hydrogen/Index.htm.
T. Tolerances
T.1. Tolerances, General.
(a) The tolerances apply equally to errors of underregistration and errors of overregistration.
(b) The tolerances apply to all products at all temperatures measured at any flow rate
within the rated measuring range of the device.
NOT ADOPTED T.2. Tolerances. – The tolerances for hydrogen gas measuring devices
are listed in Table T.2. Accuracy Classes and Tolerances for Hydrogen Gas‐Measuring Devices.
(Proposed tolerance values are based on previous work with compressed gas products and will be
confirmed based on performance data evaluated by the U.S. National Work Group.)
NOT ADOPTED
Table T.2.
Accuracy Classes and Tolerances for Hydrogen Gas‐Measuring Devices
4002.9 Hydrogen Gas‐Measuring Devices (3.39)
T.2. Tolerances. – The tolerances for hydrogen gas measuring devices are listed in Table T.2.
Accuracy Classes and Tolerances for Hydrogen Gas‐Measuring Devices.

214
Accuracy
Class
Application or Commodity Being
Measured
Acceptance
Tolerance
Maintenance
Tolerance
2.0 Hydrogen gas as a vehicle fuel 1.5 % 2.0 %
4002.9 Hydrogen Gas‐Measuring Devices (3.39)
Table T.2.
Accuracy Classes and Tolerances for Hydrogen Gas‐Measuring Devices
Accuracy Class
Application or Commodity Being
Measured
Acceptance
Tolerance
Maintenance
Tolerance
2.0
Hydrogen gas as a vehicle fuel
1.5 % 2.0 %
3.0 1 2.0 % 3.0 %
5.0 1 4.0 % 5.0 %
10.0 2 5.0 % 10.0 %
1 The tolerance values for Accuracy Classes 3.0 and 5.0 hydrogen gas‐measuring devices are
applicable to devices installed prior to January 1, 2020.
2 The tolerance values for Accuracy Class 10.0 hydrogen gas‐measuring devices are applicable to
devices installed prior to January 1, 2018.
NOT ADOPTED T.3. Repeatability. – When multiple tests are conducted at approximately
the same flow rate and draft size, the range of the test results for the flow rate shall not exceed 40 % of
the absolute value of the maintenance tolerance and the results of each test shall be within the
applicable tolerance. See also N.6.1.1. Repeatability Tests.

215
4002.9 Hydrogen Gas‐Measuring Devices (3.39)
T.3. Repeatability. – When multiple tests are conducted at approximately the same flow rate and
draft size greater than 1000 scale intervals (divisions), the range of the test results for the flow rate
shall not exceed 40 % of the absolute value of the maintenance tolerance and the results of each test
shall be within the applicable tolerance. See also Section 4002.9 ‐ N.6.1.1. Repeatability Tests.
T.4. Tolerance Application on Test Using Transfer Standard Test Method. – To the basic tolerance values that would otherwise be applied, there shall be added an amount equal to two times the standard
deviation of the applicable transfer standard when compared to a basic reference standard.
T.5. Tolerance Application in Type Evaluation Examinations for Devices. – For type evaluation examinations, the tolerance values shall apply under the following conditions:
(a) at any temperature and pressure within the operating range of the device, and
(b) for all quantities greater than the minimum measured quantity.
4002.9 Hydrogen Gas‐Measuring Devices (3.39)
T.6. Tolerance –Minimum Measures Quantity (MMQ). The maximum error applicable to the
minimum measured quantity is twice the applicable tolerance in Table T.2.
UR. User Requirements
UR.1. Selection Requirements.
UR.1.1. Computing-Type Device; Retail Dispenser. – A hydrogen gas dispenser used to refuel vehicles shall be of the computing type and shall indicate the mass, the unit price, and the total price
of each delivery.
UR.1.2. Discharge Hose-Length. – The length of the discharge hose on a retail fuel dispenser:
(a) shall not exceed 4.6 m (15 ft) unless it can be demonstrated that a longer hose is
essential to permit deliveries to be made to receiving vehicles or vessels;
(b) shall be measured from its housing or outlet of the discharge line to the inlet of the
discharge nozzle; and

216
(c) shall be measured with the hose fully extended if it is coiled or otherwise retained
or connected inside a housing. An unnecessarily remote location of a device shall not be accepted as justification for an abnormally
long hose.
UR.1.3. Minimum Measured Quantity.
(a) The minimum measured quantity shall be specified by the manufacturer.
(b) The minimum measured quantity appropriate for a transaction may be specified by the
weights and measures authority. A device may have a declared minimum measured
quantity smaller than that specified by the weights and measures authority; however, the
device must perform within the performance requirements for the declared or specified
minimum measured quantity up to deliveries at the maximum measurement range.
(c) The minimum measured quantity shall satisfy the conditions of use of the measuring
system as follows:
(1) Measuring systems having a maximum flow rate less than or equal to 4 kg/min
shall have a minimum measured quantity not exceeding 0.5 kg
(2) Measuring systems having a maximum flow rate greater than 4 kg/min but not greater
than 12 kg/min shall have a minimum measured quantity not exceeding 1.0 kg
UR.2. Installation Requirements.
UR.2.1. Manufacturer’s Instructions. – A device shall be installed in accordance with the
manufacturer’s instructions, and the installation shall be sufficiently secure and rigid to maintain
this condition.
UR.2.2. Discharge Rate. – A device shall be installed so that after initial equalization the actual maximum discharge rate will not exceed the rated maximum discharge rate. Automatic means of
flow regulation shall be incorporated in the installation if necessary. UR.2.3. Low-Flow Cut-Off Valve. – If a measuring system is equipped with a programmable or
adjustable ʺlow‐flow cut‐offʺ feature:
(a) the low‐flow cut‐off value shall not be set at flow rates lower than the minimum
operating flow rate specified by the manufacturer on the measuring device; and
(b) the system shall be equipped with flow control valves which prevent the flow of
product and stop the indicator from registering product flow whenever the product
flow rate is less than the low‐flow cut‐off value.

217
UR.3. Use of Device.
UR.3.1. Unit Price and Product Identity for Retail Dispensers. – The unit price at which
the dispenser is set to compute shall be conspicuously displayed or posted on the face of a
retail dispenser used in direct sale.
UR.3.2. Vehicle-mounted Measuring Systems Ticket Printer.
UR.3.2.1. Customer Ticket. – Vehicle‐mounted measuring systems shall be equipped
with a ticket printer which shall be used for all sales where product is delivered
through the device. A copy of the ticket issued by the device shall be left with the
customer at the time of delivery or as otherwise specified by the customer.
UR.3.2.2. Ticket in Printing Device. – A ticket shall not be inserted into a device
equipped with a ticket printer until immediately before a delivery is begun, and in no
case shall a ticket be in the device when the vehicle is in motion while on a public street,
highway, or thoroughfare.
UR.3.3. Printed Ticket. – The total price, the total quantity of the delivery, and the price per unit shall be printed on any ticket issued by a device of the computing type and containing any one of
these values.
UR.3.4. Steps After Dispensing. – After delivery to a customer from a retail dispenser:
(a) the device shall be shut‐off at the end of a delivery, through an automatic interlock
that prevents a subsequent delivery until the indicating elements and recording
elements, if the device is equipped and activated to record, have been returned to
their zero positions; and
(b) the discharge nozzle shall not be returned to its start position unless the zero set‐back interlock is engaged or becomes engaged by the act of disconnecting the
nozzle or the act of returning the discharge nozzle.
UR.3.5. Return of Indicating and Recording Elements to Zero. – The primary indicating
elements (visual), and the primary recording elements shall be returned to zero
immediately before each delivery.
UR.3.6. Return of Product to Storage, Retail Hydrogen Gas Dispensers. – Provisions at the site shall be made for returning product to storage or disposing of the product in a safe
and timely manner during or following testing operations. Such provisions may include
return lines, or cylinders adequate in size and number to permit this procedure.
UR.3.7. Conversion Factors. – Established correction values (see references in N.7.
Density.) shall be used whenever measured hydrogen gas is billed. All sales shall be based
on kilograms.

218
Appendix D. Definitions
The specific code to which the definition applies is shown in [brackets] at the end of the
definition. Definitions for the General Code [1.10] apply to all codes in Handbook 44.
A
audit trail. – An electronic count and/or information record of the changes to the values of
the calibration or configuration parameters of a device.[1.10, 2.20, 2.21, 2.24, 3.30, 3.37, 3.39,
5.56(a)]
automatic temperature or density compensation. – The use of integrated or ancillary
equipment to obtain from the output of a volumetric meter an equivalent mass, or an
equivalent liquid volume at the assigned reference temperature below and a pressure of
14.696 lb/in2 absolute.
Cryogenic liquids 21 °C (70 °F) [3.34]
Hydrocarbon gas vapor 15 °C (60 °F) [3.33]
Hydrogen gas 21 °C (70 °F) [3.39]
Liquid carbon dioxide 21 °C (70 °F) [3.38]
Liquefied petroleum gas (LPG)
and Anhydrous ammonia 15 °C (60 °F) [3.32]
Petroleum liquid fuels and lubricants 15 °C (60 °F) [3.30]
C
calibration parameter. – Any adjustable parameter that can affect measurement or
performance accuracy and, due to its nature, needs to be updated on an ongoing basis to
maintain device accuracy (e.g., span adjustments, linearization factors, and coarse zero
adjustments).[2.20, 2.21, 2.24, 3.30, 3.37, 3.39, 5.56(a)]
D
discharge hose. – A flexible hose connected to the discharge outlet of a measuring device or
its discharge line.[3.30, 3.31, 3.32, 3.34, 3.37, 3.38, 3.39]
discharge line. – A rigid pipe connected to the outlet of a measuring device.[3.30, 3.31, 3.32,
3.34, 3.37, 3.39]
E
event counter. – A nonresettable counter that increments once each time the mode that
permits changes to sealable parameters is entered and one or more changes are made to
sealable calibration or configuration parameters of a device.[2.20, 2.21, 3.30, 3.37, 3.39, 5.54,
5.56(a), 5.56(b), 5.57]
event logger. – A form of audit trail containing a series of records where each record contains
the number from the event counter corresponding to the change to a sealable parameter, the
identification of the parameter that was changed, the time and date when the parameter was
changed, and the new value of the parameter.[2.20, 2.21, 3.30, 3.37, 3.39, 5.54, 5.56(a), 5.56(b),
5.57]

219
I
indicating element. – An element incorporated in a weighing or measuring device by means
of which its performance relative to quantity or money value is ʺreadʺ from the device itself
as, for example, an index‐and‐graduated‐scale combination, a weighbeam‐and‐poise
combination, a digital indicator, and the like. (Also see ʺprimary indicating or recording
element.ʺ)[1.10]
M
minimum measured quantity (MMQ). – The smallest quantity delivered for which the
measurement is to within the applicable tolerances for that system.[3.37, 3.39]
N
nonresettable totalizer. – An element interfaced with the measuring or weighing element
that indicates the cumulative registration of the measured quantity with no means to return
to zero.[3.30, 3.37, 3.39]
P
point‐of‐sale system. – An assembly of elements including a weighing or measuring
element, an indicating element, and a recording element (and may also be equipped with a
“scanner”) used to complete a direct sales transaction.[2.20, 3.30, 3.32, 3.37, 3.39]
R
remote configuration capability. – The ability to adjust a weighing or measuring device or
change its sealable parameters from or through some other device that is not itself necessary
to the operation of the weighing or measuring device or is not a permanent part of that
device.[2.20, 2.21, 2.24, 3.30, 3.37, 3.39, 5.56(a)]
retail device. – A measuring device primarily used to measure product for the purpose of
sale to the end user.[3.30, 3.32, 3.37, 3.39]
W
wet hose. – A discharge hose intended to be full of product at all times. (See ʺwet‐hose
type.ʺ)[3.30, 3.31, 3.38, 3.39]
wet‐hose type. – A type of device designed to be operated with the discharge hose full of
product at all times. (See ʺwet hose.ʺ)[3.30, 3.32, 3.34, 3.37, 3.38, 3.39]

220
APPENDIX H: NIST Handbook 130 Regulations for the Retail Sale of Hydrogen Fuel
2.32 Retail Sales of Hydrogen Fuel (H).
2.32.1 Definitions for Hydrogen Fuel. – A fuel composed of molecular hydrogen
intended for consumption in a surface vehicle or electricity production device with an
internal combustion engine or fuel cell.
(Amended 2012)
2.32.2 Method of Retail Sale and Dispenser Labeling. – All hydrogen fuel kept,
offered, or exposed for sale and sold at retail shall be in mass units in terms of the
kilogram. The symbol for hydrogen vehicle fuel shall be the capital letter “H” (the
word Hydrogen may also be used).
2.32.3 Retail Dispenser Labeling.
(a) A computing dispenser must display the unit price in whole cents on the
basis of price per kilogram.
(b) The service pressure(s) of the dispenser must be conspicuously shown on
the user interface in bar or the SI unit of pascal (Pa) (e.g., MPa).
(c) The product identity must be shown in a conspicuous location on the
dispenser.
(d) National Fire Protection Association (NFPA) labeling requirements also
apply.
(e) Hydrogen shall be labeled in accordance with 16 CFR 309 – FTC Labeling
Alternative Fuels.
2.32.4 Street Sign Prices and Advertisements.
(a) The unit price must be in terms of price per kilogram in whole cents (e.g.,
$3.49 per kg, not $3.499 per kg.)
(b) The sign or advertisement must include the service pressure (expressed in
megapascals) at which the dispenser(s) delivers hydrogen fuel (e.g., H35
or H70).
(added 2010)

221
APPENDIX I: Hydrogen Field Standard Parts and Identification List
Instrumentation
Description Manufacturer Part Number Accuracy Comments
Measuring Scales
Sartorius IS150IGG-H ± 1 gram Temperature compensated
Pressure Transducers
American Sensor Tech
AST2000 X00900B1F1494
± 0.5% BFSL
Stability (1 year) ± 0.25% FS
Thermocouples Ultra Precise P-M-1/10 1/10 of display
indication
Flow Meters Rheonik RHM04 Coriolis
FM 0.50%
Between 10 and 0.2 kg/min
Hydrogen Field Standard Components
Description Manufacturer Part Number MAWP (psi) Temp. Range
(°C)Inlet Connection
Nozzle Receptacle
WEH TN1 H2 70 MPa 12,690 psi -40 °C to 85 °C
On-Board Hydrogen Tanks
Process Tank 1 (58 liters W.V.)
Dynetek M058H700G6N-06C
12,690 psi -40 °C to 85 °C
Process Tank 2 (65 liters W.V.)
Lincoln Composites RG102B20-02727
12,690 psi -40 °C to 85 °C
Tubing Process Tubing High Pressure Equipment Company
29-9M6-316 20,000 psi -250 °C to 600 °C
Process Hoses Spir Star Type 6/2 Hose 14,500 psi -30 °C to 60 °C
Customer California Department of Food and Agriculture - Division of
Measurement Standards
Contact: Norman Ingram [email protected]
Supplier National Renewable Energy Laboratory
Contact: Rob Burgess [email protected]

222
Hydrogen Field Standard Components (continued)
Description Manufacturer Part Number MAWP (psi) Temp. Range
(°C)
Valves Ball Valves High Pressure Equipment Company
20-71LF6 20,000 psi Up to 175 °C
Straight Valves High Pressure Equipment Company
20-11LF6 20,000 psi Up to 230 °C
Check Valves High Pressure Equipment Company
20-41LF6 20,000 psi -
Tubing Process Tubing High Pressure Equipment Company
29-9M6-316 20,000 psi -250 °C to 600 °C
Process Hoses Spir Star Type 6/2 Hose 14,500 psi -30 °C to 60 °C
Valves Ball Valves High Pressure Equipment Company
20-71LF6 20,000 psi Up to 175 °C
Straight Valves High Pressure Equipment Company
20-11LF6 20,000 psi Up to 230 °C
Check Valves High Pressure Equipment Company
20-41LF6 20,000 psi -
Pressure Relief Valves
High Pressure Equipment Company
HIP-20RV 20,000 psi Up to 150 °C
Temperature Relief Valves
Dynetek PRD-700-01-0 12,691 psi -40 °C to 85 °C Set at 110 °C
Fittings Process Tees High Pressure Equipment Company
20-23LF6 20,000 psi -
Process Elbows High Pressure Equipment Company
20-22LF6 20,000 psi -
Hose Couplings Spir Star SPC-600 20,000 psi -

223
APPENDIX J Certificates of Analysis of Biodiesel and No. 2 Diesel Blend Stocks DMS Analysis of Petroleum Diesel Stock

224
Certificate of Analysis for Community Fuels Safflower/Canola B100

225
Certificate of Analysis for Community Fuels Soy B100

226
Certificate of Analysis for Yellow Grease B100

227
Certificate of Analysis for Yellow Grease B100

228
ACRONYMS
Acronym Definition
ATR Attenuated total reflectance
AET Atmospheric Equivalent Temperature
AET90 Atmospheric Equivalent Temperature at 90 volume percent recovered
AETf Atmospheric Equivalent Temperature at final boiling point (or stop point)
ARB California Air Resources Board
ASTM ASTM International (through 2001 known as the American Society for Testing
and Materials)
BCP Business and Professions Code
Bxx Designation of a biodiesel blend having “xx” volume percent biodiesel in it
CCR California Code of Regulations
CDFA California Department of Food and Agriculture
CFPP Cold Filter Plugging Point
CRDS Cavity Ring Down Spectrometry
DMS Division of Measurement Standards
ECD Electron capture detector used with a GC
FAME Fatty‐acid methyl ester(s)
FID Flame ionization detector used with a GC
FBP Final boiling point
FTIR Fourier Transform Infrared Spectrophotometer
GC Gas Chromatography or Gas Chromatograph
GC/MS Gas Chromatography with mass spectrometric detection
HFS Hydrogen Field Standard
HQSA Hydrogen Quality Sampling Apparatus
IC/CD Ion chromatography with conductivity detection
kPa kiloPascals ‐ a unit of pressure (SI unit pascal = 1 Newton per sq meter)
LTFT Low‐Temperature Flow Test

229
MDL Method detection limit
NBB National Biodiesel Board
NIST National Institute of Standards and Technology
PDHID Pulsed discharge helium ionization detector used with a GC
PFPD Pulsed flame photometric detector used with a GC
ppb Measurement of quantity ‐ parts per billion
ppm Measurement of quantity ‐ parts per million
REN21 The Renewable Energy Policy Network for the Twentieth Century
SAE SAE International (until 2006, known as Society of Automotive Engineers)
T90 Temperature of a sample at the 90 volume percent recovery point during a
distillation according to ASTM Method D86‐10a.
TCD Thermal conductivity detector used with a GC
UCO Used cooking oil, used as a feedstock in biodiesel production. Synonymous
with WCO.
U.S. EPA U. S. Environmental Protection Agency
USNWG U.S. National Work Group
WCO Waste cooking oil, used as a feedstock

230
GLOSSARY
μm – micrometer. A unit of length equal to one‐millionth of a meter.
acceptance tolerance – the accuracy tolerance applied to a weighing or measuring device
during type evaluation or after installation or repair (see accuracy tolerance)
accuracy tolerance – the acceptable error in the indicated delivery of a weighing or measuring
device
biodiesel – a manufactured mixture of esters of glycerin with straight chain fatty acids obtained
from plant or animal fats and oils
cetane number – a measure of the ignition delay of a diesel fuel in a compression ignition
engine relative to cetane (n‐hexadecane). In California, the CARB sets a minimum cetane
number of 53 (CCR Section 2282(h)).
compression ignition engine – an internal combustion engine using heat from the compression
of the mixture of air and fuel in the cylinders to ignite the fuel
cloud point – the temperature at which waxy material begins to precipitate out from a diesel or
biodiesel fuel. The cloud point is one measure of low temperature performance.
cold filter plugging point – the temperature at which a fuel sample first fails to pass through a
filter under the conditions specified in ASTM D6371‐05
cracking –decomposition of a distillation sample prior to the final boiling point
diesel fuel – a mixture of hydrocarbons refined from crude oil that meets the specifications of
ASTM D975‐10c for use in compression ignition engines. Diesel fuel may contain up to 5
volume percent biodiesel without special labeling.
distillation – a method of separating the components of a mixture based on differences in vapor
pressure by applying heat at a controlled rate
ester – an organic molecule formed by the condensation of a carboxylic acid with an organic
alcohol
fatty acid – a straight chain carboxylic acid with the general formula CnH2n+1COOH if saturated
or CnH2n‐1COOH if monounsaturated
feedstock – the raw oil or grease from which biodiesel is manufactured

231
flash point –the lowest temperature at which there is a sufficient quantity of vapor formed to
ignite under the conditions specified in ASTM D93‐10a.
hydrogen fuel – a) “A fuel composed of molecular hydrogen intended for consumption in a
surface vehicle or electricity producing device with an internal consumption engine or fuel
cell.” NIST Handbook 130 Section 2.32.1
b) “… a fuel composed of the chemical hydrogen intended for consumption in
an internal combustion engine or fuel cell.” CA BCP Section 13401
kinematic viscosity – a measure of the resistance to flow of a liquid taking its density into
account. Vehicle engines are designed to operate with fuel in a specified range of viscosity.
legal metrology – the regulatory framework governing the application of metrology to
commercial transactions to ensure the accuracy of commercial measurements, enhance
consumer protection, foster competition, and facilitate state and national economic growth and
trade
maintenance tolerance – the accuracy tolerance applied to a weighing or measuring (device
that has been in service for more than 30 days see accuracy tolerance)
metrology – the science of measurement, including means of traceability to recognized
standards and the determination of the uncertainty associated with a measured value
No. 1 Diesel – A middle‐distillate petroleum diesel fuel with a T90 equal to 550 °F and meeting
the specifications of ASTM D975‐10c.
No. 2 Diesel – A middle‐distillate petroleum diesel fuel with a T90 equal to 640 °F and meeting
the specifications of ASTM D975‐10c.
OEM(s) ‐ Original Equipment Manufacturer. Here, refers to engine and/or automobile
manufacturers
tallow – animal fat, usually beef or chicken, used as a feedstock for biodiesel production
triglyceride – a molecule of a fat or oil containing three straight chain fatty acids linked to a
glycerin molecule through ester bonds
used cooking oil – a feedstock for biodiesel production. See waste cooking oil.

232
waste cooking oil – oil that was used in food preparation, most often frying, by restaurants,
hotels, and other businesses and has been replaced because its quality has degraded. A
feedstock for biodiesel production. Synonymous with used cooking oil and waste vegetable oil.
waste vegetable oil – a feedstock for biodiesel production. See waste cooking oil.
yellow grease – a feedstock for biodiesel production. May refer to waste cooking oil or inedible
material from rendering plants
ZnSe ‐ Zinc Selenide ‐ An infrared‐transmitting crystal used in an ATR flow cell in FTIR
233
REFERENCES
ASTM Standard Specification D975‐10c, “Standard Specification for Diesel Fuel Oils,” ASTM
International, West Conshohocken, PA, 2010.
ASTM Standard Specification D6751‐10, “Standard Specification for Biodiesel Fuel Blend Stock
(B100) for Middle Distillate Fuels,” ASTM International, West Conshohocken, PA, 2010.
ASTM Standard Specification D7467‐10, “Standard Specification for Diesel Fuel Oil, Biodiesel
Blend (B6 to B20),” ASTM International, West Conshohocken, PA, 2010.
ASTM Standard Test Method D86‐10a, “Standard Test Method for Distillation of Petroleum
Products at Atmospheric Pressure,” ASTM International, West Conshohocken, PA, 2010.
ASTM Standard Test Method D93‐10a, “Standard Test Method for Flash Point by Pensky‐
Martens Closed Cup Tester,” ASTM International, West Conshohocken, PA, 2010.
ASTM Standard Test Method D1160‐06, “Standard Test Method for Distillation of Petroleum
Products at Reduced Pressure,” ASTM International, West Conshohocken, PA, 2006.
ASTM Standard Test Method D2500‐09, “Standard Test Method for Cloud Point of Petroleum
Products,” ASTM International, West Conshohocken, PA, 2009.
ASTM Standard Test Method D2709‐96, “Standard Test Method for Water and Sediment in
Middle Distillate Fuels by Centrifuge,” ASTM International, West Conshohocken, PA, 1996.
ASTM Standard Test Method D6371‐05, “Standard Test Method for Cold Filter Plugging Point
of Diesel and Heating Fuels,” ASTM International, West Conshohocken, PA, 2005.
ASTM Standard Test Method D4539‐10, “Standard Test Method for Filterability of Diesel Fuels
by Low‐Temperature Flow Test (LTFT),” ASTM International, West Conshohocken, PA, 1985.
Beatrice, Carlo et al, “Technologies for energetic exploitation of biodiesel chain derived glycerol:
Oxy‐fuels production by catalytic conversion,” in Applied Energy 102, 63‐71 February 2013.
Abstract on‐line at sciencedirect.com/science/article/pii/S0306261912005752.
Carriquiry, M., “U.S. Biodiesel Production: Recent Developments and Prospects,” Iowa Ag
Review – online, Iowa State University (Center for Agriculture and Rural Development), Vol.
13 No. 2, 2007, <http://www.card.iastate.edu/iowa_ag_review/spring_07/article4.aspx>
accessed on January 19, 2012.
De Jong, Rob and Rik Suijker, “GC Analysis of Biodiesels: Compliance with International
Standards Using a Single System”, American Laboratory October 2012. Reprinted online at
http://www.paclp.com/content/documents/Press_Articles/ALM_October2012_web.pdf
accessed 7/10/13.

234
Giakoumis, Evangelos G. “A statistical investigation of biodiesel physical and chemical
properties, and their correlation with the degree of unsaturation,” Renewable Energy 58, 858‐
878, 2013. Abstract available on line at sciencedirect.com/science/article/pii/S0960148112004752.
Gregg, Forest, companion site for SVO: Powering Your Vehicle with Straight Vegetable Oil ,New
Society Publishers, 2008. bunkum.us/svo/fuel_property.html; bunkum.us/svo/fatty_acid.html
Hudgens, R., Hercamp, R., Francis, J., Nyman, D. et al., ʺAn Evaluation of Glycerin (Glycerol) as
a Heavy Duty Engine Antifreeze/Coolant Base,ʺ SAE Technical Paper 2007‐01‐4000, 2007,
doi:10.4271/2007‐01‐4000. http://papers.sae.org/2007‐01‐4000/
Knothe, Gerhard and Kevin R. Steidley, “Kinematic Viscosity of biodiesel fuel components and
related compounds. Fuel 84, 105901965, 2005. Abstract available on line at
http://naldc.nal.usda.gov/download/14427/PDF.
McCurry, James D. Agilent Application Note EN15779 – Gas Chromatographic Analysis of
Polyunstaruated FAME in Biodiesel Made From Algae and Marine Oils, 2011. Available
online at www.chem.agilent.com/Library/applications/5990‐8875EN.pdf. accessed 7/10/13.
Moser, Bryan R. , Aaron Williams, Michael J. Haas, and Robert L. McCormick, “Exhaust
emissions and fuel properties of partially hydrogenated soybean oil methyl esters blended
with ultra low sulfur diesel fuel “,Fuel Processing Technology 90, 1122‐1128 2009.
National Renewable Energy Laboratory, “Biodiesel Handling and Use Guide,” (Fourth Edition),
2009, National Biodiesel Board <http://www.biodiesel.org/what‐is‐biodiesel/biodiesel‐fact‐
sheets> accessed on January 10, 2012.
National Biodiesel Board, “Biodiesel and the U.S. Diesel Vehicle Market,” 2012,
<http://www.biodiesel.org/docs/ffs‐engine_manufacturers/2012‐diesel‐vehicle‐list.pdf>
accessed on May 1, 2012.
Ng, Hoon Kiat et al, “Simulation of biodiesel combustion in a light‐duty diesel engine using
integrated compact biodiesel–diesel reaction mechanism,” Applied Energy 102, 1275‐1287
2013.
NIST/SEMATECH e‐Handbook of Statistical Methods
http://www.itl.nist.gov/div898/handbook/April 2012
Pahl, Greg, Biodiesel: growing a new energy economy, Chelsea Green Publishing, White River
Junction, Vermont, 2005.
Renewable Energy Policy Network for the Twentieth Century (REN21), “Renewables 2010
Global Status Report,” 2010,
<http://www.ren21.net/REN21/REN21_GSR_2010_full_revised%20Sept2010.pdf> accessed on
March 13, 2012.
SAE International Standard J313 Diesel Fuels Section 5.6. 2004 Handbook, Warrendale PA. 2004.

235
Sanford, S.D., et. al., “Feedstock and Biodiesel Characteristics Report,” Renewable Energy
Group, Inc., 2009, <www.regfuel.com>
Schober, Sugurd et al “A method for the determination of polyunsaturated fatty acid methyl
esters in biodiesel: Results of an interlaboratory study,” European Journal of Lipid Science
and Technology, published online 8/26.09.
Schumacher, Leon, et. al. (University of Missouri). “The Physical and Chemical Characterization
of Biodiesel Low Sulfur Diesel Fuel Blends,” National Biodiesel Board, 1995
Sergeeva, Y.E.; Galanina, L. A.; Andrianova, D. A.; Feofilova, E. P. (2008). “Lipids of filamentous
fungi as a material for producing biodiesel fuel.” Applied Biochemistry and Microbiology 44
(5): 523. abstract doi: 10.1134/S0003683808050128 dx.doi.org/10.1134%2FS0003683808050128
U.S. Environmental Protection Agency. Draft Technical Report, “A Comprehensive Analysis of
Biodiesel Impacts on Exhaust Emissions,” EPA‐420‐P‐02‐001, 2002,
<http://www.epa.gov/OMS.models/biodsl.htm> accessed on January 26, 2012.
U.S. Environmental Protection Agency. “Technical Highlights: Biodiesel,” EPA‐420‐F‐10‐009,
2010, <http://www.epa.gov> accessed on February 2, 2012.