Embed Size (px)
Citation preview
Name: ___________________________________ Date: _________________
© Lincoln Public Schools, 2013 4th Grade Math
Chapter 14&15
Graph and Analyze Data
HW 14.3A
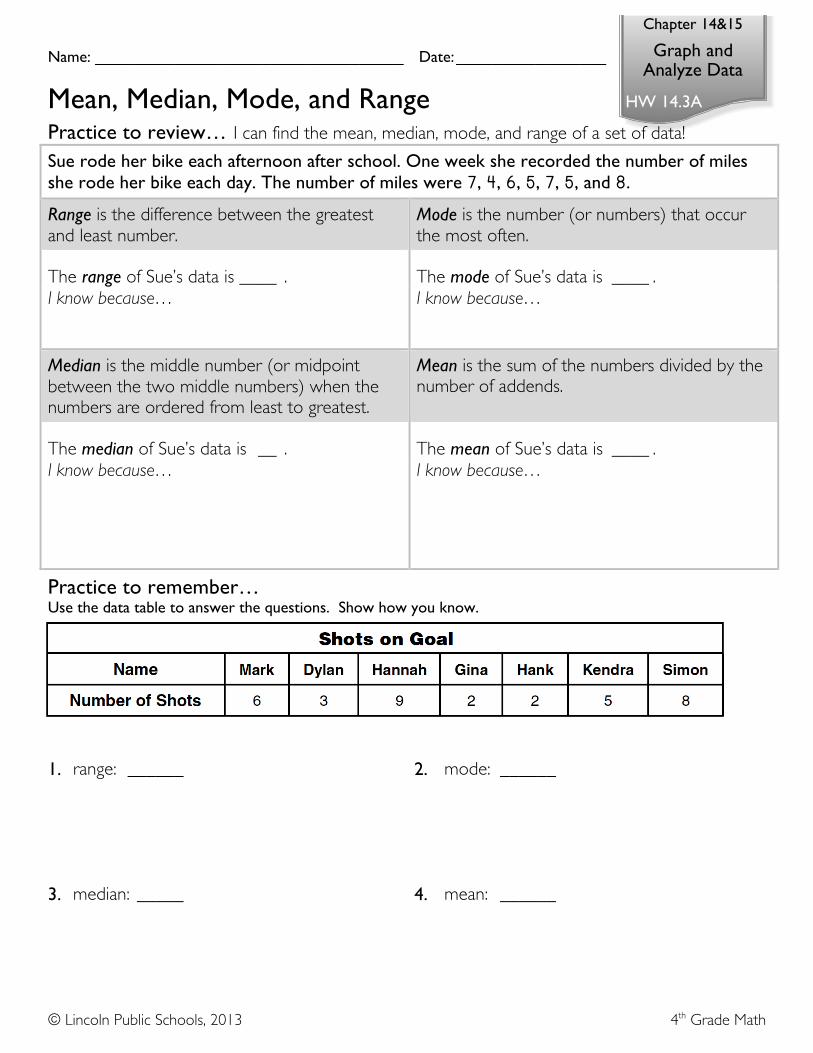
Mean, Median, Mode, and Range Practice to review… I can find the mean, median, mode, and range of a set of data! Sue rode her bike each afternoon after school. One week she recorded the number of miles she rode her bike each day. The number of miles were 7, 4, 6, 5, 7, 5, and 8.
Range is the difference between the greatest and least number.
Mode is the number (or numbers) that occur the most often.
The range of Sue’s data is ____ . The mode of Sue’s data is ____ . I know because… I know because…
Median is the middle number (or midpoint between the two middle numbers) when the numbers are ordered from least to greatest.
Mean is the sum of the numbers divided by the number of addends.
The median of Sue’s data is __ . The mean of Sue’s data is ____ . I know because… I know because…
Practice to remember… Use the data table to answer the questions. Show how you know.
1. range: ______ 2. mode: ______
3. median: _____ 4. mean: ______

Name: ___________________________________ Date: _________________
© Lincoln Public Schools, 2013 4th Grade Math
Chapter 14&15
Graph and Analyze Data
RE 14.3A
Remembering Practice for fluency… 5. The expression 2𝑛 + 5 represents the height of a
person. If 𝑛 is 20 inches, which expression represents a second person of the exact same height?
6. Circle the true statement.
a. 15 − 3 = 13 − 5
a. 3𝑛 − 5 b. 𝑛 + 35 b. 18 − 4 = 14 + 8
c. 𝑛 ÷ 4 × 9 d. 2𝑛 − 3 × 3
c. 5 − 3 + 1 = 5 − 3 + 1
d. 6 + 4 − 3 = 10 − 3
Use the rule. Find each missing value. Write a rule for the function table.
10.
7.
8.
9.
Answer each question. Use pictures, numbers, or words to show how you know.
11. John spent 1 hour 45 minutes watching his younger brother while his mom was not home. His mom left home at 2:15 P.M. What time did she return? Show how you know.
12. Notebooks cost $4 each at the school store. Chris has $15. How many notebooks can he buy? Show how you know.

Name: ___________________________________ Date: _________________
© Lincoln Public Schools, 2013 4th Grade Math
Chapter 14&15
Graph and Analyze Data
HW 14.3B
Mean, Median, Mode, and Range Practice to review… I can find the mean, median, mode, and range of a set of data! Sam kept track of the number of pages he read in his literature book each day last week.
This is Sam’s data. " 42, 13, 51, 51, 67, 62, 36
Range is the difference between the greatest and least number.
Mode is the number (or numbers) that occur the most often.
The range of Sam’s data is _____ . The mode of Sam’s data is ____ . I know because… I know because…
Median is the middle number (or midpoint between the two middle numbers) when the numbers are ordered from least to greatest.
Mean is the sum of the numbers divided by the number of addends.
The median of Sam’s data is ____ . The mean of Sam’s data is ____ . I know because… I know because…
Practice to remember… Find the mean, median, mode, and range of each set of data.
1. 34, 41, 37, 29, 33, 35, 43 2. 9, 22, 93, 31, 35, 37, 38, 31
range: ______
median: _____
mode: ______
mean: ______
range: ______
median: _____
mode: ______
mean: ______
3. Mary collected 31 rocks on Monday, 27 on Tuesday, 27 on Wednesday, 33 on Thursday, and 22 on Friday. What is the mean number of rocks she collected? Show how you know.
Name: ___________________________________ Date: _________________
© Lincoln Public Schools, 2013 4th Grade Math
Chapter 14&15
Graph and Analyze Data
RE 14.3B
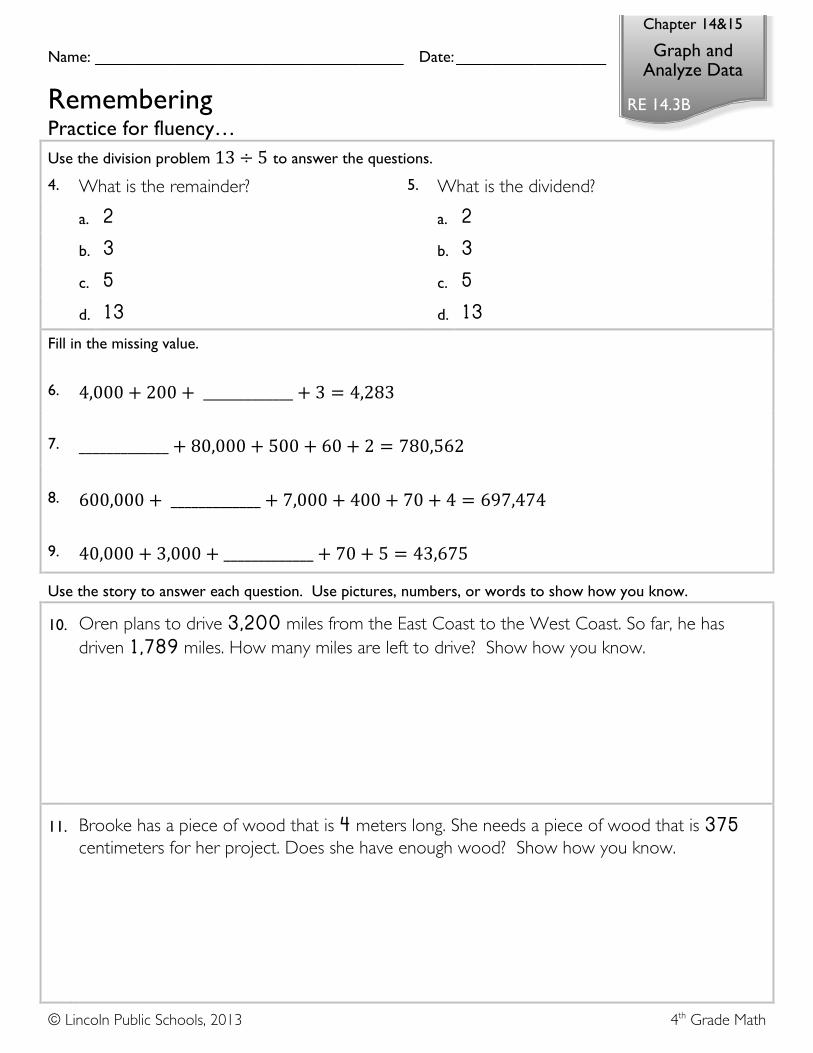
Remembering Practice for fluency… Use the division problem 13 ÷ 5 to answer the questions.
4. What is the remainder? 5. What is the dividend? a. 2 a. 2 b. 3 b. 3 c. 5 c. 5 d. 13 d. 13 Fill in the missing value.
6. 4,000 + 200 + _____________ + 3 = 4,283
7. _____________ + 80,000 + 500 + 60 + 2 = 780,562
8. 600,000 + _____________ + 7,000 + 400 + 70 + 4 = 697,474
9. 40,000 + 3,000 + _____________ + 70 + 5 = 43,675
Use the story to answer each question. Use pictures, numbers, or words to show how you know.
10. Oren plans to drive 3,200 miles from the East Coast to the West Coast. So far, he has driven 1,789 miles. How many miles are left to drive? Show how you know.
11. Brooke has a piece of wood that is 4 meters long. She needs a piece of wood that is 375 centimeters for her project. Does she have enough wood? Show how you know.

Name: ___________________________________ Date: _________________
© Lincoln Public Schools, 2013 4th Grade Math
Chapter 14&15
Graph and Analyze Data
HW 14.4A
Line Plots Practice to review… I can make line plots to represent and analyze data! Sarie asked each of her classmates how many siblings they have. This is Sarie’s data.?
3, 2, 2, 1, 5, 0, 1, 2, 0, 1, 2, 5 A line plot shows data using X’s along a number line.
Complete the line plot to show all of Sarie’s data. "
Give the line plot a title. "
Range is the difference between the greatest and least number.
Mode is the number (or numbers) that occur the most often.
The range of Sarie’s data is _________ . The mode of Sarie’s data is ________ . I know because… I know because…
Median is the middle number (or midpoint between the two middle numbers) when the numbers are ordered from least to greatest.
Mean is the sum of the numbers divided by the number of addends.
The median of Sarie’s data is _______ . The mean of Sarie’s data is ________ . I know because… I know because…
Practice to remember… Use the line plot. Find the mean, median, mode, and range of the data.
1. range: _______
2. median: _____
3. mode: ______
4. mean: _______

Name: ___________________________________ Date: _________________
© Lincoln Public Schools, 2013 4th Grade Math
Chapter 14&15
Graph and Analyze Data
RE 14.4A
Practice to remember, continued… Suppose another person had 2 pets. Add this new data to the line plot, then find the mean, median, mode, and range.
5. range: ________ 6. mode: _______
7. median: ______ 8. mean: _______
9. What changed? Tell why.
Remembering Practice for fluency… 10. Which product is 4,000? 11. Which product is 1,200?
a. 2 × 20 a. 4 × 30 b. 20 × 20 b. 40 × 30 c. 20 × 200 c. 40 × 300 d. 20 × 2,000 d. 40 × 3,000 Fill in the missing value. Compare. Write >, < , or = for each .
12. 2 T = ____________ lb 14. 44 oz 3 lb
13. ____________ lb = 64 oz 15. 2 T 5,000 lb
Use the story to answer each question. Use pictures, numbers, or words to show how you know.
16. Which has the greater diameter, Venus or Earth? Show how you know.

Name: ___________________________________ Date: _________________
© Lincoln Public Schools, 2013 4th Grade Math
Chapter 14&15
Graph and Analyze Data
HW 14.4B
Line Plots Practice to review… I can make line plots to represent and analyze data! Mark asked each of his classmates how many siblings they have. This is Mark’s data.?
3, 1, 0, 4, 0, 1, 3, 5, 1 A line plot shows data using X’s along a number line.
Complete the line plot to show all of Mark’s data. "
Give the line plot a title. "
Range is the difference between the greatest and least number.
Mode is the number (or numbers) that occur the most often.
The range of Mark’s data is ________ . The mode of Mark’s data is ________ . I know because… I know because…
Median is the middle number (or midpoint between the two middle numbers) when the numbers are ordered from least to greatest.
Mean is the sum of the numbers divided by the number of addends.
The median of Mark’s data is _______ . The mean of Mark’s data is ________ . I know because… I know because…
Practice to remember… Dimitri recorded the ages of the players on his baseball team. He recorded the ages in a table. Use Dimitri’s table to make a line plot of the players’ ages. 1.

Name: ___________________________________ Date: _________________
© Lincoln Public Schools, 2013 4th Grade Math
Chapter 14&15
Graph and Analyze Data
RE 14.4B
Practice to remember, continued… Use the information from Dimitri’s table and your line plot to answer the questions.
2. How many players are at least 12 years old?
______________
3. How many players are under 11 years old?
_______________
4. What is the median of the data?
______________
5. What is the mode of the data?
_______________
6. What is the range of the data?
______________
7. What is the mean of the data?
_______________
Remembering Practice for fluency… 8. Rusty opened her piggy bank and counted
the money. She found 27 one-dollar bills, 4 five-dollar bills, 2 ten-dollar bills, 5 quarters, 2 dimes, 6 nickels, and 82 pennies. How much money did she have in her bank?
9. Arnold has 1 one-dollar bill, 5 quarters, 1 dime, 6 nickels. He wants to buy a pint of ice cream that costs $2.45.
a. Arnold has doesn’t have enough money to buy the ice cream.
a. $92.37 b. Arnold has exactly the right amount of money to buy the ice cream.
b. $86.37
c. $70.37 c. Arnold has more than enough money to buy the ice cream.
d. $69.57 Measure each object to the nearest inch, half inch, and quarter inch
10.
11.
to the nearest inch: ______________
to the nearest half-inch: ______________
to the nearest quarter inch: ______________
to the nearest inch: ______________
to the nearest half-inch: ______________
to the nearest quarter inch: ______________

Name: ___________________________________ Date: _________________
© Lincoln Public Schools, 2013 4th Grade Math
Chapter 14&15
Graph and Analyze Data
HW 15.1 Double Bar Graphs Practice to review… I can interpret double bar graphs!
A double bar graph uses ____________________ to compare two sets of data.
Bar graphs can be ____________________, like this: or _____________________, like this: .
The ______________ tells what the graph is about. This graph is about ___________________________.
The _______________ helps us know the value of
each bar on the graph.
Labels tell more about what the bars on the
graph represent.
All the bars on this graph represent
___________________.
The _______________ gives information about what is being compared.
The lighter bars on this graph represent
___________________.
The darker bars on this graph represent
___________________.
Let’s practice reading the bar graph!
How many birds did Mitch and Susan feed in all? __________ Tell your neighbor how you know.
Practice to remember… Use the graphs to answer the questions. Use pictures, words, or numbers to show how you know.
1. How many carrot plants did Mike have in his garden?
_______________________
2. Did Mike or Jen have more bean plants?
_______________________
3. How many pea plants do Mike and Jen have altogether?
_______________________
4. All of Jen’s plants are shown on the graph. How many plants does Jen have in her garden altogether?
_______________________

Name: ___________________________________ Date: _________________
© Lincoln Public Schools, 2013 4th Grade Math
Chapter 14&15
Graph and Analyze Data
RE 15.1
Remembering Practice for fluency… Choose the equivalent expression. Multiply.
5. 16 × 20 = 6. 45 × 60 = a. 16 × (2 × 10) a. 270
b. 16 × (2 + 10) b. 280
c. 16 × (10 × 10) c. 2,700
d. 16 × 10 + 10 d. 4,560 Complete each equation.
7. 1,000 × __________________ = 1,000,000 9. 1,000,000 = __________________ × 100,000
8. 1,000,000 = __________________ × 100 10. 1 × __________________ = 1,000,000
Use the story to answer each question. Use pictures, numbers, or words to show how you know.
11. Morgan had a 1-liter container of water. She drank half of the water in the container. How many milliliters of water does Morgan have left?
12. Patty hiked a total of 1,500 miles. If she hiked 5 miles each day how many days did she hike?
Name: ___________________________________ Date: _________________
© Lincoln Public Schools, 2013 4th Grade Math
Chapter 14&15
Graph and Analyze Data
HW 15.2
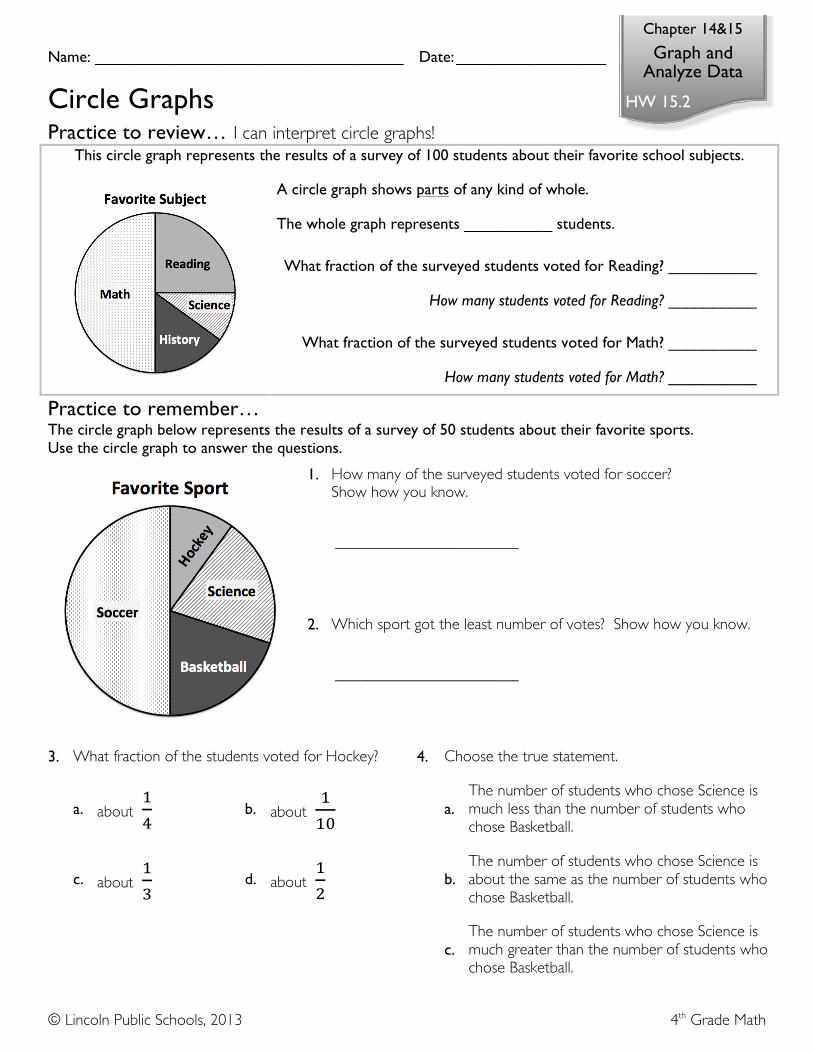
Circle Graphs Practice to review… I can interpret circle graphs!
This circle graph represents the results of a survey of 100 students about their favorite school subjects.
A circle graph shows parts of any kind of whole.
The whole graph represents __________ students.
What fraction of the surveyed students voted for Reading? __________
How many students voted for Reading? __________
What fraction of the surveyed students voted for Math? __________
How many students voted for Math? __________
Practice to remember… The circle graph below represents the results of a survey of 50 students about their favorite sports. Use the circle graph to answer the questions.
1. How many of the surveyed students voted for soccer? Show how you know.
_______________________
2. Which sport got the least number of votes? Show how you know.
_______________________
3. What fraction of the students voted for Hockey? 4. Choose the true statement.
a. about !! b. about
!!"
a. The number of students who chose Science is much less than the number of students who chose Basketball.
c. about !! d. about
!! b.
The number of students who chose Science is about the same as the number of students who chose Basketball.
c. The number of students who chose Science is much greater than the number of students who chose Basketball.

Name: ___________________________________ Date: _________________
© Lincoln Public Schools, 2013 4th Grade Math
Chapter 14&15
Graph and Analyze Data
RE 15.2
Remembering Practice for fluency…
13, 72, 81, 13, 51, 22, 63, 15, 30 ! Use these data to answer questions 5 – 6.
5. What is the median? 6. What is the range? a. 13 a. 13
b. 30 b. 30
c. 40 c. 40
d. 68 d. 68 Match up each number with its rounded number.
7.
_________
8. _________
9. _________
10. _________
Use the story to answer each question. Use pictures, numbers, or words to show how you know.
11. At the grocery store, Alice is arranging pineapples in the produce case. She puts 7 pineapples in each row, one at a time. What row does she put the 30th pineapple in? Show how you know.
12. The table lists three of the deepest seas and their greatest depths. Which one is the deepest? Show how you know.

Name: ___________________________________ Date: _________________
© Lincoln Public Schools, 2013 4th Grade Math
Chapter 14&15
Graph and Analyze Data
HW 15.3
Interpret a Line Graph Practice to review… I can interpret line graphs!
A line graph shows change over time.
The slant of the line shows trends in the data.
When Dylan’s savings increase, the line slants ________.
When Dylan’s savings decrease, the line slants ________.
I can look at the direction of the slant to understand the data.
Which statement is true? • Dylan’s savings increased more between points
A and B than between points B and C. • Dylan’s savings increased more between points
B and C than between points A and B. • Dylan’s savings increased at a steady rate
between points A and C.
Which statement is true? • Dylan’s savings decreased more between points
C and D than between points D and E. • Dylan’s savings decreased more between points
D and E than between points C and D. • Dylan’s savings decreased at a steady rate
between points C and E.
Practice to remember… Marcy graphed how her height changed over time. Use the graph below to answer questions 1-2.
1. Between which two points did Marcy grow the most? Show or explain how you know.
____________________
2. How did Marcy’s height change between points B and C? Show or explain how you know.
____________________
The graph below shows a theater’s ticket sales over a 5-week period. Use the graph to answer questions 3-4.
3. During which weeks were fewer than 100 tickets sold? Show or explain how you know. ____________________
4. What happened to sales between weeks 4 and 5? Show or explain how you know. ____________________

Name: ___________________________________ Date: _________________
© Lincoln Public Schools, 2013 4th Grade Math
Chapter 14&15
Graph and Analyze Data
RE 15.3
Remembering Practice for fluency… 5. Which is in order from greatest to least? 6. Which is in order from least to greatest? a. 5,500 5,050 5,005 a. 13,843 12,384 11,834
b. 5,050 5,500 5,005 b. 12,384 13,843 11,834
c. 5,005 5,050 5,500 c. 11,834 12,384 13,843
d. 5,500 5,005 5,050 d. 13,843 11,834 12,384 Use the graph and the word bank to answer the questions.
7. What is the graph about?
____________________
8. What interval is used for the graph’s scale?
____________________
9. Which city has the most nights below freezing on the graph?
____________________
10. Which month has the most nights below freezing on the graph?
____________________
Use the story to answer each question. Use pictures, numbers, or words to show how you know.
11. Jason is baking. He makes 10 cakes to sell at the school bake sale. How many cakes could Jason have left after the sale? Circle numbers on the number line to show all the possible answers.
12. Write an inequality to describe the relationship between the number of cakes that might be left and the number of cakes Jason made (10).

Name: ___________________________________ Date: _________________
© Lincoln Public Schools, 2013 4th Grade Math
Chapter 14&15
Graph and Analyze Data
HW 14.2A
Make a Table Practice to review… I can organize data in a table to solve a problem! Mary Beth’s age is 3 times the age of her sister Ellen. Ellen is now 4 years old. How old will they both be when Mary Beth is only twice the age of Ellen?
UNDERSTAND This story is about __________________________________________________________. PLAN I can make a table to show the relationships described in the math story.
I know for sure that Ellen is
_________ years old right now.
Ellen Mary Beth That means Mary Beth is
_________ years old right now. Next year, Ellen will be
_________ years old. Next year, Mary Beth will be
_________ years old.
SOLVE
Ellen will be _________ years old
and
Mary Beth will be _________ years old
LOOK BACK Think about the information in the story. I can check each part of my table to be sure my solution makes sense!
Practice to remember… Answer each question. Use pictures, numbers, or words to show how you know.
1. Jeff plants two trees in his front yard. One of the trees is 2 feet tall. The other tree is 3 feet tall. If both trees double their height each month, how tall will each tree be after 4 months? Show how you know.
2. Alisa is saving money to buy a new mp3 player that costs $32 (including taxes). She has $15, and she saves $4 each week. How many weeks will it take Alisa to save enough money to buy the mp3 player? Show how you know.
I need to find a time when Mary Beth is
__________ as old as Ellen.

Name: ___________________________________ Date: _________________
© Lincoln Public Schools, 2013 4th Grade Math
Chapter 14&15
Graph and Analyze Data
RE 14.2A
Remembering Practice for fluency… Choose the missing value. 3. 5 × 4 × 3 = ____ × 3 4. 9 × 2 × ____ = 2 × 9 a. 1 a. 1
b. 15 b. 2
c. 20 c. 9
d. 60 d. 18
Use models and the Distributive Property to find each product. Show your thinking.
5. 13 × 16 = ____________ 6. 11 × 12 = ____________
Use the story to answer each question. Use pictures, numbers, or words to show how you know.
7. The fourth-grade class is taking a trip to the aquarium. There are 240 people going on the trip and they are taking 4 buses. If the same number of people ride on each bus, how many people are on each bus? Show how you know.
8. Mrs. Murphy had 66 apples. She used 6 apples in each pie she baked. If she used all of her apples, how many pies did Mrs. Murphy bake? Show how you know.
Name: ___________________________________ Date: _________________
© Lincoln Public Schools, 2013 4th Grade Math
Chapter 14&15
Graph and Analyze Data
HW 14.2B
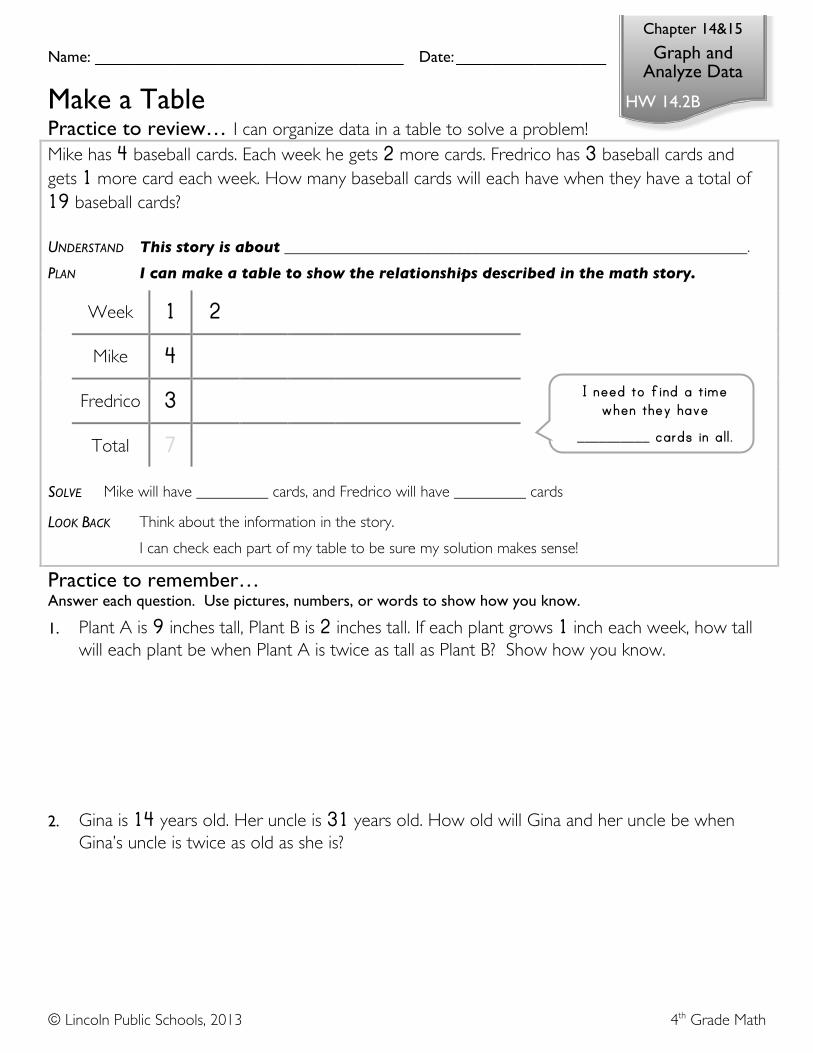
Make a Table Practice to review… I can organize data in a table to solve a problem! Mike has 4 baseball cards. Each week he gets 2 more cards. Fredrico has 3 baseball cards and gets 1 more card each week. How many baseball cards will each have when they have a total of 19 baseball cards?
UNDERSTAND This story is about __________________________________________________________. PLAN I can make a table to show the relationships described in the math story.
Week 1 2
Mike 4
Fredrico 3
Total 7
SOLVE Mike will have _________ cards, and Fredrico will have _________ cards
LOOK BACK Think about the information in the story. I can check each part of my table to be sure my solution makes sense!
Practice to remember… Answer each question. Use pictures, numbers, or words to show how you know.
1. Plant A is 9 inches tall, Plant B is 2 inches tall. If each plant grows 1 inch each week, how tall will each plant be when Plant A is twice as tall as Plant B? Show how you know.
2. Gina is 14 years old. Her uncle is 31 years old. How old will Gina and her uncle be when Gina’s uncle is twice as old as she is?
I need to find a time when they have
__________ cards in all.

Name: ___________________________________ Date: _________________
© Lincoln Public Schools, 2013 4th Grade Math
Chapter 14&15
Graph and Analyze Data
RE 14.2B
Remembering Practice for fluency… 3. Which statement is not true? 4. Which expression is equivalent to 5 × 8 × 2 a. 6 × 5 = 5 × 6 a. 5 × 10
b. 2 × 3 × 5 = 2 × 5 × 3 b. 5 × 2 × 8
c. 6 ÷ 2 = 2 ÷ 6 c. 5 × 1
d. 6 ÷ 1 = 6 × 1 d. 0 × 10 × 8
Find each missing value.
5. _____ ÷ 5 = 6 7. 0 ÷ 10 = _____
6. _____ = 7 × 4 8. 2 ×_____ = 16
Use the story to answer each question. Use pictures, numbers, or words to show how you know.
9. Matt has a sticker collection. He puts his stickers in an album. He arranges 4 stickers on each page of the album and has 3 stickers left over. How many stickers could Matt have? Show how you know.
10. Carla had 5 crayons and Nina had 3 crayons. The teacher gave Carla 3 more crayons and Nina 5 more crayons. Compare the number of crayons Carla has now to the number of crayons Nina has now. Show how you know.


![Mean, Mode, Median[1]](https://img.pdfslide.us/doc/110x75/546e38f6af79595e068b6b58/mean-mode-median1-5584abfccb147.jpg)


![Mean, Mode, Median[1]](https://img.pdfslide.us/doc/110x75/5462509daf7959fe1b8b57b8/mean-mode-median1-5584ae32b3357.jpg)

