Embed Size (px)
Citation preview
Supplemental Data. Pick and Bräutgam et al. Plant Cell. (2011). 10.1105/tpc.111.090324
1
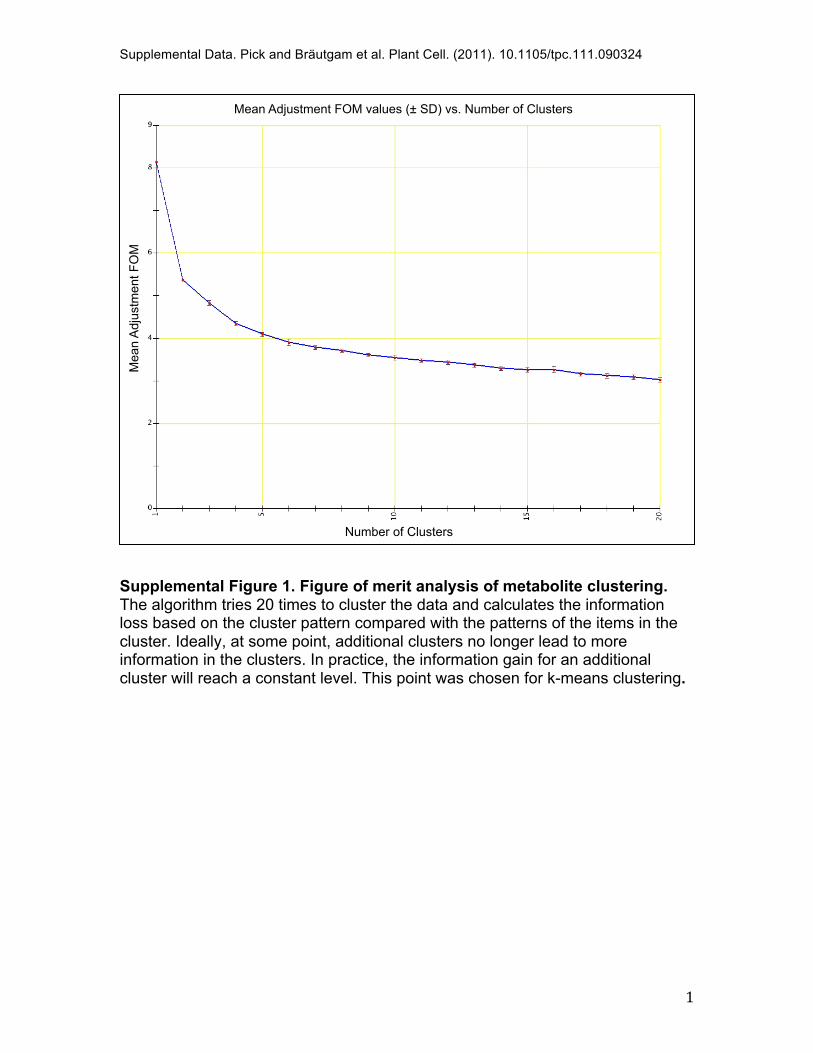
Supplemental Figure 1. Figure of merit analysis of metabolite clustering. The algorithm tries 20 times to cluster the data and calculates the information loss based on the cluster pattern compared with the patterns of the items in the cluster. Ideally, at some point, additional clusters no longer lead to more information in the clusters. In practice, the information gain for an additional cluster will reach a constant level. This point was chosen for k-means clustering.
Number of Clusters
Mean A
dju
stm
ent F
OM
Mean Adjustment FOM values (± SD) vs. Number of Clusters
Supplemental Data. Pick and Bräutgam et al. Plant Cell. (2011). 10.1105/tpc.111.090324
2
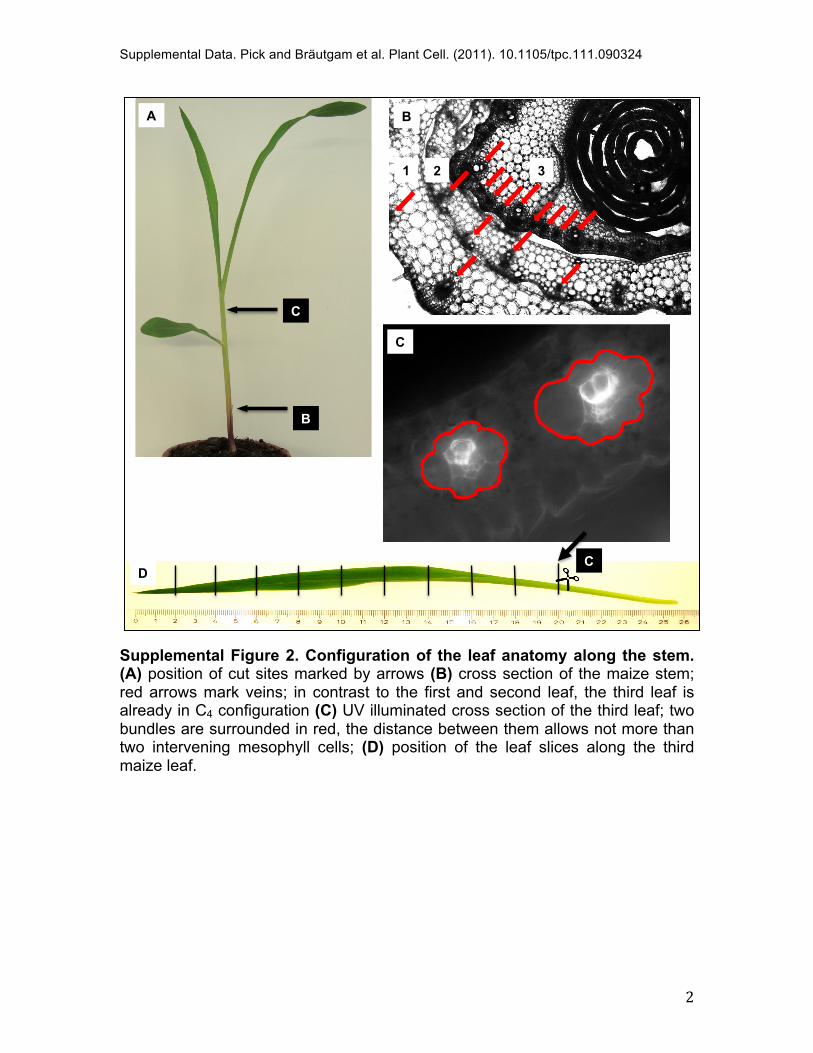
Supplemental Figure 2. Configuration of the leaf anatomy along the stem. (A) position of cut sites marked by arrows (B) cross section of the maize stem; red arrows mark veins; in contrast to the first and second leaf, the third leaf is already in C4 configuration (C) UV illuminated cross section of the third leaf; two bundles are surrounded in red, the distance between them allows not more than two intervening mesophyll cells; (D) position of the leaf slices along the third maize leaf.
1 2 3
B
C
A
C
B
D C
Supplemental Data. Pick and Bräutgam et al. Plant Cell. (2011). 10.1105/tpc.111.090324
3
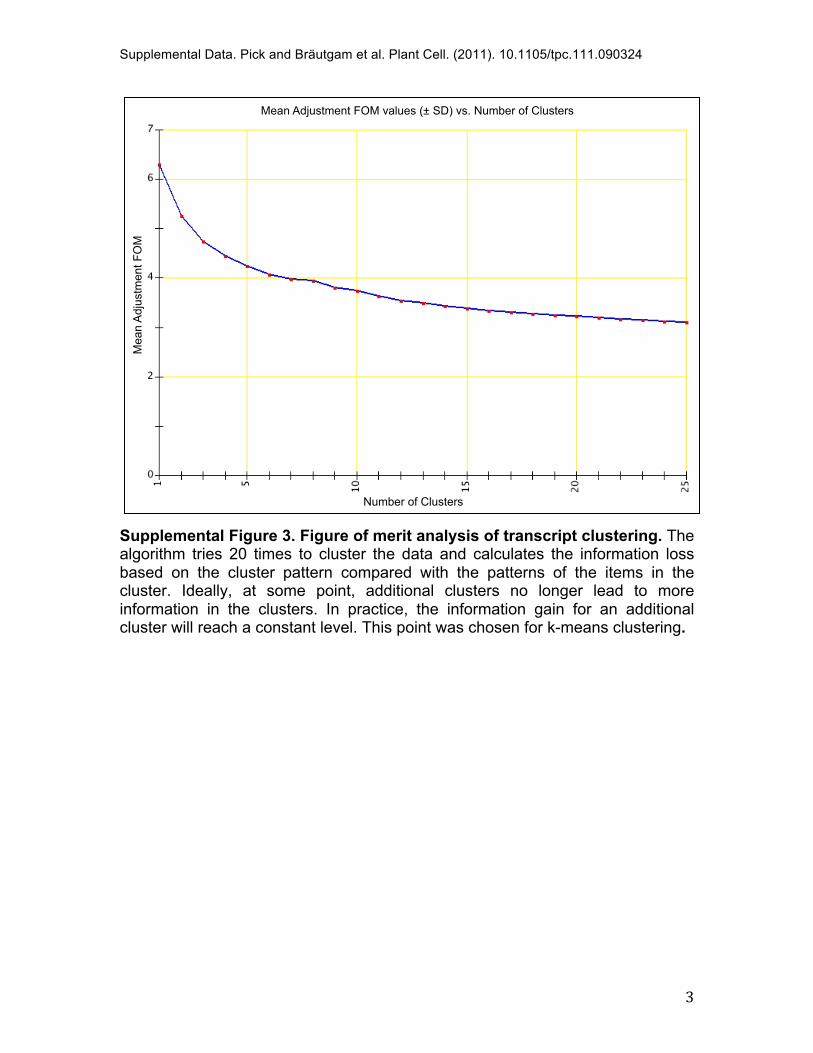
Supplemental Figure 3. Figure of merit analysis of transcript clustering. The algorithm tries 20 times to cluster the data and calculates the information loss based on the cluster pattern compared with the patterns of the items in the cluster. Ideally, at some point, additional clusters no longer lead to more information in the clusters. In practice, the information gain for an additional cluster will reach a constant level. This point was chosen for k-means clustering.
Number of Clusters
Mean A
dju
stm
ent F
OM
Mean Adjustment FOM values (± SD) vs. Number of Clusters
Supplemental Data. Pick and Bräutgam et al. Plant Cell. (2011). 10.1105/tpc.111.090324
4
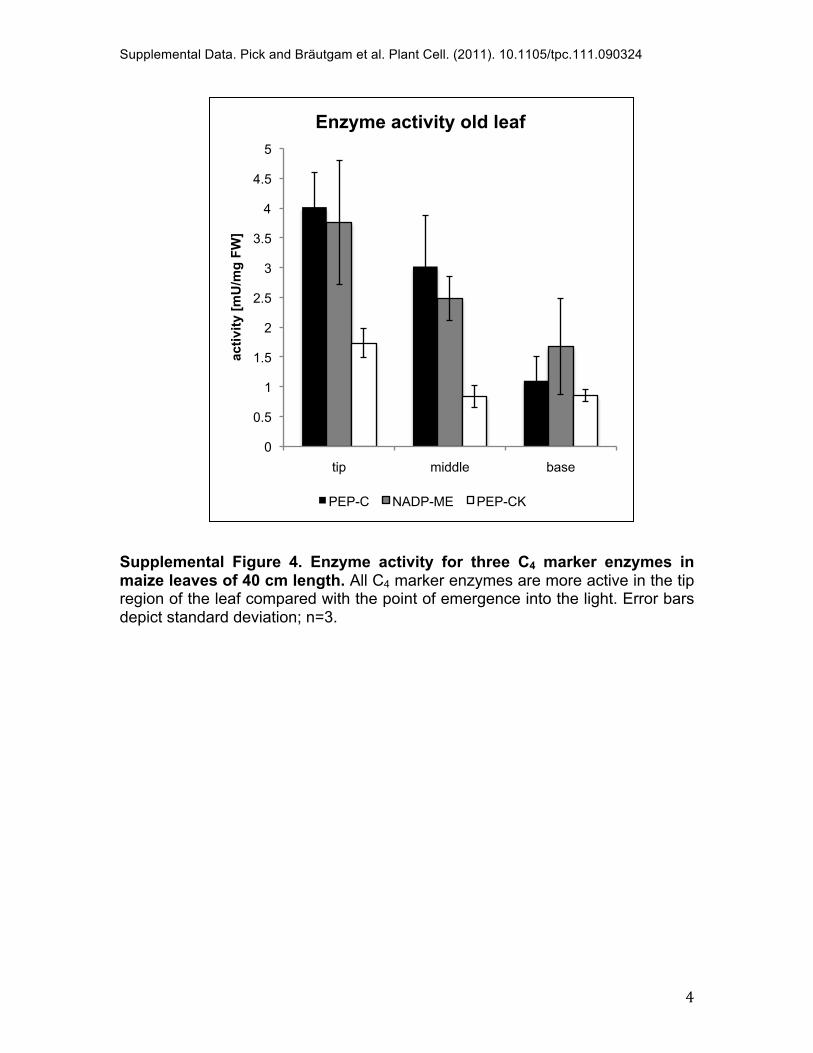
Supplemental Figure 4. Enzyme activity for three C4 marker enzymes in maize leaves of 40 cm length. All C4 marker enzymes are more active in the tip region of the leaf compared with the point of emergence into the light. Error bars depict standard deviation; n=3.
0
0.5
1
1.5
2
2.5
3
3.5
4
4.5
5
tip middle base
acti
vit
y [
mU
/mg
FW
]
Enzyme activity old leaf
PEP-C NADP-ME PEP-CK
Supplemental Data. Pick and Bräutgam et al. Plant Cell. (2011). 10.1105/tpc.111.090324
5
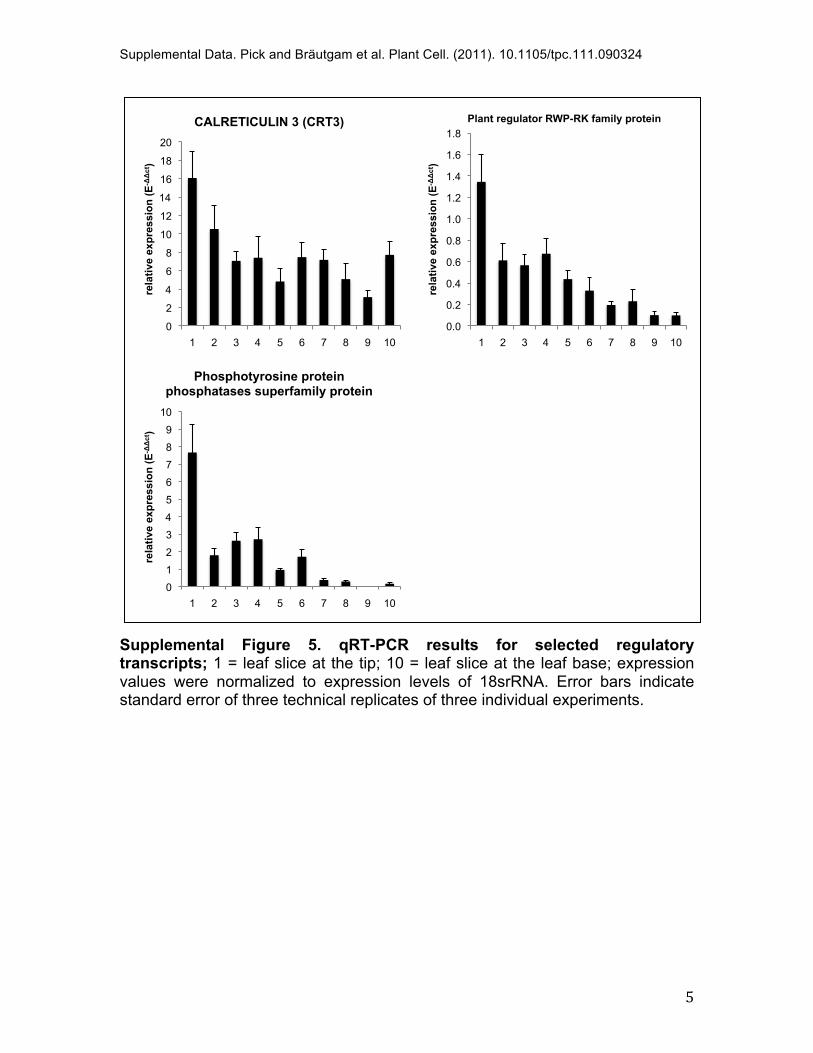
Supplemental Figure 5. qRT-PCR results for selected regulatory transcripts; 1 = leaf slice at the tip; 10 = leaf slice at the leaf base; expression values were normalized to expression levels of 18srRNA. Error bars indicate standard error of three technical replicates of three individual experiments.
0
1
2
3
4
5
6
7
8
9
10
1 2 3 4 5 6 7 8 9 10
rela
tive e
xp
ressio
n (
E-!!
ct )
Phosphotyrosine protein phosphatases superfamily protein
0.0
0.2
0.4
0.6
0.8
1.0
1.2
1.4
1.6
1.8
1 2 3 4 5 6 7 8 9 10
rela
tive e
xp
ressio
n (
E-!!
ct )
Plant regulator RWP-RK family protein
0
2
4
6
8
10
12
14
16
18
20
1 2 3 4 5 6 7 8 9 10
rela
tive e
xp
ressio
n (
E-!!
ct )
CALRETICULIN 3 (CRT3)
Supplemental Data. Pick and Bräutgam et al. Plant Cell. (2011). 10.1105/tpc.111.090324
6
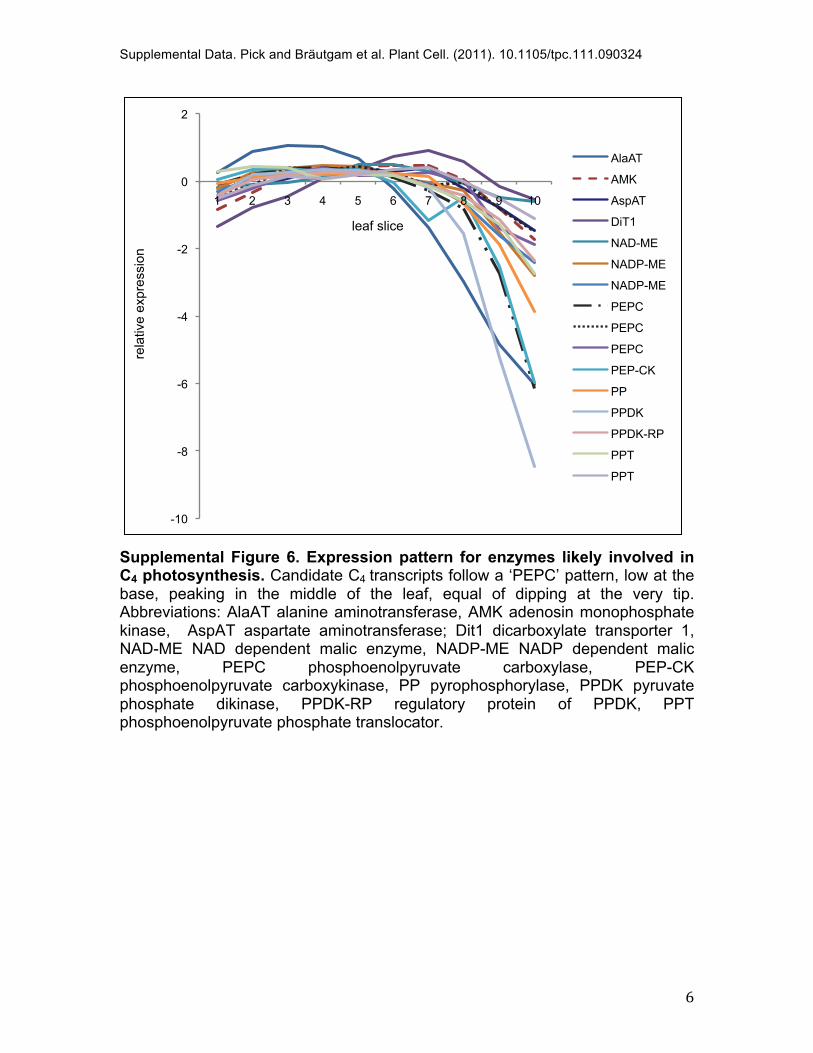
Supplemental Figure 6. Expression pattern for enzymes likely involved in C4 photosynthesis. Candidate C4 transcripts follow a ‘PEPC’ pattern, low at the base, peaking in the middle of the leaf, equal of dipping at the very tip. Abbreviations: AlaAT alanine aminotransferase, AMK adenosin monophosphate kinase, AspAT aspartate aminotransferase; Dit1 dicarboxylate transporter 1, NAD-ME NAD dependent malic enzyme, NADP-ME NADP dependent malic enzyme, PEPC phosphoenolpyruvate carboxylase, PEP-CK phosphoenolpyruvate carboxykinase, PP pyrophosphorylase, PPDK pyruvate phosphate dikinase, PPDK-RP regulatory protein of PPDK, PPT phosphoenolpyruvate phosphate translocator.
-10
-8
-6
-4
-2
0
2
1 2 3 4 5 6 7 8 9 10
AlaAT
AMK
AspAT
DiT1
NAD-ME
NADP-ME
NADP-ME
PEPC
PEPC
PEPC
PEP-CK
PP
PPDK
PPDK-RP
PPT
PPT
leaf slice
rela
tive e
xpre
ssio
n
Supplemental Data. Pick and Bräutgam et al. Plant Cell. (2011). 10.1105/tpc.111.090324
7
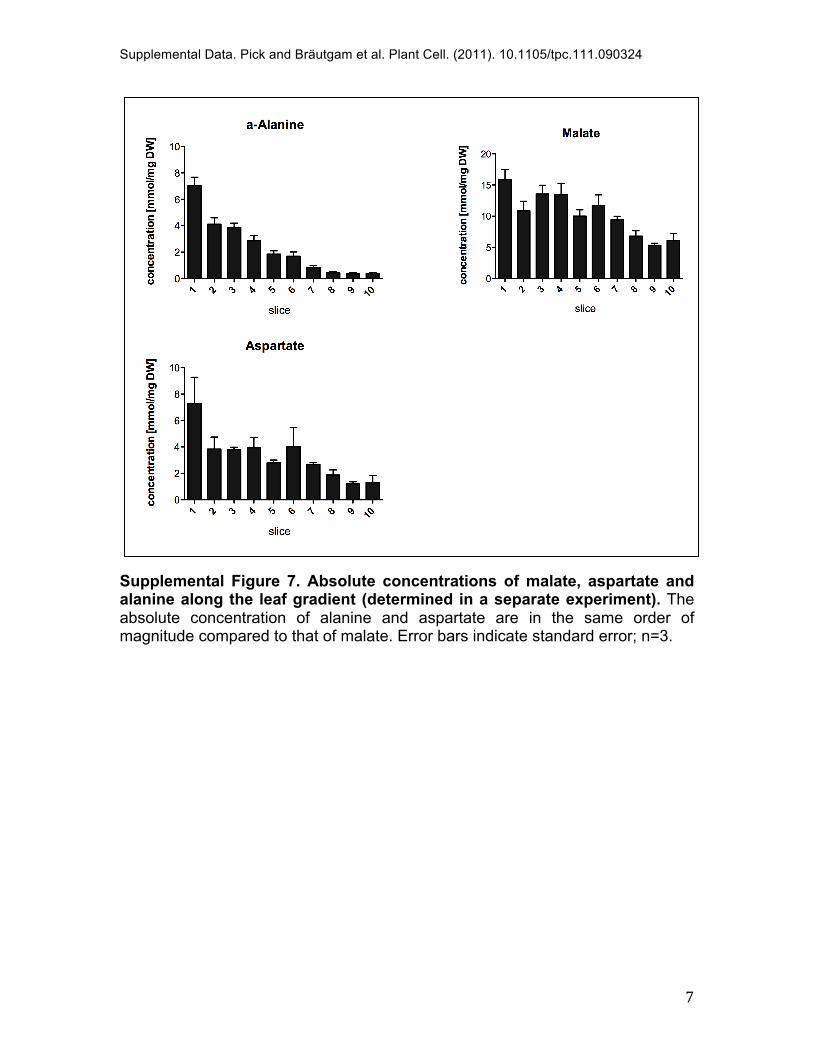
Supplemental Figure 7. Absolute concentrations of malate, aspartate and alanine along the leaf gradient (determined in a separate experiment). The absolute concentration of alanine and aspartate are in the same order of magnitude compared to that of malate. Error bars indicate standard error; n=3.
Supplemental Data. Pick and Bräutgam et al. Plant Cell. (2011). 10.1105/tpc.111.090324
8
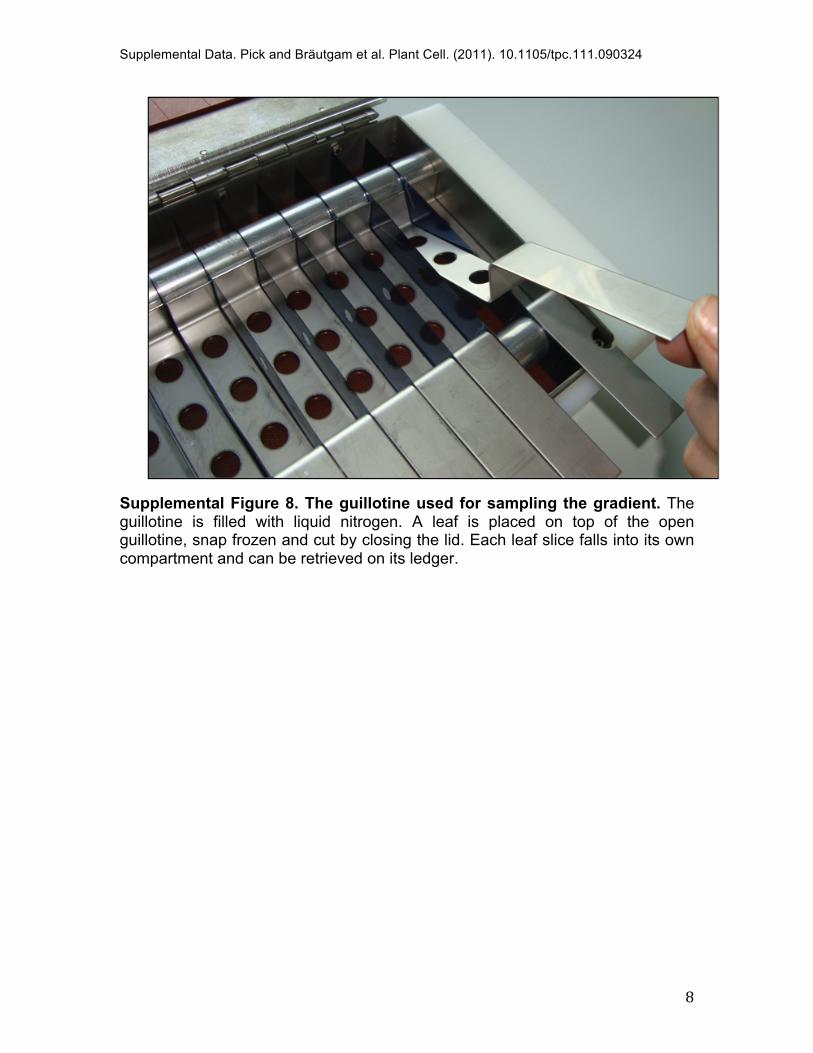
Supplemental Figure 8. The guillotine used for sampling the gradient. The guillotine is filled with liquid nitrogen. A leaf is placed on top of the open guillotine, snap frozen and cut by closing the lid. Each leaf slice falls into its own compartment and can be retrieved on its ledger.
Supplemental Data. Pick and Bräutgam et al. Plant Cell. (2011). 10.1105/tpc.111.090324
9
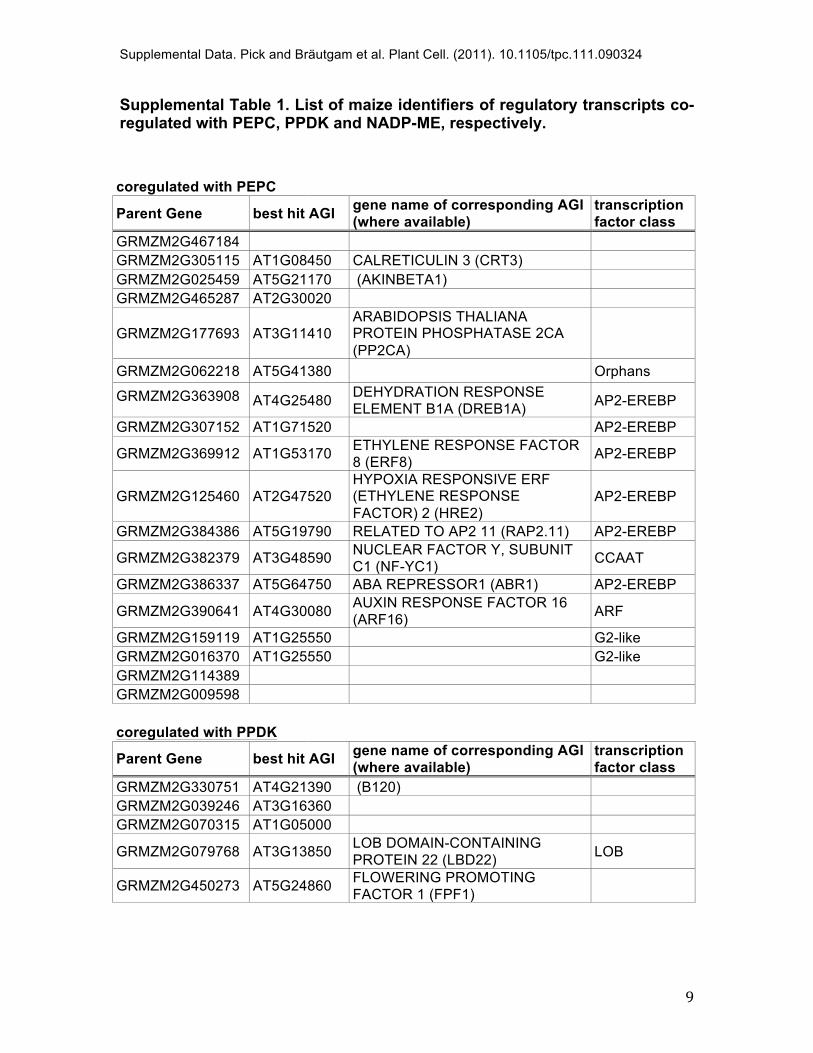
Supplemental Table 1. List of maize identifiers of regulatory transcripts co-regulated with PEPC, PPDK and NADP-ME, respectively.
coregulated with PEPC
Parent Gene best hit AGI gene name of corresponding AGI (where available)
transcription factor class
GRMZM2G467184 GRMZM2G305115 AT1G08450 CALRETICULIN 3 (CRT3) GRMZM2G025459 AT5G21170 (AKINBETA1) GRMZM2G465287 AT2G30020
GRMZM2G177693 AT3G11410 ARABIDOPSIS THALIANA PROTEIN PHOSPHATASE 2CA (PP2CA)
GRMZM2G062218 AT5G41380 Orphans
GRMZM2G363908 AT4G25480 DEHYDRATION RESPONSE ELEMENT B1A (DREB1A) AP2-EREBP
GRMZM2G307152 AT1G71520 AP2-EREBP
GRMZM2G369912 AT1G53170 ETHYLENE RESPONSE FACTOR 8 (ERF8) AP2-EREBP
GRMZM2G125460 AT2G47520 HYPOXIA RESPONSIVE ERF (ETHYLENE RESPONSE FACTOR) 2 (HRE2)
AP2-EREBP
GRMZM2G384386 AT5G19790 RELATED TO AP2 11 (RAP2.11) AP2-EREBP
GRMZM2G382379 AT3G48590 NUCLEAR FACTOR Y, SUBUNIT C1 (NF-YC1) CCAAT
GRMZM2G386337 AT5G64750 ABA REPRESSOR1 (ABR1) AP2-EREBP
GRMZM2G390641 AT4G30080 AUXIN RESPONSE FACTOR 16 (ARF16) ARF
GRMZM2G159119 AT1G25550 G2-like GRMZM2G016370 AT1G25550 G2-like GRMZM2G114389 GRMZM2G009598 coregulated with PPDK
Parent Gene best hit AGI gene name of corresponding AGI (where available)
transcription factor class
GRMZM2G330751 AT4G21390 (B120) GRMZM2G039246 AT3G16360 GRMZM2G070315 AT1G05000
GRMZM2G079768 AT3G13850 LOB DOMAIN-CONTAINING PROTEIN 22 (LBD22) LOB
GRMZM2G450273 AT5G24860 FLOWERING PROMOTING FACTOR 1 (FPF1)
Supplemental Data. Pick and Bräutgam et al. Plant Cell. (2011). 10.1105/tpc.111.090324
10
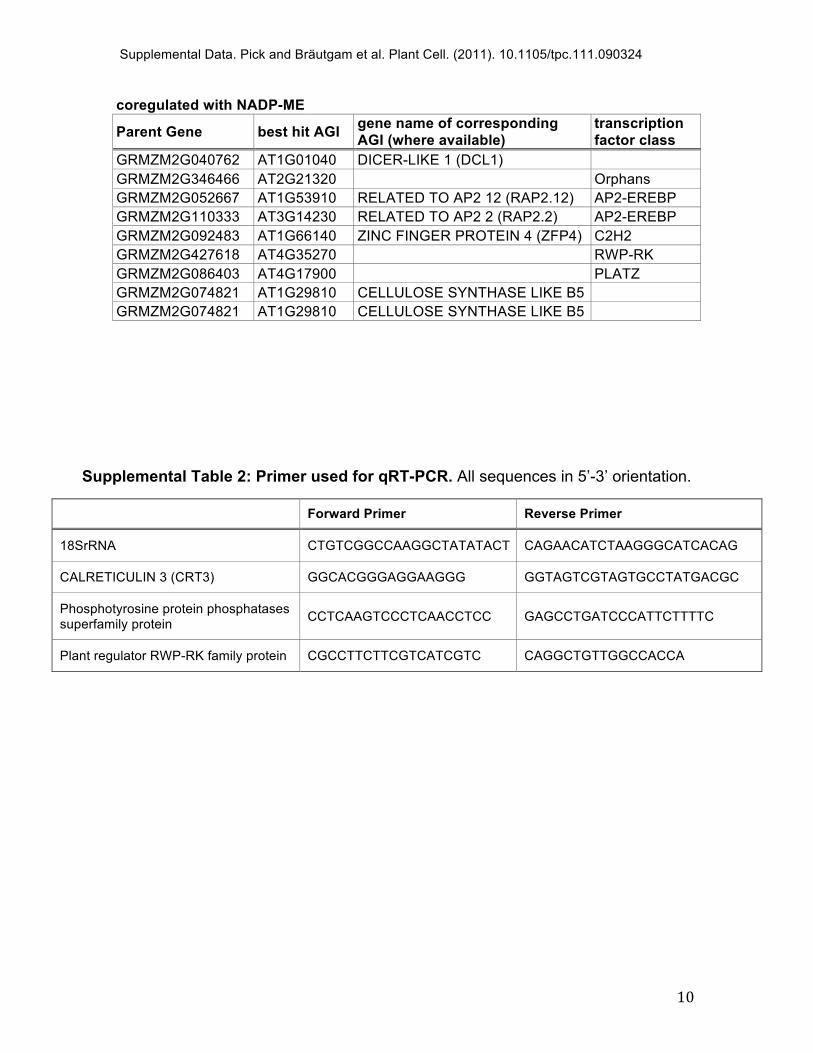
coregulated with NADP-ME
Parent Gene best hit AGI gene name of corresponding AGI (where available)
transcription factor class
GRMZM2G040762 AT1G01040 DICER-LIKE 1 (DCL1) GRMZM2G346466 AT2G21320 Orphans GRMZM2G052667 AT1G53910 RELATED TO AP2 12 (RAP2.12) AP2-EREBP GRMZM2G110333 AT3G14230 RELATED TO AP2 2 (RAP2.2) AP2-EREBP GRMZM2G092483 AT1G66140 ZINC FINGER PROTEIN 4 (ZFP4) C2H2 GRMZM2G427618 AT4G35270 RWP-RK GRMZM2G086403 AT4G17900 PLATZ GRMZM2G074821 AT1G29810 CELLULOSE SYNTHASE LIKE B5 GRMZM2G074821 AT1G29810 CELLULOSE SYNTHASE LIKE B5
Supplemental Table 2: Primer used for qRT-PCR. All sequences in 5’-3’ orientation.
Forward Primer Reverse Primer
18SrRNA CTGTCGGCCAAGGCTATATACT CAGAACATCTAAGGGCATCACAG
CALRETICULIN 3 (CRT3) GGCACGGGAGGAAGGG GGTAGTCGTAGTGCCTATGACGC
Phosphotyrosine protein phosphatases superfamily protein CCTCAAGTCCCTCAACCTCC GAGCCTGATCCCATTCTTTTC
Plant regulator RWP-RK family protein CGCCTTCTTCGTCATCGTC CAGGCTGTTGGCCACCA