Embed Size (px)
Citation preview
MDCSystems®
Providing Expert Solutions for Projects Worldwide
www.MDCSystems.com
1
Installing a Solar Power System on a Residential House
Engineering and Financial Analysis
Amal Kabalan, LEED A.P. Consulting Engineer
In the article “Pennsylvania Solar Energy Rebate on Hold: How Consumers Can Still Save
Energy” published in the February 2009 edition of the MDC Advisor®, the steps that
homeowners can take in order to reduce their energy consumption were outlined. This article
discusses a case study that shows the effect of implementing two of the mentioned suggestions
namely: increased attic insulation and powered, thermostatically controlled roof ventilation.
Moreover, since the Pennsylvania Solar Energy Rebate program has been funded, a detailed
analysis of costs and benefits of installing a solar power system on a residential house will be
outlined and whether such a project is a viable option in light of all the federal and state
incentives will be discussed.
The residential unit considered in this study is a suburban residential property located in West
Chester, Pennsylvania - 28 miles west of Philadelphia. The owner, in previous efforts to reduce
the energy consumption of the house, improved the attic insulation and added thermostatically
powered, controlled roof ventilators. The implementation of those strategies showed a significant
decrease in the energy usage and thus in the monthly bills.
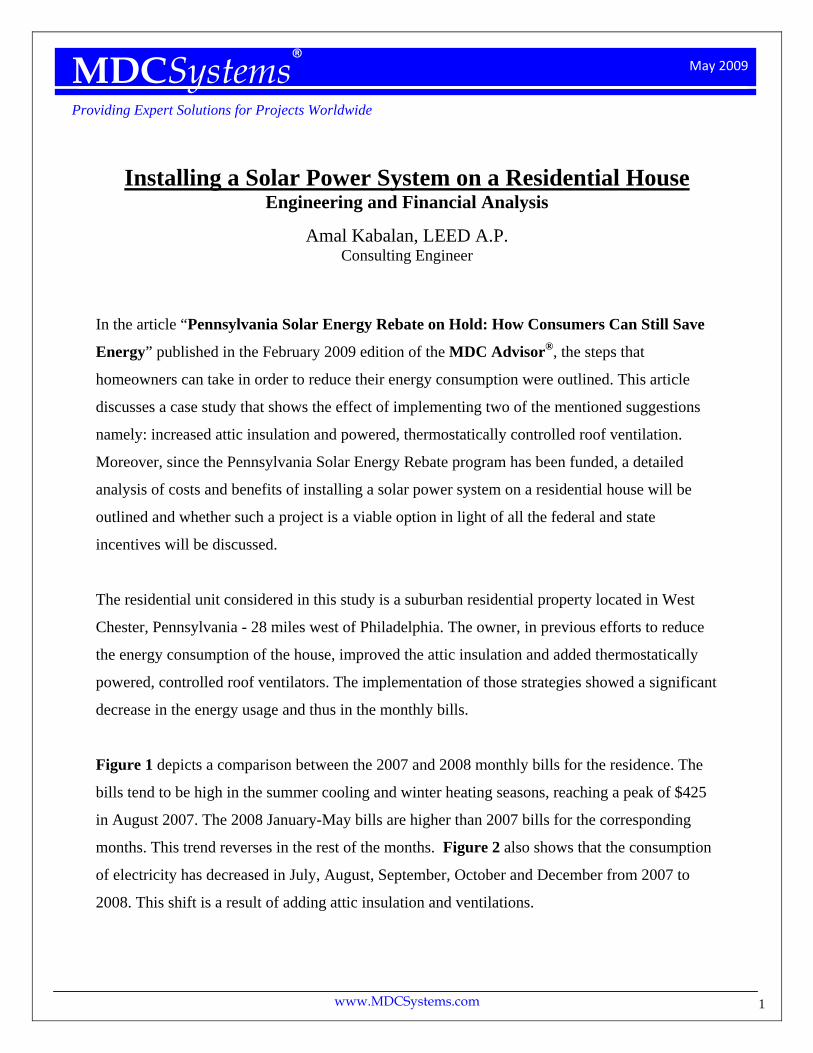
Figure 1 depicts a comparison between the 2007 and 2008 monthly bills for the residence. The
bills tend to be high in the summer cooling and winter heating seasons, reaching a peak of $425
in August 2007. The 2008 January-May bills are higher than 2007 bills for the corresponding
months. This trend reverses in the rest of the months. Figure 2 also shows that the consumption
of electricity has decreased in July, August, September, October and December from 2007 to
2008. This shift is a result of adding attic insulation and ventilations.
May 2009
www.MDCSystems.com
2
Since the highest bills are in the summer this means that it may be favorable to install solar
panels. A solar power system has the best performance in the summer when the sun is out and
the days are long; this allows the system to operate as long as 14 hours per day. Moreover, the
electricity rates are the highest during the summer peak hours. This corresponds to when the sun
is available and the solar power system is operating close to peak performance. Thus a solar
power system alternative to avoid those high rates will be the viable option to investigate in order
to shave off those peaks and save on utility costs.
Figure 1: Comparison between '07 and '08 Bills
Figure 2: Comparison Between '07 and '08 KWh Usage
www.MDCSystems.com
3
Utility Increases As a result of Pennsylvania's 1997 electric utility restructuring law, PECO no longer produces
electricity. Electric power generation is sold in a separate, competitive wholesale market. As
part of the restructuring, PECO's customers have benefited from capped electricity generation
rates since 1996. Since then, wholesale market power prices have risen, driven by increasing fuel
costs and global competition. When the electricity generation rate caps expire for PECO
customers on January 1, 2011, the company will be required to buy power on the wholesale
market at prices that are expected to be higher than today's capped rates (1).
In an attempt to provide a smooth transition to the new rates PECO said it is filing a plan with
the Pennsylvania Public Utility Commission that will help its customers deal with the expected
increase in their electricity bills when its rate caps are lifted at the start of 2011. The plan would
give electricity customers of the Philadelphia-based electric and gas utility company the option
of preparing for the expected increase by making payments into a savings account that pays 6
percent interest. Customers who make the payments would have the payments and the interest
they generate applied to their bills after the limit is lifted. Customers could also defer a portion of
any initial rate increase by spreading out the amount of the first year’s increase over the
following two or three years.
Under the plan, PECO would also spend more than $50 million on programs and products to
help customers manage costs by using energy as efficiently as possible. Strategies such as
offering a discounted residential rate to qualifying low-income customers to buying power
through a series of competitive purchases at different times, rather than at one time, when market
prices could be high and launching a multimillion-dollar consumer education campaign about the
coming change in electric rates from now through 2012 are all included in PECO’s plan.
The market prices are highly unpredictable so PECO would be able to announce an average
increase rate but not the exact rate. Given this situation the best practice a consumer can acquire
to be ready for the increases is to be energy efficient and aware of consumption. This can be
done by installing electric meters in the house instead of outside and observing the daily
consumption of the house. There are multiple electronic gadgets that will tell you if your

www.MDCSystems.com
4
consumption is average or high given the size of your house. Another practice would be to
generate one’s own power through a solar power system. Once the system is installed no extra
fees need to be paid. Think of it as installing your own customized power generator on the roof
of your house: a generator that is quiet, clean, and environmentally friendly.
Solar Power System Analysis The example residence is located near West Chester, Pennsylvania - 28 miles west of
Philadelphia. Due to its proximity to Philadelphia, it is reasonable to consider that it has the same
latitude, longitude and weather conditions to that of Philly for the purpose of the analysis.
Latitude is 39.88 and longitude 75.25. Elevation is 9 meters. Figure 3 shows the location of the
house (B) in correspondence to Philadelphia (A).
Figure 3: Location of the suburban residence in relation to Philadelphia.
www.MDCSystems.com
5
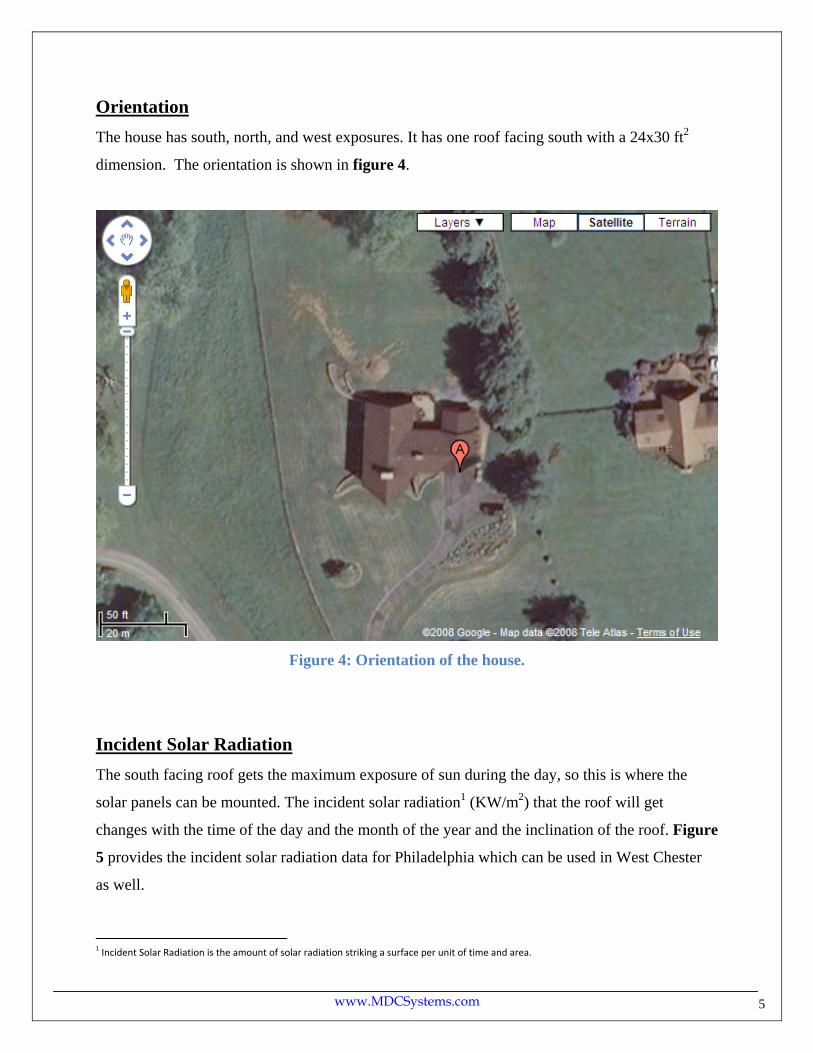
Orientation The house has south, north, and west exposures. It has one roof facing south with a 24x30 ft2
dimension. The orientation is shown in figure 4.
Figure 4: Orientation of the house.
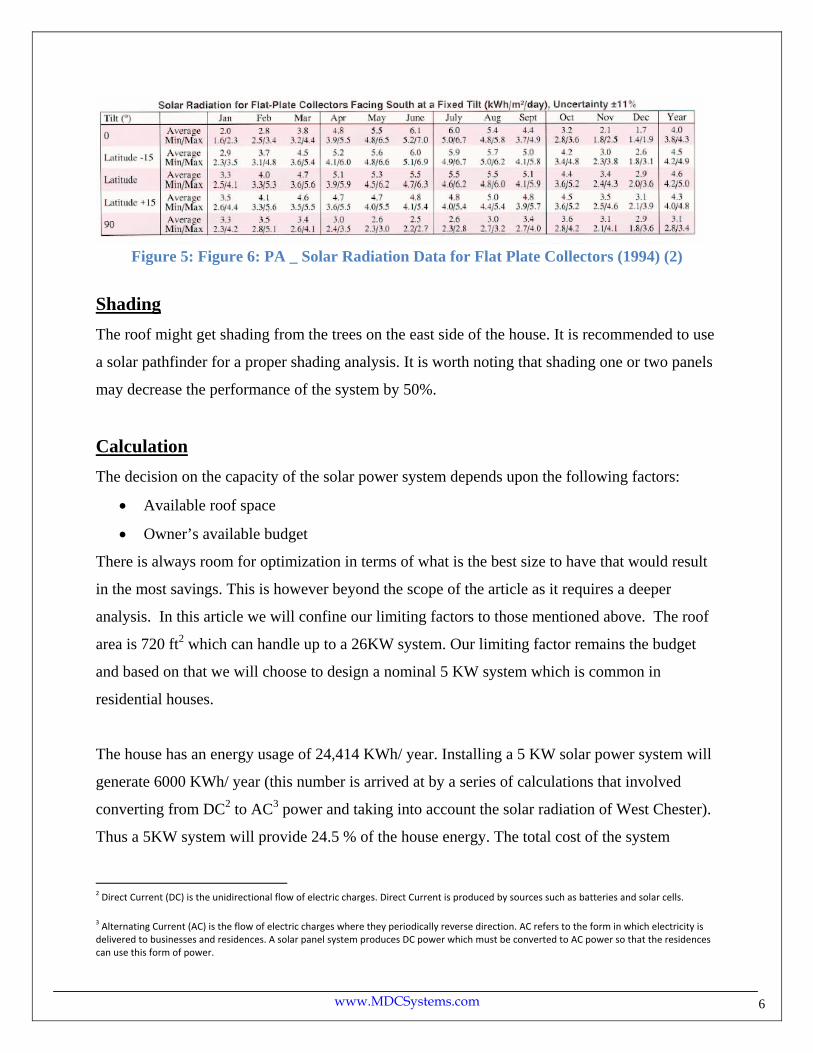
Incident Solar Radiation The south facing roof gets the maximum exposure of sun during the day, so this is where the
solar panels can be mounted. The incident solar radiation1 (KW/m2) that the roof will get
changes with the time of the day and the month of the year and the inclination of the roof. Figure
5 provides the incident solar radiation data for Philadelphia which can be used in West Chester
as well.
1 Incident Solar Radiation is the amount of solar radiation striking a surface per unit of time and area.
www.MDCSystems.com
6
Figure 5: Figure 6: PA _ Solar Radiation Data for Flat Plate Collectors (1994) (2)
Shading The roof might get shading from the trees on the east side of the house. It is recommended to use
a solar pathfinder for a proper shading analysis. It is worth noting that shading one or two panels
may decrease the performance of the system by 50%.
Calculation The decision on the capacity of the solar power system depends upon the following factors:
• Available roof space
• Owner’s available budget
There is always room for optimization in terms of what is the best size to have that would result
in the most savings. This is however beyond the scope of the article as it requires a deeper
analysis. In this article we will confine our limiting factors to those mentioned above. The roof
area is 720 ft2 which can handle up to a 26KW system. Our limiting factor remains the budget
and based on that we will choose to design a nominal 5 KW system which is common in
residential houses.
The house has an energy usage of 24,414 KWh/ year. Installing a 5 KW solar power system will
generate 6000 KWh/ year (this number is arrived at by a series of calculations that involved
converting from DC2 to AC3 power and taking into account the solar radiation of West Chester).
Thus a 5KW system will provide 24.5 % of the house energy. The total cost of the system
2 Direct Current (DC) is the unidirectional flow of electric charges. Direct Current is produced by sources such as batteries and solar cells. 3 Alternating Current (AC) is the flow of electric charges where they periodically reverse direction. AC refers to the form in which electricity is delivered to businesses and residences. A solar panel system produces DC power which must be converted to AC power so that the residences can use this form of power.
www.MDCSystems.com
7
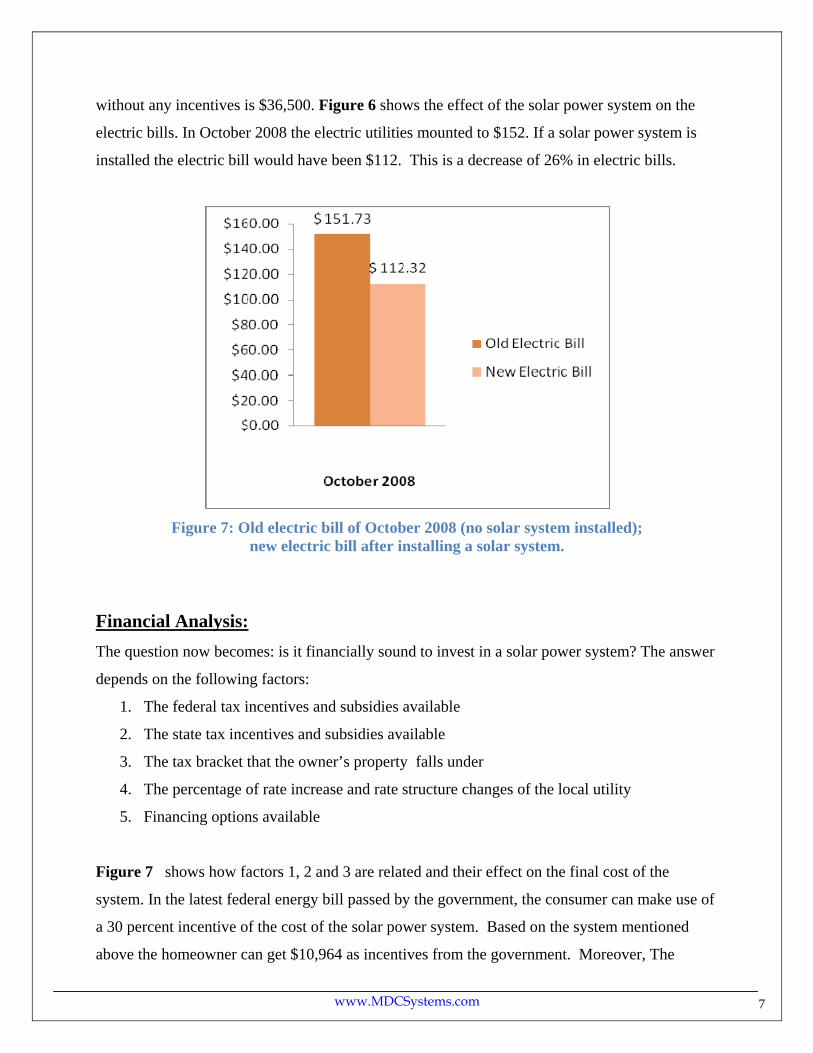
without any incentives is $36,500. Figure 6 shows the effect of the solar power system on the
electric bills. In October 2008 the electric utilities mounted to $152. If a solar power system is
installed the electric bill would have been $112. This is a decrease of 26% in electric bills.
Figure 7: Old electric bill of October 2008 (no solar system installed);
new electric bill after installing a solar system.
Financial Analysis: The question now becomes: is it financially sound to invest in a solar power system? The answer
depends on the following factors:
1. The federal tax incentives and subsidies available
2. The state tax incentives and subsidies available
3. The tax bracket that the owner’s property falls under
4. The percentage of rate increase and rate structure changes of the local utility
5. Financing options available
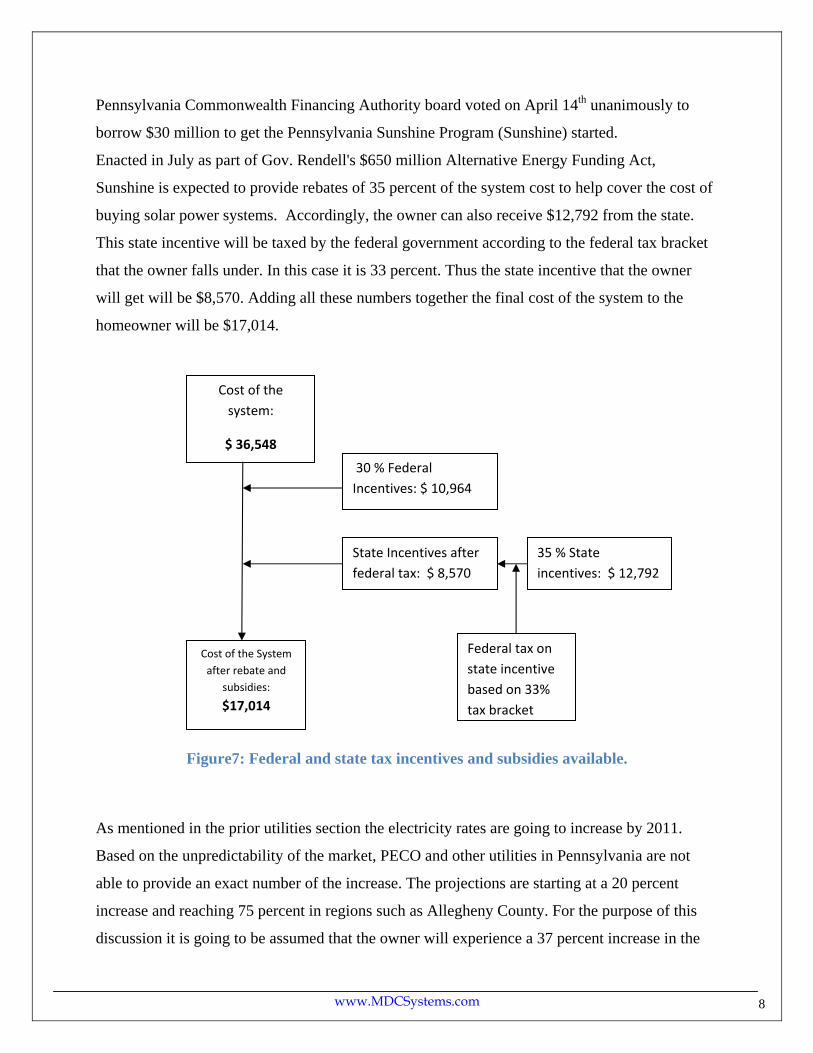
Figure 7 shows how factors 1, 2 and 3 are related and their effect on the final cost of the
system. In the latest federal energy bill passed by the government, the consumer can make use of
a 30 percent incentive of the cost of the solar power system. Based on the system mentioned
above the homeowner can get $10,964 as incentives from the government. Moreover, The
www.MDCSystems.com
8
Pennsylvania Commonwealth Financing Authority board voted on April 14th unanimously to
borrow $30 million to get the Pennsylvania Sunshine Program (Sunshine) started.
Enacted in July as part of Gov. Rendell's $650 million Alternative Energy Funding Act,
Sunshine is expected to provide rebates of 35 percent of the system cost to help cover the cost of
buying solar power systems. Accordingly, the owner can also receive $12,792 from the state.
This state incentive will be taxed by the federal government according to the federal tax bracket
that the owner falls under. In this case it is 33 percent. Thus the state incentive that the owner
will get will be $8,570. Adding all these numbers together the final cost of the system to the
homeowner will be $17,014.
Figure7: Federal and state tax incentives and subsidies available.
As mentioned in the prior utilities section the electricity rates are going to increase by 2011.
Based on the unpredictability of the market, PECO and other utilities in Pennsylvania are not
able to provide an exact number of the increase. The projections are starting at a 20 percent
increase and reaching 75 percent in regions such as Allegheny County. For the purpose of this
discussion it is going to be assumed that the owner will experience a 37 percent increase in the
Cost of the system:
$ 36,548
Cost of the System after rebate and
subsidies:
$17,014
30 % Federal Incentives: $ 10,964
State Incentives after federal tax: $ 8,570
35 % State incentives: $ 12,792
Federal tax on state incentive based on 33% tax bracket
www.MDCSystems.com
9
rates which is the current estimated increase given by the utilities for the West Chester ,
Pennsylvania area.
Another uncertainty is the rate structure. Currently, the owner pays 6.84 cents/ KWh for the
generation charge for the first 600 KWh used and 3.9 cents/KWh for the rest of the energy
purchased. The same trend applies to the transmission and distribution charges. Adding the
generation, transmission and transition charges the owner will pay 14.8 cents/KWh for the first
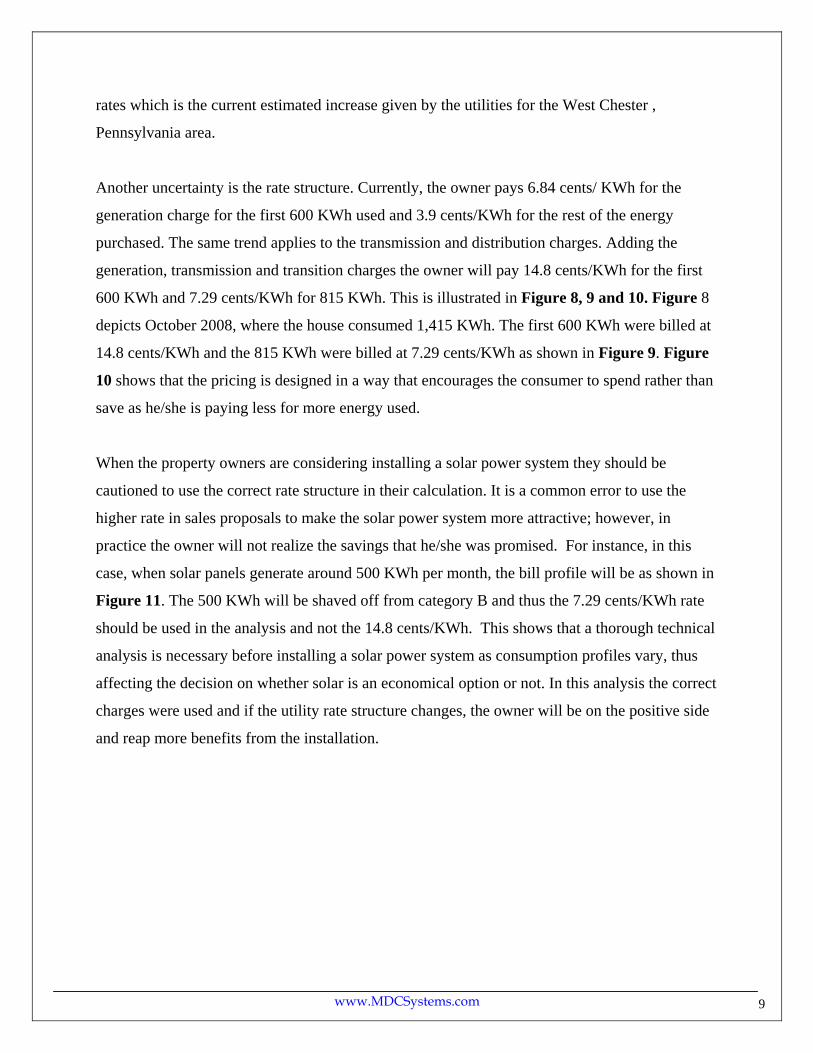
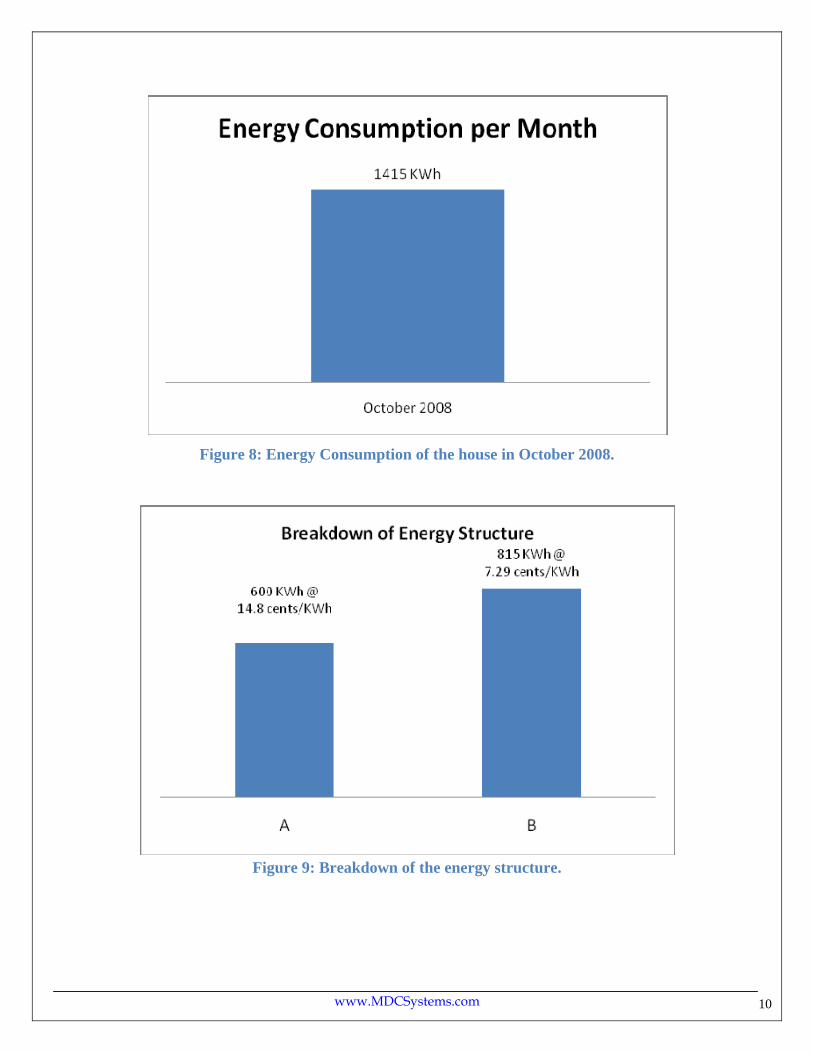
600 KWh and 7.29 cents/KWh for 815 KWh. This is illustrated in Figure 8, 9 and 10. Figure 8
depicts October 2008, where the house consumed 1,415 KWh. The first 600 KWh were billed at
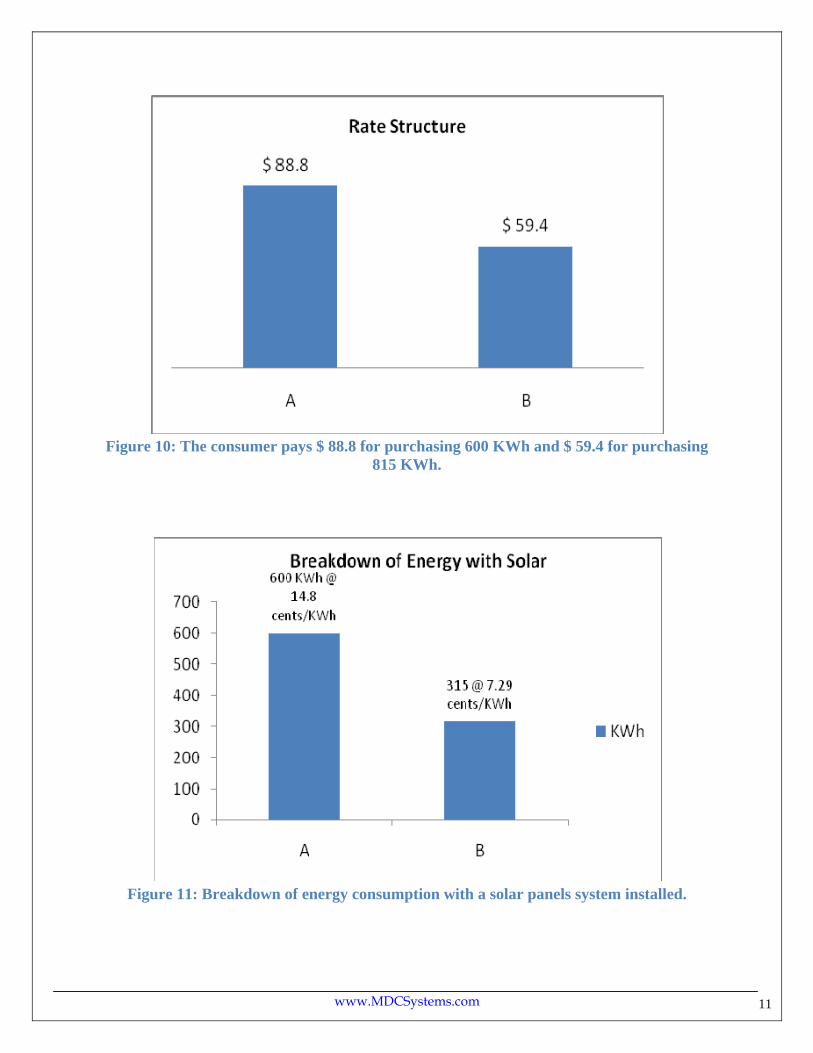
14.8 cents/KWh and the 815 KWh were billed at 7.29 cents/KWh as shown in Figure 9. Figure
10 shows that the pricing is designed in a way that encourages the consumer to spend rather than
save as he/she is paying less for more energy used.
When the property owners are considering installing a solar power system they should be
cautioned to use the correct rate structure in their calculation. It is a common error to use the
higher rate in sales proposals to make the solar power system more attractive; however, in
practice the owner will not realize the savings that he/she was promised. For instance, in this
case, when solar panels generate around 500 KWh per month, the bill profile will be as shown in
Figure 11. The 500 KWh will be shaved off from category B and thus the 7.29 cents/KWh rate
should be used in the analysis and not the 14.8 cents/KWh. This shows that a thorough technical
analysis is necessary before installing a solar power system as consumption profiles vary, thus
affecting the decision on whether solar is an economical option or not. In this analysis the correct
charges were used and if the utility rate structure changes, the owner will be on the positive side
and reap more benefits from the installation.
www.MDCSystems.com
10
Figure 8: Energy Consumption of the house in October 2008.
Figure 9: Breakdown of the energy structure.
www.MDCSystems.com
11
Figure 10: The consumer pays $ 88.8 for purchasing 600 KWh and $ 59.4 for purchasing
815 KWh.
Figure 11: Breakdown of energy consumption with a solar panels system installed.
www.MDCSystems.com
12
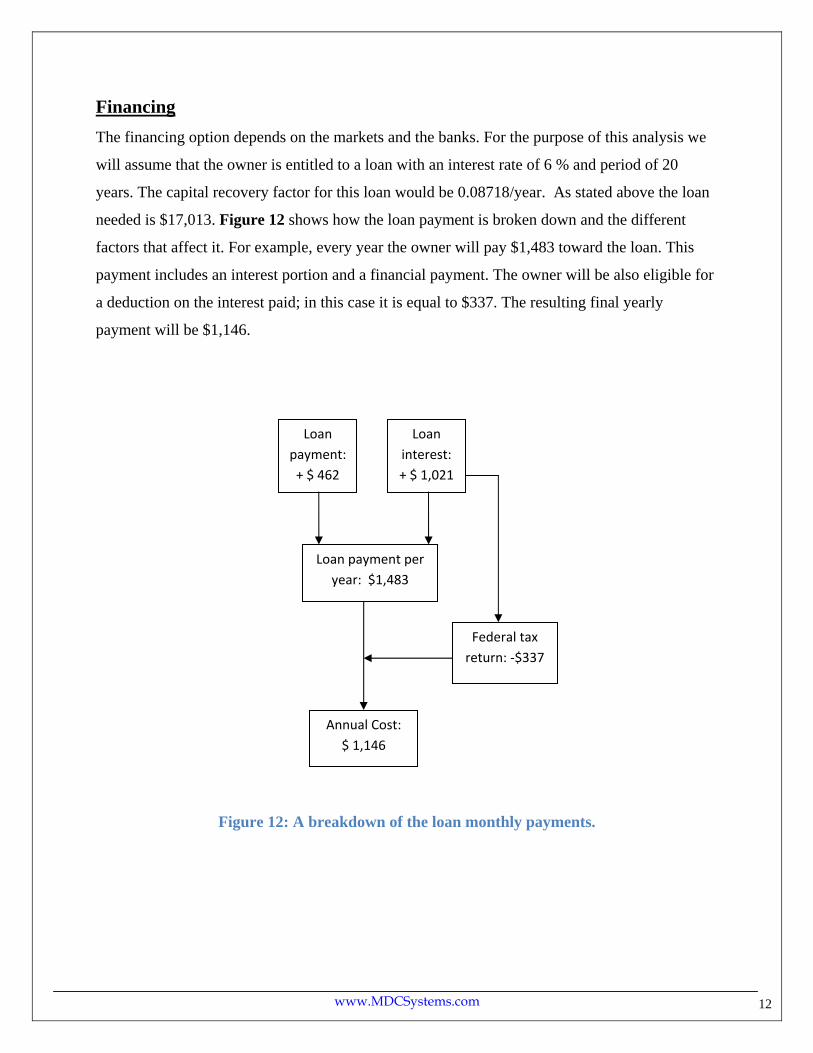
Financing The financing option depends on the markets and the banks. For the purpose of this analysis we
will assume that the owner is entitled to a loan with an interest rate of 6 % and period of 20
years. The capital recovery factor for this loan would be 0.08718/year. As stated above the loan
needed is $17,013. Figure 12 shows how the loan payment is broken down and the different
factors that affect it. For example, every year the owner will pay $1,483 toward the loan. This
payment includes an interest portion and a financial payment. The owner will be also eligible for
a deduction on the interest paid; in this case it is equal to $337. The resulting final yearly
payment will be $1,146.
Figure 12: A breakdown of the loan monthly payments.
Loan payment per year: $1,483
Annual Cost: $ 1,146
Loan interest: + $ 1,021
Federal tax return: ‐$337
Loan payment: + $ 462
www.MDCSystems.com
13
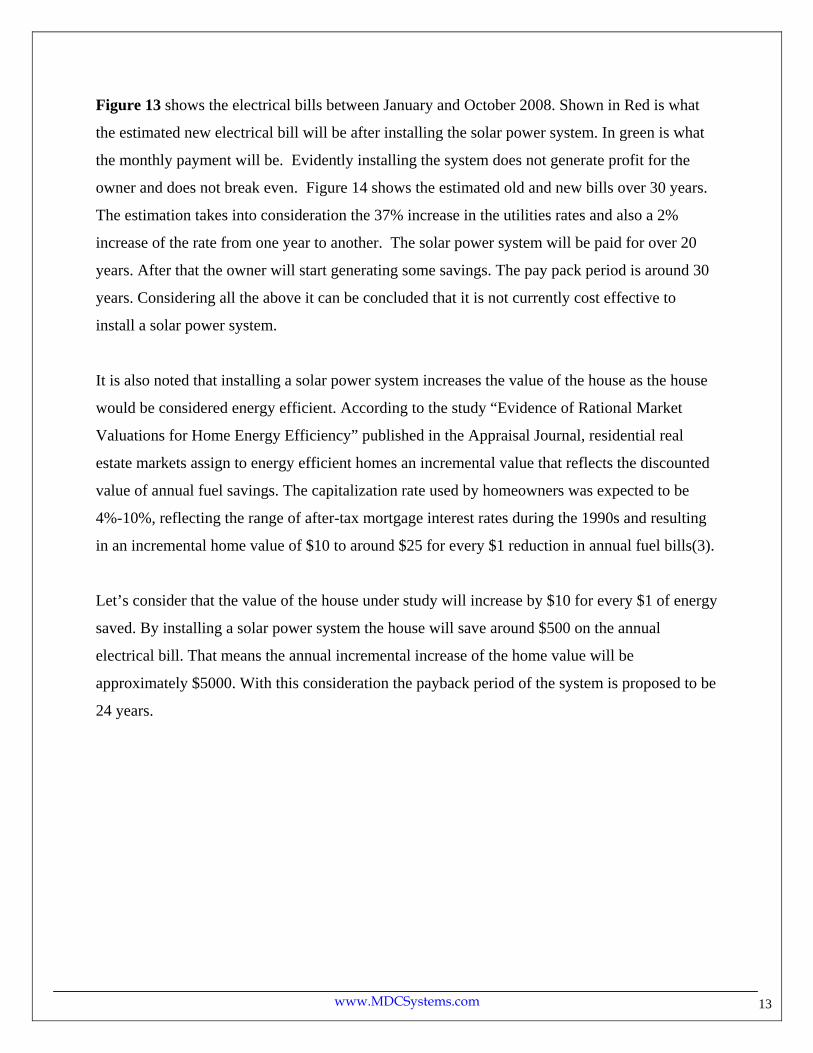
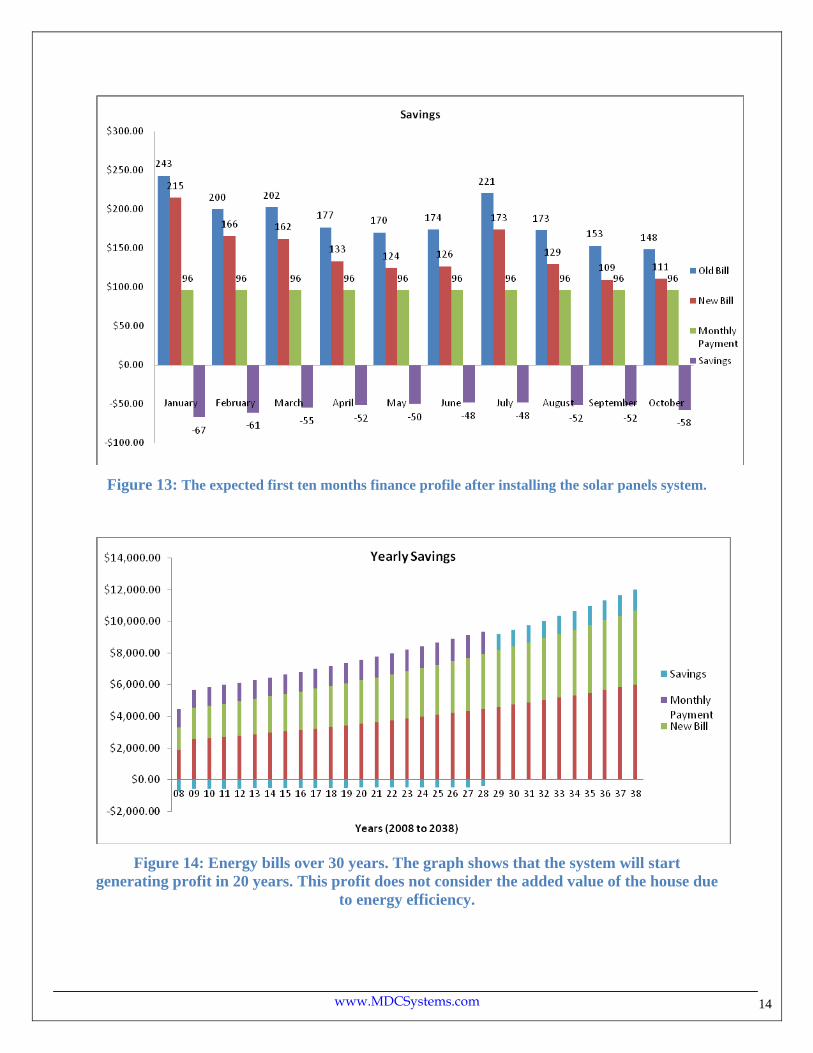
Figure 13 shows the electrical bills between January and October 2008. Shown in Red is what
the estimated new electrical bill will be after installing the solar power system. In green is what
the monthly payment will be. Evidently installing the system does not generate profit for the
owner and does not break even. Figure 14 shows the estimated old and new bills over 30 years.
The estimation takes into consideration the 37% increase in the utilities rates and also a 2%
increase of the rate from one year to another. The solar power system will be paid for over 20
years. After that the owner will start generating some savings. The pay pack period is around 30
years. Considering all the above it can be concluded that it is not currently cost effective to
install a solar power system.
It is also noted that installing a solar power system increases the value of the house as the house
would be considered energy efficient. According to the study “Evidence of Rational Market
Valuations for Home Energy Efficiency” published in the Appraisal Journal, residential real
estate markets assign to energy efficient homes an incremental value that reflects the discounted
value of annual fuel savings. The capitalization rate used by homeowners was expected to be
4%-10%, reflecting the range of after-tax mortgage interest rates during the 1990s and resulting
in an incremental home value of $10 to around $25 for every $1 reduction in annual fuel bills(3).
Let’s consider that the value of the house under study will increase by $10 for every $1 of energy
saved. By installing a solar power system the house will save around $500 on the annual
electrical bill. That means the annual incremental increase of the home value will be
approximately $5000. With this consideration the payback period of the system is proposed to be
24 years.
www.MDCSystems.com
14
Figure 13: The expected first ten months finance profile after installing the solar panels system.
Figure 14: Energy bills over 30 years. The graph shows that the system will start
generating profit in 20 years. This profit does not consider the added value of the house due to energy efficiency.
www.MDCSystems.com
15
Conclusion A comprehensive engineering and financial analysis of installing a solar power system on a
residential house was discussed. The location and incident solar radiation of the unit under study
is very favorable for installing the system. The house has minimal shading which makes it ideal
for a solar power system. The house has ample roof area for installing such a system as well.
Studying the energy consumption of the unit showed that consumption peaks in the summer,
which adds to the advantages of installing a solar power system. Finally a financial analysis was
conducted that took into account the increase in utility rates and financing option available for
the owner. The analysis showed that it is not profitable to install the system if the owner is
seeking immediate revenue from such a project. The payback period is around 24 years and only
after this time the owner will be able to generate profit. Finally, this analysis is based on current
market predictions. The electricity rates may increase rapidly, thus making a solar power system
investment viable.
Renewable energy systems, especially solar power systems, are highly customized. What might
work for one region or one house might not necessarily work for another. A thorough
engineering and financial analysis is required before embarking on such projects. The house
orientation and location, the roof structure and area, budget and consumption profile, to name
few, are all factors that must be investigated. As realized from this analysis an initial overview
of the house location and energy consumption profile made a solar power system an attractive
option; however, further detailed analysis showed that the system is not currently cost effective.
www.MDCSystems.com
16
Bibliography 1. Masters, Gilbert M. Renewable and Efficient Electric Power Systems. New Jeresey : John
Wiley & Sons, 2004.
2. Reuters. www.reuters.com. [Online] September 10, 2008.
http://www.reuters.com/article/pressRelease/idUS211109+10-Sep-2008+BW20080910.
3. Evidence of Rational Market Valuations for Home Energy Efficiency. Watson, Rick Nevin
and Gregory. Chicago : The Appraisal Journal, 1998.