Embed Size (px)
Citation preview
Prince William County Public SchoolsPrince William County, Virginia
For the fiscal year ended June 30, 2002
ComprehensiveAnnual Financial
eportR
Prince William County Public Schools Comprehensive Annual Financial Report For the Fiscal Year Ended June 30, 2002 Prince William County, Virginia
School Board
Lucy S. Beauchamp, Chairperson (At-Large) Stephen R. Wassenberg, Vice Chairperson Occoquan District
John David Allen, Sr., Coles District Lyle G. Beefelt, Brentsville District Joan R. Ferlazzo, Dumfries District Steve Keen, Woodbridge District
Donald P. Richardson, Gainesville District Mary F. Williams, Neabsco District
Superintendent of Schools Edward L. Kelly
Director of Finance David S. Cline
Department of Finance 14800 Joplin Road
Manassas, Virginia 20108 (703)-791-8753
This Report Prepared By:
Department of Finance 14800 Joplin Road
Manassas, Virginia 20108 (703)-791-8753
Director of Finance
David S. Cline
Supervisor of Fiscal Operations
John M. Wallingford
Chief Accountant Patricia Townsend
Accountants Maria Cavin, Karen Myers
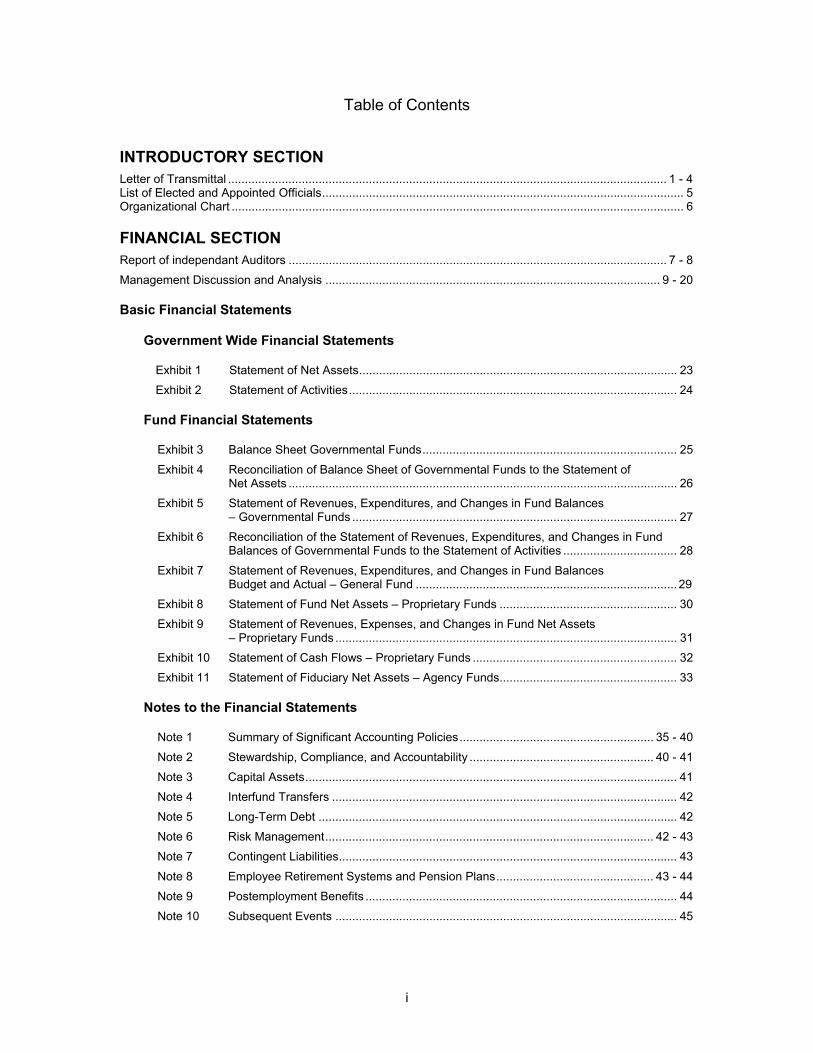
Table of Contents INTRODUCTORY SECTION
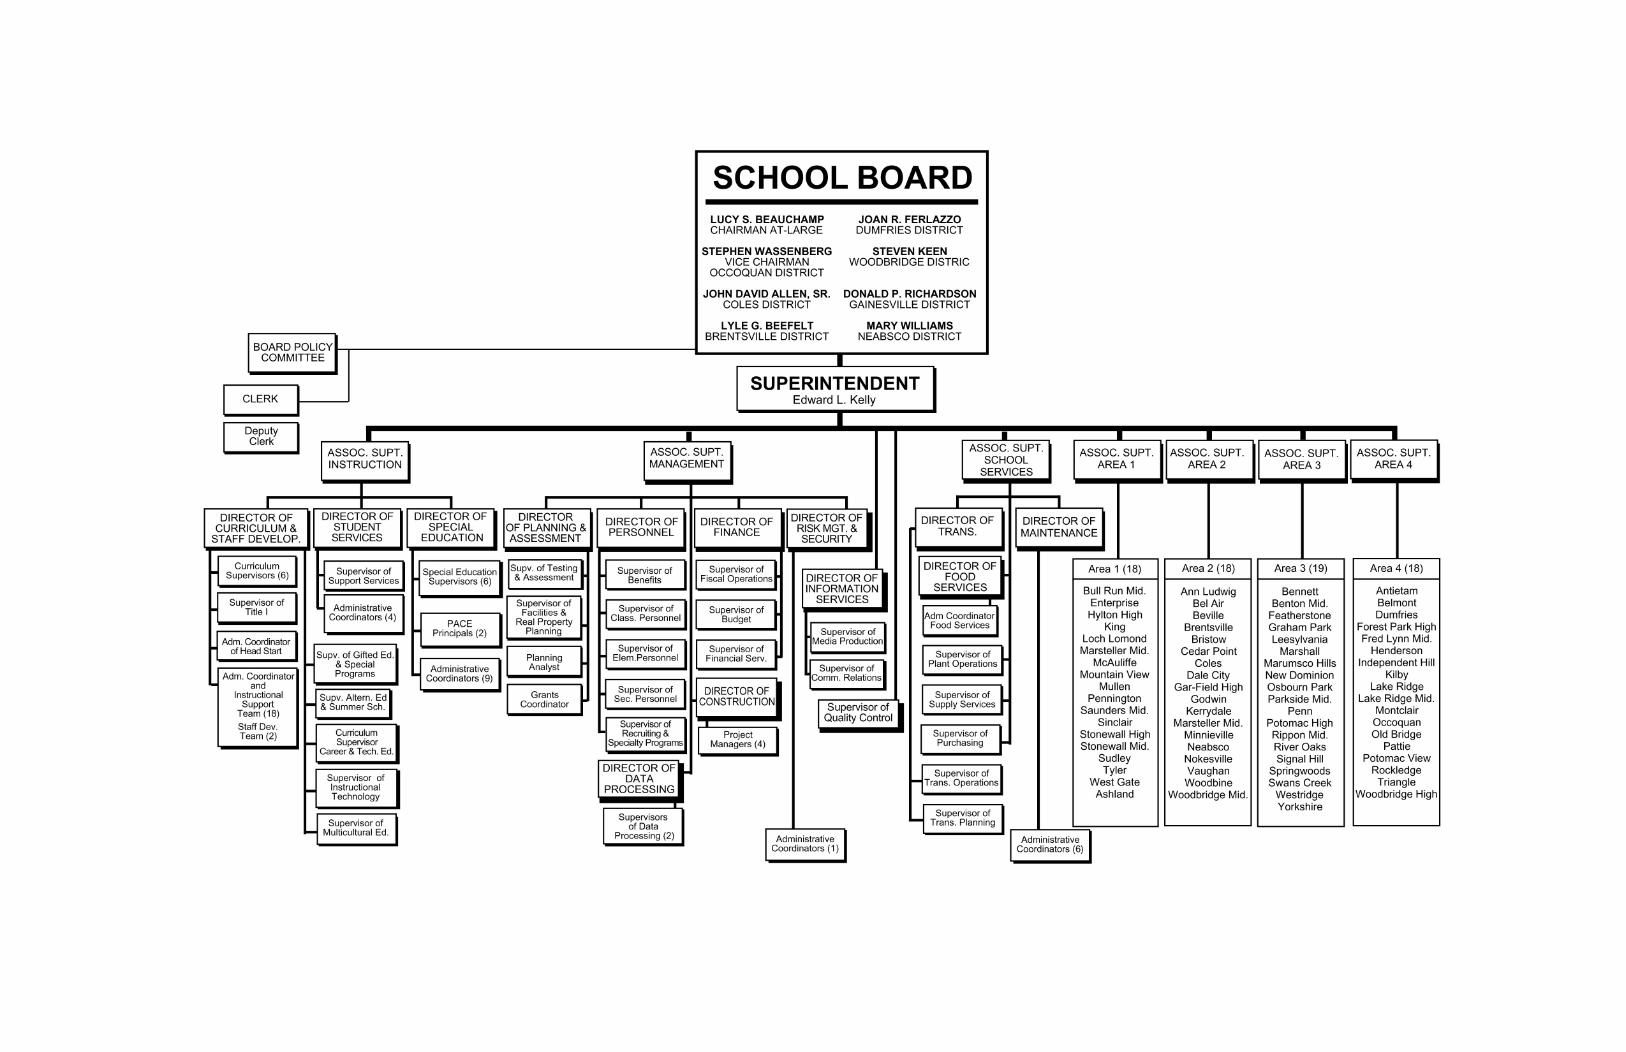
Letter of Transmittal ................................................................................................................................... 1 - 4 List of Elected and Appointed Officials............................................................................................................ 5 Organizational Chart ....................................................................................................................................... 6 FINANCIAL SECTION
Report of independant Auditors ................................................................................................................. 7 - 8
Management Discussion and Analysis .................................................................................................... 9 - 20 Basic Financial Statements
Government Wide Financial Statements
Exhibit 1 Statement of Net Assets............................................................................................... 23
Exhibit 2 Statement of Activities.................................................................................................. 24 Fund Financial Statements
Exhibit 3 Balance Sheet Governmental Funds............................................................................ 25
Exhibit 4 Reconciliation of Balance Sheet of Governmental Funds to the Statement of Net Assets .................................................................................................................... 26
Exhibit 5 Statement of Revenues, Expenditures, and Changes in Fund Balances – Governmental Funds ................................................................................................. 27
Exhibit 6 Reconciliation of the Statement of Revenues, Expenditures, and Changes in Fund Balances of Governmental Funds to the Statement of Activities .................................. 28
Exhibit 7 Statement of Revenues, Expenditures, and Changes in Fund Balances Budget and Actual – General Fund .............................................................................. 29
Exhibit 8 Statement of Fund Net Assets – Proprietary Funds ..................................................... 30
Exhibit 9 Statement of Revenues, Expenses, and Changes in Fund Net Assets – Proprietary Funds ...................................................................................................... 31
Exhibit 10 Statement of Cash Flows – Proprietary Funds ............................................................. 32
Exhibit 11 Statement of Fiduciary Net Assets – Agency Funds..................................................... 33 Notes to the Financial Statements
Note 1 Summary of Significant Accounting Policies.......................................................... 35 - 40
Note 2 Stewardship, Compliance, and Accountability ....................................................... 40 - 41
Note 3 Capital Assets............................................................................................................... 41
Note 4 Interfund Transfers ....................................................................................................... 42
Note 5 Long-Term Debt ........................................................................................................... 42
Note 6 Risk Management.................................................................................................. 42 - 43
Note 7 Contingent Liabilities..................................................................................................... 43
Note 8 Employee Retirement Systems and Pension Plans............................................... 43 - 44
Note 9 Postemployment Benefits ............................................................................................. 44
Note 10 Subsequent Events ...................................................................................................... 45
i
ii
Table of Contents (continued)
Required Supplementary Information
Schedule of Funding Progress for PWCPS ........................................................................................48
Supplementary Information
Schedule 1 Combining Balance Sheet Other Governmental Funds – Special Revenue Funds .......50
Schedule 2 Combining Statement of Revenues, Expenditures, and Changes in Fund Balances Other Governmental Funds - Special Revenue Funds .........................51
Schedule 3 Schedule of Revenues, Expenditures, and Changes in Fund Balance Budget and Actual - Food Services Fund.......................................................................52
Schedule 4 Schedule of Revenues, Expenditures, and Changes in Fund Balance Budget and Actual - Warehouse Fund ...........................................................................53
Schedule 5 Schedule of Revenues, Expenditures, and Changes in Fund Balance Budget and Actual - Facilities Use Fund ........................................................................54
Schedule 6 Combining Statement of Fund Net Assets Proprietary Funds Internal Service Funds ...................................................................................................55
Schedule 7 Combining Statement of Revenues, Expenses, and Changes in Fund Net Assets Proprietary Funds - Internal Service Funds .................................................56
Schedule 8 Combining Statement of Cash Flows Proprietary Funds - Internal Service Funds.........57
Schedule 9 Combining Statement of Fiduciary Net Assets - Agency Funds.....................................58 STATISTICAL SECTION
Table 1 General Governmental Expenditures by Function .........................................................59
Table 1A Capital Projects Expenditures by Function ....................................................................59
Table 2 General Governmental Revenues by Source ................................................................60 Table 3 Cost per Pupil ................................................................................................................61 Table 4 Student Enrollment ........................................................................................................62 Table 5 Food and Nutrition Services Program............................................................................63 Table 6 Scholastic Aptitude Test Scores ....................................................................................64 Prince William County, Virginia
Table 7 Property Tax Levies and Collections .............................................................................65
Table 8 Assessed and Estimated Market Value of Taxable Property .........................................66
Table 9 Property Tax Rates for Direct and Overlapping Governments.......................................67
Table 10 Principal Real Property Owners.....................................................................................68
Table 11 Computation of Net Tax-Supported Debt.......................................................................69
Table 12 Ratio of Net Tax-Supported Debt to Taxable Property Value and Net Tax-Supported
Debt per Capita .............................................................................................................70
Table 13 Ratio of Annual Debt Service Expenditures on Net Tax-Supported Debt to
General Governmental Expenditures and Revenues ....................................................71
Table 14 Computation of Net Tax-Supported and Overlapping Debt ...........................................72
Table 15 Demographic Statistics ..................................................................................................73
Table 15A Comparative Demographic Statistics.............................................................................73
Table 16 Real Property Assessed Value ......................................................................................74
Table 16A Commercial to Total Assessment Ratio, Construction and Bank Deposits....................74
Table 17 Miscellaneous Statistical Data ..................................................................................75-76

Introductory Section Letter of Transmittal
List of Elected Officials Organizational Chart
Prince William County Public Schools P.O. Box 389 Manassas, VA 20108
703-791-7200 Edward Kelly Superintendent of Schools
November 13, 2002 Mr. Chairman, Members of the County Board of Supervisors: Madam Chairman, Members of the School Board, And Citizens of the County of Prince William Virginia: We are pleased to present the Comprehensive Annual Financial Report of the Prince William County Public Schools (PWCPS), a component unit of Prince William County, Virginia, for the year ended June 30, 2002. This report consists of management’s representations concerning the finances of PWCPS. Consequently, management assumes full responsibility for the completeness and reliability of all of the information presented in this report. To provide a reasonable basis for making these representations, management of the PWCPS has established a comprehensive internal control framework that is designed both to protect the government’s assets from loss, theft, or misuse and to compile sufficient reliable information for the preparation of the PWCPS’ financial statements in conformity with accounting principles generally accepted in the United States. Because the cost of internal controls should not outweigh their benefits, the PWCPS’ comprehensive framework of internal controls has been designed to provide reasonable rather than absolute assurance that the financial statements will be free from material misstatement. As management, we assert that, to the best of our knowledge and belief, this financial report is complete and reliable in all material respects. PWCPS’ financial statements have been audited by Ernst & Young LLP, a firm of licensed certified public accountants. The goal of the independent audit was to provide reasonable assurance that the financial statements of PWCPS for the fiscal year ended June 30, 2002 are free of material misstatement. The independent audit involved examining, on a test basis, evidence supporting the amounts and disclosures in the financial statements; assessing the accounting principles used and significant estimates made by management; and evaluating the overall financial statement presentation. The independent auditor concluded, based upon the audit, that there was a reasonable basis for rendering an unqualified opinion that the PWCPS’ financial statements for the fiscal year ended June 30, 2002, are fairly presented in conformity with GAAP. The report of independent auditors is presented as the first component of the financial section of this report. The independent audit of PWCPS was part of a broader, federally mandated “Single Audit” for Prince William County (County) designed to meet the special needs of federal grantor agencies. The standards governing Single Audit engagements require the independent auditor to report not only on the fair presentation of the financial statements, but also on the audited government’s internal controls and compliance with legal requirements, with special emphasis on internal controls and legal requirements involving the administration of federal awards. These reports are available in the County’s separately issued Single Audit Report. GAAP requires that management provide a narrative introduction, overview, and analysis to accompany the basic financial statements in the form of Management’s Discussion and Analysis (MD&A). This letter of transmittal is designed to complement the MD&A and should be read in conjunction with it. PWCPS’ MD&A can be found immediately following the report of independent auditors.
A Quality Education for the Children, the Community, and the Future!
Profile of the Government Prince William County is located in Northern Virginia, approximately 35 miles southwest of Washington D.C. and encompasses an area of 348 square miles. Prince William County has, within its boundaries, the independent cities of Manassas and Manassas Park and the incorporated towns Dumfries, Haymarket, Occoquan and Quantico. The cities of Manassas and Manassas Park have their own public school divisions. PWCPS is a corporate body operating under the constitution of the Commonwealth of Virginia and the Code of Virginia. The eight members of the School Board are elected by the citizens of the County to serve four-year terms. One member represents each of the County's seven magisterial districts and the chairman serves at large. PWCPS is organized to focus on meeting the needs of its 58,069 students while managing 72 schools and centers. Local Economy The population of the County has grown at an average annual rate of 3.2 percent over the past decade and the vast majority of those County residents succeed in finding employment. The Virginia Employment Commission estimated the County’s at-place employment (jobs located in the County) was 84,569 in the fourth quarter of 2001, up from 79,467 in the fourth quarter of 2000. Retail and wholesale trades provided the largest share, 31 percent, of those jobs. The County had a civilian labor force of 157,740 and unemployment rate of 3.5 percent as of August 2002, according to the Virginia Employment Commission. The unemployment rates at that time in Virginia and the United States were 4.2 percent and 5.7 percent, respectively. The Census Bureau’s most recent estimates indicate that the County’s median household income rose from $52,078 in 1990 to $71,622 in 2000. The County’s real estate tax base consists primarily of residential housing. Commercial and industrial properties as of 2001 accounted for 20 percent of the real estate tax base. Assessed values of residential property continued to climb despite weakness in the national economy. The average assessed value of all residential property units in the County in 2001 was $160,116 compared to $144,979 in 2000. As of August 2002, year-to-date home sales in the County were 6,291 units compared to 4,718 units during the same period last year, according to the Virginia Association of Realtors. Real estate tax revenue in the County’s 2002 fiscal year grew 10.9 percent compared to the previous fiscal year. Maintaining an economic development climate that will attract, and foster the expansion of, environmentally-sound industries that create quality jobs, diversify the non-residential tax base, and allow people to live and work in the County is one of Prince William County’s five strategic goals. Since 1997, 131 companies announced they would locate or expand their operations within the County, according to the Prince William County Department of Economic Development. From these announcements, 7,397 high-tech jobs were created and $1.85 billion were invested in the County. The County’s economic strength has allowed the Board to reduce the tax rate on programmable computer equipment and peripherals from $3.70 to $1.25 per $100 of assessed value, making it the lowest in the region and creating a strong incentive for firms in targeted industries to locate in the County. The Board has also reduced the real estate tax rate by $.06 over the past two years to $1.30 per $100 of assessed value. The real estate tax rate was cut another $.07 in fiscal year 2003 to $1.23 Further, reflecting the vibrancy of the County’s economy, since the spring of 2000, Fitch IBCA and Moody’s Investors Service have designated the County’s bond rating as AA+ and Aa1, respectively. While Virginia and many surrounding local jurisdictions struggle with budget deficits, the County's fiscal year 2002 general fund surplus finalized at $23 million, due to conservative financial planning and strong management. Late this summer, the Governor of Virginia, Mark Warner was advised by leading business executives and economists to lower the State’s economic forecast. The new forecast meant the state must plan for $1.5 billion less revenue than had been originally projected for the current two-year budget. The causes are well known. The national economic recovery which was widely predicted has been slow and uneven; and Virginia’s own economic recovery has failed to materialize within the time frame that the professional economists originally predicted. “These budget reductions will affect vital services that Virginians count on, and there should be no attempt to disguise this”, said Governor Warner in his address on additional budget reductions October 15, 2002.
A Quality Education for the Children, the Community, and the Future! 2
Long-term Financial Planning Each year PWCPS prepares a five year budget plan. This plan incorporates expected revenue and expenditure growth to determine how future needs will be met. The goals of this five year plan are as follows: 1. To maintain current instructional, support, and extracurricular programs and services. 2. To provide services to new students. 3. To construct and operate the new schools and facilities identified in the Capital Improvements Program. 4. To complete all critical capital projects identified in the Capital Improvements Program. 5. To maintain competitive salaries and benefits for all employees. Each year PWCPS prepares a ten year Capital Improvements Plan (CIP). The CIP provides for the projected investment needs both with regard to new facilities and maintenance projects required to keep PWCPS facilities in good operating condition. This document also provides the necessary input for the five year budget plan with regard to debt service. The County has adopted several policy documents, including the Strategic Plan, the Comprehensive Plan, and the Principles of Sound Financial Management that help guide in both the general management, and financial management of PWCPS. Cash Management and Investments The County is the custodian of all cash and investments except for the Student Activity funds. These funds are held in local banks within the guidelines of Virginia State Law. Risk Financing PWCPS maintains a separate self-insurance program for its workers’ compensation insurance. The activities of these programs are reported in the Internal Service Funds. Revenues come primarily from other schools’ funds through “premiums” set to cover estimated self-insured claims and liabilities, excess, and other insurance premiums and operating expenses. Claims incurred (both reported and unreported) through June 30, 2002, are recorded as accrued liabilities. The program has sufficient reserves to cover its estimated claims liability. Please see note 6 of the financial statements for additional information. Pension Benefits and Other Postemployment Benefits PWCPS contributes to the Virginia Retirement System (VRS), an agent and cost-sharing multiple-employer public employee retirement system. The system acts as a common investment and administrative agent for political subdivisions in the Commonwealth of Virginia. All full-time, salaried permanent employees must participate in the VRS. Benefit provisions and all other requirements are established by state statute. PWCPS also offers, to all except substitute and temporary employees, a tax deferred annuity plan (TDA). PWCPS contributes money on the employee's behalf to purchase annuities after the employee has completed three (3) years of service with PWCPS. The School Board's contribution increases each time an employee has completed five (5), ten (10), and fifteen (15) years of service. At the end of the current year the cap on the employer contribution was $2,900. PWCPS provides limited postretirement health and dental benefits as provided for in Virginia state law to retirees who have 15 or more years of service with PWCPS. Retirees are granted the option to participate by paying 100% of their monthly health insurance premium to PWCPS’ plan or to the carrier of their choice less a maximum credit of $75. As of the end of the current fiscal year, there were 914 retirees receiving these benefits. The plan is financed by on-behalf payments from the Virginia Department of Education to the VRS. For fiscal year 2002 the contribution made on behalf of PWCPS was $1,435. The surplus funds are not considered advance funded because PWCPS, its employees, and retirees have no vested rights to access the excess funds. GAAP do not require governments to report a liability in the financial statements in connection with an employer's obligation to provide these benefits.
A Quality Education for the Children, the Community, and the Future! 3
4
A Quality Education for the Children, the Community, and the Future!
Acknowledgments Many professional staff members in the Finance Office of PWCPS contributed to the preparation of this report. Their hard work, professional dedication and continuing efforts to produce and improve the quality of this report are a direct benefit to all that read and use it. We would also like to acknowledge the cooperation and assistance of the PWCPS’ departments and agencies throughout the year in the efficient administration of the PWCPS’ financial operations. Additionally, we would like to thank the financial reporting and control division of the Prince William County who has helped support the efforts of PWCPS in the preparation of this report. This comprehensive annual financial report reflects the PWCPS’ commitment to the citizens of Prince William County, the Board of County Supervisors, the County School Board, and the financial community to provide information in conformance with the highest standards of financial accountability.
Respectfully,
Edward L. Kelly Dave S. Cline Superintendent of Schools Director of Finance
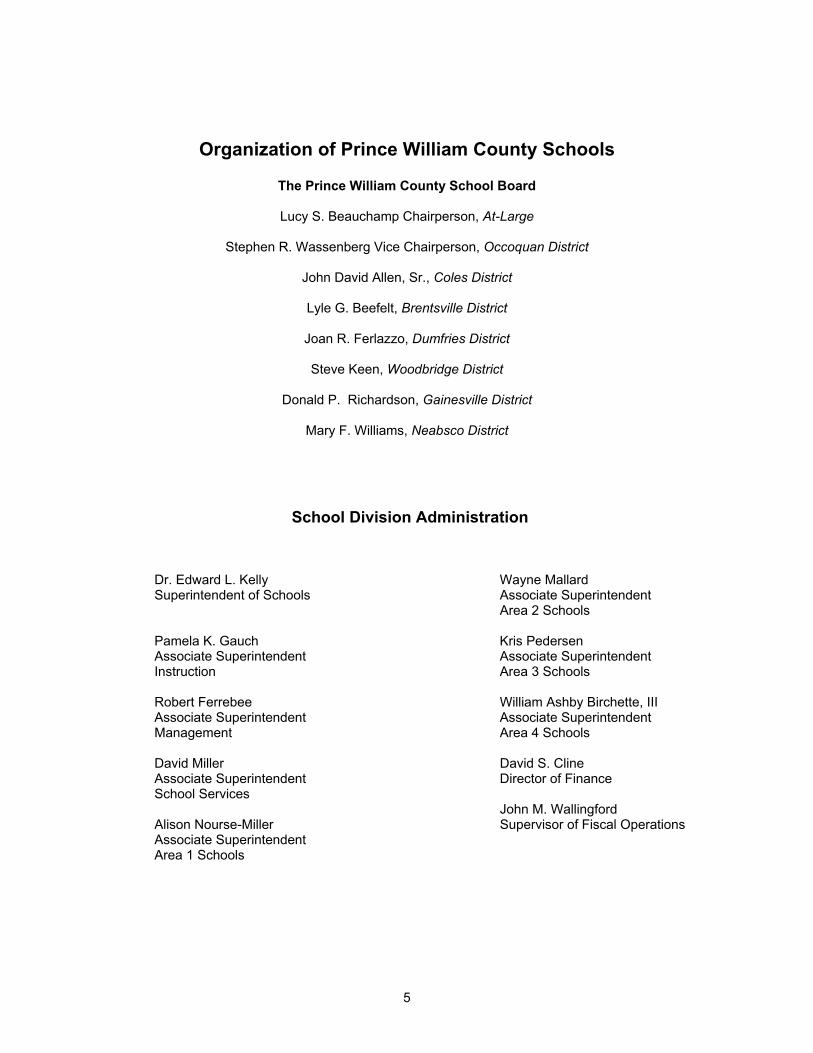
Organization of Prince William County Schools
The Prince William County School Board
Lucy S. Beauchamp Chairperson, At-Large
Stephen R. Wassenberg Vice Chairperson, Occoquan District
John David Allen, Sr., Coles District
Lyle G. Beefelt, Brentsville District
Joan R. Ferlazzo, Dumfries District
Steve Keen, Woodbridge District
Donald P. Richardson, Gainesville District
Mary F. Williams, Neabsco District
School Division Administration
Dr. Edward L. Kelly Wayne Mallard Superintendent of Schools Associate Superintendent Area 2 Schools Pamela K. Gauch Kris Pedersen Associate Superintendent Associate Superintendent Instruction Area 3 Schools Robert Ferrebee William Ashby Birchette, III Associate Superintendent Associate Superintendent Management Area 4 Schools David Miller David S. Cline Associate Superintendent Director of Finance School Services John M. Wallingford Alison Nourse-Miller Supervisor of Fiscal Operations Associate Superintendent Area 1 Schools
5