Embed Size (px)
Citation preview

SUPPLEMENT
The preclinical profile of the duocarmycin-based HER2-targeting ADC SYD985
predicts for clinical benefit in low HER2-expressing breast cancers.
Miranda M.C. van der Lee(1), Patrick G. Groothuis(1), Ruud Ubink(1), Monique A.J. van
der Vleuten(1), Tanja A. van Achterberg(1), Eline M. Loosveld(1), Désirée Damming(1),
Daniëlle C.H. Jacobs(1), Myrthe Rouwette(1), David F. Egging(1), Diels van den
Dobbelsteen(1), Patrick H. Beusker(2), Peter Goedings(3), Gijs F.M. Verheijden(4),
Jacques M. Lemmens(4), Marco Timmers(4), Wim H.A. Dokter(1)
Authors’ Affiliations: Departments of (1)Preclinical; (2)Medicinal & Protein Chemistry;
(3)Medical R&D; (4)New Molecular Entities, Synthon Biopharmaceuticals, Nijmegen, the
Netherlands.
Running title: SYD985 is effective in low HER2-expressing breast cancer.
Corresponding Author: Wim Dokter, Synthon Biopharmaceuticals , Microweg 22,
6503 GN Nijmegen, the Netherlands. Tel: +31 (0)24 372 7700, email:
Disclosure of potential conflict of interest: All authors are employees of Synthon
Biopharmaceuticals BV. JL owns stock of Synthon BV.
Financial Support of this study came from Synthon Biopharmaceuticals BV.
1

SUPPLEMENT
Supplementary Tables.
Table S1. Summary of status of tumors used in cell line and patient-derived xenograft
models.
Model Type HER2 FISH HER2 IHC ER/PR
BT474 CDX + 3+ +
MAXF 1162 PDX + 3+ -
ST313 PDX - 2+ +
HBCx-34 PDX - 2+ +
MAXF 449 PDX - 1+ -
MAXF MX1 PDX - 1+ -
HBCx-10 PDX - 1+ -
2

SUPPLEMENT
Table S2. SYD985 and T-DM1 IC50, 95% confidence interval and % efficacy values
from the in vitro cytotoxicity assays as depicted in Figure 1B.
Cell line HER2 level
SYD985 T-DM1
IC50 (ng/ml) 95% CI %
efficacyIC50
(ng/ml) 95% CI % efficacy
SK-BR-3 3+ 6.9 6.5 to 7.3 99 15.7 14.7 to 16.9 98
UACC-893 3+ 54.1 49.1 to 59.6 93 35.9 33.6 to 38.3 88
NCI-N87 3+ 24.5 23.0 to 26.0 94 44.9 41.3 to 48.7 91
SK-OV-3 2+ 32.4 30.2 to 34.8 86 112 66.4 to 189 72
MDA-MB-175-VII 1+ 67.4 37.4 to 121 94 314 201 to 490 93
ZR-75-1 1+ 14.9 10.8 to 20.6 61 >1000 89
SW-620 0 >1000 34 >1000 29
NCI-H520 0 >1000 66 >1000 81
3

SUPPLEMENT
Table S3. Pharmacokinetic parameters for ADC (SYD985 and T-DM1) in BT-474-
tumor-bearing mice after a single i.v. bolus injection of ADC.
ADC Analyte dose (mg/kg)
t ½(hr)
Cmax
(ug/mL)C0
(ug/mL)AUClast
(hr*ug/mL)CL
(mL/hr/kg)Vss
(mL/kg)
T-DM1 ADC 1 67 15 16 527 1.8 120
ADC 5 141 99 106 2970 1.7 198
SYD985 ADC 1 9.5 17 17 54.9 18.2 92.9
ADC 3 55 50 59 151 19.7 201.8
Supplementary Figure Legends.
Figure S1. In vitro cytotoxicity. Comparison of two batches of T-DM1. Four tumor cell
lines were treated for 6 days with T-DM1 EU batch N0001B02 or US batch 535405.
Induction of cytotoxicity was quantified by measuring the percentage of cell survival
Figure S2. A-G HER2 expression in BT-474 (A.) and breast cancer patient derived
xenografts (B-G). Tumors were stained with the primary Ab anti-HER2/neu (4B5) rabbit
monoclonal on a Discovery automated platform (Ventana-Roche).
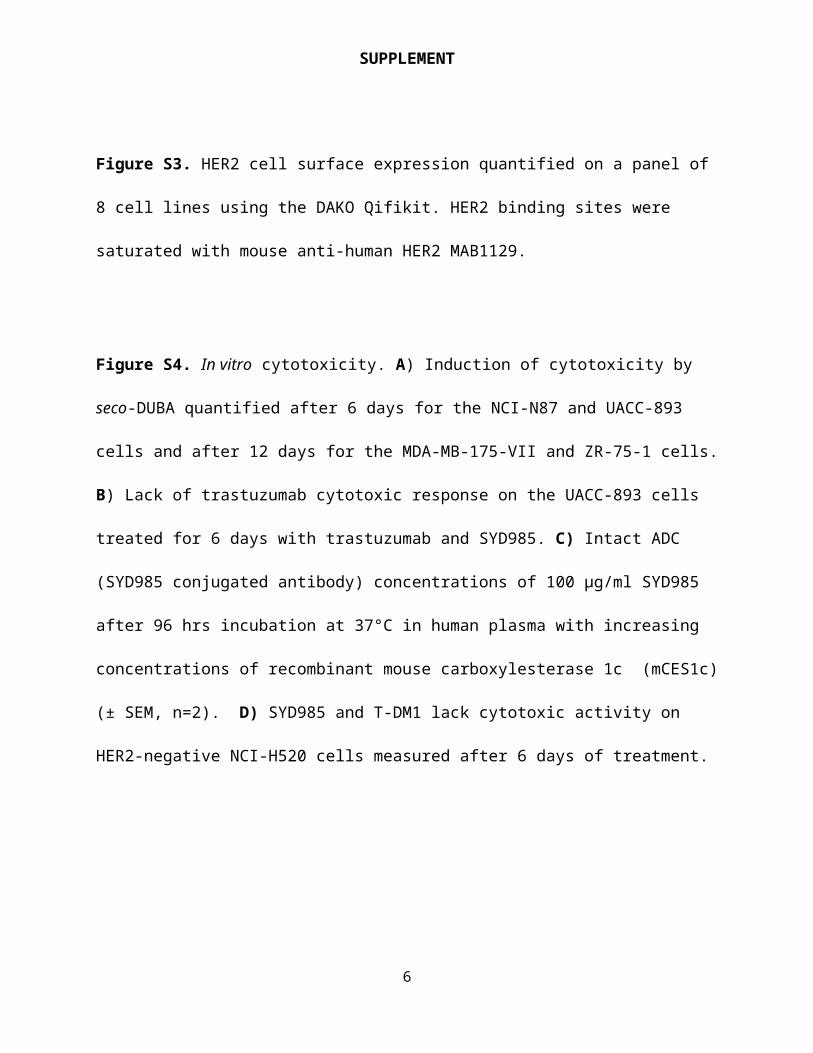
Figure S3. HER2 cell surface expression quantified on a panel of 8 cell lines using the
DAKO Qifikit. HER2 binding sites were saturated with mouse anti-human HER2
MAB1129.
4

SUPPLEMENT
Figure S4. In vitro cytotoxicity. A) Induction of cytotoxicity by seco-DUBA quantified
after 6 days for the NCI-N87 and UACC-893 cells and after 12 days for the MDA-MB-
175-VII and ZR-75-1 cells. B) Lack of trastuzumab cytotoxic response on the UACC-
893 cells treated for 6 days with trastuzumab and SYD985. C) Intact ADC (SYD985
conjugated antibody) concentrations of 100 µg/ml SYD985 after 96 hrs incubation at
37°C in human plasma with increasing concentrations of recombinant mouse
carboxylesterase 1c (mCES1c) (± SEM, n=2). D) SYD985 and T-DM1 lack cytotoxic
activity on HER2-negative NCI-H520 cells measured after 6 days of treatment.
Figure S5. In vitro bystander killing. (A) Cytotoxicity induced on HER2-positive, HER2-
negative and co-cultured cells after 12 days of treatment with 1 g/ml of ADCs or 10 nM
of active toxin using the CellTiter-Glo luminescence assay. Percentage survival was
calculated related to untreated cells quantified by measuring the percentage of cell
survival.
Figure S6. Mean ADC (SYD985 conjugated antibody) concentrations in plasma in
carboxylesterase CES1c knock-out (-/-) , CES1c heterozygeous (+/-) and CES1c wild
type (+/+) mice, after single i.v. bolus injection of SYD985 at 5 mg/kg (+/- SEM, n = 3).
5
SUPPLEMENT
Figure S1.
0.1 1 10 100 1000 100000
20
40
60
80
100
120
SK-BR-3
SK-BR-3
Concentration (ng/ml)
% S
urvi
val
SW-620
SW-620
MDA-MB-175-VII
MDA-MB-175-VII
SK-OV-3
SK-OV-3
EU batch N0001B02 on:
US batch 535405 on:
6

SUPPLEMENT
Figure S2.
A. B.
D.C.
BT-474 HER2 3+ MAXF 1162 HER2 3+
ST313 HP HER2 2+ HBCx-34 HP HER2 2+
E. MAXF 449 TNBC HER2 1+ F. MAXF MX1 TNBC HER2 1+ HBCx-10 TNBC HER2 1+G.
7

SUPPLEMENT
Figure S3.H
ER2
bind
ing
site
s pe
r cel
l
SK-BR-3
UACC893
NCI-N87
SK-OV-3
ZR-75-1
MDA-MB-17
5-VII
SW62
0
NCI-H52
00
100,000
200,000
300,000
400,000
500,000
600,000
700,000
800,000
900,000
1,000,000
8

SUPPLEMENT
Figure S4.
A.
-13 -12 -11 -10 -9 -8 -70
20
40
60
80
100
120
NCI-N87
Log conc (molar drug equivalents)
% S
urvi
val
ZR-75-1MDA-MB-175UACC893
0.1 1 10 100 1000 100000
20
40
60
80
100
120
Concentration (ng/ml)%
Sur
viva
l
trastuzumabSYD985
B.
D. HER2-negative NCI-520 cells
-13 -12 -11 -10 -9 -8 -7 -60
20
40
60
80
100
120
SYD985
Isotype control ADC
T-DM-1Seco-DUBA
Log conc (molar drug equivalents)
% s
urvi
val
C.
Con
cent
ratio
n (µ
g/m
l)
0
20
40
60
80
100
120
µg/ml mCES1c0 10 100 200 400
9

SUPPLEMENT
Figure S5.
0102030405060708090
100110120130140150160
% S
urvi
val
MDA-MB-175-VII / NCI-H520 12 days
HER2 1+MDA-MB-175-VII
HER2 0NCI-H520
Co-cultureMDA-MB-175-VII
+NCI-H520
SYD985
Isotype control ADC
T-DM-1Seco-DUBA
SYD985 T-DM1 Isotype control ADC Seco-DUBA0
20
40
60
80
100
120
% S
urvi
val
100% + 0%80% + 20%60% + 40%40% + 60%20% + 80%0% + 100%
Co-cultured cells:SK-BR-3 + NCI-H520 HER23+ HER20
A.
B.
10

SUPPLEMENT
Figure S6.
Time (h)
Con
cent
ratio
n (µ
g/m
L)
0 100 200 3000.01
0.1
1
10
100
1000
CES1c +/+CES1c +/-CES1c -/-
11


![ME 6503 — DESIGN OF MACHINE ELEMENTS · ME 6503 — DESIGN OF MACHINE ELEMENTS Mechanical Engineering Fifth Semester UNIT - 5 Part A 1. Classify the types of bearings. [N/D 16]](https://img.pdfslide.us/doc/110x75/5b7b375b7f8b9aa74b8c2083/me-6503-design-of-machine-me-6503-design-of-machine-elements-mechanical.jpg)


![78TH DAY] MONDAY, FEBRUARY 18, 2008 6503 Journal of the …](https://img.pdfslide.us/doc/110x75/61c82183a7b1d16c993295b4/78th-day-monday-february-18-2008-6503-journal-of-the-.jpg)