Embed Size (px)
Citation preview

P a g e 1 | 76
McLeod Health Dillon
2019 Community Health Needs Assessment
Approved by McLeod Medical Center Dillon Board of Directors on 07/20/2019

P a g e 2 | 76
Introduction
Health begins —long before illness—in our homes, schools and jobs. Through
meaningful collaboration, we have the opportunity to make choices that can help us all to live a
healthy life, regardless of income, education or ethnic background. This Community Health
Needs Assessment and Action Plan presents an opportunity for improving health status.
People whose circumstances have made them vulnerable to poor health need our help in
working towards eliminating barriers that provide everyone with the chance to live a healthy life.
This work can’t happen without first making use of the facts that serve as the foundation. Health
research provides indicators of health status, such as the prevalence of disease or health issue and
its effect in both economic and human terms. As health improvement initiatives are introduced,
it can reflect the effectiveness of an approach or intervention. By using the Community Health
Needs Assessment, we can evaluate relevant determinants of health that provides valuable insight
in guiding decisions that create a pathway for improving the health of our community. As you
read the Community Health Needs Assessment, it can change the way you think about health.
After reviewing the report, it is important to begin where health starts. Everyone in our
community should have the opportunity to make good healthy choices (e.g., regarding smoking,
diet, alcohol use, physical activity) since this has the largest impact on future health outcomes.
Wherever possible, through programs, services, public policy or other means, emphasis needs to
be placed on addressing health choices and prevention before there is a medical need. Research
has shown that the health care system represents only 10-20% of determining health status, while
our individual health behaviors we choose account for 40% or more.
Through changes in public policy, it is possible that most people, regardless of income,
could have the ability to see a doctor. Health insurance does not guarantee good health, but it
does provide important access to preventative health services. It can reduce the risk of deferring
needed care and the financial risk associated with receiving care. Those most vulnerable to poor
health often have the weakest voice when it comes to health policy. Our efforts should prioritize

P a g e 3 | 76
our resources to address the most pressing needs, disparities, and inequalities where we may be
impactful.
Our success should be linked to collaboration where our collective efforts can build a
healthy community that nurtures its families and communities. McLeod Health encourages
partnerships with volunteers, business, government, civic and religious institutions to join us in
this work. Although we will not be able to eradicate every illness, there is much we can
accomplish by education, fostering good health and addressing community health gaps. Health
begins with healthy relationships, healthy communities, and healthy jobs, which can protect us
from the stress of everyday life.
Input was solicited and taken into account from the following sources in identifying and
prioritizing significant health needs and in identifying resources potentially available to address
those health needs:
At least one state, local, or regional governmental public health department (or equivalent
department or agency), or State Office of Rural Health with knowledge, information, or
expertise relevant to the health needs of the community
Members of medically underserved, low-income, and minority populations in the
community served by the hospital facility or individuals or organizations serving or
representing the interests of these populations
Solicitation of comments received on the hospital facility’s most recently conducted
CHNA and most recently adopted implementation strategy
One-on-one interviews, questionnaires, and forums were conducted in Spring 2019 as a means to
gather input.
Top Health Concerns Reported Among Community Members
Obesity
Drug Abuse

P a g e 4 | 76
Cancer
Heart Disease/Stroke
Source: McLeod Health 2019 Survey
Top Health Concerns Reported Among Health Professionals
Most frequent health concerns:
Drug Abuse
Obesity
Access to Specialty Care
Source: McLeod Health 2019 Survey
Primary Diagnosis Admitted to Emergency Department
Most frequent health needs presenting to McLeod Health Dillon Emergency Department October
2017 – September 2018:
Abdominal Pain
Chest Pain
Urinary Tract Infection
Acute Upper Respiratory Infection
Acute Pharyngitis
Influenza
Acute Bronchitis
Headache
Acute Sinusitis
Vomiting
Source: McLeod Health Clinical Outcomes

P a g e 5 | 76
Primary Inpatient Diagnosis
Most frequent health needs presenting to McLeod Health Dillon
October 2017 – September 2018:
Obstetrical Care, Labor and Deliver, Vaginal and Cesarean Section
Sepsis
Acute and Chronic Respiratory Failure
Acute Kidney Failure
Hypertension with Heart Failure
Chronic Obstructive Pulmonary Disease
Acute Respiratory Failure
Cerebral Infarction
Source: McLeod Health Clinical Outcomes
Opportunities & Plan Priorities
McLeod Dillon has developed an action plan that collaborates with community partners to
provide community health initiatives that are focused on areas listed below and further described
within the Implementation Plan that utilizes evidence-based practices for addressing:
Chronic Diseases
Access to Care
Substance Abuse
Sexual Health
About McLeod Health Dillon
With a strong history in the Dillon community since 1943, McLeod Dillon, formally
Saint Eugene Hospital has continued to grow and expand to serve residents of Dillon (SC) and
Robeson (NC) counties with excellence in patient care. The DNV-GL accredited medical center

P a g e 6 | 76
employs 350 and has the strength of 100 physicians on its medical staff. McLeod Dillon,
established in 1998, offers general and orthopedic surgery, women's services, emergency
services, intensive care, rehabilitative services and cardiac rehabilitation. Investments in state of
the art technology to improve patient care have included MRI, 3D mammography, 4D
ultrasounds, CT Scans, and nuclear and vascular studies.
McLeod Medical Center Dillon, a member of the McLeod Health network, has been
serving Dillon County for 70 years. Dillon County residents have looked to McLeod Dillon to
meet their health care needs. During this time, McLeod Dillon has expanded its clinical services
and added new members to the medical, clinical and non-clinical staff to meet the changing
needs of the citizens we serve. Providing our community with a level of care rarely found
outside large urban hospitals is among our most recognized achievements at McLeod Dillon.
OVERVIEW
This Community Health Needs Assessment serves as a tool to evaluate the overall health
status, behaviors and needs of Dillon County. The March 2010 passage of the Patient Protection
and Affordable Care Act (ACA) introduced reporting requirements for private, not-for-profit
hospitals. To meet these new federal requirements, the information gathered in this assessment is
used to guide the strategic planning process in addressing health disparities.
A Community Health Needs Assessment gives information to health care providers to
make decisions and commit resources to areas of greatest need, making the greatest impact on
community health status.
This assessment incorporates data from within the community, such as individuals served
and health organizations, as well as vital statistics and other existing health-related data to
develop a tailored plan which targets the needs of the county. The Community Health Needs
Assessment includes:
P a g e 7 | 76
METHODS
An assessment team comprised of McLeod Health's Community Health and
Communication and Public Information staff reviewed literature, data and publications from
public sources. Members of the assessment team represented each of the seven acute care
hospital facilities within McLeod Health and were assigned to collect data that represented
indicators of community health status or its socioeconomic determinants. Therefore, focus was
placed on identifying locally-appropriate indicators, benchmarks, and pertinent health issues.
Pre-existing databases containing local, state and national health and behavior data were
used for comparisons when possible. Sources of this data are listed at the end of this document.
Data collection was limited to the most recent publicly available resources and some
primary data from qualitative and quantitative investigation. As a result, this document portrays
a partial picture of the health status of the community served.
Data analysis included demographic, socioeconomic and health determinant measures.
When possible, data also was analyzed according to age, gender and/or race to offer insight into
health disparities that may affect specific subgroups in the community.
Health Status Data
Community Survey
Provider Survey
Prioritize NeedsFinal CHNA
ReportImplementation
Planning
Action Plan and Implementation

P a g e 8 | 76
A summary of county data is reflected as a comparison to state and national data when
available to indicate community health concerns.
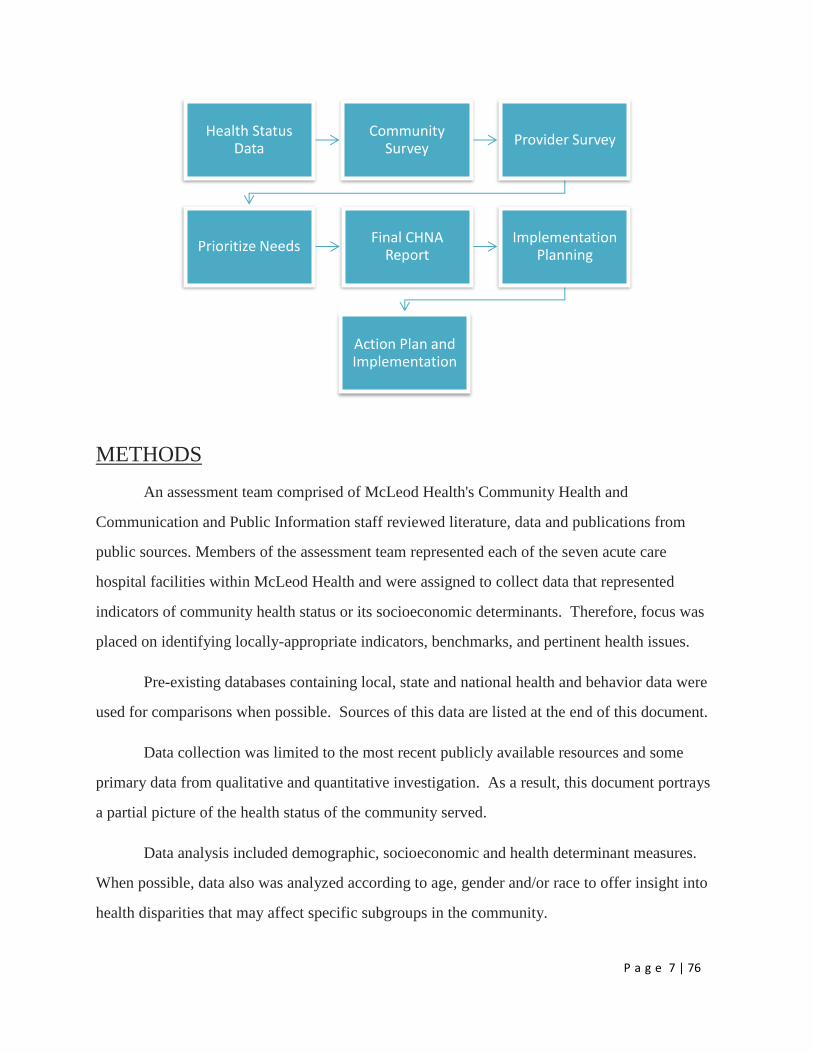
HEALTH DETERMINANTS AND DISPARITIES
What are the determinants of health?
Health behaviors had the majority overall impact on future health outcomes (i.e.,
smoking, diet, drug & alcohol use, physical activity, other lifestyle behaviors) and account for
40% of causes for premature death. Genetic predisposition is responsible for 30%, Social
circumstances 15%, and Health care for only 10% (i.e., access to physician and other health
services) of health risk for premature death.
Behavioral Determinants (40%)
Examples:
Diet
Physical activity
P a g e 9 | 76
Alcohol, cigarette, and other drug use
Hand washing
Genetic Determinants (30%)
Examples:
Age
Sex
HIV status
Inherited conditions, such as sickle-cell anemia, hemophilia, and cystic fibrosis
Carrying the BRCA1 or BRCA2 gene, which increases risk for breast and ovarian cancer
Family history of heart disease, cancer, etc.
Social Determinants (15%)
Examples:
Availability of resources to meet daily needs, such as educational and job opportunities,
living wages, or healthful foods
Social norms and attitudes, such as discrimination
Exposure to crime, violence, and social disorder, such as the presence of trash
Social support and social interactions
Socioeconomic conditions, such as concentrated poverty
Quality schools
Transportation options
Public safety

P a g e 10 | 76
Health Care Determinants (10%)
Examples:
Quality, affordability, and availability of services
Lack of insurance coverage
Limited language access
Environmental Determinants (5%)
Examples:
Quality of food, water, and air
Worksites, schools, and recreational settings
Housing, homes, and neighborhoods
Exposure to toxic substances and other physical hazards
Physical barriers, especially for people with disabilities
What are health disparities?
“Health disparity” refers to a higher burden of illness, injury, disability, or mortality
experienced by one population group relative to another group. Health disparities can involve
the medical care differences between groups in health insurance coverage, access to care, and
quality of care. While disparities are commonly viewed through the lens of race and ethnicity,
they occur across many dimensions, including socioeconomic status, age, location, gender, and
disability status. Poor health status is often linked with people without health insurance, those
who have poor access of care (i.e., limited transportation), lower socioeconomic status, lower
education obtainment, and those among racial minority groups. Beyond the provision of health
care services, eliminating health disparities will necessitate behavioral, environmental, and

P a g e 11 | 76
social-level approaches to address issues such as insufficient education, inadequate housing,
exposure to violence, and limited opportunities to earn a livable wage.
Health disparities have persisted across the nation and have been documented for many
decades and, despite overall improvements in population health over time, many disparities have
persisted and, in some cases, widened. Moreover, economic downturns contributed to a further
widening of disparities.
The Community Health Needs Assessment attempts to identify and quantify the health
disparities within a defined county population that are at disproportionately higher in incidence
of disease, disability, or at risk of experiencing worse health outcomes. Within these identified
disparities and availability of health resources, gaps can be identified and prioritized based on
need so that health resources can be targeted. Planning initiatives to address community health
needs take in consideration the existing initiatives, the available resources that we are aware of,
and where future improvements can be anticipated to make meaningful impact on improving
community health.
What are Key Initiatives to reduce disparities?
In 2010, the U.S. Department of Health and Human Services (HHS) established a vision
of, “a nation free of disparities in health and health care,” and set out a series of priorities,
strategies, actions, and goals to achieve this vision. States, local communities, private
organizations, and providers also are engaged in efforts to reduce health disparities.
Federal, state, and local agencies and programs work along with local hospitals, often in
cooperation, to provide access to needed health care services. Within constraints of limited
resources, each of these entities generally target populations with specific services offered within
the county. This study attempts to incorporate their input into determining the priorities among
health disparities and look for opportunities for collaboration.
P a g e 12 | 76
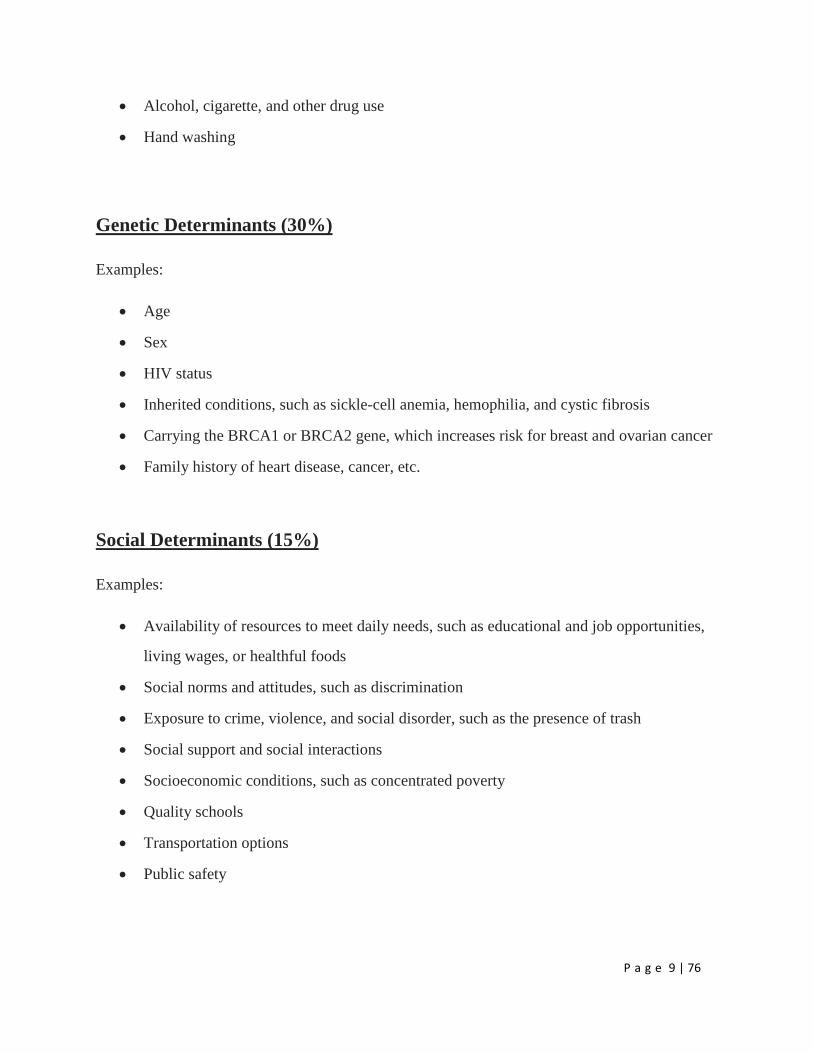
COMMUNITY DEFINED FOR THIS ASSESSMENT
The community was defined based on the geographic origins of McLeod Dillon inpatient and
outpatient hospital data, the study area for this assessment is defined as Dillon County which
represents the majority of patients served, to include the zip codes shown in Table 1.

P a g e 13 | 76
Table 1. McLeod Dillon Primary Service Area ZIP Codes
Demographics
Current population demographics and changes in demographic composition over time play a
determining role in the types of health and social services needed by communities.
The following information represents indicators of health status. The gauge displays, where
available, compare local data to state and national data. A green needle on the gauge indicates
the county is performing above the state and national data. A red needle indicates the county is
performing below the state and national data.
Total Population
A total of 31,073 people live in the 405.07 square mile report area defined for this assessment
according to the U.S. Census Bureau American Community Survey 2013-17 5-year estimates.
ZIP Code City County
28340 Fairmont Robeson, NC
28369 Orrum Robeson, NC
28383 Rowland Robeson, NC
29525 Clio Marlboro
29536 Dillon Dillon
29543 Fork Dillon
29547 Hamer Dillon
29563 Lake View Dillon
29567 Little Rock Dillon

P a g e 14 | 76
The population density for this area, estimated at 76.71 persons per square mile, is less than the
national average population density of 90.88 persons per square mile.
Total Population by Race Alone, Total
Population in Limited English Households
This indicator reports the percentage of the population aged 5 and older living in Limited English
speaking households. A “Limited English speaking household” is one in which no member 14
years old and over (1) speaks only English at home or (2) speaks a language other than English at
home and speaks English “Very well.” This indicator is significant as it identifies households
and populations that may need English-language assistance.

P a g e 15 | 76
Social & Economic Factors
Economic and social insecurity often are associated with poor health. Poverty, unemployment,
and lack of educational achievement affect access to care and a community’s ability to engage in
healthy behaviors. Without a network of support and a safe community, families cannot thrive.
Ensuring access to social and economic resources provides a foundation for a healthy
community.
Education - Bachelor's Degree or Higher
11.17% of the population aged 25 and older, or 2,274 have obtained an Bachelor's level degree
or higher. This indicator is relevant because educational attainment has been linked to positive
health outcomes.
Education - High School Graduation Rate
Within the report area 87.1% of students are receiving their high school diploma within four
years. Data represents the 2016-17 school year.
This indicator is relevant because research suggests education is one the strongest predictors of
health (Freudenberg & Ruglis, 2007).

P a g e 16 | 76
High School Graduation Rate by Year, 2011-12 through 2016-17
The table below shows local, state, and National trends in cohort graduation rates.
Note: Data for some states are omitted each year when they fail to meet federal reporting
standards or deadlines. Use caution when comparing national trends as the "universe"
population may differ over time.
Income - Median Household Income
This indicator reports median household income based on the latest 5-year American Community
Survey estimates. This includes the income of the householder and all other individuals 15 years
old and over in the household, whether they are related to the householder or not. Because many
households consist of only one person, average household income is usually less than average
family income.

P a g e 17 | 76
Poverty - Population Below 100% FPL
Poverty is considered a key driver of health status.
Within the report area 30.62% or 9,381 individuals are living in households with income below
the Federal Poverty Level (FPL). This indicator is relevant because poverty creates barriers to
access including health services, healthy food, and other necessities that contribute to poor health
status.
Dillon County, SC
Physical Environment
A community’s health also is affected by the physical environment. A safe, clean environment
that provides access to healthy food and recreational opportunities is important to maintaining
and improving community health.
P a g e 18 | 76
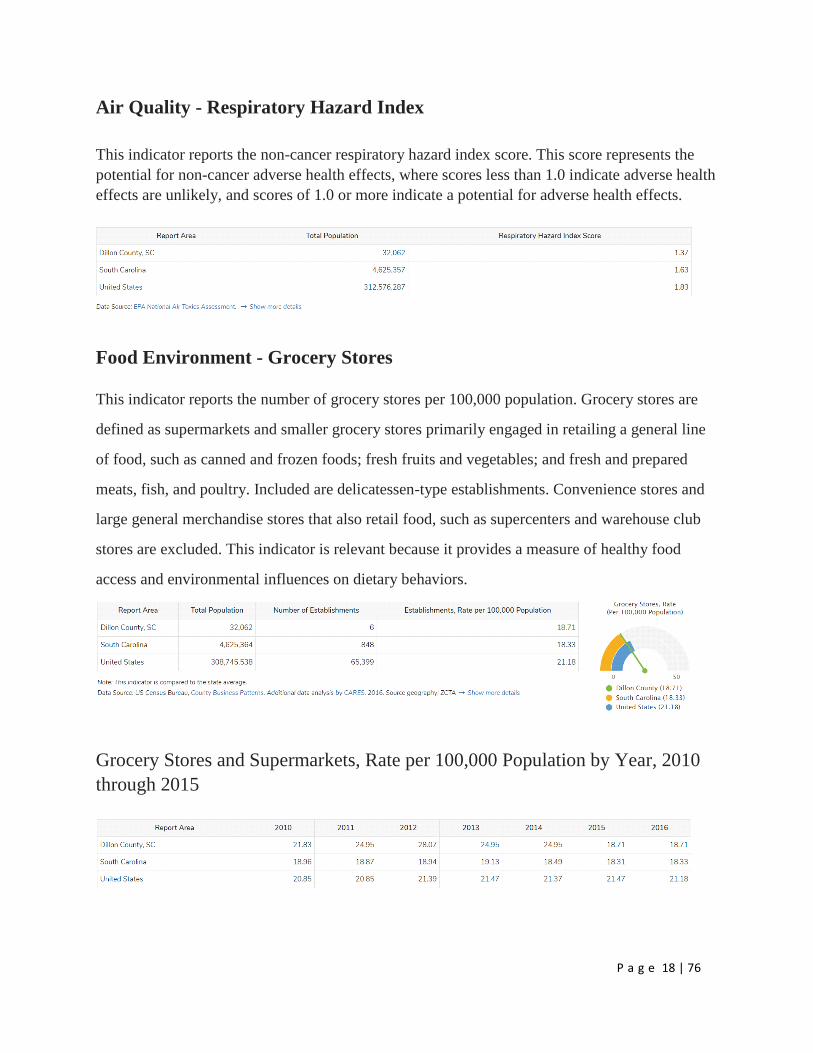
Air Quality - Respiratory Hazard Index
This indicator reports the non-cancer respiratory hazard index score. This score represents the
potential for non-cancer adverse health effects, where scores less than 1.0 indicate adverse health
effects are unlikely, and scores of 1.0 or more indicate a potential for adverse health effects.
Food Environment - Grocery Stores
This indicator reports the number of grocery stores per 100,000 population. Grocery stores are
defined as supermarkets and smaller grocery stores primarily engaged in retailing a general line
of food, such as canned and frozen foods; fresh fruits and vegetables; and fresh and prepared
meats, fish, and poultry. Included are delicatessen-type establishments. Convenience stores and
large general merchandise stores that also retail food, such as supercenters and warehouse club
stores are excluded. This indicator is relevant because it provides a measure of healthy food
access and environmental influences on dietary behaviors.
Grocery Stores and Supermarkets, Rate per 100,000 Population by Year, 2010
through 2015

P a g e 19 | 76
Food Environment - SNAP-Authorized Food Stores
This indicator reports the number of SNAP-authorized food stores as a rate per 10,000
population. SNAP-authorized stores include grocery stores as well as supercenters, specialty
food stores, and convenience stores that are authorized to accept SNAP (Supplemental Nutrition
Assistance Program) benefits.
Clinical Care
A lack of access to care presents barriers to good health. The supply and accessibility of facilities
and physicians, the rate of uninsured, financial hardship, transportation barriers, cultural
competency, and coverage limitations affect access.
Rates of morbidity, mortality, and emergency hospitalizations can be reduced if community
residents access services such as health screenings, routine tests, and vaccinations. Prevention
indicators can call attention to a lack of access or knowledge regarding one or more health issues
and can inform program interventions.

P a g e 20 | 76
30-Day Hospital Readmissions
This indicator reports the percentage of Medicare fee-for-service beneficiaries readmitted to a
hospital within 30 days of an initial hospitalization discharge.
Access to Dentists
This indicator reports the number of dentists per 100,000 population. This indicator includes all
dentists - qualified as having a doctorate in dental surgery (D.D.S.) or dental medicine (D.M.D.),
who are licensed by the state to practice dentistry and who are practicing within the scope of that
license.
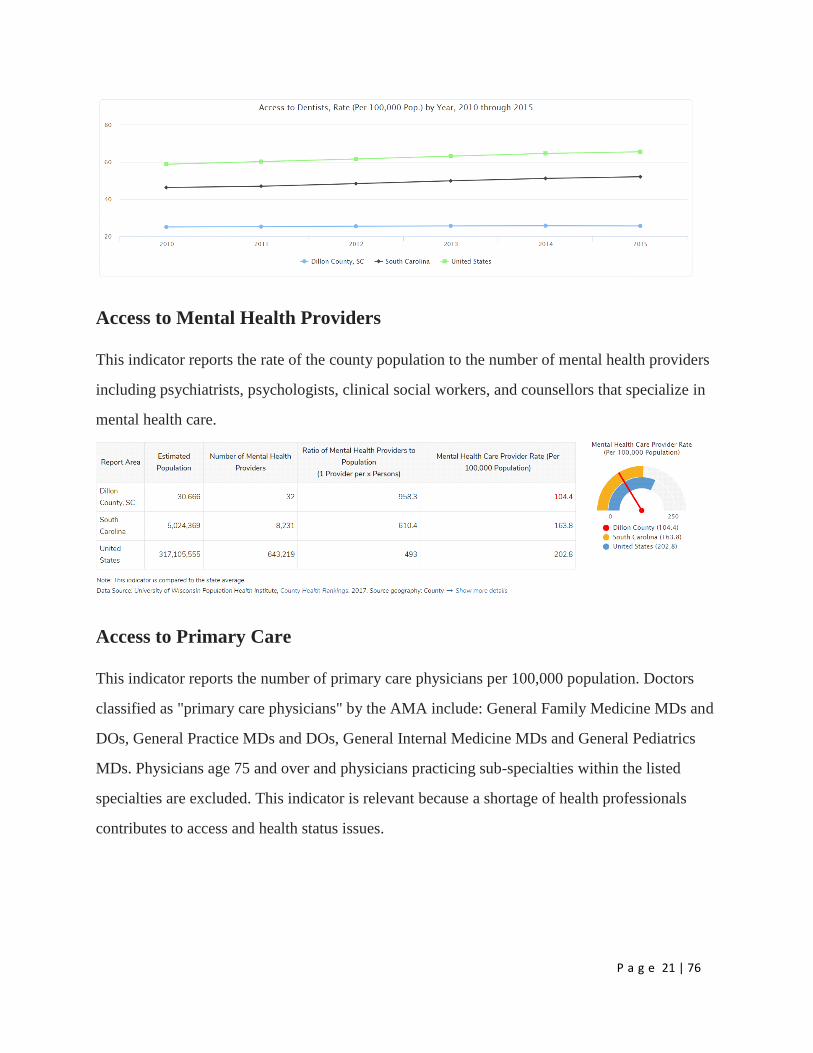
Access to Dentists, Rate (Per 100,000 Pop.) by Year, 2010 through 2015
This indicator reports the rate of dentists per 100,000 population by year.
P a g e 21 | 76
Access to Mental Health Providers
This indicator reports the rate of the county population to the number of mental health providers
including psychiatrists, psychologists, clinical social workers, and counsellors that specialize in
mental health care.
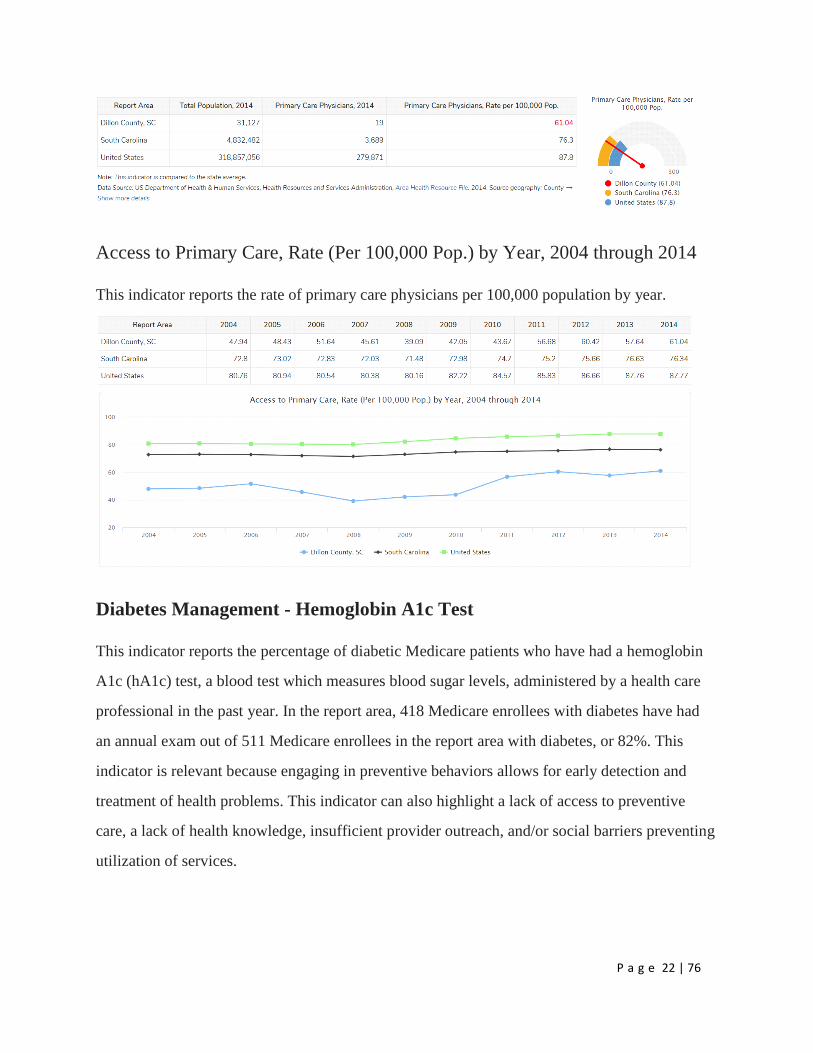
Access to Primary Care
This indicator reports the number of primary care physicians per 100,000 population. Doctors
classified as "primary care physicians" by the AMA include: General Family Medicine MDs and
DOs, General Practice MDs and DOs, General Internal Medicine MDs and General Pediatrics
MDs. Physicians age 75 and over and physicians practicing sub-specialties within the listed
specialties are excluded. This indicator is relevant because a shortage of health professionals
contributes to access and health status issues.
P a g e 22 | 76
Access to Primary Care, Rate (Per 100,000 Pop.) by Year, 2004 through 2014
This indicator reports the rate of primary care physicians per 100,000 population by year.
Diabetes Management - Hemoglobin A1c Test
This indicator reports the percentage of diabetic Medicare patients who have had a hemoglobin
A1c (hA1c) test, a blood test which measures blood sugar levels, administered by a health care
professional in the past year. In the report area, 418 Medicare enrollees with diabetes have had
an annual exam out of 511 Medicare enrollees in the report area with diabetes, or 82%. This
indicator is relevant because engaging in preventive behaviors allows for early detection and
treatment of health problems. This indicator can also highlight a lack of access to preventive
care, a lack of health knowledge, insufficient provider outreach, and/or social barriers preventing
utilization of services.

P a g e 23 | 76
Annual Hemoglobin A1c Test by Year, 2009 through 2015
Percent of Medicare Beneficiaries with Diabetes with Annual Hemoglobin A1c Test
Federally Qualified Health Centers
This indicator reports the number of Federally Qualified Health Centers (FQHCs) in the
community. This indicator is relevant because FQHCs are community assets that provide health
care to vulnerable populations; they receive extra funding from the federal government to
promote access to ambulatory care in areas designated as medically underserved.

P a g e 24 | 76
Health Professional Shortage Areas
This indicator reports the number and location of health care facilities designated as "Health
Professional Shortage Areas" (HPSAs), defined as having shortages of primary medical care,
dental or mental health providers. This indicator is relevant because a shortage of health
professionals contributes to access and health status issues.
Preventable Hospital Visits
This indicator reports the discharge rate (per 1,000 Medicare enrollees) for conditions that are
ambulatory care sensitive (ACS). ACS conditions include pneumonia, dehydration, asthma,
diabetes, and other conditions which could have been prevented if adequate primary care
resources were available and accessed by those patients. This indicator is relevant because
analysis of ACS discharges allows demonstrating a possible “return on investment” from
interventions that reduce admissions (for example, for uninsured or Medicaid patients) through
better access to primary care resources.
Ambulatory Care Sensitive Condition Discharges by Year, 2009 through 2015
Rate of Ambulatory Care Sensitive Condition Discharges (per 1,000 Medicare Part A
Beneficiaries)

P a g e 25 | 76
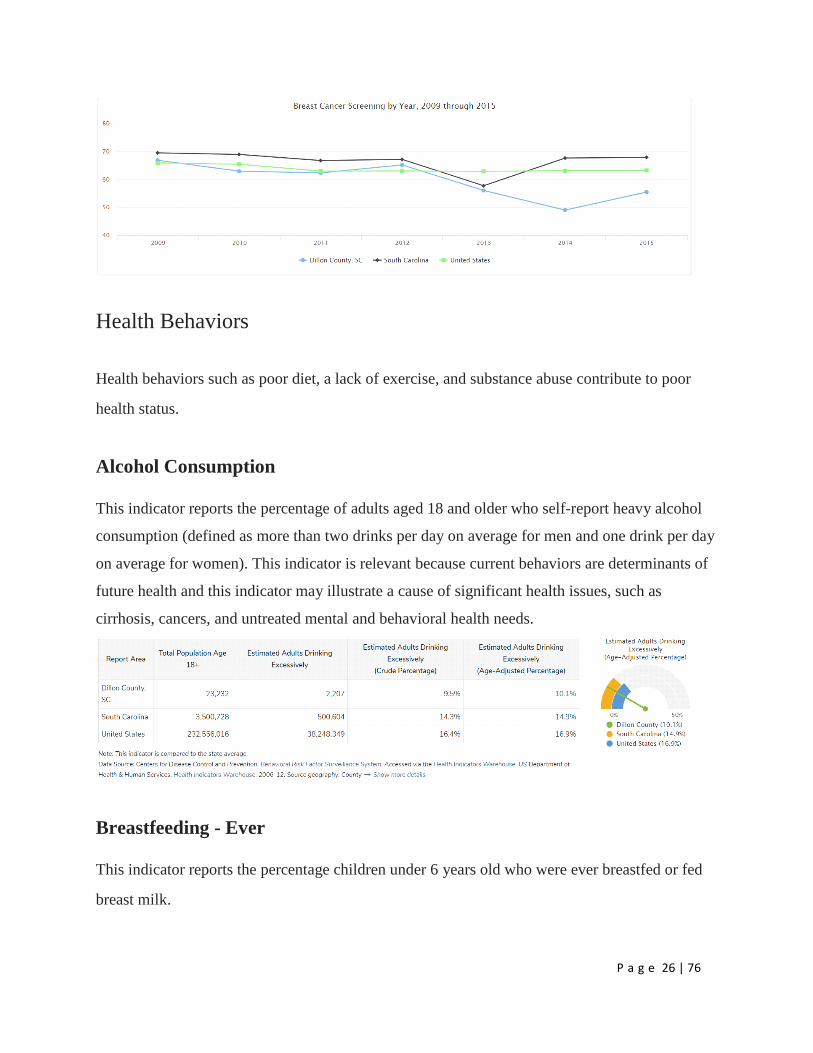
Prevention - Mammogram
This indicator reports the percentage of female Medicare enrollees, age 67-69, who have
received one or more mammograms in the past two years. This indicator is relevant because
engaging in preventive behaviors allows for early detection and treatment of health problems.
This indicator can also highlight a lack of access to preventive care, a lack of health knowledge,
insufficient provider outreach, and/or social barriers preventing utilization of services.
Breast Cancer Screening by Year, 2009 through 2015
Percent of Female Medicare Beneficiaries Age 67-69 with Mammogram trend
P a g e 26 | 76
Health Behaviors
Health behaviors such as poor diet, a lack of exercise, and substance abuse contribute to poor
health status.
Alcohol Consumption
This indicator reports the percentage of adults aged 18 and older who self-report heavy alcohol
consumption (defined as more than two drinks per day on average for men and one drink per day
on average for women). This indicator is relevant because current behaviors are determinants of
future health and this indicator may illustrate a cause of significant health issues, such as
cirrhosis, cancers, and untreated mental and behavioral health needs.
Breastfeeding - Ever
This indicator reports the percentage children under 6 years old who were ever breastfed or fed
breast milk.

P a g e 27 | 76
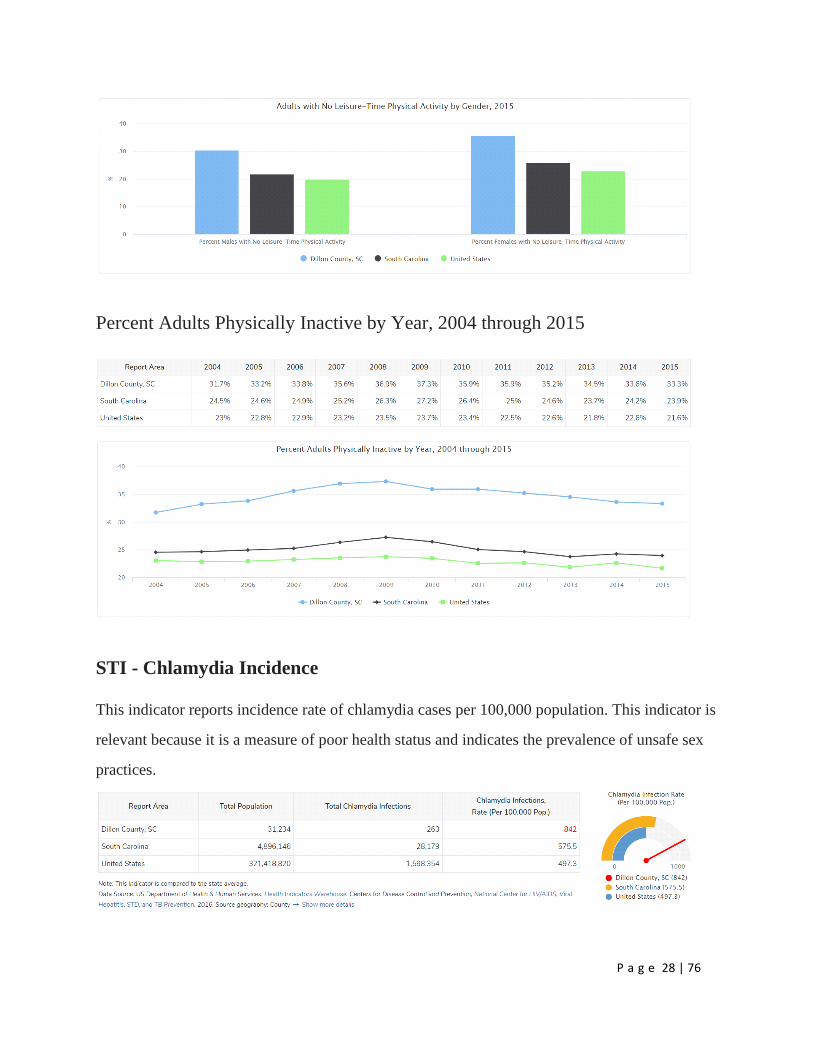
Physical Inactivity
Within the report area, 7,736 or 33.3% of adults aged 20 and older self-report no leisure time for
activity, based on the question: "During the past month, other than your regular job, did you
participate in any physical activities or exercises such as running, calisthenics, golf, gardening,
or walking for exercise?". This indicator is relevant because current behaviors are determinants
of future health and this indicator may illustrate a cause of significant health issues, such as
obesity and poor cardiovascular health.
Adults with No Leisure-Time Physical Activity by Gender, 2015
P a g e 28 | 76
Percent Adults Physically Inactive by Year, 2004 through 2015
STI - Chlamydia Incidence
This indicator reports incidence rate of chlamydia cases per 100,000 population. This indicator is
relevant because it is a measure of poor health status and indicates the prevalence of unsafe sex
practices.

P a g e 29 | 76
Chlamydia Incidence Rate (Per 100,000 Pop.) by Year, 2005 through 2016
STI - Gonorrhea Incidence
This indicator reports incidence rate of Gonorrhea cases per 100,000 population. This indicator is
relevant because it is a measure of poor health status and indicates the prevalence of unsafe sex
practices.
Gonorrhea Incidence Rate (Per 100,000 Pop.) by Year, 2005 through 2016
P a g e 30 | 76
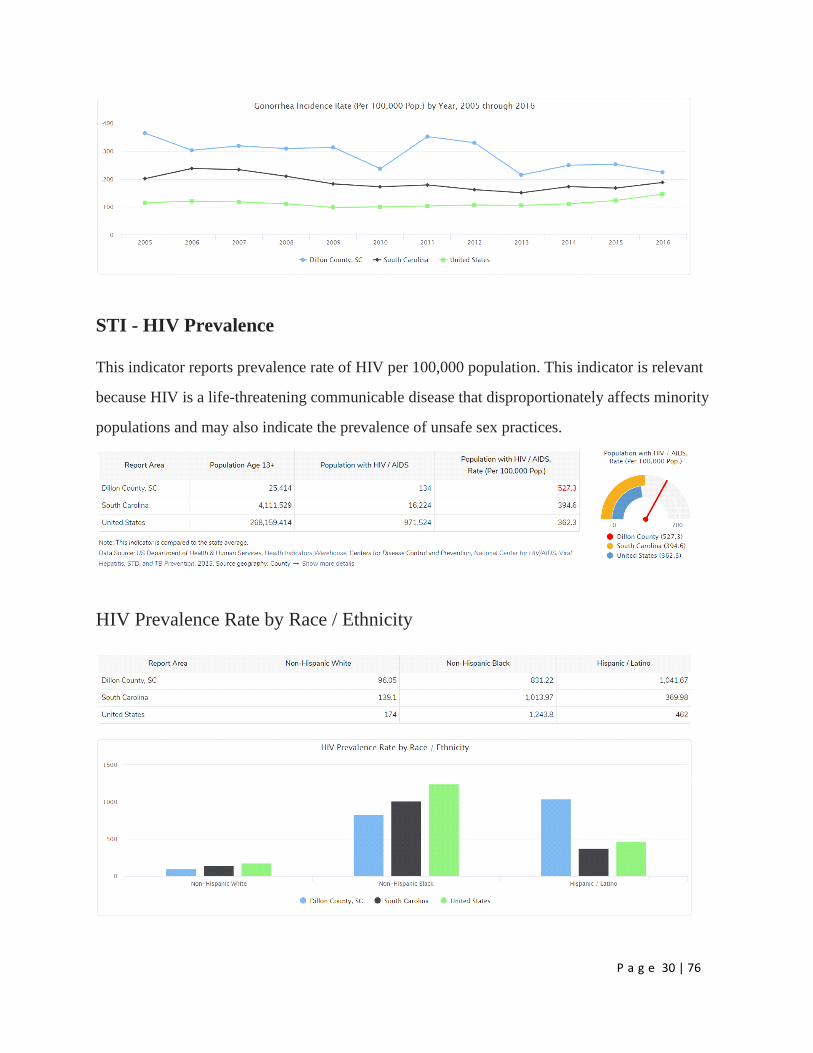
STI - HIV Prevalence
This indicator reports prevalence rate of HIV per 100,000 population. This indicator is relevant
because HIV is a life-threatening communicable disease that disproportionately affects minority
populations and may also indicate the prevalence of unsafe sex practices.
HIV Prevalence Rate by Race / Ethnicity
P a g e 31 | 76
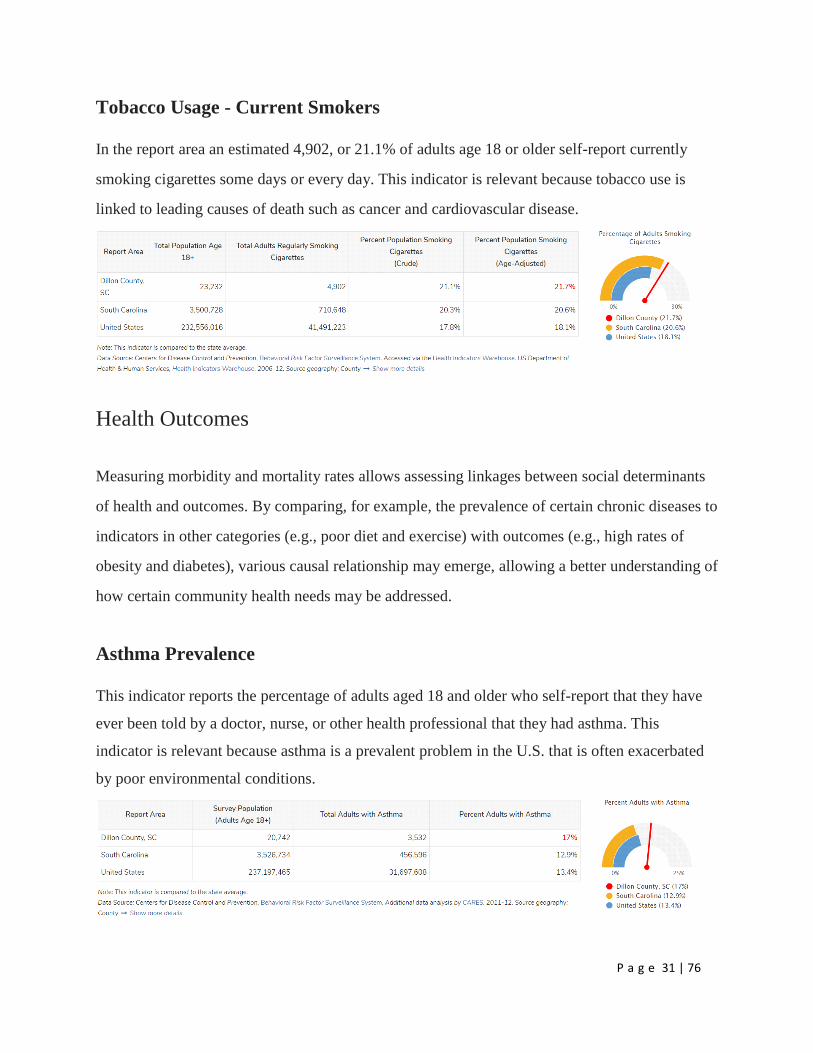
Tobacco Usage - Current Smokers
In the report area an estimated 4,902, or 21.1% of adults age 18 or older self-report currently
smoking cigarettes some days or every day. This indicator is relevant because tobacco use is
linked to leading causes of death such as cancer and cardiovascular disease.
Health Outcomes
Measuring morbidity and mortality rates allows assessing linkages between social determinants
of health and outcomes. By comparing, for example, the prevalence of certain chronic diseases to
indicators in other categories (e.g., poor diet and exercise) with outcomes (e.g., high rates of
obesity and diabetes), various causal relationship may emerge, allowing a better understanding of
how certain community health needs may be addressed.
Asthma Prevalence
This indicator reports the percentage of adults aged 18 and older who self-report that they have
ever been told by a doctor, nurse, or other health professional that they had asthma. This
indicator is relevant because asthma is a prevalent problem in the U.S. that is often exacerbated
by poor environmental conditions.

P a g e 32 | 76
Cancer Incidence - All Sites
This indicator reports the age adjusted incidence rate (cases per 100,000 population per year) of
females with breast cancer adjusted to 2000 U.S. standard population age groups (Under Age 1,
1-4, 5-9, ..., 80-84, 85 and older). This indicator is relevant because cancer is a leading cause of
death and it is important to identify cancers separately to better target interventions.
Cancer Incidence - Colon and Rectum
This indicator reports the age adjusted incidence rate (cases per 100,000 population per year) of
colon and rectum cancer adjusted to 2000 U.S. standard population age groups (Under age 1, 1-
4, 5-9, ..., 80-84, 85 and older). This indicator is relevant because cancer is a leading cause of
death and it is important to identify cancers separately to better target interventions.
P a g e 33 | 76
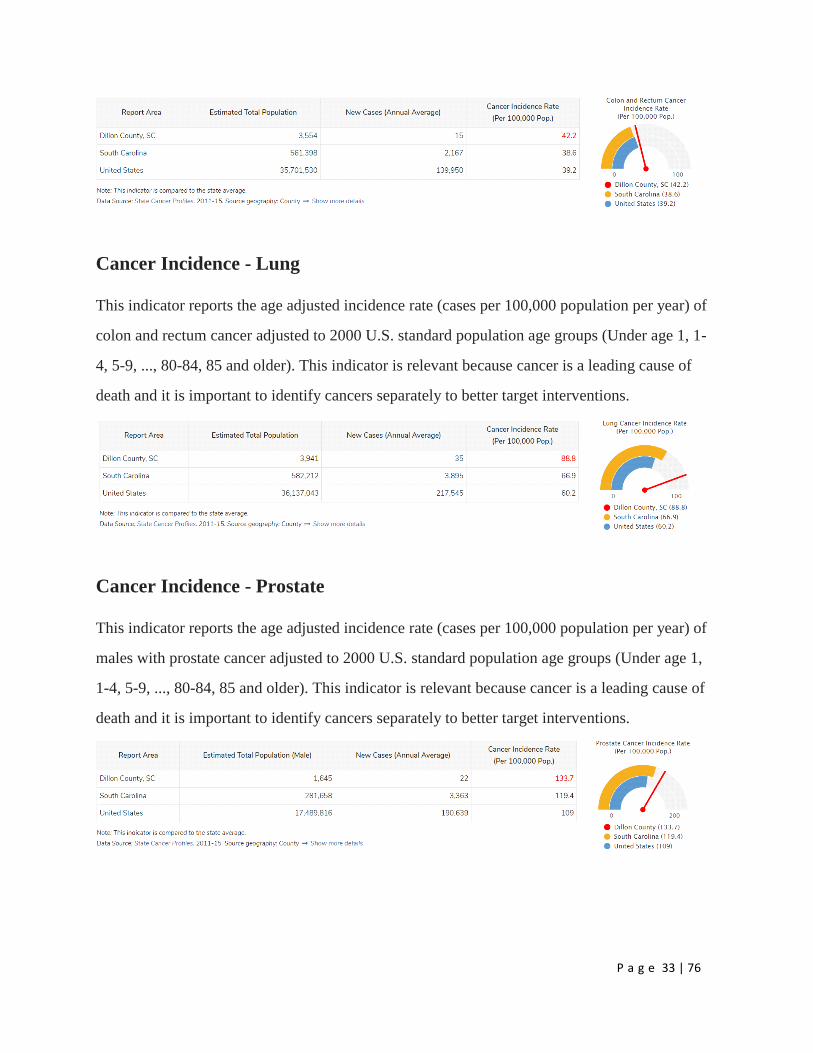
Cancer Incidence - Lung
This indicator reports the age adjusted incidence rate (cases per 100,000 population per year) of
colon and rectum cancer adjusted to 2000 U.S. standard population age groups (Under age 1, 1-
4, 5-9, ..., 80-84, 85 and older). This indicator is relevant because cancer is a leading cause of
death and it is important to identify cancers separately to better target interventions.
Cancer Incidence - Prostate
This indicator reports the age adjusted incidence rate (cases per 100,000 population per year) of
males with prostate cancer adjusted to 2000 U.S. standard population age groups (Under age 1,
1-4, 5-9, ..., 80-84, 85 and older). This indicator is relevant because cancer is a leading cause of
death and it is important to identify cancers separately to better target interventions.

P a g e 34 | 76
Depression (Medicare Population)
This indicator reports the percentage of the Medicare fee-for-service population with depression.
Percentage of Medicare Population with Depression by Year, 2010 through
2015
This indicator reports the percentage trend of the Medicare fee-for-service population with
depression over time.
Diabetes (Adult)
This indicator reports the percentage of adults aged 20 and older who have ever been told by a
doctor that they have diabetes. This indicator is relevant because diabetes is a prevalent problem
in the U.S.; it may indicate an unhealthy lifestyle and puts individuals at risk for further health
issues.

P a g e 35 | 76
Adults with Diagnosed Diabetes by Gender, 2015
Percent Adults with Diagnosed Diabetes by Year, 2004 through 2015
P a g e 36 | 76
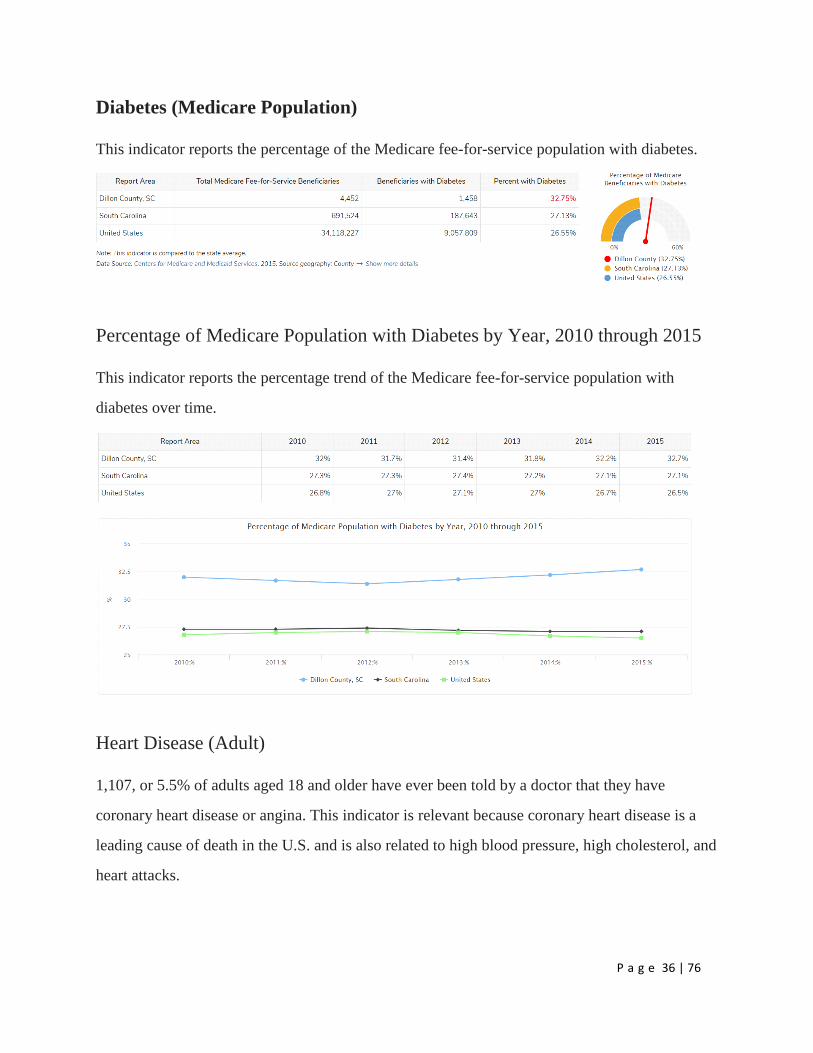
Diabetes (Medicare Population)
This indicator reports the percentage of the Medicare fee-for-service population with diabetes.
Percentage of Medicare Population with Diabetes by Year, 2010 through 2015
This indicator reports the percentage trend of the Medicare fee-for-service population with
diabetes over time.
Heart Disease (Adult)
1,107, or 5.5% of adults aged 18 and older have ever been told by a doctor that they have
coronary heart disease or angina. This indicator is relevant because coronary heart disease is a
leading cause of death in the U.S. and is also related to high blood pressure, high cholesterol, and
heart attacks.

P a g e 37 | 76
Heart Disease (Medicare Population)
This indicator reports the percentage of the Medicare fee-for-service population with ischaemic
heart disease.
Percentage of Medicare Population with Heart Disease by Year, 2010 through
2015
This indicator reports the percentage trend of the Medicare fee-for-service population with
ischaemic heart disease over time.

P a g e 38 | 76
High Blood Pressure (Adult)
9,665, or 41.6% of adults aged 18 and older have ever been told by a doctor that they have high
blood pressure or hypertension.
High Blood Pressure (Medicare Population)
This indicator reports the percentage of the Medicare fee-for-service population with
hypertension (high blood pressure).
Percentage of Medicare Population with High Blood Pressure by Year, 2010
through 2015
This indicator reports the percentage trend of the Medicare fee-for-service population with
ischaemic heart disease over time.

P a g e 39 | 76
Infant Mortality
This indicator reports the rate of deaths to infants less than one year of age per 1,000 births. This
indicator is relevant because high rates of infant mortality indicate the existence of broader issues
pertaining to access to care and maternal and child health.
Low Birth Weight
This indicator reports the percentage of total births that are low birth weight (Under 2500g). This
indicator is relevant because low birth weight infants are at high risk for health problems. This
indicator can also highlight the existence of health disparities.

P a g e 40 | 76
Babies Born with Low Birth Weight, Percent by Time Period, 2002-2008
through 2006-2012
Mortality - Cancer
This indicator reports the rate of death due to malignant neoplasm (cancer) per 100,000
population. Figures are reported as crude rates, and as rates age-adjusted to year 2000 standard.
Rates are re-summarized for report areas from county level data, only where data is available.
This indicator is relevant because cancer is a leading cause of death in the United States.
Cancer Mortality, Age-Adjusted Rate (Per 100,000 Pop.) by Gender

P a g e 41 | 76
Mortality - Coronary Heart Disease
Within the report area the rate of death due to coronary heart disease (ICD10 Codes I20-I25) per
100,000 population is 147. This rate is greater than the Healthy People 2020 target of less than or
equal to 103.4. Figures are reported as crude rates, and as rates age-adjusted to year 2000
standard. Rates are re-summarized for report areas from county level data, only where data is
available. This indicator is relevant because heart disease is a leading cause of death in the
United States.
Coronary Heart Disease Mortality, Age-Adjusted Rate (Per 100,000 Pop.) by
Gender

P a g e 42 | 76
Mortality - Lung Disease
This indicator reports the rate of death due to chronic lower respiratory disease per 100,000
population. Figures are reported as crude rates, and as rates age-adjusted to year 2000 standard.
Rates are re-summarized for report areas from county level data, only where data is available.
This indicator is relevant because lung disease is a leading cause of death in the United States.
Lung Disease Mortality, Age-Adjusted Rate (Per 100,000 Pop.) by Gender

P a g e 43 | 76
Mortality - Pedestrian Motor Vehicle Crash
This indicator reports the crude rate of pedestrians killed by motor vehicles per 100,000
population. This indicator is relevant because pedestrian-motor vehicle crash deaths are
preventable and they are a cause of premature death.
Mortality - Premature Death
This indicator reports Years of Potential Life Lost (YPLL) before age 75 per 100,000 population
for all causes of death, age-adjusted to the 2000 standard. YPLL measures premature death and
is calculated by subtracting the age of death from the 75-year benchmark. This indicator is
relevant because a measure of premature death can provide a unique and comprehensive look at
overall health status.
Premature Death Rate by Time Period, 2005-2009 to 2010-2014

P a g e 44 | 76
Mortality - Stroke
Within the report area there are an estimated 56.6 deaths due to cerebrovascular disease (stroke)
per 100,000 population. This is greater than the Healthy People 2020 target of less than or equal
to 33.8. Figures are reported as crude rates, and as rates age-adjusted to year 2000 standard.
Rates are re-summarized for report areas from county level data, only where data is available.
This indicator is relevant because stroke is a leading cause of death in the United States.
P a g e 45 | 76
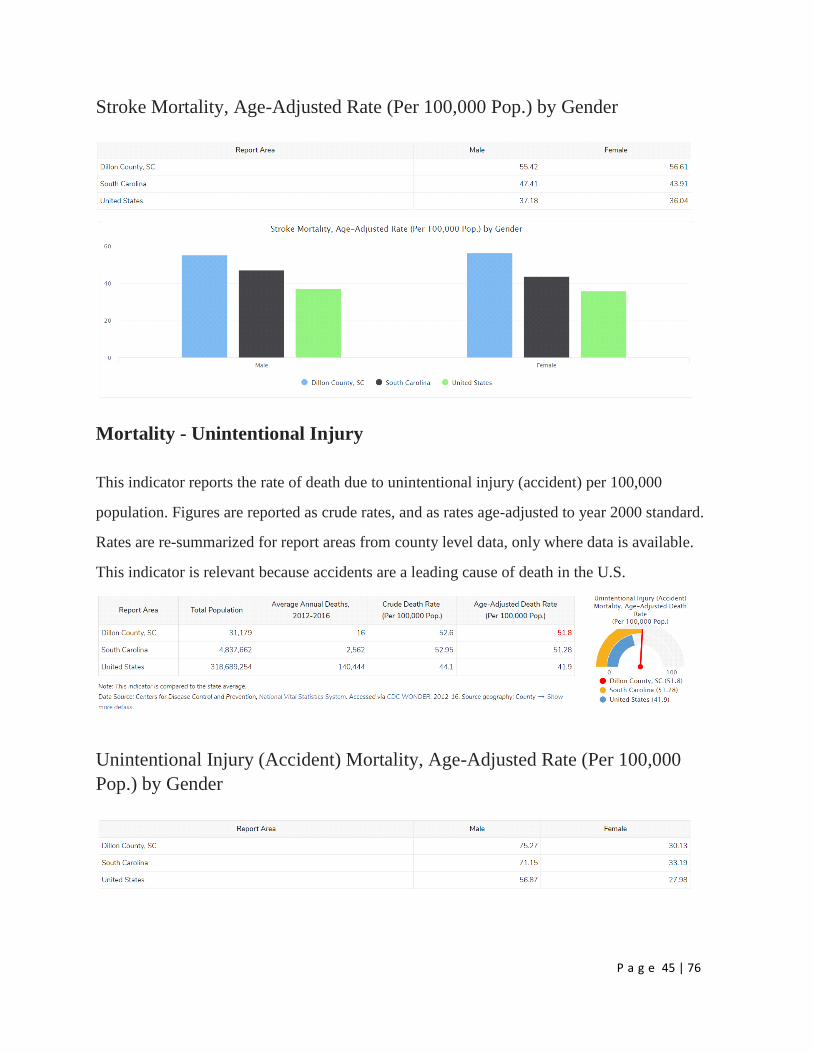
Stroke Mortality, Age-Adjusted Rate (Per 100,000 Pop.) by Gender
Mortality - Unintentional Injury
This indicator reports the rate of death due to unintentional injury (accident) per 100,000
population. Figures are reported as crude rates, and as rates age-adjusted to year 2000 standard.
Rates are re-summarized for report areas from county level data, only where data is available.
This indicator is relevant because accidents are a leading cause of death in the U.S.
Unintentional Injury (Accident) Mortality, Age-Adjusted Rate (Per 100,000
Pop.) by Gender

P a g e 46 | 76
Obesity
39.3% of adults aged 20 and older self-report that they have a Body Mass Index (BMI) greater
than 30.0 (obese) in the report area. Excess weight may indicate an unhealthy lifestyle and puts
individuals at risk for further health issues.
Adults Obese (BMI > 30.0) by Gender, 2015

P a g e 47 | 76
Percent Adults Obese (BMI > 30.0) by Year, 2004 through 2015
Poor Dental Health
This indicator reports the percentage of adults age 18 and older who self-report that six or more
of their permanent teeth have been removed due to tooth decay, gum disease, or infection. This
indicator is relevant because it indicates lack of access to dental care and/or social barriers to
utilization of dental services.
Poor General Health
Within the report area 27.6% of adults age 18 and older self-report having poor or fair health in
response to the question "would you say that in general your health is excellent, very good, good,
fair, or poor?". This indicator is relevant because it is a measure of general poor health status.

P a g e 48 | 76
Dillon County Health Rankings 2016 vs. 2019
To evaluate the impact of any actions that were taken to address the significant health needs
identified in the 2016 CHNA the following is a comparison of health outcomes and behaviors in
2016 and in 2019.
Dillon 2016 Ranking Progress Dillon 2019 Ranking
Health Outcomes 43 45
Length of Life 39 44
Premature Death 11,300 Getting Worse 13,800
Quality of Life 45 45
Poor or Fair Health 26% 29%
Poor Physical Health Days 5 5.1
Poor Mental Health Days 4.6 5.1
Low Birthweight 13% 12%
Health Factors 43 42
Health Behaviors 45 44
Adult Smoking 25% 22%
Adult Obesity 39% Little or No Change 39%
Food Environment Index 5.4 6.1
Physical Inactivity 36% Improving 34%
Access to Exercise
Opportunities
55% 32%
Excessive Drinking 12% 14%
Alcohol-Impaired Driving
Deaths
17% 29%
Sexually Transmitted
Infections
868.2 Improving 842
Teen Births 74 Improving 54
Clinical Care 41 38

P a g e 49 | 76
Uninsured 21% Improving 14%
Primary Care Physicians 1,840:1 1,820:1
Dentists 3,890:1 3,410:1
Mental Health Providers 1,300:1 960:1
Preventable Hospital Stays 68 5,743
Diabetes Monitoring 83%
Mammography Screening 56% Improving 37%
Social & Economic Factors 42 43
High School Graduation 81% 88%
Some College 39% 41%
Unemployment 9.70% Improving 5.70%
Children in Poverty 42% Little or No Change 42%
Income Inequality 5.2 5.8
Children in Single-Parent
Households
58% 51%
Social Associations 9.6 9.1
Violent Crime 1,229 Improving 914
Injury Deaths 78 84
Physical Environment 1 3
Air Pollution – Particulate
Matter
12.1 Improving 10.1
Drinking Water Violations No No
Severe Housing Problems 19% 17%
Driving Alone to Work 75% 73%
Long Commute – Driving
Alone
28% 31%
Data Source: https://www.countyhealthrankings.org/app/south-carolina/2016/compare/snapshot?counties=45_033
Priority Issues and Implementation Plan
McLeod Health utilizes resources such as U.S. Department of Health and South Carolina State
Health Improvement Plan which serves to guide health promotion and disease prevention efforts.
The South Carolina State Health Improvement Plan (SHIP) lays out the foundation for giving
everyone a chance to live a healthy life. It is a call to action for South Carolinians to take data-
driven, evidence-based steps to advance the health and well-being of all South Carolinians. The

P a g e 50 | 76
plan highlights goals and strategies on which communities can focus so the state can make
measurable health improvement by 2023. Attention is focused on determinants that affect the
public’s health that contribute to health disparities by addressing identified needs through
education, prevention, targeted initiatives validated through research, and the delivery of health
services. Cross-sector collaboration is now widely considered as essential for having meaningful
impacts on building healthier communities. Through collaboration with public health agencies,
health care organizations and providers, community leaders, and input from across business
sectors and others in the community, McLeod Health can better serve its mission.
In prioritization of needs, consideration was given to the following:
Based on importance to community
Capacity to address change
Alignment to McLeod Health Mission, Vision and Values
Collaboration with existing organizations
Magnitude/Severity of problem
Need among vulnerable populations
Willingness to act on issue
Ability to have meaningful impact
Availability of hospital resources
Plan Priorities
McLeod Health Dillon has selected the following areas which to collaborate with community
partners for improving community health in Dillon County.
Chronic Diseases
Access to Care
Substance Abuse
P a g e 51 | 76
Sexual Health
Implementation Plan
Priority issues were determined from the community input gathered for the CHNA. The priority
issues, or “goal”, are listed as Strategies, Metrics on how to measure those strategies,
Community Partners and Timeframe.
Through successful partnerships and collaborations with public health agencies, health care
organizations and providers, community leaders, and input from across business sectors and
other in our community, McLeod Health can more effectively satisfy its long standing mission
dedicated to improving the health and well-being in our region through excellence in health care.

P a g e 52 | 76
CHNA Need #1: Chronic Diseases (Heart Disease, Stroke, Obesity and Lung Disease)
Goal Strategies Metrics/What we
are measuring
Community Partners Timeframe
Goal #1: Reinforce
importance of physical
activity among youth and
adults in the community.
Strategy #1: Partner with City of
Dillon Wellness Center
Actions/Tactics
Promote free inside / outside walking tracks to potential Cardiac Rehab patients
Corporate membership for
employees and their families
established April 2019
Number of people reached through education
Number of memberships
.
City of Dillon
City of Dillon Wellness Center
Ongoing
Goal #2: Promote and raise
awareness of healthy
behaviors among youth and
adults in the community.
Strategy #1: Partnership with local
and regional organizations
Actions/Tactics:
Participate in events sponsored by city, county, local and regional organizations
Educational series to highlight health issues, including stroke, heart disease, diabetes, arthritis, women’s health
Mobile Mammography Unit
Health Fairs Go Red Luncheon
Number of people reached through education
Number of events
City of Dillon
County of Dillon
United Way
RALI/Dillon County Health Initiative
Kiwanis Club
Dillon County Help for Veterans
Pee Dee Coalition
Dillon County Boys and Girls Youth Center
Dillon County Chamber of Commerce
Local Schools
Northeastern Rural Health Network/Wise Woman
Trinity Behavioral Care
Auxiliary
Ongoing
Goal #3: Improve healthy
eating behaviors among
Strategy #1: Support Dillon’s
Francis Marion University Rural
Grant funding received
Dillon County Rural Area
Program to
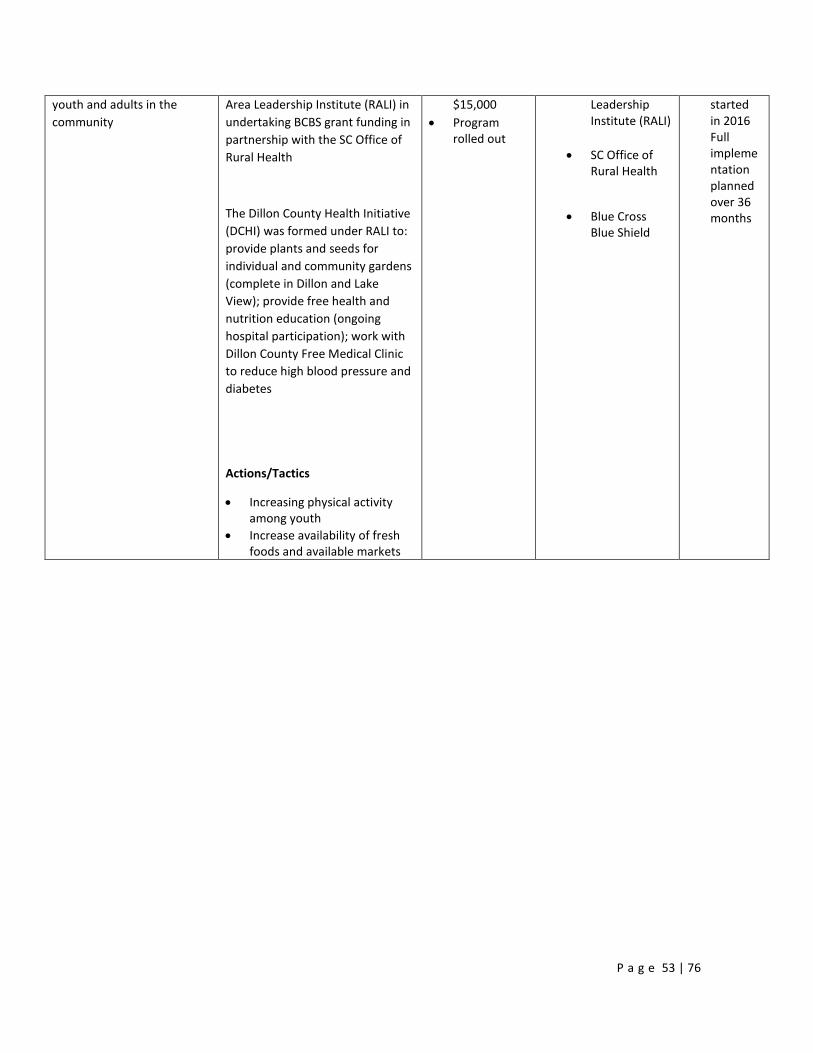
P a g e 53 | 76
youth and adults in the
community
Area Leadership Institute (RALI) in
undertaking BCBS grant funding in
partnership with the SC Office of
Rural Health
The Dillon County Health Initiative
(DCHI) was formed under RALI to:
provide plants and seeds for
individual and community gardens
(complete in Dillon and Lake
View); provide free health and
nutrition education (ongoing
hospital participation); work with
Dillon County Free Medical Clinic
to reduce high blood pressure and
diabetes
Actions/Tactics
Increasing physical activity among youth
Increase availability of fresh foods and available markets
$15,000
Program rolled out
Leadership Institute (RALI)
SC Office of Rural Health
Blue Cross Blue Shield
started in 2016 Full implementation planned over 36 months
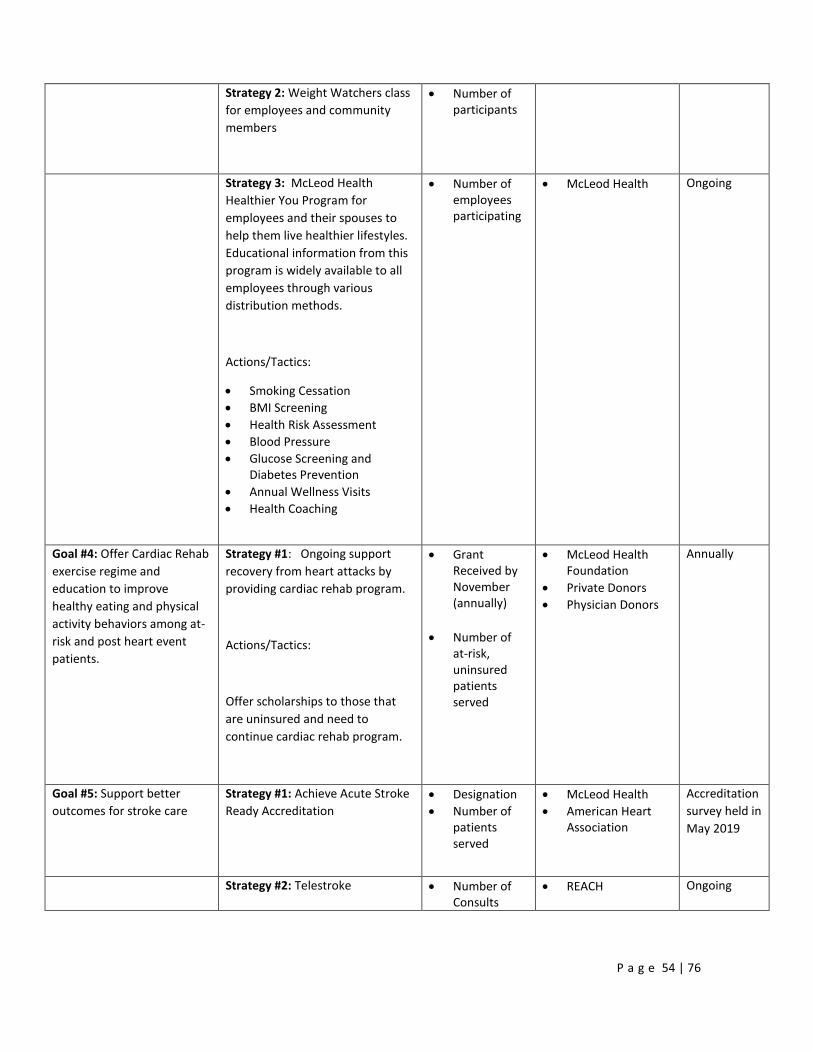
P a g e 54 | 76
Strategy 2: Weight Watchers class
for employees and community
members
Number of participants
Strategy 3: McLeod Health
Healthier You Program for
employees and their spouses to
help them live healthier lifestyles.
Educational information from this
program is widely available to all
employees through various
distribution methods.
Actions/Tactics:
Smoking Cessation
BMI Screening
Health Risk Assessment
Blood Pressure
Glucose Screening and Diabetes Prevention
Annual Wellness Visits
Health Coaching
Number of employees participating
McLeod Health
Ongoing
Goal #4: Offer Cardiac Rehab
exercise regime and
education to improve
healthy eating and physical
activity behaviors among at-
risk and post heart event
patients.
Strategy #1: Ongoing support
recovery from heart attacks by
providing cardiac rehab program.
Actions/Tactics:
Offer scholarships to those that
are uninsured and need to
continue cardiac rehab program.
Grant Received by November (annually)
Number of at-risk, uninsured patients served
McLeod Health Foundation
Private Donors
Physician Donors
Annually
Goal #5: Support better
outcomes for stroke care
Strategy #1: Achieve Acute Stroke
Ready Accreditation
Designation
Number of patients served
McLeod Health
American Heart Association
Accreditation
survey held in
May 2019
Strategy #2: Telestroke Number of Consults
REACH Ongoing

P a g e 55 | 76
CHNA Need #2: Access to Care
(Socioeconomic Barriers – Affordable Care, Resource Awareness and Education, and Transportation)
Goal Strategies Metrics/What we are
measuring
Community Partners Timeframe
Goal #1: Expand
specialty care into
rural areas for both
adult and youth
populations.
Strategy #1: Telehealth
Psychiatry
Cardiology
Pulmonology
Vascular
Stroke (REACH)
Lactation
Nutrition
Diabetes Education
Number of consultations
Number of specialty programs participating
McLeod Regional Medical Center
McLeod Physician Associates
REACH Network
Palmetto Care Connections SC Department of
Mental Health
Ongoing
Goal #2: Improve
education and access
to remove
transportation and
financial barriers for
underserved
population (new and
expecting mothers)
Strategy #1: Expand
McLeod Nurse Family
Partnership enrollment
Numbers of referrals and/or participants, Case Study Outcomes
McLeod Nurse Family partnership
McLeod Health Foundation
Alliance for a Healthier South Carolina/Initiative Healthy Babies
Annually
Goal #3: Improve
access to hospital
providers and services
Strategy #1: Recruitment
of providers
Number of provider positions filled
Mcleod Health
Local Physicians
Ongoing
Goal #4: Support
better outcomes for
stroke care
Strategy #1: Achieve and
maintain Acute Stroke
Ready Certification
evidenced by DNV
accrediting agency
Designation
Number of Patients served
McLeod Health
American Heart Association
Dillon County EMS
Survey held May 2019
Strategy #2: Telestroke Number of Consults REACH Ongoing

P a g e 56 | 76
CHNA Need #3: Substance Abuse
Goal Strategies Metrics/What we are
measuring
Community Partners Timeframe
Goal #1:
Increase access
to substance
use treatment,
prevention and
recovery
services.
Strategy #1: Participate in
the Rural Opioid Community
Response Consortium,
sponsored by CareSouth.
CareSouth
Trinity Behavioral Care
TriCounty Community Mental Health
Northeastern Rural Health Network
5 counties: Dillon, Darlington, Lee, Marlboro and Chesterfield
In beginning phases
Goal #2 Gain
access to
specialty
providers to
rural areas for
both youth and
adult
populations
Strategy #1: Use of
telepsychiatry in Emergency
Department
Number of consults
SC Department of Mental Health
Ongoing
Goal #3: Access
to emergency
mental health
assistance
through
community
partner
agencies
Strategy #1: Counselor
available daily in Emergency
Department to assist with
placement
Number of patients served
TriCounty Community Mental Health
Ongoing

P a g e 57 | 76
CHNA Need #4: Sexual Health (Birth Outcomes, STDs, Teen Pregnancy and Education)
Goal Strategies Metrics/What we are
measuring
Community Partners Timeframe
Goal #1: Improve birth
outcomes through
education to expecting
moms.
Strategy #1:
Centering Care in
McLeod OBGYN
Dillon practice – to
improve outcomes
and reduce preterm
birth (Part of
Alliance for a
Healthier South
Carolina initiative –
Centering
Pregnancy)
Actions/Tactics
Promote benefits of full term delivery through new OB packets distributed at McLeod OB/GYN Dillon.
Childbirth preparation offerings
Program Implementation
Number of participants
Breastfeeding rates
Preterm birth rates
McLeod OB/GYN Dillon
McLeod Nurse Family Partnership
12 months
Strategy #2: Utilize
the March of Dimes
39+ Weeks Quality
Improvement
Initiative
Reduction in elective inductions, cesarean deliveries scheduled before 39 weeks of pregnancy
Improved birth outcomes
McLeod OB/GYN Dillon
Annually
Strategy #3:
Obstetrical Nurse
Navigator
Number of expecting mothers attending prenatal classes
McLeod Dillon Women’s Services
McLeod OB/GYN Dillon
In beginning phases.
OB Navigator position
filled late 2018

P a g e 58 | 76
Decrease in number of mothers receiving little to no prenatal care
Increase in number of postpartum visits
Strategy #4:
Maintain Baby
Friendly Designation
Re-designation McLeod Dillon Women’s Services
McLeod OB/GYN Dillon
Baby Friendly USA
Ongoing
Re-surveyed every five
years
Goal #2: Increase
education, condom
access and improve
parent/child
communication
Strategy 1:
Continue county
wide teen pregnancy
task force to plan
and guide
collaborative action
to reduce teen
pregnancy.
Actions/Tactics
Conduct education
classes to emphasize
abstinence first,
then contraception,
condom access
(education is best
practice)
Provide evidence
based practices and
programming
Increase awareness
and understanding
of STD risks and
prevention
Reduction in teen birth rates
Number of teens reached/participating
Number of classes conducted
Decrease in STD rates
DHEC
McLeod Nurse Family Partnership
First Steps
Schools
Churches
CareSouth
Free Medical Clinic
Pee Dee Coalition
SC Campaign to Prevent Teen Pregnancy
Boys and Girls Youth Center
Community Groups
Pee Dee Healthy Start
McLeod OB/GYN Dillon
Trinity Behavioral Health
Annually

P a g e 59 | 76
Goal #3: Reach
underserved and
uninsured women and
improve sexual health
outcomes.
Strategy #1: Expand
Free Medical Clinic
to include Women’s
Services
Number of women served
Number of patient visits
McLeod OB/GYN Dillon
Dillon County Rural Area Leadership Institute (RALI)
Free Medical Clinic
Annually
Strategy #2: Utilize
the Choose Well
Grant to provide
Long Acting
Reversible
Contraception
(LARC) at delivery
Number of women served by OB Nurse Navigator
Number of LARC Insertions
McLeod OB/GYN Dillon
McLeod Dillon Women’s Services
New Morning Foundation
Annually

P a g e 60 | 76
Sources
Total Population, Data Source: US Census Bureau, American Community Survey. 2013-17. Source
geography: Tract
Population in Limited English Households, Data Source: US Census Bureau, American Community
Survey. 2013-17. Source geography: Tract
Education – Bachelor’s Degree or Higher, Data Source: US Census Bureau, American Community
Survey. 2013-17. Source geography: Tract
Education – High School Graduation Rate, Data Source, US Department of Education, EDFacts.
Accessed via DATA.GOV. Additional data analysis by CARES. 2016-17. Source geography: School
District
Income – Median Household Income, Data Source: US Census Bureau, American Community Survey.
2013-17. Source geography: Tract
Poverty – Population Below 100% FPL, Data Source: US Census Bureau, American Community Survey.
2013-17. Source geography: Tract
Air Quality – Respiratory Hazard Index, Data Source: EPA National Air Toxics Assessment.
Food Environment – Grocery Stores, Data Source: US Census Bureau, County Business Patterns.
Additional data analysis by CARES. 2016. Source geography: ZCTA
Food Environment – SNAP-Authorized Food Stores, Data Source: US Department of Agriculture, Food
and Nutrition Service, USDA – SNAP Retailer Locator. Additional data analysis by CARES. 2019.
Source geography: Tract
30-Day Hospital Readmissions, Data Source: Dartmouth College Institute for Health Policy & Clinical
Practice, Dartmouth Atlas of Health Care.
P a g e 61 | 76
Access to Dentists, Data Source: US Department of Health & Human Services, Health Resources and
Services Administration, Area Health Resource File. 2015. Source geography: County
Access to Mental Health Providers, Data Source, University of Wisconsin Population Health Institute,
County Health Rankings. 2017. Source geography: County
Access to Primary Care, Data Source: US Department of Health & Human Services, Health Resources
and Services Administration, Area Health Resource File. 2014. Source geography: County
Diabetes Management – Hemoglobin A1c Test, Data Source: Dartmouth College Institute for Health
Policy & Clinical Practice, Dartmouth Atlas of Health Care. 2015. Source geography: County
Federally Qualified Health Centers, Data Source: US Department of Health & Human Services, Center
for Medicare & Medicaid Services, Provider of Services Files. December 2018. Source geography:
Address
Health Professional Shortage Areas, Data Source: US Department of Health & Human Services, Health
Resources and Services Administration, Health Resources and Services Administration. February 2019.
Source geography: Address
Lack of Prenatal Care, Data Source: Centers for Disease Control and Prevention, National Vital Statistics
System. Accessed via CDC WONDER. Centers for Disease Control and Prevention, Wide-Ranging
Online Data for Epidemiologic Research. 2007-10. Source geography: County
Preventable Hospital Visits, Data Source: Dartmouth College Institute for Health Policy & Clinical
Practice, Dartmouth Atlas of Health Care. 2015. Source geography: County
Prevention – Mammogram, Data Source, Dartmouth College Institute for Health Policy & Clinical
Practice, Dartmouth Atlas of Health Care. 2015. Source geography: County
Alcohol Consumption, Data Sources: Centers for Disease Control and Prevention, Behavioral Risk Factor
Surveillance System. Accessed via the Health Indicators Warehouse. US Department of Health & Human
Services, Health Indicators Warehouse. 2006-12. Source geography: County

P a g e 62 | 76
Physical Inactivity, Data Source: Center for Disease Control and Prevention, National Center for
Chronic Disease Prevention and Health Promotion. 2015. Source geography: County
STI – Chlamydia Incidence, Data Source: US Department of Health & Human Services, Health
Indicators Warehouse. Centers for Disease Control and Prevention, National Center for HIV/AIDS, Viral
Hepatitis, STD, and TB Prevention. 2016. Source geography: County
STI- Gonorrhea Incidence, US Department of Health & Human Services, Health Indicators Warehouse.
Centers for Disease Control and Prevention, National Center for HIV/AIDS, Viral Hepatitis, STD, and TB
Prevention. 2016. Source geography: County
STI – HIV Prevalence, US Department of Health & Human Services, Health Indicators Warehouse.
Centers for Disease Control and Prevention, National Center for HIV/AIDS, Viral Hepatitis, STD, and TB
Prevention. 2015. Source geography: County
Tobacco Usage – Current Smokers, Data Source: Centers for Disease Control and Prevention, Behavioral
Risk Factor Surveillance System. Accessed via the Health Indicators Warehouse. US Department of
Health & Human Services, Health Indicators Warehouse. 2006-12. Source geography: County
Asthma Prevalence, Data Source: Centers for Disease Control and Prevention, Behavioral Risk Factor
Surveillance System. Additional data analysis by CARES. 2011-12. Source geography: County
Cancer Incidence – All Sites, Data Source: State Cancer Profiles. 2011-15. Source geography: County
Cancer Incidence – Colon and Rectum, Data Source: State Cancer Profiles. 2011-15. Source geography:
County
Cancer Incidence – Lung, Data Source: State Cancer Profiles. 2011-15. Source geography: County
Cancer Incidence – Prostate, Data Source: State Cancer Profiles. 2011-15. Source geography: County
Depression (Medicare Population), Data Source: Centers for Medicare and Medicaid Services. 2015.
Source geography: County

P a g e 63 | 76
Diabetes (Adult), Data Source: Centers for Disease Control and Prevention, National Center for Chronic
Disease Prevention and Health Promotion. 2015. Source geography: County
Diabetes (Medicare Population), Data Source: Centers for Medicare and Medicaid Services. 2015. Source
geography: County
Heart Disease (Adult), Data Source: Centers for Disease Control and Prevention, Behavioral Risk Factor
Surveillance System. Additional data analysis by CARES. 2011-12. Source geography: County
Heart Disease (Medicare Population), Note: This indicator is compared to the state average. Data Source:
Centers for Medicare and Medicaid Services. 2015. Source geography: County
High Blood Pressure (Adult), Note: This indicator is compared to the state average. Data Source: Centers
for Disease and Prevention, Behavioral Risk Factor Surveillance System. Accessed via the Health
Indicators Warehouse. US Department of Health & Human Services, Health Indicators Warehouse.
2006-12. Source geography: County
High Blood Pressure (Medicare Population), Note: This indicator is compared to the state average. Data
Source: Centers for Medicare and Medicaid Services. 2015. Source geography: County
Infant Mortality, Note: This indicator is compared to the state average. Data Source: US Department of
Health & Human Services, Health Resources and Services Administration, Area Health Resource File.
2006-10. Source geography: County
Low Birth Weight, Note: This indicator is compared to the state average. Data Source: US Department of
Health & Human Services, Health Indicators Warehouse. Centers for Disease Control and Prevention,
National Vital Statistics System. Accessed via CDC WONDER. 2006-12. Source geography: County
Mortality – Cancer, Note: This indicator is compared to the state average. Data Source: Centers for
Disease Control and Prevention, National Vital Statistics System. Accessed via CDC WONDER. 2012-
16. Source geography: County
P a g e 64 | 76
Mortality – Coronary Heart Disease, Note: This indicator is compared to the state average. Data Source:
Centers for Disease Control and Prevention, National Vital Statistics System. Accessed via CDC
WONDER. 2012-16. Source geography: County
Mortality – Lung Disease, Note: This indicator is compared to the state average. Data Source: Centers
for Disease Control and Prevention, National Vital Statistics System. Accessed via CDC WONDER.
2012-16. Source geography: County
Mortality – Pedestrian Motor Vehicle Crash, Note: This indicator is compared to the state average. Data
Source: US Department of Transportation, National Highway Traffic Safety Administration, Fatality
Analysis Reporting System. 2011-2015. Source geography: County
Mortality – Premature Death, Note: This indicator is compared to the state average. Data Source:
University of Wisconsin Population Health Institute, County Health Rankings. 2015-17. Source
geography: County
Mortality – Stroke, Note: This indicator is compared to the state average. Data Source: Centers for
Disease Control and Prevention, National Vital Statistics System. Accessed via CDC WONDER. 2012-
16. Source geography: County
Mortality – Suicide, Note: This indicator is compared to the state average. Data Source: Centers for
Disease Control and Prevention, National Vital Statistics System. Accessed via CDC Wonder. 2012-16.
Source geography: County
Mortality – Unintentional Injury, Note: This indicator is compared to the state average. Data Source:
Center for Disease Control and Prevention, National Vital Statistics System. Accessed via CDC
WONDER. 2012-16. Source geography: County
Obesity, Note: This indicator is compared to the state average. Data Source: Centers for Disease Control
and Prevention, National Center for Chronic Disease Prevention and Health Promotion. 2015. Source
geography: County

P a g e 65 | 76
Poor Dental Health, Note: This indicator is compared to the state average. Data Source: Centers for
Disease Control and Prevention, Behavioral Risk Factor Surveillance System. Additional data analysis by
CARES. 2006-10. Source geography: County
Poor General Health, Note: This indicator is compared to the state average. Data Source: Centers for
Disease Control and Prevention, Behavioral Risk Factor Surveillance System. Accessed via the Health
Indicators Warehouse. US Department of Health & Human Services, Health Indicators Warehouse.
2006-12. Source geography: County
Dillon County Health Rankings, Data Source: https://www.countyhealthrankings.org/app/south-
carolina/2016/compare/snapshot?counties=45_033
USPSTF Grade A and B Preventative Service Recommendations Associated with Identified Key Priority
Areas, Data Source: USPSTF A and B Recommendations by Date. U.S. Preventive Services Task Force.
June 2019. https://www.uspreventiveservicestaskforce.org/Page/Name/uspstf-a-and-b-recommendations-
by-date/

P a g e 66 | 76
Appendix A
List of civic groups, providers, and organizations surveyed:
McLeod Health Dillon Auxiliary
McLeod Health Dillon Hospitalists
McLeod Physician Associates
South Carolina Department of Health & Environmental Control

P a g e 67 | 76
Appendix B
Below is supplemental information to the Health Outcomes data found in this report.

P a g e 68 | 76

P a g e 69 | 76
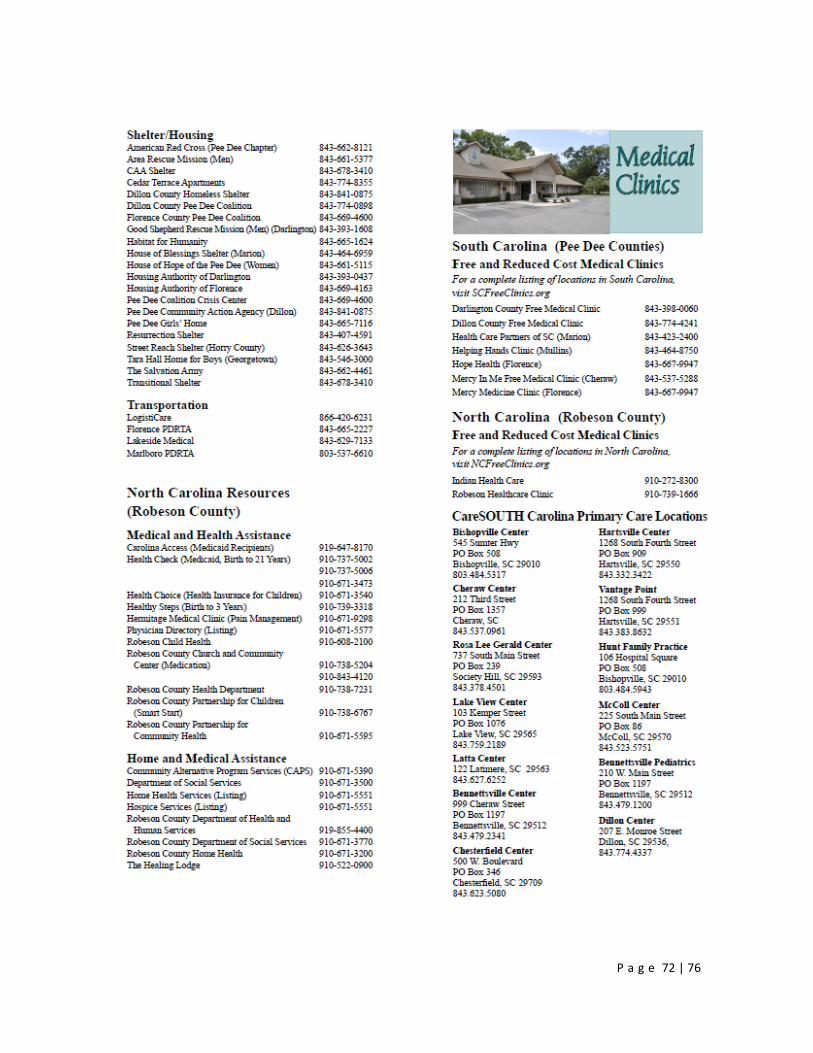
Appendix C
McLeod Health Dillon completed an inventory of community resources available within the
service area. These resources include but are not limited to organizations, facilities, and
programs in the community that are potentially available to address health needs.
Organizations are listed by county under the following headings:
Senior Services
Counseling
Special Needs
Assistance, Information and Education
Food
Shelter/Housing
Transportation
Medical and Health Assistance
Home and Medical Assistance
Free and Reduced Cost Medical Clinics
CareSOUTH Carolina Primary Care Locations
Family Medicine
Internal Medicine
Nephrology
Obstetrics and Gynecology
Pediatric Medicine
General Surgery
Orthopedics
Urology

P a g e 70 | 76

P a g e 71 | 76
P a g e 72 | 76

P a g e 73 | 76

P a g e 74 | 76

P a g e 75 | 76

P a g e 76 | 76
The 2019 McLeod Health Dillon Community Health Needs Assessment is located on the website
of McLeod Health at www.McLeodHealth.org.
A copy can also be obtained by contacting the hospital administration office.