Embed Size (px)
Citation preview
1
MCB 372 #13:Selection, Data PartitioningGene Transfer
Collaborators: Olga Zhaxybayeva (Dalhousie) Jinling Huang (ECU) Tim Harlow (UConn) Pascal Lapierre (UConn) Greg Fournier (UConn)
Funded through the NASA Exobiology and AISR Programs, and NSF Microbial Genetics
Edvard Munch, The Dance of Life (1900)
J. Peter Gogarten
University of ConnecticutDept. of Molecular and Cell Biology
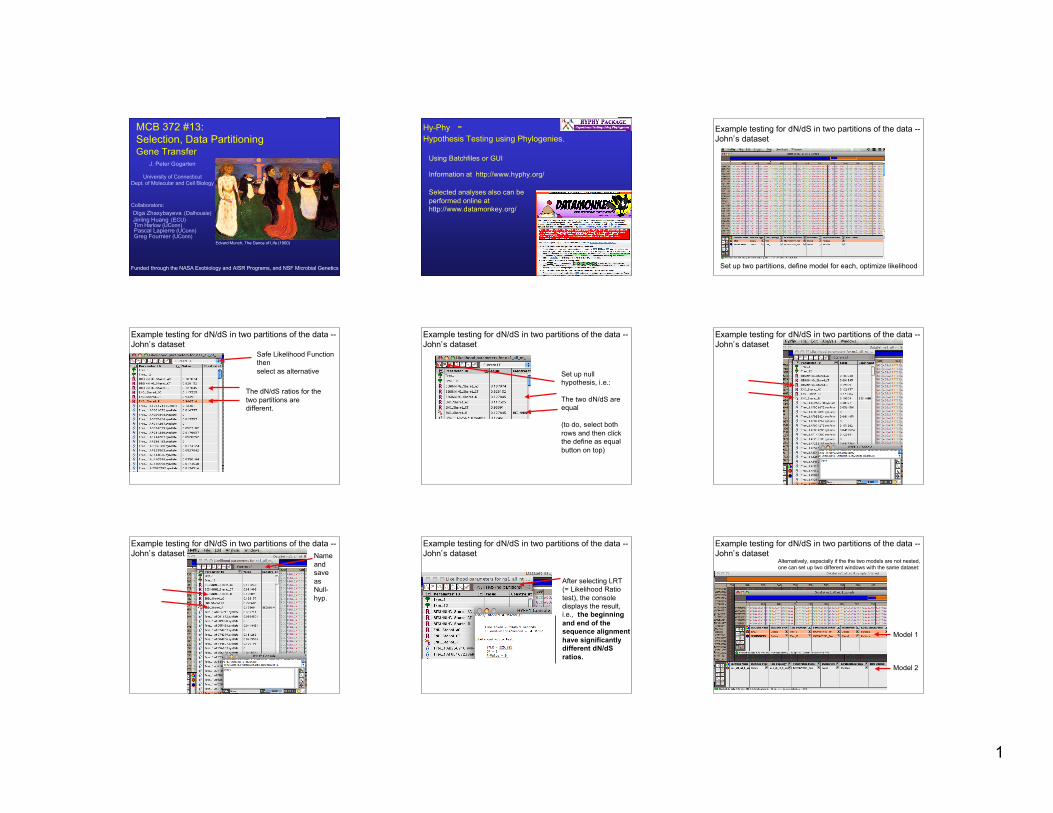
Hy-Phy -Hypothesis Testing using Phylogenies.
Using Batchfiles or GUI
Information at http://www.hyphy.org/
Selected analyses also can be performed online at http://www.datamonkey.org/
Example testing for dN/dS in two partitions of the data --John’s dataset
Set up two partitions, define model for each, optimize likelihood
Example testing for dN/dS in two partitions of the data --John’s dataset
The dN/dS ratios for thetwo partitions aredifferent.
Safe Likelihood Functionthenselect as alternative
Example testing for dN/dS in two partitions of the data --John’s dataset
Set up nullhypothesis, i.e.:
The two dN/dS areequal
(to do, select bothrows and then clickthe define as equalbutton on top)
Example testing for dN/dS in two partitions of the data --John’s dataset
Example testing for dN/dS in two partitions of the data --John’s dataset Name
andsaveasNull-hyp.
Example testing for dN/dS in two partitions of the data --John’s dataset
After selecting LRT(= Likelihood Ratiotest), the consoledisplays the result,i.e., the beginningand end of thesequence alignmenthave significantlydifferent dN/dSratios.
Example testing for dN/dS in two partitions of the data --John’s dataset
Alternatively, especially if the the two models are not nested,one can set up two different windows with the same dataset:
Model 1
Model 2
2
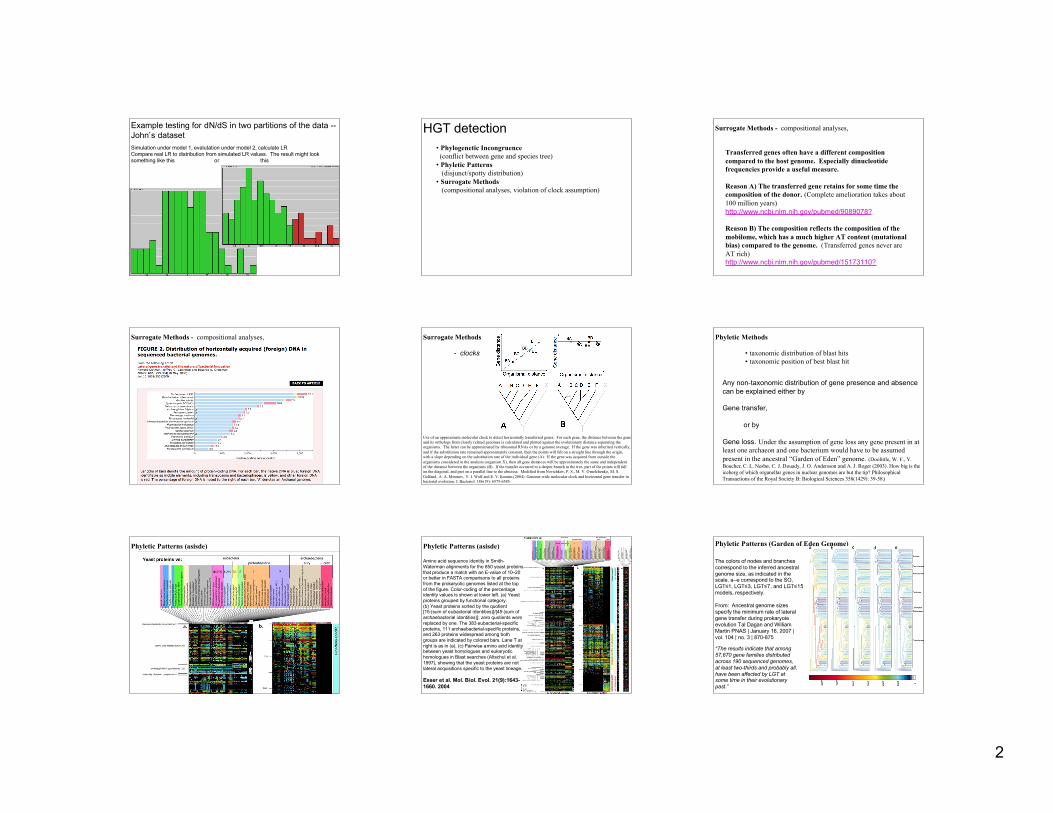
Example testing for dN/dS in two partitions of the data --John’s datasetSimulation under model 1, evalutation under model 2, calculate LRCompare real LR to distribution from simulated LR values. The result might looksomething like this or this
HGT detection• Phylogenetic Incongruence (conflict between gene and species tree)• Phyletic Patterns (disjunct/spotty distribution)• Surrogate Methods (compositional analyses, violation of clock assumption)
Surrogate Methods - compositional analyses,
Transferred genes often have a different compositioncompared to the host genome. Especially dinucleotidefrequencies provide a useful measure.
Reason A) The transferred gene retains for some time thecomposition of the donor. (Complete amelioration takes about100 million years)http://www.ncbi.nlm.nih.gov/pubmed/9089078?
Reason B) The composition reflects the composition of themobilome, which has a much higher AT content (mutationalbias) compared to the genome. (Transferred genes never areAT rich)http://www.ncbi.nlm.nih.gov/pubmed/15173110?
Surrogate Methods - compositional analyses, Surrogate Methods
Use of an approximate molecular clock to detect horizontally transferred genes. For each gene, the distance between the geneand its orthologs from closely related genomes is calculated and plotted against the evolutionary distance separating theorganisms. The latter can be approximated by ribosomal RNAs or by a genome average. If the gene was inherited vertically,and if the substitution rate remained approximately constant, then the points will fall on a straight line through the origin,with a slope depending on the substitution rate of the individual gene (A). If the gene was acquired from outside theorganisms considered in the analysis (organism X), then all gene distances will be approximately the same and independentof the distance between the organisms (B). If the transfer occurred to a deeper branch in the tree, part of the points will fallon the diagonal, and part on a parallel line to the abscissa. Modified from Novichkov, P. S., M. V. Omelchenko, M. S.Gelfand, A. A. Mironov, Y. I. Wolf and E. V. Koonin (2004). Genome-wide molecular clock and horizontal gene transfer inbacterial evolution. J. Bacteriol. 186(19): 6575-6585.
- clocks
Phyletic Methods
• taxonomic distribution of blast hits • taxonomic position of best blast hit
Any non-taxonomic distribution of gene presence and absencecan be explained either by
Gene transfer,
or by
Gene loss. Under the assumption of gene loss any gene present in atleast one archaeon and one bacterium would have to be assumedpresent in the ancestral “Garden of Eden” genome. (Doolittle, W. F., Y.Boucher, C. L. Nesbø, C. J. Douady, J. O. Andersson and A. J. Roger (2003). How big is theiceberg of which organellar genes in nuclear genomes are but the tip? PhilosophicalTransactions of the Royal Society B: Biological Sciences 358(1429): 39-58.)
Phyletic Patterns (asisde) Phyletic Patterns (asisde)
Amino acid sequence identity in Smith-Waterman alignments for the 850 yeast proteinsthat produce a match with an E-value of 10–20or better in FASTA comparisons to all proteinsfrom the prokaryotic genomes listed at the topof the figure. Color-coding of the percentageidentity values is shown at lower left. (a) Yeastproteins grouped by functional category.(b) Yeast proteins sorted by the quotient[15·(sum of eubacterial identities)]/[45·(sum ofarchaebacterial identities)]; zero quotients werereplaced by one. The 383 eubacterial-specificproteins, 111 archaebacterial-specific proteins,and 263 proteins widespread among bothgroups are indicated by colored bars. Lane T atright is as in (a). (c) Pairwise amino acid identitybetween yeast homologues and eukaryotichomologues in Blast searches (Altschul et al.1997), showing that the yeast proteins are notlateral acquisitions specific to the yeast lineage.
Esser et al. Mol. Biol. Evol. 21(9):1643-1660. 2004
Phyletic Patterns (Garden of Eden Genome)
The colors of nodes and branchescorrespond to the inferred ancestralgenome size, as indicated in thescale. a–e correspond to the SO,LGT≤1, LGT≤3, LGT≤7, and LGT≤15models, respectively.
From: Ancestral genome sizesspecify the minimum rate of lateralgene transfer during prokaryoteevolution Tal Dagan and WilliamMartin PNAS | January 16, 2007 |vol. 104 | no. 3 | 870-875
“The results indicate that among57,670 gene families distributedacross 190 sequenced genomes,at least two-thirds and probably all,have been affected by LGT atsome time in their evolutionarypast.”
3
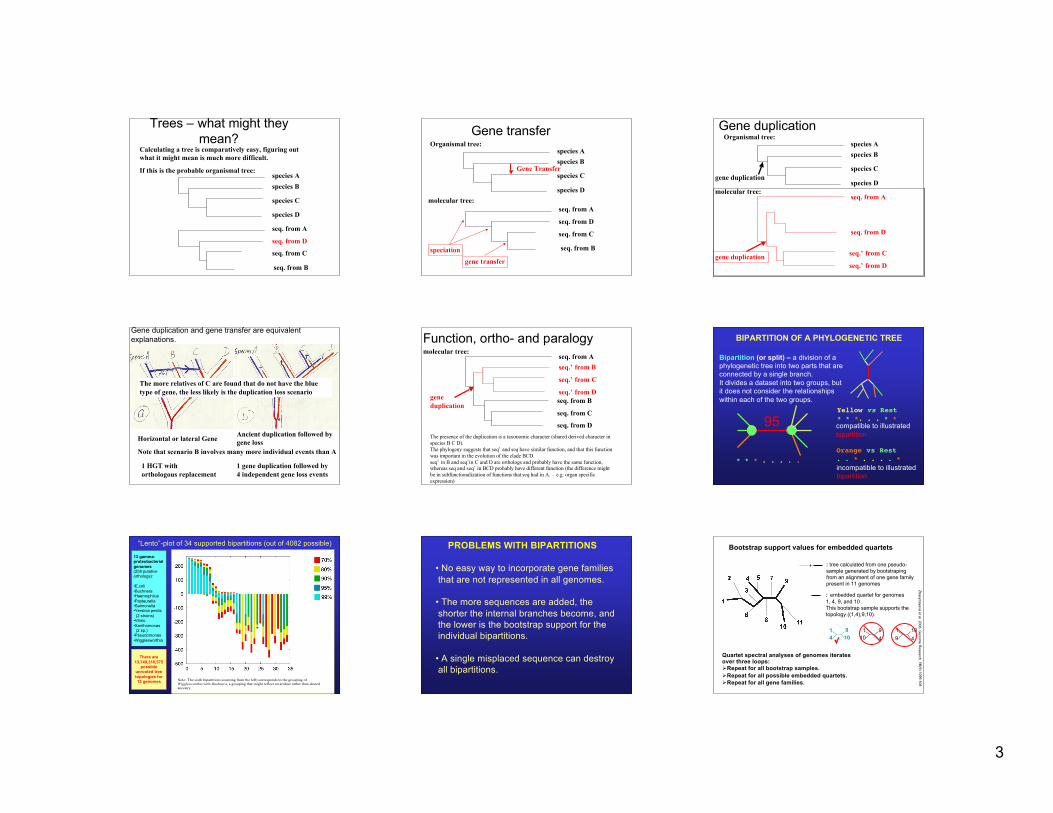
Trees – what might theymean?
Calculating a tree is comparatively easy, figuring outwhat it might mean is much more difficult.
If this is the probable organismal tree:
species Bspecies A
species C
species D
seq. from B
seq. from A
seq. from C
seq. from D
Gene transferOrganismal tree:
species Bspecies A
species C
species D
Gene Transfer
seq. from B
seq. from A
seq. from C
seq. from D
molecular tree:
speciationgene transfer
Gene duplication
gene duplication
Organismal tree:
species Bspecies A
species C
species Dmolecular tree:
seq. from D
seq. from A
seq. from C
seq. from B
seq.’ from D
seq.’ from C
seq.’ from B
gene duplication
molecular tree:
seq. from D
seq. from A
seq. from C
seq. from B
seq.’ from D
seq.’ from C
seq.’ from B
gene duplication
molecular tree:
seq. from D
seq. from A
seq.’ from D
seq.’ from Cgene duplication
Gene duplication and gene transfer are equivalentexplanations.
Horizontal or lateral Gene Ancient duplication followed bygene loss
Note that scenario B involves many more individual events than A
1 HGT with orthologous replacement
1 gene duplication followed by4 independent gene loss events
The more relatives of C are found that do not have the bluetype of gene, the less likely is the duplication loss scenario
Function, ortho- and paralogymolecular tree:
seq.’ from D
seq. from A
seq.’ from C
seq.’ from B
seq. from D
seq. from C
seq. from Bgeneduplication
The presence of the duplication is a taxonomic character (shared derived character inspecies B C D).The phylogeny suggests that seq’ and seq have similar function, and that this functionwas important in the evolution of the clade BCD.seq’ in B and seq’in C and D are orthologs and probably have the same function,whereas seq and seq’ in BCD probably have different function (the difference mightbe in subfunctionalization of functions that seq had in A. – e.g. organ specificexpression)
BIPARTITION OF A PHYLOGENETIC TREE
Bipartition (or split) – a division of aphylogenetic tree into two parts that areconnected by a single branch.It divides a dataset into two groups, butit does not consider the relationshipswithin each of the two groups.
95 compatible to illustrated bipartition
incompatible to illustrated bipartition
* * * . . . . .Orange vs Rest. . * . . . . *
Yellow vs Rest* * *. . . * *
“Lento”-plot of 34 supported bipartitions (out of 4082 possible)
13 gamma-proteobacterial genomes (258 putative orthologs):
•E.coli•Buchnera•Haemophilus•Pasteurella•Salmonella•Yersinia pestis (2 strains)•Vibrio•Xanthomonas (2 sp.)•Pseudomonas•Wigglesworthia
There are13,749,310,575
possibleunrooted treetopologies for13 genomes Note: The sixth bipartition (counting from the left) corresponds to the grouping of
Wigglesworthia with Buchnera, a grouping that might reflect an artifact rather than shared
ancestry.
PROBLEMS WITH BIPARTITIONS
• No easy way to incorporate gene familiesthat are not represented in all genomes.
• The more sequences are added, theshorter the internal branches become, andthe lower is the bootstrap support for theindividual bipartitions.
• A single misplaced sequence can destroyall bipartitions.
Bootstrap support values for embedded quartets
+ : tree calculated from one pseudo-sample generated by bootstrapingfrom an alignment of one gene familypresent in 11 genomes
Quartet spectral analyses of genomes iteratesover three loops:Repeat for all bootstrap samples.Repeat for all possible embedded quartets.Repeat for all gene families.
: embedded quartet for genomes1, 4, 9, and 10 .This bootstrap sample supports thetopology ((1,4),9,10).
14
910
110
94
19
104√
Zhaxybayeva et al. 2006, Genom
e Research, 16(9):1099-108
4
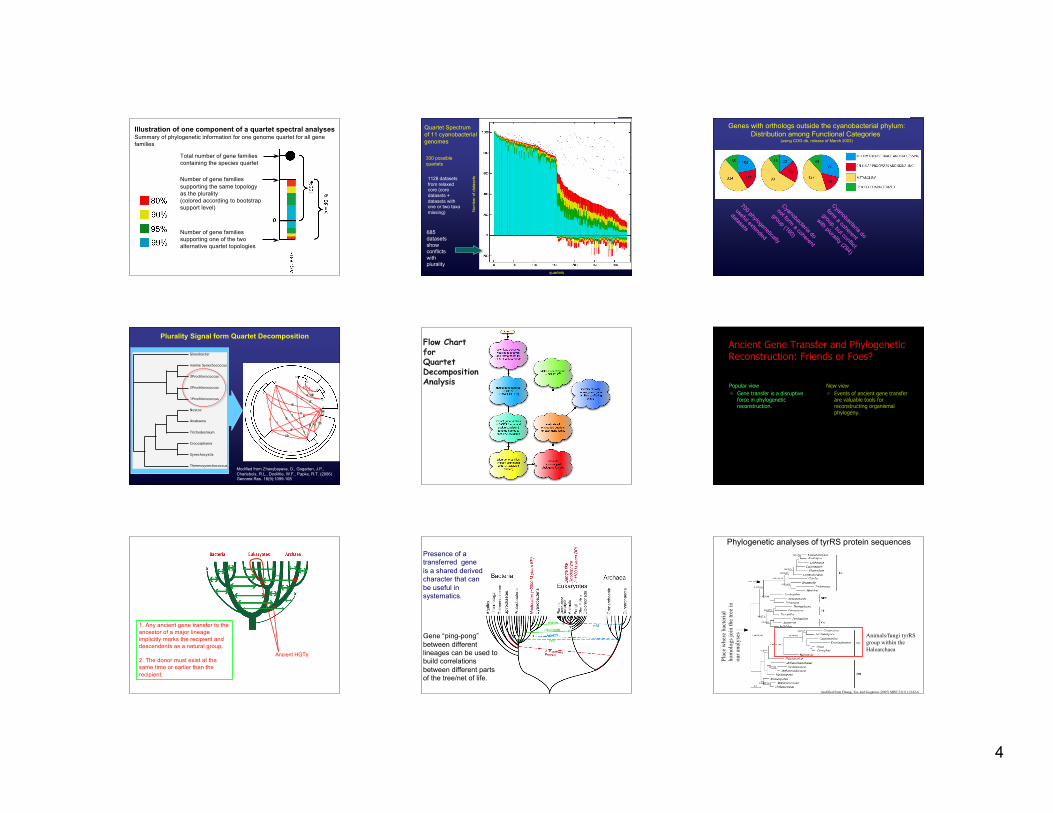
Total number of gene familiescontaining the species quartet
Number of gene familiessupporting the same topologyas the plurality(colored according to bootstrapsupport level)
Number of gene familiessupporting one of the twoalternative quartet topologies
Illustration of one component of a quartet spectral analysesSummary of phylogenetic information for one genome quartet for all genefamilies
330 possiblequartets
quartets
Num
ber o
f dat
aset
s
685datasetsshowconflictswithplurality
1128 datasetsfrom relaxedcore (coredatasets +datasets withone or two taxamissing)
Quartet Spectrumof 11 cyanobacterialgenomes
Genes with orthologs outside the cyanobacterial phylum:Distribution among Functional Categories
(using COG db, release of March 2003)
Cyanobacteria do
not form a coherent
group (160)
Cyanobacteria do
form a coherent
group, but conflict
with plurality (294)
700 phylogenetically
useful extended
datasets
Plurality Signal form Quartet Decomposition
Gloeobacter
marine Synechococcus
3Prochlorococcus
2Prochlorococcus
1Prochlorococcus
Nostoc
Anabaena
Trichodesmium
Crocosphaera
Synechocystis
Thermosynechococcus
N
A
Tr
C
S
Th
G
1P
2P
3P
mS
Modified from Zhaxybayeva, O., Gogarten, J.P.,Charlebois, R.L., Doolittle, W.F., Papke, R.T. (2006)Genome Res. 16(9):1099-108
Flow ChartforQuartetDecompositionAnalysis
Ancient Gene Transfer and PhylogeneticReconstruction: Friends or Foes?
Popular view Gene transfer is a disruptive
force in phylogeneticreconstruction.
New view Events of ancient gene transfer
are valuable tools forreconstructing organismalphylogeny.
1. Any ancient gene transfer to theancestor of a major lineageimplicitly marks the recipient anddescendents as a natural group.
2. The donor must exist at thesame time or earlier than therecipient.
Ancient HGTs
Gene “ping-pong”between differentlineages can be used tobuild correlationsbetween different partsof the tree/net of life.
Presence of atransferred geneis a shared derivedcharacter that canbe useful insystematics.
Plac
e w
here
bac
teria
lho
mol
ogs j
oin
the
tree
inou
r ana
lyse
s Animals/fungi tyrRSgroup within theHaloarchaea
Phylogenetic analyses of tyrRS protein sequences
modified from Huang, Xu, and Gogarten (2005) MBE 22(11):2142-6
5
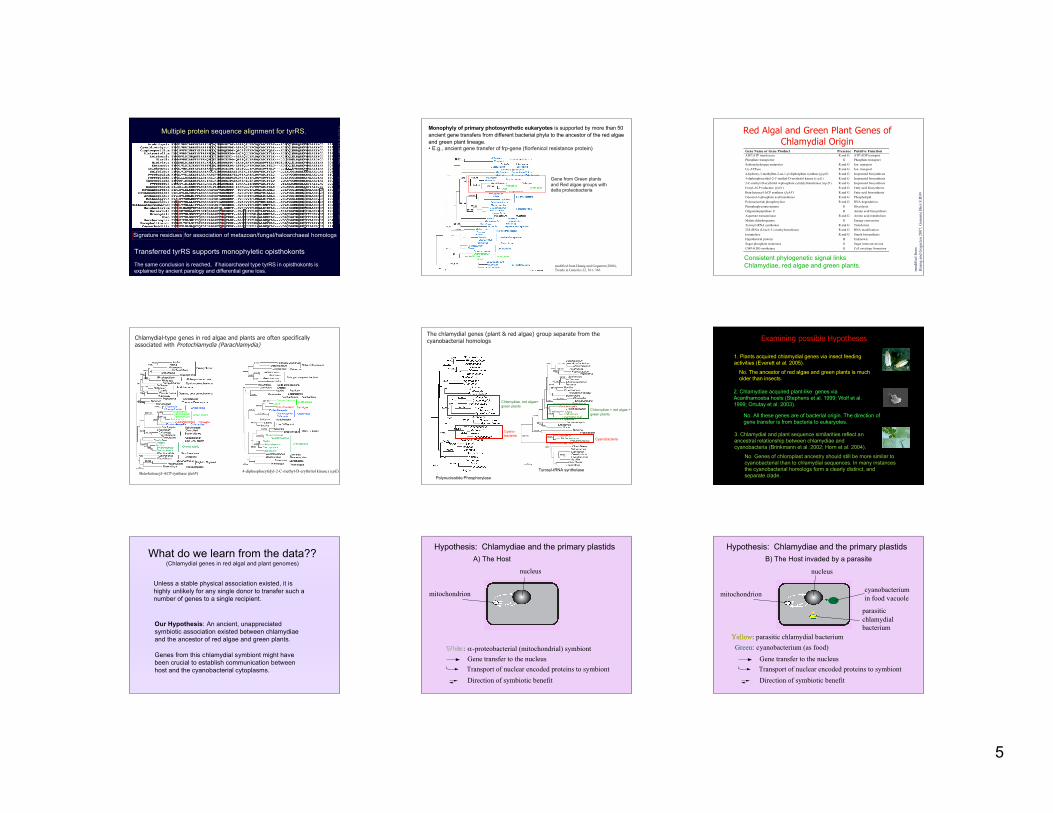
Multiple protein sequence alignment for tyrRS.
Signature residues for association of metazoan/fungal/haloarchaeal homologs
Transferred tyrRS supports monophyletic opisthokonts
The same conclusion is reached, if haloarchaeal type tyrRS in opisthokonts isexplained by ancient paralogy and differential gene loss.
mod
ified
from
Hua
ng, X
u, a
nd G
ogar
ten
(200
5) M
BE
22(1
1):2
142-
6 Monophyly of primary photosynthetic eukaryotes is supported by more than 50ancient gene transfers from different bacterial phyla to the ancestor of the red algaeand green plant lineage.• E.g., ancient gene transfer of frp-gene (florfenicol resistance protein)
Gene from Green plantsand Red algae groups withdelta proteobacteria
modified from Huang and Gogarten (2006), Trends in Genetics 22, 361- 366
Red Algal and Green Plant Genes ofChlamydial Origin
Consistent phylogenetic signal linksChlamydiae, red algae and green plants.
Gene Name or Gene Product Presence Putative Function
ADT/ATP translocase R and G ATP/ADP transport
Phosphate transporter G Phosphate transport
Sodium:hydrogen antiporter R and G Ion transport
Cu-ATPase R and G Ion transport
4-hydroxy-3-methylbut-2-en-1-yl diphosphate synthase (gcpE)
((GcpE)
R and G Isoprenoid biosynthesis
4-diphosphocytidyl-2-C-methyl-D-erythritol kinase (i spE ) R and G Isoprenoid biosynthesis
2-C-methyl-D-erythritol 4-phosphate cytidylyltransferase (isp D ) R and G Isoprenoid biosynthesis
Enoyl-ACP reductase (fabI) R and G Fatty acid biosynthesis
Beta-ketoacyl-ACP synthase (fabF) R and G Fatty acid biosynthesis
Glycerol-3-phosphate acyltransferase R and G Phospholipid
biosynthesis Polynucleotide phosphorylase R and G RNA degradation
Phosphoglycerate mutase G Glycolysis
Oligoendopeptidase F R Amino acid biosynthesis
Aspartate transaminase R and G Amino acid metabolism
Malate dehydrogenase G Energy conversion
Tyrosyl-tRNA synthetase R and G Translation
23S rRNA (Uracil-5-)-methyltransferase R and G RNA modification
Isoamylase R and G Starch biosynthesis
Hypothetical protein R Unknown
Sugar phosphate isomerase G Sugar interconversion
CMP-KDO synthetase G Cell envelope formation
mod
ified
from
H
uang
and
Gog
arte
n 20
07, G
enom
e B
iol 8
:R99
Chlamydial-type genes in red algae and plants are often specificallyassociated with Protochlamydia (Parachlamydia)
4-diphosphocytidyl-2-C-methyl-D-erythritol kinase (ispE)Beta-ketoacyl-ACP synthase (fabF)Tyrosyl-tRNA synthetase
Cyanobacteria
Chlamydiae + red algae +green plants
The chlamydial genes (plant & red algae) group separate from thecyanobacterial homologs
Cyano-bacteria
Chlamydiae, red algae+green plants
Polynucleotide Phosphorylase
Examining possible Hypotheses
2. Chlamydiae acquired plant-like genes viaAcanthamoeba hosts (Stephens et al. 1999; Wolf et al.1999; Ortutay et al. 2003).
3. Chlamydial and plant sequence similarities reflect anancestral relationship between chlamydiae andcyanobacteria (Brinkmann et al. 2002; Horn et al. 2004).
1. Plants acquired chlamydial genes via insect feedingactivities (Everett et al. 2005).
No. All these genes are of bacterial origin. The direction ofgene transfer is from bacteria to eukaryotes.
No. Genes of chloroplast ancestry should still be more similar tocyanobacterial than to chlamydial sequences. In many instancesthe cyanobacterial homologs form a clearly distinct, andseparate clade.
No. The ancestor of red algae and green plants is mucholder than insects.
What do we learn from the data??(Chlamydial genes in red algal and plant genomes)
Unless a stable physical association existed, it ishighly unlikely for any single donor to transfer such anumber of genes to a single recipient.
Our Hypothesis: An ancient, unappreciatedsymbiotic association existed between chlamydiaeand the ancestor of red algae and green plants.
Genes from this chlamydial symbiont might havebeen crucial to establish communication betweenhost and the cyanobacterial cytoplasms.
WhiteWhite: α-proteobacterial (mitochondrial) symbiont
Hypothesis: Chlamydiae and the primary plastids
Gene transfer to the nucleus
nucleus
mitochondrion
Transport of nuclear encoded proteins to symbiontDirection of symbiotic benefit
A) The Host
YellowYellow: parasitic chlamydial bacterium
Hypothesis: Chlamydiae and the primary plastids
Gene transfer to the nucleus
nucleus
mitochondrion
Transport of nuclear encoded proteins to symbiontDirection of symbiotic benefit
B) The Host invaded by a parasite
Green: cyanobacterium (as food)
cyanobacterium in food vacuole
parasiticchlamydialbacterium
6
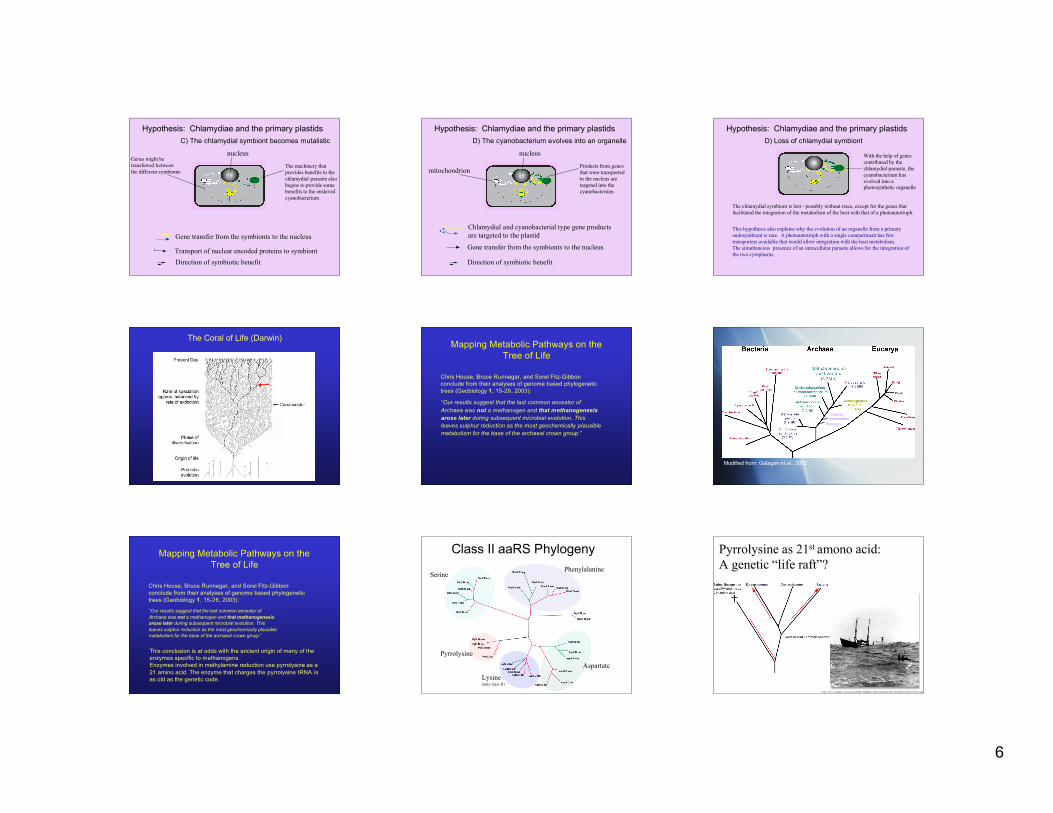
Hypothesis: Chlamydiae and the primary plastids
Gene transfer from the symbionts to the nucleus
nucleusGenes might be transferred betweenthe different symbionts
Transport of nuclear encoded proteins to symbiontDirection of symbiotic benefit
C) The chlamydial symbiont becomes mutalistic
The machinery thatprovides benefits to thechlamydial parasite alsobegins to provide somebenefits to the enslavedcyanobacterium
Hypothesis: Chlamydiae and the primary plastids
Gene transfer from the symbionts to the nucleus
nucleus
Direction of symbiotic benefit
D) The cyanobacterium evolves into an organelle
Products from genesthat were transportedto the nucleus aretargeted into thecyanobacterium
mitochondrion
Chlamydial and cyanobacterial type gene products are targeted to the plastid
Hypothesis: Chlamydiae and the primary plastids D) Loss of chlamydial symbiont
With the help of genescontributed by thechlamydial parasite, thecyanobacterium hasevolved into aphotosynthetic organelle
The chlamydial symbiont is lost - possibly without trace, except for the genes thatfacilitated the integration of the metabolism of the host with that of a photoautotroph.
This hypothesis also explains why the evolution of an organelle from a primaryendosymbiont is rare. A photoautotroph with a single compartment has fewtransporters available that would allow integration with the host metabolism.The simultaneous presence of an intracellular parasite allows for the integration ofthe two cytoplasms.
The Coral of Life (Darwin)Mapping Metabolic Pathways on the
Tree of Life
“Our results suggest that the last common ancestor ofArchaea was not a methanogen and that methanogenesisarose later during subsequent microbial evolution. Thisleaves sulphur reduction as the most geochemically plausiblemetabolism for the base of the archaeal crown group.”
Chris House, Bruce Runnegar, and Sorel Fitz-Gibbonconclude from their analyses of genome based phylogenetictrees (Geobiology 1, 15-26, 2003):
Modified from: Galagan et al., 2002
Thermo-plasmatales
Pyrococci
Mapping Metabolic Pathways on theTree of Life
“Our results suggest that the last common ancestor ofArchaea was not a methanogen and that methanogenesisarose later during subsequent microbial evolution. Thisleaves sulphur reduction as the most geochemically plausiblemetabolism for the base of the archaeal crown group.”
Chris House, Bruce Runnegar, and Sorel Fitz-Gibbonconclude from their analyses of genome based phylogenetictrees (Geobiology 1, 15-26, 2003):
This conclusion is at odds with the ancient origin of many of theenzymes specific to methanogens.Enzymes involved in methylamine reduction use pyrrolysine as a21 amino acid. The enzyme that charges the pyrrolysine tRNA isas old as the genetic code.
Class II aaRS Phylogeny
Aspartate
Lysine(only class II)
Pyrrolysine
PhenylalanineSerine
Pyrrolysine as 21st amono acid:A genetic “life raft”?
http://www.avionpark. com/catalog/images/Fighing%20boat%20sinks%20with%20life%20raft%20web.jpg
7
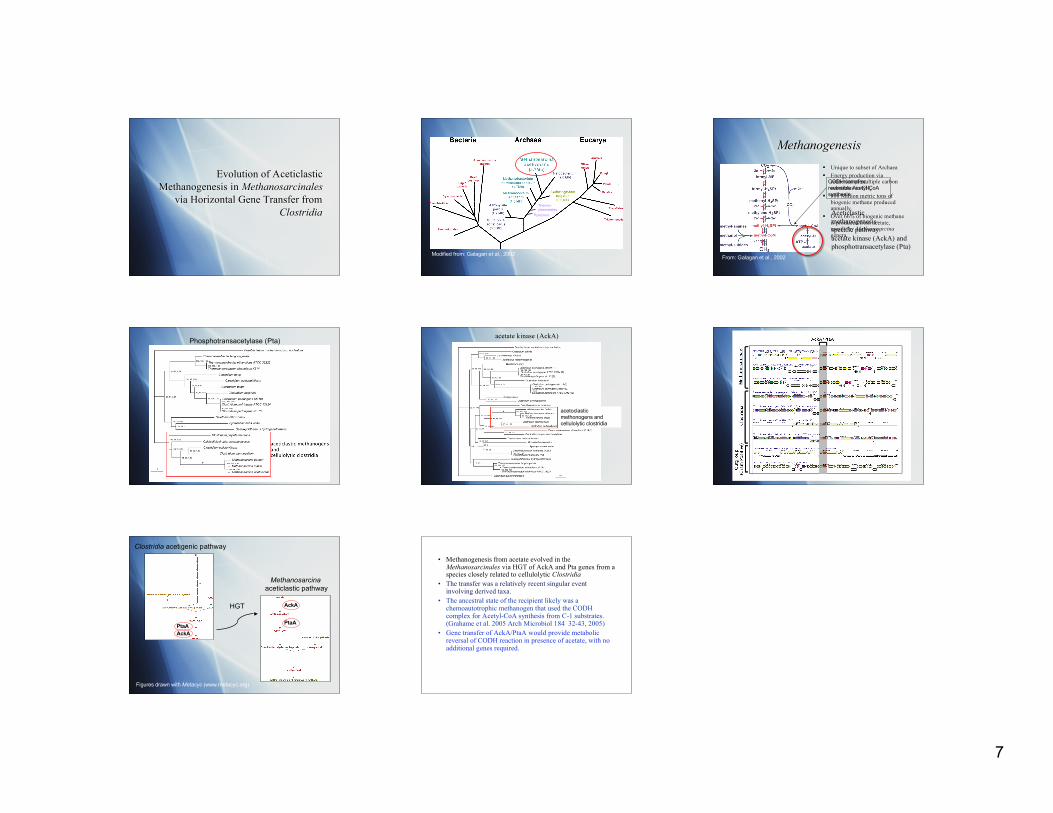
Evolution of AceticlasticMethanogenesis in Methanosarcinales
via Horizontal Gene Transfer fromClostridia
Modified from: Galagan et al., 2002
Thermo-plasmatales
Pyrococci
Methanogenesis Unique to subset of Archaea Energy production via
reduction of multiple carbonsubstrates to CH4
900 Million metric tons ofbiogenic methane producedannually.
Over 66% of biogenic methaneis produced from acetate,mostly by Methanosarcinagenera.
From: Galagan et al., 2002
Aceticlasticmethanogenesis-specific pathway:acetate kinase (AckA) andphosphotransacetylase (Pta)
CODH complex:reversible Acetyl-CoAsynthesis
Phosphotransacetylase (Pta)acetate kinase (AckA)
acetoclasticmethonogens andcellulolytic clostridia
AckA/PtaA
Clostridia acetigenic pathway
Methanosarcina aceticlastic pathway
Figures drawn with Metacyc (www.metacyc.org)
PtaAPtaA
AckA
AckA
HGT
• Methanogenesis from acetate evolved in theMethanosarcinales via HGT of AckA and Pta genes from aspecies closely related to cellulolytic Clostridia
• The transfer was a relatively recent singular eventinvolving derived taxa.
• The ancestral state of the recipient likely was achemoautotrophic methanogen that used the CODHcomplex for Acetyl-CoA synthesis from C-1 substrates.(Grahame et al. 2005 Arch Microbiol 184 32-43, 2005)
• Gene transfer of AckA/PtaA would provide metabolicreversal of CODH reaction in presence of acetate, with noadditional genes required.