Embed Size (px)
Citation preview

Marketing Plans and Performance(Part V)
Market Orientation and Marketing Performance(Part I)
Market Analysis(Part II)
Marketing MixStrategies(Part III)
STRATEGICMARKETING
(PART IV)
Market-Based Management
P A R T I V
Strategic Marketing
� If you come to a fork in the road, take it. —Yogi Berra Major League Baseball Hall of Famer
Just going left or right at a fork in the road is one way for a business to set a strategic direction. A better way, one far more likely
to achieve performance objectives, would be for the business to first consider the probable outcomes of its options.
Strategic market planning sets the long-run direction for a business and has a major role in realizing the business’s objectives of sales growth, profit performance, and share position over time. Marketing mix strategies, which were covered in Part III, are more tactical but are essential to establishing desired target market positions and generating short-run growth and profits. These target market posi-tioning strategies take a business incrementally toward its long-run goals. Both short-run mar-keting mix strategies and long-run strategic market plans promote growth, profitability, and share position.
When it undertakes a strategic market planning process, a business assesses each product-market of interest with respect to market attractiveness and the business’s
competitive position. Using these two dimen-sions of strategic opportunity and position, Chap-ter 11 presents a method for building a strategic market planning portfolio that covers a busi-ness’s existing and potential product-markets.
The strategic market plans generated by the portfolio analysis may be either offensive or defensive. Offensive strategic market plans, presented in Chapter 12 , are growth-oriented plans to spur share penetration or market growth or to prepare for entry into new, emerging, or growing markets. Offen-sive strategic market plans are critical to a business’s future growth, market position, and profitability.
Defensive strategic market plans, pre-sented in Chapter 13 , are intended to protect market positions and profitability. Defensive plans may be based on holding a market posi-tion, reducing the market focus to improve profits, or harvesting or divestment strategies that result in product-market exit. When they are properly executed, defensive strategic mar-ket plans can improve profit performance.

This page intentionally left blank

C H A P T E R 1 1
Portfolio Analysis and Strategic Market Planning
� Strategic market planning provides a sales and profit roadmap for the next 3 to 5 years.
A&W637 Stores
Long JohnSilver‘s
1,024 Stores
Pizza Hut13,281 Stores
Taco Bell5,627 Stores
KFC16,264 Stores
Segment Market Share (U.S.)
Op
po
rtu
nit
y fo
r G
row
thPo
or
0% 20% 40% 60%
Ave
rag
eG
oo
d
Yum Brands’ Product Portfolio and Strategic Market Plan
Sales Revenues
Operating Profit
Operating Profit (% sales)
$9.6
$1.26
13.1%
$10.4
$1.36
13.1%
$11.3
$1.77
15.7%
$10.8
$1.59
14.7%
$11.3
$1.52
13.5%
Performance (billions) 2006 2008 2009 20102007
Yum Brands has an impressive portfolio of five well-known brands, which together have almost 37,000 store locations worldwide. In 2011, on the basis of an analysis of the market attrac-tiveness and the competitive position of each of its five store brands, Yum Brands imple-mented the following portfolio strategy:
� Invest to Grow: KFC, Taco Bell, and Pizza Hut. The company plans much of the growth in these brands to occur outside the United States, with a strong focus on China, where the brands are already in place.
� Divest: Long John Silver’s and A&W were sold in late 2011. Long John Silver’s had a good market share but in a very small mar-ket. A&W was facing tough segment compe-tition from McDonald’s, Wendy’s, Burger King, and others. Funds from the sale of these brands will be invested in the growth brands. 1

376 Part IV Strategic Marketing
PORTFOLIO ANALYSIS AND STRATEGIC MARKET PLANNING
The purpose of portfolio analysis is to take a strategic view of where a business is and where it wants to go with its portfolio of existing and future products. A product portfolio analysis led Yum Brands to divest two of its well-known brands and to focus on the growth of three other brands that are better positioned for profitable growth. A portfolio analysis provides a strategic snapshot of the current situation. Strategic market plans are forward looking and enable a company to make strategic changes to its product portfolio that are in line with the company’s strategic vision and performance objectives.
In 1964, Toyota entered the low-price end of the U.S. car market with the Corona, followed in 1966 by the Crown and in 1968 by the Corolla. The Crown was a strong brand in Japan but lasted only a few years in the U.S. market. The Corona lasted almost 10 years. It was the Corolla that established a Toyota product position in the U.S. car market, and that model has prospered to the point where a Corolla is produced every 7 seconds.
But that is only the beginning of the Toyota product portfolio story and the company’s pursuit of a grander strategic vision. Starting at the low-price end of the U.S. car market in the 1960s, Toyota adopted a strategic market plan to build its product line by introducing brands at the next quality-price point. The company continued its strategy through the 1970s and 1980s until the Toyota brand reached the limits of its brand status, and then it made an extensive engineering and marketing effort to develop the Lexus. The Lexus was an immediate success and opened a new segment of the market for Toyota.
Toyota then carefully analyzed every market segment on the basis of the price-quality curve and sequentially added new models at different levels of the company’s price-quality product portfolio. It introduced new models at the low-price end of the market, as well as at the mid-level price and high-price points, as shown in Toyota’s 2010 product portfolio in Figure 11-1 .
Portfolio Analysis Models
There is nothing magical about a portfolio analysis model. It typically has two dimen-sions of performance: a price-quality model and a product life-cycle model. The Toyota price-quality portfolio model in Figure 11-1 may seem simplistic at first glance, but the way it contrasts price against product quality and brand status provides a strategic view of product positioning and the market segments that are served along the price-quality curve. This portfolio model has served Toyota well in managing its strategic growth over the last 50 years.
The product life-cycle model shown in Figure 11-2 is an equally useful portfolio planning model. Portfolio A is an unbalanced product portfolio. The business whose products are represented in Portfolio A has not invested in new products, and as the prod-ucts move through their product life cycles, sales and profits will at some point decline. Portfolio B has been managed more effectively. It is a balanced portfolio, one with a high
Yum Brands had profitable growth from 2006 through 2010 despite a worldwide recession. The company’s strategic market plan is to grow
sales at a faster rate, improve the average profit margin, and increase Yum Brands’ operating profit in dollars and as a percentage of sales.

Chapter 11 Portfolio Analysis and Strategic Market Planning 377
percentage of sales (shown by the sizes of the circles) at the late-growth and mature stages of the product life cycle. The result is good profitability (shown by the dashed line in the graph).
More important, Portfolio B has a great future. Roughly a third of its sales are in the early or growth stages of the product-market life cycle. As product A goes into its decline stage, each of the other products will progress at its market growth rate to the next stage of its product-market life cycle. Although Portfolio A has good short-run
Pro
du
ct-P
rice
Po
siti
on
Product Quality and Brand StatusPr
od
uct
-Pri
ce P
osi
tio
nProduct Quality and Brand Status
Corolla (1968) Crown (1966)Corona (1964)
Lexus (8 body styles) Land Cruiser Sequoia 4Runner Avalon Tundra (3 body styles) Highlander Sienna Venza FJ Cruiser Camry (2 body styles) RAV 4 Prius Tacoma (3 body styles) Matrix Scion (4 body styles) CorollaYaris (2 body styles)
Toyota U.S. Portfolio – 1960s Toyota U.S. Portfolio – 2010
FIGURE 11-1 TOYOTA PRODUCT PORTFOLIO: 1960s AND 2010
MatureMarket
Declining Market
Late Growth
EarlyAdopters
EmergingMarket
Market Growth
$0
Circle size is proportionate to sales.
Dollars
Sales
Profits
Portfolio A
AB
CD
E
MatureMarket
Declining Market
Late Growth
EarlyAdopters
EmergingMarket
Market Growth
$0
Dollars
Sales
Profits
Portfolio BA
B
C
D
E
FIGURE 11-2 PRODUCT LIFE CYCLES OF TWO PRODUCT PORTFOLIOS
378 Part IV Strategic Marketing
profitability, poor strategic market planning will eventually leave this business with declining sales and profits. Portfolio B, while perhaps not quite as profitable in the short run, is the better-positioned portfolio. It will continue to deliver growth in both sales and profits over time, as long as the business maintains a balanced portfolio of products that offer good customer value.
So far we have looked at different portfolio analysis models and strategic market plans for Yum Brands, Toyota, a company with a very mature portfolio of products that are doing well today but may threaten the company’s survival in the future, and a com-pany with a well-balanced portfolio of products spread across the different stages of a typical product-market life cycle. The next section examines how a variety of portfolio analysis models are used in strategic market planning.
STRATEGIC MARKET PLANNING
Successful companies like General Electric, Procter & Gamble, and Toyota achieve suc-cess year after year by doing a great deal of strategic market planning. 2 The executives and managers of these companies are committed to serving shareholders by continuously reviewing current performance, tracking the results of funding and investment decisions that are aimed at promoting short- and long-run performance, and seeking new opportu-nities. An important part of this process is investing for the future and maintaining port-folio diversification to reduce large swings in overall performance.
Each product-market in a business’s portfolio in some way affects both the short- and long-run performance of the business, as illustrated in Figure 11-2 . The business may want to increase its investment in some product-markets, depending on their current and potential share positions and their performance levels, in order to grow or defend impor-tant strategic market positions. In other product-markets, the business may want to reduce its focus in order to achieve a stronger competitive position and profit contribution with available resources. For yet other product-markets, the business may decide to withdraw its resources and divest. Because the resources of any business are limited, a strategic market plan is needed to carefully map a business’s future share position, sales growth, and profit performance. A strategic market plan sets the direction and provides guidelines for resource allocation. Some analysts believe that the resource allocation guidelines of a strategic market plan may lead to a strategic advantage. 3
In order to specify a strategic direction for each product-market and to allocate resources in a way that will bring about the desired short- and long-run performance, businesses engage in a strategic market planning process. 4 Figure 11-3 outlines this proc-ess. The first step is a careful assessment of market attractiveness and competitive posi-tion for each product-market that a business serves or is considering serving.
� Market Attractiveness: Several factors affect the attractiveness of a market. Product life-cycle position and market growth rate are measures of market attractiveness that correspond to sales and profits, as we saw in Figure 11-2 .
� Competitive Position: Measures of competitive position help a business discern a strong competitive position from a weak one. One measure that corresponds to sales and profit performance is relative market share , which is the ratio of a business’s mar-ket share to the total share of its three largest competitors. The stronger a business’s or

Chapter 11 Portfolio Analysis and Strategic Market Planning 379
a product’s relative market share, the more profitable it is. 5 Another measure is the share development index, which also relates share growth to sales and profit.
To create the matrix for a portfolio based on the life cycles of a business’s products, we begin by building the market attractiveness dimension of the portfolio. Figure 11-4 illustrates how the product’s sales and profits vary over the product life cycle. The differ-ent levels of performance at different stages of the product life cycle require a business to implement different strategies and allocate different levels of marketing resources as a product moves through its life cycle.
Portfolio Analysis
Strategic Market Planning
Market Attractiveness Competitive Position
FIGURE 11-3 PORTFOLIO ANALYSIS AND STRATEGIC MARKET PLANNING
30%
25%
15%
10%
Competitive Position
5%
0%
0MarketDemand
Profits
Max.Profits
MarketPotential
Product Life Cycle
10 20 30 40 50 60 70 80 90 100−5%
Circle size is proportionate to sales.
Mar
ket
Gro
wth
Rat
e
20% D
C
A
B
E
FIGURE 11-4 PRODUCT LIFE-CYCLE PORTFOLIO

380 Part IV Strategic Marketing
Examining the sales and profits of product D in Figure 11-5 helps us understand the relationship between the stages of the product life cycle and market attractiveness. Assume that the market demand for product D, now in the early growth stage of its prod-uct life cycle, is 1 million units annually and the product captures 10 percent of this demand with a price of $100 per unit. The result is $10 million in sales:
Sales (current)
Product D = Market Demand * Market Share * Price = 1,000,000 units * 10% * $100 per unit = $10 million
If the market grows 20 percent annually and the business maintains its 10 percent market share, sales should increase by $2 million in the first year:
Sales (year 1)
Product D = Market Demand * Market Share * Price = 1,200,000 units * 10% * $100 per unit = $12 million
Although this example is an oversimplification, because the price would undoubt-edly decrease somewhat, it demonstrates the attractiveness of a market in terms of sales when the product is in the growth stage of its life cycle. If the price were to decrease 3 percent, from $100 to $97, sales would still grow to $11.64 million.
But what about profits? By including in the equation the unit cost and the marketing and sales expenses, we can estimate the marketing profits that are produced with a hold share strategy for product D. The current-year net marketing contribution with a 10 percent
7.2%
7.2%
12%
30%
40%
3.6%
40%Not Aware
60%Aware
50%Consider
50% Do NotConsider
33% Do NotPurchase
67%Purchase
40% Do NotPrefer
60%Prefer 40% Not
Available
60%Available
Market Share Index (Product D) = 60% × 50% × 60% × 60% × 67% = 7.2%Share Potential Index (Product D) = 80% × 70% × 67% × 80% × 75% = 22.5%Share Development Index (Product D) = (Market Share Index / Share Potential) × 100 = (7.2% / 22.5%) × 100 = 32
FIGURE 11-5 MARKET SHARE AND POTENTIAL FOR SHARE GROWTH

Chapter 11 Portfolio Analysis and Strategic Market Planning 381
market share, 40 percent margin, and marketing and sales expenses at 15 percent of sales is $1.5 million.
NMC (current)Product D
MarketDemand
MarketShare
UnitP� � � rrice
UnitCost
Marketing andSales Expenses
1,000,
� �
� 0000 units 10% ($100 $60) $1 5 million$4 m
� � � ��
.iillion $1 5 million�
�.
$2.5 million
The marketing return on sales is 25 percent. If marketing and sales expenses remain at 15 percent of sales, a hold share strategy would produce a $3 million marketing profit in year 1.
Product DNMC (year 1) Market
DemandMarketShare
UnitPr� � � iice
UnitCost
Marketing andSales Expenses
1,200,0
� �
� 000 units 10% ($100 $60) $1 8 million$4 8
� � � ��
.. mmillion $1 8 million�
�.
$3 million
We can see, then, that the product life cycle serves as a good indication of market attractiveness not only in terms of share growth and sales, but also with regard to profit.
We still need a way to measure competitive position. There are several different ways to do it, but the one measure that provides a reliable assessment of competitive position is the level of market share. Market share is highly representative of a busi-ness’s competitive position in the market place, and it can be managed over the product life cycle to provide positive impacts on sales and profit. But, again, a word of caution: a business must manage market share gains to improve profit, not just sales and market share. For this reason, we have selected the share development index (SDI) as the stra-tegic measure of competitive position for the portfolio that is based on product life cycles in Figure 11-6 and Figure 11-7 . The SDI also indicates the level of opportunity that exists to improve a product’s competitive position: Product D’s relatively low SDI of 32 as shown in the two charts means that its potential for greater sales and profit is very high.
Recall that to calculate a product’s SDI, we first estimate its market share and share potential indexes. Using the market share performance tree presented in Chapter 3 , we can estimate that product D has a market share index of 7.2 percent, as shown in Fig-ure 11-5 . The share potential index is the share index that product D would achieve if it could reach all of the performance targets that the company sets for each level of the market share performance tree. In Figure 11-5 , these performance targets are represented in the calculation for the share potential index, resulting in a share potential index of 22.5 percent. The ratio of current to potential share multiplied by 100 produces the share development index of 32.
Remember that the market share index is not intended to represent a business’s actual market share. Many factors in addition to the ones in the share development tree shape actual market share. However, the market share index is a summary index of the more important share performance metrics—in this case, the five metrics we chose. A

382 Part IV Strategic Marketing
30%
25%
15%
10%
5%
0%
0 10 20 30 40 50 60 70 80 90 100−5%
Circle size is proportionate to sales.
Mar
ket
Gro
wth
Rat
e
20% D
C
A
B
E
Share Development Index
FIGURE 11-6 PORTFOLIO ANALYSIS USING MARKET GROWTH RATE AND SDI
30%
25%
15%
10%
5%
0%
0 10 20 30 40 50 60 70 80 90 100−5%
Circle size is proportionate to sales.
Mar
ket
Gro
wth
Rat
e 20%
C
A
B
E
Share Development Index
D
FIGURE 11-7 PRODUCT-MARKET PORTFOLIO PLAN
business can expect gains in actual market share to the extent that it improves its market share index.
The example that follows illustrates how an improved market share index can lead to sales and profit growth. A business with sales of $10 million increased its marketing resources to improve its market share index from 7.2 percent to 10 percent during year 1

Chapter 11 Portfolio Analysis and Strategic Market Planning 383
of its strategic market plan, resulting in an estimated 1 percent increase in actual market share—from 10 to 11 percent:
Sales (year 1)
Product D = Market Demand * Market Share * Price = 1,200,000 units * 11% * $100 per unit = $13.2 million
The increase in market share resulted in $3.2 million in additional sales revenue. But what about profits? Is this market share strategy profitable? To calculate the net market-ing contribution, we take into account that the business increased its marketing and sales budget from $1.8 million to $2 million to support the improvement in the market share performance metrics.
NMC (year 1)Product D
� � �MarketDemand
MarketShare
UnitPricce
UnitCost
Marketing andSales Expenses
1,200,0
� �
�
000 units 11% ($100 $60) $1.98 million� � � ��$3.3 million $2 million�� $3.3 million
Had the business pursued a hold share strategy and held marketing and sales expenses at 15 percent of sales, the net marketing contribution would have been $3 mil-lion. A grow share strategy in a market that is growing 20 percent per year would produce 10 percent higher marketing profits than a hold share strategy.
But it is equally important to examine a situation in which market share gains result in higher sales and higher market share but a lower marketing profit. Product A in Fig-ures 11-4 and 11-6 is a good example. It is approaching the mature stage of its product life cycle and has achieved 84 percent of its share potential. Given a 5 percent rate of market growth and no price erosion, sales of product A can be expected to increase from $100 million to $105 million with a 20 percent market share:
Sales (current)
Product A = Market Demand * Market Share * Price = 10,000,000 units * 20% * $50 per unit = $100 million
Sales (year 1)
Product A = Market Demand * Market Share * Price = 10,500,000 units * 20% * $50 per unit = $105 million
With sales of $100 million for the current year, a 20 percent margin, and marketing and sales expenses equal to 10 percent of sales, the marketing profit is $10 million.
NMC (current)Product A
� � �MarketDemand
MarketShare
UnnitPrice
UnitCost
MarketingExpenses� �
�
100 000 000 20 50 40, , % ($ $ ) $units 10 million$2
� � � �� 00 million $10 million�� $10 million

384 Part IV Strategic Marketing
For year 1, a grow share strategy for product A calls for a price reduction of 5 per-cent. The product’s price elasticity is –2, and a 5 percent price decrease would lead to a 10 percent increase in volume sold. The expected outcome would be a 2 percent increase in the business’s share of a market that is growing at 5 percent annually, resulting in a significant increase of $9.7 million in sales over the current year:
Sales (year 1)
Product A = Market Demand * Market Share * Price = $109.7 million
But would this grow share strategy be more profitable even when marketing and sales expenses are held at the current-year level of $10 million?
NMC (year 1)Product A
� � �MarketDemand
MarketShare
UnitPrice
UnitCost
Marketing andSales Expenses
10,500,
� �
�
0000 units 22% ($47 5 $40) $10 million
$17
� � � ��
.
.33 million $10 million�� $7 3 million.
Despite the gains in market share, a strategy to grow share with a 5 percent price reduction would reduce profits in year 1 by $2.7 million even with the 5 percent growth in market demand and no increase in the marketing and sales budget. The grow share strategy in this case is a good example of how a blind pursuit of greater market share and sales can lead to lower profits.
Product Life Cycle/Market Share Portfolio
The product-market portfolio plan in Figure 11-7 incorporates all three elements a busi-ness uses in the market planning process: business performance, market attractiveness, and competitive position. Performance is represented by the size of each product’s circle, which is proportionate to the current-year sales revenue that the product generates. The vertical axis represents the market growth rate, a major factor in determining market attractiveness. The market growth rate corresponds to the stages of the product life cycle presented in Figure 11-2 . And the horizontal axis is a scale for the share development index, our measure of competitive position. With this portfolio we can assess the five products with an eye toward selecting the kind of strategic market plan that would be most effective for each one, given the attractiveness of its market, its competitive posi-tion, and its present sales performance and potential for improved performance.
� Product A —Product A in Figure 11-7 is in the mature stage of its life cycle. Market demand, however, is still growing at 5 percent annually, and the product’s share devel-opment index of 84 indicates that it has a strong competitive position. The combina-tion of these factors suggests that the product is well worth protecting. This is the time to carefully manage the profit that the product produces; any large investment in mar-keting and sales expenses would only draw down marketing profits. Product A is a key source of profitability for the business, and it supports the business’s other products and the development of new ones.
� Product B —Like product A, product B is in the mature stage of its product life cycle, but market demand is no longer growing. There is some room to grow the product’s

Chapter 11 Portfolio Analysis and Strategic Market Planning 385
market share, but a grow share strategy with price cuts is likely to result in lower profits. Product B’s future is limited, yet it is still an important part of the business’s overall profitability. Eventually margins and marketing profits will fall below per-formance benchmarks, and then a harvest strategy will be the best approach for product B. But as the business incrementally raises prices during harvesting, it should be on the lookout for the possible formation of a profitable niche market for this product.
� Product C —As product C approaches the late-growth phase of the product life cycle, the company will need to invest in marketing and sales expenses that will enable the product to maintain its market share in a growing market. An even larger marketing and sales budget would be required if the company wished to grow share at this stage of the product life cycle. From both strategic and long-run profit perspectives, it is important to grow share before the product enters the mature stage of its life cycle. Product C will be a major contributor to the portfolio’s sales and profits as it moves into late market growth (maximum profits) and eventually the mature stage of the product life cycle.
� Product D —Product D is in the early growth stage of its product life cycle, and the com-pany needs to invest marketing and sales resources to take advantage of the rapid growth in demand for this product. Its low share development index of 32 also suggests that the business needs an effective strategy for achieving more of the product’s share potential at this stage of its product life cycle. Strategically, because it is just entering the growth phase of its life cycle, product D will be in a rapidly growing market for some time. Gaining market share now is critical and would make product D a valuable source of profitable growth until market demand reaches its full potential sometime in the future.
� Product E —As product E moves from the emerging market stage of the product life cycle to early growth stage, it is in a very strong competitive position with a share development index of 90. The company needs to make a continued investment to hold product E’s excellent share position in a market that is growing 25 percent annually. An inadequate marketing and sales budget at this point would result in share slippage and greatly reduced future profits.
GE/McKinsey Portfolio Analysis
Market attractiveness and competitive position cannot always be fairly represented by a single factor. Many factors can contribute to market attractiveness. The stage of the prod-uct life cycle, the market’s growth rate, and the market development index are certainly important considerations, but so are the size of the market, its competitive environment, and the ease or difficulty of accessing the market.
Likewise, competitive position could include more than a business’s relative market share or its share development index. A strong brand, high product performance, out-standing service quality, high brand awareness, and a cost advantage are also important in shaping competitive position.
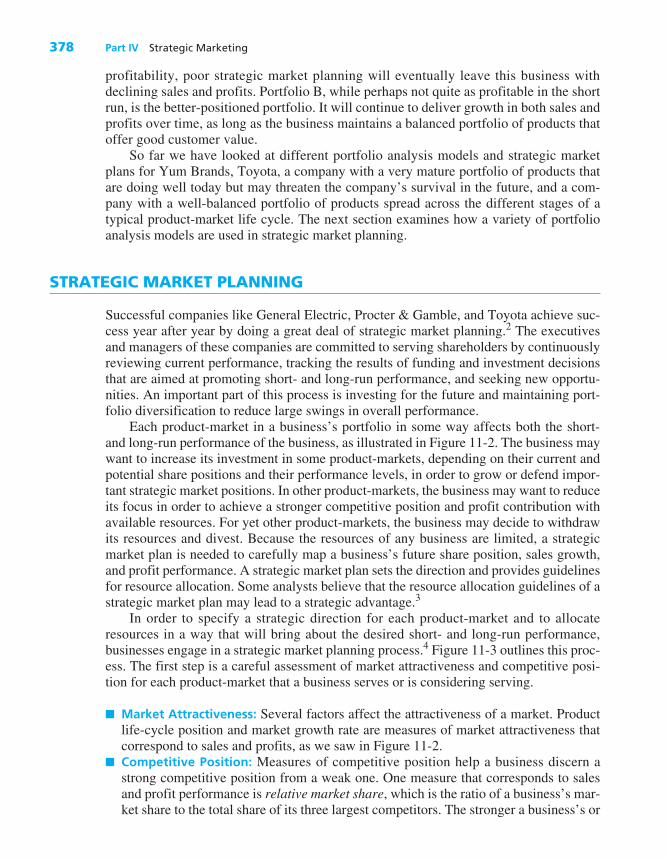
For these reasons, General Electric and McKinsey Consulting have developed a portfolio matrix that uses multiple factors to index market attractiveness and competitive position. The multi-factor indexes create a scale that varies from 0 to 100, as shown in Figure 11-8 . On the basis of these assessments, the overall portfolio position of product A is average in market attractiveness but very strong in competitive position. A business would likely consider a strategic market plan to protect this product position. But before
386 Part IV Strategic Marketing
we go further into portfolio analysis and strategic market planning, let’s take a close look at how market attractiveness and competitive position indexes are constructed.
MARKET ATTRACTIVENESS
A company’s long-term objectives serve as the basis for developing performance objec-tives and a tactical marketing mix strategy. This important step in the strategic market planning process requires an in-depth examination of market attractiveness . We need a systematic way to assess market attractiveness, using a common set of criteria against which to compare product-markets.
So what factors make a market attractive or unattractive? Factors that typically shape market attractiveness are market size, market growth, competition, margin potential, market access, and a “good fit” with the company’s core capabilities. These factors can be meaningfully grouped into three dimensions of market attractiveness: market forces, competitive environment, and market access, as shown in Figure 11-9 .
To create a measure of market attractiveness, each of these three dimensions may be weighted to reflect its importance in relation to the others. In the example presented in Figure 11-10 , market forces and market access are both weighted at 30 percent of the total importance, whereas competitive environment is weighted a little more heavily at 40 percent. Each dimension is further broken down into several factors that contribute to that particular dimension of market attractiveness, and each of these factors is also weighted to represent its relative importance within its respective dimension of market attractiveness.
100
80
60
40
Competitive Position
20
0 20 40 60 80 1000
Circle size is proportionate to sales.
Mar
ket
Att
ract
iven
ess
D
C
E
A
B
FIGURE 11-8 GE/McKINSEY PORTFOLIO MODEL

Chapter 11 Portfolio Analysis and Strategic Market Planning 387
Market SizeGrowth RateBuyer Power
Number of CompetitorsEase of Competitor EntryPrice Rivalry
Customer FamiliarityChannel AccessSales Requirements
MARKETATTRACTIVENESS
MarketForces
CompetitiveEnvironment
MarketAccess
FIGURE 11-9 FACTORS THAT SHAPE MARKET ATTRACTIVENESS
FIGURE 11-10 MARKET ATTRACTIVENESS INDEX
Market Attractiveness
Very Unattractive
Unattractive
Somewhat Unattractive
Somewhat Attractive
Attractive
Very Attractive
0 20 40 60 80 100
Market Forces Factor Importance: 30%
Relative Importance
Attractiveness Rating
Attractiveness Score
Market Size 40% 80 32
Growth Rate 30% 60 18
Buyer Power 30% 40 12
100% 62
Competitive Environment Factor Importance: 40%
Relative Importance
Attractiveness Rating
Attractiveness Score
Price Rivalry 50% 40 20
Ease of Competitor Entry 30% 40 12
Number of Competitors 20% 60 12
100% 44
Market Access Factor Importance: 30%
Relative Importance
Attractiveness Rating
Attractiveness Score
Customer Familiarity 40% 80 32
Channel Access 40% 100 40
Sales/Service Requirements 20% 60 12
100% 84
Market Attractiveness Index = 30% × 62 + 40% × 44 + 30% × 84 = 18.6 + 17.6 + 25.2 = 61
388 Part IV Strategic Marketing
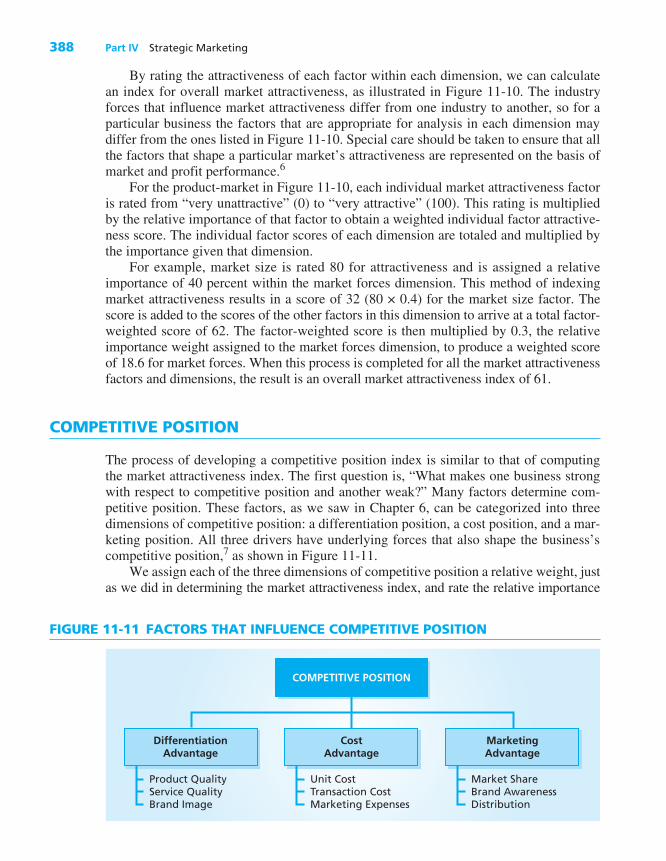
Product QualityService QualityBrand Image
Unit CostTransaction CostMarketing Expenses
Market ShareBrand AwarenessDistribution
COMPETITIVE POSITION
DifferentiationAdvantage
CostAdvantage
MarketingAdvantage
FIGURE 11-11 FACTORS THAT INFLUENCE COMPETITIVE POSITION
By rating the attractiveness of each factor within each dimension, we can calculate an index for overall market attractiveness, as illustrated in Figure 11-10 . The industry forces that influence market attractiveness differ from one industry to another, so for a particular business the factors that are appropriate for analysis in each dimension may differ from the ones listed in Figure 11-10 . Special care should be taken to ensure that all the factors that shape a particular market’s attractiveness are represented on the basis of market and profit performance. 6
For the product-market in Figure 11-10 , each individual market attractiveness factor is rated from “very unattractive” (0) to “very attractive” (100). This rating is multiplied by the relative importance of that factor to obtain a weighted individual factor attractive-ness score. The individual factor scores of each dimension are totaled and multiplied by the importance given that dimension.
For example, market size is rated 80 for attractiveness and is assigned a relative importance of 40 percent within the market forces dimension. This method of indexing market attractiveness results in a score of 32 (80 × 0.4) for the market size factor. The score is added to the scores of the other factors in this dimension to arrive at a total factor-weighted score of 62. The factor-weighted score is then multiplied by 0.3, the relative importance weight assigned to the market forces dimension, to produce a weighted score of 18.6 for market forces. When this process is completed for all the market attractiveness factors and dimensions, the result is an overall market attractiveness index of 61.
COMPETITIVE POSITION
The process of developing a competitive position index is similar to that of computing the market attractiveness index. The first question is, “What makes one business strong with respect to competitive position and another weak?” Many factors determine com-petitive position. These factors, as we saw in Chapter 6 , can be categorized into three dimensions of competitive position: a differentiation position, a cost position, and a mar-keting position. All three drivers have underlying forces that also shape the business’s competitive position, 7 as shown in Figure 11-11 .
We assign each of the three dimensions of competitive position a relative weight, just as we did in determining the market attractiveness index, and rate the relative importance

Chapter 11 Portfolio Analysis and Strategic Market Planning 389
for each of the underlying factors within the three dimensions, as illustrated in Figure 11-12 . Each factor is assessed with respect to the competitive position of the business in its existing market or its potential position in new markets under consideration. When the score for each of the three dimensions of competitive position is weighted by its relative importance, and the three weighted scores are then added, the result is the competitive position index; in this example it is 55 (rounded). The business’s index of 55 places its competitive position in the midrange.
The competitive forces that shape the differentiation position for the business shown in Figure 11-12 are relatively strong and make up more than half of the competitive posi-tion index. The business’s weighted competitive position score with respect to a market-ing advantage is a weak 6.8 (20% × 34) due to a lower dimension weighting and generally lower attractiveness ratings for the factors in that dimension.
Competitive Position
Considerably Behind
Clearly Behind
Somewhat Behind
Somewhat Ahead
Clearly Ahead
Considerably Ahead
0 20 40 60 80 100
Differentiation Advantage Factor Importance: 40%
Relative Importance
Attractiveness Rating
Attractiveness Score
Product Quality 40% 80 32
Service Quality 30% 60 18
Brand Image/Reputation 30% 80 24
100% 74
Cost Advantage Factor Importance: 40%
Relative Importance
Attractiveness Rating
Attractiveness Score
Cost of Goods Sold 70% 40 28
Marketing and Sales Expenses 20% 60 12
Overhead Expenses 10% 60 6
100% 46
Marketing Advantage Factor Importance: 20%
Relative Importance
Attractiveness Rating
Attractiveness Score
Market Share 40% 40 16
Brand Awareness 30% 40 12
Distribution 30% 20 6
100% 34
Competitive Position Index = 40% × 74 + 40% × 46 + 20% × 34 = 29.6 +18.4 + 6.8 = 55
FIGURE 11-12 COMPETITIVE POSITION INDEX
390 Part IV Strategic Marketing
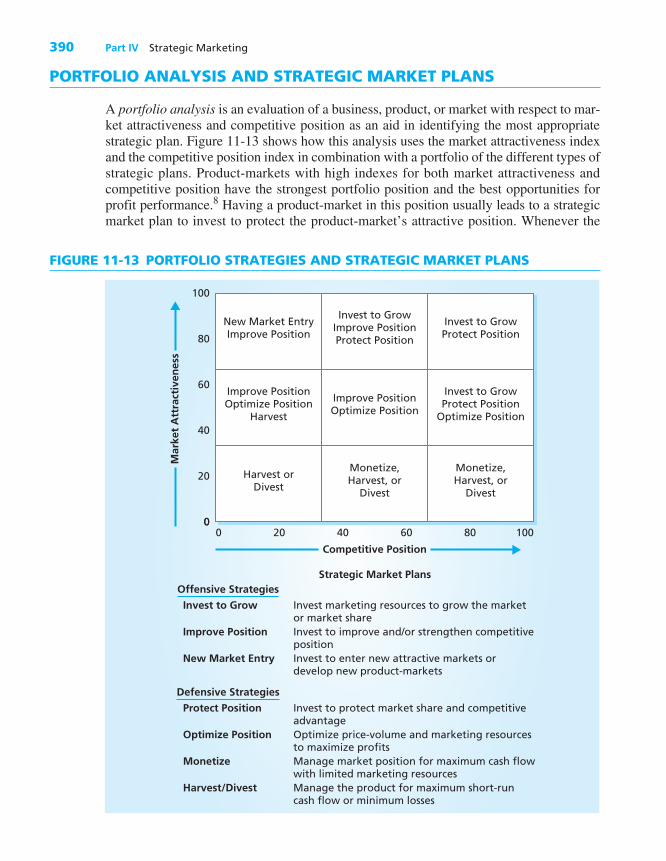
PORTFOLIO ANALYSIS AND STRATEGIC MARKET PLANS
A portfolio analysis is an evaluation of a business, product, or market with respect to mar-ket attractiveness and competitive position as an aid in identifying the most appropriate strategic plan. Figure 11-13 shows how this analysis uses the market attractiveness index and the competitive position index in combination with a portfolio of the different types of strategic plans. Product-markets with high indexes for both market attractiveness and competitive position have the strongest portfolio position and the best opportunities for profit performance. 8 Having a product-market in this position usually leads to a strategic market plan to invest to protect the product-market’s attractive position. Whenever the
0 806040200
80
60
40
20
0100
100
Competitive Position
Strategic Market PlansOffensive Strategies
Invest to Grow
Improve Position
New Market Entry
Invest marketing resources to grow the marketor market shareInvest to improve and/or strengthen competitivepositionInvest to enter new attractive markets ordevelop new product-markets
Defensive Strategies
Protect Position
Optimize Position
Monetize
Invest to protect market share and competitiveadvantageOptimize price-volume and marketing resourcesto maximize profitsManage market position for maximum cash flowwith limited marketing resources
Harvest/Divest Manage the product for maximum short-runcash flow or minimum losses
Mar
ket
Att
ract
iven
ess
Harvest orDivest
Monetize,Harvest, or
Divest
Monetize,Harvest, or
Divest
Improve PositionOptimize Position
Harvest
Improve PositionOptimize Position
Invest to GrowProtect Position
Optimize Position
New Market EntryImprove Position
Invest to GrowImprove PositionProtect Position
Invest to GrowProtect Position
FIGURE 11-13 PORTFOLIO STRATEGIES AND STRATEGIC MARKET PLANS

Chapter 11 Portfolio Analysis and Strategic Market Planning 391
two indexes intersect, there is at least one strategic market plan for the company to con-sider. 9 The different kinds of strategic plans are listed here according to their objectives:
� Invest to Grow —An offensive strategic market plan to invest marketing and sales resources to grow the market or a product’s position in a market. Dell, because of a strong portfolio position, has invested heavily over the past 20 years to grow both the personal computer market and its share of the market.
� Invest to Improve Position —An offensive strategic market plan that seeks to improve a business’s competitive position in an attractive segment of the market. Toyota invested early in hybrid vehicles to strengthen its competitive position in this segment of the automotive market. When Toyota first entered the segment, it was growing in market attractiveness, but few competitors were entering it. As a result, Toyota built an early lead in an attractive market.
� New Market Entry —An offensive strategy to enter new attractive markets. Again, Toyota’s entry into the hybrid market is an example of this strategy. The company plans to strengthen its competitive position in this market by expanding its line of hybrid cars and stepping up production. New market strategies focus on developing the market and are required for most new products, such as flat-screen televisions, cel-lular phones, and DVD players when they were introduced. New market development strategies require a large investment in marketing resources, so this segment of the business operates at a loss until market volumes reach break-even levels.
� Protect Position —A defensive strategy to protect an attractive market position in which the business dominates with respect to competitive position. Gatorade in the sports drink market and Red Bull in the energy drink market both have market shares of about 80 percent. Although these markets are attractive and growing, these products will come under increasing attack as new competitors enter the market.
� Optimize Position —Many businesses implement a defensive strategy in the late-growth stage or the mature stage of the product life cycle. When growth potential is limited and competitive position is set, businesses need to optimize the marketing mix to produce maximum marketing profits. This is the time in the product life cycle when volumes are nearly at full potential and margins are still somewhat attractive. A busi-ness can incrementally reduce its investment in marketing resources because the product-market is mature or nearing maturity. A business using this defensive strategy undertakes a conscious effort to reduce its customer base in order to reach a more profitable level of business. Many banks, for example, have redefined their customer base by charging fees for small accounts that cannot be profitably served. As these fees cause many customers to leave, the banks are able to grow profits with a smaller, more focused customer base. When it is managed correctly, a strategy to optimize position at the later stages of the product life cycle allows the product to produce its maximum profits.
� Monetize Strategy —A defensive strategy used in less attractive markets in which a business has some level of competitive position. The strategy manages prices and marketing resources in a way that maximizes cash flow without exiting the market. Businesses in the cash flow mode often place limits on payment terms, do not pay for shipping, and offer few customer services. Although the price remains competitive, these businesses minimize investment in their products and strive for maximum cash flow from their market position.

392 Part IV Strategic Marketing
� Harvest Strategy —A defensive strategy for maximizing profits and cash flow as a business slowly exits a product-market. Prices are increased to improve margins as volumes decline. In the short run, the strategy produces a higher gross profit. Reduc-tions in marketing expenses lower the cost of marketing. The business exits the market when no prospect for a short-run profit remains.
� Divest Strategy —A defensive strategy for exiting a market by selling or closing down the business or eliminating the product. Exiting a product-market is simply a way to cut losses quickly and reallocate marketing resources to more productive endeavors.
As shown in Figure 11-13 , attractive product-markets usually warrant an offensive strategic market plan. The various kinds of offensive strategic market plans all take advantage in different ways of favorable market conditions and a business’s ability to profit in that market. The plan may map out a strategy for growing the market or growing the business’s share, or it may present ways to improve the competitive position. An offensive strategic market plan could also guide entry into another existing market or the development of an entirely new product-market.
On the basis of a portfolio analysis and performance objectives, a business selects either an offensive or defensive strategic market plan. Offensive strategic market plans are geared to deliver above-average performance in the areas of sales growth, share posi-tion, and long-run profit performance. Defensive strategic market plans, in contrast, are intended to protect important share positions and produce short-run profit performance, while also contributing to long-run profit. Strategic market planning for a business with multiple product-markets often requires a careful balance of offensive and defensive stra-tegic market plans. By doing this, the business can meet short-run profit objectives and investor expectations, invest to protect attractive strategic positions, and simultaneously develop share positions in existing or new markets.
Offensive Portfolio Strategy
Because offensive strategic market plans are more growth oriented than defensive plans, they are more likely to be used in attractive markets. 10 Consider a consumer electronics manufacturer whose sales in the base year of its strategic market plan were $19.38 bil-lion. The business is the market’s leader, and its base-year market share was 10.2 percent of a market that was growing at 5 percent to 6 percent annually. Although industry mar-gins were declining, this business maintained above-average margins and produced $3.88 billion in gross profit in the base year. With an efficient marketing strategy, the business produced a net marketing contribution of $2.23 billion in the base year.
Actual Base-Year Performance Sales Revenue = Market Demand * Market Share
= $190 billion * 10.2% = $19.38 billion
Gross Profit = Sales Revenue * Percent Margin = $19.38 billion * 20%
= $3.88 billion

Chapter 11 Portfolio Analysis and Strategic Market Planning 393
Net Marketing Contribution = Gross Profit - Marketing & Sales Expenses = $3.88 billion - $1.65 billion = $2.23 billion
The results were a marketing ROS of 11.5 percent and a marketing ROI of 135 percent. Figure 11-14 shows the actual performance of this consumer electronics company, the
estimated results of the company’s offensive strategy, the estimated results of a defensive strategy, and the actual outcome of the 3-year offensive plan to grow market share. The offensive strategy to continue growing share in an expanding market, from 10.2 to 15 per-cent, presented the greater strategic challenge. This strategic market plan would require the company to increase its marketing and sales resources from $1.65 billion in the base year to $3.5 billion in year 3 of the offensive plan. On the basis of market growth and mar-ket share assumptions, sales were projected to grow from $19.4 billion to $39 billion.
The business expected that its margins would decrease as it incrementally lowered prices to attract more customers in an effort to grow market share. The year-3 margin was projected to be 17.5 percent, resulting in a gross profit of $6.8 billion. The offensive plan to grow share to 15 percent would produce an increase in net marketing contribu-tion of $1.1 billion. However, decreasing margins and increasing marketing and sales expenses would lead to declines in the year-3 marketing ROS (8.5%) and marketing ROI (94%).
Year 3: Offensive Strategy to Grow Share Sales Revenue = Market Demand * Market Share
= $260 billion * 15% = $39 billion
Gross Profit = Sales Revenue * Percent Margin = $39 billion * 17.5% = $6.83 billion
FIGURE 11-14 OFFENSIVE VERSUS DEFENSIVE PORTFOLIO STRATEGIES
3-Year Strategic Market Plan Consumer Electronics Business
Actual Base Year
Offensive Plan Grow Share
Defensive Plan Hold Share
Offensive Plan Year-3 Actual
Market Demand ($ millions) $190,000 $260,000 $260,000 $280,000
Market Share 10.2% 15.0% 10.0% 14.5%
Sales Revenues ($ millions) $19,380 $39,000 $26,000 $40,600
Percent Margin 20.0% 17.5% 19.0% 17.5%
Gross Profit ($ millions) $3,876 $6,825 $4,940 $7,105
Marketing & Sales Expenses (%) 8.5% 9.0% 8.0% 8.8%
Marketing & Sales Expenses ($ millions) $1,647 $3,510 $2,080 $3,573
Net Marketing Contribution ($ millions) $2,229 $3,315 $2,860 $3,532
Marketing ROS 11.5% 8.5% 11.0% 8.7%
Marketing ROI 135% 94% 138% 99%
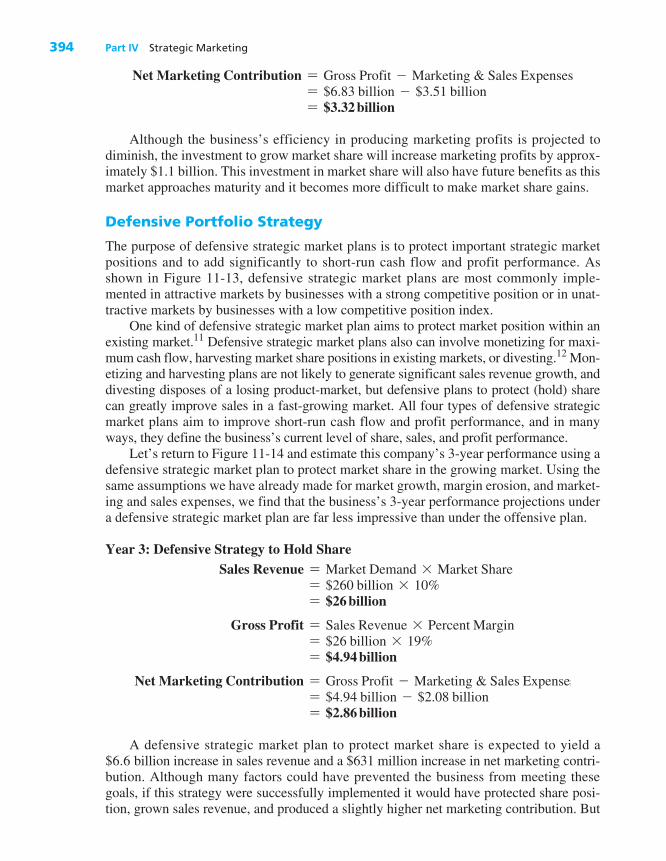
394 Part IV Strategic Marketing
Net Marketing Contribution = Gross Profit - Marketing & Sales Expenses = $6.83 billion - $3.51 billion = $3.32 billion
Although the business’s efficiency in producing marketing profits is projected to diminish, the investment to grow market share will increase marketing profits by approx-imately $1.1 billion. This investment in market share will also have future benefits as this market approaches maturity and it becomes more difficult to make market share gains.
Defensive Portfolio Strategy
The purpose of defensive strategic market plans is to protect important strategic market positions and to add significantly to short-run cash flow and profit performance. As shown in Figure 11-13 , defensive strategic market plans are most commonly imple-mented in attractive markets by businesses with a strong competitive position or in unat-tractive markets by businesses with a low competitive position index.
One kind of defensive strategic market plan aims to protect market position within an existing market. 11 Defensive strategic market plans also can involve monetizing for maxi-mum cash flow, harvesting market share positions in existing markets, or divesting. 12 Mon-etizing and harvesting plans are not likely to generate significant sales revenue growth, and divesting disposes of a losing product-market, but defensive plans to protect (hold) share can greatly improve sales in a fast-growing market. All four types of defensive strategic market plans aim to improve short-run cash flow and profit performance, and in many ways, they define the business’s current level of share, sales, and profit performance.
Let’s return to Figure 11-14 and estimate this company’s 3-year performance using a defensive strategic market plan to protect market share in the growing market. Using the same assumptions we have already made for market growth, margin erosion, and market-ing and sales expenses, we find that the business’s 3-year performance projections under a defensive strategic market plan are far less impressive than under the offensive plan.
Year 3: Defensive Strategy to Hold Share Sales Revenue = Market Demand * Market Share
= $260 billion * 10% = $26 billion
Gross Profit = Sales Revenue * Percent Margin = $26 billion * 19% = $4.94 billion
Net Marketing Contribution = Gross Profit - Marketing & Sales Expenses = $4.94 billion - $2.08 billion = $2.86 billion
A defensive strategic market plan to protect market share is expected to yield a $6.6 billion increase in sales revenue and a $631 million increase in net marketing contri-bution. Although many factors could have prevented the business from meeting these goals, if this strategy were successfully implemented it would have protected share posi-tion, grown sales revenue, and produced a slightly higher net marketing contribution. But

Chapter 11 Portfolio Analysis and Strategic Market Planning 395
the projections for share, sales, gross profit, and net marketing contribution under a defen-sive strategy are well below these same projections under the offensive strategic market plan. The business naturally chose to pursue the offensive plan as the better option for profitable growth. The business’s actual performance in year 3 was better than the pro-jected performance levels because of higher than expected growth in market demand. The net marketing contribution exceeded the year-3 projection by $200 million. As the market enters the late-growth stage of its product life cycle, the business may need to reconsider a defensive strategy to protect its market leadership position and remain profitable.
Figure 11-15 outlines the kinds of offensive and defensive strategic market plans we have been discussing. As we have seen, a portfolio analysis is a valuable aid in selecting the plan best suited for a particular product-market.
PORTFOLIO DIVERSIFICATION
Diversification across product-markets adds two important advantages to the overall per-formance of a business. First, it reduces dependence on a single product-market. Second, by diversifying, a business increases the likelihood that its overall performance will be consistent because adverse conditions in one product-market can be offset by favorable conditions in another.
For example, Figure 11-16 illustrates the overall sales of a business that is diversified across different product-markets. In product-market A, the business’s core market, sales are growing at an average rate of 1.5 percent annually, but this growth varies from year to year due to economic conditions and competitive forces. Because the business is also positioned in two other product-markets, it is able to take advantage of offsetting product life cycles and competitive forces. Product-market B is growing at 4 percent annually, and product-market C is growing at almost 15 percent. Although sales in each of these two markets are much less than in the business’s core market, each contributes to overall sales growth and performance stability.
The unexplained sales variance over the period shown for product-markets A, B, and C is 42 percent, 17 percent, and 57 percent, respectively. When the sales performances of
Invest to GrowImprove PositionEnter New Market
Hold/Protect Share PositionOptimize/Monetize PositionHarvest/Divest Share Position
BUSINESS PERFORMANCE• Share Performance• Sales Growth• Profit Performance
OffensiveStrategic Market Plans
DefensiveStrategic Market Plans
FIGURE 11-15 OFFENSIVE AND DEFENSIVE STRATEGIC MARKET PLANS

396 Part IV Strategic Marketing
all three product-markets are combined, the offsetting effects created by different com-petitive conditions and product life cycles produce more consistent growth, with only a 6 percent unexplained variance in sales.
Two Levels of Diversification
Product diversification is one of two levels of diversification. Obviously, the less depend-ent a business is on a single product, the less vulnerable it is to a major change in per-formance. Coca-Cola, for instance, has a broad line of beverage products that serves virtually all world markets. For Procter & Gamble, product diversification goes further, because it has developed product positions in widely diversified consumer household product-markets.
700
600
500
400
300
Sale
s R
even
ues
($
mill
ion
s)
200
100
01 2 3 4
*Sales variance is measured as the unexplained variance relative to the market trend.
5 6 7 8 9 10 11 12 13 14 15Years
Product-Market C
Product-Market B
Product-Market A
Overall SalesPerformance
Served Markets Sales Variance*
Product-Market A Product-Market B Product-Market C
42% 17% 57%
Overall Performance 6%
FIGURE 11-16 PORTFOLIO DIVERSIFICATION AND VARIANCE IN SALES
Chapter 11 Portfolio Analysis and Strategic Market Planning 397
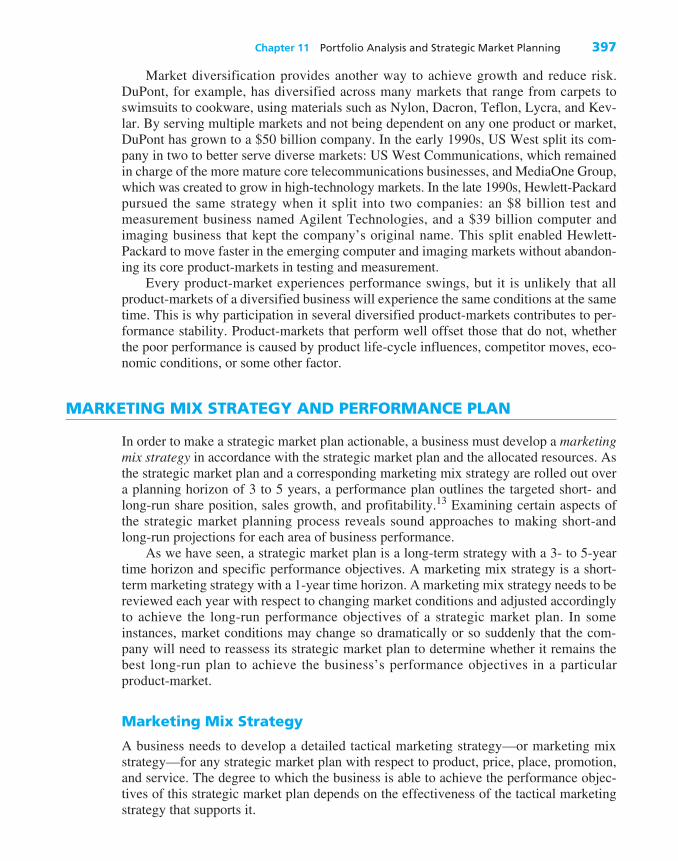
Market diversification provides another way to achieve growth and reduce risk. DuPont, for example, has diversified across many markets that range from carpets to swimsuits to cookware, using materials such as Nylon, Dacron, Teflon, Lycra, and Kev-lar. By serving multiple markets and not being dependent on any one product or market, DuPont has grown to a $50 billion company. In the early 1990s, US West split its com-pany in two to better serve diverse markets: US West Communications, which remained in charge of the more mature core telecommunications businesses, and MediaOne Group, which was created to grow in high-technology markets. In the late 1990s, Hewlett-Packard pursued the same strategy when it split into two companies: an $8 billion test and measurement business named Agilent Technologies, and a $39 billion computer and imaging business that kept the company’s original name. This split enabled Hewlett-Packard to move faster in the emerging computer and imaging markets without abandon-ing its core product-markets in testing and measurement.
Every product-market experiences performance swings, but it is unlikely that all product-markets of a diversified business will experience the same conditions at the same time. This is why participation in several diversified product-markets contributes to per-formance stability. Product-markets that perform well offset those that do not, whether the poor performance is caused by product life-cycle influences, competitor moves, eco-nomic conditions, or some other factor.
MARKETING MIX STRATEGY AND PERFORMANCE PLAN
In order to make a strategic market plan actionable, a business must develop a marketing mix strategy in accordance with the strategic market plan and the allocated resources. As the strategic market plan and a corresponding marketing mix strategy are rolled out over a planning horizon of 3 to 5 years, a performance plan outlines the targeted short- and long-run share position, sales growth, and profitability. 13 Examining certain aspects of the strategic market planning process reveals sound approaches to making short-and long-run projections for each area of business performance.
As we have seen, a strategic market plan is a long-term strategy with a 3- to 5-year time horizon and specific performance objectives. A marketing mix strategy is a short-term marketing strategy with a 1-year time horizon. A marketing mix strategy needs to be reviewed each year with respect to changing market conditions and adjusted accordingly to achieve the long-run performance objectives of a strategic market plan. In some instances, market conditions may change so dramatically or so suddenly that the com-pany will need to reassess its strategic market plan to determine whether it remains the best long-run plan to achieve the business’s performance objectives in a particular product-market.
Marketing Mix Strategy
A business needs to develop a detailed tactical marketing strategy—or marketing mix strategy—for any strategic market plan with respect to product, price, place, promotion, and service. The degree to which the business is able to achieve the performance objec-tives of this strategic market plan depends on the effectiveness of the tactical marketing strategy that supports it.

398 Part IV Strategic Marketing
For example, Intel used one tactical marketing strategy to support its strategic market plan to enter the low-end personal computer market, and a different tactical marketing strategy to support a strategic market plan to defend its high-share position in microproc-essors. Each plan required different product positioning, pricing approaches, promotions, and sales outlets to achieve a position that would be attractive to target customers relative to competitors’ product-price positions.
The strategic market plan sets the strategic direction and provides broad guidelines for resource allocation. However, the marketing mix strategy is the workhorse that has to succeed in order for the strategic market plan to achieve both its short- and long-run per-formance objectives. The right strategic market plan with the wrong marketing mix strat-egy normally will not produce the desired levels of performance.
Performance Plan
We saw earlier that a business chooses either an offensive or a defensive strategic market plan on the basis of very different performance objectives and conditions. Offensive stra-tegic market plans are geared to deliver above-average performance in the areas of sales growth, improved share position, and improved long-run profit. Defensive strategic mar-ket plans are intended to produce short-run profit performance, protect important share positions, and contribute to long-run profit performance and strategic position.
Offensive strategic market plans require investment in order to produce sales growth and improve share position, which limits short-run profit performance. Defensive strate-gic market plans promote short-run profit performance but are not particularly effective at growing sales revenue or improving the long-run share position. In the long run, a growth-oriented market strategy will shift from an offensive strategic market plan to a defensive strategic market plan.
Consider Zi-Tech Acoustics, a $250 million business that engineers, manufactures, and markets a variety of acoustic products. Figure 11-17 specifies the market share, sales revenues, and net marketing contribution for each of Zi-Tech’s four product lines. A portfolio analysis based on market attractiveness and competitive position produced the product portfolio illustrated in Figure 11-18 . Here is a summary of the strategic market plans for each of the company’s product lines:
� Product Line A—Invest to Protect Market Share: Product line A is in a mature mar-ket from which Zi-Tech derives 32 percent of its sales and 41 percent of the busi-ness’s overall net marketing contribution. The intent of the strategic market plan is to protect share and profits. The company’s priority is to hold margins as it invests in marketing and sales at the same rate as the rate of increase for sales. Although growth is nominal (3%), this strategy should produce a modest increase in sales and market-ing profits.
� Product Line B—Optimize Position: Product line B is in a mature market with no opportunity for growth. Management believes that now is the time to optimize market share to achieve greater profits. The product line is 40 percent of overall sales and 34 percent of overall marketing profits. The strategic intent is to increase prices and decrease marketing and sales expenses as a percentage of sales, which will probably erode market share. The ultimate goal is to find a more profitable combination of mar-gin and market share that will yield greater marketing profits.
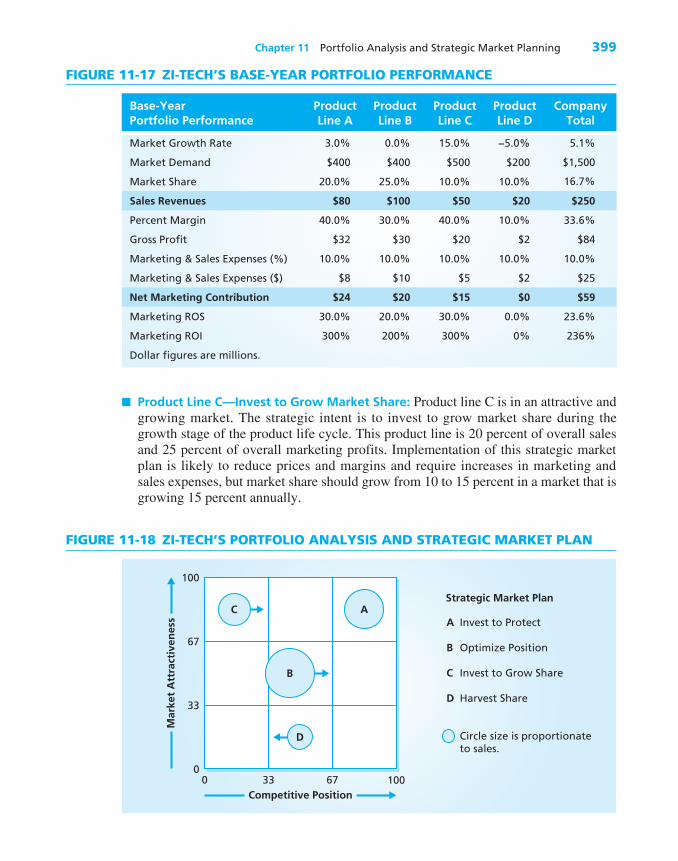
Chapter 11 Portfolio Analysis and Strategic Market Planning 399
� Product Line C—Invest to Grow Market Share: Product line C is in an attractive and growing market. The strategic intent is to invest to grow market share during the growth stage of the product life cycle. This product line is 20 percent of overall sales and 25 percent of overall marketing profits. Implementation of this strategic market plan is likely to reduce prices and margins and require increases in marketing and sales expenses, but market share should grow from 10 to 15 percent in a market that is growing 15 percent annually.
FIGURE 11-17 ZI-TECH’S BASE-YEAR PORTFOLIO PERFORMANCE
Base-Year Portfolio Performance
Product Line A
Product Line B
Product Line C
Product Line D
Company Total
Market Growth Rate 3.0% 0.0% 15.0% −5.0% 5.1%
Market Demand $400 $400 $500 $200 $1,500
Market Share 20.0% 25.0% 10.0% 10.0% 16.7%
Sales Revenues $80 $100 $50 $20 $250
Percent Margin 40.0% 30.0% 40.0% 10.0% 33.6%
Gross Profit $32 $30 $20 $2 $84
Marketing & Sales Expenses (%) 10.0% 10.0% 10.0% 10.0% 10.0%
Marketing & Sales Expenses ($) $8 $10 $5 $2 $25
Net Marketing Contribution $24 $20 $15 $0 $59
Marketing ROS 30.0% 20.0% 30.0% 0.0% 23.6%
Marketing ROI 300% 200% 300% 0% 236%
Dollar figures are millions.
Mar
ket
Att
ract
iven
ess
100
0
33
67
Competitive Position
C A
B
D
0 33 67 100
Invest to Protect
Optimize Position
Invest to Grow Share
Harvest Share
Circle size is proportionateto sales.
A
B
C
D
Strategic Market Plan
FIGURE 11-18 ZI-TECH’S PORTFOLIO ANALYSIS AND STRATEGIC MARKET PLAN
400 Part IV Strategic Marketing
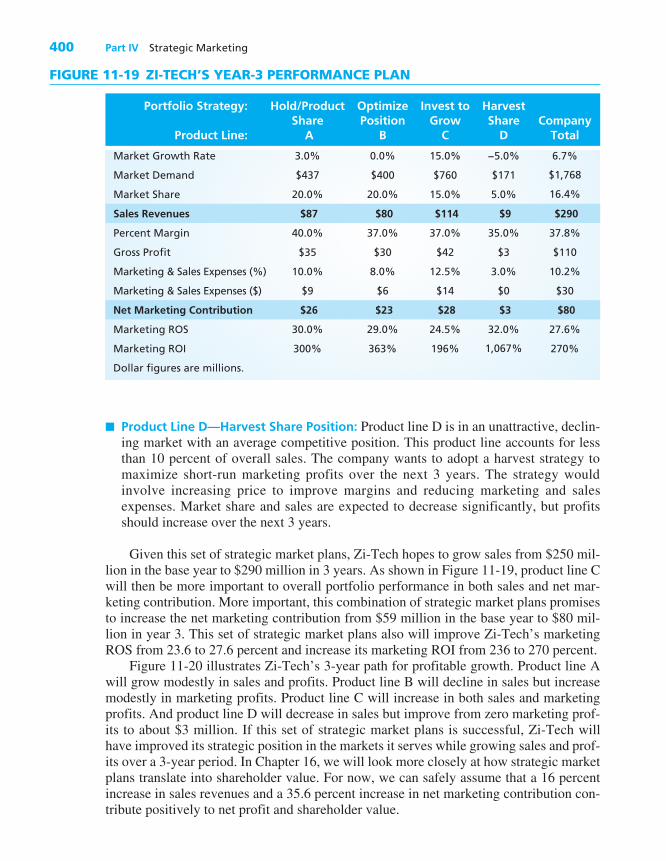
� Product Line D—Harvest Share Position: Product line D is in an unattractive, declin-ing market with an average competitive position. This product line accounts for less than 10 percent of overall sales. The company wants to adopt a harvest strategy to maximize short-run marketing profits over the next 3 years. The strategy would involve increasing price to improve margins and reducing marketing and sales expenses. Market share and sales are expected to decrease significantly, but profits should increase over the next 3 years.
Given this set of strategic market plans, Zi-Tech hopes to grow sales from $250 mil-lion in the base year to $290 million in 3 years. As shown in Figure 11-19 , product line C will then be more important to overall portfolio performance in both sales and net mar-keting contribution. More important, this combination of strategic market plans promises to increase the net marketing contribution from $59 million in the base year to $80 mil-lion in year 3. This set of strategic market plans also will improve Zi-Tech’s marketing ROS from 23.6 to 27.6 percent and increase its marketing ROI from 236 to 270 percent.
Figure 11-20 illustrates Zi-Tech’s 3-year path for profitable growth. Product line A will grow modestly in sales and profits. Product line B will decline in sales but increase modestly in marketing profits. Product line C will increase in both sales and marketing profits. And product line D will decrease in sales but improve from zero marketing prof-its to about $3 million. If this set of strategic market plans is successful, Zi-Tech will have improved its strategic position in the markets it serves while growing sales and prof-its over a 3-year period. In Chapter 16 , we will look more closely at how strategic market plans translate into shareholder value. For now, we can safely assume that a 16 percent increase in sales revenues and a 35.6 percent increase in net marketing contribution con-tribute positively to net profit and shareholder value.
FIGURE 11-19 ZI-TECH’S YEAR-3 PERFORMANCE PLAN
Portfolio Strategy:
Product Line:
Hold/Product Share
A
Optimize Position
B
Invest to Grow
C
Harvest Share
D
Company
Total
Market Growth Rate 3.0% 0.0% 15.0% −5.0% 6.7%
Market Demand $437 $400 $760 $171 $1,768
Market Share 20.0% 20.0% 15.0% 5.0% 16.4%
Sales Revenues $87 $80 $114 $9 $290
Percent Margin 40.0% 37.0% 37.0% 35.0% 37.8%
Gross Profit $35 $30 $42 $3 $110
Marketing & Sales Expenses (%) 10.0% 8.0% 12.5% 3.0% 10.2%
Marketing & Sales Expenses ($) $9 $6 $14 $0 $30
Net Marketing Contribution $26 $23 $28 $3 $80
Marketing ROS 30.0% 29.0% 24.5% 32.0% 27.6%
Marketing ROI 300% 363% 196% 1,067% 270%
Dollar figures are millions.

Chapter 11 Portfolio Analysis and Strategic Market Planning 401
� Summary
Strategic market planning is a process. It involves assessing business performance with respect to market attractiveness and competitive position. A company makes this assess-ment for each of its product-markets and any new ones that it may be considering. The product life cycle serves as the basis for an important portfolio analysis in which a busi-ness can display its product line over the product life cycle with respect to sales, sales growth, and profitability. A balanced product life-cycle portfolio will include a mix of early, growth, and mature markets.
Several measures of competitive position contribute to a portfolio analysis. One measure that corresponds to sales and profit performance is relative market share . Another measure of competitive position, one that also considers sales and profit, is the share development index .
The GE/McKinsey portfolio model includes an index of several market attractive-ness factors and an index of several competitive position factors. Separate ratings of importance and performance shape the overall performance of these two dimensions. Market attractiveness is indexed with respect to market forces (market size, growth rate, and buyer power), competitive environment (price rivalry, ease of competitor entry, and number of competitors), and market access (customer familiarity, channel access, and sales requirements). Competitive position is indexed with respect to cost advantage (unit cost, transaction costs, and marketing expenses), differentiation advantage (product qual-ity, service quality, and brand image), and marketing advantage (market share, brand awareness, and distribution). The portfolio analysis identifies one or more possible stra-tegic market plans for each product-market the business serves or may enter in the future, on the basis of the product-market’s position in the portfolio.
$0Year 3
Product Line A
Product Line B
Product Line C
Product Line D
$50
$100
$150
$200
$250
$300
Base Year
Sale
s R
even
ue
(mill
ion
s)
Product Line A
Product Line B
Product Line C
Product Line D
$0Year 3
Product Line A
Product Line B
Product Line C
Product Line D
$10
$20
$30
$50
$40
$70
$60
$80
Base YearN
et M
arke
tin
g C
on
trib
uti
on
(m
illio
ns)
Product Line A
Product Line B
Product Line C
FIGURE 11-20 PERFORMANCE PLAN FOR ZI-TECH’S FOUR PRODUCT-MARKETS

402 Part IV Strategic Marketing
A strategic market plan is a long-run, 3- to 5-year strategic market objective that involves share position but has corresponding implications for short- and long-run sales revenue growth and profit performance. Strategic market plans can be offensive or defen-sive. Offensive strategic market plans are market penetration strategies to grow share position, sales, and long-run profitability. Offensive strategies include investing to grow, investing to improve position, entering another market, and developing a new market. Defensive strategies include protecting or optimizing position for maximum profits, monetizing for maximum cash flow, harvesting, and divesting. A combination of strate-gic market plans (one for each product-market) provides an overall view of how the busi-ness will grow with respect to share, sales, and profits.
Portfolio diversification in both products and markets is an important aspect of stra-tegic market planning. A portfolio that is too concentrated in one line of products or in one market is subject to more variance in sales and profits than if it were properly diversi-fied. Diversification into unrelated product-markets protects a business’s overall per-formance against downward swings if one product-market should encounter unfavorable conditions. It adds stability to a business’s overall performance.
Although the strategic market plan for a given product-market sets short-run and long-run goals with respect to market share, sales revenues, and profits, it does not spec-ify how this performance will be achieved. Each strategic market plan, then, has a cor-responding tactical marketing plan. The tactical marketing plan is a marketing mix strategy (product, price, place, promotion, and service) that specifies the tactical details of how the business will achieve the objectives of a given strategic market plan. The plan includes the marketing and sales budget required for implementing the marketing mix strategy. Using these marketing tactics, the marketing and sales budget, and a 3- to 5-year forecast of market share, sales revenues, and net marketing contribution, the business develops a performance plan.
� Market-Based Strategic Thinking
1 Why would Yum Brands divest such well-known store brands like A&W and Long John Silver’s?
2 Why did Toyota enter the U.S. car market at the low-price point of the market instead of the mid-price or high-price point?
3 Why did Toyota add the Lexus and Scion product lines to its product portfolio as separate umbrella brands instead of retaining an all-Toyota product line portfolio?
4 How would Apple use the product life cycle that was used in this chapter to evaluate the current and future sales and profits of a business’s portfolio of products?
5 What could be done with regard to Portfolio A in Figure 11-2 to make it a more bal-anced portfolio over the next 3 to 5 years? How would this change affect short- and long-run sales and profits?
6 Why is it important to use two independent dimensions of performance to build a product portfolio for Kellogg’s? Why would these performance dimensions be dif-ferent for Netflix?
7 For Yum Brands, what is meant by a “strategic market plan”? 8 For General Motors, what is the difference between market attractiveness and com-
petitive position with respect to building a product portfolio?

Chapter 11 Portfolio Analysis and Strategic Market Planning 403
9 How does a portfolio model based on product life cycle and the market share devel-opment index help a growth business like Groupon.com?
10 Why would a business like Coca-Cola opt to use the GE/McKinsey portfolio model over other portfolio models?
11 How would you assess the attractiveness of a new consumer product-market for Procter & Gamble? List the specific factors you would include as you build an index of market attractiveness for a Procter & Gamble consumer market.
12 How would you assess the competitive position of Procter & Gamble in a new con-sumer product-market? List the specific factors you would include as you build an index of competitive position for a Procter & Gamble consumer market.
13 Using the following information, create a portfolio analysis and specify a strategic market plan for a business that serves the three product-markets A, B, and C.
Product-Market
Share (%)
Sales ($ millions)
Market Attractiveness
Competitive Position
A 10 $20 20 40 B 33 $50 75 80 C 5 $10 85 15
14 Using the information presented in item 13 and the additional information that fol-lows, create a 3-year performance plan with respect to market share and sales reve-nues for each product-market, given the strategic market plan specified. Also create a projection of overall sales for each year of the 3-year planning horizon.
Product Market
Strategic Market Plan
Share Objective (%)
Market Demand ($ millions)
Market Growth(%)
A Optimize Position 5 $200 5 B Protect Share 33 $150 7 C Grow Share 10 $200 20
15 Under what conditions would Apple use an offensive strategic market plan? 16 Under what conditions would Apple opt to use a defensive strategic market plan? 17 What role do offensive and defensive strategic market plans play in the short- and
long-run performance of Apple? 18 How does Apple’s level of product-market diversification affect sales growth and
performance consistency? 19 Why would the overall variation in sales revenues over a 10-year period be different
between General Electric and Dell? 20 How would the sales and profit performance over a 3-year period differ between a
business with only defensive strategic market plans and a business with only offen-sive strategic market plans? Why is it important for Dell to have a balance of offen-sive and defensive plans?
21 How would an offensive strategic market plan and marketing and sales budget for GE Appliances to grow market share differ from those of a strategic market plan to optimize position and reduce share?

404 Part IV Strategic Marketing
The three interactive marketing performance tools and application exercises outlined here will improve your ability to use portfolio anal-ysis in selecting an effective strategic market plan. To access the tools, go to rogerjbest.com. For the questions in the exercises, you may enter the data presented to obtain the answers. You may also enter other data to see the results, and you may save your work. The figure numbers in parentheses are related examples in Chapter 11 , but the instructions pertain to the online exercises.
11.1 Product Life Cycle Portfolio ( Figure 11-2 ) � Using the data provided, adjust the pro-
posed product life-cycle portfolio to the recommended percentage of sales and product life-cycle position. Add product F with 25 percent and product G with 10 percent market penetration.
How will the revised portfolio perform in the future with respect to sales and profit?
11.2 Market Growth Rate–Share Develop-ment Portfolio ( Figure 11-7 )
� Using the data provided (strategy pre-sented in Figure 11-7), adjust the port-folio position based on market growth rate and efforts to improve share per-formance metrics. What is the potential impact for future sales and profits?
11.3 GE/McKinsey Portfolio ( Figure 11-8 ) � Using the data provided, alter the mar-
ket attractiveness and competitive position ratings to create a revised portfolio for product A. How would you expect the revised portfolio to per-form with respect to sales and profits?
Marketing Performance Tools and Application Exercises
Notes
1. Yum Brands, Inc., SEC 10-K 2010 Annual Report (February 15, 2011): http://www.yum.com/investors/investor_materials.asp , retrieved March 19, 2011.
2. M. Treacy and F. Wiersama, The Discipline of Market Leaders (Reading, MA: Addison-Wesley, 1995).
3. D.A. Garvin, “Leveraging Processes for Strategic Advantage,” Harvard Business Review (September–October 1995): 77.
4. R.A. Kerin, V. Mahajan, and P.R. Varadarajan, Strate-gic Market Planning (Boston: Allyn and Bacon, 1990).
5. R. Buzzell and B. Gale, The PIMS Principles: Linking Strategy to Performance (New York: Free Press, 1987).
6. K. Rangan, M. Menezes, and E.P. Maier, “Channel Selection for New Industrial Products: A Framework, Method and Application,” Journal of Marketing (July 1992): 69–82.
7. L.W. Phillips, D.R. Chang, and R.D. Bussell, “Product Quality, Cost Position, and Business Performance: A Test of Some Key Hypotheses,” Journal of Marketing 47 (January 1983): 26–43.
8. M.E. Porter, Competitive Advantage (New York: Free Press, 1986).
9. D. Aaker, “Formal Planning System,” in Strategic Mar-ket Management (New York: Wiley, 1995): 341–53.
10. T. Powell, “Strategic Planning as Competitive Advan-tage,” Strategic Management Journal 13 (1992): 551–8; S. Armstrong, “The Value of Formal Planning for Strategic Decisions: Reply,” Strategic Management Journal 7 (1986): 183–5; and D. Sinha, “The Contribu-tion of Formal Planning to Decisions,” Strategic Man-agement Journal (October 1990): 479–92.
11. W.K. Hall, “Survival Strategies in a Hostile Environ-ment,” Harvard Business Review (September–October 1980): 75–85.
12. K.R. Harrigan, Strategies for Declining Businesses (Lexington, MA: Lexington Books, 1980); K.R. Har-rigan and M.E. Porter, “End-Game Strategies for Declining Industries,” Harvard Business Review (July–August 1983): 111–20; and K.R. Harrigan, Man-aging Maturing Businesses (New York: Lexington Books, 1988).
13. F.V. McCrory and P.G. Gerstberger, “The New Math of Performance Measurements,” Journal of Business Strategy (March–April 1992): 33–8.