Embed Size (px)
Citation preview
University of Nebraska - LincolnDigitalCommons@University of Nebraska - LincolnEducational Administration: Theses, Dissertations,and Student Research Educational Administration, Department of
3-2015
MBA Academic Teams Training and MeasuringTeam Skills Development and Team Satisfaction inthe First Semester of a Full-time MBA ProgramCrystal ClaytonUniversity of Nebraska-Lincoln, [email protected]
Follow this and additional works at: http://digitalcommons.unl.edu/cehsedaddiss
Part of the Higher Education Commons, and the Higher Education Administration Commons
This Article is brought to you for free and open access by the Educational Administration, Department of at DigitalCommons@University of Nebraska- Lincoln. It has been accepted for inclusion in Educational Administration: Theses, Dissertations, and Student Research by an authorized administratorof DigitalCommons@University of Nebraska - Lincoln.
Clayton, Crystal, "MBA Academic Teams Training and Measuring Team Skills Development and Team Satisfaction in the FirstSemester of a Full-time MBA Program" (2015). Educational Administration: Theses, Dissertations, and Student Research. 218.http://digitalcommons.unl.edu/cehsedaddiss/218

MBA Academic Teams Training and Measuring Team Skills Development
and Team Satisfaction in the First Semester of a Full-time MBA Program
by
Crystal L. Clayton
A DISSERTATION
Presented to the Faculty of
The Graduate College at the University of Nebraska
In Partial Fulfillment of Requirements
For the Degree of Doctor of Education
Major: Educational Studies
(Educational Leadership and Higher Education)
Under the Supervision of Professor Miles Bryant
Lincoln, Nebraska
March, 2015
MBA Academic Teams Training and Measuring Team Skills Development
and Team Satisfaction in the First Semester of a Full-time MBA Program
Crystal L. Clayton, Ed.D.
University of Nebraska, 2015
Advisor: Miles Bryant
This study explored the benefits of providing MBA academic teams with formal
training. The purpose of this mixed methods, single case study design, was to investigate
whether MBA teams training contributes to team skills development and student team
satisfaction. Participants in this study were first year, full-time MBA students at a large
Midwestern Research I institution. The Comprehensive Assessment of Team Member
Effectiveness (CATME) was utilized to regularly administer peer and self-assessment of
teamwork skills and track student team satisfaction. The research was broken into three
main components. The first component included a quantitative element utilizing regular
assessment readings of participants on the CATME, on the five team dimensions of
Contributions to the Team, Interactions with Team, Keeping Team on Track, Expecting
Quality, and Having KSAs. The second piece of the study incorporated qualitative team
advising sessions, in a focus group atmosphere. The third and final dimension of the
study was leading individual interviews with nine of the 35 study participants. These nine
participants’ CATME scores were thoroughly analyzed using single case research
methods to measure team skills development in their first semester of the MBA
experience. Qualitative findings from team advising sessions and individual interviews
were documented, categorized, and coded for research patterns and themes. Research

revealed that there is evidence that teams training is perceived to contribute to team skills
development in full-time MBA students. Participants reported that teams training is not
perceived to contribute to team satisfaction. Recommendations included exploring the
contribution of prior work experience to team skills development and conducting focused
research on students’ perceptions of international versus domestic students on MBA
teams.
Keywords: MBA teams, academic teams, graduate business students, student team
satisfaction, teams training, team learning, CATME
ACKNOWLEDGMENTS
I would like to express appreciation to my academic advisor, Dr. Miles Bryant, and
committee members for their guidance and assistance throughout the research and
technical aspects of the dissertation writing process. Additionally, many thanks goes to
one of my best friends of 20 years and also my dissertation “sponsor,” soon to be
Dr. Staci J. Garvin, for her continuous peer support and friendship. Finally, I would like
to thank my family, especially my husband and soon to be Dr. Nicholas J. Clayton, many
special friends, and motivating colleagues that have encouraged me to persist in my
academic and educational pursuits to reach a lifetime goal of obtaining a doctoral degree.

i
Table of Contents
Chapter 1—Introduction ............................................................................................ 1
Introduction to MBA Culture & Teams ............................................................... 1
MBA Cultural Context ................................................................................... 1
Overview of MBA Teams .............................................................................. 2
What Makes Teams Successful? .................................................................... 3
Problem & Purpose Statement ............................................................................. 3
Statement of Research Questions ......................................................................... 4
Central Research Questions ........................................................................... 4
Research Sub-questions ................................................................................. 4
Significance of the Study ..................................................................................... 4
Significance of the Study in the Context of MBA Teams ............................. 4
Significance of the Study in the Context of MBA Culture ............................ 5
Assessment in Higher Education and Lack of MBA Culture Studies ............................................................................................................ 5
Limitations of the Study....................................................................................... 7
Delimitations of the Study ................................................................................... 8
Definitions of Terms ............................................................................................ 9
Organization of the Study .................................................................................... 11
Overview & Participants ................................................................................ 11
Data Collection .............................................................................................. 11
Chapter 2—Literature Review ................................................................................... 14
Introduction .......................................................................................................... 14
The Case for MBA Teams Training .................................................................... 14
MBA Team Skills & Teamwork Research .......................................................... 15

ii
Common Teams Training Approaches ................................................................ 21
Historical Context of the MBA Degree ............................................................... 23
The Association to Advance Collegiate Schools of Business (AACSB) & Teamwork Connection ..................................................................................... 25
MBA Curriculum ................................................................................................. 26
Current Directions in MBA Program Curriculum & Structure ........................... 28
Trends in Current MBA Graduates ...................................................................... 29
Current Perceptions of MBA Teams in the Media & The Research Connection ........................................................................................................... 30
Chapter 3—Methodology .......................................................................................... 32
Introduction .......................................................................................................... 32
Statement of Research Questions ......................................................................... 32
Central Research Questions ........................................................................... 32
Research Sub-questions ................................................................................. 32
Study Design & Single Case Research ................................................................ 33
AB Single Case Design, Randomized Phase Start-Point Approach .................... 34
Dependent & Independent Variables ................................................................... 36
Setting & Sample Population ............................................................................... 37
Full-time MBA Teams Training at a Large Midwestern Research I Institution ............................................................................................................. 37
Overview of Research Study Intervention Activities .......................................... 39
Teams Training Topics & Activities .................................................................... 42
September Team Training Topics .................................................................. 42
The Marshmallow Challenge ................................................................... 42
Building a Team Charter .......................................................................... 42
October Teams Training Topic & Team Advising Sessions ......................... 43
Plane Crash Survival Scenario Communication Stimulation .................. 43

iii
Mid Semester Team Advising Session .................................................... 43
Team Advising Session protocol Questions ............................................ 44
November Teams Training Topic .................................................................. 45
The Trouble With Teamwork Article Review and Teams Discussion ................................................................................................ 45
Overview of Individual Interviews with Nine Full-time MBA Students ............ 45
Individual Teammates Interview Protocol ..................................................... 46
Description of the Comprehensive Assessment of Team Member Effectiveness (CATME) ...................................................................................... 46
CATME Reliability & Validity ........................................................................... 47
CATME Evaluations Data Collection ................................................................. 50
Visual Analysis .................................................................................................... 51
Visual Analysis Example Case ............................................................................ 53
Data Analysis ....................................................................................................... 58
IRB Approval ....................................................................................................... 58
Expectations of & Benefits to MBA Student Participants ................................... 58
Benefits .......................................................................................................... 58
Expectations ................................................................................................... 59
Conclusion ........................................................................................................... 60
Chapter 4—Results and Findings .............................................................................. 61
Introduction .......................................................................................................... 61
Team Intervention Activities Review .................................................................. 62
Comprehensive Assessment of Team Member Effectiveness (CATME) ............................................................................................................. 63
Single Case Research Findings ............................................................................ 65
Visual Analysis of Single Case Research Participants .................................. 66
iv
Focus on Phase A to Phase B Mean Ratings Results in Single Case Research Study............................................................................................... 67
Qualitative Data from Individual Interviews as Part of the Single Study Research ............................................................................................... 72
Individual Team Mates Interview Protocol ............................................. 75
Individual Interviews - Teams Training & Skills Development Perspectives from Single Case Research Students ........................................ 75
Student A2 ............................................................................................... 75
Student A5 ............................................................................................... 76
Student B1 ................................................................................................ 77
Student B2 ................................................................................................ 79
Student C2 ................................................................................................ 80
Student C4 ................................................................................................ 82
Student C5 ................................................................................................ 84
Student C6 ................................................................................................ 84
Student D6 ............................................................................................... 85
Individual Interviews Complete Qualitative Data ......................................... 88
Concluding Thoughts from Individual Interviews ......................................... 90
Team Advising Sessions Findings & Complete CATME Results ...................... 91
Team Advising Session Protocol Questions .................................................. 91
Team Advising Sessions Overviews .............................................................. 92
Team A..................................................................................................... 92
Team B ..................................................................................................... 99
Team C ..................................................................................................... 100
Team D..................................................................................................... 104
Team E ..................................................................................................... 108
Team F ..................................................................................................... 116
Team Satisfaction Results .................................................................................... 117
What is the Trend Line for Student Satisfaction with Teams? ...................... 121
A Phase to B Phase Means Difference and Team Satisfaction ...................... 121

v
Summary .............................................................................................................. 123
Chapter 5—Conclusion .............................................................................................. 126
Introduction .......................................................................................................... 126
Study Review ....................................................................................................... 126
Overview ........................................................................................................ 126
Key Findings ........................................................................................................ 127
Factors Contributing to Team Skills Development ....................................... 127
Student Perceptions .................................................................................. 127
Student Perceptions of the CATME .............................................................. 128
Conclusions .......................................................................................................... 129
Primary Conclusions ...................................................................................... 129
Primary Conclusion One .......................................................................... 129
Primary Conclusion Two ......................................................................... 135
Secondary Conclusions .................................................................................. 136
Secondary Conclusion One ...................................................................... 136
Secondary Conclusion Two ..................................................................... 138
Recommendations for Future Research & Practice ............................................. 139
Maximizing students’ Past Work Experience & Team Skills Development on Academic Teams ................................................................ 139
Perceptions of International Students & Cultural Barriers on MBA Academic Teams ............................................................................................ 140
Final Thoughts ..................................................................................................... 142
References .................................................................................................................. 143
Appendices ................................................................................................................. 150

vi
List of Tables
Table 1 Team Skills Training AB Design with One Unit, Two Within-Series Condition, 10 Time Periods, and Four Potential Start Points .......................................................................... 36
Table 2 Participants’ Ethnicity/Countries of Origin ....................................... 38
Table 3 Intervention Activities Schedule ........................................................ 38
Table 4 Fourteen Teamwork KSA’s ............................................................... 40
Table 5 Five Dimensions of Teamwork KSA’s .............................................. 41
Table 6 CATME Team Dimensions & Rating Descriptions .......................... 48
Table 7 Four Rules of Conducting Visual Analysis ....................................... 52
Table 8 Six Variables to Determine Within and Between Phase Data Patterns ...................................................................................... 52
Table 9 CATME Evaluation Hypothetical Team A Contributions to Team Ratings ..................................................................................... 53
Table 10 Applying Sally’s Hypothetical Data to Four Steps of Visual Analysis.............................................................................................. 54
Table 11 Applying Sally’s Hypothetical Data to Six Variables Used to Determine Within and Between Phase Data Patterns .................... 55
Table 12 CATME Assessment Weekly Student Response Rates Percentages ........................................................................................ 65
Table 13 Demographics of Students Participating in Single Case Research ............................................................................................. 66
Table 14 Keeping Team on Track Dimension: Six Variables to Determine Within and Between Phase Data Patterns ........................ 68
Table 15 Expecting Quality Dimension: Six Variables to Determine Within and Between Phase Data Patterns .......................................... 69
Table 16 Single Case Research A Phase to B Phase Significance Key ............ 70
Table 17 Phase A to Phase B Difference Between Means ............................... 73
Table 18 MBA Teams Single Case Research Individual Interviews Codes & Themes ................................................................................ 88
vii
Table 19 MBA Team Advising Sessions Codes and Themes .......................... 93
Table 20 Team A Complete CATME Data ...................................................... 96
Table 21 Team B Complete CATME Data ....................................................... 101
Table 22 Team C Complete CATME Data ....................................................... 105
Table 23 Team D Complete CATME Data ...................................................... 109
Table 24 Team E Complete CATME Data ....................................................... 113
Table 25 Team F Complete CATME Data ....................................................... 118
Table 26 Semester Team Satisfaction: Six Variables to Determine Within and Between Phase Data Patterns .......................................... 122
Table 27 Team Satisfaction A Phase to B Phase Mean Differences and Significance ................................................................................. 123
Table 28 Why Students Think Team Skills Improved ...................................... 129
Table 29 Student Perceptions and Completion Strategy on CATME Assessment ......................................................................................... 130
Table 30 Phase A to Phase B Difference between Means ................................ 133
Table 31 Team Satisfaction A Phase to B Phase Mean Differences and Significance ................................................................................. 136

viii
List of Figures
Figure 1 Single Subject AB Design Graph Sample ......................................... 36
Figure 2 CATME Behavior Anchored Ratings for Teams ............................... 51
Figure 3 Team A Sally’s Fall 2014 Semester Hypothetical CATME Evaluation Results ............................................................................. 54
Figure 4 Team A Joe’s Fall 2014 Semester Hypothetical CATME Evaluation Results ............................................................................. 56
Figure 5 Team A Jennifer’s Fall 2014 Semester Hypothetical CATME Evaluation Results .............................................................. 56
Figure 6 Team A Sam’s Fall 2014 Semester Hypothetical CATME Evaluation Results ............................................................................. 57
Figure 7 Team A Steven’s Fall 2014 Semester Hypothetical CATME Evaluation Results .............................................................. 57
Figure 8 Number of Single Case Research Participants Demonstrating Improvement At Moderate or Above on CATME Team Dimensions ............................................................... 71
Figure 9 Work Experience and Number of Team Skills Dimensions Improved at Moderate Level or Above on CATME Team Dimensions ........................................................................................ 72
Figure 10 Student A2 Interactions with Team, CATME Team Dimension .......................................................................................... 76
Figure 11 Student A5 Interactions with Team, CATME Team Dimension .......................................................................................... 78
Figure 12 Student B1 expecting quality, CATME Team Dimension ................ 79
Figure 13 Student B2 expecting quality, CATME Team Dimension ................ 80
Figure 14 Student C2 Keeping Team on Track, CATME Team Dimension .......................................................................................... 81
Figure 15 Student C2 Expecting Quality, CATME Team Dimension ............... 82
Figure 16 Student C4 Keeping Team on Track, CATME Team Dimension .......................................................................................... 83
Figure 17 Student C4 Expecting Quality, CATME Team Dimension ............... 83

ix
Figure 18 Student C5 Keeping Team on Track, CATME Team Dimension .......................................................................................... 85
Figure 19 Student C6 Contributions to Team, CATME Team Dimension .......................................................................................... 86
Figure 20 Student D6 Keeping Team on Track, CATME Team Dimension .......................................................................................... 87
Figure 21 Team B Semester Team Satisfaction ................................................. 124
Figure 22 Team F Semester Team Satisfaction .................................................. 124
Figure 23 Number of Single Case Research Participants Demonstrating Improvement at Moderate Level or Above on CATME Team Dimensions .......................................................... 132
Figure 24 Work Experience and Number of Team Skills Dimensions Improved at Moderate Level or Above During Fall Semester ............................................................................................. 137

x
List of Appendices
Appendix A Team Class Syllabus .......................................................................... 150
Appendix B Team Charter ..................................................................................... 155
Appendix C Plane Crash Survival Scenario ........................................................... 161
Appendix D The Trouble with Teamwork ............................................................. 164
Appendix E CATME Peer Evaluation Brochure ................................................... 171
Appendix F Informed Consent Form ..................................................................... 176
Appendix G Participation Intent Form ................................................................... 180
Appendix H Confidentiality of Team Advising Form............................................ 183
Appendix I Transcription Services Form .............................................................. 185
Appendix J Recruitment Email #1 ........................................................................ 187
Appendix K Recruitment Email #2 ........................................................................ 189
Appendix L Teams Training Schedule .................................................................. 191
Appendix M Teams Training Session Observer Reflection .................................... 193
Appendix N Teams Training Session Individual Reflection .................................. 195
Appendix O CATME Definitions and Notes ......................................................... 197
Appendix P Single Case Research Participants CATME Results ......................... 200
Appendix Q Single Case Research Contributions to Team Graphs ....................... 206
Appendix R Single Case Research Interactions with Team Graphs ...................... 212
Appendix S Single Case Research Keeping Team on Track Graphs .................... 218
Appendix T Single Case Research Expecting Quality Graphs .............................. 224
Appendix U Single Case Research Having KSAs Graphs ..................................... 230
Appendix V Teams A-F Semester Satisfaction Graphs ......................................... 236
1
Chapter 1
Introduction
Introduction to MBA Culture & Teams
MBA cultural context. In Saffo’s (2007) article, Six Rules for Effective
Forecasting, he stated in regards to emerging trends and future change, “you are always
safer betting that events will unfold slowly than concluding that a sudden shift is in the
wind” and to “be skeptical about apparent changes, and avoid making an immediate
forecast – or at least don’t take any one forecast too seriously” (pp. 127, 131). I would
add that this is especially the case in education, where change, for better or worse, can
move slowly and not as quickly as students, staff, and faculty may like. It is true,
however, that in recent years there has been much change and issues taking the forefront
as we contemplate the next steps for higher education as a whole as well as in Masters in
Business education and culture specifically. In reference to MBA culture, Phil Stott
(2009) of CNBC stated that:
One can’t get the feeling that public sentiment has shifted against the prevailing business and economic culture the longer the recession has continued. And when every bonus scandal and example of corporate greed that emerges only seems to reinforce that sense that something badly has gone wrong with our culture and our values, it’s only natural that we start looking at how and where those values were fostered. Thus, the spotlight has fallen on business schools. (p. 1)
Stott has not been the only one who has negative commentary on MBA culture. Kerry
Patterson (2006), an Organizational Behavior professor at Brigham Young University, in
BusinessWeek “termed the typical MBA classroom as an arena where students are
expected to be brutal to each other” (p. 1). Matthew Stewart, author of The Management
Myth added that, “if business schools would drop the pretense of providing practical
training and engage in disinterested, critical study of business and management practices
2
and culture, they might actually make a significant contribution to society” (2009,
pp. 293–294). MBA students can largely reap educational benefits when MBA program
directors and staff provide intentional programming to improve the MBA experience
while also creating valuable learning experiences that will prove beneficial post
graduation. One direct way to accomplish these goals is to build knowledge and teams
skills of MBA student team members by implementing comprehensive teams training
programs.
Overview of MBA teams. Many business schools, including the top ranked
MBA programs, have had a team component to their programs. MBA academic teams
have consisted of 4-6 students in each team. Students are assigned to this work group, for
core courses, for the duration of at least one quarter or semester when the teams are
reassigned and students are assigned to new teams for the new quarter or semester of the
academic year. MBA teams have the potential to create a myriad of practical learning
opportunities for students, but unfortunately in many ways have also been the root of
many issues in business schools including academic dishonesty, interpersonal problems,
and scheduling dilemmas.
According to the University of Pennsylvania, Wharton MBA program website,
The Learning Team model, [was] first developed by Wharton and [is] now emulated by other schools. The Learning Team model is based on the business world in which employees work together in teams that depend on persuasive rather than positional leadership. . . . . Learning Teams serves as a living laboratory for cultivating these skills.
In research from Chen, Donahue and Klimoski (2004), they studied keys to training
undergraduate students on how to succeed on organizational teams. Based on the research
of Sinclair (1997), the researchers found that “business representatives ranked teamwork-

3
related characteristics (e.g., communication skills, capacity for cooperation and
teamwork) much higher than did university educators.” This research suggests that there
is a distinct disconnect between employers and university administrators that are
participating in curriculum planning, and educating students on best practices of
preparing for life after college and graduate school.
What makes teams successful? Hackman & Walton (1986) outlined five
principles that were necessary to cultivate healthy teams. These principles included clear
direction and goals, good leadership, tasks suited for teamwork, available resources, and
an environment that provides support. The study conducted with MBA students focusing
on teams training will use these principles as a standard to maintain excellence in the
teams training process and all related activities will be based on these guidelines. These
principles coupled with the research of Chen et al. as well as the dimensions represented
in the CATME (Comprehensive Assessment of Team Member Effectiveness) suggests a
model for building an effective teams training program for MBA students.
Problem & Purpose Statement
Although MBA programs offer a useful opportunity in placing first-year students
on core academic teams, the opportunity is not maximized to the fullest. The majority of
MBA programs offer minimal to no teams training or advising to these student teams. As
a result teams are left to navigate the teaming process with few resources. The purpose of
this study was to determine whether there is evidence that MBA teams training
contributes to team skills development and student team satisfaction in the first semester
of a full-time MBA program.
4
Statement of Research Questions
Central research questions:
1. Is there evidence that teams training contributes to team skills development in
first year, full-time MBA students and if so, how?
2. Is there evidence that the teams training process in first year, full-time MBA
students impacts student satisfaction with teams and if so, why?
Research sub-questions:
x What is the trend line for student team skills development?
x What is the trend line for student satisfaction with teams?
x What do students report as their perceived growth regarding their team skills
development?
x What is in the mind of the student when s/he evaluates teammates on the CATME
team dimensions?
x As students use the CATME, are their evaluations evidence based?
Significance of the Study
Significance of the study in the context of MBA teams. “Although some university
curricula focus on developing some level of teamwork knowledge, teamwork
competencies, and skills are rarely developed” (Chen et al., 2004). Even though many
MBA programs reflect on their websites that they institute the MBA academic teams
model and conduct team building activities at the beginning of students’ first-year as an
MBA student, there is little to no evidence of widely spread teams training programs, that
establish actual development of KSA’s or are founded on previous research studies for
students in MBA programs.
5
Significance of the study in the context of MBA culture. In order to
understand MBA academic teams culture, it is important to first understand MBA
program culture. In taking strides to better understand MBA culture, it is also important
to establish a clear definition of organizational culture as a whole. Hofstede and
Hofstede (2005) defined organizational culture as “the collective programming of the
mind that distinguishes the members of one organization from another” and clarified
further that “an organization culture, however, is maintained not only in the minds of its
members but also in the minds of its other ‘stakeholders,’ everyone that interacts with the
organization” (pp. 282-283). As in any institution of higher education, members and
stakeholders of organizational culture business school environment include students,
staff, faculty, alumni, board of directors, and financial donors. The group to be focused
on in this study is the group that is most immediately impacted by the MBA culture and
related administrative based decisions—the students. “Socialization in [an] organization
is a matter of learning the practices: symbols, heroes, and rituals” (p. 287). In this study I
will research how teams training factors and the dynamics involved with MBA teams
culture and training can positively impact student team skills acquisition and student
satisfaction.
Assessment in higher education and lack of MBA culture studies. According
to Sandeen and Barr (2006), “Assessment in public higher education is no longer simply
an ‘add on’ or something that is peripheral to the institution’s overall education program.
It is at the center stage of colleges and universities” (p. 136). Allen and Bresciani (2003)
stated that “the assessment movement in higher education – with prodding from
accrediting agencies and state governments – is gradually moving us from asking
6
exclusively input based questions . . . to asking outcomes based questions” (p. 21). There
are various institutional satisfaction and engagement based surveys, as well as national
ones that have been formed and utilized in recent years. One of the most popular surveys
used with undergraduate populations is the National Survey of Student Engagement
(NSSE). “This instrument features five benchmarks: levels of academic challenge, active
and collaborative learning, student interactions with faculty members, enriching
educational experiences, and supportive campus environment” (Sandeen & Barr, 2006, p.
140). There is the thought that although the NSSE has traditionally been used for
institutional programs evaluations, there is potential to use this assessment for the
oversight of student learning in addition to the programming aspects.
Although there are various opinions regarding MBA culture, especially since the
2008 economic crisis, there are no known fully developed, student services-based studies
of MBA culture. Although this is a challenge in finding a supporting, fully researched
case for comparison when considering the importance and potential restructuring of not
just MBA curriculum, but specifically MBA culture, this also opens a door to much
opportunity. In a May 26, 2009 Bloomberg Business interview led by reporter Francesca
Di Meglio, Harvard MBA professor Rhakesh Khurana stated the following when asked
about the relationship that the business school culture may have had to the 2008
economic crisis:
I think where business schools went wrong was starting to see themselves as business and not enough as education. Too much of contemporary business education offers a narrow concept of the role of business in society. It is not holistic, nor does it take into account the competing claims that a variety of constituents have on the firm. Consequently, the leadership training in business schools tends to be narrow, functional, and specialized. It does not produce a broad, integrative understanding of business. (p. 2)
7
The most striking part of the above quote is that ultimately, business school is
about education. Education is about learning, and learning is about the full student
experience both inside and outside of the classroom. There is much potential for specific
MBA student services research including teams research, and the post economic bottom
may be one of the most fascinating places to begin as we look into the importance of
teams training in the context of MBA program culture.
Limitations of the Study
The primary limitations of this study center around the institution and full-time
MBA program that is the site for this study and the body of research that is currently
available for this type of MBA focused research. The first limitation focuses on the small
sample size and small full-time MBA program that exists at the research site institution.
The incoming full-time MBA class for the 2014-2015 academic year, starting in the fall
of 2014 had a total of 36 students. For this reason, a single study design research project
was used to adjust to the small sample size in this project. Randomized phase start-point
approach is a technique that was used to randomize and make an AB design more
scientifically credible and have important components of a true experiment.
Although there are many commonalities in curriculum and structure of differing
MBA programs, each program indeed has its own distinct culture. There are many
factors that go into this culture. These aspects include geography, demographic make-up
of each MBA class, the general campus culture, and the faculty and staff that give shape
to the program. Considering these factors, development activities that work effectively
with one group may look slightly different on another campus with a different MBA
program. In order to eliminate any campus cultural biases, the literature regarding
8
effective team building will be used to guide the practice of this study. The focus of the
teams training interventions applied were based on previous research completed not only
with graduate or MBA students, but those implemented with general student groups as
well as in corporate settings.
Although there is an ample amount of research on team building, team training,
and teams related issues, there is less research surrounding specific MBA teams training
and MBA teams related matters. Therefore, the literature reviewed focuses both on MBA
specific students and teams training as well as general teams research. The literature
reviewed centers largely on benefits and strategies involved with general teams training
and the study, then adapts this information to assist with building an effective teams
training program that is tailored specifically towards students in a full-time MBA
program environment
Delimitations of the Study
This study was designed for a focus on MBA students, and designed to be a deep
dive into the teams training structure of MBA programs. The study was not designed as a
broad look at teams training in all graduate student programs. Therefore the study
specifically focused on the full-time MBA experience through the lens of the teams
training process, and the impact that this training can have on the overall culture of an
MBA program through student satisfaction and academic achievement.
An additional consideration in regards of a delimitation is that students in the full-
time MBA program at the research site institution are usually switched from their first
team to their second mid semester, at the change of the first to second quarter. For
purposes of this study, student participants in the study stayed on the same core team for

9
the duration of the first semester in the program. This will allow for consistency in the
study and may add another element that may be explored for future research – the
advantages that may exist of students remaining on the same team for the first semester in
a full-time MBA program versus switching teams at the change of quarters.
As a researcher I am purposefully focusing on the first semester of the MBA
experience to research, and not the entire first year or entire duration of a student’s time
in an MBA program. The first semester was chosen as the research timeframe based on
this importance of the first semester to the entire MBA experience. The first semester sets
the tone for the remainder of MBA students’ time in the program. During this important
timeframe relationships are built between students and their peers, students and faculty,
students and staff, and students and their teammates. For these reasons, the first semester
in an MBA program is a crucial transition point to research for further clues into the
importance an impact of the total team and teams training process.
Definitions of Terms
MBA Students—Graduate students working towards an advanced professional
degree in a Master of Business Administration graduate degree.
MBA Student Academic/Learning Teams—Groups of 4-6 MBA students assigned
to a designated work group, for all core courses, for the duration of at least one quarter or
semester when the teams are reassigned and students are in new teams for the second
quarter or semester of the academic year.
The Learning Team model, [was] first developed by Wharton and [is] now emulated by other schools. The Learning Team model is based on the business world in which employees work together in teams that depend on persuasive rather than positional leadership. . . . Learning Teams serves as a living laboratory for cultivating these skills. (University of Pennsylvania Wharton MBA, 2014)
10
Team—A team “is a small group of people with complementary skills who are
committed to a common purpose, performance goals, and approach for which they hold
themselves mutually accountable” (Herman, 2000;; Katzenbach & Smith, 1993).
Academic Achievement—Academic Achievement will be defined by the grades
that full-time MBA students in the experimental group earn in the first semester of the
MBA program. According to Snowman and Bieler (2003) the purpose of grades is to
correctly communicate the level of academic achievement that a student has acquired.
Teams Training—Assisting students in learning the skills needed to “meet the
challenges that arise when working in organizational teams” (Chen et al., 2004).
Team Building—Team building means regularly taking time to evaluate the
performance of teams. . . . To be effective, team building must be viewed as an ongoing
activity” (Levi, 2014).
Team Learning—“Team Learning ‘empowers’ both instructors and students by
redefining their primary roles and responsibilities in the learning process. The instructor
is redefined as a course designer and the manager of the overall instructional process.
This is only possible because the performance evaluation system and instructional
activities employed in Team Learning create conditions in which the vast majority of
students willingly share in the responsibility to ensure that learning occurs” (Michaelsen
& Black, 1994).
Team Resource Management (TRM)—“is a training program to develop a defined
set of teamwork competencies so a team can operate without error under stressful
circumstances” (Goldstein & Ford, 2002).
Teamwork KSA’s—Teamwork knowledge, skills, and abilities (Chen et al., 2004).

11
Simulation—“Any artificial or synthetic environment that is created to manage an
individual’s (or team’s) experiences with reality” (Salas, Wildman, & Piccolo, 2009).
Simulation-Based Training (SBT)—Training for graduate management students
based on a simulation activity that assists in the knowledge acquisition and critical
thinking process.
CATME—Comprehensive Assessment of Team Member Effectiveness (CATME,
n.d.).
Organization of the Study
Overview & participants. The study was carried out at a college of business at a
large Midwestern Research I institution. This college of business offers a full-time
MBA, a MBA for Professionals program, and a distance Executive MBA in Energy
option. This study will focus on the full-time MBA students entering graduate school in
the fall of 2014 that on average have two years of full-time work experience prior to
starting their MBA, and are an average age of 25 years old. A total of 36 first year full-
time MBA students at the research site institution were invited to participate in this study.
Data collection. All first-year MBA students at the research site institution
received ongoing teams training and advising in the first semester of their program. A
convenience sample of 36 students (6 academic teams), all of which were first-year MBA
students, was invited to participate in the research study. The research site was the
college of business at a large Midwestern Research I institution. The Comprehensive
Assessment of Team Member Effectiveness (CATME) was utilized to regularly
administer peer and self-assessment of teamwork skills, and track student team
satisfaction throughout the semester. Students were asked to complete a brief team skills

12
assessment for themselves, and each member on their academic team at 8 points over the
course of the semester. Each team skills assessment also included a student team
satisfaction component for students to complete. Additional team advising sessions with
each participating team were utilized to collect qualitative data that was categorized and
analyzed. Team advising sessions were recorded and transcribed.
According to Creswell and Miller (2000), “As a validity procedure, triangulation
is a step taken by researchers employing only the researcher’s lens, and is systematic
process of sorting through the data to find common themes or categories by eliminating
overlapping areas” (p. 4). In this study, triangulation will be used for verification
purposes. Visual Analysis will be used to determine whether or not a relationship exists
between teams training and team skills acquisition as well as student satisfaction. The
primary goal of single case research is to track causal relationships between independent
and dependent variables (Horner et al., 2005). In order to demonstrate these causal
relationships and the strength of the relationships between variables, “single-case
researchers traditionally have relied on visual analysis of the data” (Kratochwill et al.,
2010). If the data across all phases of the study demonstrate an effect then a causal
relationship is suggested.
As stated in the Informed Consent Form that all participants were required to
complete, any information obtained during this study that could identify individuals will
be kept strictly confidential by the researcher. The data was stored in the investigator’s
office and only seen by the investigator and limited MBA administrators for program
improvement purposes during the study and for three years after the study is complete.

13
Data was reported as aggregated data and the audio recordings of team advising sessions
were erased after transcription.
There were no known risks or discomforts associated with this research.
Participation in this study was voluntary. Individuals had the option to refuse to
participate or withdraw at any time without harming their relationship with the
researcher, the University of Nebraska-Lincoln, the research site institution, or in any
other way receive a penalty or loss of benefits to which students were otherwise entitled.

14
Chapter 2
Literature Review
Introduction
The purpose of this mixed methods, quantitative and qualitative study design, was
to explore whether there is evidence that MBA teams training contributes to team skills
development and student team satisfaction in the first semester of a full-time MBA
program in order to improve the overall quality of the student culture in a full-time MBA
program. This chapter describes the case for MBA teams training and presents a review
of MBA curricular and teams training literature.
The Case for MBA Teams Training
In a 1997 study, Cohen and Bailey found that of organizations with 100 or more
employees, over 80% of these establishments utilized work teams. According to Chen
et al. “not enough has been done in educational settings, particularly in higher education
settings, to explicitly develop teamwork KSAs,” referring to teamwork knowledge, skills,
and abilities (2004). The lack of teams training in higher education may in part exist due
to the disparity in opinions of the importance of teams based training from corporate
representatives versus educators in higher education. Considering that the primary focus
of educators is still largely focused on traditional academic based course curriculum,
professionals at George Mason University in Fairfax, Virginia developed a course for
undergraduate students in the early 2000’s to specifically address the development of
teamwork KSAs. The course, that is still offered currently, is called “The Psychology of
Working in Groups and Teams” (see Appendix A: The Psychology of Working in Groups
and Teams course syllabus).

15
The KSA dimensions that Chen et al. (2004) describe in their research and thus
founded their “The Psychology of Working in Groups and Teams” course on are listed
with brief descriptions below.
x Conflict Resolution – “encourage desirable, but discourage undesirable team
conflict”
x Collaborative Problem Solving – “recognize the obstacles to collaborative
group problem solving and implement appropriate corrective actions”
x Communication – “listen non-evaluatively and to appropriately use active
listening techniques”
x Goal Setting and Performance Management – “establish specific, challenging,
and accepted team goals”
x Planning and Task Coordination – “coordinate and synchronize activities,
information, and task interdependencies between team members”
Although MBA programs are committed to the concept of teamwork, there is
minimal teams training that goes into the MBA teams process, and the teams training that
is offered is rarely founded on research or delivered in a systematic format. Chen et al.’s
research with undergraduate students offers a clear format and foundation for building a
formal teams training process for MBA students.
MBA Team Skills & Teamwork Research
Through researching past MBA teams studies, there is an adequate amount of
research that has been conducted to investigate how to make the MBA academic team
environment more efficient and effective. Since 1988, at the time of the release of the
notorious Porter and McKibbin report which encouraged graduate business educators to

16
consider and reconstruct the ways that business schools prepare students for leadership
and professional careers, there has been a movement to reconsider skills promoted in
graduate business education. Much of the research is similar in nature, and demonstrates
that many of the MBA academic teams issues that were prevalent 20 or more years ago,
are still prevalent today.
In Bedell’s unpublished dissertation at Indiana University (1996) he explored the
influence of MBA student team composition on achievement and team attitudes. He
found in his study that team heterogeneity is connected to learning enjoyment and that the
more diversity present in teams, the “higher level of positive individual reaction.” Bedell
also concluded as a response to “free-riding” being one of the greatest issues on academic
teams, that instituting a mechanism of accountability should be applied to academic
teamwork situations. Additional conclusions that Bedell drew from his study include that
assisting teams with effective team communication and making students aware of
differing communication styles is beneficial, strong social support on teams yields more
positive attitudes, and that feelings of accountability are connected to increased team
participation.
In an unpublished dissertation from Herman (2000) the researcher focused on
studying MBA teams in the context of building an institutional environment of support.
In her study, she surveyed business school faculty and deans/directors, to inquire what
these populations see as the most significant issues facing academic teams. Both stated
that the top three challenges facing academic teams are team slackers, team
dynamics/conflict, and grading. A notable conclusion that came out of Herman’s study
included that having a fixed team across the curriculum makes a significant difference on

17
the team experiences. Students learning and team effectiveness is increased when they
are placed on the same team for all core courses throughout the duration of a term or
semester.
In a 2002 study, Tonn and Milledge explored MBA team building through the
creation and execution of a MBA gateway course at the University of Massachusetts-
Boston. The course was initiated based on faculty frustration that MBA students were not
prepared for academic teamwork. As a result, the MBA gateway class was established to
teach key principles of organizational analysis and group process, and help entering
students learn team skills expected by MBA faculty. On their assigned MBA teams,
students were expected to analyze a case and present the case to the class, write a term
paper focusing on an organizational change effort, write a team contract, complete a one
time assessment of team effectiveness, develop a plan for team improvement, and keep a
journal about the evolution of their academic team. This course assisted in the school
meeting their goals associated to strengthening the MBA team process and students’
understanding of group and teamwork.
In a 2001 unpublished dissertation, Shuayto takes a critical look at the crucial
managerial skills that both business managers and business schools view as important in
MBA program graduates. More specifically, the study asked three primary research
questions:
x What are the most important managerial skills to business managers?
x What are the most important managerial skills according to MBA educators?
x Is there a difference between what skills are important to according to
business managers and MBA educators?

18
Shuayto (2001) found that business managers rank soft skills, including team skills,
significantly higher than MBA educators. Based on this data, she concluded that there is a
considerable need for graduate business programs to strengthen soft skills in students,
while simultaneously continuing to develop more traditional hard skills.
There are more recent studies that explored the benefits for teaching teamwork
and leadership skills. In 2008, Butler, Forbes, and Johnson affirmed that it is not a new
concept to develop programs and courses to focus on leadership and soft skills
development in MBA students. What this study suggested with a new twist is that
focusing on a limited number of skills and development areas instead of a broad brush
stroke approach, and adding a practical component that helps students translate the
theoretical information they are receiving to practical knowledge, can be more beneficial
to students when receiving soft skills training. The course that these researchers designed
centralized on four main skills:
x Building a trusting relationship
x Effective goal setting
x Effective communication
x Structuring the coaching dialogue or session
In the course and centering on these four main skills areas, students learned theoretical
information in the classroom, and then practiced giving and receiving feedback with a
professional coach and peers. Researchers found the course effective in its approach and
promising to “narrow the focus to a relatively small set of highly relevant skills.”
Additionally in 2008, Rosemary Maellaro wrote an insightful unpublished
dissertation exploring the ideal combination of skills for MBA graduates. In her paper,
19
Maellaro writes, “A gap continues to exist between the skills that MBA programs
develop in their students and the skills that hiring managers seek in MBA graduates,
despite the attention this issue has received in the past 20 years.” As other authors and
researchers suggest, she also concurs that the current approach to graduate management
education is too theoretical and not practical. There is a hard skills-soft skills gap, and
“There is not a single, consistent definition or description of the interpersonal skills that
are necessary for managerial success in today’s high-speed, diverse, and service-oriented
environment.” Regarding to the most important attributes valued by MBA hiring
managers, communication was ranked the highest. The relative significance of the most
important skills is the same for men and women, although men and women place a
different weight on each skill. Women put more weight on communication and empathy
while men put more weight on intellectual interpersonal skills and influence. Maellaro
found that the ideal combination of skills was superior communication skills, above
average influence and intellectually oriented skills, and adequate empathy. Candidates
with this combination of skills have an 84.26% of being hired.
In 2011, Varela, Burke, and Michel additionally explored the development of
managerial skills in MBA programs. In their article based on relevant literature
contributing to MBA skills development, the authors state that establishing learning goals
in relation to skill development, continuing to find new ways for assessing skills
development, and focusing on formation of managerial skills should be a priority for
MBA programs in order to strengthen MBA graduates. “The primary role of MBA
education is to set in motion a learning process for advancing managerial skills into
intermediate stages while equipping graduates with learning tools that support

20
development beyond graduation.” Innovations and changes to curriculum in graduate
business programs should be made to support long-term development.
In a 2013 study, Dobson, Frye, and Mantena researched MBA leadership training
using peer-led team based workshops. In their study, they stated, “While leadership
experience is essential for business executives, directly teaching leadership has often
been overlooked in MBA education.” They examined the benefits of peer led leadership
workshops in a MBA program. Participants in the study were required to complete
weekly journal assignments and participation in weekly discussions and regular feedback.
Although the study revealed that students and peer leaders benefitted from the team skills
and leadership focused workshops, participating as a peer leader had significantly
increased benefits.
A recent 2014 study from Hobson, Strupeck, Griffin, Szostek, and Rominger
considered the results of an empirical evaluation of teaching MBA students’ teamwork
and team leadership skills. The researchers claimed in this study “no skill is more
important for MBA students than facility with teamwork.” The purpose of this study was
to strengthen both teamwork and leadership skills of participants. Researchers utilized the
Adaptive Character of Thought (ACT) theory as a guide in forming their program. The
program provided students opportunities to acquire teamwork KSAs, contemplate how to
demonstrate team skills, and practice the new KSAs developed. The Leaderless Group
Discussion (LGD) exercise was used as the teamwork evaluation tool. Researchers
utilized student participation in a required teamwork course that all MBA students were
instructed to take. Teams were randomly formed in their teamwork courses. Each team
had a team exercise they participated in that was recorded for researcher and student
21
review. Assessments conducted included those of the researcher, each student examining
his or herself, and peer evaluations based on assessment elements of the LGD. This
process gave students teamwork and team leadership feedback from the perspectives of
the researcher, peers, and self. This study’s findings concluded that programs could be
successful in teaching teamwork and team leadership skills.
In an attempt to capture accurate assessment of soft skills, an additional 2014
study from Brill, Gilfoil, and Doll explores predictability of instructor ratings utilizing the
McCann Business Soft Skills Assessment. The purpose of this research was to evaluate
the McCann Business Soft Skills Assessment Tool in reference to leadership, teamwork,
critical thinking, logical reasoning, communication skills, and holistic thinking,
particularly in connection with predictive validity. Forty students participated in the
study, with 26 of these original participants completing it a second time. The pilot study
suggests that the McCann Soft Skills Assessment tool is useful in successfully assessing
soft skills in graduate business students.
Common Teams Training Approaches
The primary distinguishing factor of teams training in comparison to team
building is recognizing the knowledge and skills that are most important to develop for
team effectiveness, and then working to improve the resources and training available for
these specific areas (Levi, 2014). Competencies and skills well suited for the teams
training process may include adaptability, leadership and team management,
interpersonal relations, coordination, communication, decision making, etc. Within the
genre of teams training, there are three types of training that are widely practiced. These

22
training approaches are team resource management (TRM), cross-training and
interpositional training, and action learning.
Training resource management (TRM) “is a training program to develop a defined
set of teamwork competencies so a team can operate without error under stressful
circumstances” (Goldstein & Ford, 2002). Training resource management is also known
as crew resources management (CRM). These terms are used interchangeably in the
literature. The training research management approach was originally created as a
preparation for the aviation industry, and then expanded its reach to other high stress
careers that demand high accuracy and consistency. This training approach direction in
reference with its roots in the aviation industry concentrates on the larger goals of
communication, teamwork, decision-making, and awareness (Aguinis & Kraiger, 2009).
Currently, training resource management is used in professional development when it is
necessary for team members to learn specific skills in order to insure project success.
This training approach has been effective in “reducing errors and accidents, improving
teamwork, and increasing efficiency” (Levi, 2014). The common advantages
demonstrated and researched in reference to TRM/CRM include favorable impressions of
the training process and operational acquisition of team knowledge and skills (Aguinis &
Kraiger, 2009). Aguinis and Kraiger (2009) also document direct benefits (innovation
and tacit skills, adaptive expertise, technical and self-management skills and cross
cultural) as well as indirect benefits (empowerment, communication, planning, and task
coordination in teams).
An additional common teams training method is known as Cross-Training and
Interpositional Training. According to Goldstein and Ford (2002), the primary reason to

23
implement cross training for organization and team members is to promote flexibility and
to build a well-rounded team. Similar to cross-training, interpositional training is
designed to come to a better understanding of the work roles of oneself and others in an
organization. Ultimately, the primary purpose of interpositional training is to encourage
and empower teammates to share knowledge of skills and impactful work methods to
strengthen teams and overall job performance (Marks, Sabella, Burke, & Zaccaro, 2002).
The last largely recognized teams training method is action learning. The action
learning teams approach works to develop teams that can work together to think critically
and “analyze and solve important, real-life problems in their organizations” (Levi, 2014).
The purpose of the action learning approach is for individual organization members to
gain valuable knowledge through practical experiences that can be shared with other
members of a group for holistic training and benefit.
It is clear that there is a need for soft skill development in the MBA curriculum.
Soft and relational skills development in the teams training realm is clearly lacking in the
traditional MBA experience. Considering these factors, the potential for teams training to
be an area where these skills can be built out while serving as a great benefit to students,
holds the possibility for successful delivery of a new program approach using the training
resource management method.
Historical Context of the MBA Degree
Graduate business education premiered at Dartmouth University in 1900 with a
Master’s Degree in Business (Friga, Bettis, & Sullivan, 2003). Shortly after in 1908,
Harvard University launched the first official Master’s in Business Administration (Cudd
& King, 1995). According to Mintzberg (2004), in the mid 1900s complaints began that

24
business school offerings in curriculum were not keeping up with the ever-changing pace
of industry. At this time, a shift slowly starting taking shape to include and accentuate
softer, more human relations skills and develop analytical based skills. Primarily due to a
sponsorship from the Ford Foundation, an era of reform began in management education
to move away from a vocational based model to a more analytical and researched based
model (Friga et al., 2003). The Ford Foundation donated a total of $35 million to
transform and updated the face of management education.
The struggle for continued relevance of business schools and graduate business
education sustained into the 1980’s and 1990’s. Critics continued to “assert that
professional business education is overly tools-oriented at the expense of quality
thinking, communication, and people-related issues” (Brooks, 2006). As the curriculum
evolved into the new century and millennium, Bennis and O’Toole stated that for
business schools to maximize their benefit to students and global impact they must assert
themselves as professional skills focused on training and preparing their students to be
successful in the world of business by offering support to excel not only in the knowledge
of hard skills, but also in the practice of management and business (Bennis & O’Toole,
2005).
Friga et al. (2003), divided the complete history of MBA based management
education into three distinct periods. These timeframes included Corporate Based
education prior to the 1950’s, Faculty Based education from the 1950’s through the
1990’s and Student Based education characterizing the new millennium. The Corporate
Based era is known for its vocational focus and prevalence at the time of the industrial
revolution. The Faculty Based phase, with value rooted in media rankings, focused on

25
empirical research and analytical importance. In regards to the period of Student Based
management education, this era is currently heavily influenced by global perspectives,
the possibilities of online education, and widely prompted by the millennial knowledge
revolution.
The Association to Advance Collegiate Schools of Business (AACSB) & Teamwork
Connection
The Association to Advance Collegiate Schools of Business is commonly referred
to at the AACSB. The AACCB serves as the premier education accrediting body for
business schools around the world. Seventeen-business school deans committed to
making positive change in business education established the association in 1916. Today
this goal persists with the current mission, “AACSB International advances quality
management education worldwide through accreditation, thought leadership, and value-
added services” (AACSB, n.d.). In addition to working with standards and accreditation
processes related to management education, the AACSB offers services to business
school educators such as conference and networking opportunities, access to industry
data and publications, and education for members regarding best practices and current
trends in business education. Although the AACSB currently offers a variety of resources
regarding curriculum and education standards, until 1940’s the AACSB existed as more
of a backing for business school deans with minimal standards and curricular norms in
place (Risi, 2005). The current existence of the association lends itself to both creating
and upholding optimal standards for business schools while creating and offering support
systems for all business school educators.

26
In the 2013 edition of the AACSB Business Accreditation Standards report,
established standards 8 through 12 focus on Teaching and Learning. Standards 9 and 10
particularly lend themselves to issues related to teamwork and developing team skills in
graduate management students. Standard 9 states itself as, “Curriculum content is
appropriate to general expectations for the degree program type and learning goals,” and
mentions that one of the general skill areas for development in bachelor’s degree and
higher programs as, “Interpersonal relations and teamwork (able to work effectively with
others and in team environments)” (AACSB, 2013).
Standard 10 in the 2013 AACSB Business Accreditation Standards report states,
“Curricula facilitate student-faculty and student-student interactions appropriate to the
program type and achievement of learning goals” (AACSB, 2013). Integrating the
requirement that outlines, “For any teaching/learning model employed, students have
opportunities to work together on some learning tasks and learn from each other,”
supports this standard. Both standards 9 and 10 demonstrate the importance not only for
incorporating teamwork into the MBA student experience, but also supports the case for
actively integrating teams training and team skills development into the MBA
curriculum.
MBA Curriculum
In a well known 1988 report and game changing document for management
education, led by Porter and McKibbin, there were 6 primary qualities of an ideal MBA
program that were identified. These characteristics include multidisciplinary integration,
experiential learning, soft-skill development, a global perspective, information
technology focus, and ethics and corporate social responsibility. According to a recent

27
study conducted by Peter Navarro of University of California-Irvine, “Today’s MBA
curriculum remains far from the ideal identified in the prescriptive literature” (2008). In
Navarro’s study, he researched the top 50 MBA programs in the United States, and set
out to find which of these programs in practice demonstrated the existence of 1 or more
of these 6 ideal qualities highlighted by Porter and McKibbin. The results of Navarro’s
study “suggest that, at many schools, the ideal curriculum remains far more of a
normative construct than a positive reality” (2008). Specifically, the study revealed that
soft-skill development, corporate social responsibility, and global perspective receive
much less curricular focus than multidisciplinary integration, experiential learning, and
an information technology focus.
Additional studies have also researched the MBA curriculum and found similar
results. Rubin and Dierdorff (2009) sought out to measure the sufficiency of the MBA
curriculum in comparison to managerial competency requirements. Rubin and Dierdorff’s
results revealed that there were “significant gaps” between practical managerial work and
expectations versus the standard MBA curriculum.
Roth (1989) asserts that the lack of soft skills that are promoted and taught in the
MBA school environment creates a clear disconnect between the academic business
environment and the corporate world. This creates a clear need for the development of
more soft skills based programming and curriculum for MBA programs. “While
interpersonal skills, leadership, and communication are very important in shaping
management effectiveness, they are some of the least effective skill sets taught in the
typical MBA curriculum” (Navarro, 2008). This reality serves as both a call to action and
area for development for educators in the MBA community.
28
Current Directions in MBA Program Curriculum & Structure
Typical specializations and concentrations offered in full-time MBA programs
include consulting, finance, marketing, real estate, supply chain management,
entrepreneurship, accounting, human resources, etc. In addition to these concentrations
mentioned, programs additionally have specialization areas related to specific industries
that are geographically pertinent. Examples of this are the energy management
concentration at University of Texas, Rice University, and University of Oklahoma, as
well as the entertainment concentration at University of Southern California and New
York University.
In addition to concentrations and specializations being offered within the context
of MBA programs, specialized MBA programs have been gaining momentum in recent
years. With the saturation of MBAs in the corporate market, many schools are starting to
think through how these more specialized MBA programs can be of benefit to the
students that will be maximizing their experiences, and also giving programs a chance to
differentiate themselves from other competing MBA programs. Examples of these
specialized programs include Washington State University’s wine business management
program, Boston College’s joint MA in Ministry and MBA which prepare students for
ministry and management responsibilities simultaneously, and University of Wisconsin’s
arts administration and applied security analysis MBAs (Collins, 2012).
The full-time MBA structure typically is a one or two year program duration
format, with the first year of the program designed in a lock-step structure where all
students take the same classes simultaneously in the first year. In the two-year and one
and a half year MBA program formats, the first year of the full-time MBA program

29
students are typically assigned to core teams for all mandatory and foundational core
courses. The second year of the program gives students the freedom to take elective
courses and pursue various specialization and academic concentrations.
Trends in Current MBA Graduates
Each year the Graduate Management Admission Council (GMAC) publishes a
Business School Follow Up document for the most recent graduating class of graduate
business students. In the Class of 2013 edition of this report, there were 915 respondents
from 129 business schools, representing a 19% response rate. Based on GMAC’s
findings, the Class of 2013 continue to secure post graduate school jobs at the most recent
placement rate of 90%. Seventy-Four percent (74%) of the 90% that did have positions
secured upon graduation state that they could not have gotten the job that they have
without obtaining a graduate management degree, and 96% of respondents said that they
would recommend a graduate management education to other students. Ninety-two
percent (92%) of the recent graduates surveyed interestingly additionally reported that
they believe that their education prepared them for leadership roles and developed
quantitative skills as well as 95% responding that their graduate education taught
adequate qualitative skills. The new graduate data, particularly the statistics focused on
self-perceived competency in the areas of leadership and qualitative skills development,
conflicts with researcher data that reports managers low approval of MBA graduates
qualitative and leadership skills. Additionally, there is a significant gap between the
GMAC data and current perceptions of MBA training received while in graduate school
when it comes to basic managerial competencies expected in new graduates.

30
Current Perceptions of MBA Teams in the Media & The Research Connection
In a 2012 article in the Washington Post, the author Rich Enos, co-founder and
chief executive of StudyPoint, a company committed to providing preparation for the
SAT, ACT and general academic subjects, speaks about the shortcomings of the MBA
degree that he earned after working for several years in the corporate environment. Based
on his observations, Enos states,
The vast majority of MBA graduates will not use a balance sheet in the first five years after their degree, but they will almost certainly manage a team. Thus, they will need to be able to scale their impact on the organization by getting things done with and through other people.
The need for teams development and interpersonal skills development is widely
recognized in the professional business community.
Eric Jackson, the Founder and Managing Partner of Ironfire Capital LLC, wrote a
2012 article for Forbes titled “The Ten Most Dangerous Things Business Schools Teach
MBAs.” In the article, one of Jackson’s main points states a primary misconception of
business schools is that working on teams in the MBA environment automatically makes
students better team members. Instead, Jackson says, “In my experience, those
experiences were great at teaching you to play politics, undercut your team mates, hang
them out to dry, etc.” This perception of MBA teams and the larger MBA culture is not
uncommon, although the purpose of MBA teams is to develop management skills that
will be utilized in the workplace.
As stated on the Wharton MBA website, “The Learning Team model is based on
the business world in which employees work together in teams that depend on persuasive
rather than positional leadership. Your Learning Team serves as a living laboratory for
cultivating these skills” (University of Pennsylvania Wharton MBA, 2014). As
31
mentioned above in previous research however, anticipated management lessons and
skills are not automatically developed without intentional MBA curricular revisions. The
studies mentioned above demonstrate that there is a disconnection between the current
common and widely accepted MBA curriculum and practical, on the job managerial
knowledge and responsibilities. The research of Rubin and Dierdorff (2009) in particular
found that the skills needed to be successful in the corporate world according to 8,633
managers representing 52 managerial occupations, do not line up with the required MBA
coursework in many U.S. MBA programs. The researchers go on to state that, “Because
MBA programs are founded on the notion that they train future managers, overlap
between managerial competencies should be present.” There is clearly a growing need for
teams and team skill development at the graduate management education level to assist
with the smooth transition of students into the professional environment as well as the
responsibility for business educators to provide students with the leadership foundation to
succeed professionally.

32
Chapter 3
Methodology
Introduction
The purpose of this mixed methods, quantitative and qualitative single case study
was to explore whether there is evidence of MBA teams training contributing to team
skills development and student team satisfaction in the first semester of a full-time MBA
program, in order to improve the overall quality of the student culture. This chapter
informs the reader on the details involved in this mixed methods research, single case
study design, the study’s setting and sample population, full-time teams training at the
research site institution, data collection and analysis methods, and overall research study
methodology.
Statement of Research Questions
Central research questions:
1. Is there evidence that teams training contributes to team skills development in
first year, full-time MBA students and if so, how?
2. Is there evidence that the teams training process in first year, full-time MBA
students impacts student satisfaction with teams and if so, why?
Research sub-questions:
x What is the trend line for student team skills development?
x What is the trend line for student satisfaction with teams?
x What do students report as their perceived growth regarding their team skills
development?

33
x What is in the mind of the student when s/he evaluates teammates on the
CATME team dimensions?
x As students use the CATME, are their evaluations evidence based?
Study Design & Single Case Research
This study included a quantitative analysis based on students participating in the
CATME assessments, as well as a qualitative data collection component though
conducting team-advising sessions, and individual interviews for select participants. In
depth analysis of nine of the 35 participants will be conducted utilizing single case
research methods.
According to Creswell (2007) there are three primary aspects involved in
choosing the research design that is the best match for a researcher and accompanying
study. These factors include bearing in mind the match between the research problem
and approach, considering the personal experiences of the researcher, and respecting the
intended audience. For the researcher, the main emphasis in determining a research
design will be conceptualizing the best fit between the research problem and approach.
With great thought and deliberation, a single case research design will be chosen for this
study. Further explanation for this research choice is expanded upon in the sections
below.
A single case research design is not considered correlational or descriptive, but is
instead experimental and is most commonly used in research committed to education and
applied psychology (Horner et al., 2005; Kratochwill et al., 2010). The primary goal of
single case research is to track “causal or functional, relationships between independent
and dependent variables” (Horner et al., 2005). Single case research has the following

34
three primary unique and identifying features: a single case serves as the main point of
intervention and the case may exist with a single participant or a group of participants
receiving the same intervention; the design provides research control through
administering a baseline measure, a measure when participants are in an active
intervention phase, and in select studies once the intervention has been ceased; and the
outcome variable is measured repeatedly while administering different varied conditions
(Kratochwill et al., 2010). The end goal of research using a single case design is to
establish causal evidence between the independent and dependent variables. “In most
instances experimental control is demonstrated when the design documents three
demonstrations of the experimental effect at three different points in time.” This design is
purposeful in its ability to institute flexibility in the research process, and internal validity
is addressed through the structure and replication of the single case design.
AB Single Case Design, Randomized Phase Start-Point Approach
The AB single case design is the most basic of the within-series intervention
designs. In the AB design, the A represents the baseline, prior to treatment measure. The
B in the AB design serves as the measure once treatment has been applied to the units, or
a study’s participant(s). The AB design also is called an interrupted or basic time series
design. Although the AB design can be considered quasi-experimental, there are
techniques that can be applied to the AB design, such as including a randomization
component, which will improve the scientific reliability (Kratochwill & Levin, 2010). A
withdrawal A baseline phase is not required as part of the AB design. A withdrawal
method such as an ABAB single study design would not be appropriate for a study such
as this teams training one where the intervention knowledge that participants gain cannot

35
be unlearned, therefore it is not predicted for a measure to return to the baseline A at any
point in the study. The researcher will use an AB single case design in the team skills
development study.
Randomized phase start-point approach is a technique that can be used to
randomize and make an AB design more credible and have important components of a
true experiment. “Single-case intervention researchers can incorporate a different form of
randomization into their experiments . . . in which they randomly determine the specific
time points at which the various phases of the time series begin” (Kratochwill & Levin,
2010). The researcher can randomize the start point of the B phase of measurement, also
called the intervention start point (Edgington, 1975, 1992). This technique will be utilized
to add a randomization component to this team skills development study.
In the team skills development research study, there were a total of eight time
periods, or points of measurements taken. In order to include a randomization
component into the study, the MBA professional development class where teams training
sessions took place served as the unit for consideration in the randomization process.
Taking into consideration the total of eight measurement points in the study, along with
at least three baseline measures and at least three post intervention measure, this leaves a
potential for two intervention start points between time periods four and five inclusive.
From these two intervention start points, position four was chosen as the first B phase,
post intervention measure point. This use of the randomized phase start-point approach is
demonstrated further in Table 1.
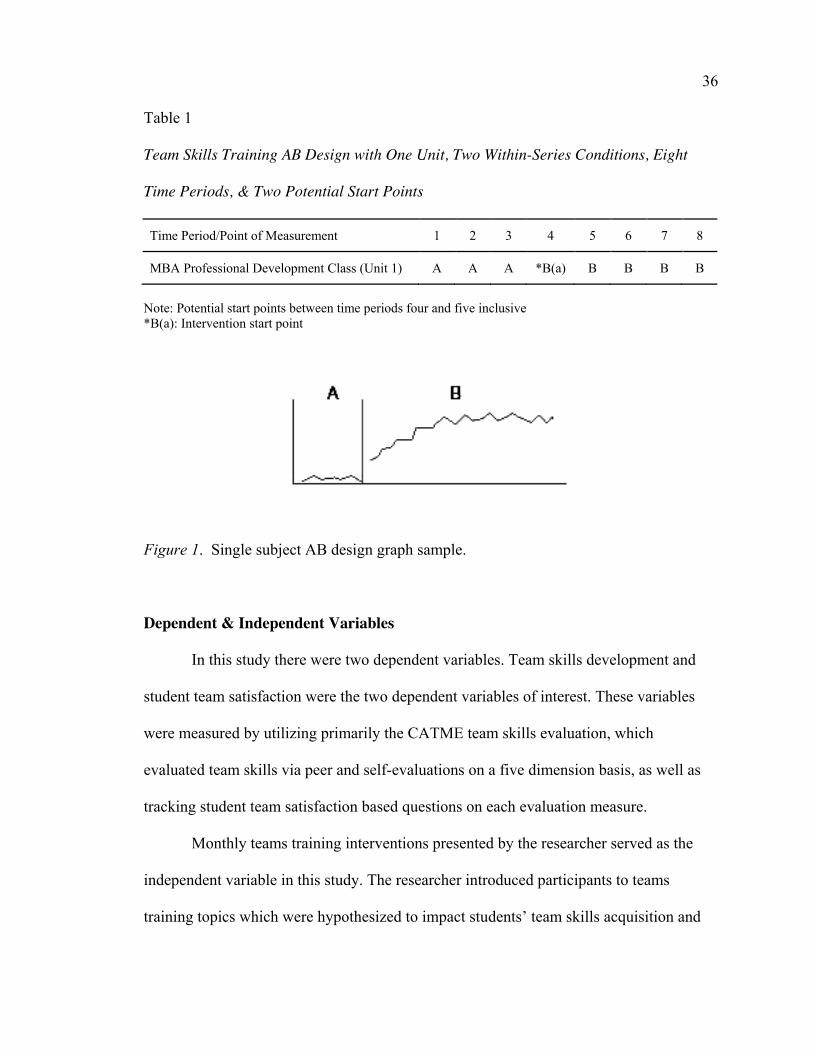
36
Table 1
Team Skills Training AB Design with One Unit, Two Within-Series Conditions, Eight
Time Periods, & Two Potential Start Points
Time Period/Point of Measurement 1 2 3 4 5 6 7 8
MBA Professional Development Class (Unit 1) A A A *B(a) B B B B
Note: Potential start points between time periods four and five inclusive *B(a): Intervention start point
Figure 1. Single subject AB design graph sample.
Dependent & Independent Variables
In this study there were two dependent variables. Team skills development and
student team satisfaction were the two dependent variables of interest. These variables
were measured by utilizing primarily the CATME team skills evaluation, which
evaluated team skills via peer and self-evaluations on a five dimension basis, as well as
tracking student team satisfaction based questions on each evaluation measure.
Monthly teams training interventions presented by the researcher served as the
independent variable in this study. The researcher introduced participants to teams
training topics which were hypothesized to impact students’ team skills acquisition and

37
overall development. The teams training process was projected to assist in knowledge
and practice of team skills that were demonstrated on the CATME team skills evaluation.
Setting and Sample Population
The study took place at the college of business at a large Midwestern Research I
institution. The college of business at the research site university offers the full-time
MBA, a MBA for Professionals program, and an Executive MBA in Energy distance
option. This study focused on the full-time MBA students entering in the fall of 2014
that on average have two years of full-time work experience prior to starting their MBA,
and are an average age of 25-years-old. A total of 36 first year full-time MBA students
were invited to participate in this study, representing 100% of the entering class. All
students were given the opportunity to participate in the study, but had the freedom to
choose to participate or opt out. Thirty-five (35) of the 36 students made the decision to
participate in the study. Twenty-six (26) of the 35 participants were male (74.29%) and
9 participants were female (25.71%). Additional demographics of the 35 total
participants are listed in Table 2.
Full-time MBA Teams Training at a Large Midwestern Research I Institution
The only teams assistance that participants received prior to the formal teams
training program are planned team building activities that includes a one-time ropes
course and a discussion based individual strengths activity based on the StrengthsQuest
assessment. The participants received regular teams training over the course of the
semester as part of the already existing mandatory professional development course for
all first-semester MBA students (see Table 3).

38
Table 2
Participants’ Ethnicity/Countries of Origin
Nationality Percentage
9 International Students 25.71
India (5)
South Korea (1)
Vietnam (1)
China (1)
Bulgaria (1)
17 White/Caucasian 48.57
1 Native American 2.86
1 Asian American 2.86
7 Not Reported 20.00
Table 3
Intervention Activities Schedule
Month Intervention/Team Support Activities
September Two team training sessions
October One team training session and one team advising session
November One team training sessions
An MBA administrative director served as the primary instructor for the professional
development course and the researcher instructed the class for teams training topics. The
professional development course is primarily focused on job search and professional
etiquette, but has never before incorporated any aspects of teams training and teams skills

39
development. Topics incorporated into the teams training interventions were built around
the five CATME (Comprehensive Assessment of Team Member Effectiveness) team
dimensions and based on teamwork KSA’s (knowledge, skills, abilities) researched by
Chen et al. (2004). Chen et al. drill down to 5 major KSA dimensions based on the 14
specific KSAs established by Stevens and Campion (1994) (see Table 4).
Chen et al. (2004) summarized the five dimensions of teamwork KSAs, based on
the work of Stevens and Campion (1994), as described in Table 5:
Overview of Research Study Intervention Activities
The five MBA teams training activities that were implemented in this study,
based on Chen et al.’s (2004) five KSA and CATME’s five team skills dimensions, are
outlined and described below. These four topics listed, along with the individual team
advising session mid semester, served as teams training interventions that all participants
received. All interventions except the individual team advising were offered in the MBA
professional development class, September through November. One individual team
advising session was mandatory mid-semester for all student teams participating in the
study. Students were additionally informed that individual team advising could be
utilized at any point in the semester at a teams’ request by appointment with the
researcher. Below is a detailed description of each monthly experimental group
intervention activity.
For each activity, one teammate volunteered to be the team observer for that day
of class in reference to the appropriate teams training activity. The observer for the group
was given the job of observing and rating the groups interactions on that day for the

40
Table 4
Fourteen Teamwork KSA’s
Interpersonal
Conflict Resolution KSAs:
1. Encourage positive team conflict and discourage Undesirable team conflict
2. Identify source of conflict and fitting strategy for resolution
3. Practice win-win negotiation strategy instead of win-lose strategy
Collaborative Problem Solving KSAs:
4. Identify need for group problem solving and how much group participation is needed
5. Identify obstacles to group problem solving and apply appropriate corrective actions
Communication KSAs
6. Understanding communication networks and improving communication where possible
7. Practice open and supportive communication
8. Practice nonevaulative and active listening
9. Incorporate agreement between verbal and non-verbal communication
10. Remember the importance of small talk and relationship building in the overall communication process
Self-Management
Goal Setting & Performance KSAs
11. Establish specific, challenging, and accepted team goals
12. Constant evaluation and feedback on team and individual performance
Planning & Task Coordination KSAs
13. Plan and synchronize all activities, information and tasks
14 Create roles and expectations for all team members
Note. Stevens & Campion (1994).

41
Table 5
Five Dimensions of Teamwork KSA’s
Conflict Resolution - encourage desirable, but discourage undesirable team conflict
Collaborative Problem Solving - recognize the obstacles to collaborative group problem solving and implement appropriate corrective actions
Communication - listen non-evaluatively and to appropriately use active listening techniques
Goal Setting & Performance Management - establish specific, challenging, and accepted team goals
Planning & Task Coordination - coordinate and synchronize activities, information, and task interdependencies between team members
Note. Chen, Donahue, and Klimoski (2004).
specific activity while also rating the group based on the CATME assessment behavioral
anchors; the same method in which teammates were rating one another individually on a
regular basis. In addition to rating the team’s performance according to the CATME
assessment, the team observer for the assigned activity was given the following three
prompts:
x Team behaviors observed exhibiting positive team skills.
x Areas observed for team skills and skill development.
x Final comments regarding the activity.
In addition to the evaluations and reflections after each activity submitted by the
assigned team observers, all individual participants were asked to complete an assessment
and reflection based on what they experienced during the current team activity. Much like
the observers were asked to do, each participant completed a brief assessment based on
ratings according to each team dimension included in the CATME assessment, and
responded to the following three questions:

42
x What positive team skills did your team exhibit today?
x What team skills does your team need to develop in order to be a more
effective team?
x Any final comments?
The participants were asked to spend a few minutes at the end of each training session
evaluating their team’s work as a whole during the task given in the current activity.
Feedback received from these brief assessments focused on student giving information
based on both their personal growth or thoughts while completing the given activity, as
well as observations and deliberations involving their teammates.
Teams Training Topics & Activities
September teams training topics.
The marshmallow challenge. The Marshmallow Challenge (Collaborative
Problem Solving & Communication KSA dimensions; Contributing to Team &
Interacting with Teammates CATME dimensions). In this team building and team
coordination pursuit, students were tasked to build the tallest freestanding structure
possible with 20 sticks of spaghetti, one yard of string, one yard of masking tape and one
marshmallow (Marshmallow Challenge, n.d.). During this activity team behaviors
emerged, students were able to get to know their teammates better, clear communication
techniques were challenges, and students learn about their teammates strengths and
possible limitations in a low pressure, project management centered environment.
Building a team charter. Building a Team Charter (Goal Setting and
Performance Management, Planning and Task Coordination, & Conflict Resolution KSA
dimensions; Expecting Quality & Keeping Team on Track CATME dimensions).

43
Students were led through a presentation focused on the importance of team planning,
goal setting, and task coordination. The presentation included an active learning
component where all student teams in the experimental group were expected to complete
as a team, a Team Charter document which forced students to establish a team mission,
talk about individual roles and responsibilities, decide how decisions would be made, and
how conflicts would be effectively solved (see Appendix B: Teams Charter).
October teams training topic & team advising sessions.
Plane crash survival scenario communication simulation. Communication
Simulation (Communication, Conflict Resolution, Collaborative Problem Solving KSA
dimensions; Interacting with Teammates CATME dimension). Students participated in a
Plane Crash Survival Scenario. In this scenario, there are nine survivors of a plane crash,
but only four people will fit into the one lifeboat available. Participants in this activity
must decide as a group who will be the final four people to board the lifeboat and row to
land for help. The activity encouraged communication, demonstrated potential
communication issues, individual strengths and weaknesses, and team awareness, while
students were forced to practice conflict resolution (see Appendix C: Plane Crash
Survival Scenario).
Mid semester team advising session. Individual Team Advising
(Communication, Conflict Resolution, & Collaborative Problem Solving KSA
dimensions). One individual team advising session will be mandatory mid-semester for
all student teams in the experimental group. Individual team counseling can additionally
be utilized at any point in the semester at a teams’ request by appointment. Team
advising sessions will be recorded and transcribed for research purposes.
44
Team advising session protocol questions.
What specific issues have you encountered on your team?
In what ways do issues arising on MBA Teams impact the overall student
culture?
Have you received helpful tools from MBA program student services and/or
the teams training program to assist in navigating issues that have arisen on
your teams?
o What tools have you received that have been most helpful to you and your
team?
Has the co-curricular training that you have received from MBA program
student services outside of the traditional classroom environment helped you
to be more successful in your academic based courses?
o What specific co-curricular programs have assisted your success in the
academic environment and in what ways?
How satisfied are you with your overall MBA experience?
The data collected from team advising sessions will be analyzed and categorized into
common themes. The themes will be organized based on the five team CATME
dimensions and stated student satisfaction, as well as additional teams training
information of interest that is derived from these team advising sessions. The qualitative
information gathered in these sessions will be compared to numerical data collected in
the CATME team skills evaluations, and examined for connections and discrepancies that
may exist between the two.

45
November teams training topic.
The trouble with teamwork article review and teams discussion. The Trouble
With Teamwork: Work Groups vs. Teams (Goal Setting and Performance Management
KSA dimensions; Contributing to Teamwork CATME dimension). Student subjects
participated in an active learning review and discussion on Patrick Lencione’s article
“The Trouble With Teamwork.” Students were asked to answer a set of questions about
the article and discuss as a team before discussing as class. In the article, Lencione talks
about the vast differences between work groups and teams, and the difficult questions
that must be asked and answered, as well as the necessary steps that must follow, in order
to operate as a true functional and well operating team or acknowledge their cluster as a
work group (see Appendix D: The Trouble With Teamwork).
Overview of Individual Interviews with Nine Full-time MBA Students
Nine (9) students from the total 35 participants in this study were chosen to
research on a deeper level via single case research analysis. These 9 students were chosen
based on the results of their CATME self and peer assessment data, diversity of work
experience duration, gender diversity, and ethnic diversity. For each of these 9 students,
visual analysis was utilized to consider the significance of teams training on the
development of the five CATME team skills dimensions.
This group of participants consisted of six males, three females, three
international students, six domestic students, five white/Caucasian students, and four
students that chose not to report their ethnicity. In addition to completing the eight
CATME team skills assessment evaluations of themselves and peers, and participating in
one team advising session with the researcher and their team, these participants
46
additionally met with the researcher for an individual interview about their personal team
experience.
Individual teammates interview protocol.
x Scores Overview and Discussion
x Regarding CATME Peer and Self Evaluations:
o Do you perceive that you have improved your team skills over the course
of the semester?
o If so, why do you think this is/to what do you attribute your improvement
in teamwork?
o Are your CATME scores reflective of your experience?
x What value have the teams training sessions had for you personally?
o Did your team incorporate any of the lessons or tips from the teams
training sessions into your interactions?
o Were any of the team sessions particularly helpful?
x What are some of the team skills lessons you learned over the course of the
semester?
x Would these sessions be best in the orientation format, or over the course of
the semester?
o Any suggestions for future teams training sessions?
Description of the Comprehensive Assessment of Team Member Effectiveness
(CATME)
In order to assess the development of team skills over the course of the semester
in the full-time MBA program at the research site institution, the Comprehensive
47
Assessment of Team Member Effectiveness (CATME, n.d.), a behaviorally anchored
rating scale tool was utilized. The CATME was used for three primary tasks with the
first-year full-time MBA students. These functionalities include the peer assessment, self-
assessment features, and gauging student team satisfaction. First, before students rate
each other, participants will involve themselves in a CATME Rater Calibration where
participants will be give the opportunity to rate sample teams in order to come to a better
understanding of the peer evaluation process through CATME and familiarize themselves
with the CATME peer evaluation system. Students participating in the study will be
asked on a bi-monthly basis to complete the peer and self-assessment that focuses on the
five team skills dimensions of: contributing to the team’s work, interacting with
teammates, keeping the team on track, expecting quality, having related knowledge,
skills, and abilities (KSAs). There is also a team satisfaction component that gives
students three prompts regarding their team satisfaction. These prompts include the
following: 1. I am satisfied with my present teammates; 2. I am pleased with the way my
teammates and I work together; and 3. I am very satisfied with working in this team.
Table 6 lists the five CATME team dimensions and their corresponding ratings and
descriptions.
CATME Reliability & Validity
The internal consistency reliability coefficients for the Likert-scale version of the
CATME range from α = .78 to α = .91 (Ohland, Layton, Loughry, & Yuhasz, 2005).
Reliability of the CATME dimensions using generalizability theory and coefficients
additionally ranged from ρ = .70 to ρ = .85, and reliability of the behaviorally anchored

48
Table 6
CATME Team Dimensions & Rating Descriptions
Dimension Rating Description
Dimension 1: Contributing to the Team's Work
5 • Does more or higher-quality work than expected. • Makes important contributions that improve the team's work. • Helps teammates who are having difficulty completing their work.
4 • Demonstrates behaviors described immediately above and below.
3 • Completes a fair share of the team's work with acceptable quality. • Keeps commitments and completes assignments on time. • Helps teammates who are having difficulty when it is easy or important.
2 • Demonstrates behaviors described immediately above and below.
1 • Does not do a fair share of the team's work. Delivers sloppy or incomplete work.
• Misses deadlines. Is late, unprepared, or absent for team meetings. • Does not assist teammates. Quits if the work becomes difficult.
Dimension 2: Interacting with Teammates
5 • Asks for and shows an interest in teammates' ideas and contributions. • Makes sure teammates stay informed and understand each other. • Provides encouragement or enthusiasm to the team. • Asks teammates for feedback and uses their suggestions to improve
4 • Demonstrates behaviors described immediately above and below.
3 • Listens to teammates and respects their contributions. • Communicates clearly. Shares information with teammates. • Participates fully in team activities. • Respects and responds to feedback from teammates.
2 • Demonstrates behaviors described immediately above and below.
1 • Interrupts, ignores, bosses, or makes fun of teammates. • Takes actions that affect teammates without their input. Does not share
information. • Complains, makes excuses, or does not interact with teammates. • Is defensive. Will not accept help or advice from teammates.
Dimension 3: Keeping the Team on Track
5 • Watches conditions affecting the team and monitors the team's progress. • Makes sure that teammates are making appropriate progress.
• Gives teammates specific, timely, and constructive feedback.
4 • Demonstrates behaviors described immediately above and below.
Table 6 continues
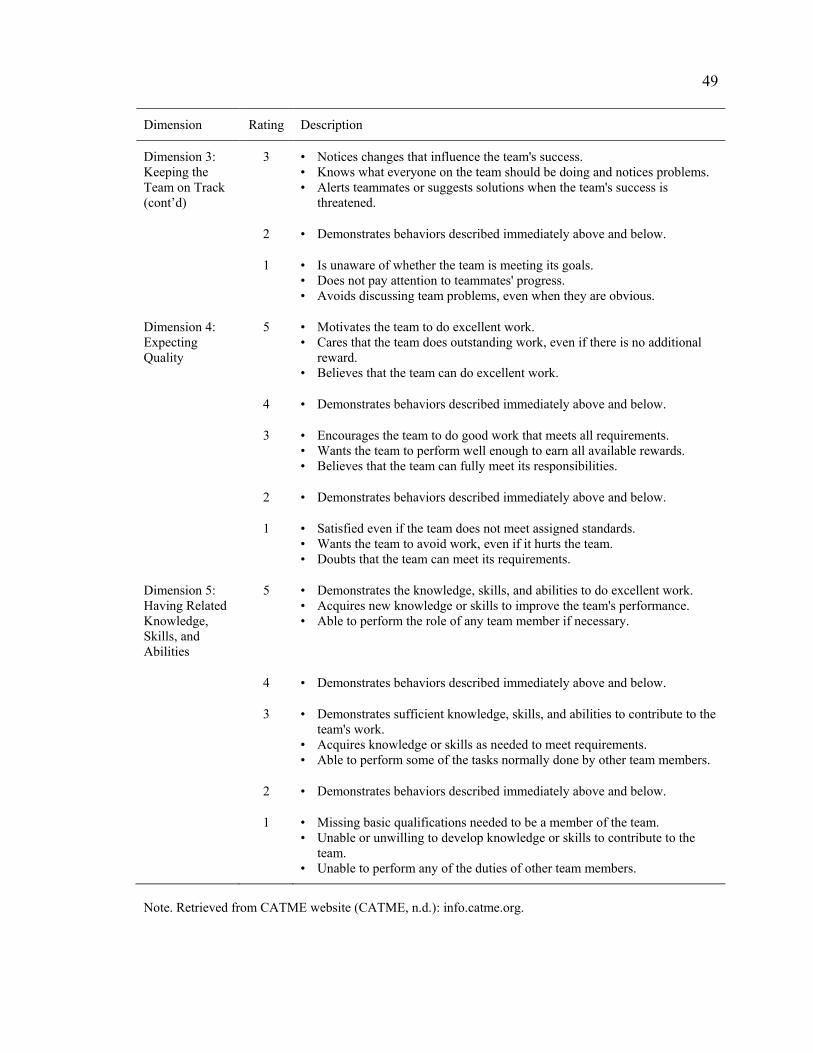
49
Dimension Rating Description
Dimension 3: Keeping the Team on Track (cont’d)
3 • Notices changes that influence the team's success. • Knows what everyone on the team should be doing and notices problems. • Alerts teammates or suggests solutions when the team's success is
threatened.
2 • Demonstrates behaviors described immediately above and below.
1 • Is unaware of whether the team is meeting its goals. • Does not pay attention to teammates' progress. • Avoids discussing team problems, even when they are obvious.
Dimension 4: Expecting Quality
5 • Motivates the team to do excellent work. • Cares that the team does outstanding work, even if there is no additional
reward. • Believes that the team can do excellent work.
4 • Demonstrates behaviors described immediately above and below.
3 • Encourages the team to do good work that meets all requirements. • Wants the team to perform well enough to earn all available rewards. • Believes that the team can fully meet its responsibilities.
2 • Demonstrates behaviors described immediately above and below.
1 • Satisfied even if the team does not meet assigned standards. • Wants the team to avoid work, even if it hurts the team. • Doubts that the team can meet its requirements.
Dimension 5: Having Related Knowledge, Skills, and Abilities
5 • Demonstrates the knowledge, skills, and abilities to do excellent work. • Acquires new knowledge or skills to improve the team's performance. • Able to perform the role of any team member if necessary.
4 • Demonstrates behaviors described immediately above and below.
3 • Demonstrates sufficient knowledge, skills, and abilities to contribute to the team's work.
• Acquires knowledge or skills as needed to meet requirements. • Able to perform some of the tasks normally done by other team members.
2 • Demonstrates behaviors described immediately above and below.
1 • Missing basic qualifications needed to be a member of the team. • Unable or unwilling to develop knowledge or skills to contribute to the
team. • Unable to perform any of the duties of other team members.
Note. Retrieved from CATME website (CATME, n.d.): info.catme.org.
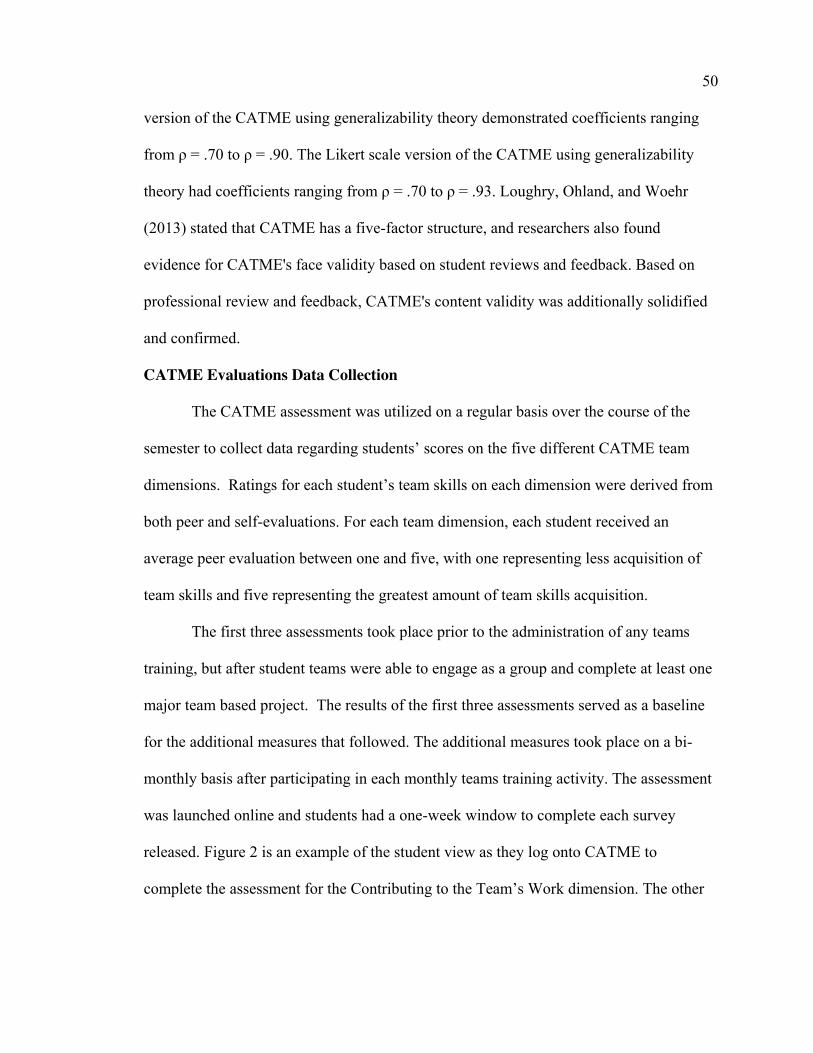
50
version of the CATME using generalizability theory demonstrated coefficients ranging
from ρ = .70 to ρ = .90. The Likert scale version of the CATME using generalizability
theory had coefficients ranging from ρ = .70 to ρ = .93. Loughry, Ohland, and Woehr
(2013) stated that CATME has a five-factor structure, and researchers also found
evidence for CATME's face validity based on student reviews and feedback. Based on
professional review and feedback, CATME's content validity was additionally solidified
and confirmed.
CATME Evaluations Data Collection
The CATME assessment was utilized on a regular basis over the course of the
semester to collect data regarding students’ scores on the five different CATME team
dimensions. Ratings for each student’s team skills on each dimension were derived from
both peer and self-evaluations. For each team dimension, each student received an
average peer evaluation between one and five, with one representing less acquisition of
team skills and five representing the greatest amount of team skills acquisition.
The first three assessments took place prior to the administration of any teams
training, but after student teams were able to engage as a group and complete at least one
major team based project. The results of the first three assessments served as a baseline
for the additional measures that followed. The additional measures took place on a bi-
monthly basis after participating in each monthly teams training activity. The assessment
was launched online and students had a one-week window to complete each survey
released. Figure 2 is an example of the student view as they log onto CATME to
complete the assessment for the Contributing to the Team’s Work dimension. The other
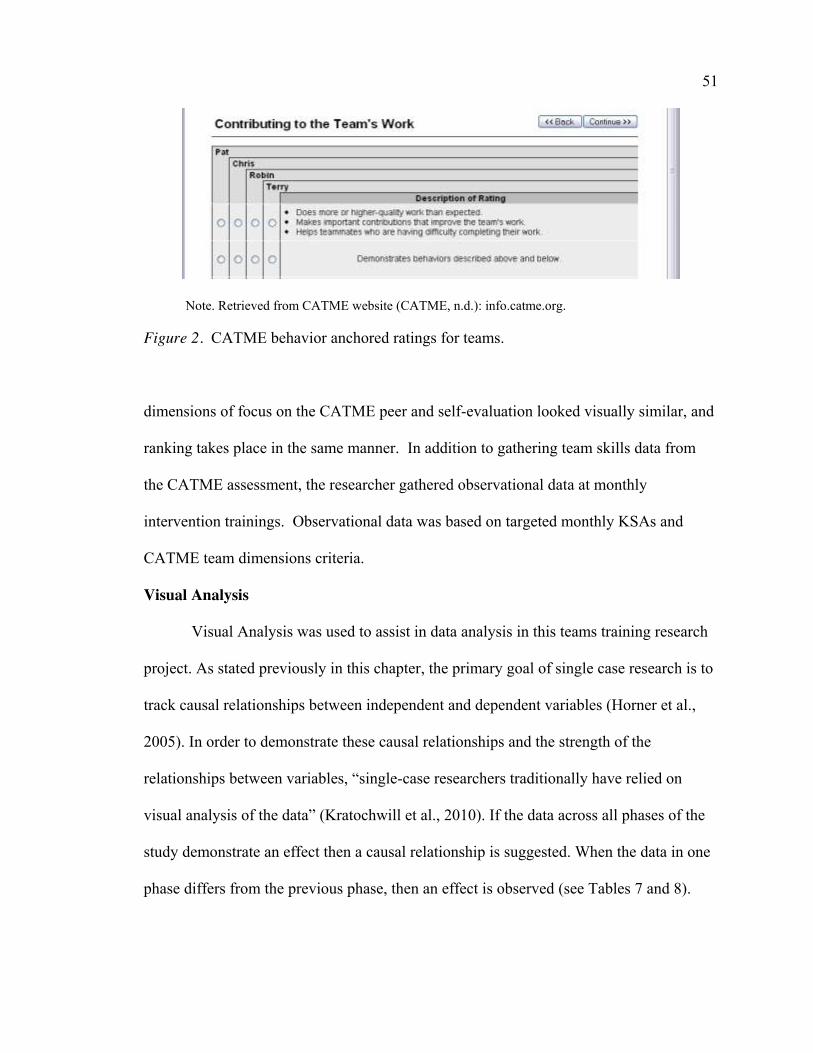
51
Note. Retrieved from CATME website (CATME, n.d.): info.catme.org.
Figure 2. CATME behavior anchored ratings for teams.
dimensions of focus on the CATME peer and self-evaluation looked visually similar, and
ranking takes place in the same manner. In addition to gathering team skills data from
the CATME assessment, the researcher gathered observational data at monthly
intervention trainings. Observational data was based on targeted monthly KSAs and
CATME team dimensions criteria.
Visual Analysis
Visual Analysis was used to assist in data analysis in this teams training research
project. As stated previously in this chapter, the primary goal of single case research is to
track causal relationships between independent and dependent variables (Horner et al.,
2005). In order to demonstrate these causal relationships and the strength of the
relationships between variables, “single-case researchers traditionally have relied on
visual analysis of the data” (Kratochwill et al., 2010). If the data across all phases of the
study demonstrate an effect then a causal relationship is suggested. When the data in one
phase differs from the previous phase, then an effect is observed (see Tables 7 and 8).
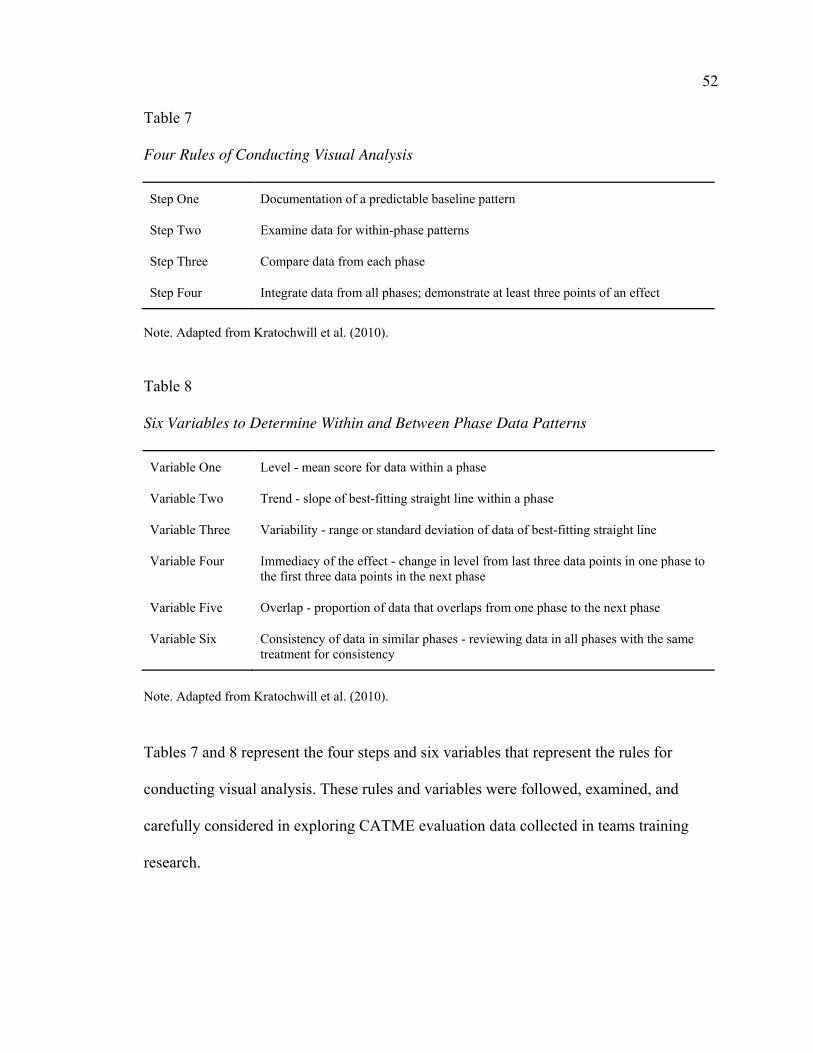
52
Table 7
Four Rules of Conducting Visual Analysis
Step One Documentation of a predictable baseline pattern
Step Two Examine data for within-phase patterns
Step Three Compare data from each phase
Step Four Integrate data from all phases; demonstrate at least three points of an effect
Note. Adapted from Kratochwill et al. (2010).
Table 8
Six Variables to Determine Within and Between Phase Data Patterns
Variable One Level - mean score for data within a phase
Variable Two Trend - slope of best-fitting straight line within a phase
Variable Three Variability - range or standard deviation of data of best-fitting straight line
Variable Four Immediacy of the effect - change in level from last three data points in one phase to the first three data points in the next phase
Variable Five Overlap - proportion of data that overlaps from one phase to the next phase
Variable Six Consistency of data in similar phases - reviewing data in all phases with the same treatment for consistency
Note. Adapted from Kratochwill et al. (2010).
Tables 7 and 8 represent the four steps and six variables that represent the rules for
conducting visual analysis. These rules and variables were followed, examined, and
carefully considered in exploring CATME evaluation data collected in teams training
research.

53
Visual Analysis Example Case
In the example below I used hypothetical data from hypothetical Team A that is
treated as if the team had undergone the teams training in the full-time MBA program at
the research site institution in the fall of 2014. Table 9 represents the measurements of
Team A’s results on the CATME peer and self-evaluation at every measurement point
over the course of the semester in both the A (baseline) and B (intervention) phases, on
the Contributions to Team dimension.
Table 9
CATME Evaluation Hypothetical Team A Contributions to Team Ratings
Measurement Points Sally Joe Jennifer Sam Steven
1 (A1) 3.2 2.3 3.4 1.5 2.3
2 (A2) 3.1 2.5 3.6 1.6 2.6
3 (A3) 3 2.5 3.5 1.5 2.6
4 (B1) 3.1 2.4 3.6 1.7 2.8
5 (B2) 3.4 2.7 3.8 1.9 3
6 (B3) 3.6 2.9 3.9 2 3.2
7 (B4) 3.8 3.1 4 2.4 3.3
8 (B5) 4 3.3 4 2.7 3.6
For discussion purposes, below I have demonstrated the rules of visual analysis
by using Sally’s scores as an example and display a visual chart analysis of each of the
five teammates (see Figure 3).
54
Figure 3.3. Team A Sally’s Fall 2014 semester hypothetical CATME evaluation results.
Table 10
Applying Sally’s Hypothetical Data to Four Steps of Visual Analysis
Step One Documentation of a predictable baseline pattern: Baseline pattern established.
Step Two Examine data for within-phase patterns: Baseline stabilized, Intervention phase incremental increase in team skills development
Step Three Compare data from each phase: Clear increase in team skills ratings from Phase A to Phase B
Step Four Integrate data from all phases; demonstrate at least three points of an effect: Each Phase B measurement point showed incremental increase between each measurement point.
1 2 3 4 5 6 7 8
Series1 3.2 3.1 3
Series2 3.1 3.4 3.6 3.8 4
2
2.5
3
3.5
4
4.5
5
Team
Ski
lls A
vera
ge P
eer
Rati
ng Sally Contributions to Team

55
Table 11
Applying Sally’s Hypothetical Data to Six Variables Used to Determine Within and Between Phase Data Patterns
Calculated Means Slope Range
Immediacy of the Effect
Overlap of Data Between Phases
Consistency of Data
Student Overall Mean
Phase A (Series 1)
Mean
Phase B (Series 2)
Mean
Phase B (Series 2)
Significant Slope
Between Phase Slope
Highest Data Point - Lowest
Data Point
Change in Level from Phase A (Series 1) to
Phase B (Series 2)
No, Minimal, Moderate, or Significant Yes or No
Sally 3.4 3.1 3.58 0.3 0.1 1 0.267 Minimal Yes

56
Figure 4. Team A Joe’s Fall 2014 semester hypothetical CATME evaluation results.
Figure 5. Team A Jennifer’s Fall 2014 semester hypothetical CATME evaluation results.
1 2 3 4 5 6 7 8
Series1 2.3 2.5 2.5
Series2 2.4 2.7 2.9 3.1 3.3
2
2.5
3
3.5
4
4.5
5
Team
Ski
lls A
vera
ge P
eer
Rati
ng Joe Contributions to Team
1 2 3 4 5 6 7 8
Series1 3.4 3.6 3.5
Series2 3.6 3.8 3.9 4 4
2
2.5
3
3.5
4
4.5
5
Team
Ski
lls A
vera
ge P
eer
Rati
ng Jennifer Contributions to Team
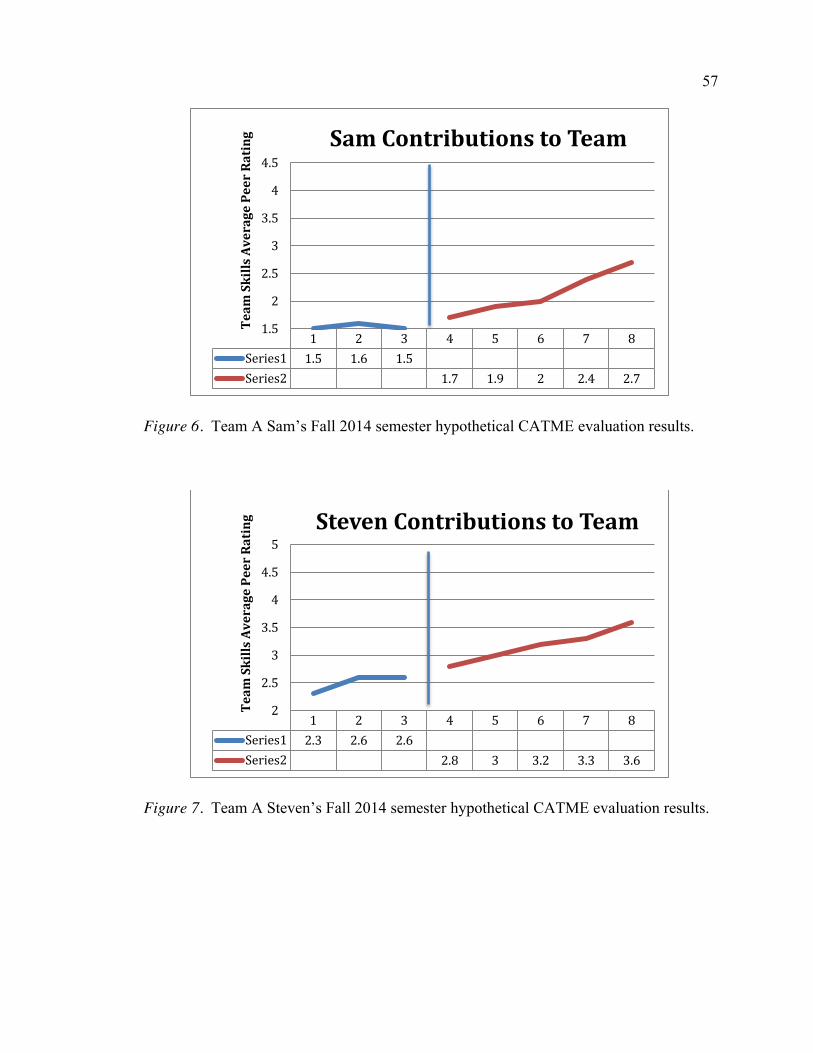
57
Figure 6. Team A Sam’s Fall 2014 semester hypothetical CATME evaluation results.
Figure 7. Team A Steven’s Fall 2014 semester hypothetical CATME evaluation results.
1 2 3 4 5 6 7 8
Series1 1.5 1.6 1.5
Series2 1.7 1.9 2 2.4 2.7
1.5
2
2.5
3
3.5
4
4.5
Team
Ski
lls A
vera
ge P
eer
Rati
ng Sam Contributions to Team
1 2 3 4 5 6 7 8
Series1 2.3 2.6 2.6
Series2 2.8 3 3.2 3.3 3.6
2
2.5
3
3.5
4
4.5
5
Team
Ski
lls A
vera
ge P
eer
Rati
ng Steven Contributions to Team

58
Data Analysis
The data collected from the peer and self-evaluations from the CATME team
dimensions will be numerically and visually analyzed, and examined for causal and
functional relationships. In order to evaluate this data, there will be specific demographic
information considered including ethnicity, gender, months of work experience, and age
of participants.
IRB Approval
An IRB was obtained from the University of Nebraska-Lincoln, and accepted by
the research site institution. Student participants were given research consent forms,
which were completed by all students participating in the study.
Expectations of & Benefits to MBA Student Participants
MBA student participants in this study received several benefits from their
participation in the team skills training and evaluation program. Both the benefits to the
MBA student participants as well as the researcher’s expectations of all student
participants are outlined below. These benefits and expectations were made known to all
students before they decided to opt in or out of the research component of the teams
training program as part of the full-time MBA Professional Development course.
Benefits.
x Monthly raffle held for $50 Target gift card for all participants completing
evaluations required for monthly assessment cycle.
x Received teams training that can be marketed in the MBA internship/job
search process.
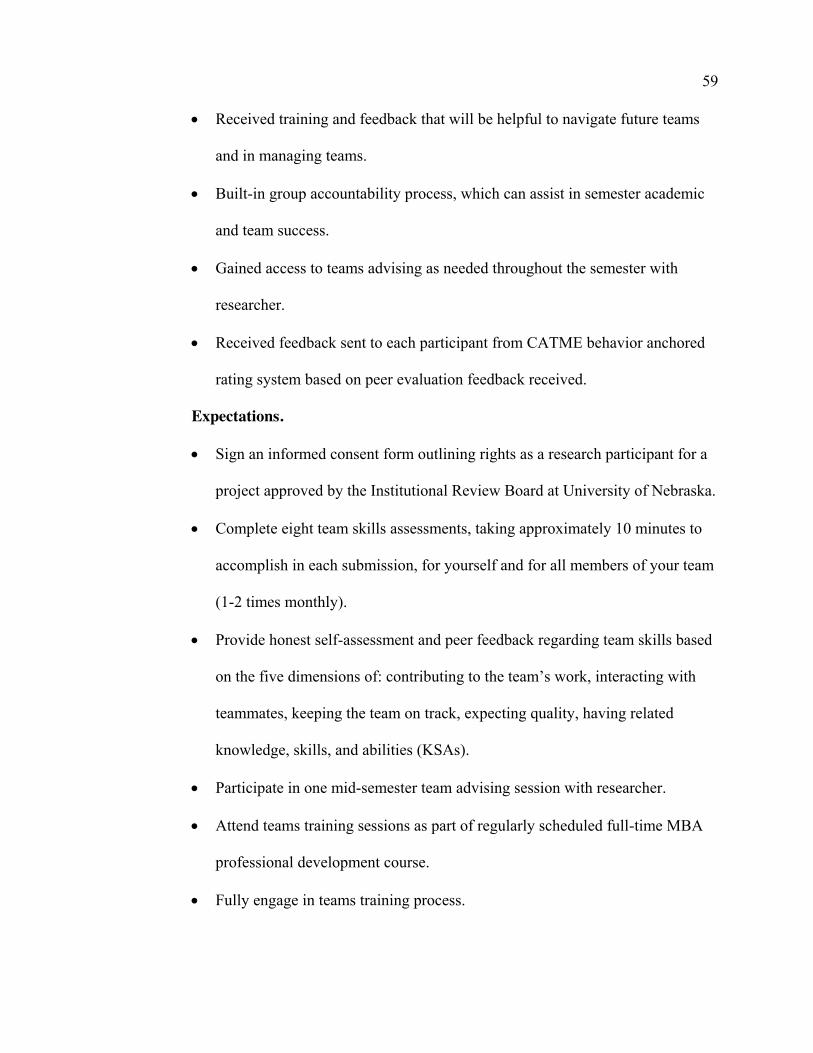
59
x Received training and feedback that will be helpful to navigate future teams
and in managing teams.
x Built-in group accountability process, which can assist in semester academic
and team success.
x Gained access to teams advising as needed throughout the semester with
researcher.
x Received feedback sent to each participant from CATME behavior anchored
rating system based on peer evaluation feedback received.
Expectations.
x Sign an informed consent form outlining rights as a research participant for a
project approved by the Institutional Review Board at University of Nebraska.
x Complete eight team skills assessments, taking approximately 10 minutes to
accomplish in each submission, for yourself and for all members of your team
(1-2 times monthly).
x Provide honest self-assessment and peer feedback regarding team skills based
on the five dimensions of: contributing to the team’s work, interacting with
teammates, keeping the team on track, expecting quality, having related
knowledge, skills, and abilities (KSAs).
x Participate in one mid-semester team advising session with researcher.
x Attend teams training sessions as part of regularly scheduled full-time MBA
professional development course.
x Fully engage in teams training process.
60
Conclusion
This chapter outlines the specific procedures, approach, and methodology that
will be utilized in the proposed teams training based single-case research study. The
single-case research design method and data collection methods were described, as well
as the randomization process used to improve scientific credibility of the study. The
CATME (Comprehensive Assessment of Team Member Effectiveness) was carefully
described and explained. Data analysis practices, including visual analysis of graphed
data, descriptive, and inferential statistics, were reviewed.

61
Chapter 4
Results and Findings
Introduction
The purpose of this mixed methods, quantitative and qualitative single case study
is to explore whether there is evidence that MBA teams training contributes to team skills
development and student team satisfaction in the first semester of a full-time MBA
program in order to improve the overall quality of the student culture in the business
school at a large Midwestern Research I university. This chapter informs the reader on
the results and findings of researching full-time MBA academic teams in the first
semester of a MBA Program. This chapter will start out with a statement of the research
questions as well as an overview of the team intervention activities used in this research
study and brief review of the CATME (Comprehensive Assessment of Team Member
Effectiveness) assessment. The chapter will then continue with giving specific
information regarding the mixed methods research, which was utilized in this diverse
research study. The structure of this chapter highlighting research findings and results
will be based on the primary components of this mixed methods research study. The
complete chapter will focus on the following areas:
x Team Intervention Activities Review
x Comprehensive Assessment of Team Member Effectiveness (CATME)
Review
x Single Case Research Findings
x Team Advising Sessions Findings & Corresponding Team CATME Results
62
x Team Satisfaction Results
x Summary
Team Intervention Activities Review
Over the course of the fall semester, four teams training sessions were conducted
with the full-time MBA program at a large Midwestern Research I university. The four
sessions consisted of the following:
x Marshmallow Challenge Activity (Marshmallow Challenge, n.d.);
x Building a Team Charter Activity (Appendix B: Teams Charter);
x Communication Simulation featuring Place Crash Survival Scenario
(Appendix C: Plane Crash Survival Scenario); and
x The Trouble with Teamwork Article Discussion and Team Activity
(Appendix D: The Trouble With Teamwork).
Topics incorporated into the teams training interventions are built around the 5 CATME
(Comprehensive Assessment of Team Member Effectiveness) team dimensions
(Contributions to Team, Interactions with Team, Keeping the Team on Track, Expecting
Quality, and Having KSA’s) and based on 14 primary teamwork KSA’s (knowledge,
skills, abilities) researched by Chen et al. (2004).
For each activity, one teammate volunteered to be the team observer for that day
of class. The observer designated for each team was given the job of observing and rating
his or her team’s interactions during the day’s activity based on the CATME assessment
behavioral anchors; the same method in which teammates were rating one another
individually on a regular basis. In addition to rating the team’s performance according to

63
the CATME assessment, the team observer for the assigned activity was given the
following three prompts to observe and respond to in a written evaluation:
x Team behaviors observed exhibiting positive team skills.
x Areas observed for team skills and skill development.
x Final comments regarding the activity.
In addition to the evaluations and reflections submitted by the assigned team
observers after each activity, all individual participants completed an assessment and
reflection based on what they experienced during the current team activity. Much like the
observers were asked to do, each participant completed a brief assessment based on
ratings according to each team dimension included in the CATME assessment, and
responded to the following three questions:
x What positive team skills did your team exhibit today?
x What team skills does your team need to develop in order to be a more
effective team?
x Any final comments?
The participants spent a few minutes at the end of each training session evaluating their
team’s work as a whole. Feedback received from these brief assessments focused on
participants giving information based on both their personal growth or thoughts while
completing the given activity, as well as observations and deliberations involving their
teammates.
Comprehensive Assessment of Team Member Effectiveness (CATME)
The CATME (Comprehensive Assessment of Team Member Effectiveness) was
utilized to collect quantitative data from all MBA student participants. For eight
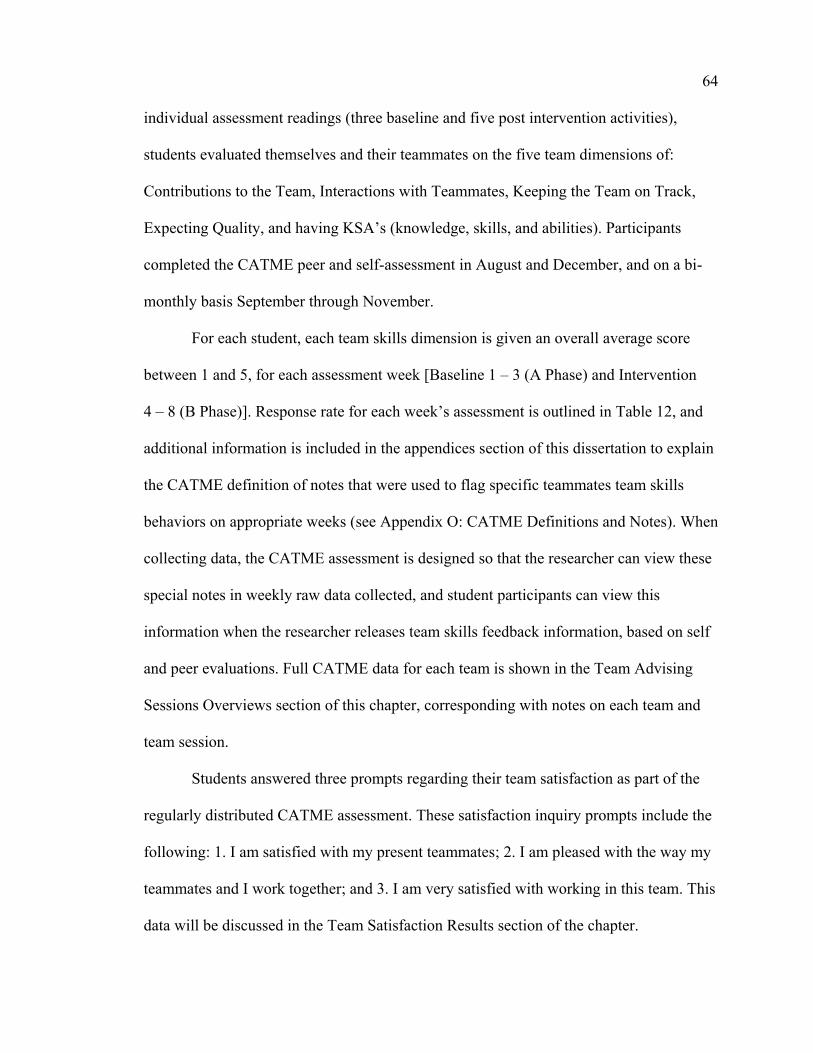
64
individual assessment readings (three baseline and five post intervention activities),
students evaluated themselves and their teammates on the five team dimensions of:
Contributions to the Team, Interactions with Teammates, Keeping the Team on Track,
Expecting Quality, and having KSA’s (knowledge, skills, and abilities). Participants
completed the CATME peer and self-assessment in August and December, and on a bi-
monthly basis September through November.
For each student, each team skills dimension is given an overall average score
between 1 and 5, for each assessment week [Baseline 1 – 3 (A Phase) and Intervention
4 – 8 (B Phase)]. Response rate for each week’s assessment is outlined in Table 12, and
additional information is included in the appendices section of this dissertation to explain
the CATME definition of notes that were used to flag specific teammates team skills
behaviors on appropriate weeks (see Appendix O: CATME Definitions and Notes). When
collecting data, the CATME assessment is designed so that the researcher can view these
special notes in weekly raw data collected, and student participants can view this
information when the researcher releases team skills feedback information, based on self
and peer evaluations. Full CATME data for each team is shown in the Team Advising
Sessions Overviews section of this chapter, corresponding with notes on each team and
team session.
Students answered three prompts regarding their team satisfaction as part of the
regularly distributed CATME assessment. These satisfaction inquiry prompts include the
following: 1. I am satisfied with my present teammates; 2. I am pleased with the way my
teammates and I work together; and 3. I am very satisfied with working in this team. This
data will be discussed in the Team Satisfaction Results section of the chapter.
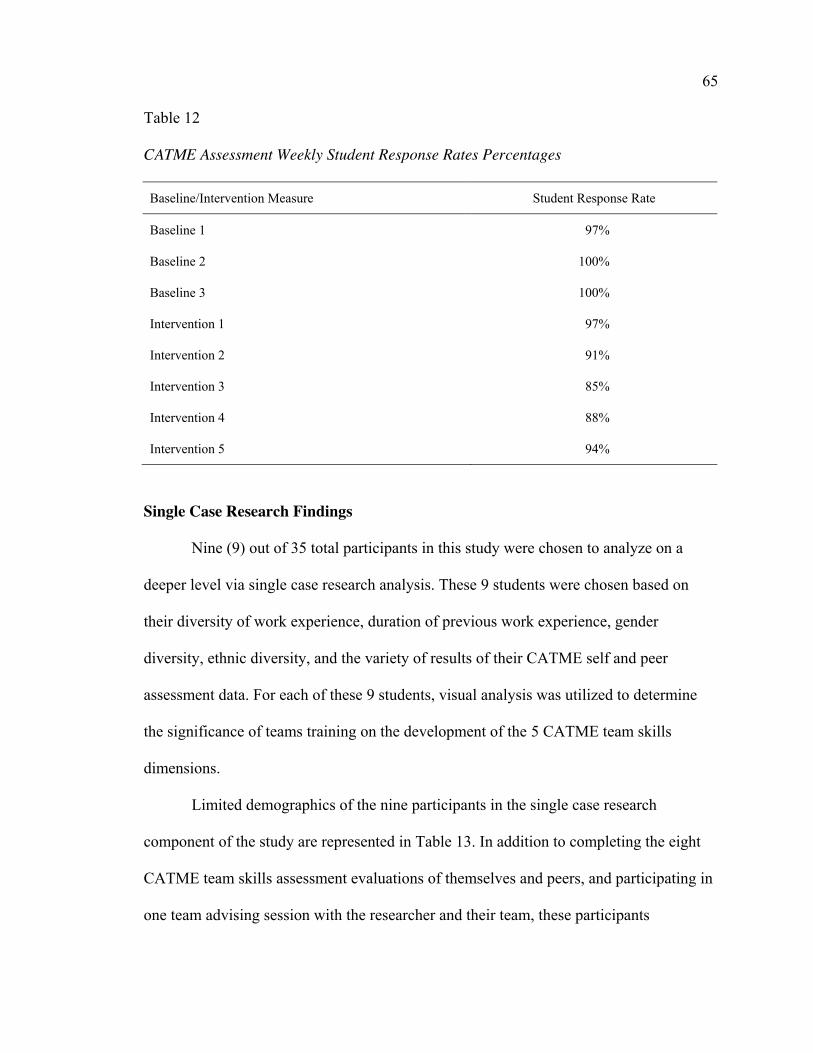
65
Table 12
CATME Assessment Weekly Student Response Rates Percentages
Baseline/Intervention Measure Student Response Rate
Baseline 1 97%
Baseline 2 100%
Baseline 3 100%
Intervention 1 97%
Intervention 2 91%
Intervention 3 85%
Intervention 4 88%
Intervention 5 94%
Single Case Research Findings
Nine (9) out of 35 total participants in this study were chosen to analyze on a
deeper level via single case research analysis. These 9 students were chosen based on
their diversity of work experience, duration of previous work experience, gender
diversity, ethnic diversity, and the variety of results of their CATME self and peer
assessment data. For each of these 9 students, visual analysis was utilized to determine
the significance of teams training on the development of the 5 CATME team skills
dimensions.
Limited demographics of the nine participants in the single case research
component of the study are represented in Table 13. In addition to completing the eight
CATME team skills assessment evaluations of themselves and peers, and participating in
one team advising session with the researcher and their team, these participants
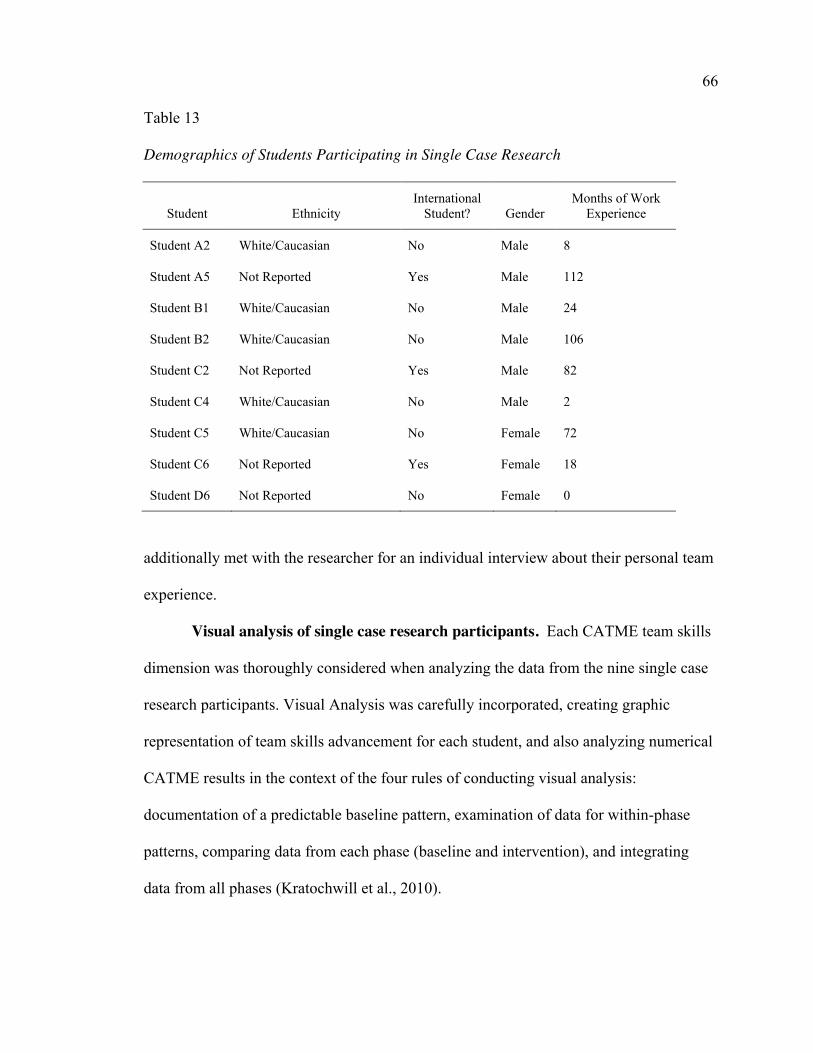
66
Table 13
Demographics of Students Participating in Single Case Research
Student Ethnicity International
Student? Gender Months of Work
Experience
Student A2 White/Caucasian No Male 8
Student A5 Not Reported Yes Male 112
Student B1 White/Caucasian No Male 24
Student B2 White/Caucasian No Male 106
Student C2 Not Reported Yes Male 82
Student C4 White/Caucasian No Male 2
Student C5 White/Caucasian No Female 72
Student C6 Not Reported Yes Female 18
Student D6 Not Reported No Female 0
additionally met with the researcher for an individual interview about their personal team
experience.
Visual analysis of single case research participants. Each CATME team skills
dimension was thoroughly considered when analyzing the data from the nine single case
research participants. Visual Analysis was carefully incorporated, creating graphic
representation of team skills advancement for each student, and also analyzing numerical
CATME results in the context of the four rules of conducting visual analysis:
documentation of a predictable baseline pattern, examination of data for within-phase
patterns, comparing data from each phase (baseline and intervention), and integrating
data from all phases (Kratochwill et al., 2010).

67
Each single case research participant’s data is represented collectively, focused on
the six variables to determine within and between phase data patterns (Kratochwill et al.,
2010). Tables 14 and 15 represent the semester of each single case research participant’s
progress on the dimensions of Keeping the Team on Track and Expecting Quality. Tables
representing results on other CATME team dimensions can be found as an appendix (see
Appendix P: Single Case Research Participants CATME Results Six Variables Visual
Analysis). Additionally, each student’s team skills ratings over the course of the semester
are individually and visually represented based on each of the five CATME team skills
dimensions of contributions to team, interactions with team, keeping team on track,
expecting quality, and having KSA’s, and are represented as appendices (see Appendices
Q-U: Single Case Research Participants Graphed Results).
Focus on Phase A to Phase B mean ratings results in single case research
study. For each of the nine students participating in the single case research component
of the study, the difference of the Phase A mean to Phase B mean was calculated
according to each CATME team dimension. Each number was categorized based on its
significance and coded accordingly. The significance codes and corresponding numbers
range is outlined in Table 16.
Two of the students had a “moderate increase” or higher mean ranking from the A
phase to the B phase of the study on all five team dimensions. Three students had a
“moderate increase” or higher on four of the five team dimensions, and two students had
a “moderate increase” or higher on three of the five team dimensions. The remaining two
students reached a “moderate increase” on two of the five CATME team dimensions
between the A and B phase team skills means of peer ratings.
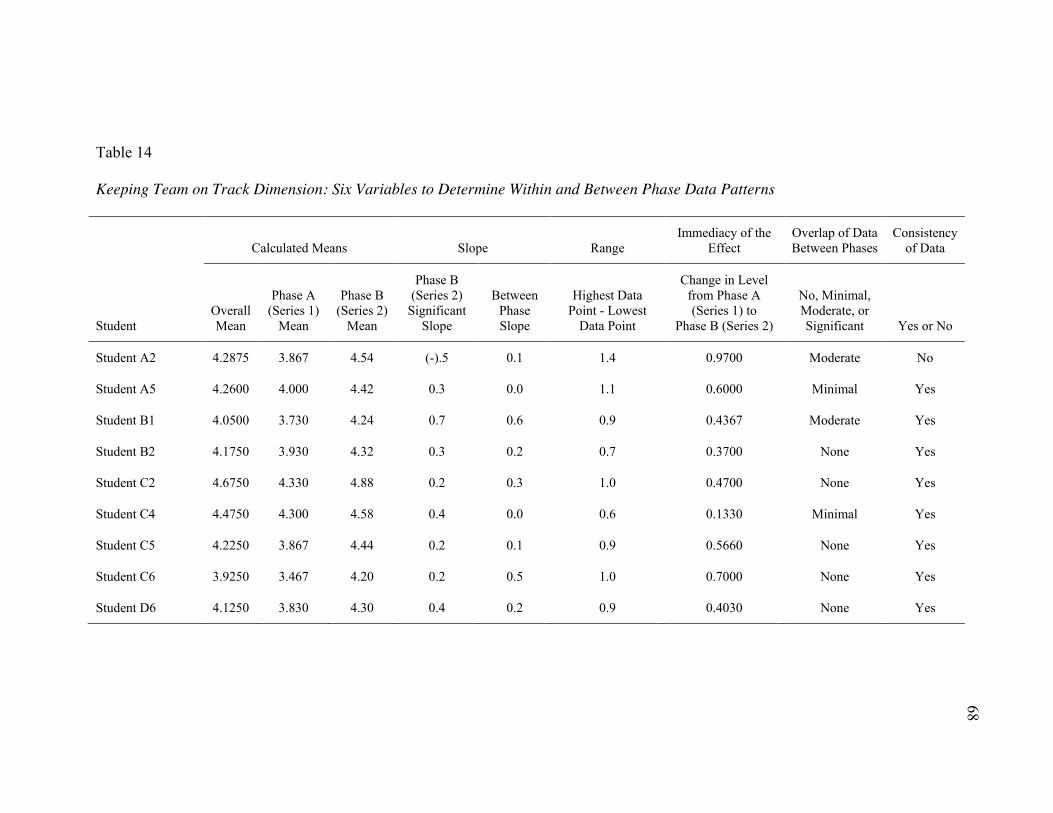
68
Table 14
Keeping Team on Track Dimension: Six Variables to Determine Within and Between Phase Data Patterns
Calculated Means Slope Range
Immediacy of the Effect
Overlap of Data Between Phases
Consistency of Data
Student Overall Mean
Phase A (Series 1)
Mean
Phase B (Series 2)
Mean
Phase B (Series 2)
Significant Slope
Between Phase Slope
Highest Data Point - Lowest
Data Point
Change in Level from Phase A (Series 1) to
Phase B (Series 2)
No, Minimal, Moderate, or Significant Yes or No
Student A2 4.2875 3.867 4.54 (-).5 0.1 1.4 0.9700 Moderate No
Student A5 4.2600 4.000 4.42 0.3 0.0 1.1 0.6000 Minimal Yes
Student B1 4.0500 3.730 4.24 0.7 0.6 0.9 0.4367 Moderate Yes
Student B2 4.1750 3.930 4.32 0.3 0.2 0.7 0.3700 None Yes
Student C2 4.6750 4.330 4.88 0.2 0.3 1.0 0.4700 None Yes
Student C4 4.4750 4.300 4.58 0.4 0.0 0.6 0.1330 Minimal Yes
Student C5 4.2250 3.867 4.44 0.2 0.1 0.9 0.5660 None Yes
Student C6 3.9250 3.467 4.20 0.2 0.5 1.0 0.7000 None Yes
Student D6 4.1250 3.830 4.30 0.4 0.2 0.9 0.4030 None Yes

69
Table 15
Expecting Quality Dimension: Six Variables to Determine Within and Between Phase Data Patterns
Calculated Means Slope Range
Immediacy of the Effect
Overlap of Data Between Phases
Consistency of Data
Student Overall Mean
Phase A (Series 1)
Mean
Phase B (Series 2)
Mean
Phase B (Series 2)
Significant Slope
Between Phase Slope
Highest Data Point - Lowest
Data Point
Change in Level from Phase A (Series 1) to
Phase B (Series 2)
No, Minimal, Moderate, or Significant Yes or No
Student A2 4.390 4.230 4.48 0.1 0.2 0.5 0.2370 Moderate Yes
Student A5 4.460 4.300 4.56 0.2 0.2 0.4 0.2330 None Yes
Student B1 4.000 3.670 4.20 0.5 0.6 1.1 0.4967 None Yes
Student B2 4.100 3.800 4.28 0.4 0.2 0.9 0.5000 None Yes
Student C2 4.513 4.167 4.72 0.5 0.1 1.0 0.4330 None Yes
Student C4 4.475 4.300 4.58 0.2 0.5 0.8 0.3670 None Yes
Student C5 4.438 4.367 4.48 0.4 0.1 0.5 0.1330 Moderate Yes
Student C6 4.210 3.867 4.42 0.2 0.2 0.9 0.4000 Minimal Yes
Student D6 4.300 4.100 4.42 0.6 0.4 0.8 0.2670 Minimal Yes
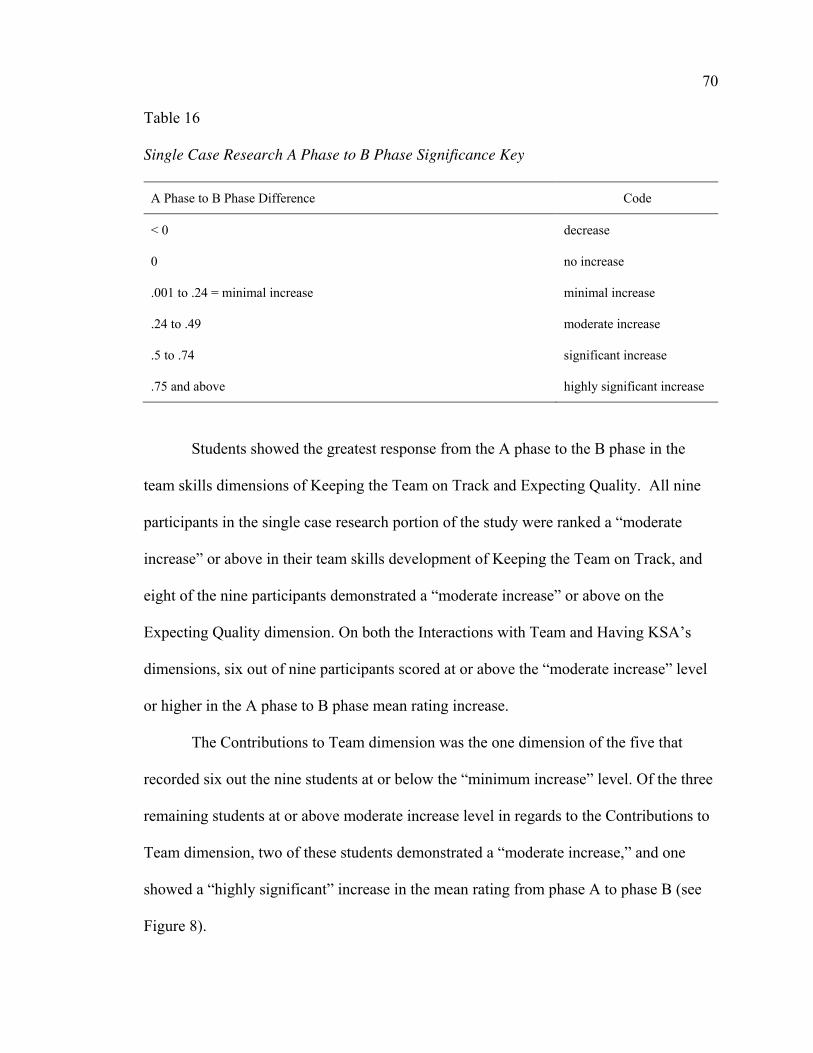
70
Table 16
Single Case Research A Phase to B Phase Significance Key
A Phase to B Phase Difference Code
< 0 decrease
0 no increase
.001 to .24 = minimal increase minimal increase
.24 to .49 moderate increase
.5 to .74 significant increase
.75 and above highly significant increase
Students showed the greatest response from the A phase to the B phase in the
team skills dimensions of Keeping the Team on Track and Expecting Quality. All nine
participants in the single case research portion of the study were ranked a “moderate
increase” or above in their team skills development of Keeping the Team on Track, and
eight of the nine participants demonstrated a “moderate increase” or above on the
Expecting Quality dimension. On both the Interactions with Team and Having KSA’s
dimensions, six out of nine participants scored at or above the “moderate increase” level
or higher in the A phase to B phase mean rating increase.
The Contributions to Team dimension was the one dimension of the five that
recorded six out the nine students at or below the “minimum increase” level. Of the three
remaining students at or above moderate increase level in regards to the Contributions to
Team dimension, two of these students demonstrated a “moderate increase,” and one
showed a “highly significant” increase in the mean rating from phase A to phase B (see
Figure 8).

71
Figure 8. Number of single case research design participants demonstrating
improvement at moderate or above on CATME team dimensions.
Also notable, when examining the individual students included in the single case
research, are the patterns that clustered around work experience. Students with less than
six months work experience only showed growth at a moderate level or above on two of
the five CATME team dimensions, and students that had two to seven years work
experience only showed moderate or above growth on three of the five CATME team
dimensions. Students however with six months to two years work experience, and those
with eight to ten years of work experience, demonstrated growth on four to five team
dimensions (see Figure 9).
Table 17 gives a detailed look into each student’s numerical increase or decrease
in their A phase to B phase average rating for each of the five CATME team dimensions
of Contributions to Team, Interactions with Team, Keeping Team on Track, Expecting
3
6
9 8
6
Contributionsto Team
Interactionswith Team
Keeping Teamon Track
ExpectingQuality
Having KSAs
Number of Single Case Research Participants Demonstrating A Phase to B Phase Improvement at
Moderate Level or Above On CATME Team Dimensions
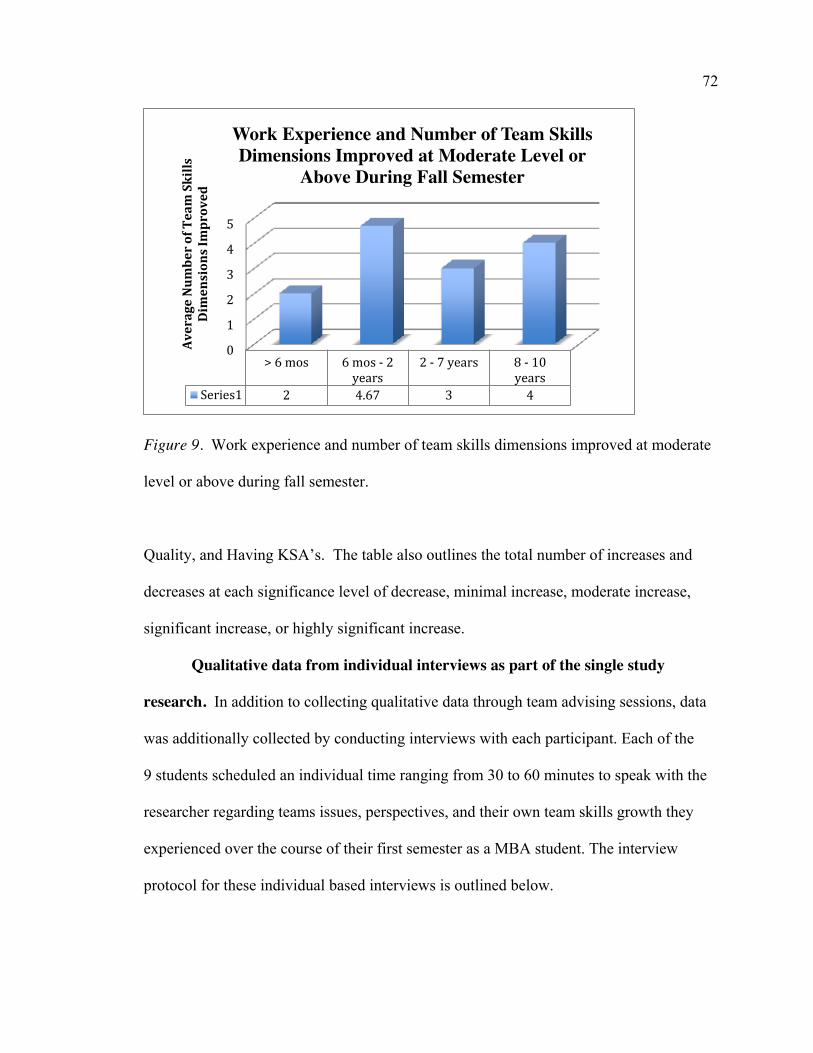
72
Figure 9. Work experience and number of team skills dimensions improved at moderate
level or above during fall semester.
Quality, and Having KSA’s. The table also outlines the total number of increases and
decreases at each significance level of decrease, minimal increase, moderate increase,
significant increase, or highly significant increase.
Qualitative data from individual interviews as part of the single study
research. In addition to collecting qualitative data through team advising sessions, data
was additionally collected by conducting interviews with each participant. Each of the
9 students scheduled an individual time ranging from 30 to 60 minutes to speak with the
researcher regarding teams issues, perspectives, and their own team skills growth they
experienced over the course of their first semester as a MBA student. The interview
protocol for these individual based interviews is outlined below.
0
1
2
3
4
5
> 6 mos 6 mos - 2years
2 - 7 years 8 - 10years
Series1 2 4.67 3 4
Aver
age
Num
ber o
f Tea
m S
kills
D
imen
sion
s Im
prov
ed
Work Experience and Number of Team Skills Dimensions Improved at Moderate Level or
Above During Fall Semester

73
Table 17
Phase A to Phase B Difference Between Means
Student Contributions to Team Interactions with Team Keeping Team on Track Expecting Quality Having KSAs
Student A2 (-).03 = Decrease .87 = highly significant increase
.673 = significant increase .25 = moderate increase .45 = moderate increase
Student A5 .133 = minimal increase .8 = highly significant increase
.42 = moderate increase .26 = moderate increase .333 = moderate increase
Student B1 .44 = moderate increase .43 = moderate increase .51 = significant increase .53 = significant increase
.413 = moderate increase
Student B2 .293 = minimal increase .35 = moderate increase .39 = moderate increase .48 = moderate increase .293 = moderate increase
Student C2 .18 = minimal increase .47 = moderate increase .55 = significant increase .553 = significant increase
(-).047 = decrease
Student C4 .15 = minimal increase .06 = minimal increase .28 = moderate increase .28 = moderate increase (-).13 = decrease
Student C5 .453 = moderate increase (-).08 = decrease .573 = significant increase .113 = minimal increase .52 = significant increase
Student C6 .893 = highly significant increase
.5 = significant increase .733 = significant increase .553 = significant increase
.39 = moderate increase
Student D6 .133 = minimal increase (-).007 = decrease .47 = moderate increase .32 = moderate increase (-).047 = decrease
Table 17 continues

74
Student Contributions to Team Interactions with Team Keeping Team on Track Expecting Quality Having KSAs
# of Highly Significant Increases
1 2 0 0 0
# of Significant Increases
0 1 5 3 1
# of Moderate Increases
2 3 4 5 5
# of Minimal Increases
5 1 0 1 0
# of Decreases 1 2 0 0 3

75
Individual teammates interview protocol.
x Scores Overview and Discussion
x Regarding CATME Peer and Self Evaluations:
o Do you perceive that you have improved your team skills over the course
of the semester?
o If so, why do you think this is/to what do you attribute your improvement
in teamwork?
o Are your CATME scores reflective of your experience?
x What value have the teams training sessions had for you personally?
o Did your team incorporate any of the lessons or tips from the teams
training sessions into your interactions?
o Were any of the team sessions particularly helpful?
x What are some of the team skills lessons you learned over the course of the
semester?
x Would these sessions be best in the orientation format, or over the course of
the semester?
o Any suggestions for future teams training sessions?
Individual interviews - Teams training & skills development perspectives
from single case research students.
Student A2. Student A2 worked for eight months in the finance industry prior to
returning to school to pursue his MBA education. According to phase A to phase B
average ratings data comparisons, student A2 achieved a highly significant increase on
the Interactions with Team CATME dimension, a significant increase in ratings on the
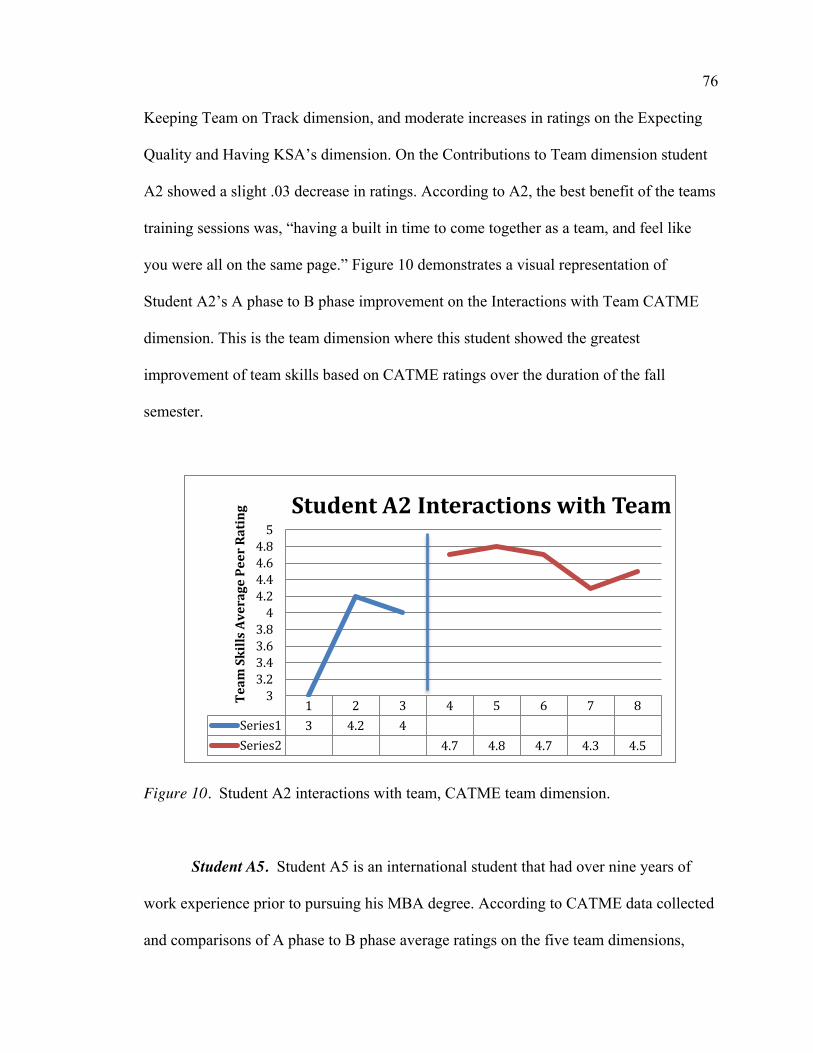
76
Keeping Team on Track dimension, and moderate increases in ratings on the Expecting
Quality and Having KSA’s dimension. On the Contributions to Team dimension student
A2 showed a slight .03 decrease in ratings. According to A2, the best benefit of the teams
training sessions was, “having a built in time to come together as a team, and feel like
you were all on the same page.” Figure 10 demonstrates a visual representation of
Student A2’s A phase to B phase improvement on the Interactions with Team CATME
dimension. This is the team dimension where this student showed the greatest
improvement of team skills based on CATME ratings over the duration of the fall
semester.
Figure 10. Student A2 interactions with team, CATME team dimension.
Student A5. Student A5 is an international student that had over nine years of
work experience prior to pursuing his MBA degree. According to CATME data collected
and comparisons of A phase to B phase average ratings on the five team dimensions,
1 2 3 4 5 6 7 8
Series1 3 4.2 4
Series2 4.7 4.8 4.7 4.3 4.5
33.23.43.63.8
44.24.44.64.8
5
Team
Ski
lls A
vera
ge P
eer
Rati
ng Student A2 Interactions with Team

77
student A5 showed a highly significant increase on the Interactions with Team
dimension, moderate increases on the Keeping Team on Track, Expecting Quality, and
Having KSA’s dimensions, and a minimal increase on the Contributions to Team
dimension. When asked if he agrees that his team skills have improved over the course of
the semester, he says that he is not convinced that his team skills have improved, but
thinks that his teammates had lower expectations coming into the team since he was an
international student and that he started at a “lower baseline” than his teammates. Team
actions he personally practiced over the course of the semester were being receptive to
others’ perspectives, encouraging others to state their ideas, not being too harsh,
admitting mistakes, and keeping a good attitude. He appreciated the teams training
sessions because according to him, these activities encouraged everyone to speak up and
have their perspectives he heard. He additionally mentioned that his international heritage
and experience brought a decreased sense of prejudice to the team, and that planning
ahead is incredibly important in teamwork. Figure 11 demonstrates a visual
representation of Student A5’s A phase to B phase improvement on the Interactions with
Team CATME dimension. This is the team dimension where this student showed the
greatest improvement of team skills based on CATME ratings over the duration of the
fall semester.
Student B1. Student B1 improved his team skills rating significantly on the
Keeping Team on Track and Expecting Quality CATME dimensions, and moderately
improved ratings on the remaining dimensions of Contributions to Team, Interactions
with Team, and Having KSA’s. Having worked full-time for two years, he returned to

78
Figure 11. Student A5 interactions with team, CATME team dimension.
receive graduation business education towards a MBA degree. Student B1 agrees with
the ratings, that his team skills have improved over the semester. According to him, peers
start the semester grading one another more difficultly, but being more generous with
scores as peers prove themselves to teammates, and do good work. For him, the best
thing about the team sessions was that they gave the teams the forced opportunity to get
together as a team, learn about one another, and see how teammates and others in the
cohort think differently and the same as himself. Figure 12 demonstrates a visual
representation of Student B1’s A phase to B phase improvement on the Expecting
Quality CATME dimension. This is the team dimension where this student showed the
greatest improvement of team skills based on CATME ratings over the duration of the
fall semester.
1 2 3 4 5 6 7 8
Series1 3.5 3.3 4
Series2 4.2 4.6 4.5 4.2 4.5
33.23.43.63.8
44.24.44.64.8
5
Team
Ski
lls A
vera
ge P
eer
Rati
ng
Student A5 Interactions with Team
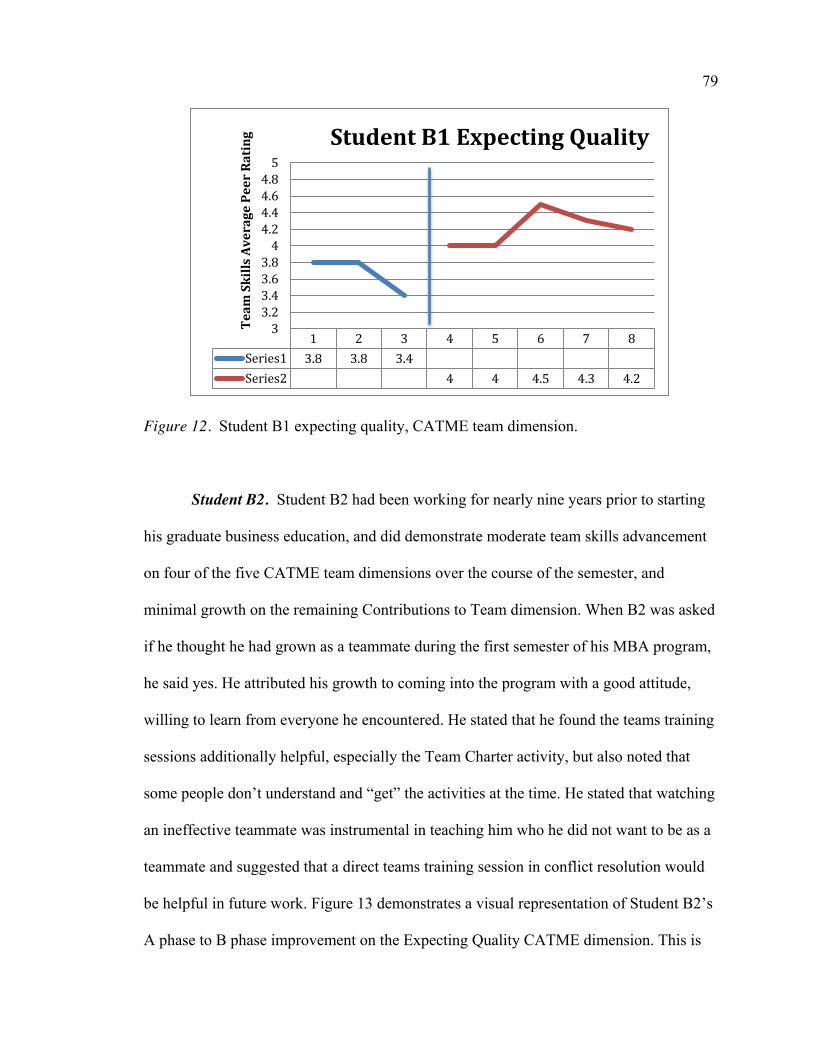
79
Figure 12. Student B1 expecting quality, CATME team dimension.
Student B2. Student B2 had been working for nearly nine years prior to starting
his graduate business education, and did demonstrate moderate team skills advancement
on four of the five CATME team dimensions over the course of the semester, and
minimal growth on the remaining Contributions to Team dimension. When B2 was asked
if he thought he had grown as a teammate during the first semester of his MBA program,
he said yes. He attributed his growth to coming into the program with a good attitude,
willing to learn from everyone he encountered. He stated that he found the teams training
sessions additionally helpful, especially the Team Charter activity, but also noted that
some people don’t understand and “get” the activities at the time. He stated that watching
an ineffective teammate was instrumental in teaching him who he did not want to be as a
teammate and suggested that a direct teams training session in conflict resolution would
be helpful in future work. Figure 13 demonstrates a visual representation of Student B2’s
A phase to B phase improvement on the Expecting Quality CATME dimension. This is
1 2 3 4 5 6 7 8
Series1 3.8 3.8 3.4
Series2 4 4 4.5 4.3 4.2
33.23.43.63.8
44.24.44.64.8
5
Team
Ski
lls A
vera
ge P
eer
Rati
ng Student B1 Expecting Quality

80
Figure 13. Student B2 expecting quality, CATME team dimension.
the team dimension where this student showed the greatest improvement of team skills
based on CATME ratings over the duration of the fall semester.
Student C2. As an international student, Student C2 mentioned in his individual
interview that due to cultural barriers, he was unsure at first how to act on his team. He
said, “I feel because of cultural differences I was not able to connect with teammates that
well. There were several instances where I was not sure how my teammates will see my
actions.” This student however received consistently strong CATME assessment peer
ratings.
When asked about the value of the teams training sessions, Student C2 stated,
“with the training sessions [team practices] became more formal and we openly discussed
and documented the practices to be followed in our team.” He also mentioned that he
particularly enjoyed the Marshmallow Challenge activity because that one session
“covered most aspects of teamwork.” Some of the most valuable teamwork lessons that
1 2 3 4 5 6 7 8
Series1 3.6 4 3.8
Series2 4 4.4 4.5 4.3 4.2
33.23.43.63.8
44.24.44.64.8
5
Team
Ski
lls A
vera
ge P
eer
Rati
ng Student B2 Expecting Quality

81
Student C2 gained during the fall semester include the significance of clear and timely
communication, and the importance of helping others on the team when needed.
Figures 14 and 15 demonstrate visual representations of Student C2’s A phase to
B phase improvement on the Keeping Team on Track and Expecting Quality CATME
dimensions. These are the team dimensions where this student showed the greatest
improvement of team skills based on CATME ratings over the duration of the fall
semester, at the same number of increase.
Figure 14. Student C2 keeping team on track, CATME team dimension.
1 2 3 4 5 6 7 8
Series1 4 4.5 4.5
Series2 4.8 4.8 4.8 5 5
33.23.43.63.8
44.24.44.64.8
5
Team
Ski
lls A
vera
ge P
eer
Rati
ng
Student C2 Keeping Team on Track

82
Figure 15. Student C2 expecting quality, CATME team dimension.
Student C4. Student C4 only had two months of work experience before starting
his MBA educational pursuits. Out of the five CATME team dimensions, he showed
moderate team skills growth on the Keeping Team on Track and Expecting Quality
dimensions. On the dimensions of Contributions to Team and Interactions with Team he
demonstrated minimal increase in peer ratings of team scores, and on the dimension of
Having Knowledge, Skills and Abilities, his A phase to B phase average rating decreased
by .13. As a former student athlete, he stated that he was more prepared to handle conflict
than some of his teammates, and since he had to learn excellent time management skills
from his student athlete experience, stressful situations do not faze him. In regards to
lessons he learned on his team over the course of the semester, he said, “It is important to
be proactive in helping others on the team. Ask if they need help, don’t necessarily wait
for them to ask for help if you know they may need it.” Figures 16 and 17 demonstrate
visual representations of Student C4’s A phase to B phase improvement on the Keeping
1 2 3 4 5 6 7 8
Series1 4 4.3 4.2
Series2 4.3 4.8 4.7 4.8 5
33.23.43.63.8
44.24.44.64.8
5
Team
Ski
lls A
vera
ge P
eer
Rati
ng Student C2 Expecting Quality

83
Figure 16. Student C4 keeping team on track, CATME team dimension.
Figure 17. Student C4 expecting quality, CATME team dimension.
1 2 3 4 5 6 7 8
Series1 4.4 4.2 4.3
Series2 4.3 4.3 4.7 4.8 4.8
33.23.43.63.8
44.24.44.64.8
5
Team
Ski
lls A
vera
ge P
eer
Rati
ng Student C4 Keeping Team on Track
1 2 3 4 5 6 7 8
Series1 4.4 4.2 4
Series2 4.5 4.5 4.7 4.8 4.7
33.23.43.63.8
44.24.44.64.8
5
Team
Ski
lls A
vera
ge P
eer
Rati
ng Student C4 Expecting Quality
84
Team on Track and Expecting Quality CATME dimensions. These are the team
dimensions where this student showed the greatest improvement of team skills based on
CATME ratings over the duration of the fall semester, at the exact same number of
increase.
Student C5. Student C5 stated that she came into the program underconfident,
and that her team skills did improve over the course of the semester. According to the
CATME, her team skills significantly increased on the Keeping the Team on Track and
Having KSA’s dimensions, and moderately increased on the Contributions to Team
dimension. In addition to asserting that the Team Charter activity was very helpful in
setting expectations for her group and the most impactful teams training session, she also
mentioned that building trust and relationships was crucial in her personal team success
throughout the semester. Figure 18 demonstrates a visual representation of Student C5’s
A phase to B phase improvement on the Keeping Team on Track CATME dimension.
This is the team dimension where this student showed the greatest improvement of team
skills based on CATME ratings over the duration of the fall semester.
Student C6. Student C6 is an international student, and as a result she sees this as
having impacted her team experience as well as the ways in which her teammates viewed
her. She stated that the Communication Simulation was a helpful learning experience for
her, and started her to think about assumptions on her team and in her cohort, and how
everyone can look at the same situation and think very differently. On every CATME
team dimension except for Having KSA’s, student C6 demonstrated significant increases
in ratings, and on the Having KSA’s dimensions, she showed a moderate increase. She
said that over the course of the semester she learned that, “you make yourself a team

85
Figure 18. Student C5 keeping team on track, CATME team dimension.
member,” and in order to make yourself part of the group, you have to commit yourself
as teammate. Reluctant at first to get involved, after getting to know teammates, she was
able to work effectively with her team by utilizing lessons learned in the teams training
sessions, and interpersonal lessons learned by working with teammates. Figure 19
demonstrates a visual representation of Student C6’s A phase to B phase improvement on
the Contributions to Team CATME dimension. This is the team dimension where this
student showed the greatest improvement of team skills based on CATME ratings over
the duration of the fall semester.
Student D6. Student D6 is a dual Engineering and MBA student. Because of her
prior academic experience in the College of Engineering, she is used to working on
teams, but noted in our conversation that there is a distinct difference between teams in
the College of Engineering and teams in the College of Business. She stated that on her
1 2 3 4 5 6 7 8
Series1 3.6 3.8 4.2
Series2 4.3 4.5 4.5 4.4 4.5
33.23.43.63.8
44.24.44.64.8
5
Team
Ski
lls A
vera
ge P
eer
Rati
ng Student C5 Keeping Team on Track

86
Figure 19. Student C6 contributions to the team, CATME team dimension.
Engineering academic teams, they truly do operate more as a unified entity. MBA teams,
according to Student D6 operate more as a work group with a divide and conquer
mentality.
Student D6 does think that she grew as a teammate and improved her team skills
over the duration of the fall semester, but she also mentions that she was on a well
functioning, “good” team, and that sometimes being on a comfortable, functioning team
does not create as many opportunities for growth. Although she recollects that of all the
team training sessions, the Team Charter activity was the most useful, she personally
enjoyed the Marshmallow Challenge activity the most. She added that the Marshmallow
Challenge was a “fun way to interact with a team” and that she and her team worked well
together during this challenge because they communicated well. Considering important
team lessons that Student D6 learned in the fall semester, being on a high functioning
1 2 3 4 5 6 7 8
Series1 3.2 3.7 3.5
Series2 4.3 4.2 4.2 4.6 4.5
33.23.43.63.8
44.24.44.64.8
5
Team
Ski
lls A
vera
ge P
eer
Rati
ng Student C6 Contributions to Team

87
team taught her to relax and trust her teammates, while also making her more open to
learning from others.
In regards to the CATME assessments that were completed, Student D6
mentioned that she thought that this added an extra element of accountability into the
MBA academic teams process. Figure 20 demonstrates a visual representation of Student
D6’s A phase to B phase improvement on the Keeping Team on Track CATME
dimension. This is the team dimension where this student showed the greatest
improvement of team skills based on CATME ratings over the duration of the fall
semester.
Figure 20. Student D6 keeping team on track, CATME team dimension.
1 2 3 4 5 6 7 8
Series1 3.7 3.8 4
Series2 4.2 4.3 4.2 4.2 4.6
33.23.43.63.8
44.24.44.64.8
5
Team
Ski
lls A
vera
ge P
eer
Rati
ng Student D6 Keeping Team on Track
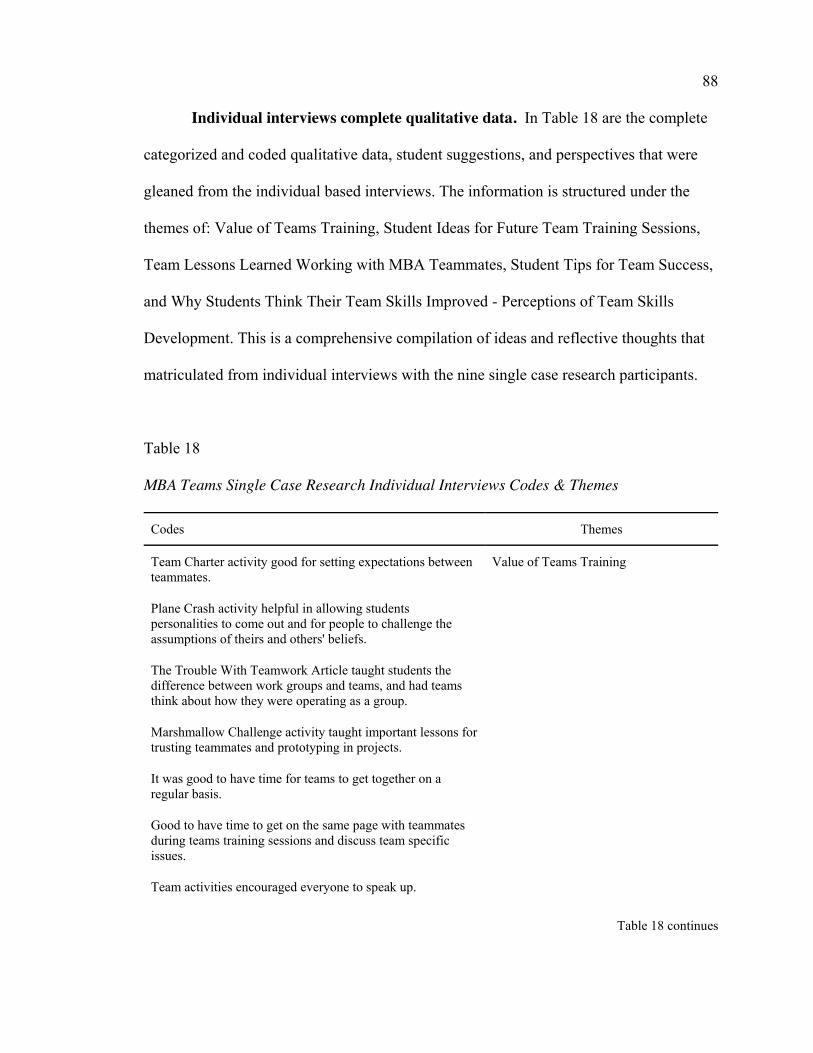
88
Individual interviews complete qualitative data. In Table 18 are the complete
categorized and coded qualitative data, student suggestions, and perspectives that were
gleaned from the individual based interviews. The information is structured under the
themes of: Value of Teams Training, Student Ideas for Future Team Training Sessions,
Team Lessons Learned Working with MBA Teammates, Student Tips for Team Success,
and Why Students Think Their Team Skills Improved - Perceptions of Team Skills
Development. This is a comprehensive compilation of ideas and reflective thoughts that
matriculated from individual interviews with the nine single case research participants.
Table 18
MBA Teams Single Case Research Individual Interviews Codes & Themes
Codes Themes
Team Charter activity good for setting expectations between teammates.
Value of Teams Training
Plane Crash activity helpful in allowing students personalities to come out and for people to challenge the assumptions of theirs and others' beliefs.
The Trouble With Teamwork Article taught students the difference between work groups and teams, and had teams think about how they were operating as a group.
Marshmallow Challenge activity taught important lessons for trusting teammates and prototyping in projects.
It was good to have time for teams to get together on a regular basis.
Good to have time to get on the same page with teammates during teams training sessions and discuss team specific issues.
Team activities encouraged everyone to speak up.
Table 18 continues
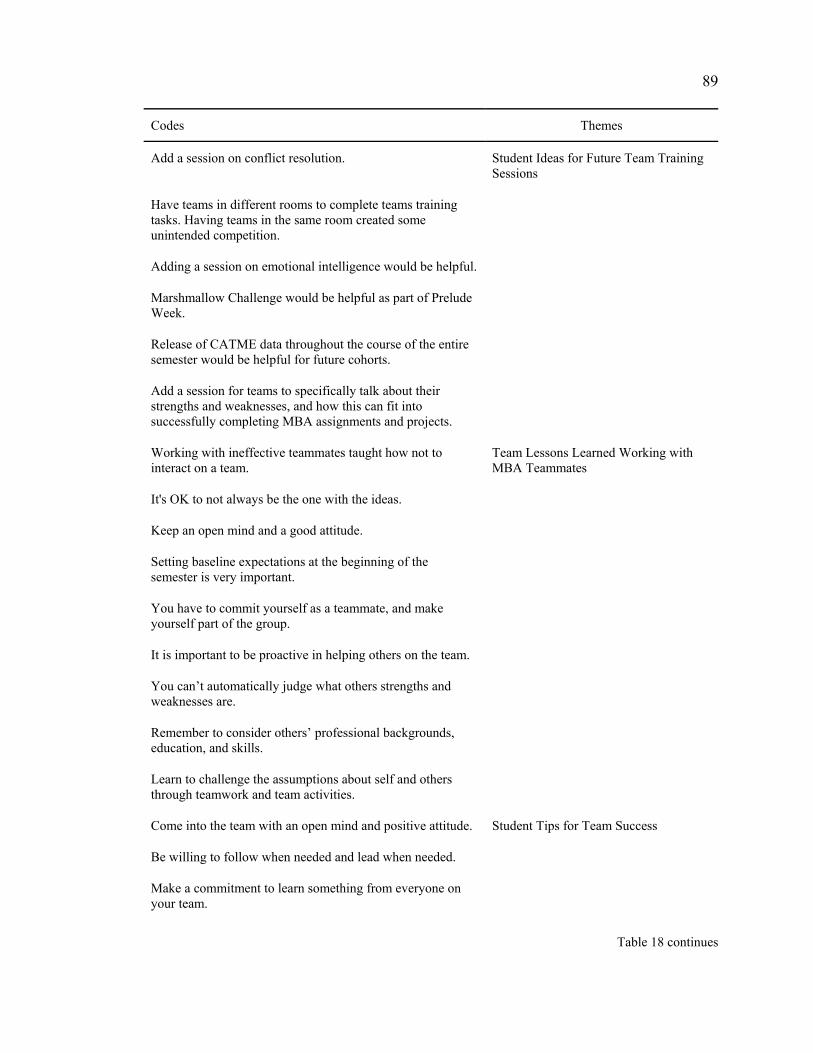
89
Codes Themes
Add a session on conflict resolution. Student Ideas for Future Team Training Sessions
Have teams in different rooms to complete teams training tasks. Having teams in the same room created some unintended competition.
Adding a session on emotional intelligence would be helpful.
Marshmallow Challenge would be helpful as part of Prelude Week.
Release of CATME data throughout the course of the entire semester would be helpful for future cohorts.
Add a session for teams to specifically talk about their strengths and weaknesses, and how this can fit into successfully completing MBA assignments and projects.
Working with ineffective teammates taught how not to interact on a team.
Team Lessons Learned Working with MBA Teammates
It's OK to not always be the one with the ideas.
Keep an open mind and a good attitude.
Setting baseline expectations at the beginning of the semester is very important.
You have to commit yourself as a teammate, and make yourself part of the group.
It is important to be proactive in helping others on the team.
You can’t automatically judge what others strengths and weaknesses are.
Remember to consider others’ professional backgrounds, education, and skills.
Learn to challenge the assumptions about self and others through teamwork and team activities.
Come into the team with an open mind and positive attitude. Student Tips for Team Success
Be willing to follow when needed and lead when needed.
Make a commitment to learn something from everyone on your team.
Table 18 continues

90
Codes Themes
Remain calm and focused. Student Tips for Team Success (cont’d)
Good communication is key in teamwork.
Set expectations early.
Teams Training Sessions, particularly the Team Charter activity.
Why Students Think Their Team Skills Improved - Perceptions of Team Skills Development
Coming into the program and starting on new team with a good attitude.
Previous knowledge of and experiences working on teams.
Knowledge of effective communication techniques.
International students mentioned that team may have ranked them lower at the beginning of the semester based on their negative international students stereotypes, then ranked them higher as the semester went on based on them demonstrating their abilities.
Taking time to know and understand teammates.
Concluding thoughts from individual interviews. In the individual
conversations with first year full-time MBA students it was discussed that the teams
training sessions did have an impact on and contribute to individual team skills
development and team success. The session that was mentioned most frequently in
making a significant impact was the Team Charter session. Other sessions mentioned for
their assistance with various team issues include the Plane Crash Communication
Simulation for its importance of revealing different assumptions and perspectives
between teammates, the Marshmallow Challenge session mentioned for its explanation of
the importance of prototyping in teamwork, and the Trouble With Teamwork article
discussion session for challenging students to think through whether they were operating
as a work group or a team. Unanticipated benefits of the team sessions that were

91
mentioned by multiple students in the individual interviews was that the teams training
sessions allowed students to come together as a team to have a regular time to “get on the
same page as a team” and “encouraged students that may not normally voice their
opinions to speak up.” The individual interviews also revealed factors other than teams
training session that may have contributed to team skills development. These influences
include amount of work experience prior to pursuing graduate business education, student
attitude, prior experiences on teams, and socialization as a team.
Team Advising Sessions Findings & Complete CATME Results
Half way through the semester, team advising sessions were conducted with the
six first year, full-time MBA academic teams. The team advising sessions were
conducted in a focus group format and the sessions were used to clarify student
perspectives on the team and MBA experience. Below are the questions that were asked
in the teams advising group process, and qualitative information gathering sessions.
Team advising session protocol questions.
x What specific issues have you encountered on your team?
x In what ways do issues arising on MBA Teams impact the overall student
culture?
x Have you received helpful tools from MBA program student services and/or
the teams training program to assist in navigating issues that have arisen on
your teams?
o What tools have you received that have been most helpful to you and your
team?
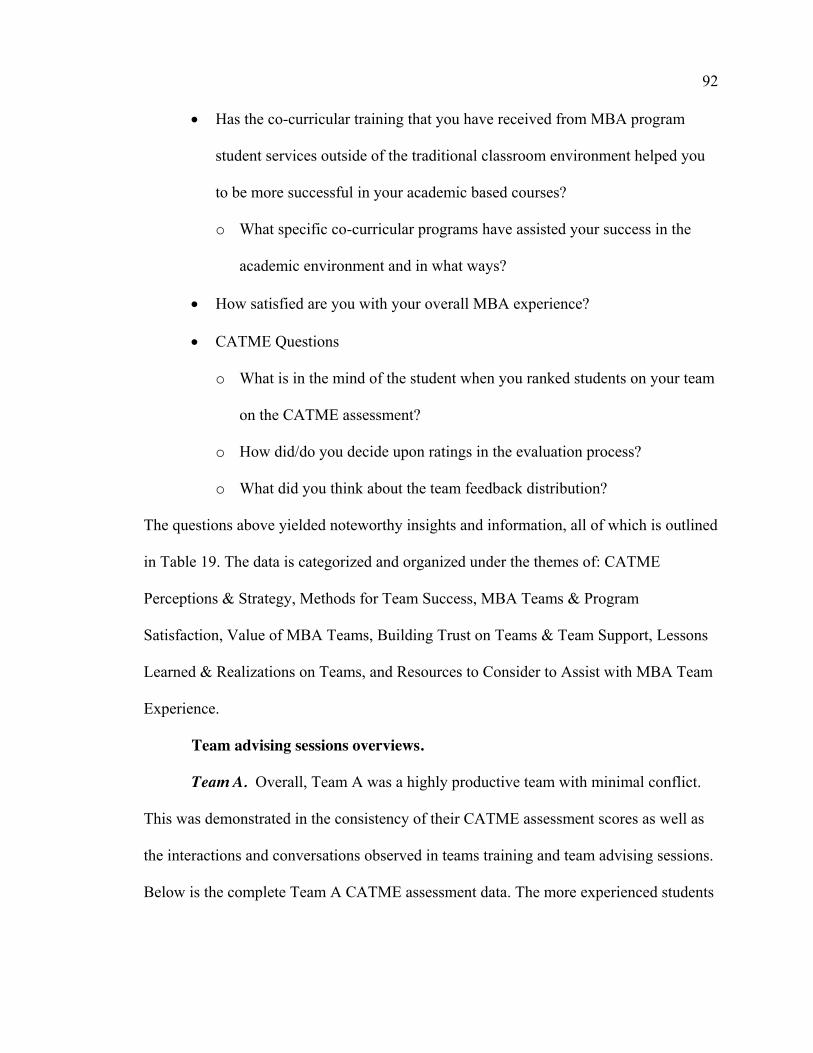
92
x Has the co-curricular training that you have received from MBA program
student services outside of the traditional classroom environment helped you
to be more successful in your academic based courses?
o What specific co-curricular programs have assisted your success in the
academic environment and in what ways?
x How satisfied are you with your overall MBA experience?
x CATME Questions
o What is in the mind of the student when you ranked students on your team
on the CATME assessment?
o How did/do you decide upon ratings in the evaluation process?
o What did you think about the team feedback distribution?
The questions above yielded noteworthy insights and information, all of which is outlined
in Table 19. The data is categorized and organized under the themes of: CATME
Perceptions & Strategy, Methods for Team Success, MBA Teams & Program
Satisfaction, Value of MBA Teams, Building Trust on Teams & Team Support, Lessons
Learned & Realizations on Teams, and Resources to Consider to Assist with MBA Team
Experience.
Team advising sessions overviews.
Team A. Overall, Team A was a highly productive team with minimal conflict.
This was demonstrated in the consistency of their CATME assessment scores as well as
the interactions and conversations observed in teams training and team advising sessions.
Below is the complete Team A CATME assessment data. The more experienced students
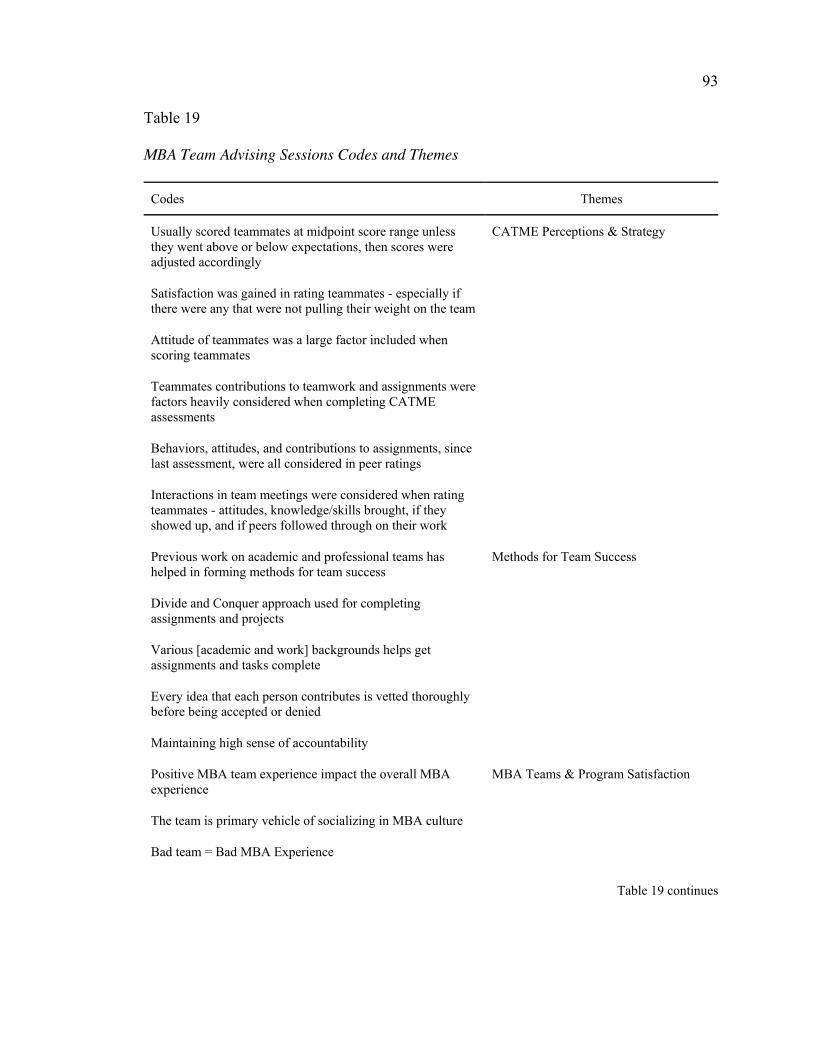
93
Table 19
MBA Team Advising Sessions Codes and Themes
Codes Themes
Usually scored teammates at midpoint score range unless they went above or below expectations, then scores were adjusted accordingly
CATME Perceptions & Strategy
Satisfaction was gained in rating teammates - especially if there were any that were not pulling their weight on the team
Attitude of teammates was a large factor included when scoring teammates
Teammates contributions to teamwork and assignments were factors heavily considered when completing CATME assessments
Behaviors, attitudes, and contributions to assignments, since last assessment, were all considered in peer ratings
Interactions in team meetings were considered when rating teammates - attitudes, knowledge/skills brought, if they showed up, and if peers followed through on their work
Previous work on academic and professional teams has helped in forming methods for team success
Methods for Team Success
Divide and Conquer approach used for completing assignments and projects
Various [academic and work] backgrounds helps get assignments and tasks complete
Every idea that each person contributes is vetted thoroughly before being accepted or denied
Maintaining high sense of accountability
Positive MBA team experience impact the overall MBA experience
MBA Teams & Program Satisfaction
The team is primary vehicle of socializing in MBA culture
Bad team = Bad MBA Experience
Table 19 continues
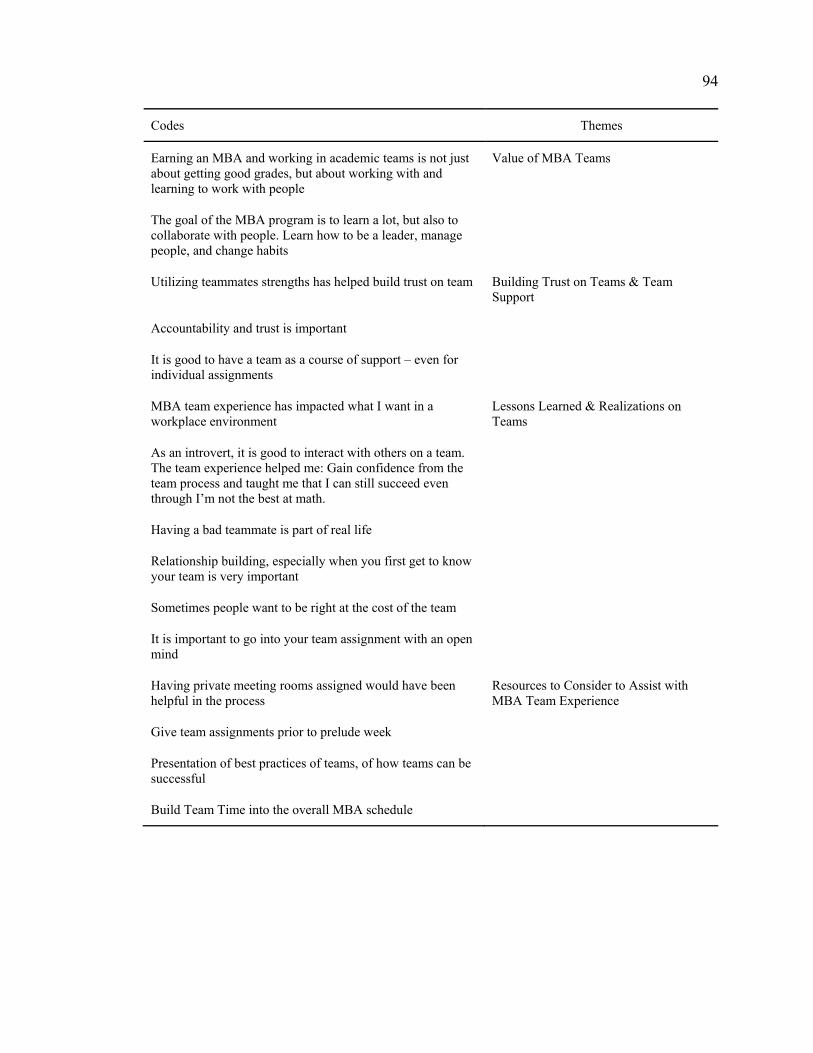
94
Codes Themes
Earning an MBA and working in academic teams is not just about getting good grades, but about working with and learning to work with people
Value of MBA Teams
The goal of the MBA program is to learn a lot, but also to collaborate with people. Learn how to be a leader, manage people, and change habits
Utilizing teammates strengths has helped build trust on team Building Trust on Teams & Team Support
Accountability and trust is important
It is good to have a team as a course of support – even for individual assignments
MBA team experience has impacted what I want in a workplace environment
Lessons Learned & Realizations on Teams
As an introvert, it is good to interact with others on a team. The team experience helped me: Gain confidence from the team process and taught me that I can still succeed even through I’m not the best at math.
Having a bad teammate is part of real life
Relationship building, especially when you first get to know your team is very important
Sometimes people want to be right at the cost of the team
It is important to go into your team assignment with an open mind
Having private meeting rooms assigned would have been helpful in the process
Resources to Consider to Assist with MBA Team Experience
Give team assignments prior to prelude week
Presentation of best practices of teams, of how teams can be successful
Build Team Time into the overall MBA schedule
95
in Team A repeatedly mentioned in their team session that their previous work
experience and occurrences working on professional teams were a significant part of their
team success. These previous experiences provided insights and methods of working
effectively and dealing with teammates that was helpful also in the MBA academic
environment. This was a team of all male students. The group’s diversity came from one
international student on the team and the variety of students with and without previous
full-time work experience. In order to be effective interpersonally, the team stated that
they had “a high sense of accountability and tough skin,” yet that no one was too hard on
each other.
Team A emphasized that they were intentional in utilizing the strengths of all
teammates. Unprompted from MBA program leadership or others, the team designed
their own strengths grid at the beginning of the semester to not only highlight all of their
strengths according to the StrengthsFinder 2.0 assessment, but additionally included each
of their own academic strengths and professional experiences so that they could divide
academic assignments and tasks accordingly.
When Team A was asked if a student’s team experience impacts the overall MBA
program experience, as a whole the group agreed, yes. One student said that the team
experience, “Seeps into everything and bleeds into [a student’s] opinion of the entire
program.” Another student mentioned that he had friends on other teams that had a bad
image of the MBA program based on their academic team.” This team definitely sees a
direct connection between the team experience and the overall MBA team experience.
Complete Team A CATME data is represented in Table 20.

96
Table 20
Team A Complete CATME Data
Student Contributions
to Team Interactions with Team
Keeping Team on Track
Expecting Quality
Having KSAs
Adj Factor w/self
Adj Factor w/o self Notes
Baseline/ Intervention
Student A1 2.8 2.8 3.5 4.2 3.3 0.89 0.85 Baseline 1
3.7 3.5 3.2 3.7 3.5 0.91 0.88 Baseline 2
3.5 3.3 3 3.2 3.5 0.86 0.83 Baseline 3
3.7 4 3.3 4 3.8 0.92 0.9 Intervention 1
3.2 3.4 3.4 3.4 3.8 0.85 0.85 Intervention 2
3.5 3.7 3.3 3.8 4.2 0.92 0.9 Intervention 3
3.7 3.8 3.7 3.8 3.8 0.93 0.92 Intervention 4
3.7 3.7 3.5 3.7 3.5 0.91 0.89 Intervention 5
Student A2 4.2 3 3.4 4.4 3.6 1 1 Baseline 1
4.7 4.2 3.5 4 4.2 1.05 1.05 Baseline 2
4.5 4 4.7 4.3 4.3 1.05 1.05 High Performer Baseline 3
4.7 4.7 4.8 4.5 4.3 1.05 1.05 Intervention 1
4.8 4.8 4.8 4.4 4.8 1.05 1.05 High Performer Intervention 2
4.7 4.7 4.5 4.5 4.5 1.05 1.05 Intervention 3
4.3 4.3 4.3 4.5 4.3 1.05 1.05 Conflict Intervention 4
Table 20 continues

97
Student Contributions
to Team Interactions with Team
Keeping Team on Track
Expecting Quality
Having KSAs
Adj Factor w/self
Adj Factor w/o self Notes
Baseline/ Intervention
Student A2 (cont’d)
4.7 4.5 4.3 4.5 4.5 1.05 1.05 High Performer Intervention 5
Student A3 4.3 3.7 3.8 4.3 3.3 1.04 1.05 Underconfident Baseline 1
3.8 3.8 3.7 3.7 4 1 1.02 Baseline 2
3.7 3.8 3.7 3.7 4 1 1.02 Baseline 3
3.8 4 3.7 4.2 3.8 1 1 Underconfident Intervention 1
4 4.2 4 3.8 4.2 1 1.05 Underconfident Intervention 2
3.8 4.2 3.8 4 4.2 1 1 Intervention 3
3.7 4 4 4.2 4 1 1 Intervention 4
4 4.2 3.8 3.8 4 1 1 Intervention 5
Student A4 3.8 3.7 3.3 4.2 3.8 1 1 Baseline 1
4.2 3.8 3.7 3.8 4.2 1.02 1 Baseline 2
3.8 3.7 3.3 3.5 4 1 0.92 Baseline 3
3.8 3.8 3.8 4 3.8 0.95 1 Intervention 1
3.2 3.8 3.4 3.4 3.8 0.87 0.83 Intervention 2
3.7 3.7 3.3 4 4 0.92 0.95 Intervention 3
4 4.2 3.8 4 4 1 0.94 Intervention 4
3.7 3.8 3.5 3.7 3.5 0.92 0.92 Intervention 5
Table 20 continues

98
Student Contributions
to Team Interactions with Team
Keeping Team on Track
Expecting Quality
Having KSAs
Adj Factor w/self
Adj Factor w/o self Notes
Baseline/ Intervention
Student A5 4.3 3.5 3.7 4.3 4.2 1.05 1.05 Baseline 1
4.3 3.3 3.8 4.3 4.3 1.05 1.04 Baseline 2
4.5 4 4.5 4.3 4.3 1.05 1.05 High Performer Baseline 3
4.3 4.2 4.5 4.5 4.5 1.05 1.05 Intervention 1
4.8 4.6 4.8 4.6 4.8 1.05 1.05 High Performer Intervention 2
4.7 4.5 4.5 4.5 4.3 1.05 1.05 High Performer Intervention 3
4 4.2 4.3 4.7 4.6 1.05 1.05 Intervention 4
4.7 4.5 4 4.5 4.8 1.05 1.05 High Performer Intervention 5
Student A6 4 4 3.7 4.2 3.3 1.02 1.03 Baseline 1
3.8 3.8 3.2 3.8 4.2 1 1 Baseline 2
3.5 3.5 3.2 3.5 3.7 0.91 0.9 Baseline 3
3.8 4 3.5 4.2 4 1 0.92 Intervention 1
3.8 4.2 3.8 3.6 3.8 0.95 0.92 Intervention 2
3.5 3.8 3.5 4 3.8 0.92 0.9 Intervention 3
4 4 3.8 3.8 3.8 1 1 Intervention 4
3.7 3.7 3.5 3.7 3.3 0.9 0.85 Intervention 5
99
Team B. Team B was a productive team that did deal with some internal team
conflict based largely on one student that was identified as not pulling his weight on team
related projects and assignments. Due to this challenge, as noted in the CATME
assessment, clique behavior was identified on the team, and smaller groups formed
internally. Overall however, the team functioned well and the active teammates made up
for the absentee teammate. In their team session, Team B talked openly about the MBA
academic team environment. One student mentioned that in the MBA program, the “team
is the primary vehicle of socializing.” Another student stated that working on a MBA
team is, “not just about getting good grades, but about working with, and learning to
work with people.”
This group was a diverse one with males and females, domestic and two
international students, and diverse professional and educational backgrounds. The group
stated that they were happy that they were assigned to such a diverse team, and wouldn’t
want to be on a less diverse team as some of the other students in their cohort were. The
students in Team B went on to say that they routinely came together as a group during
group projects and were able to complete the projects successfully.
When discussing the teams training sessions, the session that stood out in their
mind was the Plane Crash Survival Scenario Communication Simulation. They noted that
their team seemed to work more effectively on its own than when the discussion was
opened up to the full class. An additional perspective is that the two female international
students on their team talked openly and expertly in the team discussing surrounding the
case, but then did not speak at all when the case was opened for whole class discussion.

100
Regarding discussion of the routine CATME assessments that the students
completed, one of the students stated that rating peer students, “Ones or fives are off the
table unless my mind has been blown.” Another student mentioned that, “I give my
teammates high grades if they are putting forth the effort.” An additional student agreed
that if other were or were not making an honest effort, that this was demonstrated in the
ratings granted. Complete Team B CATME data is represented in Table 21.
Team C. Based on CATME data compiled and interactions with Team C in
teams training and team advising sessions, these teammates created a highly functioning
team environment. Team C was also one of the more diverse teams in terms of ethnicity,
gender, and work experience. This team had three Caucasian males, one Caucasian
female, one male international student, and one female international student.
Team C observed in their team that relationships have the power to make things
good and bad. The team went on to state that having a poor team does equal an overall
bad MBA experience, but also that having a bad teammate is part of real life, and an
experience that most professionals encounter in the workplace – so it is good training in
the MBA environment.
When asked about their strengths as a team, one student stated that the students on
their team are all very similar – similar strengths, work styles, and thinking. Teammates
also mention that this can be a strength as well as a challenge. Team C’s primary keys to
effectiveness include being respectful of everyone’s perspectives and ideas, and everyone
works hard – no laziness allowed.
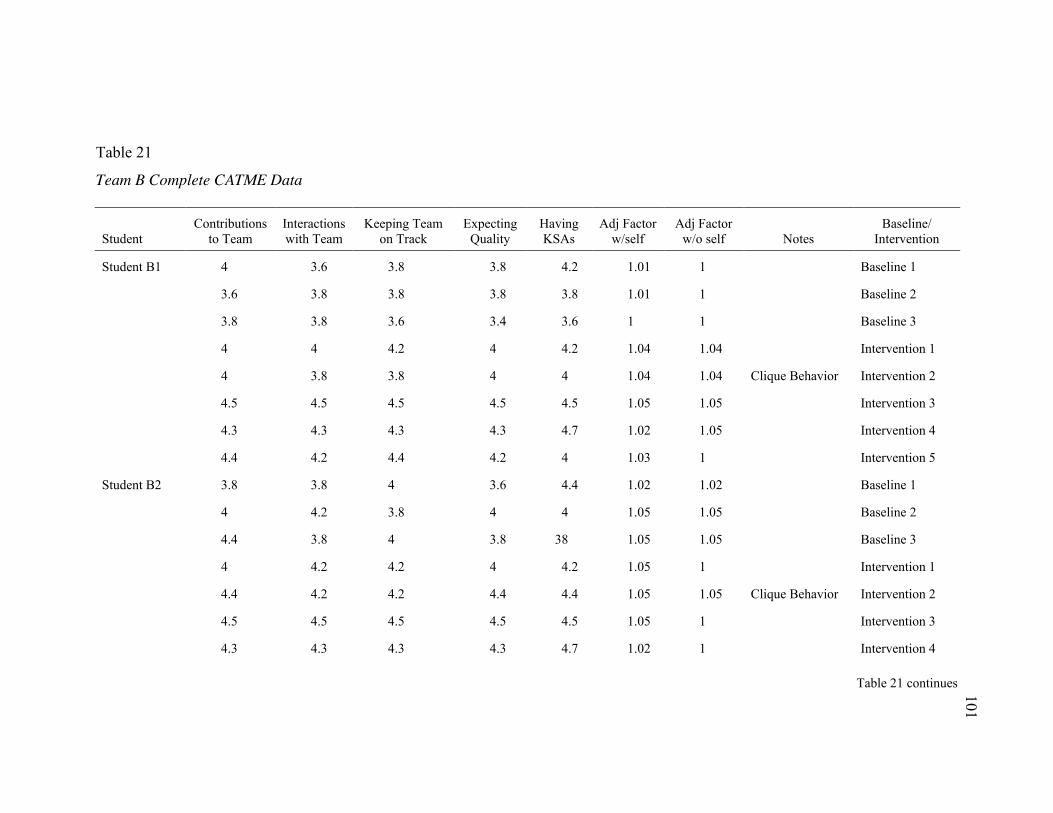
101
Table 21
Team B Complete CATME Data
Student Contributions
to Team Interactions with Team
Keeping Team on Track
Expecting Quality
Having KSAs
Adj Factor w/self
Adj Factor w/o self Notes
Baseline/ Intervention
Student B1 4 3.6 3.8 3.8 4.2 1.01 1 Baseline 1
3.6 3.8 3.8 3.8 3.8 1.01 1 Baseline 2
3.8 3.8 3.6 3.4 3.6 1 1 Baseline 3
4 4 4.2 4 4.2 1.04 1.04 Intervention 1
4 3.8 3.8 4 4 1.04 1.04 Clique Behavior Intervention 2
4.5 4.5 4.5 4.5 4.5 1.05 1.05 Intervention 3
4.3 4.3 4.3 4.3 4.7 1.02 1.05 Intervention 4
4.4 4.2 4.4 4.2 4 1.03 1 Intervention 5
Student B2 3.8 3.8 4 3.6 4.4 1.02 1.02 Baseline 1
4 4.2 3.8 4 4 1.05 1.05 Baseline 2
4.4 3.8 4 3.8 38 1.05 1.05 Baseline 3
4 4.2 4.2 4 4.2 1.05 1 Intervention 1
4.4 4.2 4.2 4.4 4.4 1.05 1.05 Clique Behavior Intervention 2
4.5 4.5 4.5 4.5 4.5 1.05 1 Intervention 3
4.3 4.3 4.3 4.3 4.7 1.02 1 Intervention 4
Table 21 continues
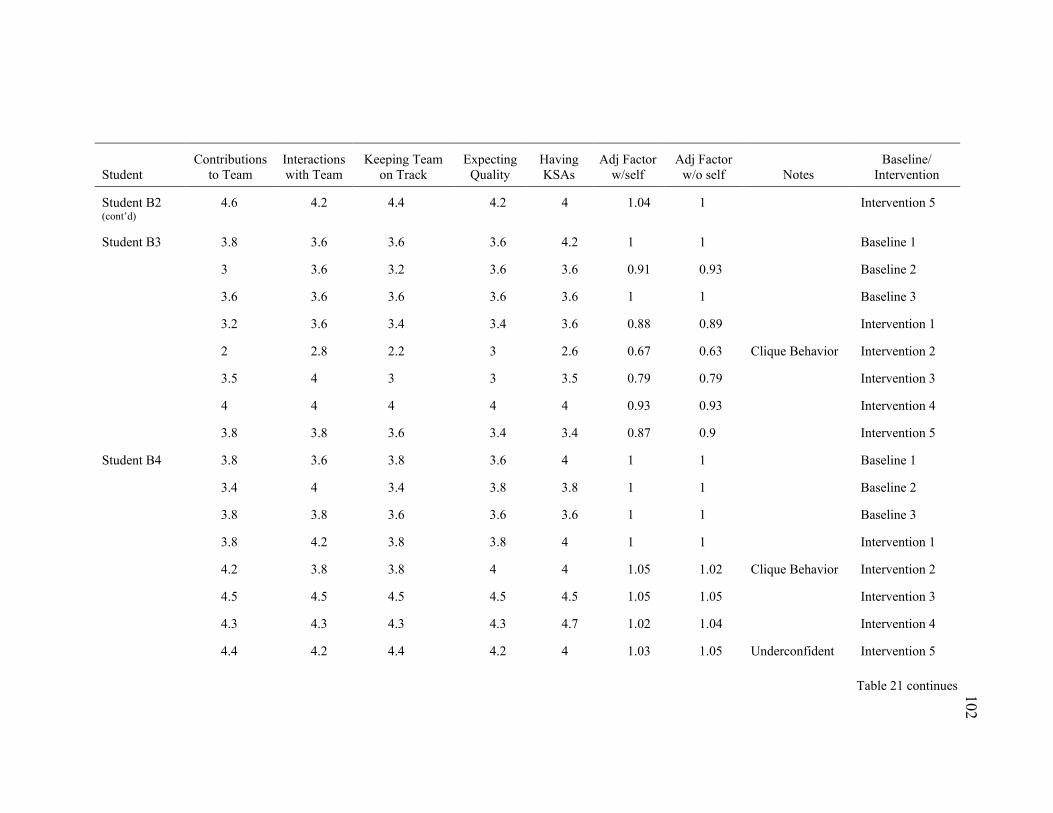
102
Student Contributions
to Team Interactions with Team
Keeping Team on Track
Expecting Quality
Having KSAs
Adj Factor w/self
Adj Factor w/o self Notes
Baseline/ Intervention
Student B2 (cont’d)
4.6 4.2 4.4 4.2 4 1.04 1 Intervention 5
Student B3 3.8 3.6 3.6 3.6 4.2 1 1 Baseline 1
3 3.6 3.2 3.6 3.6 0.91 0.93 Baseline 2
3.6 3.6 3.6 3.6 3.6 1 1 Baseline 3
3.2 3.6 3.4 3.4 3.6 0.88 0.89 Intervention 1
2 2.8 2.2 3 2.6 0.67 0.63 Clique Behavior Intervention 2
3.5 4 3 3 3.5 0.79 0.79 Intervention 3
4 4 4 4 4 0.93 0.93 Intervention 4
3.8 3.8 3.6 3.4 3.4 0.87 0.9 Intervention 5
Student B4 3.8 3.6 3.8 3.6 4 1 1 Baseline 1
3.4 4 3.4 3.8 3.8 1 1 Baseline 2
3.8 3.8 3.6 3.6 3.6 1 1 Baseline 3
3.8 4.2 3.8 3.8 4 1 1 Intervention 1
4.2 3.8 3.8 4 4 1.05 1.02 Clique Behavior Intervention 2
4.5 4.5 4.5 4.5 4.5 1.05 1.05 Intervention 3
4.3 4.3 4.3 4.3 4.7 1.02 1.04 Intervention 4
4.4 4.2 4.4 4.2 4 1.03 1.05 Underconfident Intervention 5
Table 21 continues

103
Student Contributions
to Team Interactions with Team
Keeping Team on Track
Expecting Quality
Having KSAs
Adj Factor w/self
Adj Factor w/o self Notes
Baseline/ Intervention
Student B5 4 3.8 3.8 3.6 4.2 1.01 1.04 Baseline 1
3.8 4 3.4 3.8 3.8 1.01 1.01 Baseline 2
.8 3.8 3.6 3.6 3.6 1 1.01 Baseline 3
3.8 4.2 4.2 4.2 4 1.04 1.03 Intervention 1
4.4 3.8 4.2 4 4.4 1.05 1.05 Clique Behavior Intervention 2
4.5 4.5 4.5 4.5 4.5 1.05 1.05 Intervention 3
4.3 4.3 4.3 4.3 4.7 1.02 1.02 Intervention 4
4.4 4.2 4.4 4.2 4 1.03 1 Intervention 5

104
When asked about the team’s methods of completing the regular CATME
assessments, one student stated that he always started the assessments with a rating of a
four in mind for each student on each team dimension. If a teammate did better work than
a four level, then he gave a higher score. If teammates did work worse than a four level,
than he granted a lower score. Other students mentioned that they based their assessment
ratings on effort and skills, and the behavioral anchors descriptions on the CATME.
Complete Team C CATME data is represented in Table 22.
Team D. Team D was a solid, well functioning team. This was shown in their
semester CATME scores, as well as in their regular teams training and team advising
sessions. Overall the group worked efficiently, effectively, and with minimal conflict. In
their team advising session, Team D as a whole stated that there is a good mixture of
strengths on their team, and that they had a functional team environment based on trust
and a healthy level of competitiveness. They went on to mention that the time spent in
teams training sessions was a helpful time for team bonding. One of the teammates, a self
proclaimed introvert, stated that she gained confidence from the teams training and team
building process, and that she learned that she can be successful on and as the result of
her team, even though she is not an expert in all academic areas.
According to Team D, team experience is everything in the context of the MBA
environment. Also teammates mentioned that one of the primary purposed on the MBA
team experience is to teach students how to work together. One student said the, “Team
experience would make or break the whole MBA experience.” Another student mentions,

105
Table 22
Team C Complete CATME Data
Student Contributions
to Team Interactions with Team
Keeping Team on Track
Expecting Quality
Having KSAs
Adj Factor w/self
Adj Factor w/o self Notes
Baseline/ Intervention
Student C1 4 4.4 4.4 4.8 4.8 1.05 1.05 Baseline 1
4.2 4.2 3.8 4 4.2 1 0.94 Baseline 2
4.2 4.2 4 3.8 4.3 1 0.92 Baseline 3
4.7 4.3 4.3 4.5 4.5 1.01 1 Intervention 1
4.3 4.5 4.2 4.3 4.5 1 0.95 Intervention 2
4.3 4.3 4.3 4.5 4.7 1 1 Intervention 3
4.6 4.6 4.6 4.6 4.6 1 1 Intervention 4
4.5 4.5 4.3 4.7 4.5 1 0.95 Intervention 5
Student C2 4.2 4 4 4 4.8 1.02 1.02 Baseline 1
4.7 4.2 4.5 4.3 4.3 1.05 1.05 Baseline 2
4.3 4.5 4.5 4.2 5 1.05 1.05 Baseline 3
4.3 4.5 48 4.3 4.5 1.02 1.03 Intervention 1
4.5 4.5 4.8 4.8 4.8 1 0.95 Intervention 2
4.5 4.5 4.8 4.7 4.7 1.03 1.04 Intervention 3
4.8 5 5 4.8 4.8 1.05 1.04 Intervention 4
Table 22 continues

106
Student Contributions
to Team Interactions with Team
Keeping Team on Track
Expecting Quality
Having KSAs
Adj Factor w/self
Adj Factor w/o self Notes
Baseline/ Intervention
Student C2 (cont’d)
4.8 5 5 5 4.8 1.05 1.05 Intervention 5
Student C3 3.6 4 3.8 4 4.6 1 0.91 Baseline 1
4.3 3.8 3.8 4 4.3 1 1 Baseline 2
4.7 4.5 4.5 4.5 4.7 1.05 1.05 Baseline 3
4.7 4.3 47 4.7 4.7 1.04 1.04 Intervention 1
4.8 4.5 4.7 4.7 4.8 1.05 1.05 Intervention 2
4.7 4.5 48 4.7 4.7 1.03 1.04 Intervention 3
4.8 5 4.8 4.8 4.8 1.04 1.05 Intervention 4
4.7 4.8 5 4.8 4.8 1.04 1.05 Intervention 5
Student C4 4 4.4 4.4 4.4 4.8 1.05 1.05 Baseline 1
4.5 4.3 4.2 4.2 4.7 1.05 1.05 Baseline 2
4.5 4.8 4.3 4 5 1.05 1.05 Baseline 3
4.3 4.5 4.3 4.5 4.5 1 1.01 Intervention 1
4.5 4.3 4.3 4.5 4.8 1 1.03 Intervention 2
4.3 4.5 4.7 4.7 4.7 1.01 1.01 Intervention 3
4.6 4.8 4.8 4.8 4.8 1.02 1.04 Intervention 4
4.7 4.7 4.8 4.7 4.7 1.01 1.04 Intervention 5
Table 22 continues
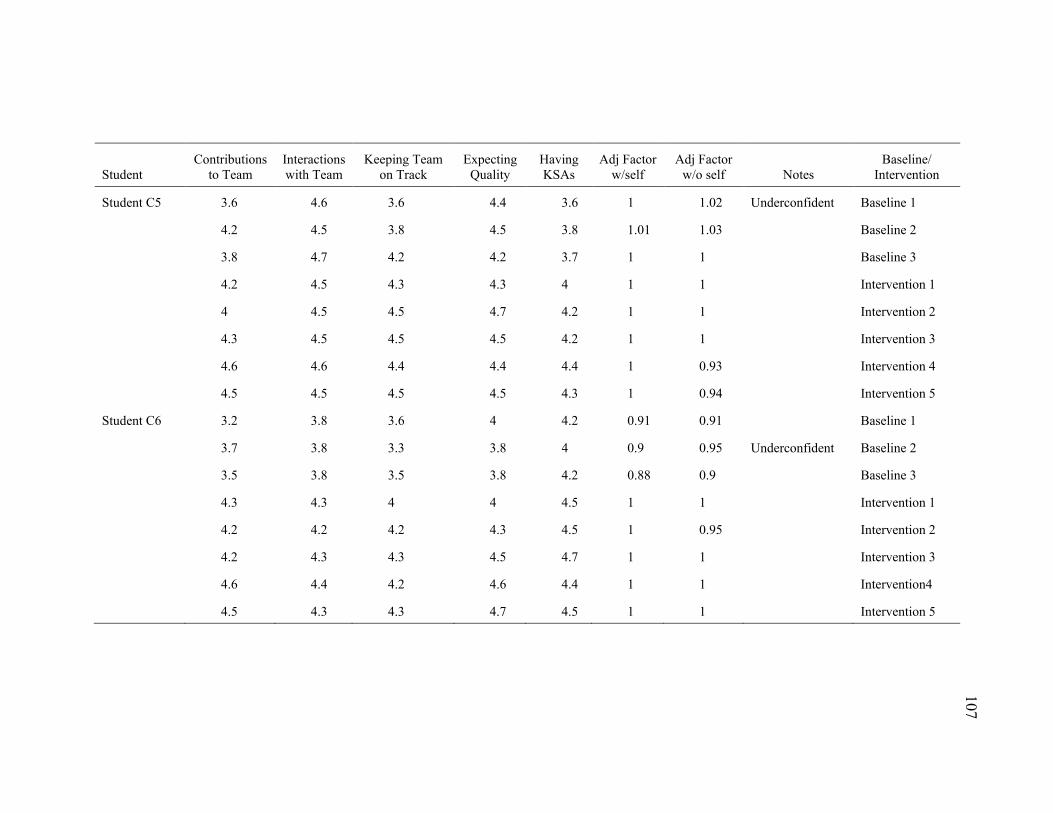
107
Student Contributions
to Team Interactions with Team
Keeping Team on Track
Expecting Quality
Having KSAs
Adj Factor w/self
Adj Factor w/o self Notes
Baseline/ Intervention
Student C5 3.6 4.6 3.6 4.4 3.6 1 1.02 Underconfident Baseline 1
4.2 4.5 3.8 4.5 3.8 1.01 1.03 Baseline 2
3.8 4.7 4.2 4.2 3.7 1 1 Baseline 3
4.2 4.5 4.3 4.3 4 1 1 Intervention 1
4 4.5 4.5 4.7 4.2 1 1 Intervention 2
4.3 4.5 4.5 4.5 4.2 1 1 Intervention 3
4.6 4.6 4.4 4.4 4.4 1 0.93 Intervention 4
4.5 4.5 4.5 4.5 4.3 1 0.94 Intervention 5
Student C6 3.2 3.8 3.6 4 4.2 0.91 0.91 Baseline 1
3.7 3.8 3.3 3.8 4 0.9 0.95 Underconfident Baseline 2
3.5 3.8 3.5 3.8 4.2 0.88 0.9 Baseline 3
4.3 4.3 4 4 4.5 1 1 Intervention 1
4.2 4.2 4.2 4.3 4.5 1 0.95 Intervention 2
4.2 4.3 4.3 4.5 4.7 1 1 Intervention 3
4.6 4.4 4.2 4.6 4.4 1 1 Intervention4
4.5 4.3 4.3 4.7 4.5 1 1 Intervention 5

108
“If I were on a bad team, I would feel constantly stressed.” A very insightful student went
on to explain that, “The goal of the MBA program is to learn a lot, but also to collaborate
with people,” and learn how to be a leader, manage people, and change your habits.
When Team D was completing the routine CATME assessments, students were
thinking about how their teammates worked and contributed to projects and assignments
in the previous week. Also, this team took into significant consideration most recent
interactions in team meetings when scoring their peers on the CATME. These team
meeting interactions for consideration included did students show up for team meetings,
contribute in meaningful ways, and work together with teammates towards a common
academic goal. Complete Team D CATME data is represented in Table 23.
Team E. Although Team E did experience some personality conflicts and
philosophical differences on select project and task management, they compensated
effectively and came together as a team when needed. Their CATME assessment scores
represent mixed results with some students demonstrating growth over the course of the
semester on, and other teammates experience an increase or decrease of team skills
ratings on various team dimensions. Complete Team E CATME data is shown below.
In their team advising session, a student from Team E stated that in the MBA
environment, “If you’re on a bad team, this program would be hell.” The team went on to
say that in order to strengthen their team environment, as a team they talked through their
individual results on the StrengthsFinder assessment, and academic strengths areas.
According to Team E, this was a helpful foundation in building a solid team environment.
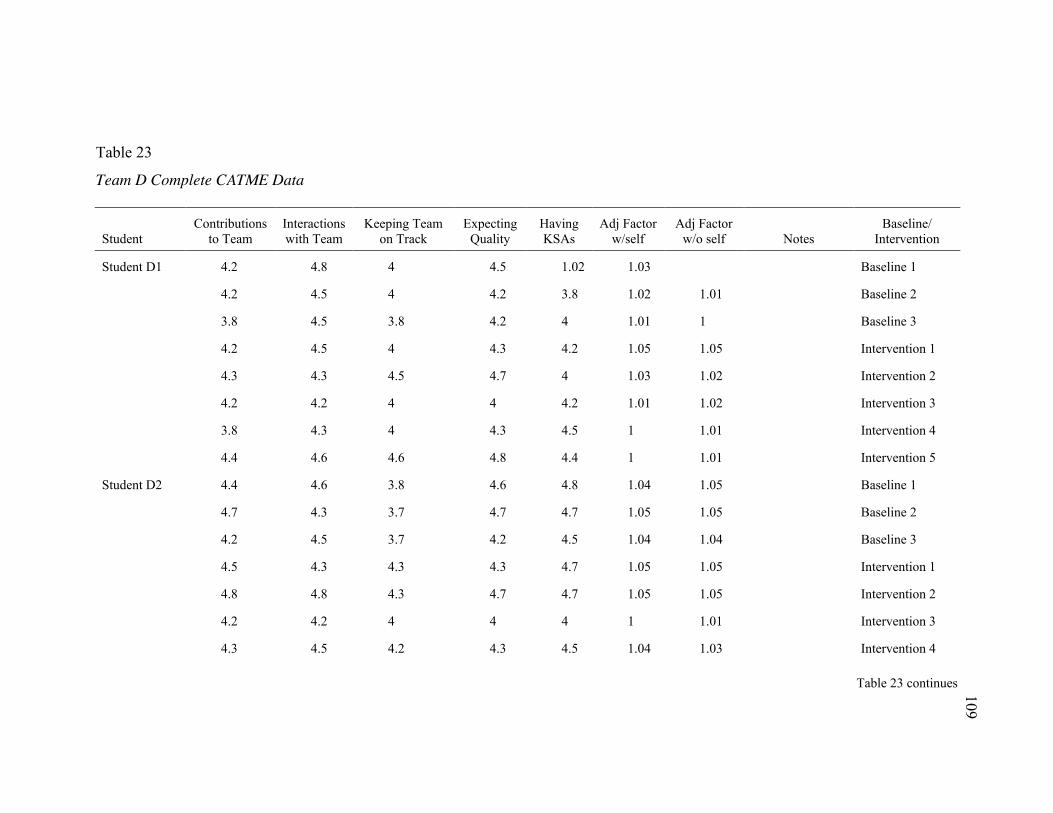
109
Table 23
Team D Complete CATME Data
Student Contributions
to Team Interactions with Team
Keeping Team on Track
Expecting Quality
Having KSAs
Adj Factor w/self
Adj Factor w/o self Notes
Baseline/ Intervention
Student D1 4.2 4.8 4 4.5 1.02 1.03 Baseline 1
4.2 4.5 4 4.2 3.8 1.02 1.01 Baseline 2
3.8 4.5 3.8 4.2 4 1.01 1 Baseline 3
4.2 4.5 4 4.3 4.2 1.05 1.05 Intervention 1
4.3 4.3 4.5 4.7 4 1.03 1.02 Intervention 2
4.2 4.2 4 4 4.2 1.01 1.02 Intervention 3
3.8 4.3 4 4.3 4.5 1 1.01 Intervention 4
4.4 4.6 4.6 4.8 4.4 1 1.01 Intervention 5
Student D2 4.4 4.6 3.8 4.6 4.8 1.04 1.05 Baseline 1
4.7 4.3 3.7 4.7 4.7 1.05 1.05 Baseline 2
4.2 4.5 3.7 4.2 4.5 1.04 1.04 Baseline 3
4.5 4.3 4.3 4.3 4.7 1.05 1.05 Intervention 1
4.8 4.8 4.3 4.7 4.7 1.05 1.05 Intervention 2
4.2 4.2 4 4 4 1 1.01 Intervention 3
4.3 4.5 4.2 4.3 4.5 1.04 1.03 Intervention 4
Table 23 continues
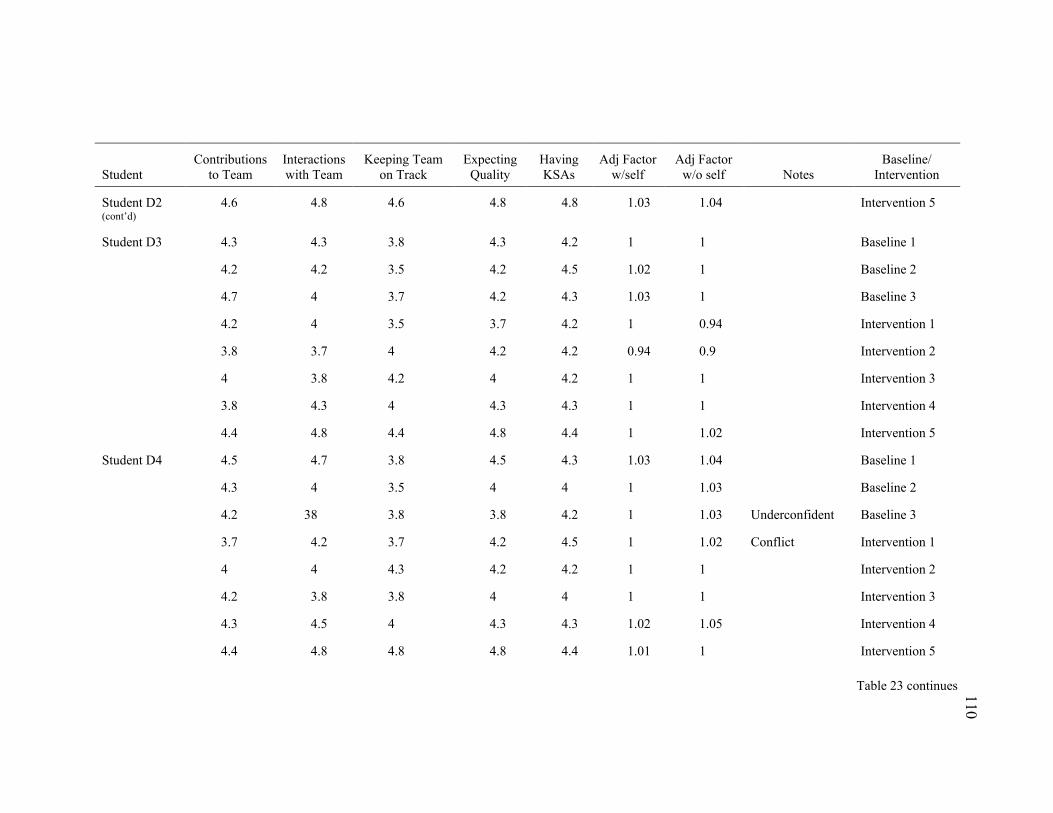
110
Student Contributions
to Team Interactions with Team
Keeping Team on Track
Expecting Quality
Having KSAs
Adj Factor w/self
Adj Factor w/o self Notes
Baseline/ Intervention
Student D2 (cont’d)
4.6 4.8 4.6 4.8 4.8 1.03 1.04 Intervention 5
Student D3 4.3 4.3 3.8 4.3 4.2 1 1 Baseline 1
4.2 4.2 3.5 4.2 4.5 1.02 1 Baseline 2
4.7 4 3.7 4.2 4.3 1.03 1 Baseline 3
4.2 4 3.5 3.7 4.2 1 0.94 Intervention 1
3.8 3.7 4 4.2 4.2 0.94 0.9 Intervention 2
4 3.8 4.2 4 4.2 1 1 Intervention 3
3.8 4.3 4 4.3 4.3 1 1 Intervention 4
4.4 4.8 4.4 4.8 4.4 1 1.02 Intervention 5
Student D4 4.5 4.7 3.8 4.5 4.3 1.03 1.04 Baseline 1
4.3 4 3.5 4 4 1 1.03 Baseline 2
4.2 38 3.8 3.8 4.2 1 1.03 Underconfident Baseline 3
3.7 4.2 3.7 4.2 4.5 1 1.02 Conflict Intervention 1
4 4 4.3 4.2 4.2 1 1 Intervention 2
4.2 3.8 3.8 4 4 1 1 Intervention 3
4.3 4.5 4 4.3 4.3 1.02 1.05 Intervention 4
4.4 4.8 4.8 4.8 4.4 1.01 1 Intervention 5
Table 23 continues
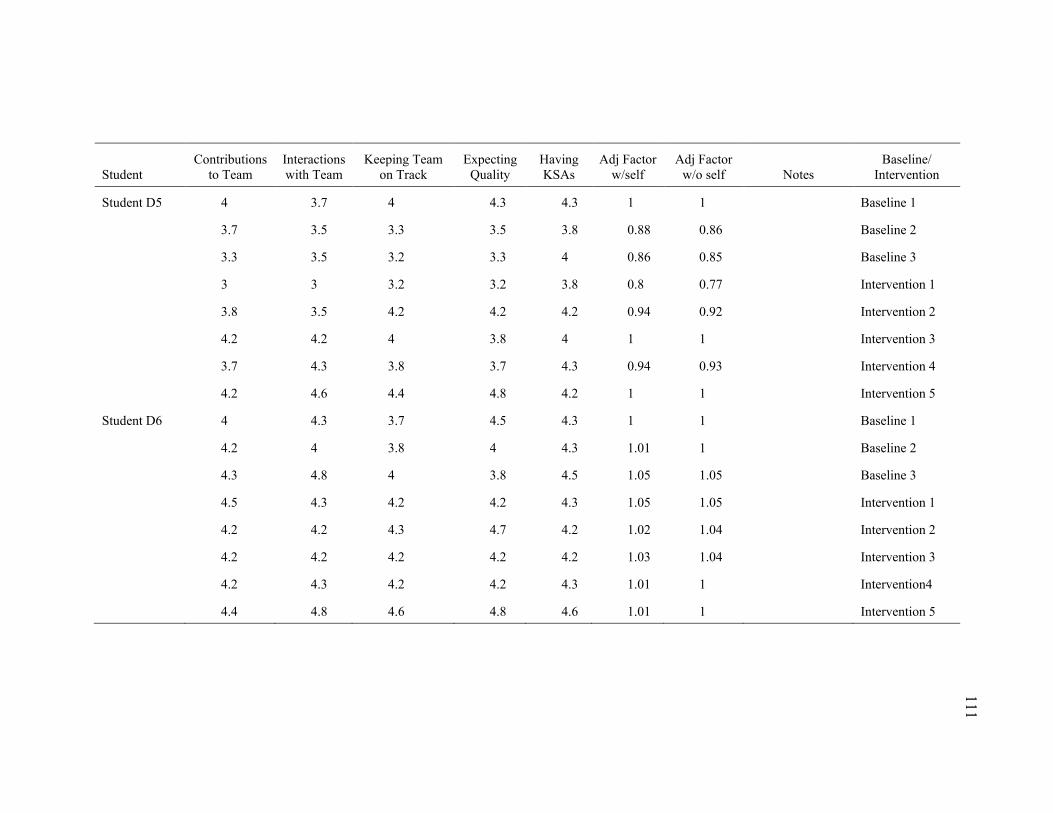
111
Student Contributions
to Team Interactions with Team
Keeping Team on Track
Expecting Quality
Having KSAs
Adj Factor w/self
Adj Factor w/o self Notes
Baseline/ Intervention
Student D5 4 3.7 4 4.3 4.3 1 1 Baseline 1
3.7 3.5 3.3 3.5 3.8 0.88 0.86 Baseline 2
3.3 3.5 3.2 3.3 4 0.86 0.85 Baseline 3
3 3 3.2 3.2 3.8 0.8 0.77 Intervention 1
3.8 3.5 4.2 4.2 4.2 0.94 0.92 Intervention 2
4.2 4.2 4 3.8 4 1 1 Intervention 3
3.7 4.3 3.8 3.7 4.3 0.94 0.93 Intervention 4
4.2 4.6 4.4 4.8 4.2 1 1 Intervention 5
Student D6 4 4.3 3.7 4.5 4.3 1 1 Baseline 1
4.2 4 3.8 4 4.3 1.01 1 Baseline 2
4.3 4.8 4 3.8 4.5 1.05 1.05 Baseline 3
4.5 4.3 4.2 4.2 4.3 1.05 1.05 Intervention 1
4.2 4.2 4.3 4.7 4.2 1.02 1.04 Intervention 2
4.2 4.2 4.2 4.2 4.2 1.03 1.04 Intervention 3
4.2 4.3 4.2 4.2 4.3 1.01 1 Intervention4
4.4 4.8 4.6 4.8 4.6 1.01 1 Intervention 5
112
In reference to the teams training sessions, the students found the Marshmallow
Challenge activity to be particularly helpful. The idea of prototyping that was emphasized
in the debriefing of the Marshmallow Challenge activity was beneficial in the context of
successfully designing and completing academic projects and assignments. Team E
utilized this concept and idea into their work as a team.
Other helpful lessons that the team learned over the course of the semester that
finding time to meet face to face as a team is important. Sometimes meeting remotely is
helpful for scheduling, but every meeting cannot be remote. Additionally, a key concept
that Team E learned from their team experience is that relationship building within a
team, especially at the beginning of their time working together, is very important.
Finally, the students in Team E had some curious and entertaining strategies in
completing the regular CATME assessments. One student talked about how he would use
the CATME to release aggression and punishment on teammates that were not working
effectively as part of the team or were not completing tasks as agreed upon, and therefore
gained personal satisfaction from doing so. Another student stated he graded students
with a mid range score in mind unless teammates went above or below expectation for
the given week, then he would adjust scores accordingly. An additional student
mentioned that he tried to base peer ratings on the CATME team dimension behavioral
anchors descriptions, but sometimes it was difficult to do so. Complete Team E CATME
data is represented in Table 24.

113
Table 24
Team E Complete CATME Data
Student Contributions
to Team Interactions with Team
Keeping Team on Track
Expecting Quality
Having KSAs
Adj Factor w/self
Adj Factor w/o self Notes
Baseline/ Intervention
Student E1 3.2 3.2 3.2 3.7 3.7 0.89 0.9 Baseline 1
2.7 3.2 2.7 3.5 3 0.8 0.74 Overconfident Baseline 2
3.2 3.5 3.5 3.3 3.8 1 0.88 Baseline 3
3.3 3.3 3.3 3.7 3.5 1 0.91 Intervention 1
3.7 3.8 3.5 3.8 3.8 1 0.94 Intervention 2
3.2 3.3 3.3 3.3 3.3 1 0.92 Intervention 3
3.7 3.8 3.5 3.5 3.7 1 0.9 Intervention 4
4 3.8 3.8 3.8 38 1 0.94 Intervention 5
Student E2 3.8 3.5 3.8 3.7 4 1 1 Baseline 1
3 3.5 3.5 3.8 4.2 1 0.91 Conflict Baseline 2
3 3.5 3 3.5 4 0.94 0.88 Baseline 3
3 3.3 3.3 3.8 4 1 0.95 Intervention 1
4 4 3.5 3.7 4 1.03 1.01 Intervention 2
3.3 3.5 3.5 3.5 3.7 1.02 1 Intervention 3
3.8 3.8 3.7 3.7 3.8 1 1 Intervention 4
Table 24 continues
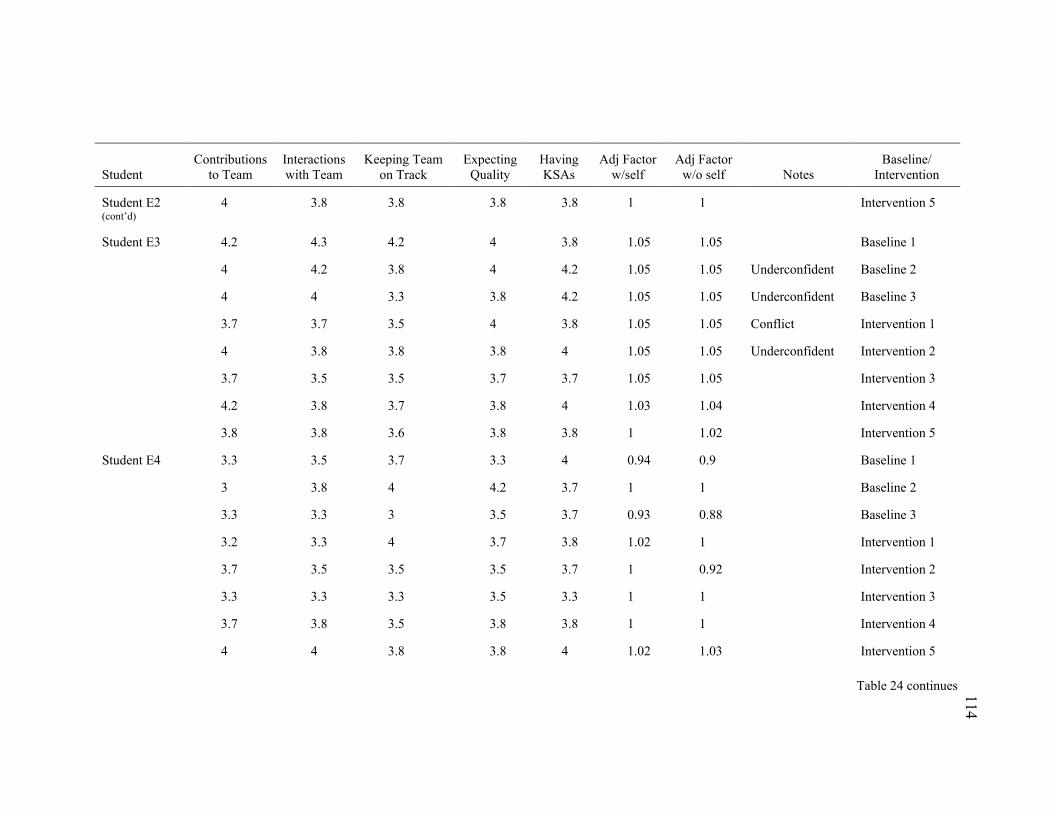
114
Student Contributions
to Team Interactions with Team
Keeping Team on Track
Expecting Quality
Having KSAs
Adj Factor w/self
Adj Factor w/o self Notes
Baseline/ Intervention
Student E2 (cont’d)
4 3.8 3.8 3.8 3.8 1 1 Intervention 5
Student E3 4.2 4.3 4.2 4 3.8 1.05 1.05 Baseline 1
4 4.2 3.8 4 4.2 1.05 1.05 Underconfident Baseline 2
4 4 3.3 3.8 4.2 1.05 1.05 Underconfident Baseline 3
3.7 3.7 3.5 4 3.8 1.05 1.05 Conflict Intervention 1
4 3.8 3.8 3.8 4 1.05 1.05 Underconfident Intervention 2
3.7 3.5 3.5 3.7 3.7 1.05 1.05 Intervention 3
4.2 3.8 3.7 3.8 4 1.03 1.04 Intervention 4
3.8 3.8 3.6 3.8 3.8 1 1.02 Intervention 5
Student E4 3.3 3.5 3.7 3.3 4 0.94 0.9 Baseline 1
3 3.8 4 4.2 3.7 1 1 Baseline 2
3.3 3.3 3 3.5 3.7 0.93 0.88 Baseline 3
3.2 3.3 4 3.7 3.8 1.02 1 Intervention 1
3.7 3.5 3.5 3.5 3.7 1 0.92 Intervention 2
3.3 3.3 3.3 3.5 3.3 1 1 Intervention 3
3.7 3.8 3.5 3.8 3.8 1 1 Intervention 4
4 4 3.8 3.8 4 1.02 1.03 Intervention 5
Table 24 continues
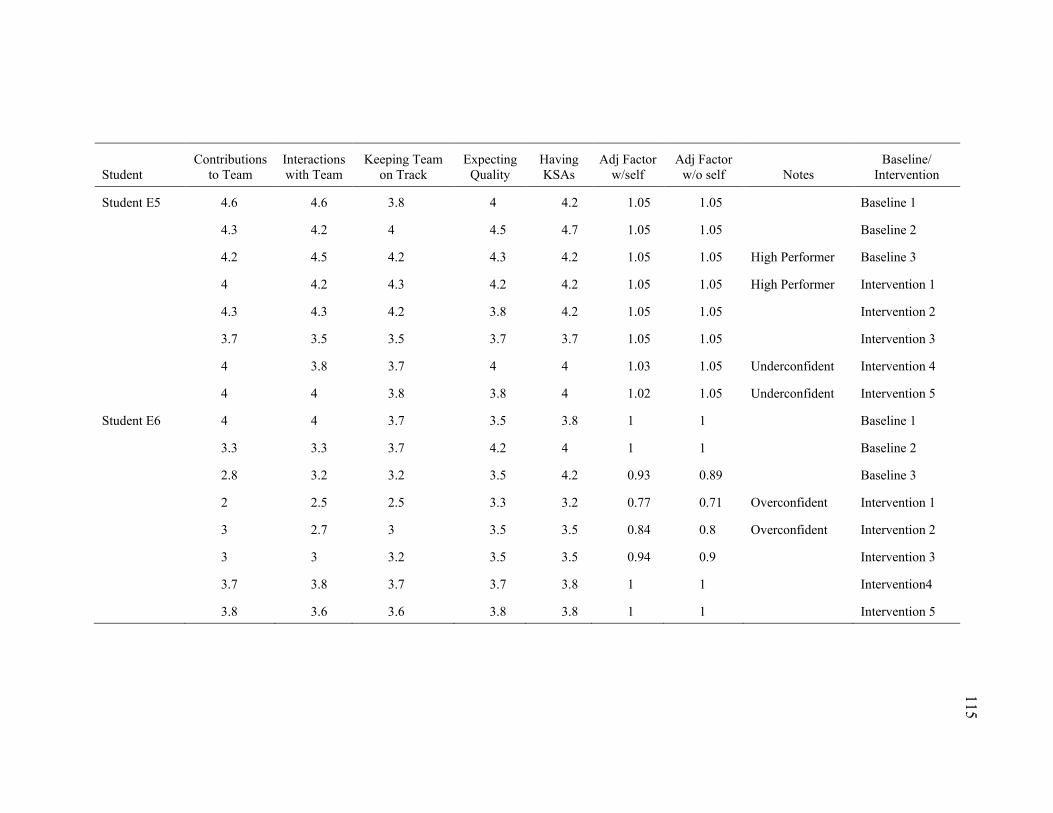
115
Student Contributions
to Team Interactions with Team
Keeping Team on Track
Expecting Quality
Having KSAs
Adj Factor w/self
Adj Factor w/o self Notes
Baseline/ Intervention
Student E5 4.6 4.6 3.8 4 4.2 1.05 1.05 Baseline 1
4.3 4.2 4 4.5 4.7 1.05 1.05 Baseline 2
4.2 4.5 4.2 4.3 4.2 1.05 1.05 High Performer Baseline 3
4 4.2 4.3 4.2 4.2 1.05 1.05 High Performer Intervention 1
4.3 4.3 4.2 3.8 4.2 1.05 1.05 Intervention 2
3.7 3.5 3.5 3.7 3.7 1.05 1.05 Intervention 3
4 3.8 3.7 4 4 1.03 1.05 Underconfident Intervention 4
4 4 3.8 3.8 4 1.02 1.05 Underconfident Intervention 5
Student E6 4 4 3.7 3.5 3.8 1 1 Baseline 1
3.3 3.3 3.7 4.2 4 1 1 Baseline 2
2.8 3.2 3.2 3.5 4.2 0.93 0.89 Baseline 3
2 2.5 2.5 3.3 3.2 0.77 0.71 Overconfident Intervention 1
3 2.7 3 3.5 3.5 0.84 0.8 Overconfident Intervention 2
3 3 3.2 3.5 3.5 0.94 0.9 Intervention 3
3.7 3.8 3.7 3.7 3.8 1 1 Intervention4
3.8 3.6 3.6 3.8 3.8 1 1 Intervention 5
116
Team F. Team F did not get off to a fair start at the beginning of the semester. A
week and a half prior to the regular MBA academic semester starting, the MBA program
at the research site institution had an orientation week for all entering first year full-time
MBA students. The orientation week is an important time to get to know teammates and
work on a team based case study project, as well as participating in many academic and
informational sessions based on the MBA experience. One of the teammates in Team F,
was a late admit into the MBA program, and did not attend the MBA orientation week.
This placed her, and Team F as a whole, at an automatic disadvantage in regards to team
dynamics.
Team F started off at a deficit in regards to not having all their teammates present
for the orientation week and as the MBA experience was kicking off, and their struggle as
a team continued as the semester went on. This was demonstrated in their CATME team
skills rating scores and their team satisfaction ratings. Both the team skills ratings for
every teammate on all of the five CATME team dimensions, as well as in their team
satisfaction ratings, decreased gradually and significantly over the course of the semester.
Complete Team F CATME ratings are shown below. This team did not have a highly
productive team advising session as some of the students refused to talk or only spoke
minimally, but there were some interesting takeaways from this team session and the
students on this team.
When asked if the team experience impacts the overall MBA experience,
responses from students on Team F were varied. One student mentioned that she thought
that a positive team experience would impact the overall experience. Another student,
Student F3 who was a late add to the entering MBA cohort, stated that she did not think

117
that a bad team experience impacted the overall MBA experience. A couple additional
students echoed that MBA program satisfaction is marginally related to the team
experience. Unfortunately, the student that entered the program late ended up dropping
out of the MBA program at the end of her first semester.
When asked about scoring of peers on the CATME assessment, the response of
the students on Team F was in line with what other teams stated. Students said that they
rated each teammate on the work and interactions that had taken place on the team since
the last assessment. Other students mentioned that the factors that specifically impacted
the peer ratings given to teammates were, the quality of work that teammates provided on
projects, assignments, and major academic related tasks. Complete Team F CATME data
is represented in Table 25.
Team Satisfaction Results
In addition to participants completing self and peer evaluations based on the
CATME five team dimensions, students also completed a brief team satisfaction survey
as part of every CATME assessment. Every assessment asked students to respond to three
team satisfaction based statements. These statements include:
x I am satisfied with my present teammates
x I am pleased with the way my teammates and I work together
x I am very satisfied with working in this team
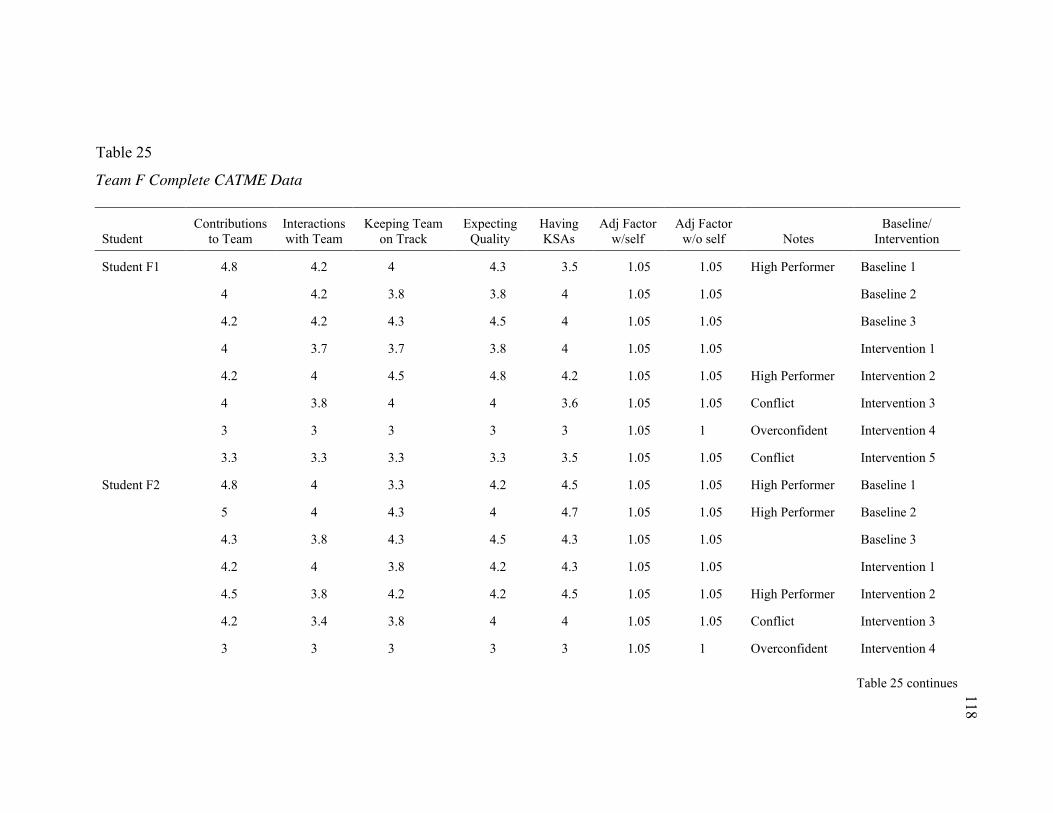
118
Table 25
Team F Complete CATME Data
Student Contributions
to Team Interactions with Team
Keeping Team on Track
Expecting Quality
Having KSAs
Adj Factor w/self
Adj Factor w/o self Notes
Baseline/ Intervention
Student F1 4.8 4.2 4 4.3 3.5 1.05 1.05 High Performer Baseline 1
4 4.2 3.8 3.8 4 1.05 1.05 Baseline 2
4.2 4.2 4.3 4.5 4 1.05 1.05 Baseline 3
4 3.7 3.7 3.8 4 1.05 1.05 Intervention 1
4.2 4 4.5 4.8 4.2 1.05 1.05 High Performer Intervention 2
4 3.8 4 4 3.6 1.05 1.05 Conflict Intervention 3
3 3 3 3 3 1.05 1 Overconfident Intervention 4
3.3 3.3 3.3 3.3 3.5 1.05 1.05 Conflict Intervention 5
Student F2 4.8 4 3.3 4.2 4.5 1.05 1.05 High Performer Baseline 1
5 4 4.3 4 4.7 1.05 1.05 High Performer Baseline 2
4.3 3.8 4.3 4.5 4.3 1.05 1.05 Baseline 3
4.2 4 3.8 4.2 4.3 1.05 1.05 Intervention 1
4.5 3.8 4.2 4.2 4.5 1.05 1.05 High Performer Intervention 2
4.2 3.4 3.8 4 4 1.05 1.05 Conflict Intervention 3
3 3 3 3 3 1.05 1 Overconfident Intervention 4
Table 25 continues
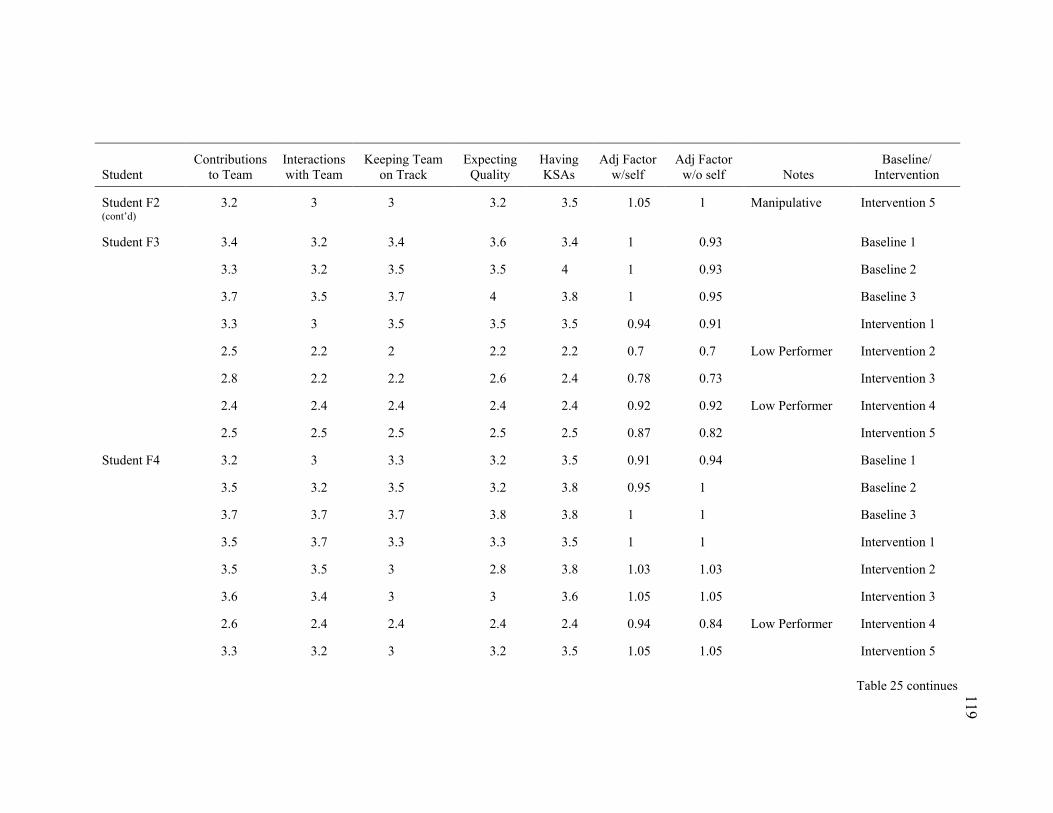
119
Student Contributions
to Team Interactions with Team
Keeping Team on Track
Expecting Quality
Having KSAs
Adj Factor w/self
Adj Factor w/o self Notes
Baseline/ Intervention
Student F2 (cont’d)
3.2 3 3 3.2 3.5 1.05 1 Manipulative Intervention 5
Student F3 3.4 3.2 3.4 3.6 3.4 1 0.93 Baseline 1
3.3 3.2 3.5 3.5 4 1 0.93 Baseline 2
3.7 3.5 3.7 4 3.8 1 0.95 Baseline 3
3.3 3 3.5 3.5 3.5 0.94 0.91 Intervention 1
2.5 2.2 2 2.2 2.2 0.7 0.7 Low Performer Intervention 2
2.8 2.2 2.2 2.6 2.4 0.78 0.73 Intervention 3
2.4 2.4 2.4 2.4 2.4 0.92 0.92 Low Performer Intervention 4
2.5 2.5 2.5 2.5 2.5 0.87 0.82 Intervention 5
Student F4 3.2 3 3.3 3.2 3.5 0.91 0.94 Baseline 1
3.5 3.2 3.5 3.2 3.8 0.95 1 Baseline 2
3.7 3.7 3.7 3.8 3.8 1 1 Baseline 3
3.5 3.7 3.3 3.3 3.5 1 1 Intervention 1
3.5 3.5 3 2.8 3.8 1.03 1.03 Intervention 2
3.6 3.4 3 3 3.6 1.05 1.05 Intervention 3
2.6 2.4 2.4 2.4 2.4 0.94 0.84 Low Performer Intervention 4
3.3 3.2 3 3.2 3.5 1.05 1.05 Intervention 5
Table 25 continues
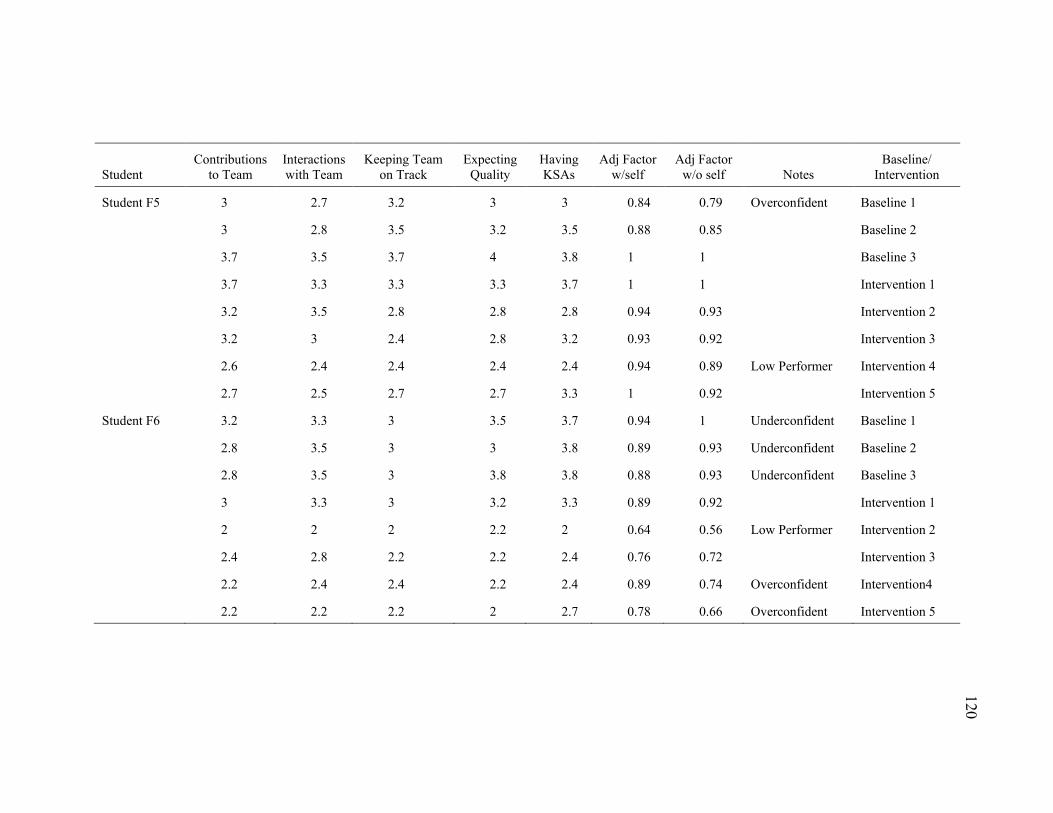
120
Student Contributions
to Team Interactions with Team
Keeping Team on Track
Expecting Quality
Having KSAs
Adj Factor w/self
Adj Factor w/o self Notes
Baseline/ Intervention
Student F5 3 2.7 3.2 3 3 0.84 0.79 Overconfident Baseline 1
3 2.8 3.5 3.2 3.5 0.88 0.85 Baseline 2
3.7 3.5 3.7 4 3.8 1 1 Baseline 3
3.7 3.3 3.3 3.3 3.7 1 1 Intervention 1
3.2 3.5 2.8 2.8 2.8 0.94 0.93 Intervention 2
3.2 3 2.4 2.8 3.2 0.93 0.92 Intervention 3
2.6 2.4 2.4 2.4 2.4 0.94 0.89 Low Performer Intervention 4
2.7 2.5 2.7 2.7 3.3 1 0.92 Intervention 5
Student F6 3.2 3.3 3 3.5 3.7 0.94 1 Underconfident Baseline 1
2.8 3.5 3 3 3.8 0.89 0.93 Underconfident Baseline 2
2.8 3.5 3 3.8 3.8 0.88 0.93 Underconfident Baseline 3
3 3.3 3 3.2 3.3 0.89 0.92 Intervention 1
2 2 2 2.2 2 0.64 0.56 Low Performer Intervention 2
2.4 2.8 2.2 2.2 2.4 0.76 0.72 Intervention 3
2.2 2.4 2.4 2.2 2.4 0.89 0.74 Overconfident Intervention4
2.2 2.2 2.2 2 2.7 0.78 0.66 Overconfident Intervention 5
121
For each of these statements, students responded with one of the following numerical
ratings:
x 1 = Strongly Disagree
x 2 = Disagree
x 3 = Neither Agree Nor Disagree
x 4 = Agree
x 5 = Strongly Agree.
What is the trend line for student satisfaction with teams? Listed in Table 26
are the average semester satisfaction ratings for each team, along with single case study
analysis based on the six variables to determine between phase data patterns.
Inconsistencies in the data do not lead to an overall conclusion that there is significant
evidence that teams training produces an increased team satisfaction level.
Visual analysis is also used to analyze each team’s average satisfaction score of
every baseline and intervention assessment over the course of the semester. In the graphs
following the team semester average data, every teams’ satisfaction data reported over
the course of the eight measures is graphed using visual analysis techniques.
A Phase to B Phase means difference and team satisfaction. In regards to
significance of team satisfaction data, there were no significant increases or decreases in
team satisfaction on any team as the semester advanced. Table 27 outlines the numerical
increases and decreases in A phase to B phase means for each team based on eight data
collection points over the course of the fall semester.

122
Table 26
Semester Team Satisfaction: Six Variables to Determine Within and Between Phase Data Patterns
Calculated Means Slope Range Immediacy of the
Effect
Overlap of Data
Between Phases
Consistency of Data
Team Overall Mean
Phase A (Series 1)
Mean
Phase B (Series 2)
Mean Phase B (Series 2) Significant Slope
Between Phase Slope
Highest Data Point - Lowest
Data Point
Change in Level from Phase A (Series 1) to
Phase B (Series 2)
None, Minimal, Moderate,
or Significant Yes or No
Team A 4.47 4.37 4.534 0.07 0.17 0.45 0.093 None Yes
Team B 4.09 3.94 4.184 0.73 0.13 0.69 0.0467 Moderate Yes
Team C 4.599 4.567 4.618 0.5 0.17 0.61 (-).027 Moderate Yes
Team D 4.688 4.72 4.666 0.33 (-).17 0.33 (-).077 Significant No
Team E 3.99 4.02 3.972 0.21 (-).17 0.42 (-).11 Significant No
Team F 2.895 3.2 2.71 (-).67 0.16 1.11 (-).46 Moderate No
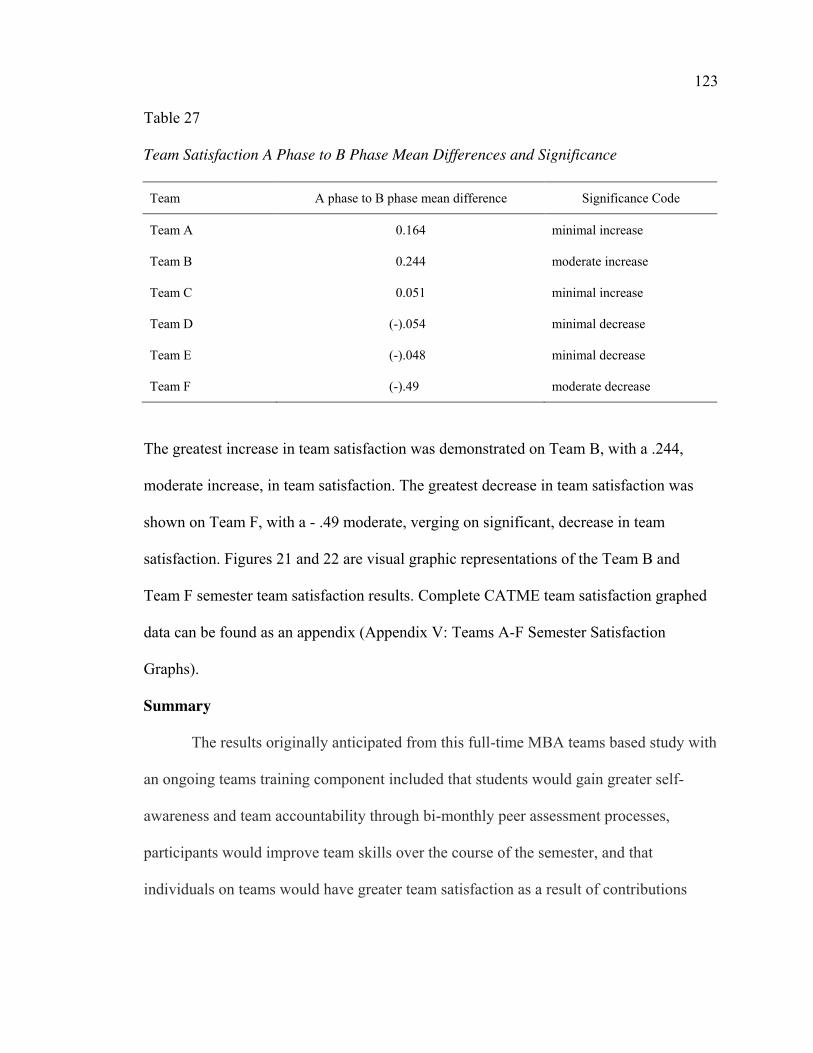
123
Table 27
Team Satisfaction A Phase to B Phase Mean Differences and Significance
Team A phase to B phase mean difference Significance Code
Team A 0.164 minimal increase
Team B 0.244 moderate increase
Team C 0.051 minimal increase
Team D (-).054 minimal decrease
Team E (-).048 minimal decrease
Team F (-).49 moderate decrease
The greatest increase in team satisfaction was demonstrated on Team B, with a .244,
moderate increase, in team satisfaction. The greatest decrease in team satisfaction was
shown on Team F, with a - .49 moderate, verging on significant, decrease in team
satisfaction. Figures 21 and 22 are visual graphic representations of the Team B and
Team F semester team satisfaction results. Complete CATME team satisfaction graphed
data can be found as an appendix (Appendix V: Teams A-F Semester Satisfaction
Graphs).
Summary
The results originally anticipated from this full-time MBA teams based study with
an ongoing teams training component included that students would gain greater self-
awareness and team accountability through bi-monthly peer assessment processes,
participants would improve team skills over the course of the semester, and that
individuals on teams would have greater team satisfaction as a result of contributions
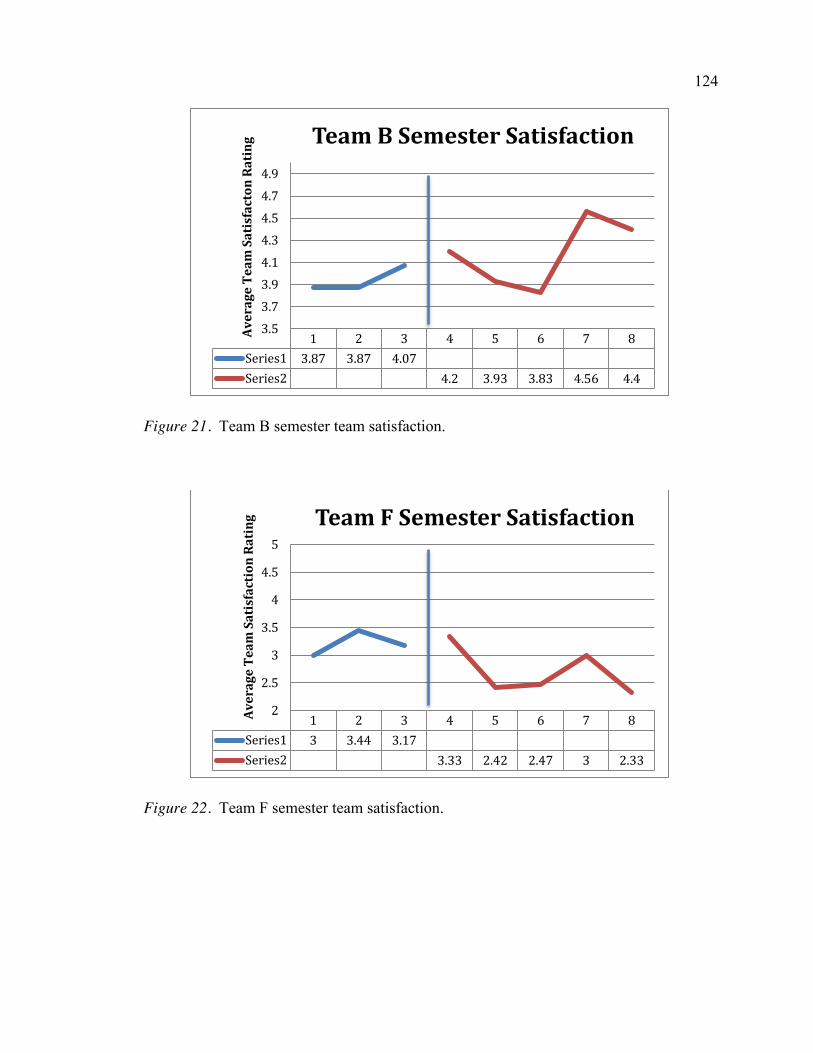
124
Figure 21. Team B semester team satisfaction.
Figure 22. Team F semester team satisfaction.
1 2 3 4 5 6 7 8
Series1 3.87 3.87 4.07
Series2 4.2 3.93 3.83 4.56 4.4
3.5
3.7
3.9
4.1
4.3
4.5
4.7
4.9
Aver
age
Team
Sat
isfa
cton
Rat
ing Team B Semester Satisfaction
1 2 3 4 5 6 7 8
Series1 3 3.44 3.17
Series2 3.33 2.42 2.47 3 2.33
2
2.5
3
3.5
4
4.5
5
Aver
age
Team
Sat
isfa
ctio
n Ra
ting
Team F Semester Satisfaction

125
from the teams training process. Based on both the study’s quantitative and qualitative
data, these hypotheses are partially correct. Although the findings of this study
demonstrate that teams training, amongst other factors, does contribute to improving
team skills on the five CATME team dimensions, data does not indicate that teams
training significantly contributes to team satisfaction among team members.
126
Chapter 5
Conclusion
Introduction
The purpose of this mixed methods, quantitative and qualitative single case study
design is to explore whether there is evidence that MBA teams training contributes to
team skills development, and student team satisfaction in the first semester of a full-time
MBA program in order to improve the overall quality of the student culture in the
business school at a large Midwestern Research I university. This chapter will
incorporate a brief review of the study’s results and findings, discuss an assessment of the
significance of the research findings and conclusions, and comprise a list of
recommendations for future research and practice.
Study Review
Overview. This study was broken into 3 main components. The first component
included a quantitative element utilizing regular assessment readings of participants on
the CATME (Comprehensive Assessment of Team Member Effectiveness) on the 5 team
dimensions of Contributions to the Team, Interactions with Team, Keeping Team on
Track, Expecting Quality, and Having KSAs. The second piece of the study incorporated
qualitative team advising sessions, in a focus group atmosphere, led mid semester for all
participants in teams A – F. The third and final dimension of the study was leading
qualitative based individual interviews with 9 of the 35 study participants. These
9 participants’ CATME scores were thoroughly analyzed using single case research
methods to measure team skills development in their first semester of the MBA

127
experience. Qualitative findings from team advising sessions and individual interviews
were documented, categorized, and coded for research patterns and themes.
Key Findings
Factors contributing to team skills development.
Student perceptions. All of the nine students examined in the single case
research component of this study improved their team skills on at least two of the five
CATME team dimensions over the course of the semester. Various reasons were
documented on why participants thought their team skills improved over the course of the
semester. The teams training sessions were certainly discussed as one factor, with a focus
on the benefits from the Team Charter activity. Other reasons students mentioned as
reasons for team skills development include: having a good attitude, previous experiences
with teams, and knowledge of communication theory and techniques.
One of the more interesting responses received regarding student perceptions of
team skills development, was a similar response given by the two male international
students, Students A5 and C2, that participated in the single case research component of
the study. These international students mentioned that they think teammates may have
questioned their abilities and had biases towards what contributions they may be able to
make to the team as international students at the beginning of the semester. The students
believed that their teammates as a result rated students based on these biases, on the
CATME assessment, at the beginning of the semester. Once teammates viewed the value,
knowledge, skills, and contributions these international students were making to the team,
this was represented on the CATME as team skills development. Student A5 improved at
128
a moderate level or above on four of the five CATME team dimensions, and Student C2
improved at a moderate level or above on three of the five dimensions.
In contrast, the female international student that participated in the study, Student
C6, mentioned that it does not surprise her that her team skills ratings from her peers
gradually increased over the course of the semester. The reasoning she stated for this was
that she held herself back from full participation for the first couple weeks in the program
until she felt like she better knew and understood her teammates. After working together
with her teammates for a couple weeks on academic assignments, participating in teams
training sessions, and getting to know better their personal and professional style, she
then felt more comfortable making significant contributions to the team. This student
demonstrated moderate to highly significant improvement on her CATME scores for all
five team skills dimensions areas.
A trait repeatedly mentioned by participants in the single case research interviews,
is the importance of bringing a good attitude and willingness to learn. All of the students
mentioned this being a crucial trait to bring into the team environment. A full listing of
students’ perceptions of team skills development and improvement are documented in
Table 28.
Student perceptions of the CATME. The team advising sessions and individual
interviews revealed an overall favorable impression of the CATME assessment. Some
students stated that they found the feedback helpful to gauge their team skills
development in reference to their teammates. Others mentioned that CATME had
therapeutic value in rating down a teammate that had not pulled his or her weight in terms
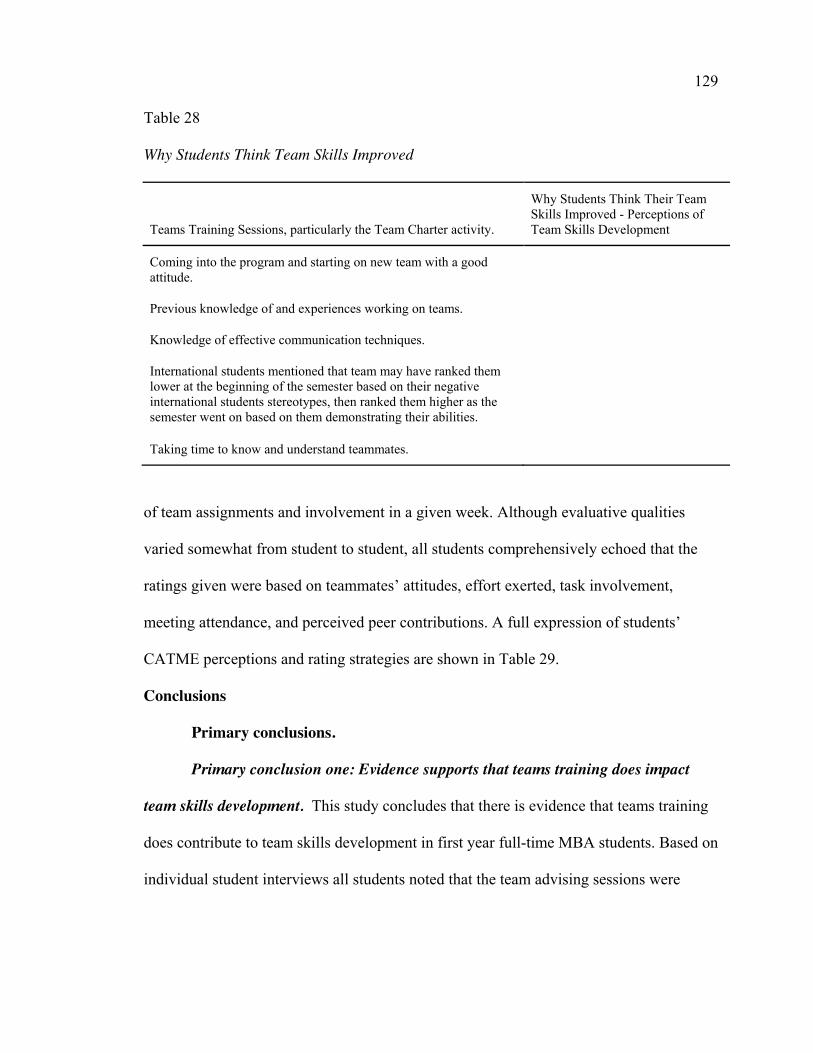
129
Table 28
Why Students Think Team Skills Improved
Teams Training Sessions, particularly the Team Charter activity.
Why Students Think Their Team Skills Improved - Perceptions of Team Skills Development
Coming into the program and starting on new team with a good attitude.
Previous knowledge of and experiences working on teams.
Knowledge of effective communication techniques.
International students mentioned that team may have ranked them lower at the beginning of the semester based on their negative international students stereotypes, then ranked them higher as the semester went on based on them demonstrating their abilities.
Taking time to know and understand teammates.
of team assignments and involvement in a given week. Although evaluative qualities
varied somewhat from student to student, all students comprehensively echoed that the
ratings given were based on teammates’ attitudes, effort exerted, task involvement,
meeting attendance, and perceived peer contributions. A full expression of students’
CATME perceptions and rating strategies are shown in Table 29.
Conclusions
Primary conclusions.
Primary conclusion one: Evidence supports that teams training does impact
team skills development. This study concludes that there is evidence that teams training
does contribute to team skills development in first year full-time MBA students. Based on
individual student interviews all students noted that the team advising sessions were
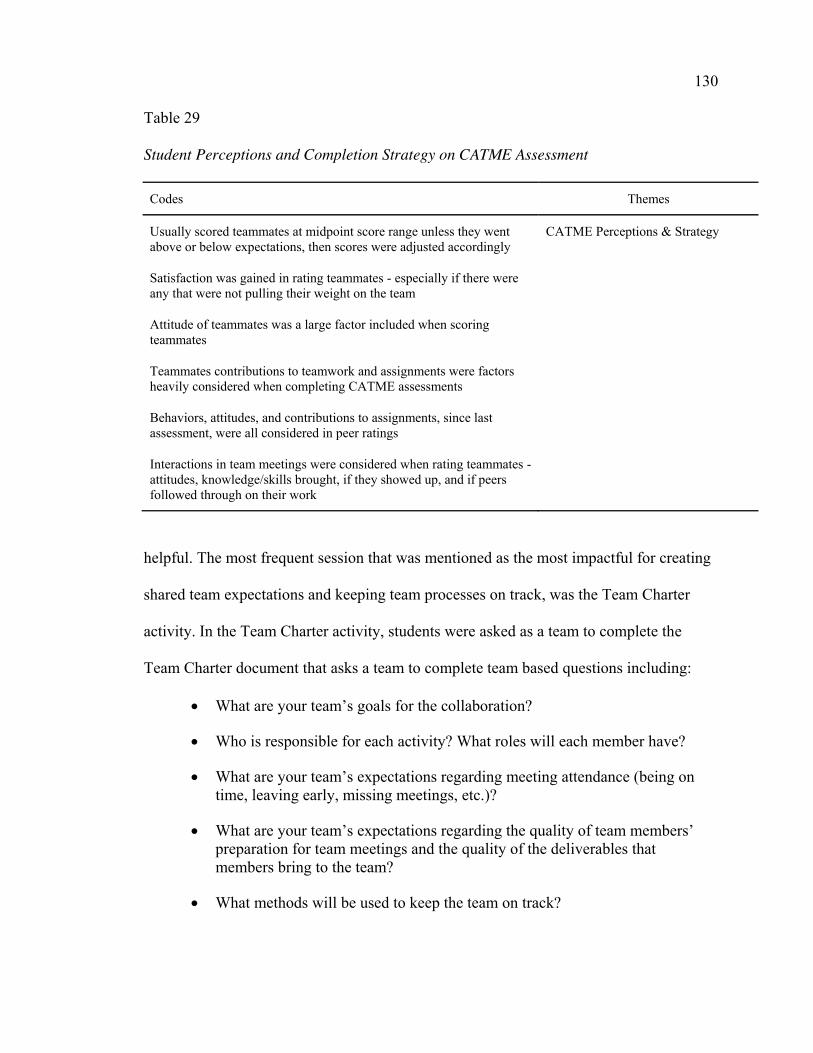
130
Table 29
Student Perceptions and Completion Strategy on CATME Assessment
Codes Themes
Usually scored teammates at midpoint score range unless they went above or below expectations, then scores were adjusted accordingly
CATME Perceptions & Strategy
Satisfaction was gained in rating teammates - especially if there were any that were not pulling their weight on the team
Attitude of teammates was a large factor included when scoring teammates
Teammates contributions to teamwork and assignments were factors heavily considered when completing CATME assessments
Behaviors, attitudes, and contributions to assignments, since last assessment, were all considered in peer ratings
Interactions in team meetings were considered when rating teammates - attitudes, knowledge/skills brought, if they showed up, and if peers followed through on their work
helpful. The most frequent session that was mentioned as the most impactful for creating
shared team expectations and keeping team processes on track, was the Team Charter
activity. In the Team Charter activity, students were asked as a team to complete the
Team Charter document that asks a team to complete team based questions including:
x What are your team’s goals for the collaboration?
x Who is responsible for each activity? What roles will each member have?
x What are your team’s expectations regarding meeting attendance (being on time, leaving early, missing meetings, etc.)?
x What are your team’s expectations regarding the quality of team members’ preparation for team meetings and the quality of the deliverables that members bring to the team?
x What methods will be used to keep the team on track?
131
The content of the Teams Charter questions were directed towards team collaboration,
understanding, expectations, and keeping the team on track. Considering that students
voiced in individual interviews that the Teams Charter activity as the most helpful teams
training session, improvement in these related areas are directly connected to the
improvement of team skills on the CATME assessment, particularly in connection to the
Keeping Team on Track and Expecting Quality team skills development dimensions.
Of the students participating in the single case research component of the study,
the greatest increase of CATME assessment ratings from the A phase to B phase was
demonstrated on the Keeping Team on Track and Expecting Quality team dimensions.
These increases of participants’ team skills are demonstrated in the figures and tables
below. Figure 23 shows the number of single case research design participants at
moderate or above levels on the five CATME team dimensions of Contributions to Team,
Interactions on Team, Keeping Team on Track, Expecting Quality, and Having KSA’s.
Students performed the best on the dimensions of Keeping Team on Track and Expecting
Quality. Nine out of nine students improved their team skills on the dimension of
Keeping Team on Track, and eight out of nine students improved their team skills on the
dimension of Expecting Quality.
Table 30 exhibits the A phase to B phase differences on all five CATME
dimensions, including detailed significance of increase or decrease in ratings. The
Keeping Team on Track dimension included five significant and four moderate team skill
increases for participants from the A to B phase. On the Expecting Quality team
dimension, of those eight single case participants that improved their A to B phase team

132
Figure 23. Number of single case research participants demonstrating improvement at
moderate level or above on CATME team dimensions.
skills ratings at a moderate level or above, five students increased their ratings at a
moderate level and the remaining three improved their scores at a significant level.
According to Chen et al. (2004) “not enough has been done in educational
settings, particularly in higher education settings, to explicitly develop teamwork KSAs,”
referring to teamwork knowledge, skills, and abilities. The lack of teams training in
higher education may in part exist due to the disparity in opinions of the importance of
teams based training from corporate representatives versus educators in higher education.
Although MBA programs are committed to the concept of teamwork, there is minimal
teams training that goes into the MBA teams process, and the teams training that is
offered is rarely founded on research or delivered in a systematic format.
3
6
9 8
6
Contributionsto Team
Interactionswith Team
KeepingTeam on
Track
ExpectingQuality
Having KSAs
Number of Single Case Research Participants Demonstrating A Phase to B Phase Improvement at
Moderate Level or Above On CATME Team Dimensions
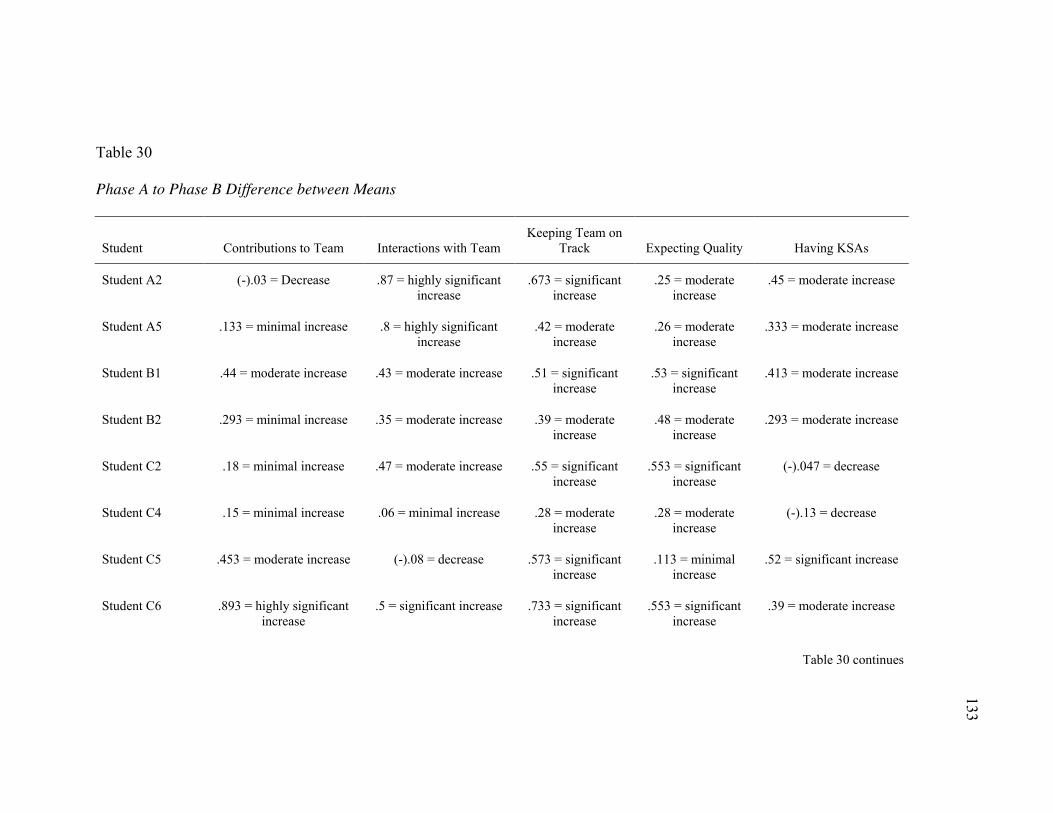
133
Table 30
Phase A to Phase B Difference between Means
Student Contributions to Team Interactions with Team Keeping Team on
Track Expecting Quality Having KSAs
Student A2 (-).03 = Decrease .87 = highly significant increase
.673 = significant increase
.25 = moderate increase
.45 = moderate increase
Student A5 .133 = minimal increase .8 = highly significant increase
.42 = moderate increase
.26 = moderate increase
.333 = moderate increase
Student B1 .44 = moderate increase .43 = moderate increase .51 = significant increase
.53 = significant increase
.413 = moderate increase
Student B2 .293 = minimal increase .35 = moderate increase .39 = moderate increase
.48 = moderate increase
.293 = moderate increase
Student C2 .18 = minimal increase .47 = moderate increase .55 = significant increase
.553 = significant increase
(-).047 = decrease
Student C4 .15 = minimal increase .06 = minimal increase .28 = moderate increase
.28 = moderate increase
(-).13 = decrease
Student C5 .453 = moderate increase (-).08 = decrease .573 = significant increase
.113 = minimal increase
.52 = significant increase
Student C6 .893 = highly significant increase
.5 = significant increase .733 = significant increase
.553 = significant increase
.39 = moderate increase
Table 30 continues
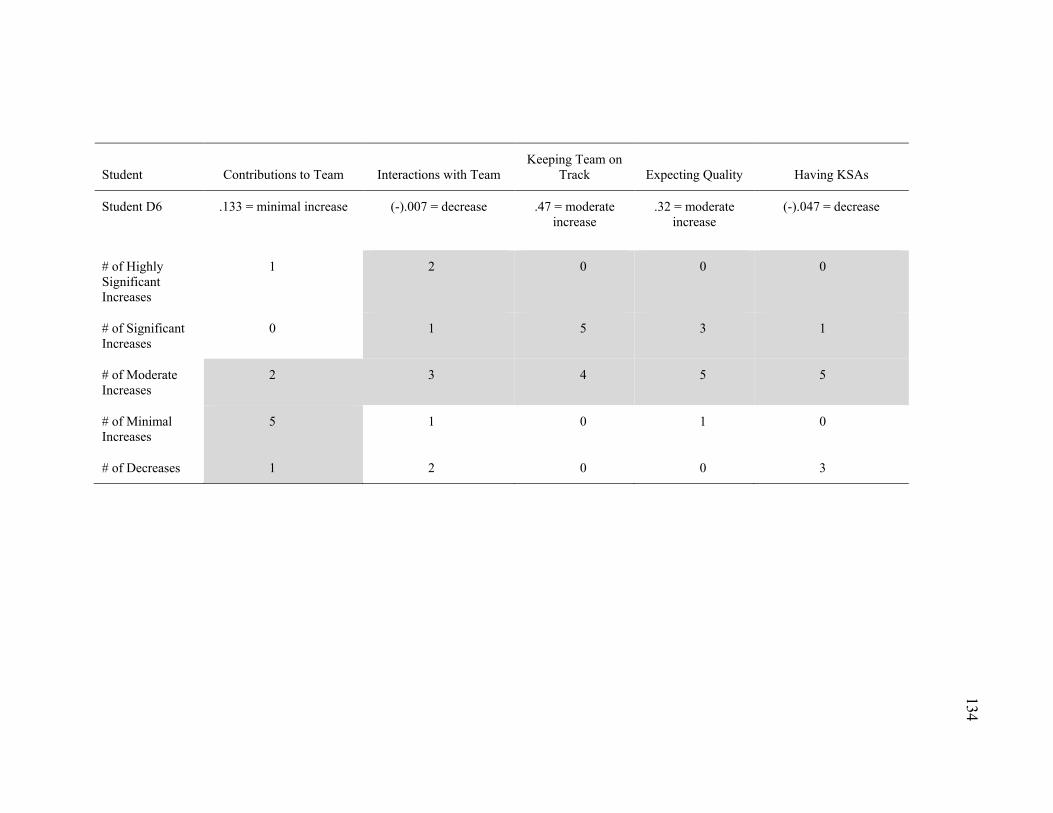
134
Student Contributions to Team Interactions with Team Keeping Team on
Track Expecting Quality Having KSAs
Student D6 .133 = minimal increase (-).007 = decrease .47 = moderate increase
.32 = moderate increase
(-).047 = decrease
# of Highly Significant Increases
1 2 0 0 0
# of Significant Increases
0 1 5 3 1
# of Moderate Increases
2 3 4 5 5
# of Minimal Increases
5 1 0 1 0
# of Decreases 1 2 0 0 3
135
Roth (1989) states that the lack of soft skills that are promoted and taught in the
MBA school environment creates a clear disconnect between the academic business
environment and the corporate world. This creates a clear need for the development of
more soft skills based programming and curriculum for MBA programs. Teams training
is an example of this kind of soft skills training that is still greatly needed in the graduate
business school environment, and is demonstrated as a strong contributing factor to
developing team skills in first year, full-time MBA students.
Primary conclusion two: Evidence does not support that teams training impacts
student team satisfaction. This study concludes that there is not significant evidence to
support that the teams training process in first year full-time MBA students contributes to
student team satisfaction. Based on the eight CATME assessment readings from students
on teams A-F, each student’s satisfaction data from each team was averaged to give a
team satisfaction average for each reading. These satisfaction averages were generated
for each team for every assessment period. Over the course of the fall semester, just as
team skills development ratings were analyzed, so were satisfaction ratings. Every
assessment asked students to respond to three team satisfaction based statements. These
statements include:
x I am satisfied with my present teammates
x I am pleased with the way my teammates and I work together
x I am very satisfied with working in this team
For each of these statements, students responded with one of the following numerical
ratings:
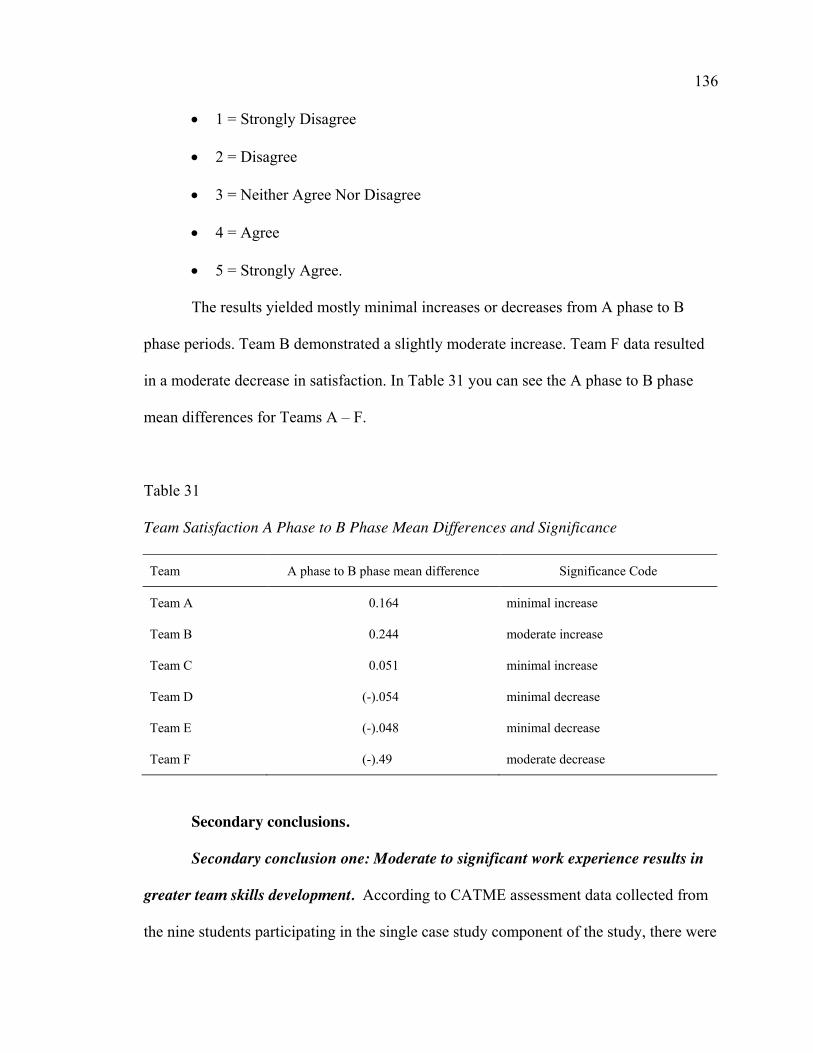
136
x 1 = Strongly Disagree
x 2 = Disagree
x 3 = Neither Agree Nor Disagree
x 4 = Agree
x 5 = Strongly Agree.
The results yielded mostly minimal increases or decreases from A phase to B
phase periods. Team B demonstrated a slightly moderate increase. Team F data resulted
in a moderate decrease in satisfaction. In Table 31 you can see the A phase to B phase
mean differences for Teams A – F.
Table 31
Team Satisfaction A Phase to B Phase Mean Differences and Significance
Team A phase to B phase mean difference Significance Code
Team A 0.164 minimal increase
Team B 0.244 moderate increase
Team C 0.051 minimal increase
Team D (-).054 minimal decrease
Team E (-).048 minimal decrease
Team F (-).49 moderate decrease
Secondary conclusions.
Secondary conclusion one: Moderate to significant work experience results in
greater team skills development. According to CATME assessment data collected from
the nine students participating in the single case study component of the study, there were

137
patterns of team skills improvement that clustered around work experience. Students with
less than six months work experience only showed growth at a moderate level or above
on two of the five CATME team dimensions. Alternatively, all participating students with
more than six months of prior work experience showed moderate level or above
improvement on at least three of the five team dimensions. Students that had two to seven
years work experience showed moderate or above growth on three of the five CATME
team dimensions. Students with six months to two years work experience, and those with
eight to ten years of work experience, demonstrated growth on four to five team
dimensions. This data is further illustrated in Figure 24.
Figure 24. Work experience and number of team skills dimensions improved at
moderate level or above during fall semester.
0
1
2
3
4
5
> 6 mos 6 mos - 2years
2 - 7 years 8 - 10years
Series1 2 4.67 3 4
Aver
age
Num
ber o
f Tea
m S
kills
D
imen
sion
s Im
prov
ed
Work Experience and Number of Team Skills Dimensions Improved at Moderate Level or
Above During Fall Semester
138
This data is supported in a 2009 GMAC (Graduate Management Admission
Council) article focused on the value of work experience in MBA students and concludes
that “the quantity of individuals’ career work experience, in terms of total years of
experience prior to entering the MBA program is an important criterion to consider when
admitting students” (DeRue, 2009). The article goes on to say that in reference to MBA
teams and workgroups, using team activities to build learning experiences that will give
students with less experience a more profound reference point is important. This is a
valuable lesson for MBA educators and administrators.
The research of Rubin and Dierdorff (2009) found that the skills needed to be
successful in the corporate world do not line up with the required MBA coursework in
many U.S. MBA programs. These researchers go on to state that, “Because MBA
programs are founded on the notion that they train future managers, overlap between
managerial competencies should be present.” The team skills that can be taught by MBA
educators, and acquired by first year full-time MBA students, through teams training
sessions can assist with students gaining the managerial competencies needed to be
successful in the corporate world. Gaining this team skills knowledge is especially
essential to full-time MBA students that typically have much less professional experience
than students in Professional and Executive MBA programs.
Secondary conclusion two: The MBA academic teams experience does impact
the overall MBA experience and culture. With the exception of the varied responses
from Team F, all other teams expressed in full agreement in their team advising sessions
that the MBA academic teams experience does impact the overall MBA experience and
culture. The primary themes that came out of these sessions are featured below.
139
x Positive MBA team experience impact the overall MBA experience.
x The team is the primary vehicle of socializing in MBA culture.
x Bad team = Bad MBA experience.
These findings further the case that the team experience is crucial in the overall context
of the quality of the MBA experience and culture for students.
In continued support of the statements highlighted above, Team F that expressed
and demonstrated a negative experience particularly in reference to the team satisfaction
and comments documented on the CATME assessment, did not have a positive team
experience in their first semester in the MBA program. This poor experience was
additionally echoed and viewed in their team advising session as well as regular teams
training activities. Unfortunately this dysfunctional team experience contributed to
factors involved in one of the members choosing to leave the MBA program.
Recommendations for Future Research & Practice
Maximizing students’ past work experience & team skills development on
academic teams. In a 2009 GMAC study researching work experience as a predictor of
MBA student success, the study explores the question of why top ranked MBA programs
require students to have prior work experience to be admitted, and the value of these
requirements. Does work experience serve as a predictor of MBA student and academic
success? This 2009 study concluded that work experience is indeed a crucial factor to
consider before admitting prospective MBA students. The study found that “the total
years of work experience that students have prior to entering their MBA program
positively predicts whether they hold a formal leadership position in the MBA program,
their internship performance, and their starting full-time salary upon graduation,”

140
(DeRue, 2009). The article based on this study also mentions that in addition to using
these results to make well-founded admission decisions, these findings can also be used
to enrich student development programming.
Based on the 2009 GMAC study highlighted above, and the secondary conclusion
from this team skills development study that moderate to significant work experience
results in greater team skills development, one suggestion for further research is taking a
deeper look at work experience and team skills development. Researching the impact of
strategic placement of students on teams with more or less work experience has
significant potential. This research could assist in finding a new model for team
development and formation in the MBA academic teams setting that could create
advanced opportunities for student learning.
Regarding practical suggestions for MBA administrators currently working with
academic teams, it has been demonstrated in this teams skills development research that
work experience does matter to teaming processes and developing team skills.
Considering this work experience component for building and assigning MBA academic
teams, evenly distributing students with more and less work experience amongst various
teams can assist with the overall peer learning process.
Perceptions of international students & cultural barriers on MBA academic
teams. International participants in this team skills development study all mentioned
various challenges involved with being an international student on a MBA academic
team. The findings from this study, involving cultural barriers and potential perceptions
of international students on MBA teams, have implications for future research and
immediate practice for offices of MBA student services.

141
In regards to future research, basing a study on the international student team
experience and perceptions of domestic teammates, has the potential to yield
transformative results. Conducting focused research on students’ perceptions of
international students versus domestic students on MBA teams, how these perceptions
change over the course of time working together, and how perceptions are different from
students with more or less international travel experience, would be valuable research for
MBA educators. Results from this kind of study could assist in building more effective
MBA academic teams, providing helpful information to develop informed cultural
programming for international students prior to participating in their first MBA and
American business team, and give specific information to present to American students
regarding cultural awareness training tailored explicitly for the MBA student
environment.
When considering translating this cultural team awareness to a MBA student
affairs environment, there are immediate implications for practice. First and foremost,
culture in and of itself is a learning experience for students, particularly full-time MBA
students with no or minimal work experience. These teams, with proper guidance and
advising, can learn as much in the team environment as the classroom environment. By
strategically placing international students on different teams with other students with
varied demographics, while simultaneously adding cultural based programming into the
fabric of the teams development process, both international students and domestic
students have the potential to build essential business skills necessary to be effective
business leaders in the global business landscape.
142
Final Thoughts
In the well known 1988 Porter and McKibbin report, there were six primary
qualities of an ideal MBA program identified. These characteristics were
multidisciplinary integration, experiential learning, soft-skill development, a global
perspective, information technology focus, and ethics and corporate social responsibility.
According to Navarro’s 2008 research, “Today’s MBA curriculum remains far from the
ideal identified in the prescriptive literature.” Incorporation of a formalized teams
training process, in the graduate business environment with full-time MBA students, is an
important factor in building the soft skills that students need in order for programs to
deliver prepared business professionals.
MBA teams have a tremendous amount of potential for student learning and
impact, but are a largely underutilized learning environment for graduate business
students. Crafting focused research around MBA teams and implementing well-informed
and intentional team development solutions to improve overall team skills, will better
prepare students for the business environment. It is the job of every MBA administrator
to not only accurately place students on their academic teams, but also to create a
comprehensive process to educate students on teams how to effectively lead, manage,
navigate, and communicate in the graduate business environment. Exploring related
research and tapping the full potential of the MBA academic teams environment, through
formalized team skills development programs, is one way to bridge the gap between the
soft skills and hard skills needed for students to become knowledgeable about business
while also becoming the employees that managers want to hire and promote.
143
References
AACSB. (n.d.). Retrieved from www.aacsb.edu
AACSB. (2013). Business Accreditation Standards. Retrieved from
http://www.aacsb.edu/en/accreditation/standards/2013-business/
Aguinis, H., & Kraiger, K. (2009). Benefits of training and development for individuals
and teams, organizations, and society. The Annual Review of Psychology, 60,
451-474.
Allen, J., & Bresciani, M. J. (2003). Public institutions, public challenges. Change, 35(1),
20-23.
Bedell, M. D. (1996). The influence of M.B.A. student team composition and process of
learning achievement and attitudes (unpublished doctoral dissertation). Indiana
University, Bloomington, IN.
Bennis, W. G., & O’Toole, J. (2005). How business schools lost their way. Harvard
Business Review, 83(5), 96-104.
Brill, R. T., Gilfoil, D. M., & Doll, D. (2014, Third Quarter). Exploring predictability of
instructor ratings using a qualitative tool for evaluating soft skills among MBA
students. American Journal of Business Education (Online), 175-181.
Brooks, L. M. (2006). Corporate and academic views on the importance of an MBA
graduate skill set and the effectiveness of the U.S. Master’s of Business
Administration curriculum in developing those skills (Unpublished doctoral
dissertation). University of Nebraska, Lincoln, NE.

144
Butler, D., Forbes, B., & Johnson, L. (2008, March/April). An examination of a skills-
based leadership coaching course in an MBA program. Journal of Education for
Business, 227-232.
CATME. (n.d.). Retrieved from www.info.catme.org
Chen, G., Donahue, L. M., & Klimoski, R. J. (2004). Training undergraduates to work in
organizational teams. Academy of Management Learning and Education, 3(1),
27-40.
Cohen, S. G., & Bailey, D. E. (1997). What makes teams work: Group effectiveness
research from the shop floor to the executive suite. Journal of Management,
23(3), 239-290.
Collins, E. (2012). The rise of specialized MBA programs and how they will benefit the
world at large. Initiative for a Competitive Inner City. Retrieved from
http://www.icic.org
Creswell, J. (2007). Qualitative inquiry & research design: Choosing among five
approaches. Thousand Oaks, CA: Sage Publications, Inc.
Creswell, J., & Miller, D. (2000, Summer). Determining validity in qualitative inquiry.
Theory Into Practice, 39(3), 124-130.
Cudd, M., & King, J. O. (1995). Assessment of the nature and status of the MBA
restructuring trend. Journal of Education for Business, 71(1), 44-48.
DeRue, D. S. (2009, September 9). Quantity or quality? Work experience as a predictor
of MBA student success. GMAC Research Reports. Retrieved from
http://www.gmac.com
145
Di Meglio. F. (2009, May 26). The future of business school. Bloomberg Business.
Retrieved from
http://www.bloomberg.com/bschools/content/may2009/bs20090526_498100.htm
Dobson, G., Frye, R., & Mantena, R. (2013). Leadership training in an MBA program
using peer-led team learning. American Journal of Business Education, 6(2),
177-190.
Edgington, E. S. (1975). Randomization tests for one-subject operant experiments.
Journal of Psychology, 90, 57-68.
Edgington, E. S. (1992). Nonparametric tests for single-case experiments. In T. R.
Kratochwill & J. R. Levin (Eds.), Single-case research design and analysis
(pp.133-157). Hillsdale, NJ: Erlbaum.
Enos, R. (2012). What MBA programs lack: Management training. The Washington Post.
Retrieved from http://www.washingtonpost.com
Friga, N., Bettis, R. A., & Sullivan, R. S. (2003). Changes in graduate management
education and new business school strategies for the 21st century. Academy of
Management and Education, 2(3), 233-249.
George Mason University. (n.d.). Retrieved from
http://psychology.gmu.edu/courses/1550
Goldstein, I. L., & Ford, J. K. (2002). Training in organizations. Belmont, CA:
Wadsworth.
Graduate Management Admission Council. (2013a). Disrupt or be disrupted: A blueprint
for change in management education. San Francisco, CA: Jossey-Bass.
146
Graduate Management Admission Council. (2013b). GMAC 2013 business school follow
up. Retrieved from http://www.gmac.com
Hackman, J. R., & Walton, R. E. (1986). Leading groups in organizations. In
P. S. Goodman (Ed.), Designing effective work groups (pp. 72-119).
San Francisco: Jossey-Bass.
Herman, E. D. (2000). A case study of MBA teams: Creating faculty and institutional
support for building an environment that enhances team learning (Unpublished
doctoral dissertation). The Union Institute Graduate College, Cincinnati, OH.
Hobson, C. J., Strupeck, D., Griffin, A., Szostek, J., & Rominger, A. S. (2014). Teaching
MBA students teamwork and team leadership skills: An empirical evaluation of a
classroom educational program. American Journal of Business Education, 7(3),
191-212.
Hofstede, G., & Hofstede, G. J. (2005). Cultures and organizations: Software of the
mind. New York: McGraw-Hill.
Horner, R. H., Carr, E. G., Halle, J., McGee, G., Odom, S., & Wolery, M. (2005). The
use of single-subject research to identify evidence-based practice in special
education. Exceptional Children, 71(2), 165-179.
Jackson, E. (2012). The ten most dangerous things business school teaches MBAs.
Forbes. Retrieved from http://www.forbes.com
Katzenbach, J. R., & Smith, D. K. (1993). The wisdom of teams: Creating the high-
performance organization. Boston: Harvard Business School.
Kratochwill, T. R., Hitchcock, J., Horner, R. H., Levin, J. R., Odom, S. L.,
Rindskopf, D. M., & Shadish, W. R. (2010). Single-case designs technical
147
documentation. Retrieved from What Works Clearinghouse website:
http//ies.ed.gov/ncee/wwc/pdf/wwc_sed.pdf
Kratochwill, T. R., & Levin, J. R. (2010). Enhancing the scientific credibility of single-
case intervention research: Randomization to the rescue. Psychological Methods,
15(2), 124-144.
Levi, D. (2014). Group dynamics for teams. Thousand Oaks, CA: SAGE.
Loughry, M. L., Ohland, M. W., & Woehr, D. J. (2013). Assessing teamwork skills for
assurance of learning using catme team tools. Journal of Marketing Education,
20(10), 1-15.
Maellaro, R. (2008). Determining the ideal combination of interpersonal skills for MBA
graduates: A conjoint analysis study of hiring manager preferences (unpublished
doctoral dissertation). Fielding Graduate University, Santa Barbara, CA.
Marks, M., Sabella, M., Burke, C., & Zaccaro, S. (2002). The impact of cross-training on
team effectiveness. Journal of Applied Psychology, 81(1), 2-13.
Marshmallow Challenge (The). (n.d.). Retrieved from www.marshmallow challenge.com
Michaelsen, L. K., & Black, R. H. (1994) Building learning teams: The key to harnessing
the power of small groups in higher education. In S. Kadel & J. Keehner (Eds.),
Collaborative learning: A sourcebook for higher education (Vol. 2). State
College, PA: National Center for Teaching, Learning and Assessment.
Mintzberg, H. (2004). Managers, Not MBA’ s. San Francisco: Berrett-Koehler.
Navarro, P. (2008). The MBA core curricula of top-ranked U.S. business schools: A
study in failure? Academy of Management Learning & Education, 7(1), 108-123.

148
Ohland, M. W., Layton, R. A., Loughry, M. L., & Yuhasz, A. G. (2005). Effects of
behavioral anchors on peer evaluation reliability. Journal of Engineering
Education, 94(3), 319-326.
Patterson, K. (2006, May 17). Business Week Online. Taking on the cutthroat culture of
B-School. BusinessWeek. Retrieved from: http://www.businessweek.com
Plane Crash Survival Scenario. (n.d.). Retrieved from http://humanservices.ucdavis.edu
Porter, L. W., & McKibbin, L. E. (1988). Management education and development: Drift
or thrust into the 21st century? New York: McGraw-Hill.
Risi, K. M. (2005). The MBA in transition: Factors driving curricular change
(unpublished doctoral thesis). Drexel University, Philadelphia, PA.
Roth, W. F. (1989). Today's MBA: A lot to learn. Personnel, 66(5), 46-51.
Rubin, S. B., & Dierdorff, E. C. (2009). How relevant is the MBA? Assessing the
alignment of required curricula and required managerial competencies. Academy
of Management Learning & Education, 8(2), 208-224.
Saffo, P. (2007, July-August). Six rules for effective forecasting. Harvard Business
Review.
Salas, E., Wildman, J. L., & Piccolo, R. F. (2009). Using simulation-based training to
enhance management education. Academy of Management Learning & Education,
8(4), 559-573.
Sandeen, A., & Barr, M. J. (2006). Critical issues for student affairs. San Francisco:
Jossey Bass.
Shuayto, N. (2001). A study evaluating the critical managerial skills corporations and
business schools desire of MBA graduates (unpublished doctoral dissertation).

149
Wayne Huizenga Graduate School of Business and Entrepreneurship, Nova
Southeastern University, Fort-Lauderdale-Davie, FL.
Sinclair, K. E. (1997). Workforce competencies of college graduates. In H. F. O’Neil
(Ed.), Workforce readiness: Competencies and assessment (pp. 103-120).
Mahwah, NJ: Lawrence Erlbaum.
Snowman, J. & Bieler, R. F. (2003). Psychology applied to teaching (10th ed.). Boston,
MA: Houghton Mifflin.
Stevens, M. J., & Campion, M. A. (1994). The knowledge, skill, and ability requirements
for teamwork: Implications for human resource management. Journal of
Management, 20(2), 503-530.
Stewart, M. (2009). The management myth. New York: Norton.
Stott, P. (2009, March 25). A crisis in MBA culture. CNBC. Retrieved from
http://www.cnbc.com/id/29877474
Tonn, J. C., & Milledge V. (2002). Team building in an MBA “gateway” course: Lessons
learned. Journal of Management Education, 26(4), 415-428.
University of Pennsylvania Wharton MBA Website. (2014). Leadership and teamwork.
Retrieved from http://www.wharton.upenn.edu/mba/academics/leadership-and-
teamwork.cfm
Varela, O., Burke, M., & Michel, N. (2011). The development of managerial skills in
MBA programs. Journal of Management Development, 32(4), 435-452.
Yorks, L., Marsick, V. J., Kasl, E., & Dechant, K. (2003). Contextualizing team learning:
Implications for research and practice. Advances in Developing Human Resources
5(1), 103-117.
150
Appendix A
Team Class Syllabus
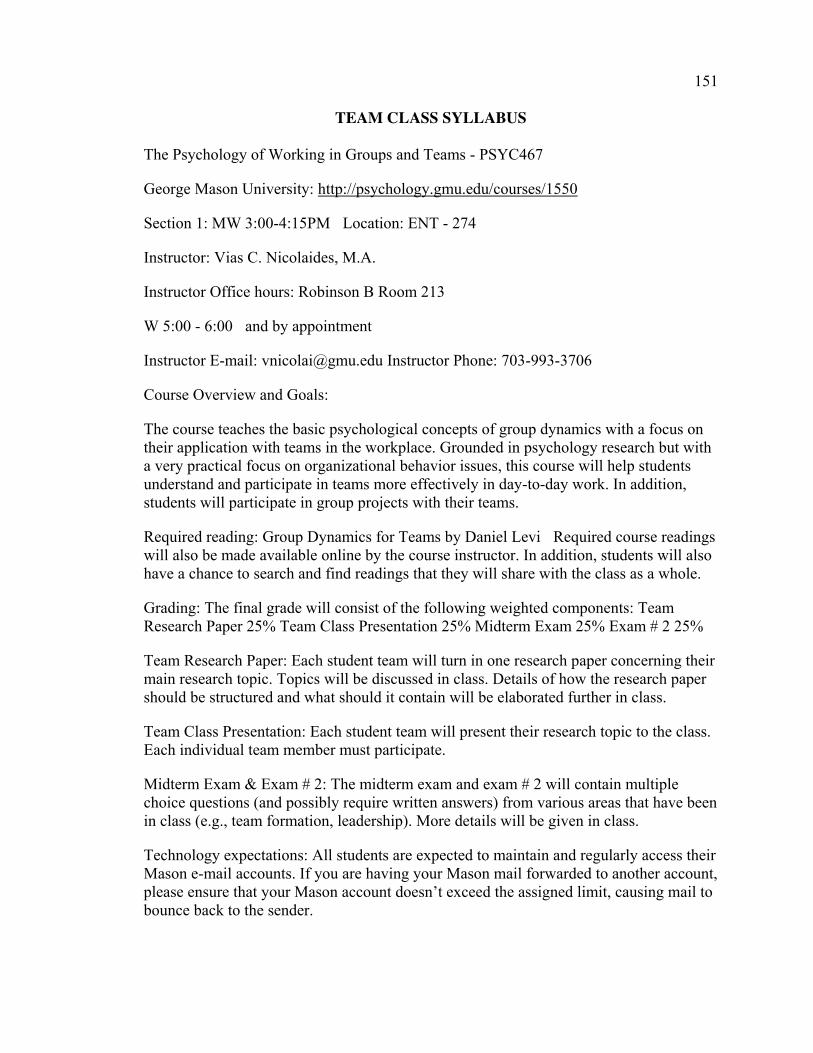
151
TEAM CLASS SYLLABUS
The Psychology of Working in Groups and Teams - PSYC467
George Mason University: http://psychology.gmu.edu/courses/1550
Section 1: MW 3:00-4:15PM Location: ENT - 274
Instructor: Vias C. Nicolaides, M.A.
Instructor Office hours: Robinson B Room 213
W 5:00 - 6:00 and by appointment
Instructor E-mail: [email protected] Instructor Phone: 703-993-3706
Course Overview and Goals:
The course teaches the basic psychological concepts of group dynamics with a focus on their application with teams in the workplace. Grounded in psychology research but with a very practical focus on organizational behavior issues, this course will help students understand and participate in teams more effectively in day-to-day work. In addition, students will participate in group projects with their teams.
Required reading: Group Dynamics for Teams by Daniel Levi Required course readings will also be made available online by the course instructor. In addition, students will also have a chance to search and find readings that they will share with the class as a whole.
Grading: The final grade will consist of the following weighted components: Team Research Paper 25% Team Class Presentation 25% Midterm Exam 25% Exam # 2 25%
Team Research Paper: Each student team will turn in one research paper concerning their main research topic. Topics will be discussed in class. Details of how the research paper should be structured and what should it contain will be elaborated further in class.
Team Class Presentation: Each student team will present their research topic to the class. Each individual team member must participate.
Midterm Exam & Exam # 2: The midterm exam and exam # 2 will contain multiple choice questions (and possibly require written answers) from various areas that have been in class (e.g., team formation, leadership). More details will be given in class.
Technology expectations: All students are expected to maintain and regularly access their Mason e-mail accounts. If you are having your Mason mail forwarded to another account, please ensure that your Mason account doesn’t exceed the assigned limit, causing mail to bounce back to the sender.

152
Attendance and decorum: Class attendance is not recorded, but it is important for students who want to do well to be in class, prepared, and attentive. In addition to other important information, extra credit opportunities may be announced in class and may often consist of in-class participation. Preparation for class includes completing readings and coming to class ready to discuss interesting topics. Lectures and debates will be more interesting and more meaningful for students who have done the reading in advance. In order to be attentive, you should not engage in any multi-tasking activities during class – that means no texting, e-mail, web surfing, doing homework for other classes, etc. Please turn off all cell phones and other potential sources of disruption at the start of class. During class, laptops may only be used for taking notes. If you must arrive late or leave early, please do so as quietly as possible and be considerate of your classmates by sitting near an exit.
Disability accommodations: If you are a student with a disability and you need academic accommodations, please see me early in the semester. If you have not already done so, contact the Office of Disability Services (ODS) at 703-993-2474. All academic accommodations must be arranged through that office. Please keep in mind that it might not be possible to grant last-minute requests for accommodations, so it important to make all arrangements well before the date when the accommodation is needed.
Honor code: All students are expected to be familiar with, and abide by, the University Honor Code. As required by the Honor Code, all suspected violations will be reported.
Important dates: Last day to add a class – September 4 Last day to drop a class – September 28
Enrollment: Every student is responsible for verifying correct enrollment. Graded work will not be returned to students who are not officially enrolled.
Disclaimer: The instructor reserves the right to change the syllabus and its content. Any changes will be announced orally and in writing.
The instructor for this course reserves the right to enter a failing grade to any student found guilty of an honor code violation.
Official Communications via GMU E-mail: Mason uses electronic mail to provide official information to students. Examples include communications from course instructors, notices form the library, notices about academic standing, financial aid information, class materials, assignments, questions, and instructor feedback.
Students are responsible for the content of university communication sent to their mason e-mail account, and are required to activate that account and check it regularly."

153
Date Details:
8-27 Introduction to Our Class
8-29 Formations of Student Teams
9-3 Characteristics of Teams (Chapter 1)
9-5 Understanding and Defining Team Success (Chapter 2)
9-10 Understanding and Defining Team Success (Chapter 2)
9-12 Team Beginnings (Chapter 3)
9-17 Team Beginnings (Chapter 3)
9-19 Basic Team Processes (Chapter 4)
9-24 Basic Team Processes (Chapter 4)
9-26 Cooperation & Competition (Chapter 5)
10-1 Cooperation & Competition (Chapter 5)
10-3 Communication (Chapter 6)
10-8 Communication (Chapter 6)
10-10 Midterm Exam
10-15 Conflict in Teams (Chapter 7)
10-17 Conflict in Teams (Chapter 7)
10-22 Power & Social Influence (Chapter 8)
10-24 Power & Social Influence (Chapter 8)
10-29 Decision Making (Chapter 9)
10-31 Decision Making (Chapter 9)
11-5 Leadership (Chapter 10)
11-7 Leadership (Chapter 10)
11-12 Problem Solving (Chapter 11)
11-14 Problem Solving (Chapter 11)
154
11-19 Exam # 2
11-21 Thanksgiving Recess
11-26 Team Class Presentations
Team Class Presentations
Team Class Presentations
Team Class Presentations
12-10 Reading Days
12-12 Reading Days
12-17 Final Exam Day 1:30 - 4:15 PM – Team Papers Due to Instructor electronically

155
Appendix B
Team Charter

156
TEAM CHARTER FOR TEAM #:___________
Team Member Names Contact Information (e-mail, cell, Facebook, etc.)
Preferred Contact Method / Limitations (ex. no calls after…)
Member 1 Contact 1 Pref 1
Member 2 Contact 2 Pref 2
Member 3 Contact 3 Pref 3
Member 4 Contact 4 Pref 4
Member 5 Contact 5 Pref 5
Member 6 Contact 6 Pref 6
Team Member Names Strengths related to teamwork and the team’s assigned task.
Weaknesses related to teamwork and the team’s assigned task.
Member 1 Strength 1 Weakness 1
Member 2 Strength 2 Weakness 2
Member 3 Strength 3 Weakness 3
Member 4 Strength 4 Weakness 4
Member 5 Strength 5 Weakness 5
Member 6 Strength 6 Weakness 6
1. What are your team’s goals for the collaboration? These should relate to the team’s performance on projects/assignments as well as the processes that the team will follow to complete projects/assignments. What are your team’s expectations regarding the quality and timeliness of the team’s work?
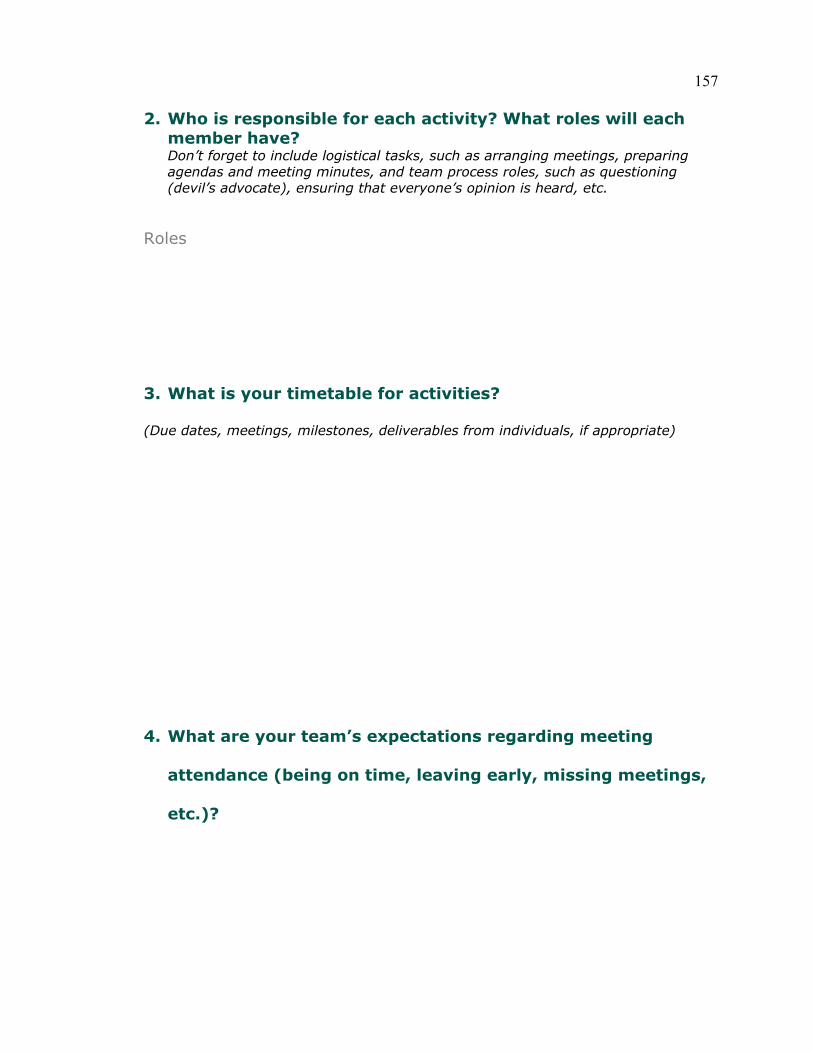
157
2. Who is responsible for each activity? What roles will each member have? Don’t forget to include logistical tasks, such as arranging meetings, preparing agendas and meeting minutes, and team process roles, such as questioning (devil’s advocate), ensuring that everyone’s opinion is heard, etc.
Roles
3. What is your timetable for activities?
(Due dates, meetings, milestones, deliverables from individuals, if appropriate)
4. What are your team’s expectations regarding meeting
attendance (being on time, leaving early, missing meetings,
etc.)?
158
5. What constitutes an acceptable excuse for missing a meeting
or a deadline? What types of excuses will not be considered
acceptable?
6. What process will team members follow if they have an
emergency and cannot attend a team meeting or complete
their individual work promised to the team (deliverable)?
159
7. What are your team’s expectations regarding the quality of
team members’ preparation for team meetings and the
quality of the deliverables that members bring to the team?
8. What are your team’s expectations regarding team
members’ ideas, interactions with the team, cooperation,
attitudes, and anything else regarding team-member
contributions?

160
9. What methods will be used to keep the team on track?
How will your team ensure that members contribute as expected to the team and
that the team performs as expected? How will your team reward members who do
well and manage members whose performance is below expectations?
Monitoring
161
Appendix C
Plane Crash Survival Scenario

162
Plane Crash Survival Scenario
Scenario:
A small aircraft crashes in the shark-infested waters of the Pacific Ocean. There is damage to the aircraft on impact with the water which causes the electronic systems within to be damaged. The resulting radio failure means that no may-day message can be sent.
Of the sixteen passengers on the plane there are nine survivors. The location of the crash is approximately one and a half days from the nearest land. The life raft on one side of the aeroplane can be used, however there is only room for four persons in it.
Your group must reach a decision as to which four persons can enter the life raft. You have approximately 30 minutes to reach this decision before the aircraft sinks.
The Nine Survivors:
1 'Ace' Browning. Ace was the pilot at the time of the crash and it was his expertise which landed the aircraft in one piece, enabling it to float. 'Ace' received his pilot training and nickname when he was in the Airforce. He is the son of an Air Vice-Marshall and a decorated Gulf veteran. He is a keen golfer and collects theatre memorabilia. Recently, there has been some concern amongst his colleagues that he is showing signs of a drinking problem. He is one of a team of volunteer pilots who carry out mercy missions which drop food and medical aid in places of crises.
2 Geoff McGraw. Geoff was returning from a medical conference where he gave a paper on "Re-building Facial Features Following Accidents.” He is a recent divorcee with four grown up children. At 57 he owns a plastic surgery clinic in California from which he has made a considerable fortune. Geoff has established a charitable programme which helps children with facial injuries. His hobbies include collecting vintage cars, deep sea fishing.
The Butler family - James, Patience and Prudence
3 James Butler is a 40-year-old church minister. He has been a missionary in Papua New Guinea for the past 15 years. He is keen to take up the challenge of a new post in Haiti, but has not discussed the move with his wife, Patience, as he is aware that she is anxious to return to the UK and start a career. He is also torn by the wish to spend more time with his two older children. James' hobbies are bridge and fishing.
4 Patience Butler (35) did a lot of voluntary work whilst in Papua New Guinea. She established a youth club which developed skills such as orienteering and homecrafts in young people. For many years Patience has wanted to start a career; she has the manuscript of a first book which she intends to take to a publisher. Her book explores issues relating to helping indigenous peoples and their way of life survive the 21st century. She has three children.

163
5 Prudence Butler. Prudence Butler, an epileptic, was travelling from Papua New Guinea to London with her parents at the time of the accident. She is a very intelligent 10-year-old girl and shows great talent at music and languages. She has two siblings, a fourteen-year-old brother and a 12-year-old sister who are both at boarding school in the UK. Prudence did not want to take time out of school for this trip but her father felt that it was important that she visit her brother and sister.
6 Donald Heap. Donald Heap is a 45-year-old married man with two children. He is the Conservative member for Happiburgh and currently resides on the back bench following a brief, but very public period as Junior Minister in the Department for Defense. Donald resigned from this position because of a scandal involving insider dealing. Donald is a self-made man, having made his fortune in sports clothing. He is an Olympic medallist in track events and used his world-wide reputation as a sportsman in marketing his goods. His hobbies include sailing, squash and growing hothouse orchids.
7 Sam Comfort. Sam is a 29-year-old nurse and a member of Greenpeace. He abandoned plans to marry three years ago and took up a post as Nursing Officer at an Antarctic research station where he carried out work on hypothermia. He got on very well with the rest of the team at the research station and would like to renew his contract and return there. Sam is a very gifted musician; he plays the violin and enjoys swimming and badminton.
8 Professor Mu Chado. Professor Chado has been Professor of Microbiology at the University of Barkington for the past 10 years. He has developed an antibody to the HIV virus that has proved successful in combating illness in experimental animals. He is 60 years old and a bachelor. He was physically disabled when he was 30 in a riding accident and has since then been confined to a wheelchair. His hobbies include watercolor painting.
9 Philippa Lowes-Harrington. Philippa Lowes-Harrington is a Performance Director in the energy industry. She is a 50-year-old married woman with no children. Philippa spent 12 years in the army and retired at the age of 30 at the rank of Captain. Her hobbies include skiing and collecting objet d'art. She has been involved in negotiations where the Victoria and Albert Museum acquired a number of valuable pieces of British art from Japan and the United State. Currently she is the Chair of a working group, which is considering how art may be used to improve inner-city environments. Philippa has recently been diagnosed as HIV positive

164
Appendix D
The Trouble with Teamwork Article
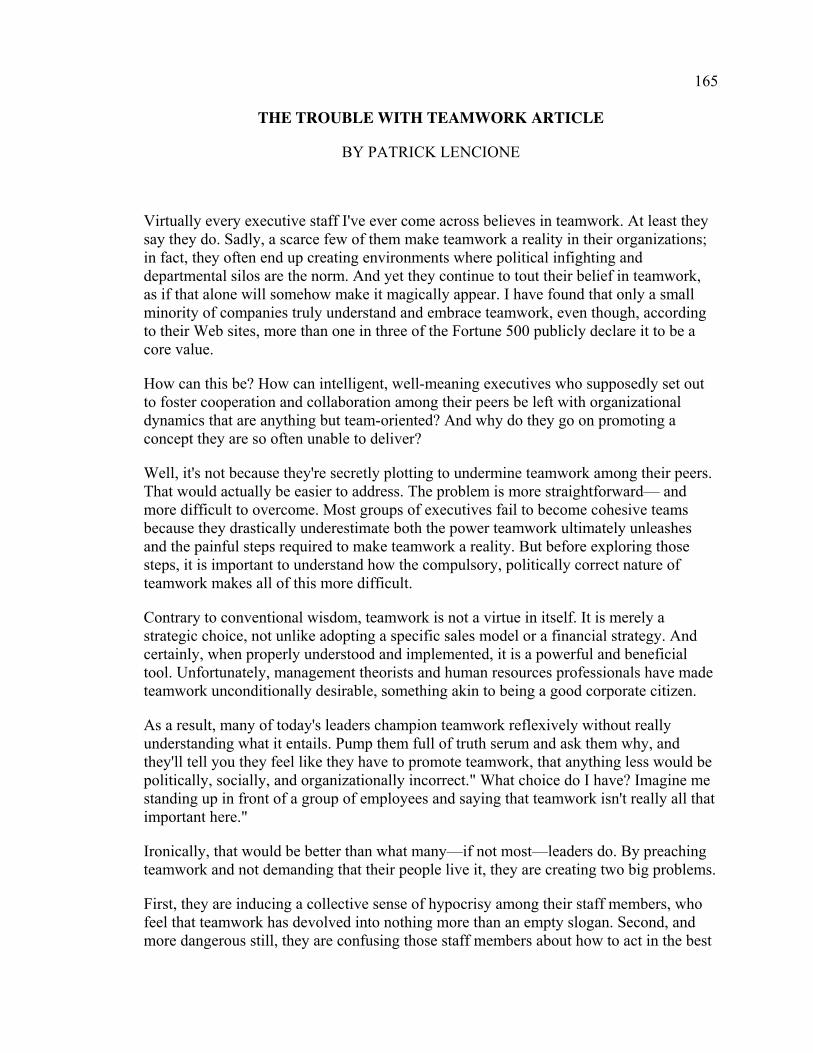
165
THE TROUBLE WITH TEAMWORK ARTICLE
BY PATRICK LENCIONE
Virtually every executive staff I've ever come across believes in teamwork. At least they say they do. Sadly, a scarce few of them make teamwork a reality in their organizations; in fact, they often end up creating environments where political infighting and departmental silos are the norm. And yet they continue to tout their belief in teamwork, as if that alone will somehow make it magically appear. I have found that only a small minority of companies truly understand and embrace teamwork, even though, according to their Web sites, more than one in three of the Fortune 500 publicly declare it to be a core value.
How can this be? How can intelligent, well-meaning executives who supposedly set out to foster cooperation and collaboration among their peers be left with organizational dynamics that are anything but team-oriented? And why do they go on promoting a concept they are so often unable to deliver?
Well, it's not because they're secretly plotting to undermine teamwork among their peers. That would actually be easier to address. The problem is more straightforward— and more difficult to overcome. Most groups of executives fail to become cohesive teams because they drastically underestimate both the power teamwork ultimately unleashes and the painful steps required to make teamwork a reality. But before exploring those steps, it is important to understand how the compulsory, politically correct nature of teamwork makes all of this more difficult.
Contrary to conventional wisdom, teamwork is not a virtue in itself. It is merely a strategic choice, not unlike adopting a specific sales model or a financial strategy. And certainly, when properly understood and implemented, it is a powerful and beneficial tool. Unfortunately, management theorists and human resources professionals have made teamwork unconditionally desirable, something akin to being a good corporate citizen.
As a result, many of today's leaders champion teamwork reflexively without really understanding what it entails. Pump them full of truth serum and ask them why, and they'll tell you they feel like they have to promote teamwork, that anything less would be politically, socially, and organizationally incorrect." What choice do I have? Imagine me standing up in front of a group of employees and saying that teamwork isn't really all that important here."
Ironically, that would be better than what many—if not most—leaders do. By preaching teamwork and not demanding that their people live it, they are creating two big problems.
First, they are inducing a collective sense of hypocrisy among their staff members, who feel that teamwork has devolved into nothing more than an empty slogan. Second, and more dangerous still, they are confusing those staff members about how to act in the best

166
interest of the company, so they wind up trying at once to be pragmatically self-interested and ideologically selfless. The combination of these factors evokes inevitable and sometimes paralyzing feelings of dissonance and guilt.
Executives must understand that there is an alternative to teamwork, and it is actually more effective than being a faux team. Jon Katzenbach, author of The Wisdom of Teams, calls it a "working group," a group of executives who agree to work independently with few expectations for collaboration. The advantage of a working group is clarity; members know exactly what they can, and more important, cannot expect of one another, and so they focus on how to accomplish goals without the distractions and costs that teamwork inevitably presents. (For guidance on deciding whether teamwork is right for your organization, see sidebar, "To Be or Not to Be a Team.")
Of course, none of this is to say that teamwork is not a worthy goal. There is no disputing that it is uniquely powerful, enabling groups of people to achieve more collectively than they could have imagined doing apart. However, the requirements of real teamwork cannot be underestimated.
The fact is, building a leadership team is hard. It demands substantial behavioral changes from people who are strong-willed and often set in their ways, having already accomplished great things in their careers. What follows is a realistic description of what a group of executives must be ready to do if they undertake the nontrivial task of becoming a team, something that is not necessarily right for every group of leaders.
Vulnerability-Based Trust
The first and most important step in building a cohesive and functional team is the establishment of trust. But not just any kind of trust. Teamwork must be built upon a solid foundation of vulnerability-based trust.
This means that members of a cohesive, functional team must learn to comfortably and quickly acknowledge, without provocation, their mistakes, weaknesses, failures, and needs for help. They must also readily recognize the strengths of others, even when those strengths exceed their own.
In theory—or kindergarten—this does not seem terribly difficult. But when a leader is faced with a roomful of accomplished, proud, and talented staff members, getting them to let their guard down and risk loss of positional power is an extremely difficult challenge. And the only way to initiate it is for the leader to go first.
Showing vulnerability is unnatural for many leaders, who were raised to project strength and confidence in the face of difficulty. And while that is certainly a noble behavior in many circumstances, it must be tempered when it comes to demonstrating vulnerability-based trust to hesitant team members who need their leader to strip naked and dive into the cold water first. Of course, this requires that a leader be confident enough, ironically, to admit to frailties and make it easy for others to follow suit. One particular CEO I worked with failed to build trust among his team and watched the company falter as a
167
result. As it turns out, a big contributing factor was his inability to model vulnerability-based trust. As one of the executives who reported to him later explained to me, "No one on the team was ever allowed to be smarter than him in any area because he was the CEO." As a result, team members would not open up to one another and admit their own weaknesses or mistakes.
What exactly does vulnerability-based trust look like in practice? It is evident among team members who say things to one another like "I screwed up," "I was wrong," "I need help," "I'm sorry," and "You're better than I am at this." Most important, they only make one of these statements when they mean it, and especially when they really don't want to.
If all this sounds like motherhood and apple pie, understand that there is a very practical reason why vulnerability-based trust is indispensable. Without it, a team will not, and probably should not, engage in unfiltered productive conflict.
Healthy Conflict
One of the greatest inhibitors of teamwork among executive teams is the fear of conflict, which stems from two separate concerns. On one hand, many executives go to great lengths to avoid conflict among their teams because they worry that they will lose control of the group and that someone will have their pride damaged in the process. Others do so because they see conflict as a waste of time. They prefer to cut meetings and discussions short by jumping to the decision that they believe will ultimately be adopted anyway, leaving more time for implementation and what they think of as "real work."
Whatever the case, CEOs who go to great lengths to avoid conflict often do so believing that they are strengthening their teams by avoiding destructive disagreement. This is ironic, because what they are really doing is stifling productive conflict and pushing important issues that need to be resolved under the carpet where they will fester. Eventually, those unresolved issues transform into uglier and more personal discord when executives grow frustrated at what they perceive to be repeated problems.
What CEOs and their teams must do is learn to identify artificial harmony when they see it, and incite productive conflict in its place. This is a messy process, one that takes time to master. But there is no avoiding it, because to do so makes it next to impossible for a team to make real commitment.
Unwavering Commitment
To become a cohesive team, a group of leaders must learn to commit to decisions when there is less than perfect information available, and when no natural consensus develops. And because perfect information and natural consensus rarely exist, the ability to commit becomes one of the most critical behaviors of a team.
But teams cannot learn to do this if they are not in the practice of engaging in productive and unguarded conflict. That's because it is only after team members passionately and unguardedly debate with one another and speak their minds that the leader can feel

168
confident of making a decision with the full benefit of the collective wisdom of the group. A simple example might help illustrate the costs of failing to truly commit.
Becoming a team is not necessarily right for every group of leaders.
The CEO of a struggling pharmaceutical company decided to eliminate business and first class travel to cut costs. Everyone around the table nodded their heads in agreement, but within weeks, it became apparent that only half the room had really committed to the decision. The others merely decided not to challenge the decision, but rather to ignore it. This created its own set of destructive conflict when angry employees from different departments traveled together and found themselves heading to different parts of the airplane. Needless to say, the travel policy was on the agenda again at the next meeting, wasting important time that should have been spent righting the company's financial situation.
Teams that fail to disagree and exchange unfiltered opinions are the ones that find themselves revisiting the same issues again and again. All this is ironic, because the teams that appear to an outside observer to be the most dysfunctional (the arguers) are usually the ones that can arrive at and stick with a difficult decision.
It's worth repeating here that commitment and conflict are not possible without trust. If team members are concerned about protecting themselves from their peers, they will not be able to disagree and commit. And that presents its own set of problems, not the least of which is the unwillingness to hold one another accountable.
Unapologetic Accountability
Great teams do not wait for the leader to remind members when they are not pulling their weight. Because there is no lack of clarity about what they have committed to do, they are comfortable calling one another on actions and behaviors that don't contribute to the likelihood of success. Less effective teams typically resort to reporting unacceptable behavior to the leader of the group, or worse yet, to back-channel gossip. These behaviors are not only destructive to the morale of the team, they are inefficient and allow easily addressable issues to live longer than should be allowed.
Don't let the simplicity of accountability hide the difficulty of making it a reality. It is not easy to teach strong leaders on a team to confront their peers about behavioral issues that hurt the team. But when the goals of the team have been clearly delineated, the behaviors that jeopardize them become easier to call out.
Collective Orientation to Results
The ultimate goal of the team, and the only real scorecard for measuring its success, is the achievement of tangible collective outcomes. And while most executive teams are certainly populated with leaders who are driven to succeed, all too often the results they focus on are individual or departmental. Once the inevitable moment of truth comes, when executives must choose between the success of the entire team and their own, many

169
are unable to resist the instinct to look out for themselves. This is understandable, but it is deadly to a team.
Identify artificial harmony; incite productive conflict in its place.
Leaders committed to building a team must have zero tolerance for individually focused behavior. This is easier said than done when one considers the size of the egos assembled on a given leadership team. Which is perhaps why a leader trying to assemble a truly cohesive team would do well to select team members with small ones.
If all of this sounds obvious, that's because it is. The problem with teamwork is not that it is difficult to understand, but rather that it is extremely difficult to achieve when the people involved are strong-willed, independently successful leaders. The point here is not that teamwork is not worth the trouble, but rather that its rewards are both rare and costly. And as for those leaders who don't have the courage to force team members to step up to the requirements of teamwork, they would be wiser to avoid the concept altogether. Of course, that would require a different kind of courage; the courage not to be a team.
To Be or Not to Be a Team
So how do well-intentioned leaders go about deciding if teamwork is right for their staffs? They can start by recognizing that organizational structure is not nearly as important as behavioral willingness.
Most theorists will call for teamwork in organizations that are structured functionally, but may not do so for those that are organized divisionally or geographically.
In other words, if the work can be organized in departments that operate largely independently (with regional territories, distinct product divisions, or separate subsidiaries), then the executives at the top can follow suit and function as what Jon Katzenbach, author of The Wisdom of Teams, describes as "working units." These are groups made up of individuals who, though friendly and cooperative at times, are not expected to make willing sacrifices to one another to achieve common goals that lead to joint rewards.
However, when executives run an organization that is made up of departments that have structural interdependencies, teamwork is usually presented as the only possible approach for the leadership group. But although this is a sound and reasonable theory when all other factors are considered equal, it is not necessarily advisable in the messy and fallible world of real human beings. Before deciding that teamwork is the answer, ask these questions of yourself and your fellow team members.
• Can we keep our egos in check?
• Are we capable of admitting to mistakes, weaknesses, insufficient knowledge?
• Can we speak up openly when we disagree?
170
• Will we confront behavioral problems directly?
• Can we put the success of the team or organization over our own?
If the answer to one or more of these questions is "probably not," then a group of executives should think twice about declaring themselves a team. Why? Because more than structure, it is the willingness of executives to change behavior —starting with the leader of the organization—that should determine whether teamwork is the right answer.
171
Appendix E
CATME Peer Evaluation Brochure

172
CATME PEER EVALUATION BROCHURE
Comprehensive Assessment of Team Member Effectiveness
www.catme.org
When using teams in education, faculty often use peer evaluations and self-evaluations to assess how effectively each team member contributes to the team. The Comprehensive Assessment of Team Member Effectiveness (CATME) was developed for this purpose. This web-based instrument collects
data on team-member
1. 2. 3. 4. 5.
effectiveness in five areas research has shown to be important.
Contributing to the team’s work Interacting with teammates
Keeping the team on track Expecting quality
Having relevant knowledge skills and abilities
The CATME Peer Evaluation instrument is a behaviorally anchored rating scale, which describes behaviors typical of various levels of performance in each of the five categories. Raters select the category of behaviors that most closely matches the behavior of each student on their team (including themselves). The CATME website shows the instrument and allows faculty and students to practice using the system by rating fictitious team members.
Special Feature—helping professors understand what is happening in student teams The system alerts faculty to exceptional conditions, which are rating patterns that warrant attention.
• Low—a student who rates him/herself as ineffective and who also receives “ineffective” ratings by teammates.
• Overconfident—a student rated as “ineffective” by teammates but rates him/herself as much more effective.
• High—a student who is rated as highly effective according to both teammate and self ratings.
• Underconfident—a student rated as highly effective by teammates but who under-rates her/himself.

173
• Manipulator—a student who rates him/herself as highly effective and who rates teammates as ineffective in disagreement with teammates. Such a student may be trying to influence the distribution of grades unfairly.
• Conflict—a team in which there is considerable disagreement among the various raters about the effectiveness of an individual student.
• Clique—a team in which cliques appear to have formed. The ratings show that subsets of the team rate members of their subset high and members of other subsets low. Some of these conditions have more than one explanation. A student flagged as a “manipulator” might actually have performed a disproportionately large amount of the work on the project even though they worked to engage their teammates in the process. Thus, an instructor’s involvement and judgment are critical when exceptional conditions are flagged. Though the formal study of these exceptions has not been completed, faculty using the system have reported that both the clique and conflict conditions have accurately provided early warnings of those conditions.
• Study Describing Development and Validity Testing for the CATME Peer Evaluation Instrument Ohland, M. W., Loughry, M. L., Woehr, D. J., Bullard, L. G., Felder, R. M., Finelli, C. J., Layton, R. A., Pomeranz, H. R., & Schmucker, D. G. (2012). The comprehensive assessment of team member effectiveness: Development of a behaviorally anchored rating scale for self and peer evaluation. Academy of Management Learning & Education, 11, 609-630. This paper won the 2013 Maryellen Weimer Scholarly Work on Teaching and Learning Award. For further information on the design of the CATME Peer Evaluation instrument, research supporting its use, or to request an account, go to www.CATME.org. The instrument is copyrighted.
The Online Interface
The CATME website is a secure interface for collecting data on team-member effectiveness and reporting different views of the data to faculty and students. The CATME system has a number of convenient features—the ability to upload student and team data from files generated by Excel; support for multi-section courses and teaching assistants; the ability to edit teams, reset surveys, send email reminders, and track survey completion. The system also allows students to make comments for instructors to read and can compute grade adjustments based on how the ratings patterns compare with faculty-specified criteria.
Faculty request an account at www.CATME.org. The process of defining a class and setting up teams is wizard-based, but a tutorial is available. Several typical screen shots are captured here:

174
The first of five rating categories: Contributing to the Team’s Work.
The wizard-based interface for class creation in CATME is typical of other setup screens.
Faculty summary results (raw data available). Student results: by self, by team, average
CATME Peer Evaluation is part of the CATME SMARTER Teamwork system, which includes other team-support tools. The CATME online interface was developed by Deer Run Associates. This material is based upon work supported by NSF Awards 0243254 and 0817403.
Click here if Pat’s behavior in “contributing to the team’s work” is consistent with the descriptions in the top row.

175

176
Appendix F
Informed Consent Form

177
INFORMED CONSENT FORM
IRB# (Labeled by IRB) Identification of Project: Implications for MBA Culture Through the Lens of MBA Academic Teams Training and Measuring Team Skills Development and Student Satisfaction in the First Semester of the Full-time MBA Program at University of Oklahoma Purpose of the Research: The purpose of this quantitative, single case study design is to explore whether there is a relationship between MBA teams training and team skills development and student satisfaction in the first semester of a Full-time MBA program in order to improve the overall quality of the student culture at the Price College of Business at University of Oklahoma in Norman, OK. Procedures: Participants in this study will be first-year full-time MBA students at the University of Oklahoma. All first year MBA students at the University of Oklahoma will receive monthly teams training as part of a mandatory professional development course focused primarily on job search preparation in the first semester of the MBA program. All first year full-time MBA students are invited to participate in the study. Study participants will self-select to participate or opt out of the study. The Comprehensive Assessment of Team Member Effectiveness (CATME) will be utilized to configure teams, regularly administer peer and self-assessment of teamwork skills (2-3 times monthly), and gauge student satisfaction. Additional team advising sessions (1 mid-semester session and others by request) with each participating team. Risks and/or Discomforts: There are no known risks or discomforts associated with this research. In the event of problems resulting from participation in the study. Free counseling is offered to University of Oklahoma students at Goddard Counseling Center if needed for any reason; the center can be reached at 405-325-2911 to schedule an appointment. Benefits:
x Monthly raffle for $50 Target gift card for all participants completing evaluations required for monthly assessment cycle.
x Receive teams training that can be marketed in the MBA internship/job search process.
x Receive training and feedback that will be helpful to navigate future teams and in managing teams.
178
x Built-in group accountability process, which can assist in semester academic success.
x Gain access to teams advising as needed throughout the semester with researcher. x Frequent feedback sent to each participant from CATME based on peer
evaluation feedback received. Confidentiality: Any information obtained during this study, which could identify you, will be kept strictly confidential. The data will be stored in a locked cabinet in the investigator’s office and will only be seen by the investigator during the study and for three years after the study is complete. The information obtained in this study may be published in scientific journals or presented at scientific meetings but the data will be reported as aggregated data. Any audiotapes participant interactions will be erased after transcription. Compensation: As part of the requirements for your MBA Professional Development Course, you will receive course credit for the Professional Development course for your participation in regularly scheduled classroom teams training. You will not received additional credit for your participation in the corresponding research study. For your participation in the study, you will be entered into a monthly raffle for a $50 Target gift card from the researcher, which one study per month will receive. Opportunity to Ask Questions: You may ask any questions concerning this research and have those questions answered before agreeing to participate in or during the study. Or you may call the investigator at any time, office phone, 405-325-2503 or contact via email at [email protected]. Please contact the investigator:
x if you want to voice concerns or complaints about the research x in the event of a research related injury or discomfort.
Please contact the University of Nebraska-Lincoln Institutional Review Board at 402-472-6965 or the University of Oklahoma Institutional Review Board at 405-325-8110 for the following reasons:
x you wish to talk to someone other than the research staff to obtain answers to questions about your rights as a research participant
x to voice concerns or complaints about the research x to provide input concerning the research process x in the event the study staff could not be reached,
Freedom to Withdraw: Participation in this study is voluntary. You can refuse to participate or withdraw at any time without harming your relationship with the researchers or the University of
179
Nebraska-Lincoln or University of Oklahoma, or in any other way receive a penalty or loss of benefits to which you are otherwise entitled. Consent, Right to Receive a Copy: You are voluntarily making a decision whether or not to participate in this research study. Your signature certifies that you have decided to participate having read and understood the information presented. You will be given a copy of this consent form to keep. ______ Check if you agree to be audiotaped during the interview. Any audiotapes participant interactions will be erased after transcription. Signature of Participant: ______________________________________ _________________ Signature of Research Participant Date Name and Phone number of investigator: Crystal L. Clayton, MA, Principal Investigator Office: 405- 325-2503

180
Appendix G
Participation Intent Form

181
PARTICIPATION INTENT FORM
MBA TEAMS RESEARCH PARTICIPATION INTENT FORM: Study Title: Implications for MBA Culture Through the Lens of MBA Academic Teams Training and Measuring Team Skills Development and Student Satisfaction in the First Semester of the Full-time MBA Program at University of Oklahoma First Name: Last Name: OU Email Address: Preferred Email Address: Study Duration: August – December 2014 Teams Training Sessions: All teams training sessions will take place as part of your mandatory MBA Professional Development course. All first-year, full-time MBA students will participate in teams training sessions as part of this course. Optional Research Study Participation Component of Teams Training: Students have the ability to opt in or out of participating in a MBA Teams research study corresponding with the MBA teams training all first-year, full-time MBA students will receive. Study Benefits to Participants:
x Receive teams training that can be marketed in the MBA internship/job search process.
x Receive training and feedback from researcher and peers that will be helpful to navigate future teams and in managing teams.
x Built-in group accountability process, which can assist in semester academic and team success.
x Gain access to teams advising as needed throughout the semester with researcher. x Frequent feedback sent to each participant from CATME behavior anchored
rating system based on peer evaluation feedback received. x All participants completing evaluations required for monthly assessment cycle
will be entered into a monthly raffle for $50 Target gift card.

182
Researcher Expectations of Participants: x Sign an informed consent form outlining your rights as a research participant for a
project approved by the Institutional Review Boards at both University of Nebraska and University of Oklahoma.
x Complete frequent team skills assessments, taking approximately 10 minutes to accomplish in each submission, for yourself and for all members of your team (2-3 times monthly).
x Provide honest self-assessment and peer feedback regarding team skills based on the five dimensions of: contributing to the team’s work, interacting with teammates, keeping the team on track, expecting quality, having related knowledge, skills, and abilities (KSAs).
x Participate in one mid-semester team advising session with researcher. x Attend teams training sessions as part of your regularly scheduled full-time MBA
professional development course. x Fully engage in teams training process.
It is my intention to participate in the research component of the fall 2014 MBA Teams Training that I will receive as part of my MBA Professional Development course. Participant’s Signature __________________________________________________________________________ Date ________________________________________________________________________________________________ Name and Phone number of investigator: Crystal L. Clayton, MA, Principal Investigator Office: 405- 325-2503
183
Appendix H
Confidentiality of Team Advising Form

184
CONFIDENTIALITY OF TEAM ADVISING FORM
TEAM ADVISING SESSIONS CONFIDENTIALTY AGREEMENT: Your identity will be known to other team advising group participants and the researcher cannot guarantee that others in these groups will respect the confidentiality of the group. We will ask you to sign below to indicate that you will keep all comments made during team advising sessions confidential and not discuss what happened during the team advising session outside the meeting. Please read the below team advising session guidelines and sign indicating consent:
x I have reviewed the information in this letter and have had any questions about the study answered to my satisfaction.
x I understand that I am able to receive a copy of this information letter from the researcher by request.
x I am agreeing to have the team advising sessions audio-recorded. x I agree to maintain confidentiality of information shared in this focus group. x I agree to participate in team advising sessions.
Signature of Participant: ______________________________________ ___________________________ Signature of Research Participant Date Name and Phone number of investigator: Crystal L. Clayton, MA, Principal Investigator Office: 405- 325-2503

185
Appendix I
Transcription Services Form
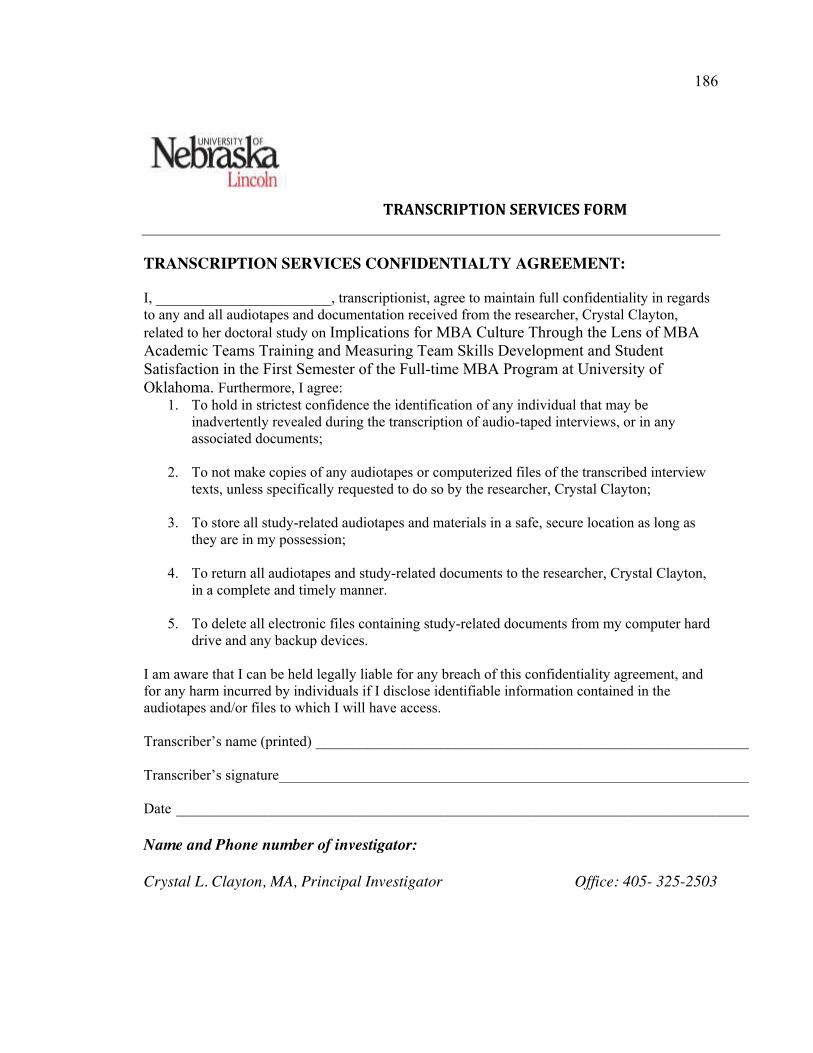
186
TRANSCRIPTION SERVICES FORM TRANSCRIPTION SERVICES CONFIDENTIALTY AGREEMENT: I, ________________________, transcriptionist, agree to maintain full confidentiality in regards to any and all audiotapes and documentation received from the researcher, Crystal Clayton, related to her doctoral study on Implications for MBA Culture Through the Lens of MBA Academic Teams Training and Measuring Team Skills Development and Student Satisfaction in the First Semester of the Full-time MBA Program at University of Oklahoma. Furthermore, I agree:
1. To hold in strictest confidence the identification of any individual that may be inadvertently revealed during the transcription of audio-taped interviews, or in any associated documents;
2. To not make copies of any audiotapes or computerized files of the transcribed interview
texts, unless specifically requested to do so by the researcher, Crystal Clayton;
3. To store all study-related audiotapes and materials in a safe, secure location as long as they are in my possession;
4. To return all audiotapes and study-related documents to the researcher, Crystal Clayton,
in a complete and timely manner.
5. To delete all electronic files containing study-related documents from my computer hard drive and any backup devices.
I am aware that I can be held legally liable for any breach of this confidentiality agreement, and for any harm incurred by individuals if I disclose identifiable information contained in the audiotapes and/or files to which I will have access. Transcriber’s name (printed) ___________________________________________________________ Transcriber’s signature ________________________________________________________________ Date ______________________________________________________________________________ Name and Phone number of investigator: Crystal L. Clayton, MA, Principal Investigator Office: 405- 325-2503

187
Appendix J
Recruitment Email #1

188
Dear OU First-year Full-time MBA Students:
Welcome to the Price College of Business! I am looking forward to meeting you at Prelude Week, and working with you in the upcoming semester. My name is Crystal Clayton, and I serve as the Director of the JCPenney Leadership Center in the Price College of Business. Although I am currently working with undergraduate students in the Price College, prior to working at OU my most recent previous position was working as the Director of the Full-time MBA Program at Rice University – so I have a strong understanding of and affinity for full-time MBA students. Additionally my current research is reviewing the MBA Academic Teams Training process and related benefits of this process.
As you know and will soon learn more about first hand, the MBA Academic Teams process is a very important part of your academic and social experiences in the first year in the MBA program. As a result, in the fall semester I will be conducting a series of Teams Training Sessions as part of your MBA Professional Development course, and offering you strategies to support you and your assigned academic team. Additionally, I am writing to tell you about an optional research component of the training that I encourage you to consider and take part in. This research component is part of my doctoral research and is offered to only first-year, full-time MBA students in the Price College of Business, in which the results may have programming implications for future students in the program. Although all students will receive the teams training through the MBA Professional Development course, you must opt in to participate in the research component – please note however that most activities related to the research will take place as part of your Professional Development course. Click on the following link to opt into the research component of the Teams Training process for the fall, and to see complete benefits and expectations outlined: https://orgsync.com/70726/forms/110069. You can additionally find these participant benefits and expectations listed below.
Please contact me at your convenience if I can answer any questions or concerns you may have regarding participation in this research study. Additionally, feel free to connect with me on LinkedIn and review my professional credentials in the following link: http://www.linkedin.com/in/claytonc.
Thank you for your consideration and I look forward to meeting you soon!
Best regards,
Crystal L. Clayton

189
Appendix K
Recruitment Email #2
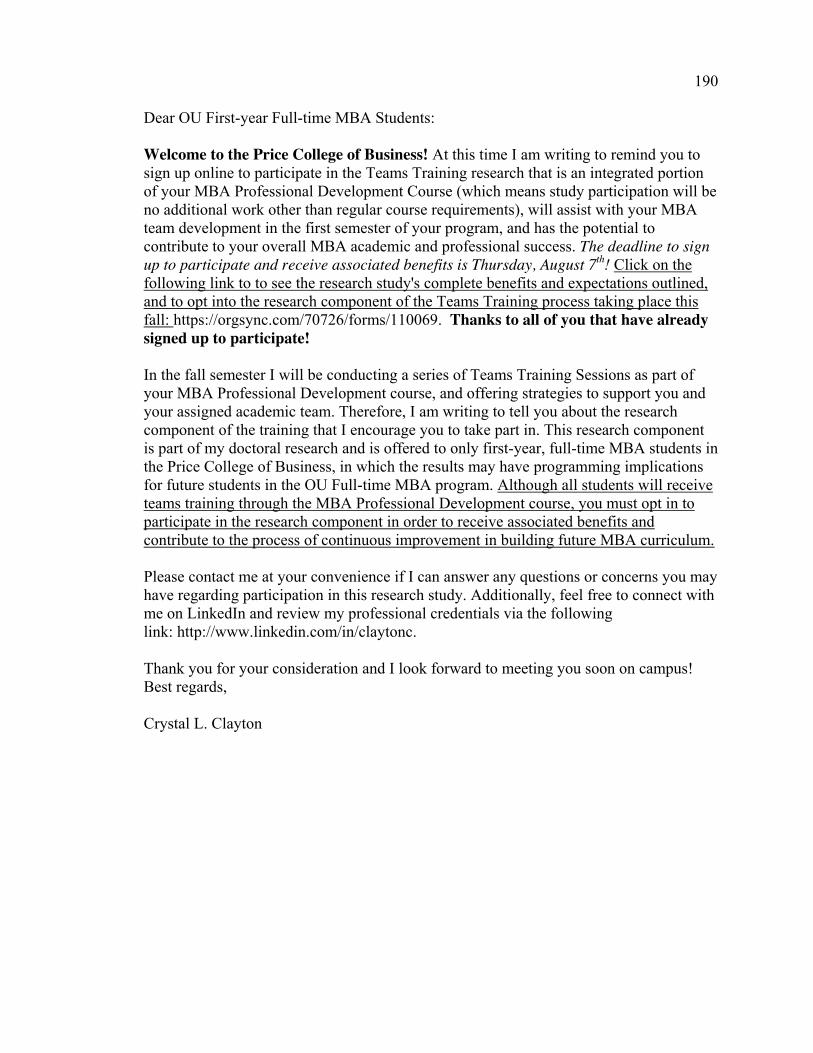
190
Dear OU First-year Full-time MBA Students: Welcome to the Price College of Business! At this time I am writing to remind you to sign up online to participate in the Teams Training research that is an integrated portion of your MBA Professional Development Course (which means study participation will be no additional work other than regular course requirements), will assist with your MBA team development in the first semester of your program, and has the potential to contribute to your overall MBA academic and professional success. The deadline to sign up to participate and receive associated benefits is Thursday, August 7th! Click on the following link to to see the research study's complete benefits and expectations outlined, and to opt into the research component of the Teams Training process taking place this fall: https://orgsync.com/70726/forms/110069. Thanks to all of you that have already signed up to participate! In the fall semester I will be conducting a series of Teams Training Sessions as part of your MBA Professional Development course, and offering strategies to support you and your assigned academic team. Therefore, I am writing to tell you about the research component of the training that I encourage you to take part in. This research component is part of my doctoral research and is offered to only first-year, full-time MBA students in the Price College of Business, in which the results may have programming implications for future students in the OU Full-time MBA program. Although all students will receive teams training through the MBA Professional Development course, you must opt in to participate in the research component in order to receive associated benefits and contribute to the process of continuous improvement in building future MBA curriculum. Please contact me at your convenience if I can answer any questions or concerns you may have regarding participation in this research study. Additionally, feel free to connect with me on LinkedIn and review my professional credentials via the following link: http://www.linkedin.com/in/claytonc. Thank you for your consideration and I look forward to meeting you soon on campus! Best regards, Crystal L. Clayton

191
Appendix L
Teams Training Schedule
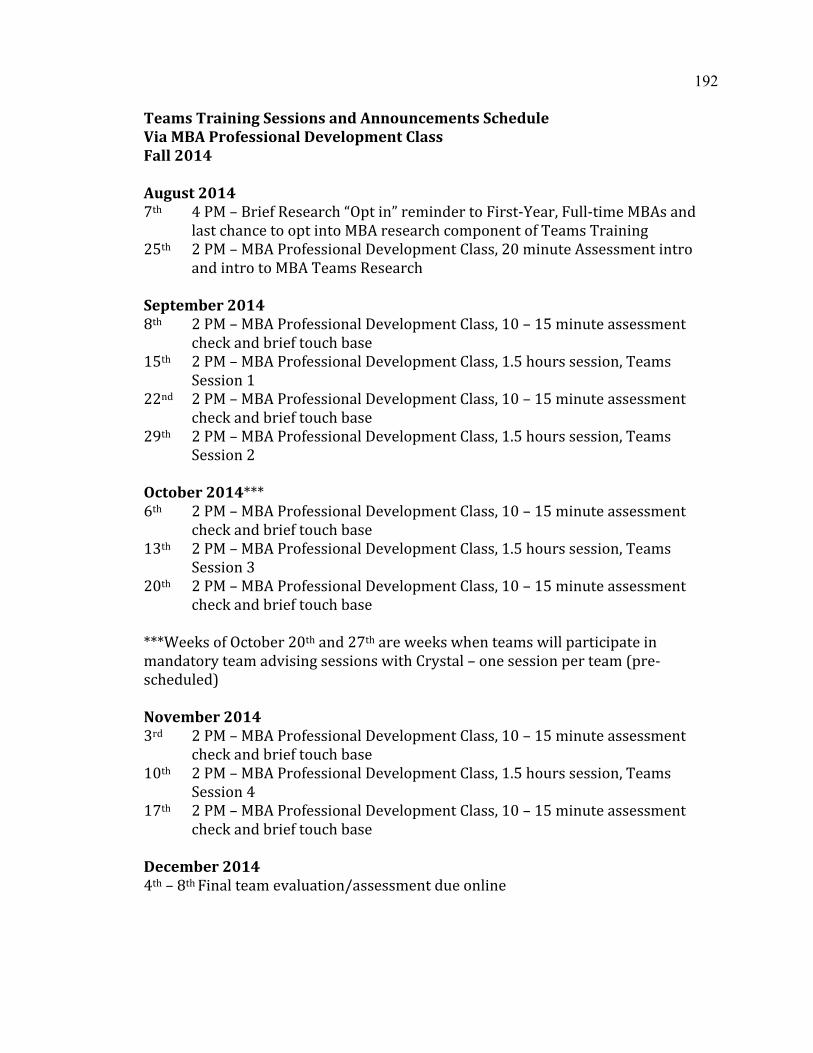
192
Teams Training Sessions and Announcements Schedule Via MBA Professional Development Class Fall 2014 August 2014 7th 4 PM – Brief Research “Opt in” reminder to First-Year, Full-time MBAs and last chance to opt into MBA research component of Teams Training 25th 2 PM – MBA Professional Development Class, 20 minute Assessment intro and intro to MBA Teams Research September 2014 8th 2 PM – MBA Professional Development Class, 10 – 15 minute assessment check and brief touch base 15th 2 PM – MBA Professional Development Class, 1.5 hours session, Teams Session 1 22nd 2 PM – MBA Professional Development Class, 10 – 15 minute assessment check and brief touch base 29th 2 PM – MBA Professional Development Class, 1.5 hours session, Teams Session 2 October 2014*** 6th 2 PM – MBA Professional Development Class, 10 – 15 minute assessment check and brief touch base 13th 2 PM – MBA Professional Development Class, 1.5 hours session, Teams Session 3 20th 2 PM – MBA Professional Development Class, 10 – 15 minute assessment check and brief touch base ***Weeks of October 20th and 27th are weeks when teams will participate in mandatory team advising sessions with Crystal – one session per team (pre-scheduled) November 2014 3rd 2 PM – MBA Professional Development Class, 10 – 15 minute assessment check and brief touch base 10th 2 PM – MBA Professional Development Class, 1.5 hours session, Teams Session 4 17th 2 PM – MBA Professional Development Class, 10 – 15 minute assessment check and brief touch base December 2014 4th – 8th Final team evaluation/assessment due online
193
Appendix M
Teams Training Session Observer Reflection
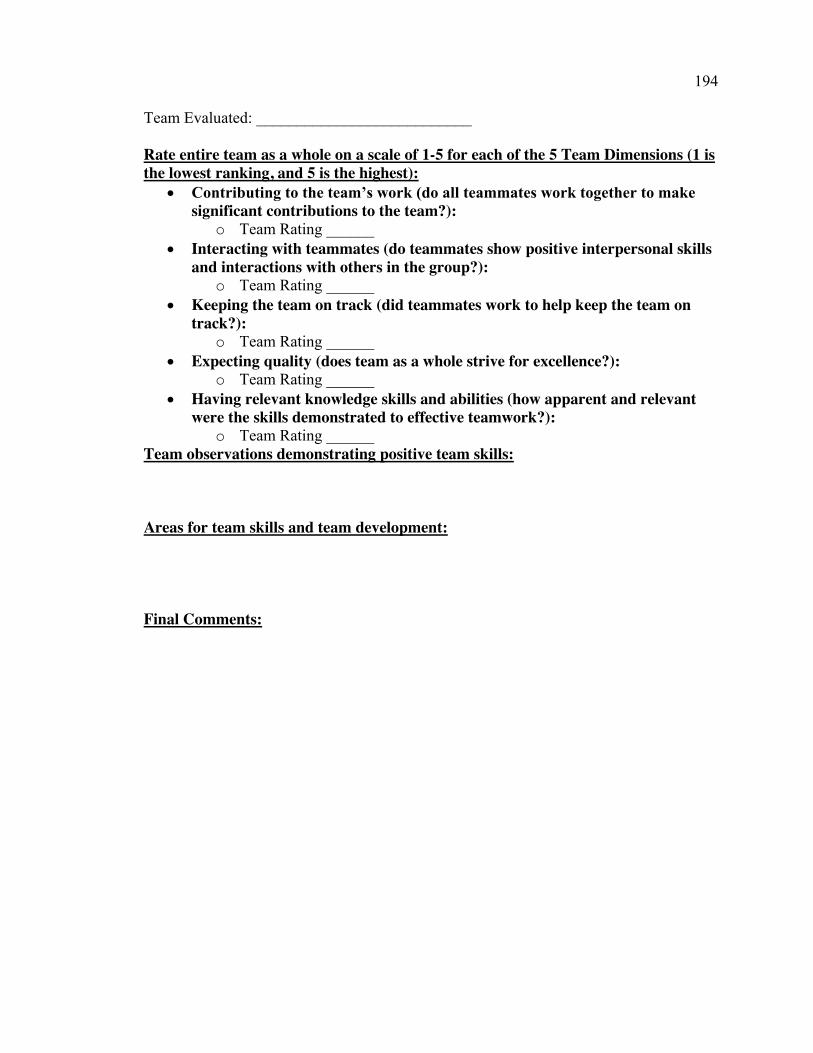
194
Team Evaluated: ___________________________ Rate entire team as a whole on a scale of 1-5 for each of the 5 Team Dimensions (1 is the lowest ranking, and 5 is the highest):
x Contributing to the team’s work (do all teammates work together to make significant contributions to the team?):
o Team Rating ______ x Interacting with teammates (do teammates show positive interpersonal skills
and interactions with others in the group?): o Team Rating ______
x Keeping the team on track (did teammates work to help keep the team on track?):
o Team Rating ______ x Expecting quality (does team as a whole strive for excellence?):
o Team Rating ______ x Having relevant knowledge skills and abilities (how apparent and relevant
were the skills demonstrated to effective teamwork?): o Team Rating ______
Team observations demonstrating positive team skills: Areas for team skills and team development: Final Comments:

195
Appendix N
Teams Training Session Individual Reflection

196
Name (optional): __________________________________ Team Number (members on team): __________________________ How would you rate your team on today’s activity? Rate entire team as a whole on a scale of 1-5 for each of the 5 Team Dimensions (1 is the lowest ranking, and 5 is the highest):
x Contributing to the team’s work (do all teammates work together to make significant contributions to the team?):
o Team Rating ______ x Interacting with teammates (do teammates show positive interpersonal skills
and interactions with others in the group?): o Team Rating ______
x Keeping the team on track (did teammates work to help keep the team on track?):
o Team Rating ______ x Expecting quality (does team as a whole strive for excellence?):
o Team Rating ______ x Having relevant knowledge skills and abilities (how apparent and relevant
were the skills demonstrated to effective teamwork?): o Team Rating ______
What positive Team Skills did your team exhibit today? What team skills does your team need to develop in order to be a more effective team? Final Comments?
197
Appendix O
CATME Definitions and Notes
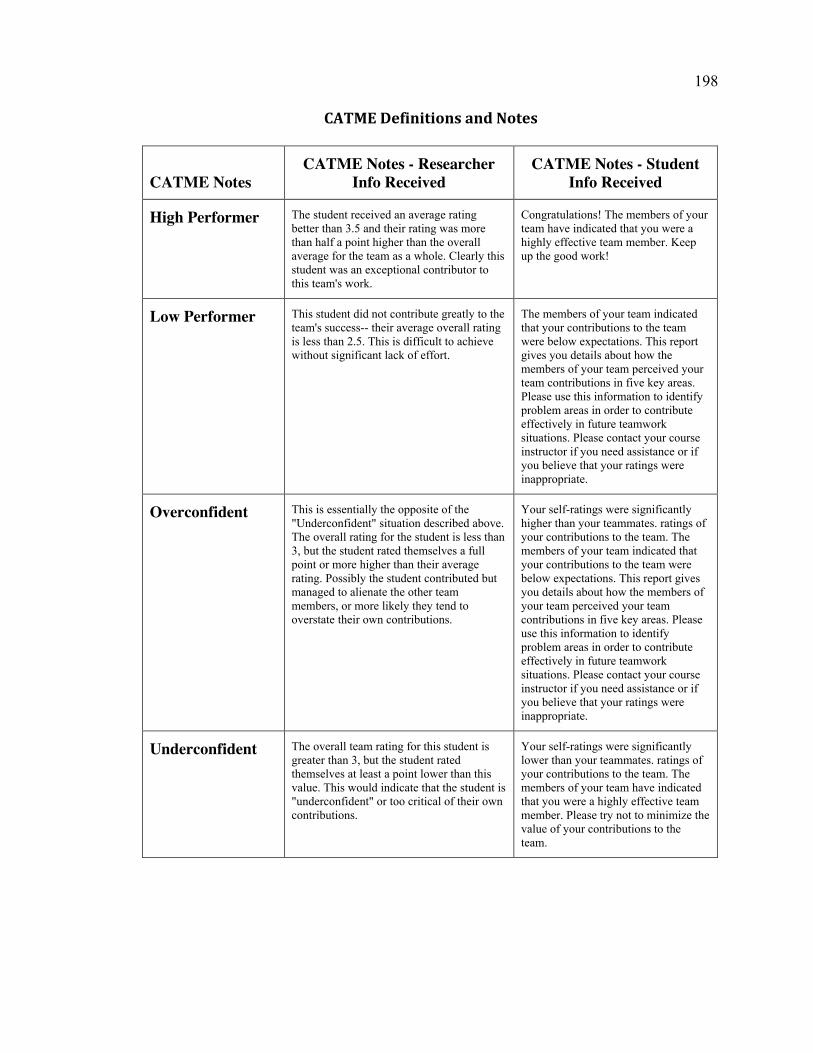
198
CATME Definitions and Notes
CATME Notes CATME Notes - Researcher
Info Received CATME Notes - Student
Info Received
High Performer The student received an average rating better than 3.5 and their rating was more than half a point higher than the overall average for the team as a whole. Clearly this student was an exceptional contributor to this team's work.
Congratulations! The members of your team have indicated that you were a highly effective team member. Keep up the good work!
Low Performer This student did not contribute greatly to the team's success-- their average overall rating is less than 2.5. This is difficult to achieve without significant lack of effort.
The members of your team indicated that your contributions to the team were below expectations. This report gives you details about how the members of your team perceived your team contributions in five key areas. Please use this information to identify problem areas in order to contribute effectively in future teamwork situations. Please contact your course instructor if you need assistance or if you believe that your ratings were inappropriate.
Overconfident This is essentially the opposite of the "Underconfident" situation described above. The overall rating for the student is less than 3, but the student rated themselves a full point or more higher than their average rating. Possibly the student contributed but managed to alienate the other team members, or more likely they tend to overstate their own contributions.
Your self-ratings were significantly higher than your teammates. ratings of your contributions to the team. The members of your team indicated that your contributions to the team were below expectations. This report gives you details about how the members of your team perceived your team contributions in five key areas. Please use this information to identify problem areas in order to contribute effectively in future teamwork situations. Please contact your course instructor if you need assistance or if you believe that your ratings were inappropriate.
Underconfident The overall team rating for this student is greater than 3, but the student rated themselves at least a point lower than this value. This would indicate that the student is "underconfident" or too critical of their own contributions.
Your self-ratings were significantly lower than your teammates. ratings of your contributions to the team. The members of your team have indicated that you were a highly effective team member. Please try not to minimize the value of your contributions to the team.

199
CATME Notes CATME Notes - Researcher
Info Received CATME Notes - Student
Info Received
Conflict This condition is best summarized as "somebody didn't get along.” Specifically, this student rated another team member at 2 or less, while the median rating for that student from the other team members is 3 or more. Note that the system checks for the "Clique" condition described above before evaluating the data for potential personality conflicts. For the "Clique" condition not to be flagged there must be significant agreement among the other students' scores, so this would appear to be an individual personality conflict. This is another condition that can result in erroneous "Adjustment Factor" values, and so the "Adjustment Factor" column will be highlighted in this case.
Your evaluation indicates that <other student> contributed very little to the project. This is not consistent with the assessment of the rest of the team. Your instructor may require additional information to clarify what happened in your team.
Manipulative One of the students on the team appears to be trying to "skew the curve" by giving themselves high ratings while rating the other team members poorly (it's possible that the student honestly believes that they were a star performer and the other team members failed to contribute). Strictly speaking, the student has to have given themselves an overall rating of 4 or higher while rating all of the other members on their team at least two points below this rating. The "Manipulator" condition is one that can cause erroneous "Adjustment Factor" values and will result in the "Adjustment Factor" column being highlighted.
Your self-evaluation indicates you made the primary contribution to the project with little value added by your teammates. The ratings from your teammates did not concur with your assessment. Your instructor may require additional information to clarify what happened in your team.
Clique Behavior-Cliques
None of the other conditions described above apply, but there is still significant disagreement between the ratings from various team members. "Significant disagreement" here is defined as the sum of the standard deviations for the ratings in each behavioral category being greater than the total number of behaviors surveyed (typically 5). When this occurs, it usually means that the team has split into multiple non-cooperating groups-- hence "Cliques.” This is another situation that can lead to erroneous "Adjustment Factor" values, and so the "Adjustment Factor" column will be highlighted in this case.
There was considerable disagreement among your teammates as to which team members were most effective during team assignments. Your instructor may require additional information to clarify what happened in your team.
200
Appendix P
Single Case Research Participants CATME Results
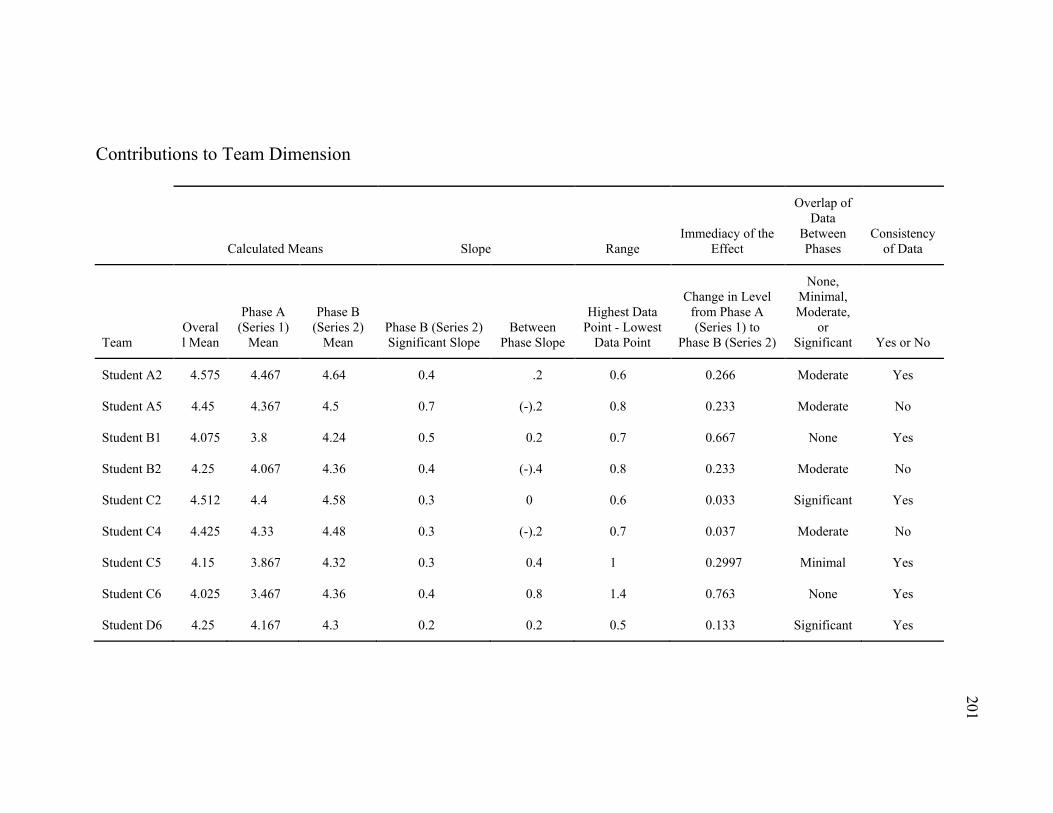
201
Contributions to Team Dimension
Calculated Means Slope Range Immediacy of the
Effect
Overlap of Data
Between Phases
Consistency of Data
Team Overall Mean
Phase A (Series 1)
Mean
Phase B (Series 2)
Mean Phase B (Series 2) Significant Slope
Between Phase Slope
Highest Data Point - Lowest
Data Point
Change in Level from Phase A (Series 1) to
Phase B (Series 2)
None, Minimal, Moderate,
or Significant Yes or No
Student A2 4.575 4.467 4.64 0.4 .2 0.6 0.266 Moderate Yes
Student A5 4.45 4.367 4.5 0.7 (-).2 0.8 0.233 Moderate No
Student B1 4.075 3.8 4.24 0.5 0.2 0.7 0.667 None Yes
Student B2 4.25 4.067 4.36 0.4 (-).4 0.8 0.233 Moderate No
Student C2 4.512 4.4 4.58 0.3 0 0.6 0.033 Significant Yes
Student C4 4.425 4.33 4.48 0.3 (-).2 0.7 0.037 Moderate No
Student C5 4.15 3.867 4.32 0.3 0.4 1 0.2997 Minimal Yes
Student C6 4.025 3.467 4.36 0.4 0.8 1.4 0.763 None Yes
Student D6 4.25 4.167 4.3 0.2 0.2 0.5 0.133 Significant Yes

202
Interactions with Team Dimension
Calculated Means Slope Range Immediacy of the
Effect
Overlap of Data
Between Phases
Consistency of Data
Team Overall Mean
Phase A (Series 1)
Mean
Phase B (Series 2)
Mean Phase B (Series 2) Significant Slope
Between Phase Slope
Highest Data Point - Lowest
Data Point
Change in Level from Phase A (Series 1) to
Phase B (Series 2)
None, Minimal, Moderate,
or Significant Yes or No
Student A2 4.275 3.73 4.6 0.2 .7 1.8 1 None Yes
Student A5 4.1 3.6 4.4 0.3 0.2 1.3 0.833 None Yes
Student B1 4 3.73 4.16 0.7 0.2 0.9 0.37 None Yes
Student B2 4.15 3.93 4.28 0.3 0.2 0.7 0.37 Minimal Yes
Student C2 4.525 4.23 4.7 0.5 0 1 0.27 Minimal Yes
Student C4 4.537 4.5 4.56 0.3 (-).3 0.5 (-).067 Moderate No
Student C5 4.55 4.6 4.52 0.1 (-).2 0.2 0.1 Significant No
Student C6 4.11 3.8 4.3 0.3 0.5 0.6 0.467 None Yes
Student D6 4.363 4.367 4.36 0.4 0.2 0.8 (-).137 Significant No

203
Keeping Team on Track Team Dimension
Calculated Means Slope Range Immediacy of the
Effect
Overlap of Data
Between Phases
Consistency of Data
Team Overall Mean
Phase A (Series 1)
Mean
Phase B (Series 2)
Mean Phase B (Series 2) Significant Slope
Between Phase Slope
Highest Data Point - Lowest
Data Point
Change in Level from Phase A (Series 1) to
Phase B (Series 2)
None, Minimal, Moderate,
or Significant Yes or No
Student A2 4.2875 3.867 4.54 (-).5 0.1 1.4 0.97 Moderate No
Student A5 4.26 4 4.42 0.3 0 1.1 0.6 Minimal Yes
Student B1 4.05 3.73 4.24 0.7 0.6 0.9 0.4367 Moderate Yes
Student B2 4.175 3.93 4.32 0.3 0.2 0.7 0.37 None Yes
Student C2 4.675 4.33 4.88 0.2 0.3 1 0.47 None Yes
Student C4 4.475 4.3 4.58 0.4 0 0.6 0.133 Minimal Yes
Student C5 4.225 3.867 4.44 0.2 0.1 0.9 0.566 None Yes
Student C6 3.925 3.467 4.2 0.2 0.5 1 0.7 None Yes
Student D6 4.125 3.83 4.3 0.4 0.2 0.9 0.403 None Yes

204
Expecting Quality Team Dimension
Calculated Means Slope Range Immediacy of the
Effect
Overlap of Data
Between Phases
Consistency of Data
Team Overall Mean
Phase A (Series 1)
Mean
Phase B (Series 2)
Mean Phase B (Series 2) Significant Slope
Between Phase Slope
Highest Data Point - Lowest
Data Point
Change in Level from Phase A (Series 1) to
Phase B (Series 2)
None, Minimal, Moderate,
or Significant Yes or No
Student A2 4.39 4.23 4.48 0.1 0.2 0.5 0.237 Moderate Yes
Student A5 4.46 4.3 4.56 0.2 0.2 0.4 0.233 None Yes
Student B1 4 3.67 4.2 0.5 0.6 1.1 0.4967 None Yes
Student B2 4.1 3.8 4.28 0.4 0.2 0.9 0.5 None Yes
Student C2 4.513 4.167 4.72 0.5 0.1 1 0.433 None Yes
Student C4 4.475 4.3 4.58 0.2 0.5 0.8 0.367 None Yes
Student C5 4.438 4.367 4.48 0.4 0.1 0.5 0.133 Moderate Yes
Student C6 4.21 3.867 4.42 0.2 0.2 0.9 0.4 Minimal Yes
Student D6 4.3 4.1 4.42 0.6 0.4 0.8 0.267 Minimal Yes
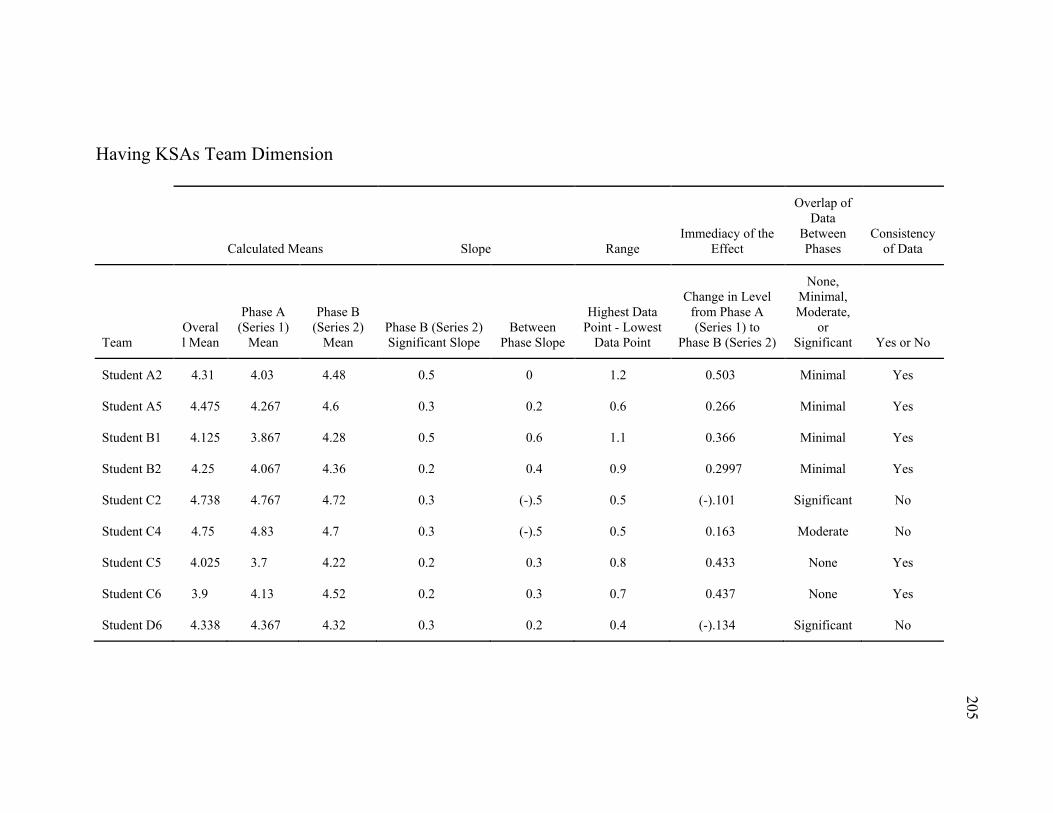
205
Having KSAs Team Dimension
Calculated Means Slope Range Immediacy of the
Effect
Overlap of Data
Between Phases
Consistency of Data
Team Overall Mean
Phase A (Series 1)
Mean
Phase B (Series 2)
Mean Phase B (Series 2) Significant Slope
Between Phase Slope
Highest Data Point - Lowest
Data Point
Change in Level from Phase A (Series 1) to
Phase B (Series 2)
None, Minimal, Moderate,
or Significant Yes or No
Student A2 4.31 4.03 4.48 0.5 0 1.2 0.503 Minimal Yes
Student A5 4.475 4.267 4.6 0.3 0.2 0.6 0.266 Minimal Yes
Student B1 4.125 3.867 4.28 0.5 0.6 1.1 0.366 Minimal Yes
Student B2 4.25 4.067 4.36 0.2 0.4 0.9 0.2997 Minimal Yes
Student C2 4.738 4.767 4.72 0.3 (-).5 0.5 (-).101 Significant No
Student C4 4.75 4.83 4.7 0.3 (-).5 0.5 0.163 Moderate No
Student C5 4.025 3.7 4.22 0.2 0.3 0.8 0.433 None Yes
Student C6 3.9 4.13 4.52 0.2 0.3 0.7 0.437 None Yes
Student D6 4.338 4.367 4.32 0.3 0.2 0.4 (-).134 Significant No

206
Appendix Q
Single Case Research Contributions to Team Graphs

207
Student A2 Contributions to Team
Student A5 Contributions to Team
1 2 3 4 5 6 7 8
Series1 3.6 4.2 4.3
Series2 4.3 4.8 4.5 4.3 4.5
33.23.43.63.8
44.24.44.64.8
5
Team
Ski
lls A
vera
ge P
eer
Rati
ng Student A2 Having KSAs
1 2 3 4 5 6 7 8
Series1 4.3 4.3 4.5
Series2 4.3 4.8 4.7 4 4.7
33.23.43.63.8
44.24.44.64.8
5
Team
Ski
lls A
vera
ge P
eer
Rati
ng Student A5 Contributions to Team
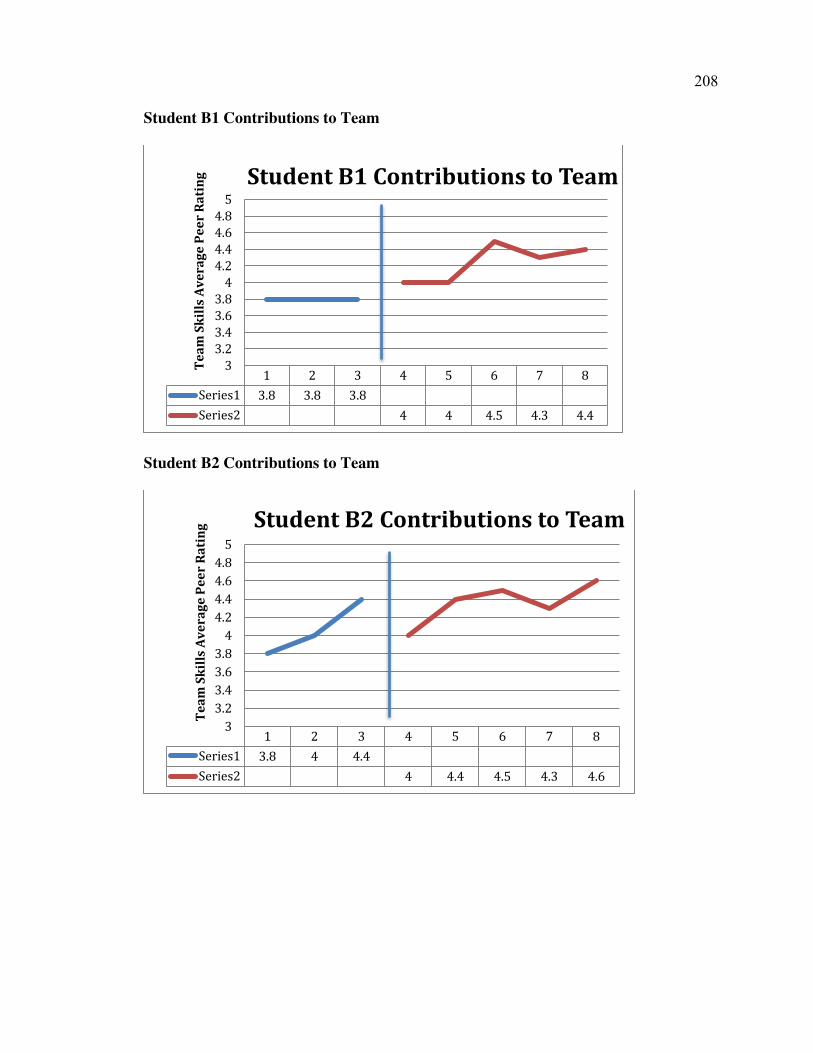
208
Student B1 Contributions to Team
Student B2 Contributions to Team
1 2 3 4 5 6 7 8
Series1 3.8 3.8 3.8
Series2 4 4 4.5 4.3 4.4
33.23.43.63.8
44.24.44.64.8
5Te
am S
kills
Ave
rage
Pee
r Ra
ting
Student B1 Contributions to Team
1 2 3 4 5 6 7 8
Series1 3.8 4 4.4
Series2 4 4.4 4.5 4.3 4.6
33.23.43.63.8
44.24.44.64.8
5
Team
Ski
lls A
vera
ge P
eer
Rati
ng Student B2 Contributions to Team

209
Student C2 Contributions to Team
Student C4 Contributions to Team
1 2 3 4 5 6 7 8
Series1 4.2 4.7 4.3
Series2 4.3 4.5 4.5 4.8 4.8
33.23.43.63.8
44.24.44.64.8
5Te
am S
kils
Ave
rage
Pee
r Ra
ting
Student C2 Contributions to Team
1 2 3 4 5 6 7 8
Series1 4 4.5 4.5
Series2 4.3 4.5 4.3 4.6 4.7
33.23.43.63.8
44.24.44.64.8
5
Team
Ski
lls A
vera
ge P
eer
Rati
ng Student C4 Contributions to Team
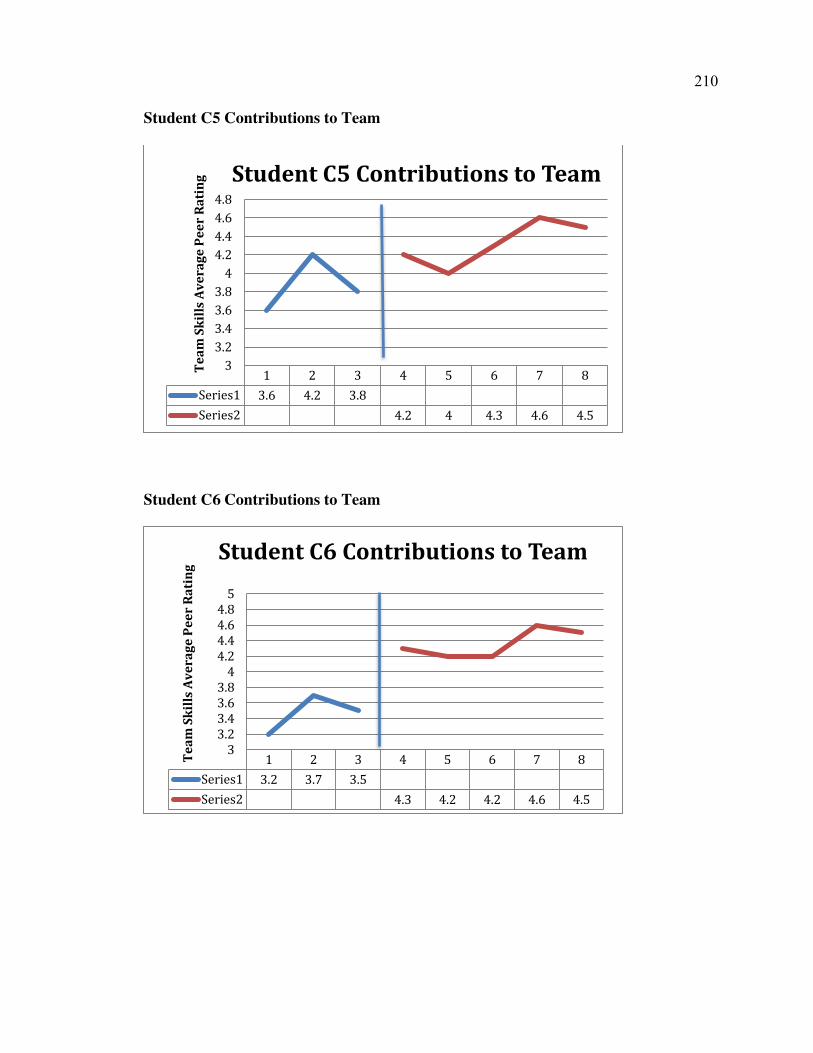
210
Student C5 Contributions to Team
Student C6 Contributions to Team
1 2 3 4 5 6 7 8
Series1 3.6 4.2 3.8
Series2 4.2 4 4.3 4.6 4.5
33.23.43.63.8
44.24.44.64.8
Team
Ski
lls A
vera
ge P
eer
Rati
ng Student C5 Contributions to Team
1 2 3 4 5 6 7 8
Series1 3.2 3.7 3.5
Series2 4.3 4.2 4.2 4.6 4.5
33.23.43.63.8
44.24.44.64.8
5
Team
Ski
lls A
vera
ge P
eer
Rati
ng Student C6 Contributions to Team

211
Student D6 Contributions to Team
1 2 3 4 5 6 7 8
Series1 4 4.2 4.3
Series2 4.5 4.2 4.2 4.2 4.4
33.23.43.63.8
44.24.44.64.8
5Te
am S
kills
Ave
rage
Pee
r Ra
ting
Student D6 Contributions to Team

212
Appendix R
Single Case Research Interactions with Team Graphs

213
Student A2 Interactions with Team
Student A5 Interactions with Team
1 2 3 4 5 6 7 8
Series1 3 4.2 4
Series2 4.7 4.8 4.7 4.3 4.5
33.23.43.63.8
44.24.44.64.8
5
Team
Ski
lls A
vera
ge P
eer
Rati
ng
Student A2 Interactions with Team
1 2 3 4 5 6 7 8
Series1 3.5 3.3 4
Series2 4.2 4.6 4.5 4.2 4.5
33.23.43.63.8
44.24.44.64.8
5
Team
Ski
lls A
vera
ge P
eer
Rati
ng Student A5 Interactions with Team
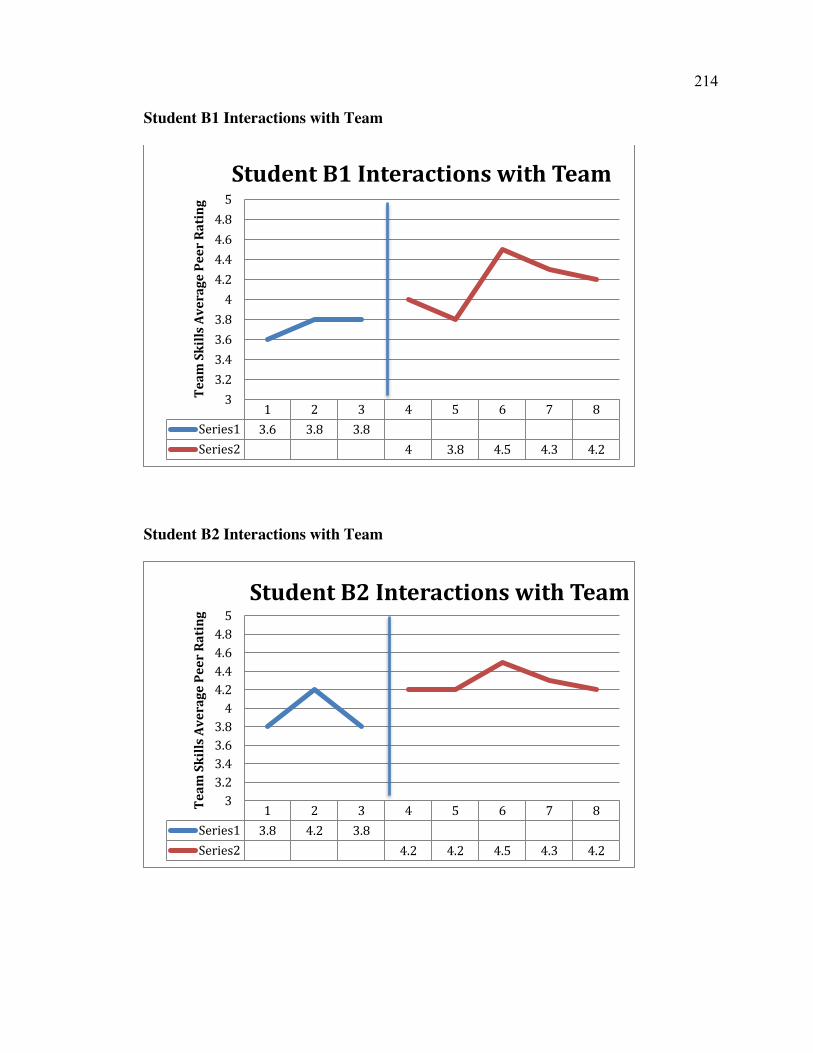
214
Student B1 Interactions with Team
Student B2 Interactions with Team
1 2 3 4 5 6 7 8
Series1 3.6 3.8 3.8
Series2 4 3.8 4.5 4.3 4.2
3
3.2
3.4
3.6
3.8
4
4.2
4.4
4.6
4.8
5Te
am S
kills
Ave
rage
Pee
r Ra
ting
Student B1 Interactions with Team
1 2 3 4 5 6 7 8
Series1 3.8 4.2 3.8
Series2 4.2 4.2 4.5 4.3 4.2
33.23.43.63.8
44.24.44.64.8
5
Team
Ski
lls A
vera
ge P
eer
Rati
ng
Student B2 Interactions with Team
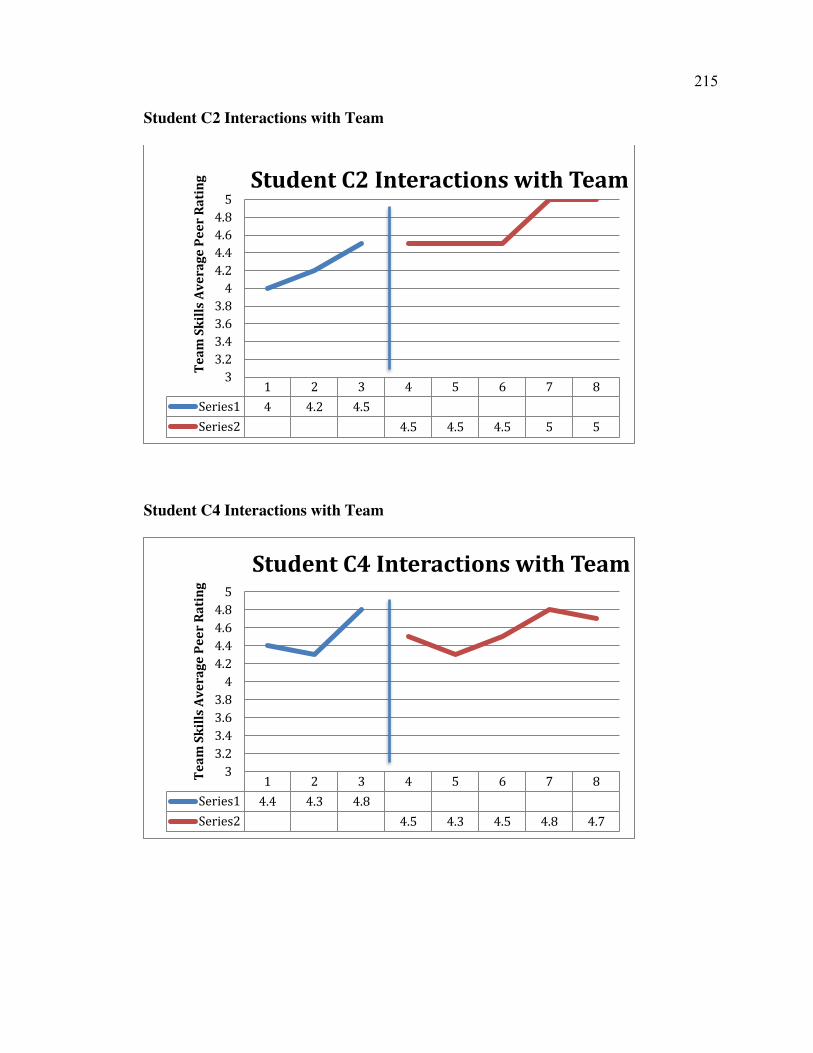
215
Student C2 Interactions with Team
Student C4 Interactions with Team
1 2 3 4 5 6 7 8
Series1 4 4.2 4.5
Series2 4.5 4.5 4.5 5 5
33.23.43.63.8
44.24.44.64.8
5Te
am S
kills
Ave
rage
Pee
r Ra
ting
Student C2 Interactions with Team
1 2 3 4 5 6 7 8
Series1 4.4 4.3 4.8
Series2 4.5 4.3 4.5 4.8 4.7
33.23.43.63.8
44.24.44.64.8
5
Team
Ski
lls A
vera
ge P
eer
Rati
ng
Student C4 Interactions with Team
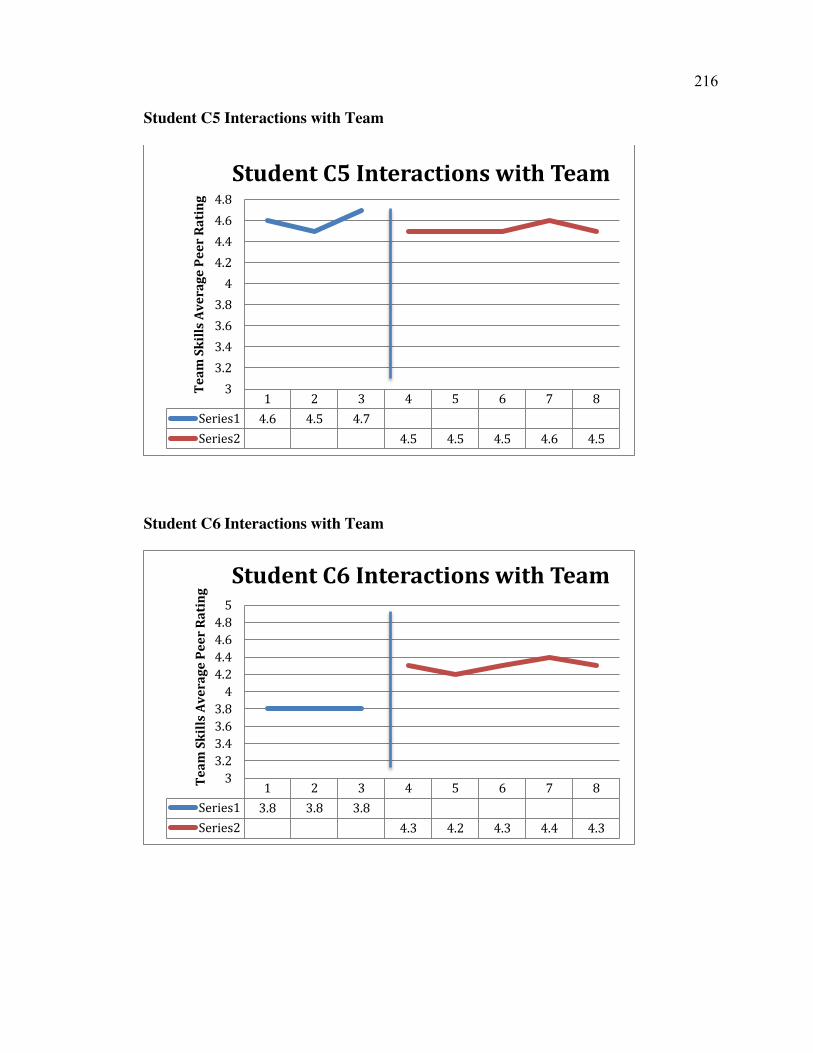
216
Student C5 Interactions with Team
Student C6 Interactions with Team
1 2 3 4 5 6 7 8
Series1 4.6 4.5 4.7
Series2 4.5 4.5 4.5 4.6 4.5
3
3.2
3.4
3.6
3.8
4
4.2
4.4
4.6
4.8Te
am S
kills
Ave
rage
Pee
r Ra
ting
Student C5 Interactions with Team
1 2 3 4 5 6 7 8
Series1 3.8 3.8 3.8
Series2 4.3 4.2 4.3 4.4 4.3
33.23.43.63.8
44.24.44.64.8
5
Team
Ski
lls A
vera
ge P
eer
Rati
ng Student C6 Interactions with Team

217
Student D6 Interactions with Team
1 2 3 4 5 6 7 8
Series1 4.3 4 4.8
Series2 4.3 4.2 4.2 4.3 4.8
33.23.43.63.8
44.24.44.64.8
5Te
am S
kills
Ave
rage
Pee
r Ra
ting
Student D6 Interactions with Team
218
Appendix S
Single Case Research Keeping Track of Team Graphs

219
Student A2 Keeping Team on Track
Student A4 Keeping Team on Track
1 2 3 4 5 6 7 8
Series1 3.4 3.5 4.7
Series2 4.8 4.8 4.5 4.3 4.3
33.23.43.6
3.84
4.2
4.44.6
4.85
Team
Ski
lls A
vera
ge P
eer
Rati
ng
Student A2 Keeping Team on Track
1 2 3 4 5 6 7 8
Series1 3.7 3.8 4.5
Series2 4.5 4.8 4.5 4.3 4
33.23.43.63.8
44.24.44.64.8
5
Team
Ski
lls A
vera
ge P
eer
Rati
ng
Student A5 Keeping Team on Track

220
Student B1 Keeping Team on Track
Student B2 Keeping Team on Track
1 2 3 4 5 6 7 8
Series1 3.8 3.8 3.6
Series2 4.2 3.8 4.5 4.3 4.4
33.23.43.6
3.84
4.2
4.44.6
4.85
Team
Ski
lls A
vera
ge P
eer
Rati
ng
Student B1 Keeping Team on Track
1 2 3 4 5 6 7 8
Series1 3.8 3.8 3.6
Series2 4.2 3.8 4.5 4.3 4.4
33.23.43.63.8
44.24.44.64.8
5
Team
Ski
lls A
vera
ge P
eer
Rati
ng
Student B1 Keeping Team on Track

221
Student C2 Keeping Team on Track
Student C4 Keeping Team on Track
1 2 3 4 5 6 7 8
Series1 4 4.5 4.5
Series2 4.8 4.8 4.8 5 5
33.23.43.63.8
44.24.44.64.8
5Te
am S
kills
Ave
rage
Pee
r Ra
ting
Student C2 Keeping Team on Track
1 2 3 4 5 6 7 8
Series1 4.4 4.2 4.3
Series2 4.3 4.3 4.7 4.8 4.8
33.23.43.63.8
44.24.44.64.8
5
Team
Ski
lls A
vera
ge P
eer
Rati
ng
Student C4 Keeping Team on Track

222
Student C5 Keeping Team on Track
Student C6 Keeping Team on Track
1 2 3 4 5 6 7 8
Series1 3.6 3.8 4.2
Series2 4.3 4.5 4.5 4.4 4.5
33.23.43.6
3.84
4.2
4.44.6
4.85
Team
Ski
lls A
vera
ge P
eer
Rati
ng
Student C5 Keeping Team on Track
1 2 3 4 5 6 7 8
Series1 3.6 3.3 3.5
Series2 4 4.2 4.3 4.2 4.3
33.23.43.63.8
44.24.44.64.8
5
Team
Ski
lls A
vera
ge P
eer
Rati
ng Student C6 Keeping Team on Track
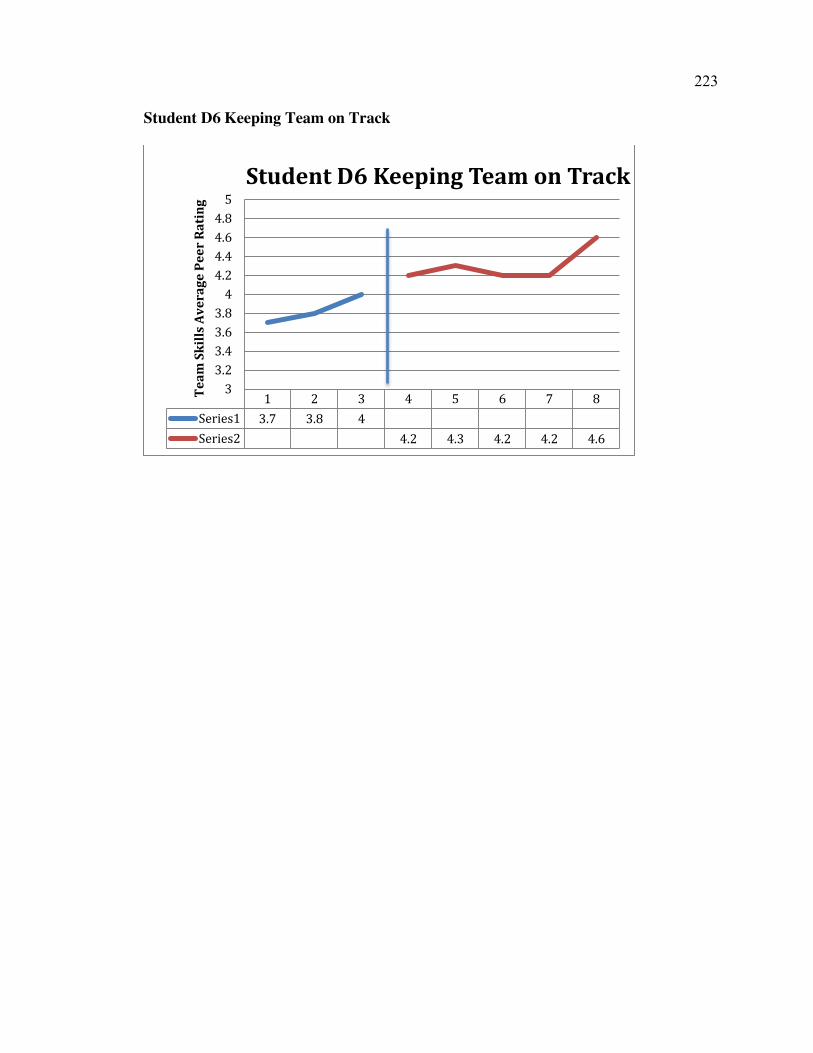
223
Student D6 Keeping Team on Track
1 2 3 4 5 6 7 8
Series1 3.7 3.8 4
Series2 4.2 4.3 4.2 4.2 4.6
33.23.43.6
3.84
4.2
4.44.6
4.85
Team
Ski
lls A
vera
ge P
eer
Rati
ng
Student D6 Keeping Team on Track

224
Appendix T
Single Case Research Expecting Quality Graphs
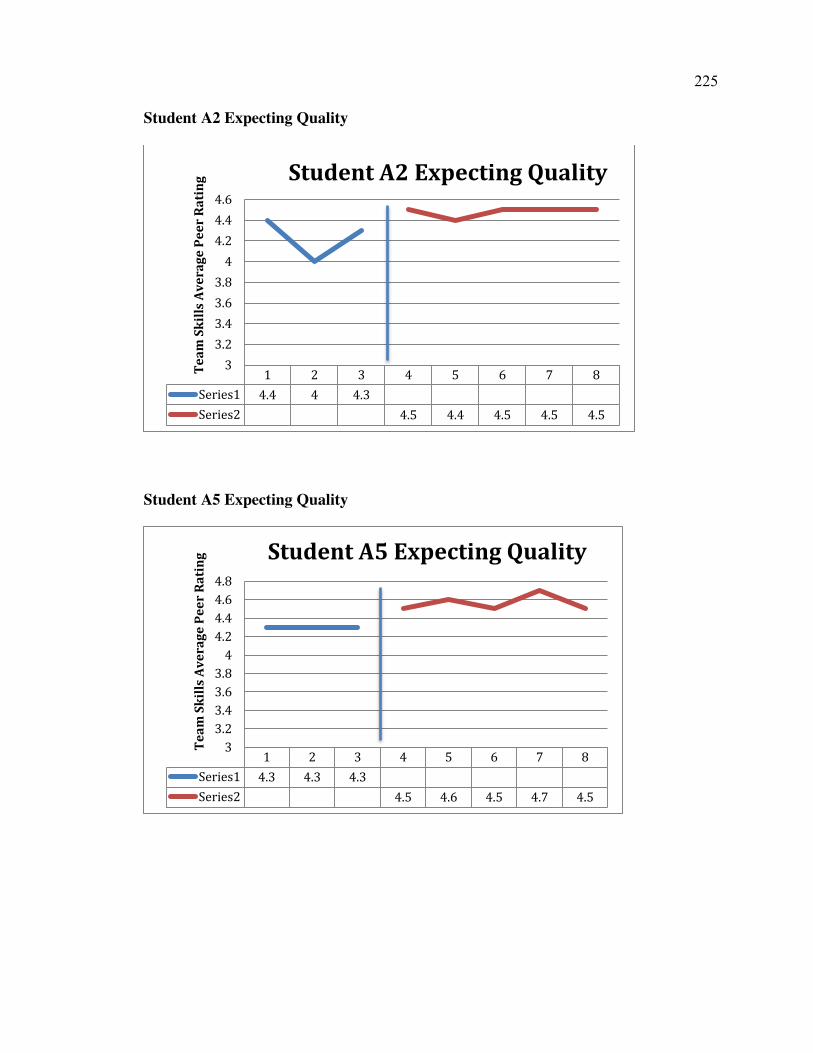
225
Student A2 Expecting Quality
Student A5 Expecting Quality
1 2 3 4 5 6 7 8
Series1 4.4 4 4.3
Series2 4.5 4.4 4.5 4.5 4.5
3
3.2
3.4
3.6
3.8
4
4.2
4.4
4.6Te
am S
kills
Ave
rage
Pee
r Ra
ting
Student A2 Expecting Quality
1 2 3 4 5 6 7 8
Series1 4.3 4.3 4.3
Series2 4.5 4.6 4.5 4.7 4.5
33.23.43.63.8
44.24.44.64.8
Team
Ski
lls A
vera
ge P
eer
Rati
ng Student A5 Expecting Quality

226
Student B1 Expecting Quality
Student B2 Expecting Quality
1 2 3 4 5 6 7 8
Series1 3.8 3.8 3.4
Series2 4 4 4.5 4.3 4.2
33.23.43.63.8
44.24.44.64.8
5Te
am S
kills
Ave
rage
Pee
r Ra
ting
Student B1 Expecting Quality
1 2 3 4 5 6 7 8
Series1 3.6 4 3.8
Series2 4 4.4 4.5 4.3 4.2
33.23.43.63.8
44.24.44.64.8
5
Team
Ski
lls A
vera
ge P
eer
Rati
ng Student B2 Expecting Quality

227
Student C2 Expecting Quality
Student C4 Expecting Quality
1 2 3 4 5 6 7 8
Series1 4 4.3 4.2
Series2 4.3 4.8 4.7 4.8 5
33.23.43.63.8
44.24.44.64.8
5Te
am S
kills
Ave
rage
Pee
r Ra
ting
Student C2 Expecting Quality
1 2 3 4 5 6 7 8
Series1 4.4 4.2 4
Series2 4.5 4.5 4.7 4.8 4.7
33.23.43.63.8
44.24.44.64.8
5
Team
Ski
lls A
vera
ge P
eer
Rati
ng Student C4 Expecting Quality
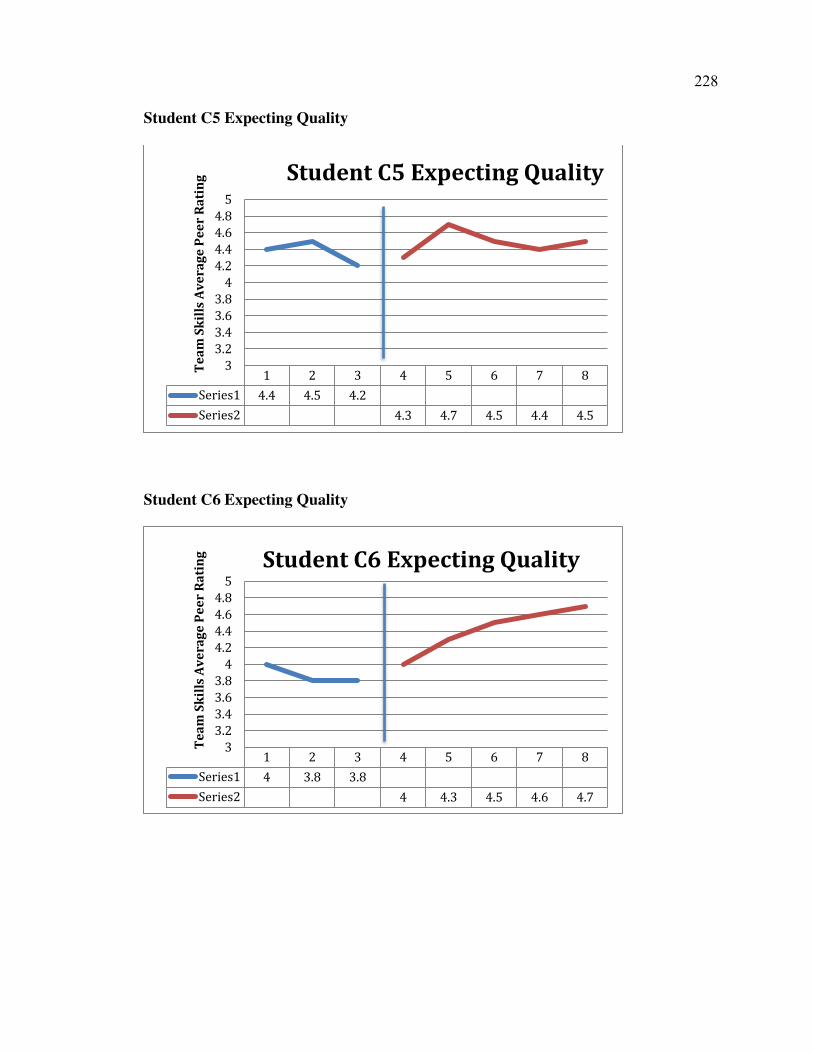
228
Student C5 Expecting Quality
Student C6 Expecting Quality
1 2 3 4 5 6 7 8
Series1 4.4 4.5 4.2
Series2 4.3 4.7 4.5 4.4 4.5
33.23.43.63.8
44.24.44.64.8
5Te
am S
kills
Ave
rage
Pee
r Ra
ting
Student C5 Expecting Quality
1 2 3 4 5 6 7 8
Series1 4 3.8 3.8
Series2 4 4.3 4.5 4.6 4.7
33.23.43.63.8
44.24.44.64.8
5
Team
Ski
lls A
vera
ge P
eer
Rati
ng Student C6 Expecting Quality
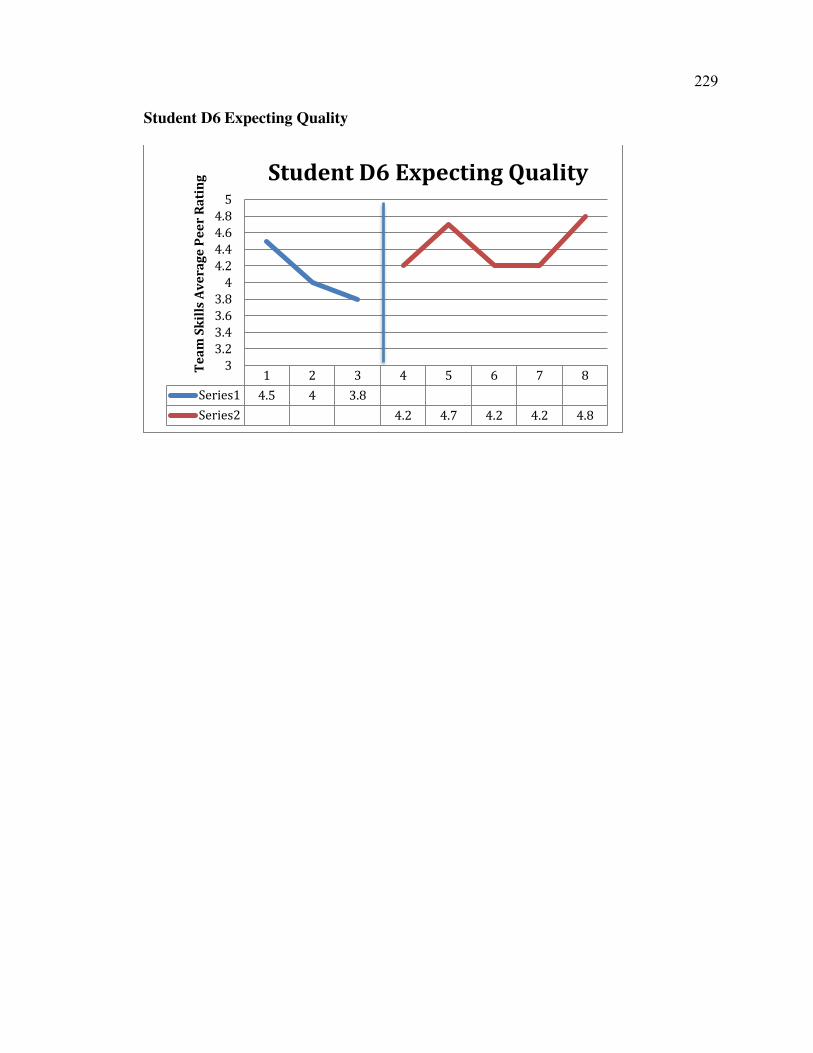
229
Student D6 Expecting Quality
1 2 3 4 5 6 7 8
Series1 4.5 4 3.8
Series2 4.2 4.7 4.2 4.2 4.8
33.23.43.63.8
44.24.44.64.8
5Te
am S
kills
Ave
rage
Pee
r Ra
ting
Student D6 Expecting Quality

230
Appendix U
Single Case Research Having KSA’s Graphs

231
Student A2 Having KSA’s
Student A5 Having KSA’s
1 2 3 4 5 6 7 8
Series1 3.6 4.2 4.3
Series2 4.3 4.8 4.5 4.3 4.5
33.23.43.63.8
44.24.44.64.8
5Te
am S
kills
Ave
rage
Pee
r Ra
ting
Student A2 Having KSAs
1 2 3 4 5 6 7 8
Series1 4.3 4.3 4.3
Series2 4.5 4.6 4.5 4.7 4.5
33.23.43.63.8
44.24.44.64.8
Team
Ski
lls A
vera
ge P
eer
Rati
ng Student A5 Expecting Quality

232
Student B1 Having KSA’s
Student B2 Having KSA’s
1 2 3 4 5 6 7 8
Series1 4.2 3.8 3.6
Series2 4.2 4 4.5 4.7 4
33.23.43.63.8
44.24.44.64.8
5Te
am S
kills
Ave
rage
Pee
r Ra
ting
Student B1 Having KSAs
1 2 3 4 5 6 7 8
Series1 4.4 4 3.8
Series2 4.2 4.4 4.5 4.7 4
33.23.43.63.8
44.24.44.64.8
5
Team
Ski
lls A
vera
ge P
eer
Rati
ng Student B2 Having KSAs
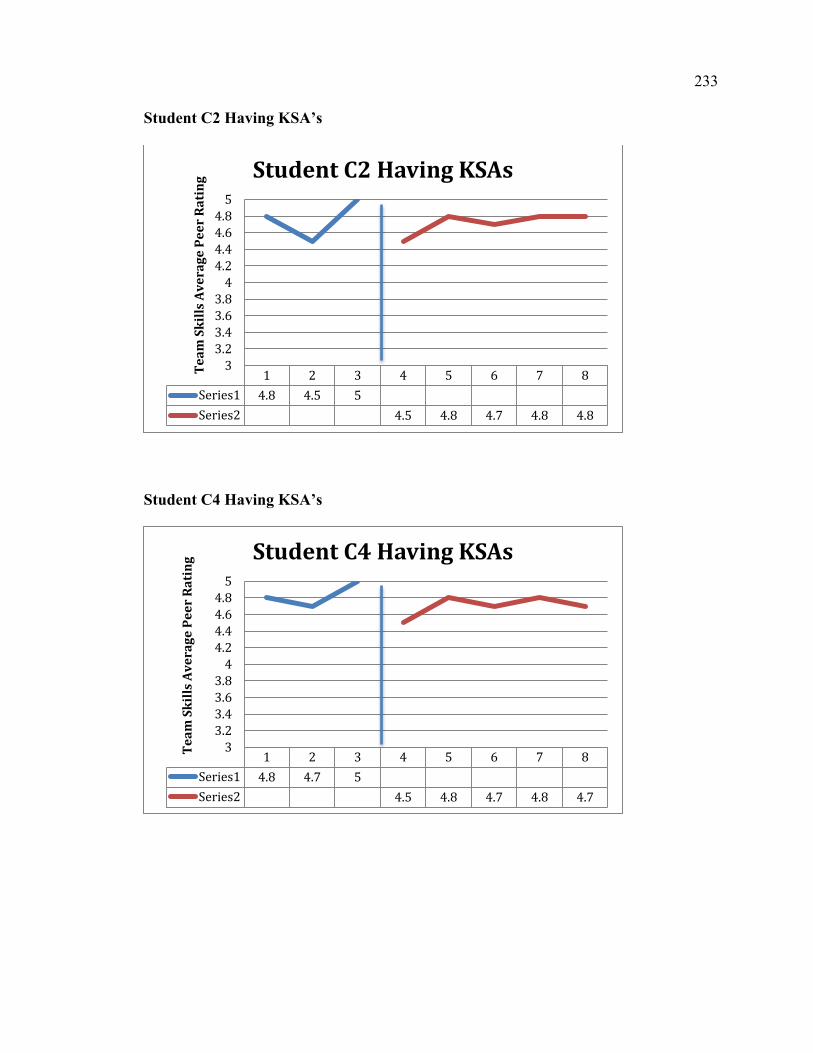
233
Student C2 Having KSA’s
Student C4 Having KSA’s
1 2 3 4 5 6 7 8
Series1 4.8 4.5 5
Series2 4.5 4.8 4.7 4.8 4.8
33.23.43.63.8
44.24.44.64.8
5Te
am S
kills
Ave
rage
Pee
r Ra
ting
Student C2 Having KSAs
1 2 3 4 5 6 7 8
Series1 4.8 4.7 5
Series2 4.5 4.8 4.7 4.8 4.7
33.23.43.63.8
44.24.44.64.8
5
Team
Ski
lls A
vera
ge P
eer
Rati
ng Student C4 Having KSAs

234
Student C5 Having KSA’s
Student C6 Having KSA’s
1 2 3 4 5 6 7 8
Series1 3.6 3.8 3.7
Series2 4 4.2 4.2 4.4 4.3
33.23.43.63.8
44.24.44.64.8
5Te
am S
kills
Ave
rage
Pee
r Ra
ting
Student C5 Having KSAs
1 2 3 4 5 6 7 8
Series1 4.2 4 4.2
Series2 4.5 4.5 4.7 4.4 4.5
33.23.43.63.8
44.24.44.64.8
5
Team
Ski
lls A
vera
ge P
eer
Rati
ng Student C6 Having KSAs
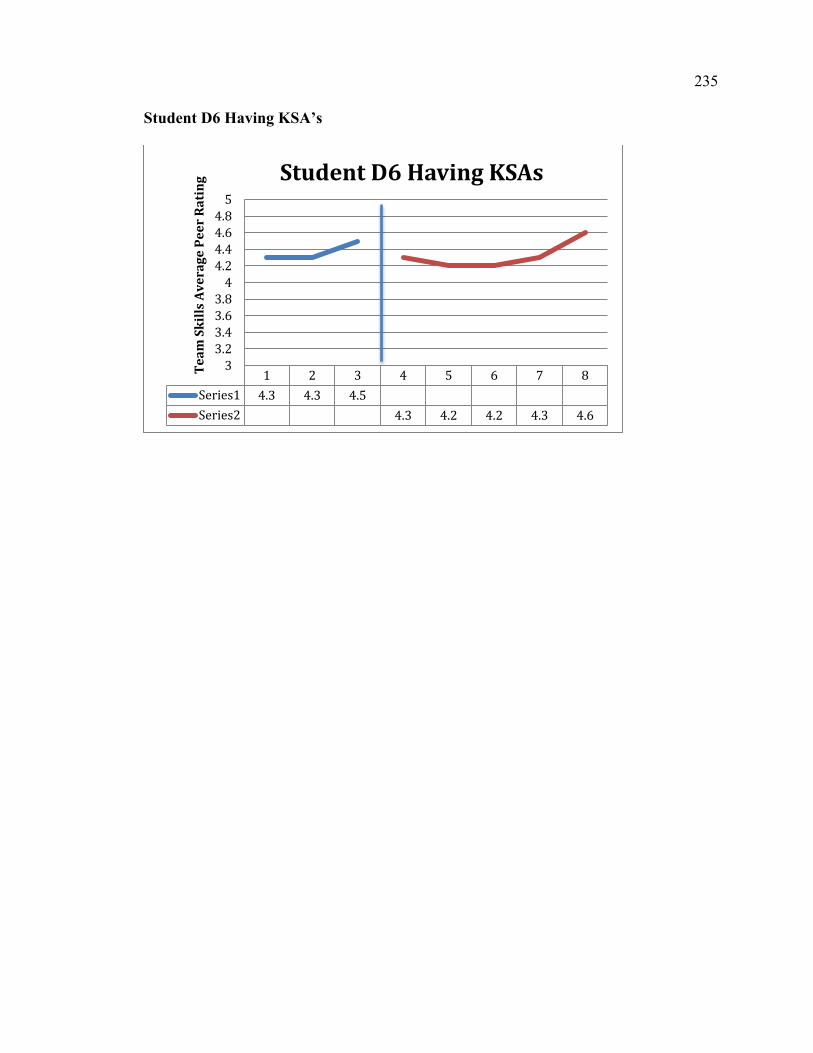
235
Student D6 Having KSA’s
1 2 3 4 5 6 7 8
Series1 4.3 4.3 4.5
Series2 4.3 4.2 4.2 4.3 4.6
33.23.43.63.8
44.24.44.64.8
5Te
am S
kills
Ave
rage
Pee
r Ra
ting
Student D6 Having KSAs
236
Appendix V
Teams A - F Semester Satisfaction Graphs

237
Team A Semester Satisfaction
Team B Semester Satisfaction
1 2 3 4 5 6 7 8
Series1 4.5 4.39 4.22
Series2 4.39 4.44 4.56 4.61 4.67
3.5
3.7
3.9
4.1
4.3
4.5
4.7
4.9
Aver
age
Team
Sat
isfa
ctio
n Ra
ting
Team A Semester Satisfaction
1 2 3 4 5 6 7 8
Series1 3.87 3.87 4.07
Series2 4.2 3.93 3.83 4.56 4.4
3.5
3.7
3.9
4.1
4.3
4.5
4.7
4.9
Aver
age
Team
Sat
isfa
cton
Rat
ing Team B Semester Satisfaction

238
Team C Semester Satisfaction
Team D Semester Satisfaction
1 2 3 4 5 6 7 8
Series1 4.53 4.56 4.61
Series2 4.78 4.17 4.67 4.8 4.67
3.5
3.7
3.9
4.1
4.3
4.5
4.7
4.9
Aver
age
Team
Sat
isfa
ctio
n Ra
ting
Team C Semester Satisfaction
1 2 3 4 5 6 7 8
Series1 4.83 4.67 4.67
Series2 4.5 4.83 4.6 4.67 4.73
3.5
3.7
3.9
4.1
4.3
4.5
4.7
4.9
Aver
age
Team
Sat
isfa
ctio
n Ra
ting
Team D Semester Satisfaction

239
Team E Semester Satisfaction
Team F Semester Satisfaction
1 2 3 4 5 6 7 8
Series1 4.06 3.89 4.11
Series2 3.94 4 3.78 3.94 4.2
3.5
3.7
3.9
4.1
4.3
4.5
4.7
4.9
Aver
age
Team
Sat
isfa
ctio
n Ra
ting
Team E Semester Satisfaction
1 2 3 4 5 6 7 8
Series1 3 3.44 3.17
Series2 3.33 2.42 2.47 3 2.33
2
2.5
3
3.5
4
4.5
5
Aver
age
Team
Sat
isfa
ctio
n Ra
ting
Team F Semester Satisfaction


![MBA & MBA+MSDT HANDBOOKquestromworld.bu.edu/.../FT-MBA-_-MBAMSDT-Handbook... · [ 3 ] FT MBA & MBA+MSDT INTRODUCTION The MBA and MBA+MSDT Full-Time Handbook is a reference document](https://img.pdfslide.us/doc/110x75/60bda8e811233a4a927a3ca9/mba-mbamsdt-h-3-ft-mba-mbamsdt-introduction-the-mba-and-mbamsdt.jpg)

![Measuring Group Personality with Swarm AI€¦ · underlying and unique group dynamics present in teams [9, 10]. For example, a study of MBA students found that measuring team efficacy](https://img.pdfslide.us/doc/110x75/605a7816f1adbf748b787f25/measuring-group-personality-with-swarm-ai-underlying-and-unique-group-dynamics-present.jpg)