Embed Size (px)
Citation preview
1
TO:
HENLEY MANAGEMENT COLLEGE
FROM:
CHEUNG TSE KIN, MICHAEL MASTER OF BUSINESS ADMINISTRATION
PROGRAMME STAGE THREE HONG KONG
SUBJECT:
ASSESSED ASSIGNMENT: BUSINESS FINANCE
March 2000
TOPIC:
1. Prepare a report to be presented to the Chief Executive of Ragus Corporation, recommending whether or not to accept the project proposal. (40%)
2. Identify and discuss the circumstances in which it may be rational to accept
negative net present value projects. (30%) 3. Describe the mechanism whereby shareholders’ wealth is maximised using the
dividend valuation model, raising any difficulties you perceive in this analysis (30%).
2
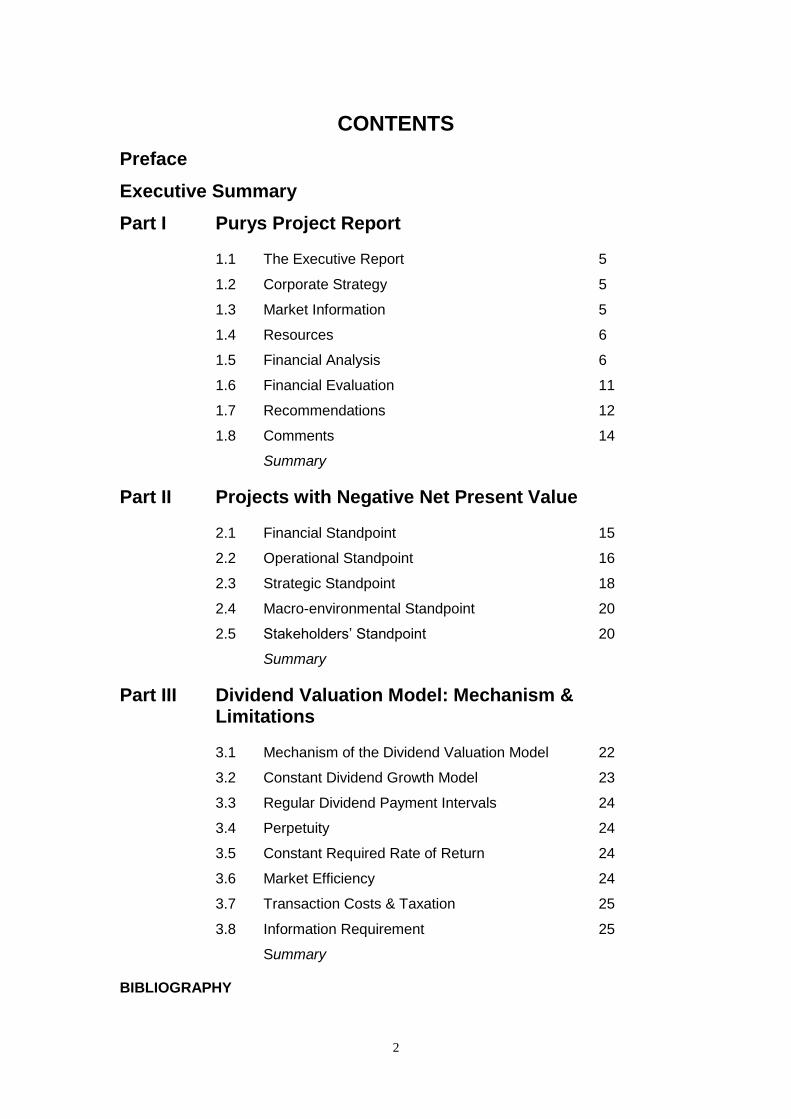
CONTENTS
Preface
Executive Summary
Part I Purys Project Report
1.1 The Executive Report 5
1.2 Corporate Strategy 5
1.3 Market Information 5
1.4 Resources 6
1.5 Financial Analysis 6
1.6 Financial Evaluation 11
1.7 Recommendations 12
1.8 Comments 14
Summary
Part II Projects with Negative Net Present Value 2.1 Financial Standpoint 15
2.2 Operational Standpoint 16
2.3 Strategic Standpoint 18
2.4 Macro-environmental Standpoint 20
2.5 Stakeholders’ Standpoint 20
Summary
Part III Dividend Valuation Model: Mechanism & Limitations
3.1 Mechanism of the Dividend Valuation Model 22
3.2 Constant Dividend Growth Model 23
3.3 Regular Dividend Payment Intervals 24
3.4 Perpetuity 24
3.5 Constant Required Rate of Return 24
3.6 Market Efficiency 24
3.7 Transaction Costs & Taxation 25
3.8 Information Requirement 25
Summary
BIBLIOGRAPHY
3
PREFACE TOPIC This assignment of Business Finance is the selected elective course in Stage III of
the MBA Programme. It is based on the Ragus Corporation Ltd. case study.
STRUCTURE
This report has 3 parts, divided in accordance to the 3 assignment questions.
Part I presents the Purys project proposal. The report was prepared as if the time
were January 1987 according to the data given from the case. The Tables and
Appendices related to this proposal are inserted here (instead of placing them at the
end), to provide a continuous flow of readability. Some comments are followed after
the proposal.
Part II identifies and discusses a wide range of circumstances whereby it is rational
to accept projects with negative net present value. The analysis starts by taking a
micro-view from the financial standpoint, and expands to a much broader perspective
in the later part. In section 2.3, under the Strategic Standpoint analysis, the writer
uses 3 different examples, from actual work experiences, to validate the discussion.
Part III begins with a simple illustration of the Dividend Valuation Model, followed by
the descriptions on its limitations.
With each Part ends with a section summary, this report has 5,017 words.
As part of the assignment contains confidential information related to the writer’s
employer, please do not disclose this report to those outside of the Henley
Management College. Thank you.
CHEUNG Tse-Kin Michael
March 2000 Hong Kong
4
Executive Summary
Internal information generated from Ragus Corporation indicated that there was a
positive market potential on the Purys product in the U.K. The main resource
requirements for Ragus to implement this new project included production site,
production plant, new manager/workers, raw materials, plus additional power and
maintenance. A projected profit and loss statement revealed that this venture has
a positive net present value in its estimated product life. The Chief Financial
Officer thereby gave a positive recommendation on this project. Apart from the
favourable financial return, it would also improve the overall competitive position
of Ragus Corporation, by means of diversifying business risks, reducing threat
from direct competitors, increasing bargaining power to suppliers, and, reducing
threat from new entrants.
There are situations whereby a firm will undertake a project with negative net
present value. First, if the quantitative information in the projected financial
statement is not entirely accurate, a negative bottom line does not mean that the
project should be discarded. Second, projects arising from the marketing, human
resources and information system departments may be a loss by itself, but could
bring many benefits at the corporate level. Third, projects with strategic
implications will often override the financial results. Fourth, firms are sometimes
forced to undertake ventures when the macro-environment drives them to do so.
Last, major stakeholders of an organization can overrule decision derived from
financial analysis.
The basic concept of the Dividend Valuation Model is to maximise shareholders’
wealth. It does so by finding the sum of the: 1) share price at the time of purchase,
2) present value of the share price at the time of sale, and 3) present values of all
the dividends expected to receive in the investment period. Its limitations are that
it assumes that the dividend growth rate, the dividend payment intervals, and the
required rate of return by investors, are all constants. Other drawbacks of the
theory include: it assumes the firm exist indefinitely, it fails to take transaction
costs and taxation effect into consideration, and, the amount of information
required to conduct this analysis is immense.
5
PART I Pury Project Report
1.1 The Executive Report
The Executive Report, consist of editorial and tabular contents, is presented as follow.
*********************************************************************************************
Purys Project
Submitted to: Mr. Tom Ragus; Chief Executive Office
Prepared by: Chief Financial Officer
Date: January 1987
Objective
To provide recommendation on the new Purys Project based on financial and
strategic analysis.
1.2 Corporate Strategy
The long-term corporate objective of Ragus Corporation is to maximise
shareholders’ value. To achieve this goal, the management team has decided,
through utilising technical expertise, to employ the strategy of Product Development.
1.3 Market Information
The Marketing Department has identified a potential in the Purys market. The
Research & Development team has developed the technology to produce Purys
product. A comprehensive market research, conducted in the last quarter of 1986,
reveals the following facts:
The market potential in the U.K. is 500,000 cases annually.
Setat currently has 75% market share in this product category. Another 5
regional firms hold the remaining 25%.
The market size has remained stable for 5 years.
The demand for Purys, if launch in this year, is estimated to be 100,000 cases,
at selling price of $30 per case.
The demand will double by the end of the 2nd year. Thereafter, the annual
demand will remain steady at 200,000 cases during its product-life.
Product life of Purys is estimated to be 5 years. Beyond that, the environment
would be too difficult and unrealistic to forecast.
6
1.4 Resources
Essential resources include:
A production line at the idle Peterborough factory site.
A production plant (including storage facilities), requiring an investment of
$4,200,000. Its estimated useful life is 8 years.
A new Production Manager (annual salary = $14,000).
A work-team of 16 (annual compensation = $10,000 per worker).
Raw material of 40 kg of Ragus to produce one case of Purys.
Power cost of $10 per case of Purys.
Annual maintenance fees of $550,000.
An allocation of $150,000 of general overheads from the operations of Ragus.
1.5 Financial Analysis
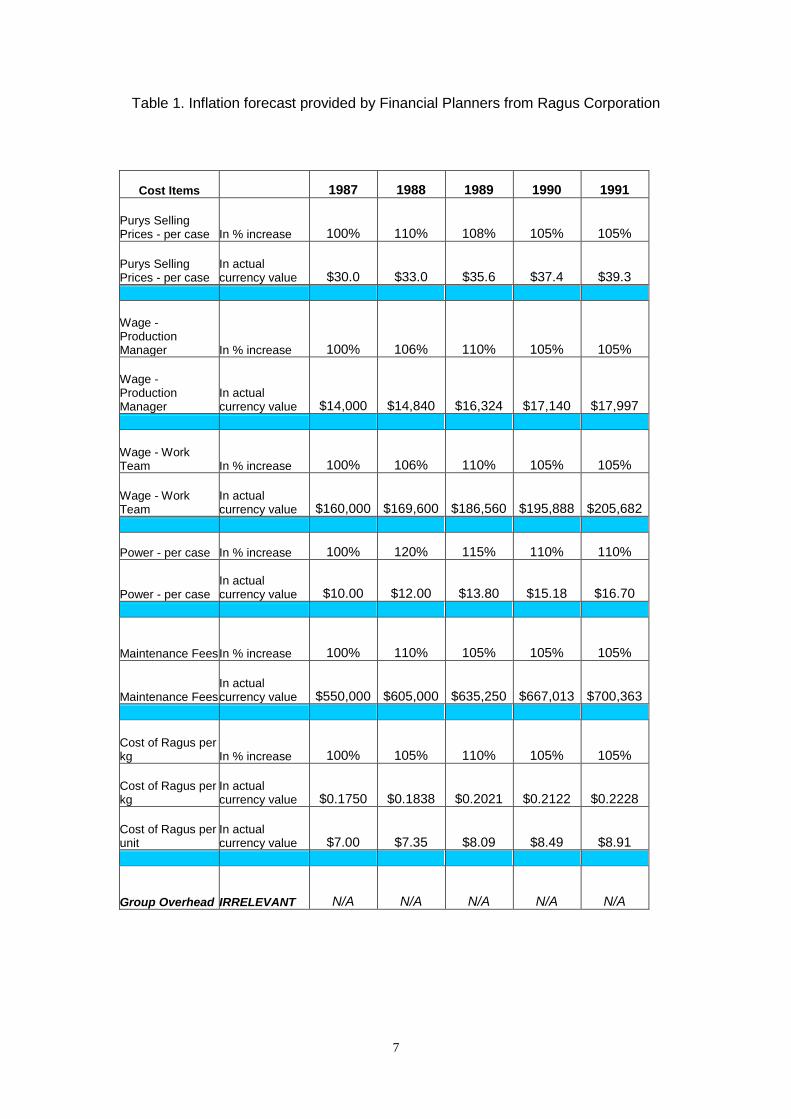
Table 1 is the Inflationary forecast provided by the Financial Planners.
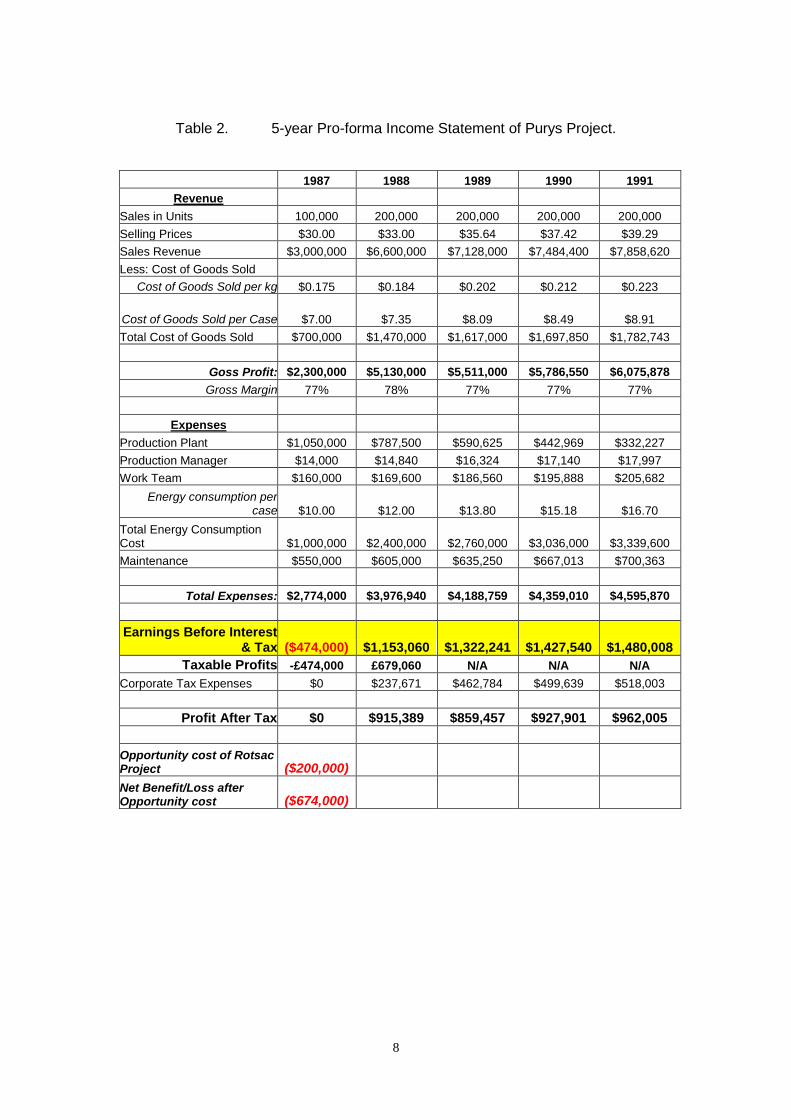
Table 2 is a 5-year Pro-forma Income Statement of the Purys project.
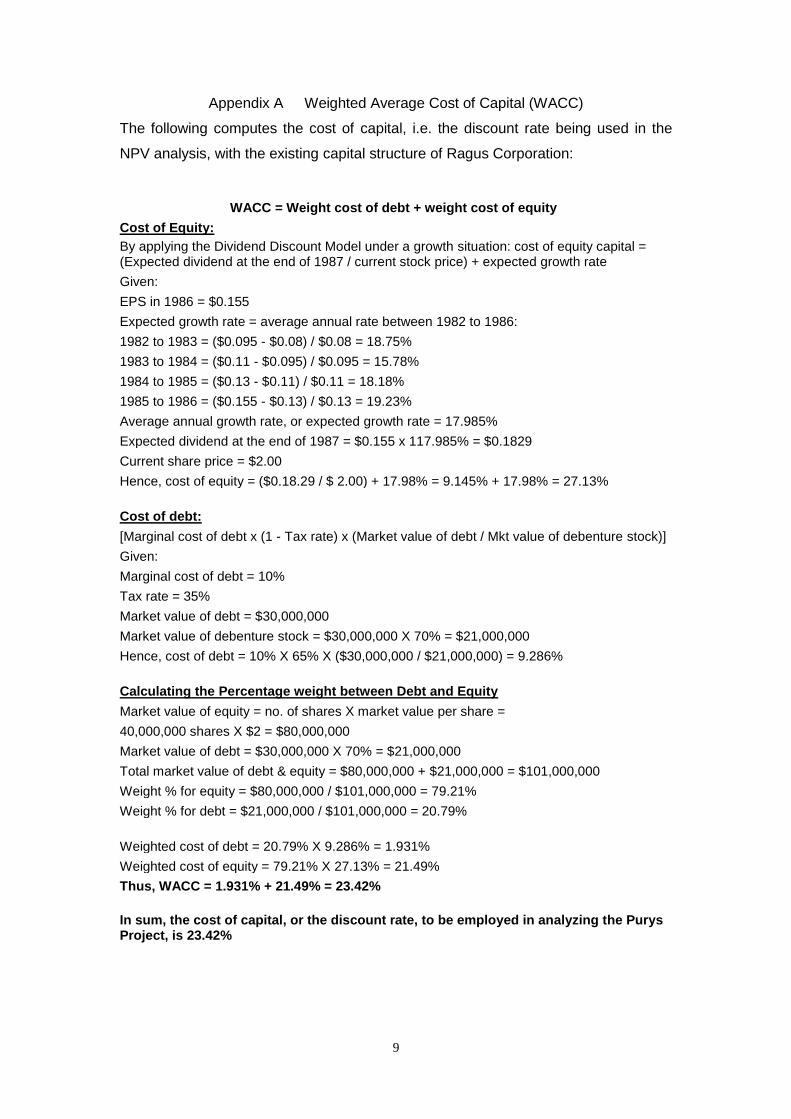
Appendix A computes the weight average cost of capital being used in this
analysis, which is 23.42%.
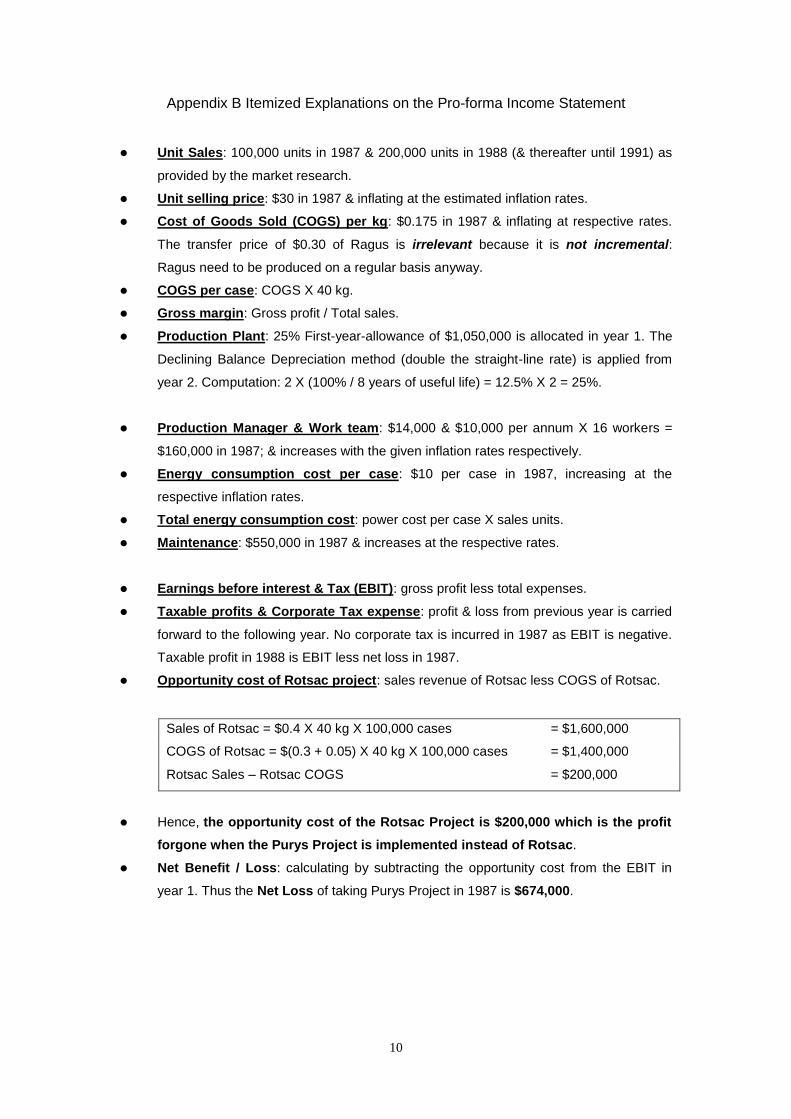
Appendix B lists the itemised explanations in the Pro-forma Income Statement.
Summary of the Pro-forma Income Statement Analysis
The gross profit is $2.3 million in 1987. Then grew over double to $5.13 million
in 1988. Thereafter, GP increases by 7%, 5% & 5% respectively in the following
3 years.
Gross margin remains steady at 77% throughout the product life.
A negative EBIT results only in 1987 due to premature sales performance and
high initial investments in production plant.
In 1987, the net benefit of the Purys Project is EBIT less the opportunity loss
from the Rotsac project. The Purys & Rotsac Projects are mutually exclusive.
Thus, $200,000 would have been gained if Purys Project were discarded.
7
Table 1. Inflation forecast provided by Financial Planners from Ragus Corporation
Cost Items 1987 1988 1989 1990 1991
Purys Selling Prices - per case In % increase 100% 110% 108% 105% 105%
Purys Selling Prices - per case
In actual currency value $30.0 $33.0 $35.6 $37.4 $39.3
Wage - Production Manager In % increase 100% 106% 110% 105% 105%
Wage - Production Manager
In actual currency value $14,000 $14,840 $16,324 $17,140 $17,997
Wage - Work Team In % increase 100% 106% 110% 105% 105%
Wage - Work Team
In actual currency value $160,000 $169,600 $186,560 $195,888 $205,682
Power - per case In % increase 100% 120% 115% 110% 110%
Power - per case In actual currency value $10.00 $12.00 $13.80 $15.18 $16.70
Maintenance Fees In % increase 100% 110% 105% 105% 105%
Maintenance Fees In actual currency value $550,000 $605,000 $635,250 $667,013 $700,363
Cost of Ragus per kg In % increase 100% 105% 110% 105% 105%
Cost of Ragus per kg
In actual currency value $0.1750 $0.1838 $0.2021 $0.2122 $0.2228
Cost of Ragus per unit
In actual currency value $7.00 $7.35 $8.09 $8.49 $8.91
Group Overhead IRRELEVANT N/A N/A N/A N/A N/A
8
Table 2. 5-year Pro-forma Income Statement of Purys Project.
1987 1988 1989 1990 1991
Revenue
Sales in Units 100,000 200,000 200,000 200,000 200,000
Selling Prices $30.00 $33.00 $35.64 $37.42 $39.29
Sales Revenue $3,000,000 $6,600,000 $7,128,000 $7,484,400 $7,858,620
Less: Cost of Goods Sold
Cost of Goods Sold per kg $0.175 $0.184 $0.202 $0.212 $0.223
Cost of Goods Sold per Case $7.00 $7.35 $8.09 $8.49 $8.91
Total Cost of Goods Sold $700,000 $1,470,000 $1,617,000 $1,697,850 $1,782,743
Goss Profit: $2,300,000 $5,130,000 $5,511,000 $5,786,550 $6,075,878
Gross Margin 77% 78% 77% 77% 77%
Expenses
Production Plant $1,050,000 $787,500 $590,625 $442,969 $332,227
Production Manager $14,000 $14,840 $16,324 $17,140 $17,997
Work Team $160,000 $169,600 $186,560 $195,888 $205,682
Energy consumption per case $10.00 $12.00 $13.80 $15.18 $16.70
Total Energy Consumption Cost $1,000,000 $2,400,000 $2,760,000 $3,036,000 $3,339,600
Maintenance $550,000 $605,000 $635,250 $667,013 $700,363
Total Expenses: $2,774,000 $3,976,940 $4,188,759 $4,359,010 $4,595,870
Earnings Before Interest & Tax ($474,000) $1,153,060 $1,322,241 $1,427,540 $1,480,008
Taxable Profits -£474,000 £679,060 N/A N/A N/A
Corporate Tax Expenses $0 $237,671 $462,784 $499,639 $518,003
Profit After Tax $0 $915,389 $859,457 $927,901 $962,005
Opportunity cost of Rotsac Project ($200,000)
Net Benefit/Loss after Opportunity cost ($674,000)
9
Appendix A Weighted Average Cost of Capital (WACC)
The following computes the cost of capital, i.e. the discount rate being used in the
NPV analysis, with the existing capital structure of Ragus Corporation:
WACC = Weight cost of debt + weight cost of equity
Cost of Equity:
By applying the Dividend Discount Model under a growth situation: cost of equity capital = (Expected dividend at the end of 1987 / current stock price) + expected growth rate
Given:
EPS in 1986 = $0.155
Expected growth rate = average annual rate between 1982 to 1986:
1982 to 1983 = ($0.095 - $0.08) / $0.08 = 18.75%
1983 to 1984 = ($0.11 - $0.095) / $0.095 = 15.78%
1984 to 1985 = ($0.13 - $0.11) / $0.11 = 18.18%
1985 to 1986 = ($0.155 - $0.13) / $0.13 = 19.23%
Average annual growth rate, or expected growth rate = 17.985%
Expected dividend at the end of 1987 = $0.155 x 117.985% = $0.1829
Current share price = $2.00
Hence, cost of equity = ($0.18.29 / $ 2.00) + 17.98% = 9.145% + 17.98% = 27.13%
Cost of debt:
[Marginal cost of debt x (1 - Tax rate) x (Market value of debt / Mkt value of debenture stock)]
Given:
Marginal cost of debt = 10%
Tax rate = 35%
Market value of debt = $30,000,000
Market value of debenture stock = $30,000,000 X 70% = $21,000,000
Hence, cost of debt = 10% X 65% X ($30,000,000 / $21,000,000) = 9.286%
Calculating the Percentage weight between Debt and Equity
Market value of equity = no. of shares X market value per share =
40,000,000 shares X $2 = $80,000,000
Market value of debt = $30,000,000 X 70% = $21,000,000
Total market value of debt & equity = $80,000,000 + $21,000,000 = $101,000,000
Weight % for equity = $80,000,000 / $101,000,000 = 79.21%
Weight % for debt = $21,000,000 / $101,000,000 = 20.79%
Weighted cost of debt = 20.79% X 9.286% = 1.931%
Weighted cost of equity = 79.21% X 27.13% = 21.49%
Thus, WACC = 1.931% + 21.49% = 23.42%
In sum, the cost of capital, or the discount rate, to be employed in analyzing the Purys Project, is 23.42%
10
Appendix B Itemized Explanations on the Pro-forma Income Statement
Unit Sales: 100,000 units in 1987 & 200,000 units in 1988 (& thereafter until 1991) as
provided by the market research.
Unit selling price: $30 in 1987 & inflating at the estimated inflation rates.
Cost of Goods Sold (COGS) per kg: $0.175 in 1987 & inflating at respective rates.
The transfer price of $0.30 of Ragus is irrelevant because it is not incremental:
Ragus need to be produced on a regular basis anyway.
COGS per case: COGS X 40 kg.
Gross margin: Gross profit / Total sales.
Production Plant: 25% First-year-allowance of $1,050,000 is allocated in year 1. The
Declining Balance Depreciation method (double the straight-line rate) is applied from
year 2. Computation: 2 X (100% / 8 years of useful life) = 12.5% X 2 = 25%.
Production Manager & Work team: $14,000 & $10,000 per annum X 16 workers =
$160,000 in 1987; & increases with the given inflation rates respectively.
Energy consumption cost per case: $10 per case in 1987, increasing at the
respective inflation rates.
Total energy consumption cost: power cost per case X sales units.
Maintenance: $550,000 in 1987 & increases at the respective rates.
Earnings before interest & Tax (EBIT): gross profit less total expenses.
Taxable profits & Corporate Tax expense: profit & loss from previous year is carried
forward to the following year. No corporate tax is incurred in 1987 as EBIT is negative.
Taxable profit in 1988 is EBIT less net loss in 1987.
Opportunity cost of Rotsac project: sales revenue of Rotsac less COGS of Rotsac.
Sales of Rotsac = $0.4 X 40 kg X 100,000 cases = $1,600,000
COGS of Rotsac = $(0.3 + 0.05) X 40 kg X 100,000 cases = $1,400,000
Rotsac Sales – Rotsac COGS = $200,000
Hence, the opportunity cost of the Rotsac Project is $200,000 which is the profit
forgone when the Purys Project is implemented instead of Rotsac.
Net Benefit / Loss: calculating by subtracting the opportunity cost from the EBIT in
year 1. Thus the Net Loss of taking Purys Project in 1987 is $674,000.
11
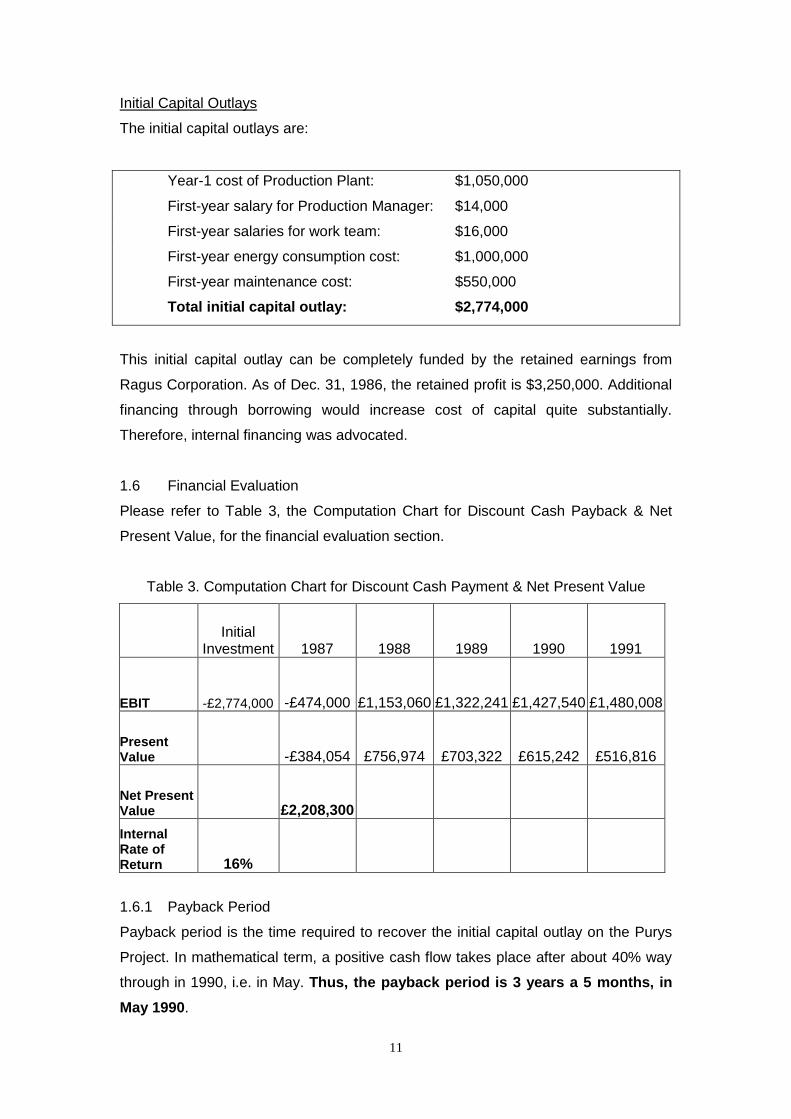
Initial Capital Outlays
The initial capital outlays are:
Year-1 cost of Production Plant: $1,050,000
First-year salary for Production Manager: $14,000
First-year salaries for work team: $16,000
First-year energy consumption cost: $1,000,000
First-year maintenance cost: $550,000
Total initial capital outlay: $2,774,000
This initial capital outlay can be completely funded by the retained earnings from
Ragus Corporation. As of Dec. 31, 1986, the retained profit is $3,250,000. Additional
financing through borrowing would increase cost of capital quite substantially.
Therefore, internal financing was advocated.
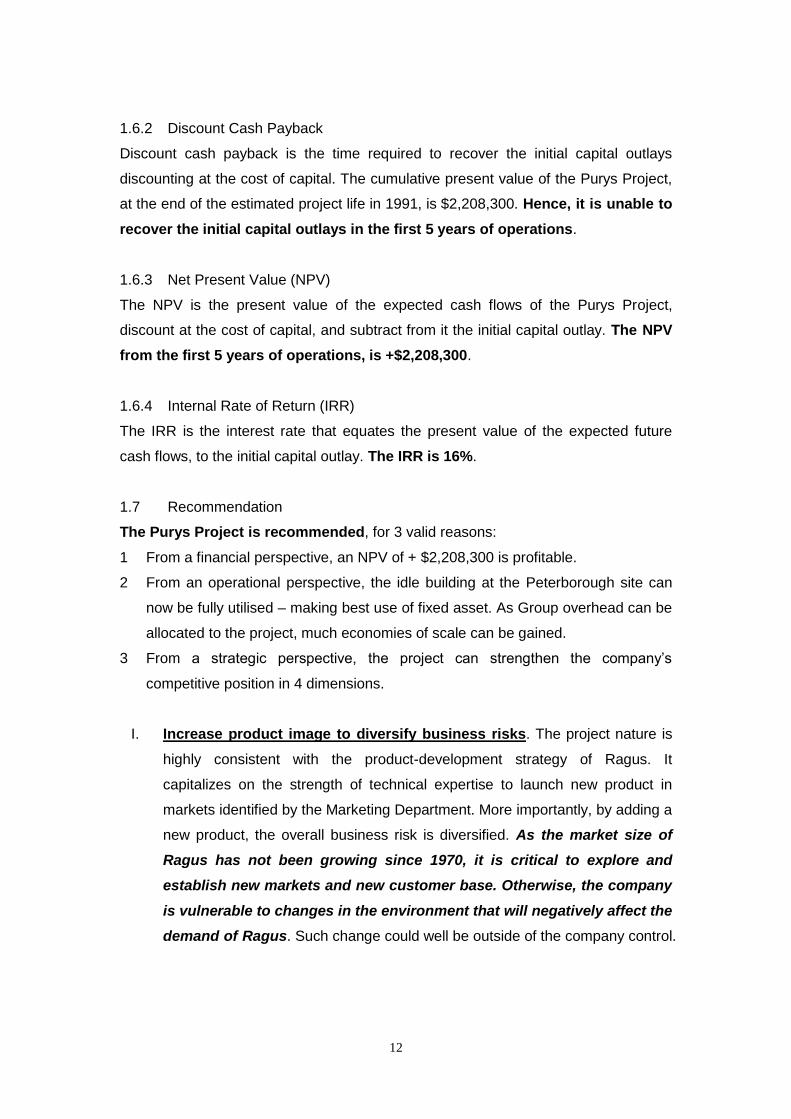
1.6 Financial Evaluation
Please refer to Table 3, the Computation Chart for Discount Cash Payback & Net
Present Value, for the financial evaluation section.
Table 3. Computation Chart for Discount Cash Payment & Net Present Value
Initial Investment 1987 1988 1989 1990 1991
EBIT -£2,774,000 -£474,000 £1,153,060 £1,322,241 £1,427,540 £1,480,008
Present Value -£384,054 £756,974 £703,322 £615,242 £516,816
Net Present Value £2,208,300
Internal Rate of Return 16%
1.6.1 Payback Period
Payback period is the time required to recover the initial capital outlay on the Purys
Project. In mathematical term, a positive cash flow takes place after about 40% way
through in 1990, i.e. in May. Thus, the payback period is 3 years a 5 months, in
May 1990.
12
1.6.2 Discount Cash Payback
Discount cash payback is the time required to recover the initial capital outlays
discounting at the cost of capital. The cumulative present value of the Purys Project,
at the end of the estimated project life in 1991, is $2,208,300. Hence, it is unable to
recover the initial capital outlays in the first 5 years of operations.
1.6.3 Net Present Value (NPV)
The NPV is the present value of the expected cash flows of the Purys Project,
discount at the cost of capital, and subtract from it the initial capital outlay. The NPV
from the first 5 years of operations, is +$2,208,300.
1.6.4 Internal Rate of Return (IRR)
The IRR is the interest rate that equates the present value of the expected future
cash flows, to the initial capital outlay. The IRR is 16%.
1.7 Recommendation
The Purys Project is recommended, for 3 valid reasons:
1 From a financial perspective, an NPV of + $2,208,300 is profitable.
2 From an operational perspective, the idle building at the Peterborough site can
now be fully utilised – making best use of fixed asset. As Group overhead can be
allocated to the project, much economies of scale can be gained.
3 From a strategic perspective, the project can strengthen the company’s
competitive position in 4 dimensions.
I. Increase product image to diversify business risks. The project nature is
highly consistent with the product-development strategy of Ragus. It
capitalizes on the strength of technical expertise to launch new product in
markets identified by the Marketing Department. More importantly, by adding a
new product, the overall business risk is diversified. As the market size of
Ragus has not been growing since 1970, it is critical to explore and
establish new markets and new customer base. Otherwise, the company
is vulnerable to changes in the environment that will negatively affect the
demand of Ragus. Such change could well be outside of the company control.
13
II. Reduce threat from direct competitor. Setat is the biggest competitor in the
Purys market. It is a major company and is also strong in marketing, in
addition to research and development. It poses constant threat to Ragus. By
establishing a committed and well-planned attack on the existing Purys
market, Ragus can generate a solid market signal that it is determined to
maintain and strengthen its leadership status in the UK. Striving to gain
substantial market share from Setat’s existing terrain will certainly create
a competitive reaction from Setat. In doing so, Setat must assign
additional resources to defend its territory. Then, it will have less
resource to develop new product(s) to threaten Ragus. Thus, the Purys
project can strengthen Ragus’ competitive position by reducing the threat from
this direct competitor.
III. Increase bargaining power to suppliers. Adding the Purys product into the
marketplace requires additional resource input. Ragus can ask for lower
price and / or more favourable terms from vendors. Such as: fight for a
price reduction on raw materials as volume grows; ask for discount from the
freight forwarder as distribution expands; request for a lower rate from media
companies as more advertising space is committed; etc. In short, whenever
applicable, Ragus’ competitive position is enhanced through reducing the
bargaining power of suppliers.
IV. Reduce threat of new entrants / competitor(s). Setat currently holds 75% of
the existing Purys market share, while other 5 regional firms hold the rest.
Other potential new entrants might consider attacking one or more of these
players. By implementing the Purys project, other potential competitors
that might be interested in entering into this market, will probably not do
so. Ragus will intensify the industry competition by entering the playing
field as a new major player, and will likely eliminate some of the weaker
contestants. Hence, this project reduces the threat of new entrants in the
Purys market.
Therefore, the Corporate Finance Department recommends the Chief Executive to
approve the Purys project to take place this year.
********************** End of Report to C.E.O. Tom Ragus *********************
14
1.8 Comment
The technology process development cost of $75,000, the market research
cost of $50,000, the general overhead of $150,000, and the original building
cost of $10,000 (in 1976) are all excluded from the analysis: ‘Only the increment
in costs and benefits as a result of the decision are relevant; benefits we would receive
irrespective, and costs which we would have had to incur are irrelevant. It follows from
this that past, historic data can never be relevant for decisions. Sunk costs which have
been committed to a project in the past, and are therefore irretrievable.’ (Higson 1995)
The opportunity cost of $200,000 of Rotsac project is probably an
overstated amount in reflecting the profit forgone. This figure has NOT
taken the associated costs into consideration, such as the incremental
expenditures in plant and equipment, manpower or marketing. The actual
opportunity cost is likely to be less than $200,000. Nevertheless, as these data
are unavailable, the $200,000 amount is used in this analytical context.
Summary of Part I
Internal information generated from Ragus Corporation indicated that there is a
positive market potential on the Purys product in the U.K.
The main resource requirements for Ragus to implement this new project
include production site, production plant, new manager and workers, raw
materials, and additional power maintenance.
A detailed projected profit and loss statement revealed that this new venture
has a positive net present value in its product life cycle. The Chief Financial
Officer thereby gave a positive recommendation on this project.
Apart from the favourable financial return, it also improves the overall
competitive position of Ragus Corporation, by means of diversifying business
risks, reducing threat from direct competitor, increasing bargaining power to
supplier, and, reducing threat from new entrants.
15
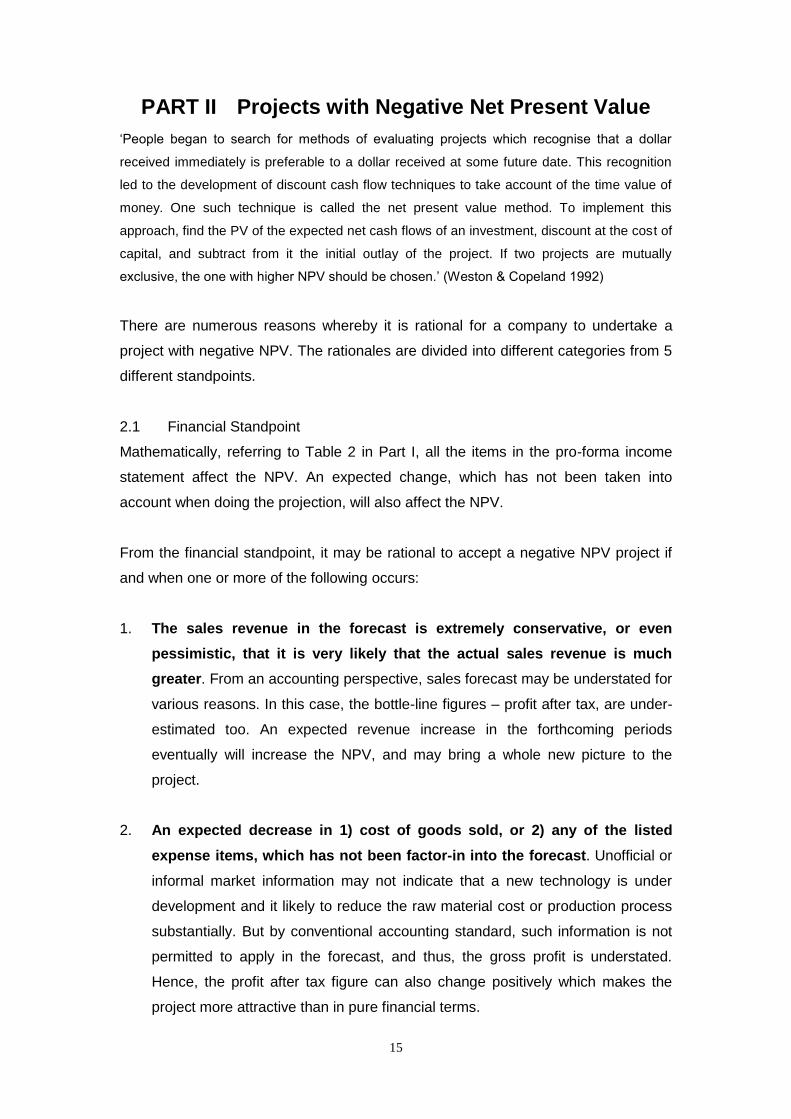
PART II Projects with Negative Net Present Value
‘People began to search for methods of evaluating projects which recognise that a dollar
received immediately is preferable to a dollar received at some future date. This recognition
led to the development of discount cash flow techniques to take account of the time value of
money. One such technique is called the net present value method. To implement this
approach, find the PV of the expected net cash flows of an investment, discount at the cost of
capital, and subtract from it the initial outlay of the project. If two projects are mutually
exclusive, the one with higher NPV should be chosen.’ (Weston & Copeland 1992)
There are numerous reasons whereby it is rational for a company to undertake a
project with negative NPV. The rationales are divided into different categories from 5
different standpoints.
2.1 Financial Standpoint
Mathematically, referring to Table 2 in Part I, all the items in the pro-forma income
statement affect the NPV. An expected change, which has not been taken into
account when doing the projection, will also affect the NPV.
From the financial standpoint, it may be rational to accept a negative NPV project if
and when one or more of the following occurs:
1. The sales revenue in the forecast is extremely conservative, or even
pessimistic, that it is very likely that the actual sales revenue is much
greater. From an accounting perspective, sales forecast may be understated for
various reasons. In this case, the bottle-line figures – profit after tax, are under-
estimated too. An expected revenue increase in the forthcoming periods
eventually will increase the NPV, and may bring a whole new picture to the
project.
2. An expected decrease in 1) cost of goods sold, or 2) any of the listed
expense items, which has not been factor-in into the forecast. Unofficial or
informal market information may not indicate that a new technology is under
development and it likely to reduce the raw material cost or production process
substantially. But by conventional accounting standard, such information is not
permitted to apply in the forecast, and thus, the gross profit is understated.
Hence, the profit after tax figure can also change positively which makes the
project more attractive than in pure financial terms.
16
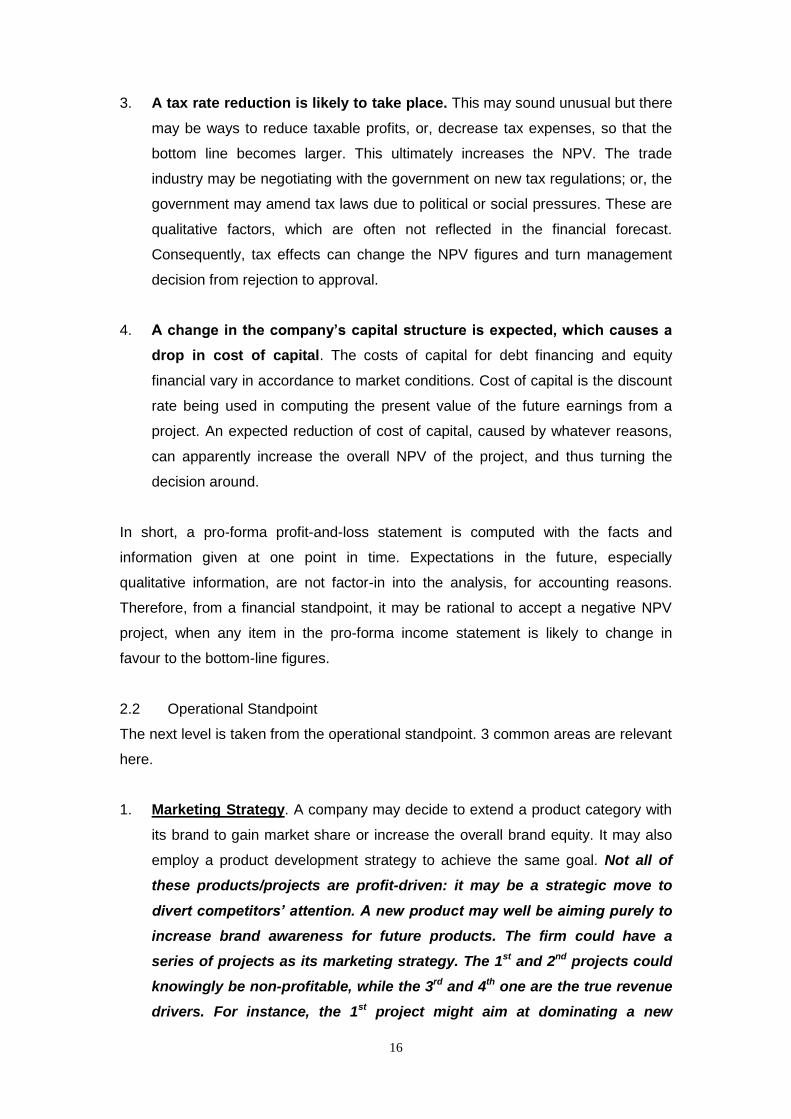
3. A tax rate reduction is likely to take place. This may sound unusual but there
may be ways to reduce taxable profits, or, decrease tax expenses, so that the
bottom line becomes larger. This ultimately increases the NPV. The trade
industry may be negotiating with the government on new tax regulations; or, the
government may amend tax laws due to political or social pressures. These are
qualitative factors, which are often not reflected in the financial forecast.
Consequently, tax effects can change the NPV figures and turn management
decision from rejection to approval.
4. A change in the company’s capital structure is expected, which causes a
drop in cost of capital. The costs of capital for debt financing and equity
financial vary in accordance to market conditions. Cost of capital is the discount
rate being used in computing the present value of the future earnings from a
project. An expected reduction of cost of capital, caused by whatever reasons,
can apparently increase the overall NPV of the project, and thus turning the
decision around.
In short, a pro-forma profit-and-loss statement is computed with the facts and
information given at one point in time. Expectations in the future, especially
qualitative information, are not factor-in into the analysis, for accounting reasons.
Therefore, from a financial standpoint, it may be rational to accept a negative NPV
project, when any item in the pro-forma income statement is likely to change in
favour to the bottom-line figures.
2.2 Operational Standpoint
The next level is taken from the operational standpoint. 3 common areas are relevant
here.
1. Marketing Strategy. A company may decide to extend a product category with
its brand to gain market share or increase the overall brand equity. It may also
employ a product development strategy to achieve the same goal. Not all of
these products/projects are profit-driven: it may be a strategic move to
divert competitors’ attention. A new product may well be aiming purely to
increase brand awareness for future products. The firm could have a
series of projects as its marketing strategy. The 1st and 2nd projects could
knowingly be non-profitable, while the 3rd and 4th one are the true revenue
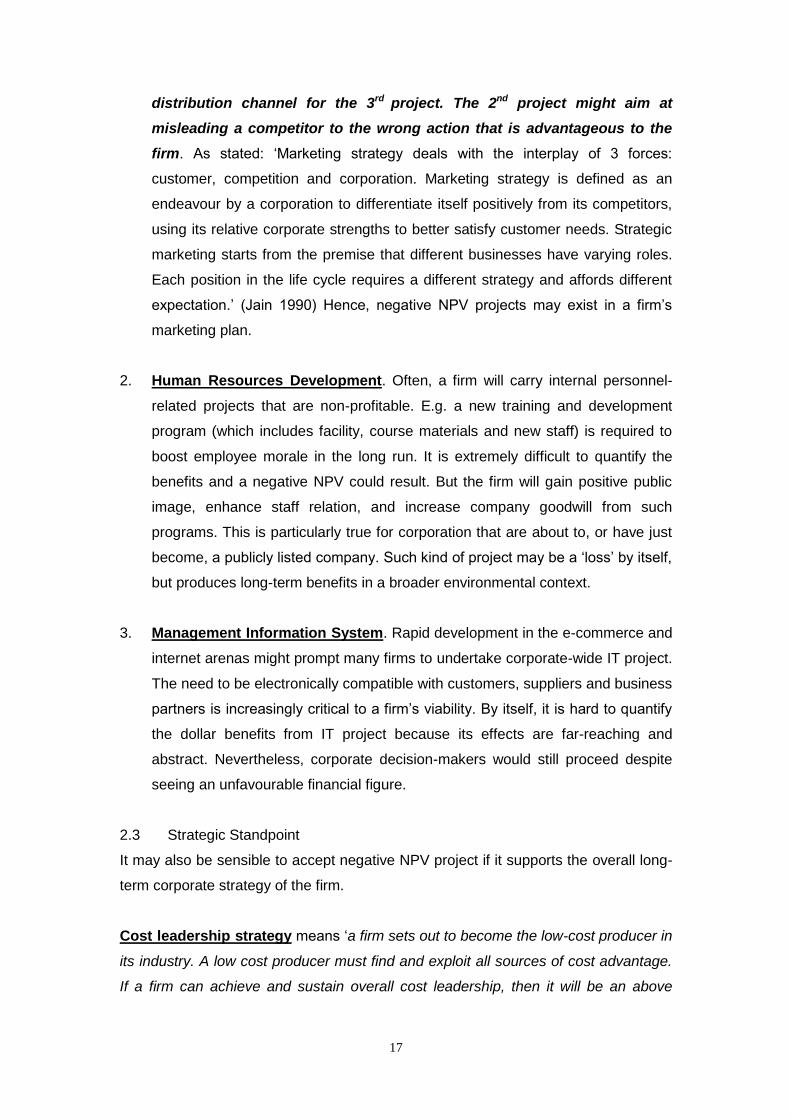
drivers. For instance, the 1st project might aim at dominating a new
17
distribution channel for the 3rd project. The 2nd project might aim at
misleading a competitor to the wrong action that is advantageous to the
firm. As stated: ‘Marketing strategy deals with the interplay of 3 forces:
customer, competition and corporation. Marketing strategy is defined as an
endeavour by a corporation to differentiate itself positively from its competitors,
using its relative corporate strengths to better satisfy customer needs. Strategic
marketing starts from the premise that different businesses have varying roles.
Each position in the life cycle requires a different strategy and affords different
expectation.’ (Jain 1990) Hence, negative NPV projects may exist in a firm’s
marketing plan.
2. Human Resources Development. Often, a firm will carry internal personnel-
related projects that are non-profitable. E.g. a new training and development
program (which includes facility, course materials and new staff) is required to
boost employee morale in the long run. It is extremely difficult to quantify the
benefits and a negative NPV could result. But the firm will gain positive public
image, enhance staff relation, and increase company goodwill from such
programs. This is particularly true for corporation that are about to, or have just
become, a publicly listed company. Such kind of project may be a ‘loss’ by itself,
but produces long-term benefits in a broader environmental context.
3. Management Information System. Rapid development in the e-commerce and
internet arenas might prompt many firms to undertake corporate-wide IT project.
The need to be electronically compatible with customers, suppliers and business
partners is increasingly critical to a firm’s viability. By itself, it is hard to quantify
the dollar benefits from IT project because its effects are far-reaching and
abstract. Nevertheless, corporate decision-makers would still proceed despite
seeing an unfavourable financial figure.
2.3 Strategic Standpoint
It may also be sensible to accept negative NPV project if it supports the overall long-
term corporate strategy of the firm.
Cost leadership strategy means ‘a firm sets out to become the low-cost producer in
its industry. A low cost producer must find and exploit all sources of cost advantage.
If a firm can achieve and sustain overall cost leadership, then it will be an above
18
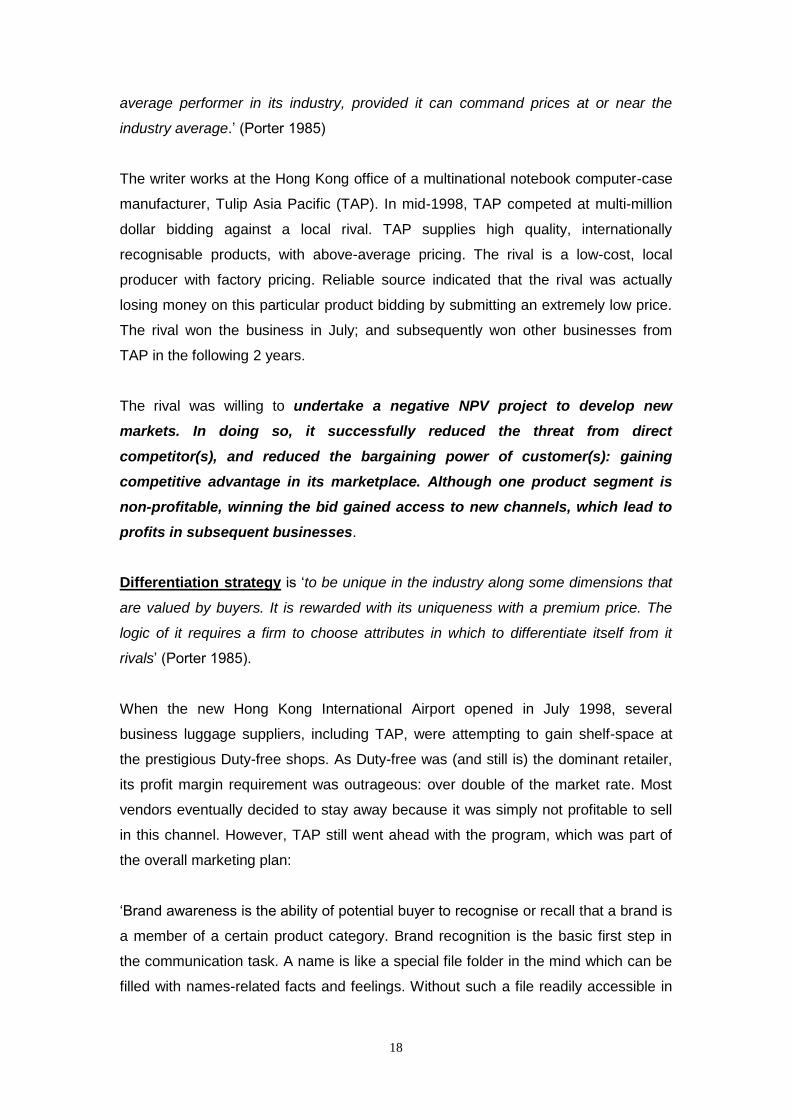
average performer in its industry, provided it can command prices at or near the
industry average.’ (Porter 1985)
The writer works at the Hong Kong office of a multinational notebook computer-case
manufacturer, Tulip Asia Pacific (TAP). In mid-1998, TAP competed at multi-million
dollar bidding against a local rival. TAP supplies high quality, internationally
recognisable products, with above-average pricing. The rival is a low-cost, local
producer with factory pricing. Reliable source indicated that the rival was actually
losing money on this particular product bidding by submitting an extremely low price.
The rival won the business in July; and subsequently won other businesses from
TAP in the following 2 years.
The rival was willing to undertake a negative NPV project to develop new
markets. In doing so, it successfully reduced the threat from direct
competitor(s), and reduced the bargaining power of customer(s): gaining
competitive advantage in its marketplace. Although one product segment is
non-profitable, winning the bid gained access to new channels, which lead to
profits in subsequent businesses.
Differentiation strategy is ‘to be unique in the industry along some dimensions that
are valued by buyers. It is rewarded with its uniqueness with a premium price. The
logic of it requires a firm to choose attributes in which to differentiate itself from it
rivals’ (Porter 1985).
When the new Hong Kong International Airport opened in July 1998, several
business luggage suppliers, including TAP, were attempting to gain shelf-space at
the prestigious Duty-free shops. As Duty-free was (and still is) the dominant retailer,
its profit margin requirement was outrageous: over double of the market rate. Most
vendors eventually decided to stay away because it was simply not profitable to sell
in this channel. However, TAP still went ahead with the program, which was part of
the overall marketing plan:
‘Brand awareness is the ability of potential buyer to recognise or recall that a brand is
a member of a certain product category. Brand recognition is the basic first step in
the communication task. A name is like a special file folder in the mind which can be
filled with names-related facts and feelings. Without such a file readily accessible in
19
the memory, the facts and feelings become misfiled, and cannot be readily accessed
when needed.’ (Aaker 1991)
The move had several strategic implications. First, it increased brand
awareness and raise international image to enhance the differentiation strategy.
Second, it built entry barrier for new comers to enter this retail channel. Third,
it enlarges TAP’s bargaining power to other customers in opening new
distribution channels. The launch program at the Duty-free shop by itself was non-
profitable in pure financial term, but the qualitative benefits received, in the overall
territorial distribution, were far reaching.
Focus strategy is ‘based on the choice of a narrow competitive scope within an
industry. The focuser selects a segment or group of segments in the industry and
tailors its strategy to serving them to the exclusion of others’. (Johnson & Scholes
1993)
TAP has a parent company called Tulip International Inc. (TI) based in Seattle, USA.
TI has offices in 5 continents and distributes computer-cases in over 140 countries.
Its target market is sharply defined as: notebook computer users with medium to high
income, managers, executives and professionals.
TI’s mission is to become an international corporation with worldwide brand presence.
In 1999, the author received direction from TI to expand distribution in China
aggressively, As China marketing plan was prepared and showed a loss in the first 3
years, plus no definite promise on profit afterwards either.
Nevertheless, TAP was instructed to proceed. The rationale was that, first, focus-
differentiation was, and still is, the global long-term corporate strategy of TI:
focus on mobile professionals with quality and functionality as product-
differentiation attributes. The China expansion project supports the global
direction. Second, TI intended to expand business scope through mergers and
acquisitions. An established distribution network in China will substantially
increase TI’s competitive position by raising its bargaining power to potential
partners. TI’s global corporate profile would increase tremendously, when its
business covers difficult markets such as China, South Korea and Russia. In
sum, TI lost the battle but won the war.
20
2.4 Macro-environment Standpoint
There are situations whereby a firm is forced to implement negative NPV projects
due to macro-environmental pressures.
Political: A manufacturer may be forced to switch its production facility from one
country to another because the former is experiencing political upheavals. War,
sanction, embargo, and riots are some typical reasons. Under these
circumstances, the firm often has no choice but to proceed to relocation.
Legal: a firm might have to fulfil a legal requirement before having a chance to
achieve a goal. A petroleum company may first need to conduct scientific
project to prove that it is environmentally safe to perform oil-drilling in a location.
A properly developer may need to complete a pre-construction reclamation as
land law requires.
By the same token, other economic, social and technological conditions can also
exert pressures on an organization to undertake projects with negative NPV.
2.5 Stakeholders’ Standpoint
Stakeholders are those who have a strong interest and influence on the direction or
operations of the firm. Common stakeholders include shareholders, board of
directors and senior managers. In a practical business environment, stakeholders’
influence on decision-making is no less then the elements above.
A business owner will accept negative NPV project, which he/she believes is worth
pursuing beyond financial evaluation. Similar situations may occur at different levels
of an organization, whereby the stakeholders take a personal interest in the
circumstances.
Summary of Part II
There are situations whereby a firm will undertake a project with negative net
present value.
First, if the quantitative information in the projected financial statement is not
entirely accurate, a negative bottom line may not mean that the project should
be discarded.
Second, projects arising from the marketing, human resource and information
system department may be a loss by itself, but could bring many benefits at a
corporate level.

21
Third, projects with strategic implications will often override the financial results.
Fourth, firms are sometimes forced to undertake ventures when the macro-
environment drives them to do so.
Last, major stakeholders of an organization can over-rule decision derived from
financial analysis.
22
PART III Dividend Valuation Model: Mechanism and
Limitation
3.1 Mechanism of the Dividend Valuation Model
Maximising shareholders’ wealth has long been the long-term corporate objective for
organizations. There are essentially 2 ways to increase the share value. First,
investors purchase shares with the expectation of an increase in share value
sometime in the future. The share being bought in year 1 at $10 is expected to grow
and worth more than $10 in year 2. This is termed as capital gain on share prices.
But this occurs in a somewhat long-term timeframe. Second, then, to reward
investors in the short-term, dividends are declared intermittently. These dividends, in
the eyes of the investors, are their investment profits.
To compute the present value of a share price, the idea is similar to that of the Net
Present Value concept. If an investor purchases a share and intends to hold for 1
year, the total value of the share is the sum of:
Share price at the time of purchase in year 1, plus
Present value of the share price at the time of sale in year 2, plus
Present values of all the intermittent dividends expect to receive in that year
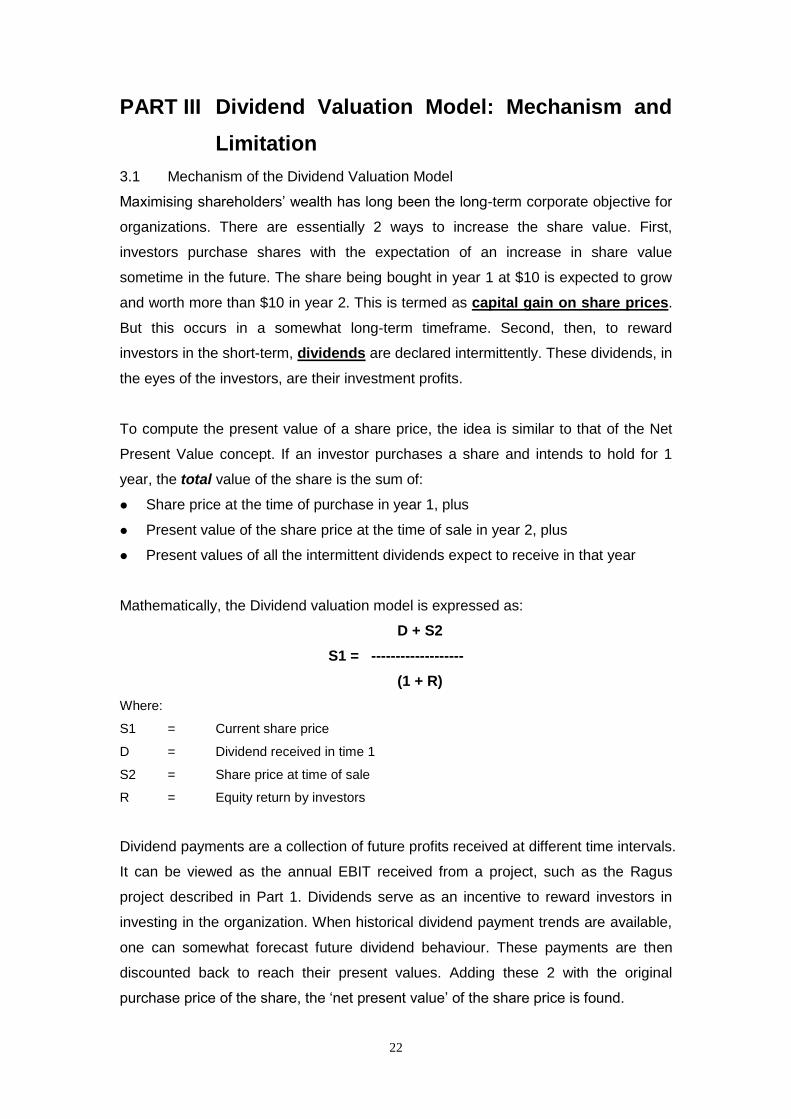
Mathematically, the Dividend valuation model is expressed as:
D + S2
S1 = -------------------
(1 + R)
Where:
S1 = Current share price
D = Dividend received in time 1
S2 = Share price at time of sale
R = Equity return by investors
Dividend payments are a collection of future profits received at different time intervals.
It can be viewed as the annual EBIT received from a project, such as the Ragus
project described in Part 1. Dividends serve as an incentive to reward investors in
investing in the organization. When historical dividend payment trends are available,
one can somewhat forecast future dividend behaviour. These payments are then
discounted back to reach their present values. Adding these 2 with the original
purchase price of the share, the ‘net present value’ of the share price is found.
23
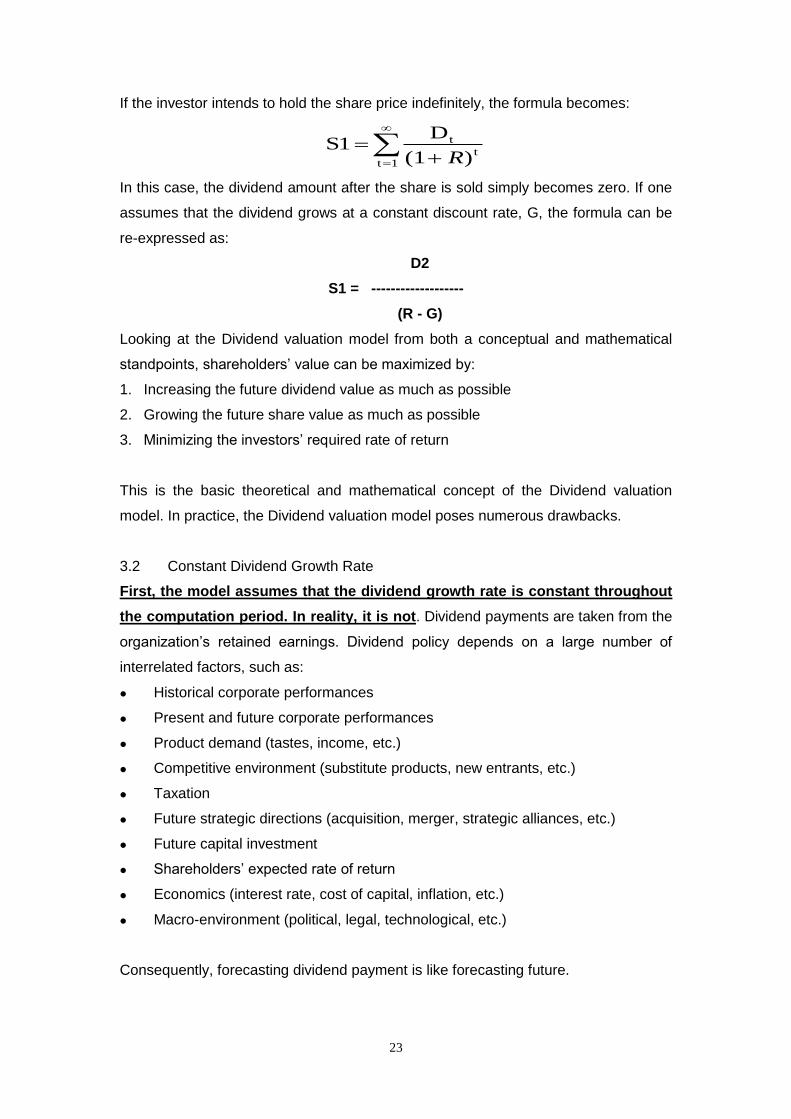
If the investor intends to hold the share price indefinitely, the formula becomes:
1tt
t
)(1
D S1
R
In this case, the dividend amount after the share is sold simply becomes zero. If one
assumes that the dividend grows at a constant discount rate, G, the formula can be
re-expressed as:
D2
S1 = -------------------
(R - G)
Looking at the Dividend valuation model from both a conceptual and mathematical
standpoints, shareholders’ value can be maximized by:
1. Increasing the future dividend value as much as possible
2. Growing the future share value as much as possible
3. Minimizing the investors’ required rate of return
This is the basic theoretical and mathematical concept of the Dividend valuation
model. In practice, the Dividend valuation model poses numerous drawbacks.
3.2 Constant Dividend Growth Rate
First, the model assumes that the dividend growth rate is constant throughout
the computation period. In reality, it is not. Dividend payments are taken from the
organization’s retained earnings. Dividend policy depends on a large number of
interrelated factors, such as:
Historical corporate performances
Present and future corporate performances
Product demand (tastes, income, etc.)
Competitive environment (substitute products, new entrants, etc.)
Taxation
Future strategic directions (acquisition, merger, strategic alliances, etc.)
Future capital investment
Shareholders’ expected rate of return
Economics (interest rate, cost of capital, inflation, etc.)
Macro-environment (political, legal, technological, etc.)
Consequently, forecasting dividend payment is like forecasting future.
24
3.3 Regular Dividend Payment Intervals
Second, the model also assumes that the dividend payments have regular
interval, this is impractical in the real world. At good times a firm may choose to
pay dividend to reward its shareholders, or, invest the fund in the future projects. At
bad time, a firm may hold back dividend payment simply due to shortage of capital,
or, declare a dividend instead to battle the negative market rumour. Dividend policy I
therefore subject to fluctuations.
3.4 Perpetuity
The model further assumes that dividend payments take place perpetually –
that the firm (and its dividend policy) exists indefinitely. Again, for rationale
given before, perpetuity is seldom a reality. It is not uncommon for a firm to liquidate
willingly or unwillingly. Future is simply unpredictable.
3.5 Constant Required Rate of Return
Moreover, the model assumes the investors’ required rate of return is constant.
Investors set their required rate of return in accordance to several criteria. First, they
compare the return from a risk-free investment. Second, returns provided by similar
companies are examined, in order to generate a picture on the appropriate return
level. Third, the future prospect of the relevant industry is investigated. Fourth, the
management structure and leadership capabilities are explored. Given all these,
investors can establish the desired rate of return in accordance to risk and
uncertainty level. Inevitably, the rate of return fluctuates as one or more of the above-
mentioned factors changes.
3.6 Market Efficiency
In addition, the Market Efficiency assumption is not always true. The Market
Efficiency theory assumes that all investors act rationally and they are able to gather
all relevant information before making a decision. Recalling the Purys project in Part
1, the information is supplied by knowledgeable managers from Ragus Corporation.
These managers can access first-handed information to provide a project appraisal
which is reasonably accurate. The dividend valuation model is performed by analysts
outside of the company. These analysts can only access and gather second-handed
or third-handed information. This fact further dilutes the accuracy of the result.
25
3.7 Transaction Costs and Taxation
Another deficiency in the model is that it failed to take transaction costs and
taxation effects into consideration. Transaction costs include administrative costs
and issue discount during the issue of new shares. Taxation at corporate and
personal levels will also have impact on the final level of earnings.
3.8 Information Requirement
The last limitation of the model is simply the fact that it is extremely difficult, if not
impossible, to research such as immense amount of future information for the
formula. By the time the 3rd piece of information is found at some point in time, it is
likely that the 1st piece is already outdated. The determinants of the demand include
market size, taste, income, expectation, and price of related goods. The economic
growth is the sum of consumption, investment, government purchase and net export.
Predicting all these is indeed a challenging task.
These are the difficulties in implementing the dividend valuation model analysis. And
this concludes the entire assignment.
Summary of Part III
The basic concept of the dividend valuation model is to maximize shareholders’
wealth. It does so by finding the sum of the 1) share price at the time of
purchase, 2) present value of the share price at the time of sale, and 3) values
of all dividends expected to receive in the investment period.
Its limitations are that it assumes the dividend growth rate, the dividend
payment intervals, and, the required rate of return by investors, are all constants.
Other drawbacks of the theory include: it assumes the firm exist indefinitely, it
fails to take transaction costs and taxation effect into considerations, and, the
amount of information required to conduct this analysis is immense.
End
26
Bibliography
Aaker, A. D. (1991). Managing Brand Equity: Capitalising on the Value of a Brand Name. New York: The Free Press. Henley Management College. MBA Module Business Finance: Guide to Economic Appraisal (1996 Edition). Henley Management College. MBA Module Business Finance: Managing a Cash Flow Crisis – A Guide for Businessmen and Managers. (1996 Edition). Henley Management College. MBA Module Business Finance: Readings (1996 Edition). Henley Management College. MBA Module Business Finance: Workbook (1996 Edition).
Higson, C. (1995). Business Finance. London: Butterworths Publishing Ltd.
Jain C. S. (1990). Marketing Planning & Strategy (3
rd Edition). Cincinnati: South-Western
Publishing Co. Johnson, G. & Scholes, K. (1993). Exploring Corporate Strategy (3
rd Edition). London:
Prentice-Hall International (UK) Ltd.
Mills, W. R. & Robertson, J. (1993). Fundamentals of Managerial Accounting and Finance (3
rd Edition). Glos: Mars Business Associates Ltd.
Mills, W. R. (1994). Finance, Strategy and Strategic Value Analysis. Glos: Mars Business Associates.
Porter, E. M. (1980). Competitive Strategy: Techniques for Analysing Industries & Competitors. New York: The Free Press-Macmillan, Inc.
Van Horne, C. J. (1998). Financial Management And Policy (11
th Edition). New Jersey:
Prentice Hall, Inc.
Weston, J. F. & Copeland, E. T. (1992). Managerial Finance (9
th Edition). Fort Worth: The
Dryden Press.