Embed Size (px)
Citation preview
Mayor’s Budget
The 2018 Proposed Budget reduces property taxes, continues to prioritize public safety, and provides for Anchorage’s continued stability, even in the face of the state’s economic and budgetary challenges. The State’s continued inability to resolve its fiscal crisis highlights the Municipality’s need to be more independent and self-sufficient. Historically, the State and Municipality have operated as two meshed systems, developing and supporting infrastructure and services together. Anchorage is adapting to the new paradigm of declining state participation. For 2018, we have continued with additional cuts and changes to revenue sources, but have also incorporated opportunities to lower property taxes for homeowners. These changes maintain our fiscal stability and ensure we have the means to continue our investment in public safety and provide local services that support a safe, secure, and strong Anchorage.
Between cost shifts from the state, increases to labor and health care costs, the SAP software project, and the continued refusal of the state’s Regulatory Commission to allow the taxpayers of Anchorage to collect a dividend from the municipally owned Municipal Light & Power (ML&P), we began the 2018 budget process in a $20 million dollar hole. Through a combination of cuts and cost saving measures, we decreased costs and restrained growth. We will also continue to aggressively pursue shared services opportunities with the State, Anchorage School District (ASD), and Joint Base Elmendorf Richardson (JBER) to further reduce costs and retain the quality levels of service.
The 2018 Proposed Budget continues to prioritize public safety and first responder departments, which is especially critical given the state cuts to state troopers, state prosecutors, and state corrections, as well the consequences of the opioid epidemic.
2018 Continuation Budget
The continuation budget illustrates how much it would cost to provide current (2017) levels of services in the next budget (2018) year.
Starting with the 2017 Revised budget, spending changes are projected for personnel and other ongoing costs. Next, 2017 non-recurring (one-time) spending is removed from the budget. The 2018 continuation level spending plan result is about $13.0 million higher than 2017 Revised budget, before consideration of SAP ongoing costs.
Projected funding source changes are then identified. Property taxes, the largest source of local funding, are established based on the projected taxing capacity for 2018, using preliminary numbers to calculate the Tax Cap.
Non-property tax revenues are projected based on recent economic trends and fund balance, which is a non-recurring funding source, is removed. The resulting 2018 continuation level non-property tax funding change is $0.7 million lower than 2017.
After known program changes are netted with estimated funding source changes, the 2018 continuation budget indicates a funding gap.
The 2018 continuation spending change of about $13.0 million, resulted from: • Wages projected to increase for most unions by 1.5% in 2018 over 2017• Health benefit costs increasing
2018 Approved General Government Operating Budget
II - 1
• Opt-out reductions for medical and social security • Debt service, primarily general obligation (GO) bonds are expected to increase
according to debt schedule and Tax Anticipation Notices (TANS) are also anticipated to increase.
Net spending reductions resulted from removing non-recurring personnel and non-labor activities funded in 2017, including spending for:
• SAP go-live • Police academies • Litigation • One-time projects including: Storm Water Utility Implementation Plan, Socrata Open
Data, Windows Server Upgrade, and ADA Compliance Tool & Services The spending reductions were partially offset with continuation increases for reinstating contribution to Fleet for capital program and reinstating some partial-year SAP ongoing costs that were reduced in 2017 due to SAP go-live being moved from July 1 to October 1. 2018 continuation funding source changes include:
• Tax cap property tax revenue increase to the cap, before funding voter approved O&M.
• Non-property tax revenues had an initial net decrease, highlights include: o Removal of one-time revenues for land sale, contributions, Build America
Bonds (BABs) Subsidy recovery, and special collections effort o Net decrease in program revenues for Development Services, Fire
Department, Police Department, and Public Transportation o Increase in non-property tax, tax revenues of MUSA/MESA primarily due
to projected changes in the utilities’ net book values and tax district mill rates, Tobacco Tax, and Motor Vehicle Rental Tax. Although these represent funding source increases, they are included in the tax cap calculation – non-property tax increases are offset with property tax decreases
o Increase in Marijuana Tax and MOA Trust Fund Contribution • Fund balance adjustments for 2017 activity was removed.
The 2018 budget could be balanced by any combination of reducing services or increasing funding sources. 2018 Proposed Budget The 2018 Proposed General Government Operating Budget (GGOB) is a balanced budget at $519,560,007. The 2018 Proposed budget is balanced by adjusting spending to match available and proposed funding including some proposed fee changes, while achieving the goals of the community. The spending adjustments include ongoing programs and miscellaneous cost savings and reductions identified by departments; significant adjustments are: • Public Safety has been increased for one-time Police academy and vehicle purchases,
Fire academies, and Housing and Homelessness initiative and for ongoing growth in ambulance service. The Mayor is proposing to restructure the payments to the Police & Fire Retirement Trust by using Certificates of Participation (COPs) that will give the municipality a pause in payments until 2019
2018 Approved General Government Operating Budget
II - 2
• SAP ongoing support and depreciation increase • One-time spending, including: pedestrian safety sidewalk snow clearing contingency for
State and Municipal sidewalks within the municipality; code abatements and deteriorated property clean-up; write-off of Kronos time clocks; and anticipated operating losses for George M. Sullivan Arena, Ben Boeke Ice Arena, and Dempsey Anderson Ice Arena.
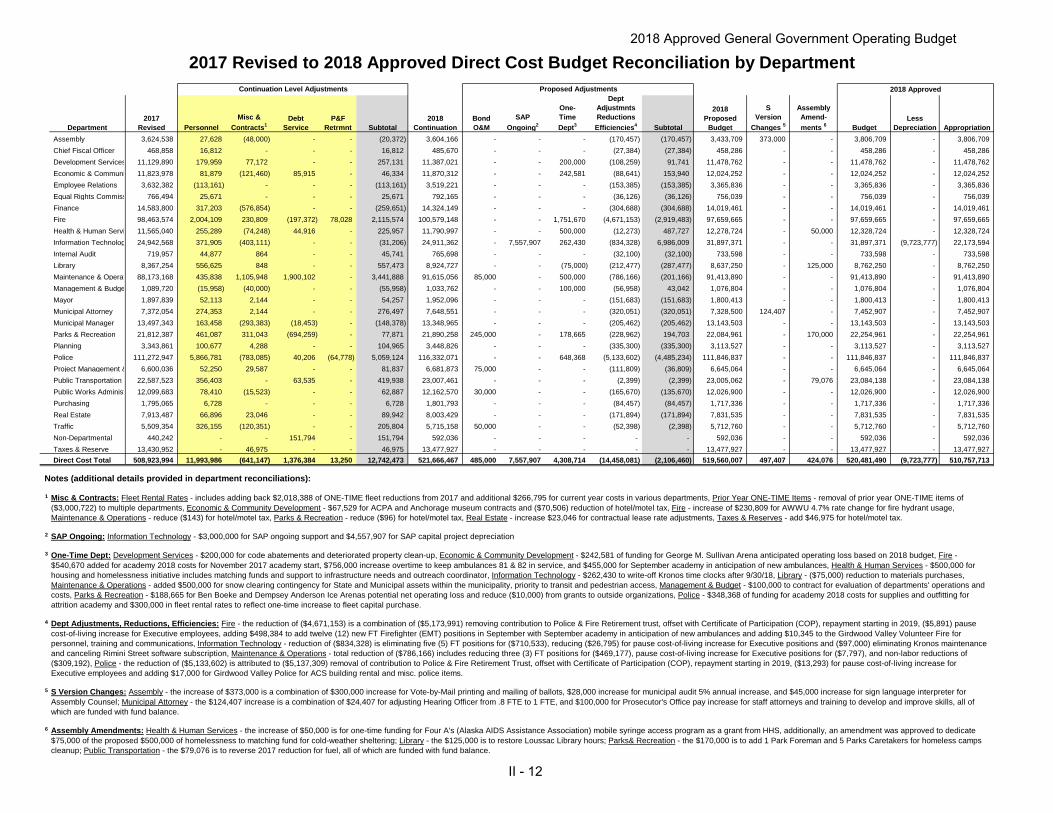
• Ongoing efficiencies and adjustments provided by departments. 2018 Approved Budget The 2018 Approved General Government Operating Budget (GGOB) is a balanced budget at $520,481,490, an increase of $921,483 from the 2018 Proposed Budget and is comprised of: • $497,407 S-Version changes that take into consideration Assembly member
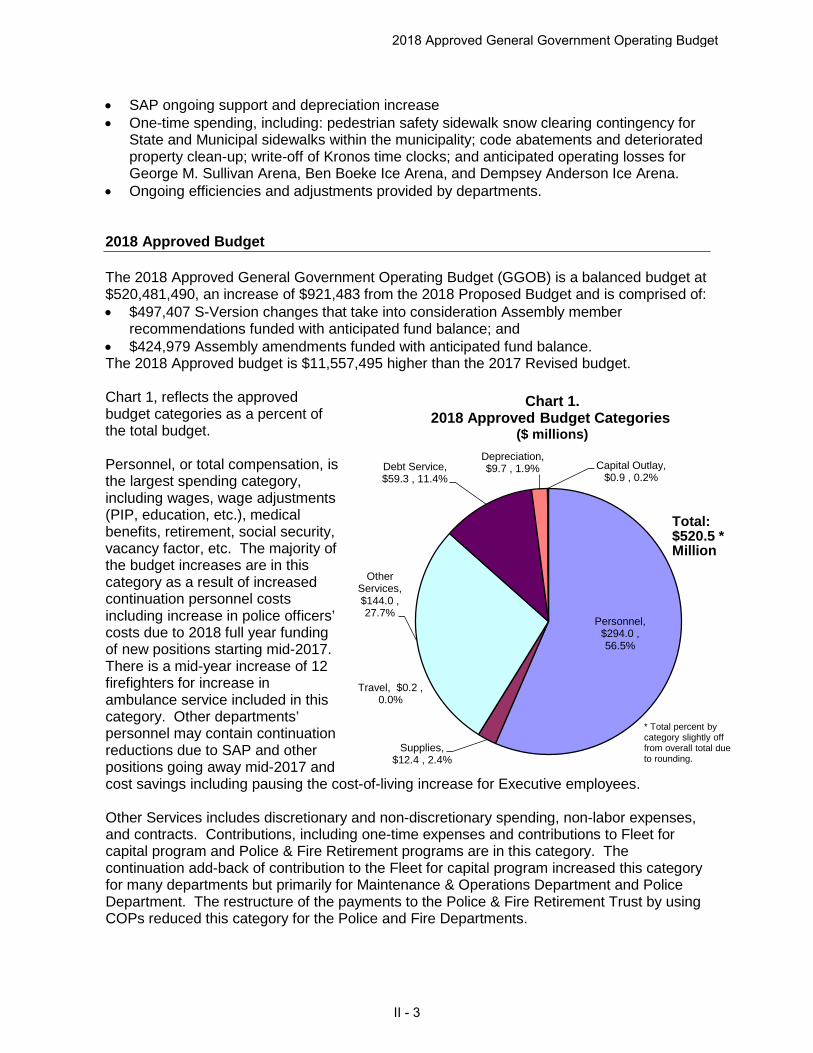
recommendations funded with anticipated fund balance; and • $424,979 Assembly amendments funded with anticipated fund balance. The 2018 Approved budget is $11,557,495 higher than the 2017 Revised budget. Chart 1, reflects the approved budget categories as a percent of the total budget. Personnel, or total compensation, is the largest spending category, including wages, wage adjustments (PIP, education, etc.), medical benefits, retirement, social security, vacancy factor, etc. The majority of the budget increases are in this category as a result of increased continuation personnel costs including increase in police officers’ costs due to 2018 full year funding of new positions starting mid-2017. There is a mid-year increase of 12 firefighters for increase in ambulance service included in this category. Other departments’ personnel may contain continuation reductions due to SAP and other positions going away mid-2017 and cost savings including pausing the cost-of-living increase for Executive employees. Other Services includes discretionary and non-discretionary spending, non-labor expenses, and contracts. Contributions, including one-time expenses and contributions to Fleet for capital program and Police & Fire Retirement programs are in this category. The continuation add-back of contribution to the Fleet for capital program increased this category for many departments but primarily for Maintenance & Operations Department and Police Department. The restructure of the payments to the Police & Fire Retirement Trust by using COPs reduced this category for the Police and Fire Departments.
Personnel, $294.0 , 56.5%
Supplies, $12.4 , 2.4%
Travel, $0.2 , 0.0%
Other Services, $144.0 , 27.7%
Debt Service, $59.3 , 11.4%
Depreciation, $9.7 , 1.9% Capital Outlay,
$0.9 , 0.2%
Chart 1. 2018 Approved Budget Categories
($ millions)
Total:$520.5 *Million
* Total percent by category slightly off from overall total due to rounding.
2018 Approved General Government Operating Budget
II - 3
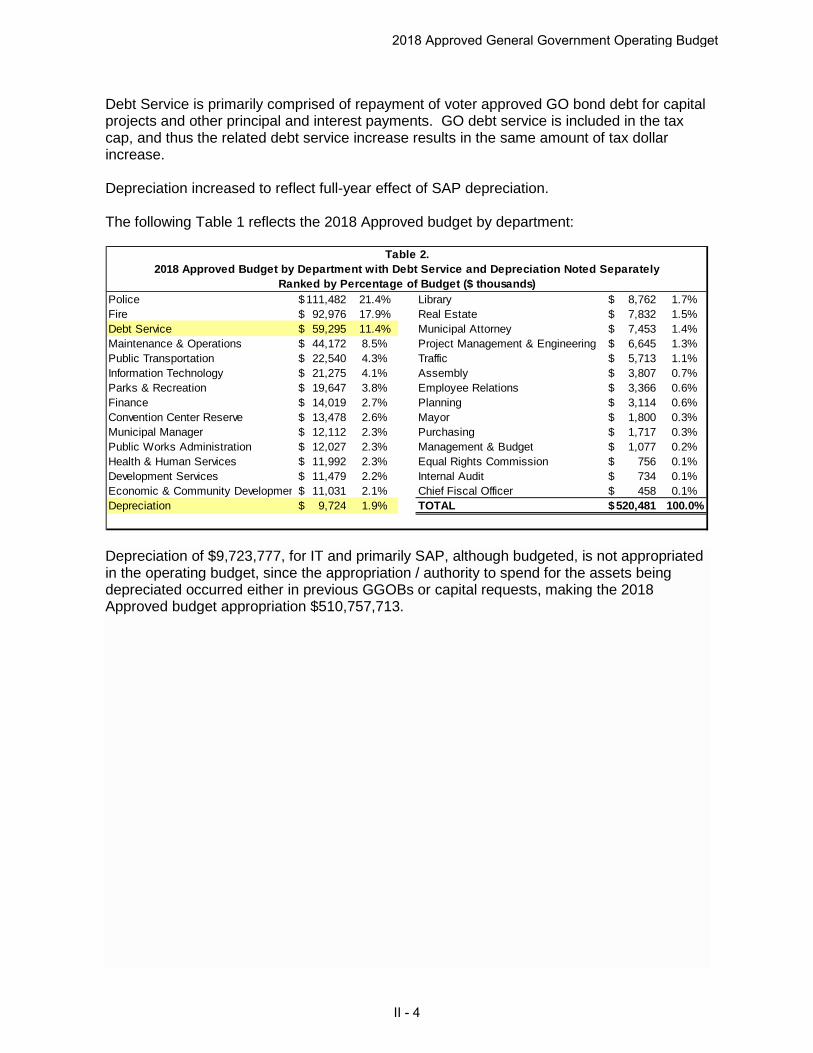
Debt Service is primarily comprised of repayment of voter approved GO bond debt for capital projects and other principal and interest payments. GO debt service is included in the tax cap, and thus the related debt service increase results in the same amount of tax dollar increase. Depreciation increased to reflect full-year effect of SAP depreciation. The following Table 1 reflects the 2018 Approved budget by department:
Depreciation of $9,723,777, for IT and primarily SAP, although budgeted, is not appropriated in the operating budget, since the appropriation / authority to spend for the assets being depreciated occurred either in previous GGOBs or capital requests, making the 2018 Approved budget appropriation $510,757,713.
Police 111,482$ 21.4% Library 8,762$ 1.7%Fire 92,976$ 17.9% Real Estate 7,832$ 1.5%Debt Service 59,295$ 11.4% Municipal Attorney 7,453$ 1.4%Maintenance & Operations 44,172$ 8.5% Project Management & Engineering 6,645$ 1.3%Public Transportation 22,540$ 4.3% Traffic 5,713$ 1.1%Information Technology 21,275$ 4.1% Assembly 3,807$ 0.7%Parks & Recreation 19,647$ 3.8% Employee Relations 3,366$ 0.6%Finance 14,019$ 2.7% Planning 3,114$ 0.6%Convention Center Reserve 13,478$ 2.6% Mayor 1,800$ 0.3%Municipal Manager 12,112$ 2.3% Purchasing 1,717$ 0.3%Public Works Administration 12,027$ 2.3% Management & Budget 1,077$ 0.2%Health & Human Services 11,992$ 2.3% Equal Rights Commission 756$ 0.1%Development Services 11,479$ 2.2% Internal Audit 734$ 0.1%Economic & Community Developmen 11,031$ 2.1% Chief Fiscal Officer 458$ 0.1%Depreciation 9,724$ 1.9% TOTAL 520,481$ 100.0%
Table 2.2018 Approved Budget by Department with Debt Service and Depreciation Noted Separately
Ranked by Percentage of Budget ($ thousands)
2018 Approved General Government Operating Budget
II - 4
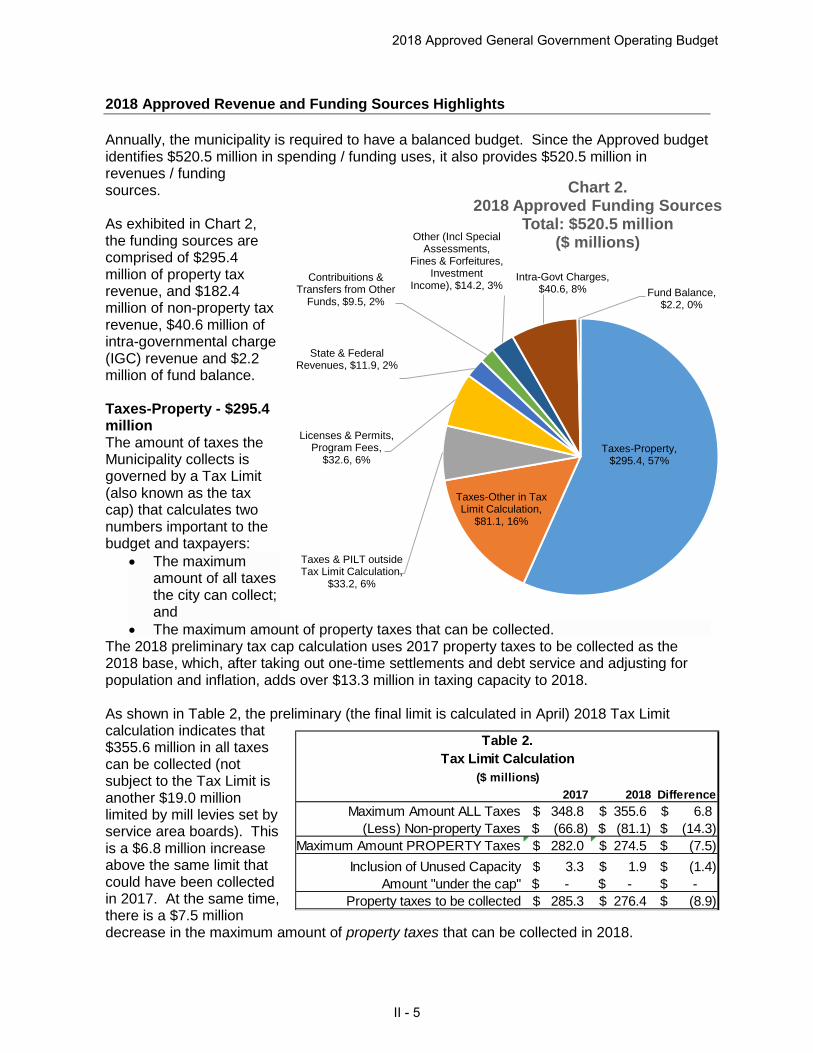
2018 Approved Revenue and Funding Sources Highlights Annually, the municipality is required to have a balanced budget. Since the Approved budget identifies $520.5 million in spending / funding uses, it also provides $520.5 million in revenues / funding sources. As exhibited in Chart 2, the funding sources are comprised of $295.4 million of property tax revenue, and $182.4 million of non-property tax revenue, $40.6 million of intra-governmental charge (IGC) revenue and $2.2 million of fund balance. Taxes-Property - $295.4 million The amount of taxes the Municipality collects is governed by a Tax Limit (also known as the tax cap) that calculates two numbers important to the budget and taxpayers:
• The maximum amount of all taxes the city can collect; and
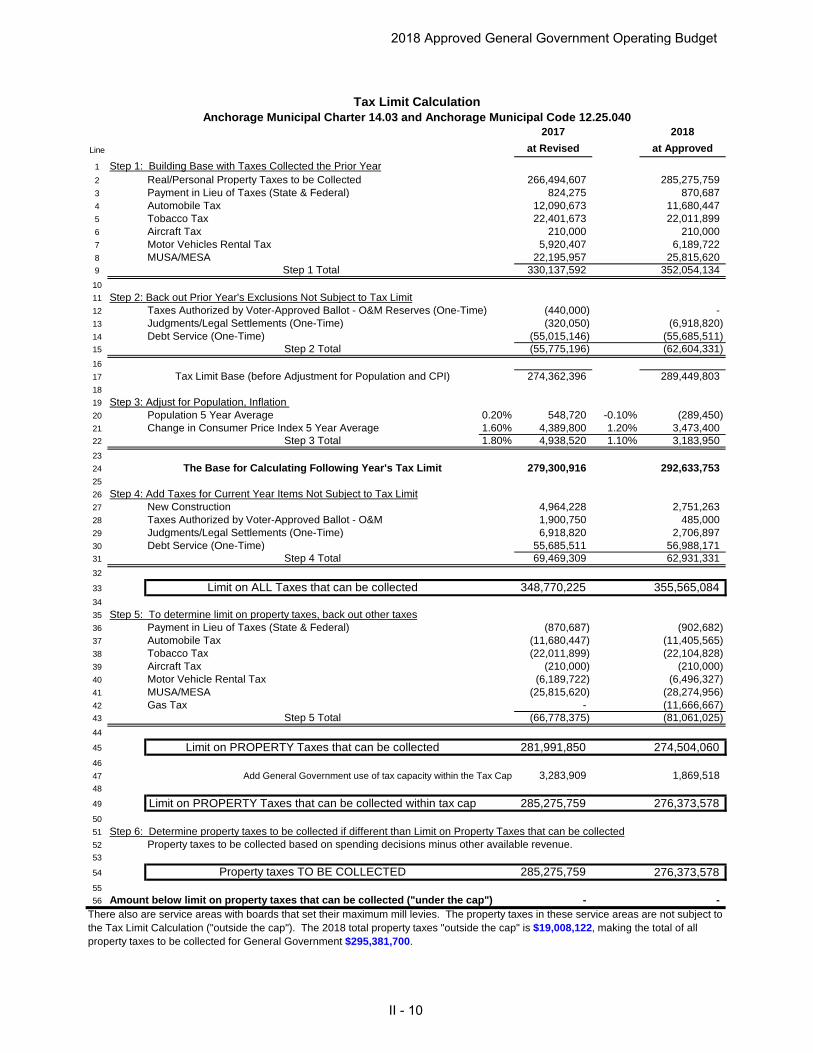
• The maximum amount of property taxes that can be collected. The 2018 preliminary tax cap calculation uses 2017 property taxes to be collected as the 2018 base, which, after taking out one-time settlements and debt service and adjusting for population and inflation, adds over $13.3 million in taxing capacity to 2018. As shown in Table 2, the preliminary (the final limit is calculated in April) 2018 Tax Limit calculation indicates that $355.6 million in all taxes can be collected (not subject to the Tax Limit is another $19.0 million limited by mill levies set by service area boards). This is a $6.8 million increase above the same limit that could have been collected in 2017. At the same time, there is a $7.5 million decrease in the maximum amount of property taxes that can be collected in 2018.
2017 2018 DifferenceMaximum Amount ALL Taxes 348.8$ 355.6$ 6.8$
(Less) Non-property Taxes (66.8)$ (81.1)$ (14.3)$ Maximum Amount PROPERTY Taxes 282.0$ 274.5$ (7.5)$
Inclusion of Unused Capacity 3.3$ 1.9$ (1.4)$ Amount "under the cap" -$ -$ -$
Property taxes to be collected 285.3$ 276.4$ (8.9)$
Tax Limit CalculationTable 2.
($ millions)
Taxes-Property, $295.4, 57%
Taxes-Other in Tax Limit Calculation,
$81.1, 16%
Taxes & PILT outside Tax Limit Calculation,
$33.2, 6%
Licenses & Permits, Program Fees,
$32.6, 6%
State & Federal Revenues, $11.9, 2%
Contribuitions & Transfers from Other
Funds, $9.5, 2%
Other (Incl Special Assessments,
Fines & Forfeitures, Investment
Income), $14.2, 3%Intra-Govt Charges,
$40.6, 8% Fund Balance, $2.2, 0%
Chart 2.2018 Approved Funding Sources
Total: $520.5 million($ millions)
2018 Approved General Government Operating Budget
II - 5
The reason for a decrease in one limit but not the same amount in the other is the core of the tax cap’s design – every dollar in non-property tax replaces a dollar in property tax. The difference is the net increase in the other taxes within the tax cap that automatically reduce the same amount in property taxes and is comprised of:
• $0.3 million increase in Automobile Tax • $0.1 million decrease in Tobacco Tax • $0.3 million increase in Motor Vehicle Rental Tax • $2.5 million increase in MESA/MUSA • $11.7 million inclusion of Gas Tax, pending Assembly approval.
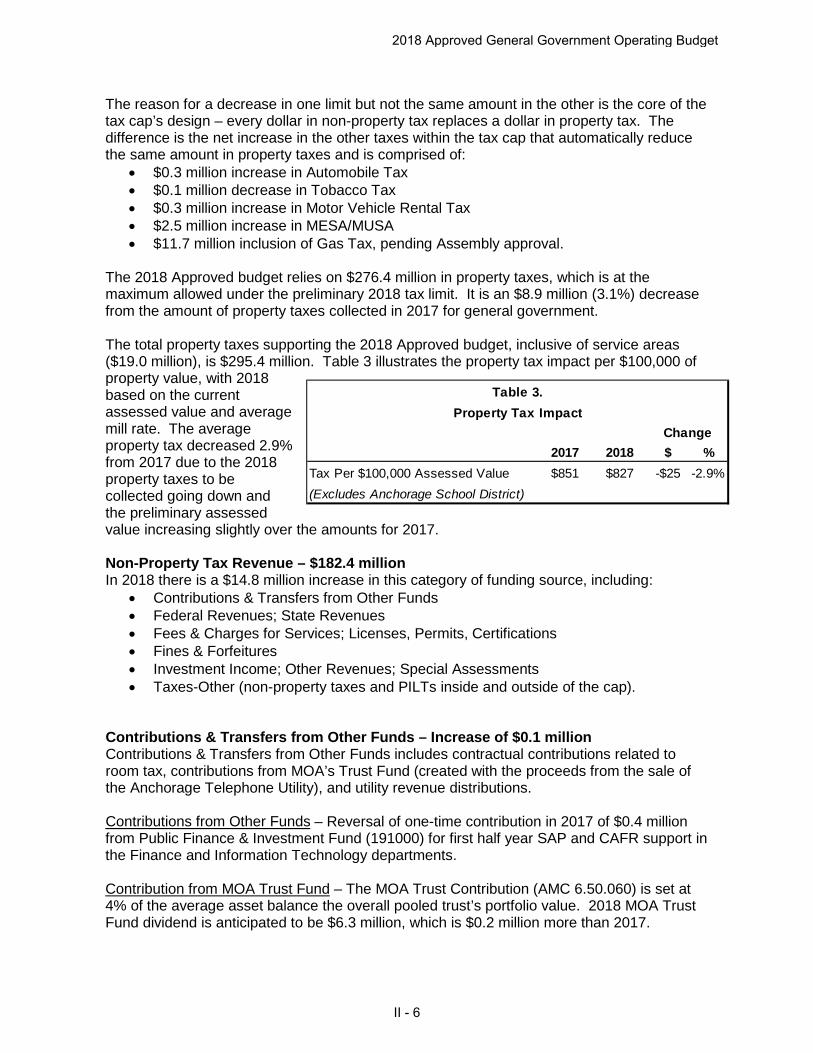
The 2018 Approved budget relies on $276.4 million in property taxes, which is at the maximum allowed under the preliminary 2018 tax limit. It is an $8.9 million (3.1%) decrease from the amount of property taxes collected in 2017 for general government. The total property taxes supporting the 2018 Approved budget, inclusive of service areas ($19.0 million), is $295.4 million. Table 3 illustrates the property tax impact per $100,000 of property value, with 2018 based on the current assessed value and average mill rate. The average property tax decreased 2.9% from 2017 due to the 2018 property taxes to be collected going down and the preliminary assessed value increasing slightly over the amounts for 2017. Non-Property Tax Revenue – $182.4 million In 2018 there is a $14.8 million increase in this category of funding source, including:
• Contributions & Transfers from Other Funds • Federal Revenues; State Revenues • Fees & Charges for Services; Licenses, Permits, Certifications • Fines & Forfeitures • Investment Income; Other Revenues; Special Assessments • Taxes-Other (non-property taxes and PILTs inside and outside of the cap).
Contributions & Transfers from Other Funds – Increase of $0.1 million Contributions & Transfers from Other Funds includes contractual contributions related to room tax, contributions from MOA’s Trust Fund (created with the proceeds from the sale of the Anchorage Telephone Utility), and utility revenue distributions. Contributions from Other Funds – Reversal of one-time contribution in 2017 of $0.4 million from Public Finance & Investment Fund (191000) for first half year SAP and CAFR support in the Finance and Information Technology departments. Contribution from MOA Trust Fund – The MOA Trust Contribution (AMC 6.50.060) is set at 4% of the average asset balance the overall pooled trust’s portfolio value. 2018 MOA Trust Fund dividend is anticipated to be $6.3 million, which is $0.2 million more than 2017.
2017 2018 $ %Tax Per $100,000 Assessed Value $851 $827 -$25 -2.9%(Excludes Anchorage School District)
Table 3.Property Tax Impact
Change
2018 Approved General Government Operating Budget
II - 6
Utility Revenue Distribution – The Utility Revenue Distribution (AMC 26.10.065) is anticipated to be a total of $2.5 million, comprised of $1.3 million from Solid Waste Services Collection, $0.8 million from Solid Waste Services Disposal, and $0.5 million from Port of Anchorage and a total of $0.3 million more than 2017. Federal Revenues; State Revenues – Increase of $2.8 million This category includes revenue received by general government from federal and state governments. Build America Bonds (BABs) Subsidy – A total of $0.8 million is expected from BABs in 2018 which is down $0.5 million from 2017 due to the removal of one-time recovery in 2017 of amounts shorted by the Internal Revenue Service (IRS) in 2015 and 2016. State Revenues (General Assistance) – A total of $7.8 million is expected from revenue sharing from the State of Alaska (SOA), which is flat from the amount received in 2017 and an increase of $3.4 million in the amount budgeted in 2017. Fees & Charges for Services; Licenses, Permits, Certifications – Decrease of $1.1 million This category includes fees paid for services, such as land use permits and bus fares. Changes in 2018 include, but are not limited to: Fees & Charges for Services – Included in this category are changes reflecting: decrease in Lease & Rental Revenue-HLB due to a reclassification of $0.5 million to Lease & Rental Revenue in the Other Revenues category, decrease in Transit fares and advertising fees of $1.0 million, increase in Ambulance Service Fees of $0.6 million, and decrease in DWI Impound/Admin Fees of $0.4 million based on trends in activity and collections. Licenses, Permits, Certifications – the significant changes in this category are increases in Plmb/Gs/Sht Mtl Cert of $0.1 million and Local Business Licenses of $0.3 million due to biennial renewal process (all due in February of each even year) and Bldg/Grde/Clrng Permits down $0.2 million due to anticipated timing of payment of permit fees. Fines & Forfeitures – Decrease of $1.4 million SOA Traffic Court Fines, SOA Trial Court Fines, APD Counter Fines, and Other Fines and Forfeitures – A decrease of $0.2 million is anticipated for SOA Traffic Court Fines due to projected Permanent Fund Dividend (PFD) cap of $1,100 limiting collections and reduced non-PFD collections due to the special collections effort in 2017 that will not be repeated in 2018. Additionally, a decrease of $1.1 million is anticipated for SOA Trial Court Fines because the special collections effort in 2017 will not be repeated in 2018. Investment Income; Other Revenues; Special Assessments – Decrease of $0.4 million Investment Income – The combined 2018 budget for this revenue category is increasing $0.1 million from 2017 due to relatively flat $0.1 million reduction in CIP Cash Pools Short-Term Interest and $0.2 million increase in Other Short-Term Interest for Tax Anticipation Notes (TANs) revenue that is offset by a TANs expense – note that starting in 2018, the TANS Interest Earnings is identified separately from Other Short-Term Interest. Other Revenues – The combined 2018 budget for this revenue category is decreasing by $0.5 million from the 2017 budget mainly due to Land Sales-Cash showing a reduction of $1.2 million due to removal of one-time 2017 proceeds for sale of Fire Station 9, also, the
2018 Approved General Government Operating Budget
II - 7
$0.5 million increase in Lease & Rental Revenue is due to a reclassification from Lease & Rental Revenue-HLB in the Fees & Charges for Services category,. Taxes-Other – Increase of $14.7 million Revenue from non-property taxes and payments made by utilities, Municipal enterprises, and private companies instead of taxes to the Municipality, state, and federal governments (PILT) that have substantively changed in 2018. Taxes that are within the Tax Limit Calculation will offset property taxes dollar-for-dollar. Representative examples of other taxes include: Marijuana Sales Tax (outside Tax Limit Calculation until 2019) – The 2018 budget is anticipated to be $3.5 million, a $0.5 million increase from 2017. The increase is based on a comparison to the growth of taxable sales in Washington and Colorado during their second year of legal recreational sales compared to their first year of legal recreational sales. Room Tax (outside Tax Limit Calculation) – The 2018 budget is anticipated to be 3.8% higher than actual year-end revenues received in 2017 but $0.1 million lower than the 2017 budget. Auto Tax (within Tax Limit Calculation) – The 2018 budget is $11.4 million, a $0.3 million reduction from 2017. The factors that affect the auto registration tax revenues are: total population growth, proportionally faster growth of exemptions, and an increase in average age of vehicles. The decrease in revenues is based on a comparison to revenues in 2016, due to the biennial nature of auto registration (fewer cars are registered in odd-numbered years), and assumes continued decline in population and in personal income, continued increase car owners claiming senior exemptions, and more old cars assessed a lower tax rate. Motor Vehicle Rental Tax (within Tax Limit Calculation) – A total of $6.5 million is expected, which is an increase of $0.3 million compared to 2017. This increase is reflective of the projected continued long-term growth in vehicle rental tax revenues. Fuel Excise Tax (within Tax Limit Calculation) – A total of $11.7 million is $0.10 a gallon, passed with Assembly approval in November 2017, the tax will be effective March 2018 with a full-year estimate of $14.0 million. MUSA/MESA (within Tax Limit Calculation) – A total of $27.8 million is expected for MUSA/MESA, which in an increase of $2.5 million from the 2017 budgeted amount, primarily due to projected changes in the utilities’ net book values and tax district mill rates. These revenues will be updated in the spring during the Revised budget process to include most recent millage and plant values. Intra-Governmental Charges (IGCs) - $40.6 million IGCs are charges for services provided by one Municipal organization to another. For example, the Maintenance & Operations Department maintains all general government buildings. Maintenance costs are budgeted as direct costs in Maintenance & Operations and “charged out” through IGCs to the appropriate users. By using an intra-governmental charge system, the full cost of a program—including overhead—is linked to the program’s budget. The costs of workers compensation and general liability are charged to the departments as IGCs. This system also allows departments to charge Municipal utilities/enterprise, grants, capital projects, and other special revenue funds for services.
2018 Approved General Government Operating Budget
II - 8
In 2018, IGCs are anticipated to generate $40.6 million in funding source “revenue” which is $3.1 million more than 2017 which is reflective of the changes in the approved budget. As part of the annual budget process, IGCs will be updated during 2018 first quarter budget revisions. Fund Balance Fund balance is generally defined as the difference between a fund’s assets and liabilities. This category of funding sources includes unspent funds at year-end in governmental operating funds. These balances then may be used to help pay for the following year’s budget, reducing the amount of funding from other sources that otherwise would be required to support the spending from the respective fund. The 2018 Approved budget uses $0.9 million of fund balance in the taxed service area funds and does increase fund balance by $0.8 million in the Anchorage Fire Service Area (131000) and $1.9 million in the Anchorage Police Service Area Fund (151000) for recovery of legal settlements paid in 2017. As part of the annual budget process, fund balance will be reviewed during first quarter budget amendments to ensure that the funds remain in compliance with the Municipal fund balance reserve policies. Several programs generate revenue that is placed in self-sustaining funds to pay operating costs. For example, Development Services receives revenue from construction-related permits; Heritage Land Bank receives revenue from the sale of Municipal property; and the Dena’ina Center receives bed tax revenue to pay its debt service. A net of $3.9 million of fund balance in these funds is projected to be used (decreased) based on the 2018 Proposed budget and is comprised as follows:
• $1.9 million use – Anchorage Building Safety Service Area Fund (163000) • $0.4 million creation – Public Finance and Investment Fund (164000) • $2.8 million creation – Convention Center Operating Reserve Fund (2020X0) to be
used only for convention center costs • $0.5 million use – Heritage Land Bank Fund (221000) • $1.1 million use – Self-Insurance Fund (602000) • $3.6 million use – Management Information Systems Fund (607000)
Anchorage Building Safety Service Area Fund (163000), Heritage Land Bank Fund (221000), Self-Insurance Fund (602000), and Management Information Systems Fund (607000) show use / decreases in fund balances. These will be reexamined in first quarter budget amendments.
• Fund balance use in the Anchorage Building Safety Service Area Fund (163000) may require a policy decision if the permit revenue continues to be less than the cost of the programs it is meant to support.
• Heritage Land Bank Fund (221000) fund balance use may be adjusted in the revised budget to reflect increases in projected revenue from property sales, leases, and land use permits that may occur after the initial 2018 budget approval.
• Self-Insurance Fund (602000) and Management Information Systems Fund (607000) are internal service funds used to accumulate and allocate costs for services to other Municipal departments and agencies on a cost-reimbursement basis. The 2018 Approved budget IGC revenue is based on 2017 reimbursement rates. As part of the annual budget process, the IGCs may be updated during first quarter budget revisions to reimburse this fund without the use of fund balance.
2018 Approved General Government Operating Budget
II - 9
2017 2018Line at Revised at Approved
1 Step 1: Building Base with Taxes Collected the Prior Year2 Real/Personal Property Taxes to be Collected 266,494,607 285,275,759 3 Payment in Lieu of Taxes (State & Federal) 824,275 870,687 4 Automobile Tax 12,090,673 11,680,447 5 Tobacco Tax 22,401,673 22,011,899 6 Aircraft Tax 210,000 210,000 7 Motor Vehicles Rental Tax 5,920,407 6,189,722 8 MUSA/MESA 22,195,957 25,815,620 9 Step 1 Total 330,137,592 352,054,134 1011 Step 2: Back out Prior Year's Exclusions Not Subject to Tax Limit12 Taxes Authorized by Voter-Approved Ballot - O&M Reserves (One-Time) (440,000) - 13 Judgments/Legal Settlements (One-Time) (320,050) (6,918,820) 14 Debt Service (One-Time) (55,015,146) (55,685,511) 15 Step 2 Total (55,775,196) (62,604,331) 1617 Tax Limit Base (before Adjustment for Population and CPI) 274,362,396 289,449,803 1819 Step 3: Adjust for Population, Inflation 20 Population 5 Year Average 0.20% 548,720 -0.10% (289,450) 21 Change in Consumer Price Index 5 Year Average 1.60% 4,389,800 1.20% 3,473,400 22 Step 3 Total 1.80% 4,938,520 1.10% 3,183,950 2324 The Base for Calculating Following Year's Tax Limit 279,300,916 292,633,753 2526 Step 4: Add Taxes for Current Year Items Not Subject to Tax Limit27 New Construction 4,964,228 2,751,263 28 Taxes Authorized by Voter-Approved Ballot - O&M 1,900,750 485,000 29 Judgments/Legal Settlements (One-Time) 6,918,820 2,706,897 30 Debt Service (One-Time) 55,685,511 56,988,171 31 Step 4 Total 69,469,309 62,931,331 32
33 Limit on ALL Taxes that can be collected 348,770,225 355,565,084 3435 Step 5: To determine limit on property taxes, back out other taxes36 Payment in Lieu of Taxes (State & Federal) (870,687) (902,682) 37 Automobile Tax (11,680,447) (11,405,565) 38 Tobacco Tax (22,011,899) (22,104,828) 39 Aircraft Tax (210,000) (210,000) 40 Motor Vehicle Rental Tax (6,189,722) (6,496,327) 41 MUSA/MESA (25,815,620) (28,274,956) 42 Gas Tax - (11,666,667) 43 Step 5 Total (66,778,375) (81,061,025) 44
45 Limit on PROPERTY Taxes that can be collected 281,991,850 274,504,060 4647 Add General Government use of tax capacity within the Tax Cap 3,283,909 1,869,518 48
49 Limit on PROPERTY Taxes that can be collected within tax cap 285,275,759 276,373,578 5051 Step 6: Determine property taxes to be collected if different than Limit on Property Taxes that can be collected52 Property taxes to be collected based on spending decisions minus other available revenue.53
54 Property taxes TO BE COLLECTED 285,275,759 276,373,578 5556 Amount below limit on property taxes that can be collected ("under the cap") - -
There also are service areas with boards that set their maximum mill levies. The property taxes in these service areas are not subject to the Tax Limit Calculation ("outside the cap"). The 2018 total property taxes "outside the cap" is $19,008,122, making the total of all property taxes to be collected for General Government $295,381,700.
Tax Limit CalculationAnchorage Municipal Charter 14.03 and Anchorage Municipal Code 12.25.040
2018 Approved General Government Operating Budget
II - 10

Department FT PT Seas Temp Total FT PT Seas Temp Total FT PT Seas Temp Total # %Assembly 25 3 - - 28 26 1 - - 27 25 1 - - 26 (1) -3.6%Chief Fiscal Officer 2 - - - 2 2 - - - 2 2 - - - 2 - 0.0%Development Services 74 - - - 74 73 - - - 73 72 - - - 72 (1) -1.4%Economic & Community Development 6 - - - 6 6 - - - 6 7 - - - 7 1 16.7%Employee Relations 34 - - - 34 30 - - - 30 27 - - - 27 (3) -8.8%Equal Rights Commission 5 1 - - 6 6 - - - 6 6 - - - 6 - 0.0%Finance 104 1 - - 105 102 1 - - 103 102 1 - - 103 - 0.0%Fire 383 - - - 383 382 - - - 382 394 - - - 394 12 3.1%Health & Human Services 54 1 2 - 57 53 1 1 - 55 47 1 2 - 50 (5) -8.8%Information Technology 73 - - - 73 74 - - - 74 68 - - - 68 (6) -8.2%Internal Audit 5 1 - - 6 5 1 - - 6 5 1 - - 6 - 0.0%Library 60 34 - - 94 61 30 - - 91 60 25 - - 85 (6) -6.4%Maintenance & Operations 155 - 14 - 169 153 - 7 - 160 150 - 7 - 157 (3) -1.8%Management & Budget 7 - - - 7 6 - - - 6 5 - - - 5 (1) -14.3%Mayor 9 - - - 9 9 - - - 9 8 - - - 8 (1) -11.1%Municipal Attorney 50 1 - - 51 49 1 - - 50 48 - - - 48 (2) -3.9%Municipal Manager 20 2 - 22 20 2 - 22 18 3 - 21 (1) -4.5%Parks & Recreation 65 42 183 30 320 69 25 199 31 324 69 25 210 31 335 11 3.4%Planning 25 - - - 25 24 - - - 24 21 - - - 21 (3) -12.0%Police 544 - - - 544 599 - - - 599 599 - - - 599 - 0.0%Project Management & Engineering 38 1 2 1 42 37 1 2 1 41 38 1 2 - 41 - 0.0%Public Transportation 147 - - - 147 147 - - - 147 148 - - - 148 1 0.7%Public Works Administration 17 - - - 17 18 - - - 18 17 - - - 17 (1) -5.9%Purchasing 15 - - - 15 14 - - - 14 13 - - - 13 (1) -6.7%Real Estate 5 1 - - 6 5 1 - - 6 5 1 - - 6 - 0.0%Traffic 26 - 3 1 30 26 - 3 1 30 27 - 3 1 31 1 3.3%
Position Total 1,948 88 204 32 2,272 1,996 64 212 33 2,305 1,981 59 224 32 2,296 (9) -0.4%
2018 Proposed Assembly Amendments:
Health & Human Services - reduce six (6) FT positions and adding one (1) seasonal position, aligning with grant funding and non-labor adjustment to cover addition of Air Quality position
Project Management & Engineering - align position types to actuals adjust one (1) temp and (1) seasonal position to FT positions.
Traffic - add one (1) Assistant Traffic Engineer offset with non-labor reductions.
2018 Proposed Budget Changes from 2018 Continuation:Assembly - eliminate 1 vacant FT Administrative Assistant position.Development Services - eliminate 1 FT Engineering Technician III position.Employee Relations - transfer 1 FT Personnel Analyst I position to Finance Department, Payroll Division due to nature of work performed by position; eliminate 1 FT Personnel Analyst I position, as of 6/30/18, offset with Family and Medical Leave Act (FMLA) contractual support to ensure consistent federal and state compliance; eliminate 1 FT Special Administrative Assistant II position as of 6/30/18.
Planning - eliminate two (2) FT Planner positions, eliminate one (1) FT Principal Admin Officer position.Project Management & Engineering - convert one (1) FT Engineering Tech III position to a seasonal position.Public Works Administration - eliminate one (1) FT Accountant position with work to be distributed amongst remaining staff.Purchasing - eliminate one (1) FT Office Associate position.
Position Summary by Department
This summary shows budgeted staffing levels at end of year. Reports generated from QuesticaBudget (Department Summary and Division Summary), included in department sections of budget books show staffing levels at beginning of year. Notable position changes are listed below:
Parks & Recreation - alignment of position type to actuals, eliminate one (1) FT position, add six (6) seasonal positions.
2018 Approved Budget2016 Revised Budget 18 v 17 Chg
2018 Continuation adjustments from 2017 Revised (net-zero changes detailed in department reconciliations).
Parks & Recreation - add one (1) FT Park Foremen and five (5) seasonal Parks Caretakers for homeless camp cleanup.
2017 Revised Budget
Economic & Community Development - addition of one GIS Technician III offset with reduction of non-labor.
Information Technology - reduction of one (1) FT position to increase grades on other positions.Library - adjust a position from PT to FT reducing PT count by 1 and adding 1 to FT.
Public Transportation - add one (1) FT position to be offset with grant funding.
Finance - net-zero to total count: transfer 1 FT Personnel Analyst I position to Payroll Division from Employee Relations Department due to nature of work performed, eliminate 1 FT Administrative Officer position and add 1 FT Senior Staff Accountant position in Controller Division, Eliminate 1 FT Junior Accountant position in Payroll Division.Fire - add twelve (12) new FT Firefighter (EMT) positions in September, 2018 with September academy in anticipation of new ambulances.Information Technology - eliminate two (2) FT Helpdesk positions, eliminate one (1) FT IT Procurement Specialist position, eliminate two (2) FT Systems Analyst positions that provided Computerized Assisted Mass Appraisal (CAMA) support and PeopleSoft support.Library - eliminate two (2) PT call-in Librarian I positions at Loussac that work 4 hrs/week with minimal impact on service, eliminate two (2) FT Library Assistant III positions at Loussac and use a staff member from Youth Services to fill the gap, eliminate one (1) PT Library Assistant II and one (1) PT Library Clerk due to anticipated Loussac hours reduced from 64 hrs/week to 46 hrs/week.Maintenance & Operations - eliminate one (1) FT Senior Electronic Tech position, eliminate one (1) FT Special Admin Assistant I position and one (1) FT Superintendent position.Management & Budget - eliminate 1 FT Budget Analyst position partially offset with overtime and non-labor adjustments.Mayor - eliminate one (1) FT Special Administrative Assistant position.Municipal Attorney - eliminate one (1) FT Legal Secretary position, eliminate one (1) FT Special Administrative Assistant position.Municipal Manager - reduce one (1) Senior Code Enforcement Officer position from FT to PT, eliminate one (1) FT Senior Office Associate position.
Municipal Attorney - adjust Hearing Officer from one (1) PT to one (1) FT.
2018 Approved General Government Operating Budget
II - 11
Department2017
Revised Personnel Misc &
Contracts1Debt
ServiceP&F
Retrmnt Subtotal2018
ContinuationBondO&M
SAPOngoing2
One-TimeDept3
DeptAdjustmntsReductionsEfficiencies4 Subtotal
2018Proposed
Budget
SVersion
Changes 5
AssemblyAmend-ments 6 Budget
LessDepreciation Appropriation
Assembly 3,624,538 27,628 (48,000) - - (20,372) 3,604,166 - - - (170,457) (170,457) 3,433,709 373,000 - 3,806,709 - 3,806,709 Chief Fiscal Officer 468,858 16,812 - - - 16,812 485,670 - - - (27,384) (27,384) 458,286 - - 458,286 - 458,286 Development Services 11,129,890 179,959 77,172 - - 257,131 11,387,021 - - 200,000 (108,259) 91,741 11,478,762 - - 11,478,762 - 11,478,762 Economic & Communi 11,823,978 81,879 (121,460) 85,915 - 46,334 11,870,312 - - 242,581 (88,641) 153,940 12,024,252 - - 12,024,252 - 12,024,252 Employee Relations 3,632,382 (113,161) - - - (113,161) 3,519,221 - - - (153,385) (153,385) 3,365,836 - - 3,365,836 - 3,365,836 Equal Rights Commiss 766,494 25,671 - - - 25,671 792,165 - - - (36,126) (36,126) 756,039 - - 756,039 - 756,039 Finance 14,583,800 317,203 (576,854) - - (259,651) 14,324,149 - - - (304,688) (304,688) 14,019,461 - - 14,019,461 - 14,019,461 Fire 98,463,574 2,004,109 230,809 (197,372) 78,028 2,115,574 100,579,148 - - 1,751,670 (4,671,153) (2,919,483) 97,659,665 - - 97,659,665 - 97,659,665 Health & Human Servi 11,565,040 255,289 (74,248) 44,916 - 225,957 11,790,997 - - 500,000 (12,273) 487,727 12,278,724 - 50,000 12,328,724 - 12,328,724 Information Technolog 24,942,568 371,905 (403,111) - - (31,206) 24,911,362 - 7,557,907 262,430 (834,328) 6,986,009 31,897,371 - - 31,897,371 (9,723,777) 22,173,594 Internal Audit 719,957 44,877 864 - - 45,741 765,698 - - - (32,100) (32,100) 733,598 - - 733,598 - 733,598 Library 8,367,254 556,625 848 - - 557,473 8,924,727 - - (75,000) (212,477) (287,477) 8,637,250 - 125,000 8,762,250 - 8,762,250 Maintenance & Operat 88,173,168 435,838 1,105,948 1,900,102 - 3,441,888 91,615,056 85,000 - 500,000 (786,166) (201,166) 91,413,890 - - 91,413,890 - 91,413,890 Management & Budge 1,089,720 (15,958) (40,000) - - (55,958) 1,033,762 - - 100,000 (56,958) 43,042 1,076,804 - - 1,076,804 - 1,076,804 Mayor 1,897,839 52,113 2,144 - - 54,257 1,952,096 - - - (151,683) (151,683) 1,800,413 - - 1,800,413 - 1,800,413 Municipal Attorney 7,372,054 274,353 2,144 - - 276,497 7,648,551 - - - (320,051) (320,051) 7,328,500 124,407 - 7,452,907 - 7,452,907 Municipal Manager 13,497,343 163,458 (293,383) (18,453) - (148,378) 13,348,965 - - - (205,462) (205,462) 13,143,503 - - 13,143,503 - 13,143,503 Parks & Recreation 21,812,387 461,087 311,043 (694,259) - 77,871 21,890,258 245,000 - 178,665 (228,962) 194,703 22,084,961 - 170,000 22,254,961 - 22,254,961 Planning 3,343,861 100,677 4,288 - - 104,965 3,448,826 - - - (335,300) (335,300) 3,113,527 - - 3,113,527 - 3,113,527 Police 111,272,947 5,866,781 (783,085) 40,206 (64,778) 5,059,124 116,332,071 - - 648,368 (5,133,602) (4,485,234) 111,846,837 - - 111,846,837 - 111,846,837 Project Management & 6,600,036 52,250 29,587 - - 81,837 6,681,873 75,000 - - (111,809) (36,809) 6,645,064 - - 6,645,064 - 6,645,064 Public Transportation 22,587,523 356,403 - 63,535 - 419,938 23,007,461 - - - (2,399) (2,399) 23,005,062 - 79,076 23,084,138 - 23,084,138 Public Works Administ 12,099,683 78,410 (15,523) - - 62,887 12,162,570 30,000 - - (165,670) (135,670) 12,026,900 - - 12,026,900 - 12,026,900 Purchasing 1,795,065 6,728 - - - 6,728 1,801,793 - - - (84,457) (84,457) 1,717,336 - - 1,717,336 - 1,717,336 Real Estate 7,913,487 66,896 23,046 - - 89,942 8,003,429 - - - (171,894) (171,894) 7,831,535 - - 7,831,535 - 7,831,535 Traffic 5,509,354 326,155 (120,351) - - 205,804 5,715,158 50,000 - - (52,398) (2,398) 5,712,760 - - 5,712,760 - 5,712,760 Non-Departmental 440,242 - - 151,794 - 151,794 592,036 - - - - - 592,036 - - 592,036 - 592,036 Taxes & Reserve 13,430,952 - 46,975 - - 46,975 13,477,927 - - - - - 13,477,927 - - 13,477,927 - 13,477,927 Direct Cost Total 508,923,994 11,993,986 (641,147) 1,376,384 13,250 12,742,473 521,666,467 485,000 7,557,907 4,308,714 (14,458,081) (2,106,460) 519,560,007 497,407 424,076 520,481,490 (9,723,777) 510,757,713
502,346,507 ########## 502,346,507 497,584,219 Notes (additional details provided in department reconciliations): ######## #########
1
2 SAP Ongoing: Information Technology - $3,000,000 for SAP ongoing support and $4,557,907 for SAP capital project depreciation
3
4
5
6 Assembly Amendments: Health & Human Services - the increase of $50,000 is for one-time funding for Four A's (Alaska AIDS Assistance Association) mobile syringe access program as a grant from HHS, additionally, an amendment was approved to dedicate $75,000 of the proposed $500,000 of homelessness to matching fund for cold-weather sheltering; Library - the $125,000 is to restore Loussac Library hours; Parks& Recreation - the $170,000 is to add 1 Park Foreman and 5 Parks Caretakers for homeless camps cleanup; Public Transportation - the $79,076 is to reverse 2017 reduction for fuel, all of which are funded with fund balance.
S Version Changes: Assembly - the increase of $373,000 is a combination of $300,000 increase for Vote-by-Mail printing and mailing of ballots, $28,000 increase for municipal audit 5% annual increase, and $45,000 increase for sign language interpreter for Assembly Counsel; Municipal Attorney - the $124,407 increase is a combination of $24,407 for adjusting Hearing Officer from .8 FTE to 1 FTE, and $100,000 for Prosecutor's Office pay increase for staff attorneys and training to develop and improve skills, all of which are funded with fund balance.
Dept Adjustments, Reductions, Efficiencies: Fire - the reduction of ($4,671,153) is a combination of ($5,173,991) removing contribution to Police & Fire Retirement trust, offset with Certificate of Participation (COP), repayment starting in 2019, ($5,891) pause cost-of-living increase for Executive employees, adding $498,384 to add twelve (12) new FT Firefighter (EMT) positions in September with September academy in anticipation of new ambulances and adding $10,345 to the Girdwood Valley Volunteer Fire for personnel, training and communications, Information Technology - reduction of ($834,328) is eliminating five (5) FT positions for ($710,533), reducing ($26,795) for pause cost-of-living increase for Executive positions and ($97,000) eliminating Kronos maintenance and canceling Rimini Street software subscription, Maintenance & Operations - total reduction of ($786,166) includes reducing three (3) FT positions for ($469,177), pause cost-of-living increase for Executive positions for ($7,797), and non-labor reductions of ($309,192), Police - the reduction of ($5,133,602) is attributed to ($5,137,309) removal of contribution to Police & Fire Retirement Trust, offset with Certificate of Participation (COP), repayment starting in 2019, ($13,293) for pause cost-of-living increase for Executive employees and adding $17,000 for Girdwood Valley Police for ACS building rental and misc. police items.
2018 Approved
2017 Revised to 2018 Approved Direct Cost Budget Reconciliation by Department
Misc & Contracts: Fleet Rental Rates - includes adding back $2,018,388 of ONE-TIME fleet reductions from 2017 and additional $266,795 for current year costs in various departments, Prior Year ONE-TIME Items - removal of prior year ONE-TIME items of ($3,000,722) to multiple departments, Economic & Community Development - $67,529 for ACPA and Anchorage museum contracts and ($70,506) reduction of hotel/motel tax, Fire - increase of $230,809 for AWWU 4.7% rate change for fire hydrant usage, Maintenance & Operations - reduce ($143) for hotel/motel tax, Parks & Recreation - reduce ($96) for hotel/motel tax, Real Estate - increase $23,046 for contractual lease rate adjustments, Taxes & Reserves - add $46,975 for hotel/motel tax.
One-Time Dept: Development Services - $200,000 for code abatements and deteriorated property clean-up, Economic & Community Development - $242,581 of funding for George M. Sullivan Arena anticipated operating loss based on 2018 budget, Fire - $540,670 added for academy 2018 costs for November 2017 academy start, $756,000 increase overtime to keep ambulances 81 & 82 in service, and $455,000 for September academy in anticipation of new ambulances, Health & Human Services - $500,000 for housing and homelessness initiative includes matching funds and support to infrastructure needs and outreach coordinator, Information Technology - $262,430 to write-off Kronos time clocks after 9/30/18, Library - ($75,000) reduction to materials purchases, Maintenance & Operations - added $500,000 for snow clearing contingency for State and Municipal assets within the municipality, priority to transit and pedestrian access, Management & Budget - $100,000 to contract for evaluation of departments' operations and costs, Parks & Recreation - $188,665 for Ben Boeke and Dempsey Anderson Ice Arenas potential net operating loss and reduce ($10,000) from grants to outside organizations, Police - $348,368 of funding for academy 2018 costs for supplies and outfitting for attrition academy and $300,000 in fleet rental rates to reflect one-time increase to fleet capital purchase.
Proposed AdjustmentsContinuation Level Adjustments
2018 Approved General Government Operating Budget
II - 12
Fund # 101000 104000 106000 119000 131000 141000 151000 161000 162000 SA/LRSA 163000 164000 2020X0 221000 301000 602000 607000
Department Areawide
Chugiak Fire
Service Area
Girdwood Valley
Service Area
Chugiak/Birchwd/
ER RRSA
Anch Fire
Service Area
Anch Roads /
DrainageService
Area
Anch Police
Service Area
Anch Parks &
Rec Service
Area
Eagle River /
Chugiak Parks &
RecService
Area
Multiple SAs and LRSAs
Bld Safety
Service Area
Public Fin
Invest
Cnvntn Ctr Ops Reserve
Heritage Land Bank
Rev Bond-PAC Self-Ins
Mgmnt Info
Systems TOTAL% of Total
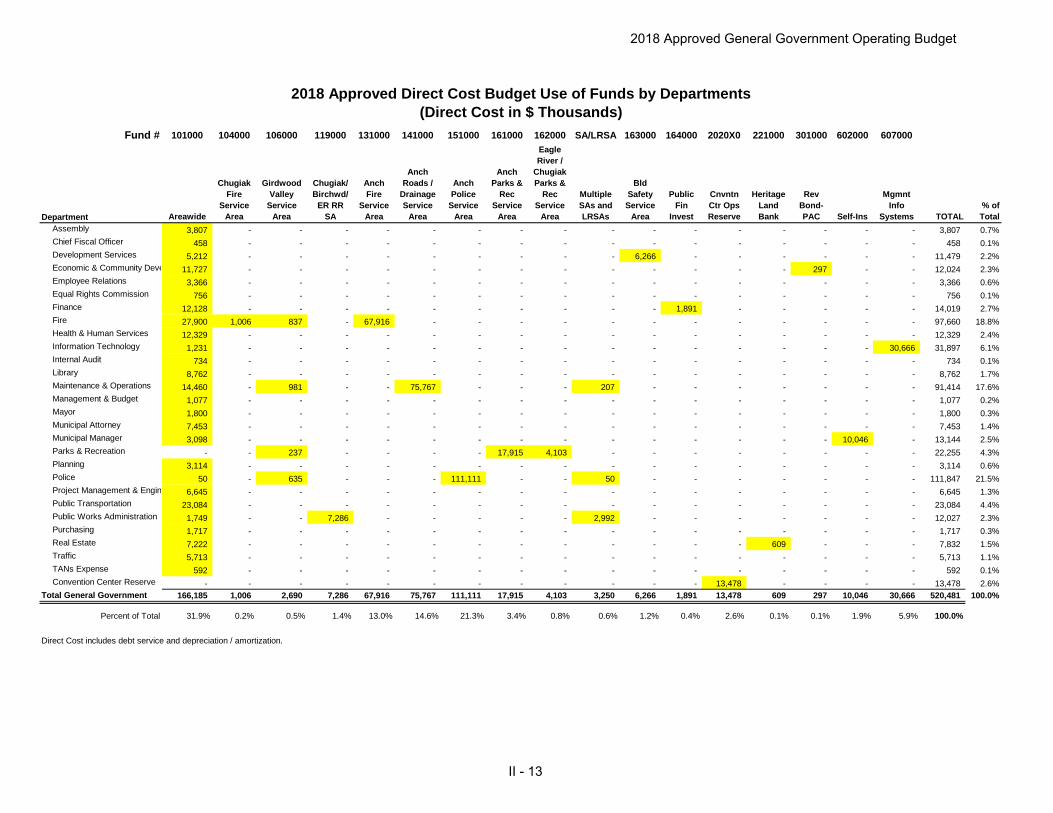
Assembly 3,807 - - - - - - - - - - - - - - - - 3,807 0.7%Chief Fiscal Officer 458 - - - - - - - - - - - - - - - - 458 0.1%Development Services 5,212 - - - - - - - - - 6,266 - - - - - - 11,479 2.2%Economic & Community Deve 11,727 - - - - - - - - - - - - - 297 - - 12,024 2.3%Employee Relations 3,366 - - - - - - - - - - - - - - - - 3,366 0.6%Equal Rights Commission 756 - - - - - - - - - - - - - - - - 756 0.1%Finance 12,128 - - - - - - - - - - 1,891 - - - - - 14,019 2.7%Fire 27,900 1,006 837 - 67,916 - - - - - - - - - - - - 97,660 18.8%Health & Human Services 12,329 - - - - - - - - - - - - - - - - 12,329 2.4%Information Technology 1,231 - - - - - - - - - - - - - - - 30,666 31,897 6.1%Internal Audit 734 - - - - - - - - - - - - - - - - 734 0.1%Library 8,762 - - - - - - - - - - - - - - - - 8,762 1.7%Maintenance & Operations 14,460 - 981 - - 75,767 - - - 207 - - - - - - - 91,414 17.6%Management & Budget 1,077 - - - - - - - - - - - - - - - - 1,077 0.2%Mayor 1,800 - - - - - - - - - - - - - - - - 1,800 0.3%Municipal Attorney 7,453 - - - - - - - - - - - - - - - - 7,453 1.4%Municipal Manager 3,098 - - - - - - - - - - - - - - 10,046 - 13,144 2.5%Parks & Recreation - - 237 - - - - 17,915 4,103 - - - - - - - - 22,255 4.3%Planning 3,114 - - - - - - - - - - - - - - - - 3,114 0.6%Police 50 - 635 - - - 111,111 - - 50 - - - - - - - 111,847 21.5%Project Management & Engin 6,645 - - - - - - - - - - - - - - - - 6,645 1.3%Public Transportation 23,084 - - - - - - - - - - - - - - - - 23,084 4.4%Public Works Administration 1,749 - - 7,286 - - - - - 2,992 - - - - - - - 12,027 2.3%Purchasing 1,717 - - - - - - - - - - - - - - - - 1,717 0.3%Real Estate 7,222 - - - - - - - - - - - - 609 - - - 7,832 1.5%Traffic 5,713 - - - - - - - - - - - - - - - - 5,713 1.1%TANs Expense 592 - - - - - - - - - - - - - - - - 592 0.1%Convention Center Reserve - - - - - - - - - - - - 13,478 - - - - 13,478 2.6%
Total General Government 166,185 1,006 2,690 7,286 67,916 75,767 111,111 17,915 4,103 3,250 6,266 1,891 13,478 609 297 10,046 30,666 520,481 100.0%
Percent of Total 31.9% 0.2% 0.5% 1.4% 13.0% 14.6% 21.3% 3.4% 0.8% 0.6% 1.2% 0.4% 2.6% 0.1% 0.1% 1.9% 5.9% 100.0%
Direct Cost includes debt service and depreciation / amortization.
2018 Approved Direct Cost Budget Use of Funds by Departments(Direct Cost in $ Thousands)
2018 Approved General Government Operating Budget
II - 13
Fund # 101000 104000 106000 119000 131000 141000 151000
Revenue Type AreawideChugiak FireService Area
Girdwood Valley
Service AreaChugiak/Birchwd/ER RR SA
Anchorage Fire
Service Area
Anchorage Roads /
DrainageService Area
Anchorage Police
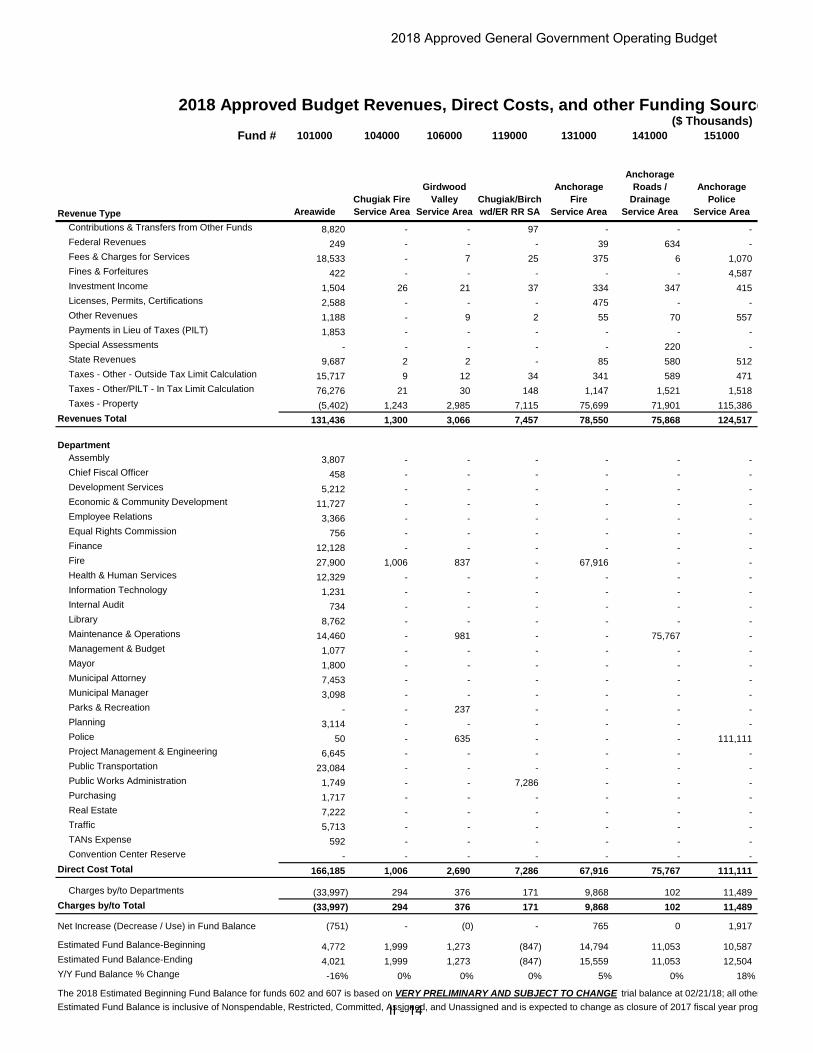
Service AreaContributions & Transfers from Other Funds 8,820 - - 97 - - - Federal Revenues 249 - - - 39 634 - Fees & Charges for Services 18,533 - 7 25 375 6 1,070 Fines & Forfeitures 422 - - - - - 4,587 Investment Income 1,504 26 21 37 334 347 415 Licenses, Permits, Certifications 2,588 - - - 475 - - Other Revenues 1,188 - 9 2 55 70 557 Payments in Lieu of Taxes (PILT) 1,853 - - - - - - Special Assessments - - - - - 220 - State Revenues 9,687 2 2 - 85 580 512 Taxes - Other - Outside Tax Limit Calculation 15,717 9 12 34 341 589 471 Taxes - Other/PILT - In Tax Limit Calculation 76,276 21 30 148 1,147 1,521 1,518 Taxes - Property (5,402) 1,243 2,985 7,115 75,699 71,901 115,386
Revenues Total 131,436 1,300 3,066 7,457 78,550 75,868 124,517
DepartmentAssembly 3,807 - - - - - - Chief Fiscal Officer 458 - - - - - - Development Services 5,212 - - - - - - Economic & Community Development 11,727 - - - - - - Employee Relations 3,366 - - - - - - Equal Rights Commission 756 - - - - - - Finance 12,128 - - - - - - Fire 27,900 1,006 837 - 67,916 - - Health & Human Services 12,329 - - - - - - Information Technology 1,231 - - - - - - Internal Audit 734 - - - - - - Library 8,762 - - - - - - Maintenance & Operations 14,460 - 981 - - 75,767 - Management & Budget 1,077 - - - - - - Mayor 1,800 - - - - - - Municipal Attorney 7,453 - - - - - - Municipal Manager 3,098 - - - - - - Parks & Recreation - - 237 - - - - Planning 3,114 - - - - - - Police 50 - 635 - - - 111,111 Project Management & Engineering 6,645 - - - - - - Public Transportation 23,084 - - - - - - Public Works Administration 1,749 - - 7,286 - - - Purchasing 1,717 - - - - - - Real Estate 7,222 - - - - - - Traffic 5,713 - - - - - - TANs Expense 592 - - - - - - Convention Center Reserve - - - - - - -
Direct Cost Total 166,185 1,006 2,690 7,286 67,916 75,767 111,111
Charges by/to Departments (33,997) 294 376 171 9,868 102 11,489 Charges by/to Total (33,997) 294 376 171 9,868 102 11,489
Net Increase (Decrease / Use) in Fund Balance (751) - (0) - 765 0 1,917
Estimated Fund Balance-Beginning 4,772 1,999 1,273 (847) 14,794 11,053 10,587 Estimated Fund Balance-Ending 4,021 1,999 1,273 (847) 15,559 11,053 12,504 Y/Y Fund Balance % Change -16% 0% 0% 0% 5% 0% 18%
The 2018 Estimated Beginning Fund Balance for funds 602 and 607 is based on VERY PRELIMINARY AND SUBJECT TO CHANGE trial balance at 02/21/18; all other Estimated Fund Balance is inclusive of Nonspendable, Restricted, Committed, Assigned, and Unassigned and is expected to change as closure of 2017 fiscal year prog
($ Thousands)2018 Approved Budget Revenues, Direct Costs, and other Funding Source
2018 Approved General Government Operating Budget
II - 14
161000 162000 SA/LRSA 163000 164000 2020X0 221000 301000 602000 607000
Anchorage Parks &
RecreationService Area
Eagle River / Chugiak
Parks & RecService Area
Multiple SAs and LRSAs
BuildingSafetyService
Area
Public Finance
Investment
Convention Center
Operations Reserve
Heritage Land Bank
Revenue Bond
Payment-Performing Arts Center
Self-Insurance
Management Information
SystemsTotal
Budget
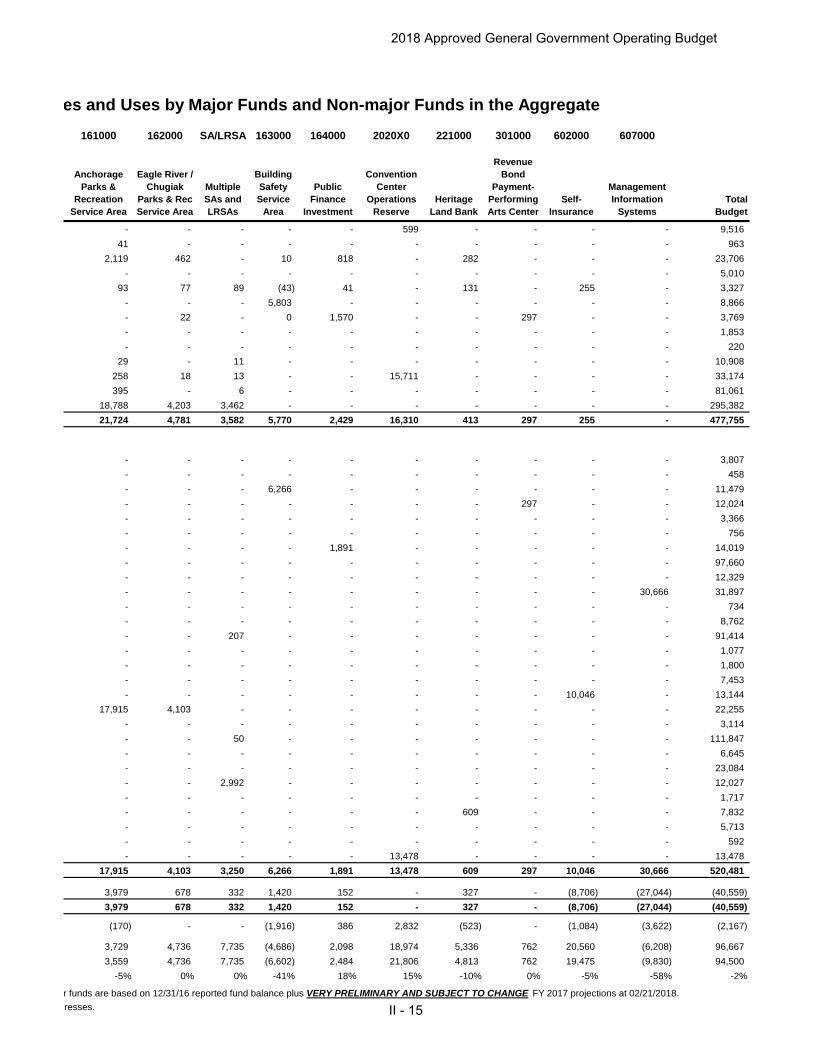
- - - - - 599 - - - - 9,516 41 - - - - - - - - - 963
2,119 462 - 10 818 - 282 - - - 23,706 - - - - - - - - - - 5,010
93 77 89 (43) 41 - 131 - 255 - 3,327 - - - 5,803 - - - - - - 8,866 - 22 - 0 1,570 - - 297 - - 3,769 - - - - - - - - - - 1,853 - - - - - - - - - - 220
29 - 11 - - - - - - - 10,908 258 18 13 - - 15,711 - - - - 33,174 395 - 6 - - - - - - - 81,061
18,788 4,203 3,462 - - - - - - - 295,382 21,724 4,781 3,582 5,770 2,429 16,310 413 297 255 - 477,755
- - - - - - - - - - 3,807 - - - - - - - - - - 458 - - - 6,266 - - - - - - 11,479 - - - - - - - 297 - - 12,024 - - - - - - - - - - 3,366 - - - - - - - - - - 756 - - - - 1,891 - - - - - 14,019 - - - - - - - - - - 97,660 - - - - - - - - - - 12,329 - - - - - - - - - 30,666 31,897 - - - - - - - - - - 734 - - - - - - - - - - 8,762 - - 207 - - - - - - - 91,414 - - - - - - - - - - 1,077 - - - - - - - - - - 1,800 - - - - - - - - - - 7,453 - - - - - - - - 10,046 - 13,144
17,915 4,103 - - - - - - - - 22,255 - - - - - - - - - - 3,114 - - 50 - - - - - - - 111,847 - - - - - - - - - - 6,645 - - - - - - - - - - 23,084 - - 2,992 - - - - - - - 12,027 - - - - - - - - - - 1,717 - - - - - - 609 - - - 7,832 - - - - - - - - - - 5,713 - - - - - - - - - - 592 - - - - - 13,478 - - - - 13,478
17,915 4,103 3,250 6,266 1,891 13,478 609 297 10,046 30,666 520,481
3,979 678 332 1,420 152 - 327 - (8,706) (27,044) (40,559) 3,979 678 332 1,420 152 - 327 - (8,706) (27,044) (40,559)
(170) - - (1,916) 386 2,832 (523) - (1,084) (3,622) (2,167)
3,729 4,736 7,735 (4,686) 2,098 18,974 5,336 762 20,560 (6,208) 96,667 3,559 4,736 7,735 (6,602) 2,484 21,806 4,813 762 19,475 (9,830) 94,500
-5% 0% 0% -41% 18% 15% -10% 0% -5% -58% -2%
r funds are based on 12/31/16 reported fund balance plus VERY PRELIMINARY AND SUBJECT TO CHANGE FY 2017 projections at 02/21/2018. resses.
es and Uses by Major Funds and Non-major Funds in the Aggregate
2018 Approved General Government Operating Budget
II - 15
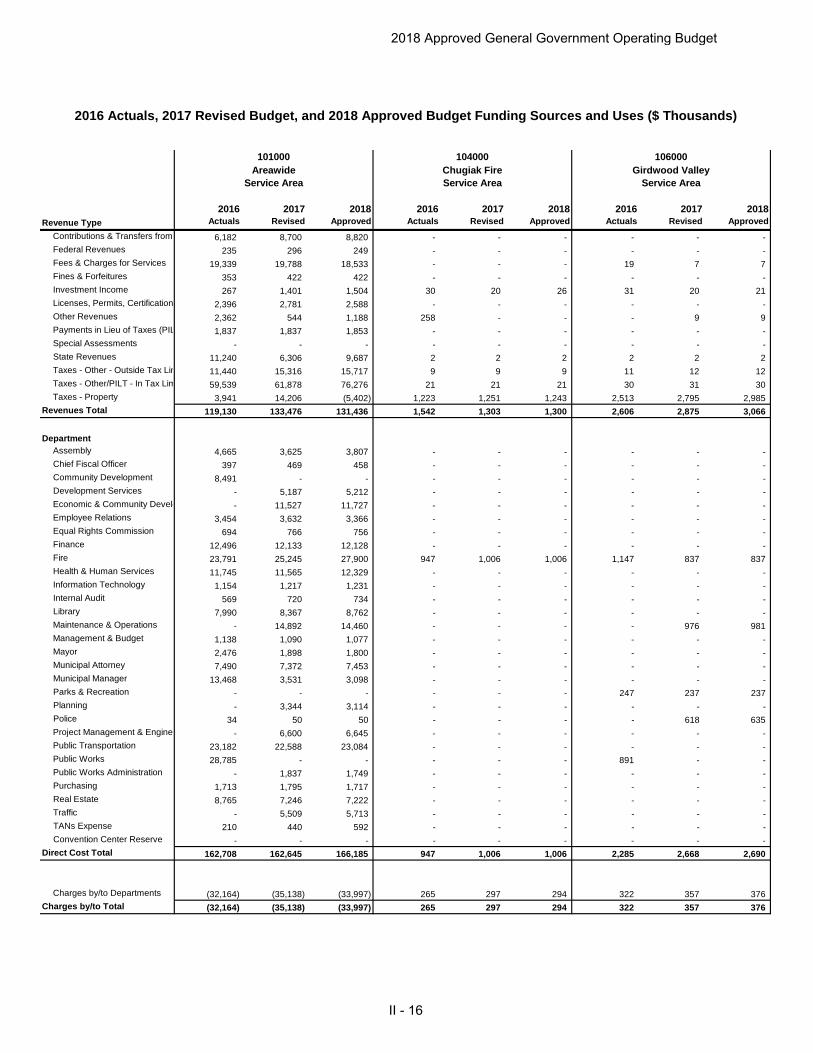
2016 Actuals, 2017 Revised Budget, and 2018 Approved Budget Funding Sources and Uses ($ Thousands)
2016 2017 2018 2016 2017 2018 2016 2017 2018Revenue Type Actuals Revised Approved Actuals Revised Approved Actuals Revised Approved
Contributions & Transfers from 6,182 8,700 8,820 - - - - - - Federal Revenues 235 296 249 - - - - - - Fees & Charges for Services 19,339 19,788 18,533 - - - 19 7 7 Fines & Forfeitures 353 422 422 - - - - - - Investment Income 267 1,401 1,504 30 20 26 31 20 21 Licenses, Permits, Certifications 2,396 2,781 2,588 - - - - - - Other Revenues 2,362 544 1,188 258 - - - 9 9 Payments in Lieu of Taxes (PIL 1,837 1,837 1,853 - - - - - - Special Assessments - - - - - - - - - State Revenues 11,240 6,306 9,687 2 2 2 2 2 2 Taxes - Other - Outside Tax Lim 11,440 15,316 15,717 9 9 9 11 12 12 Taxes - Other/PILT - In Tax Lim 59,539 61,878 76,276 21 21 21 30 31 30 Taxes - Property 3,941 14,206 (5,402) 1,223 1,251 1,243 2,513 2,795 2,985
Revenues Total 119,130 133,476 131,436 1,542 1,303 1,300 2,606 2,875 3,066
DepartmentAssembly 4,665 3,625 3,807 - - - - - - Chief Fiscal Officer 397 469 458 - - - - - - Community Development 8,491 - - - - - - - - Development Services - 5,187 5,212 - - - - - - Economic & Community Develo - 11,527 11,727 - - - - - - Employee Relations 3,454 3,632 3,366 - - - - - - Equal Rights Commission 694 766 756 - - - - - - Finance 12,496 12,133 12,128 - - - - - - Fire 23,791 25,245 27,900 947 1,006 1,006 1,147 837 837 Health & Human Services 11,745 11,565 12,329 - - - - - - Information Technology 1,154 1,217 1,231 - - - - - - Internal Audit 569 720 734 - - - - - - Library 7,990 8,367 8,762 - - - - - - Maintenance & Operations - 14,892 14,460 - - - - 976 981 Management & Budget 1,138 1,090 1,077 - - - - - - Mayor 2,476 1,898 1,800 - - - - - - Municipal Attorney 7,490 7,372 7,453 - - - - - - Municipal Manager 13,468 3,531 3,098 - - - - - - Parks & Recreation - - - - - - 247 237 237 Planning - 3,344 3,114 - - - - - - Police 34 50 50 - - - - 618 635 Project Management & Enginee - 6,600 6,645 - - - - - - Public Transportation 23,182 22,588 23,084 - - - - - - Public Works 28,785 - - - - - 891 - - Public Works Administration - 1,837 1,749 - - - - - - Purchasing 1,713 1,795 1,717 - - - - - - Real Estate 8,765 7,246 7,222 - - - - - - Traffic - 5,509 5,713 - - - - - - TANs Expense 210 440 592 - - - - - - Convention Center Reserve - - - - - - - - -
Direct Cost Total 162,708 162,645 166,185 947 1,006 1,006 2,285 2,668 2,690
Charges by/to Departments (32,164) (35,138) (33,997) 265 297 294 322 357 376 Charges by/to Total (32,164) (35,138) (33,997) 265 297 294 322 357 376
101000Areawide
Service Area
106000Girdwood Valley
Service Area
104000Chugiak FireService Area
2018 Approved General Government Operating Budget
II - 16
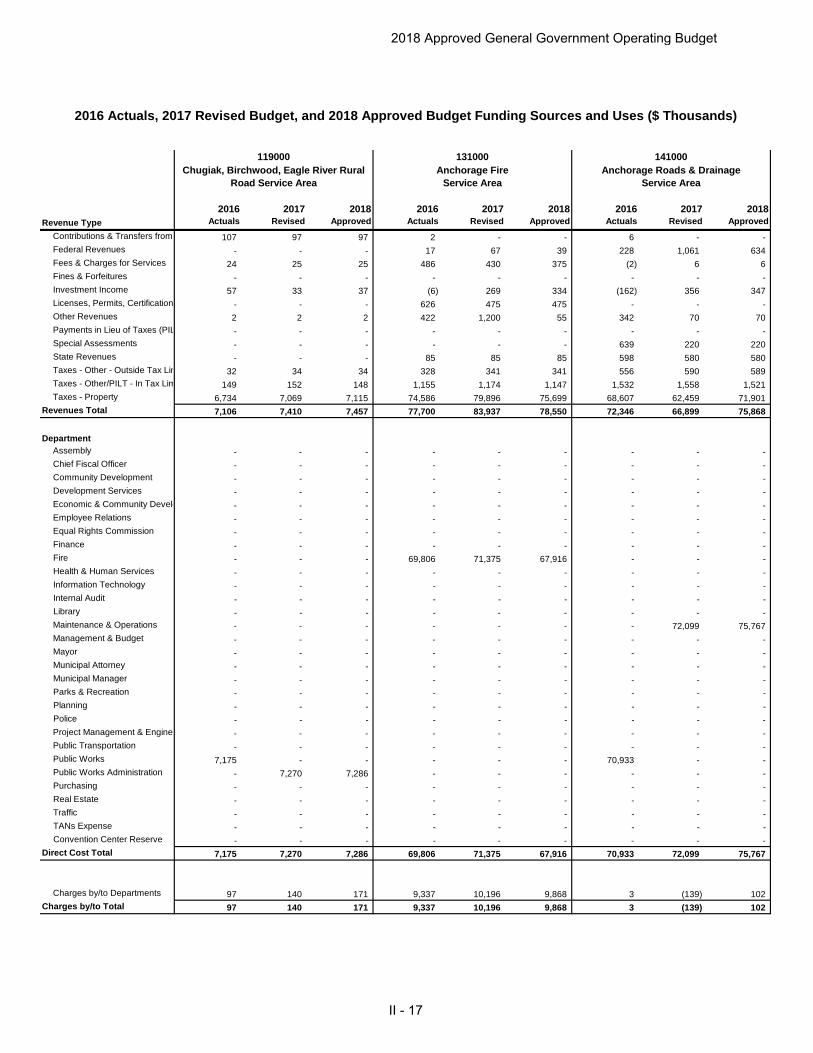
2016 Actuals, 2017 Revised Budget, and 2018 Approved Budget Funding Sources and Uses ($ Thousands)
2016 2017 2018 2016 2017 2018 2016 2017 2018Revenue Type Actuals Revised Approved Actuals Revised Approved Actuals Revised Approved
Contributions & Transfers from 107 97 97 2 - - 6 - - Federal Revenues - - - 17 67 39 228 1,061 634 Fees & Charges for Services 24 25 25 486 430 375 (2) 6 6 Fines & Forfeitures - - - - - - - - - Investment Income 57 33 37 (6) 269 334 (162) 356 347 Licenses, Permits, Certifications - - - 626 475 475 - - - Other Revenues 2 2 2 422 1,200 55 342 70 70 Payments in Lieu of Taxes (PIL - - - - - - - - - Special Assessments - - - - - - 639 220 220 State Revenues - - - 85 85 85 598 580 580 Taxes - Other - Outside Tax Lim 32 34 34 328 341 341 556 590 589 Taxes - Other/PILT - In Tax Lim 149 152 148 1,155 1,174 1,147 1,532 1,558 1,521 Taxes - Property 6,734 7,069 7,115 74,586 79,896 75,699 68,607 62,459 71,901
Revenues Total 7,106 7,410 7,457 77,700 83,937 78,550 72,346 66,899 75,868
DepartmentAssembly - - - - - - - - - Chief Fiscal Officer - - - - - - - - - Community Development - - - - - - - - - Development Services - - - - - - - - - Economic & Community Develo - - - - - - - - - Employee Relations - - - - - - - - - Equal Rights Commission - - - - - - - - - Finance - - - - - - - - - Fire - - - 69,806 71,375 67,916 - - - Health & Human Services - - - - - - - - - Information Technology - - - - - - - - - Internal Audit - - - - - - - - - Library - - - - - - - - - Maintenance & Operations - - - - - - - 72,099 75,767 Management & Budget - - - - - - - - - Mayor - - - - - - - - - Municipal Attorney - - - - - - - - - Municipal Manager - - - - - - - - - Parks & Recreation - - - - - - - - - Planning - - - - - - - - - Police - - - - - - - - - Project Management & Enginee - - - - - - - - - Public Transportation - - - - - - - - - Public Works 7,175 - - - - - 70,933 - - Public Works Administration - 7,270 7,286 - - - - - - Purchasing - - - - - - - - - Real Estate - - - - - - - - - Traffic - - - - - - - - - TANs Expense - - - - - - - - - Convention Center Reserve - - - - - - - - -
Direct Cost Total 7,175 7,270 7,286 69,806 71,375 67,916 70,933 72,099 75,767
Charges by/to Departments 97 140 171 9,337 10,196 9,868 3 (139) 102 Charges by/to Total 97 140 171 9,337 10,196 9,868 3 (139) 102
119000 131000 141000Chugiak, Birchwood, Eagle River Rural
Road Service AreaAnchorage Fire
Service AreaAnchorage Roads & Drainage
Service Area
2018 Approved General Government Operating Budget
II - 17
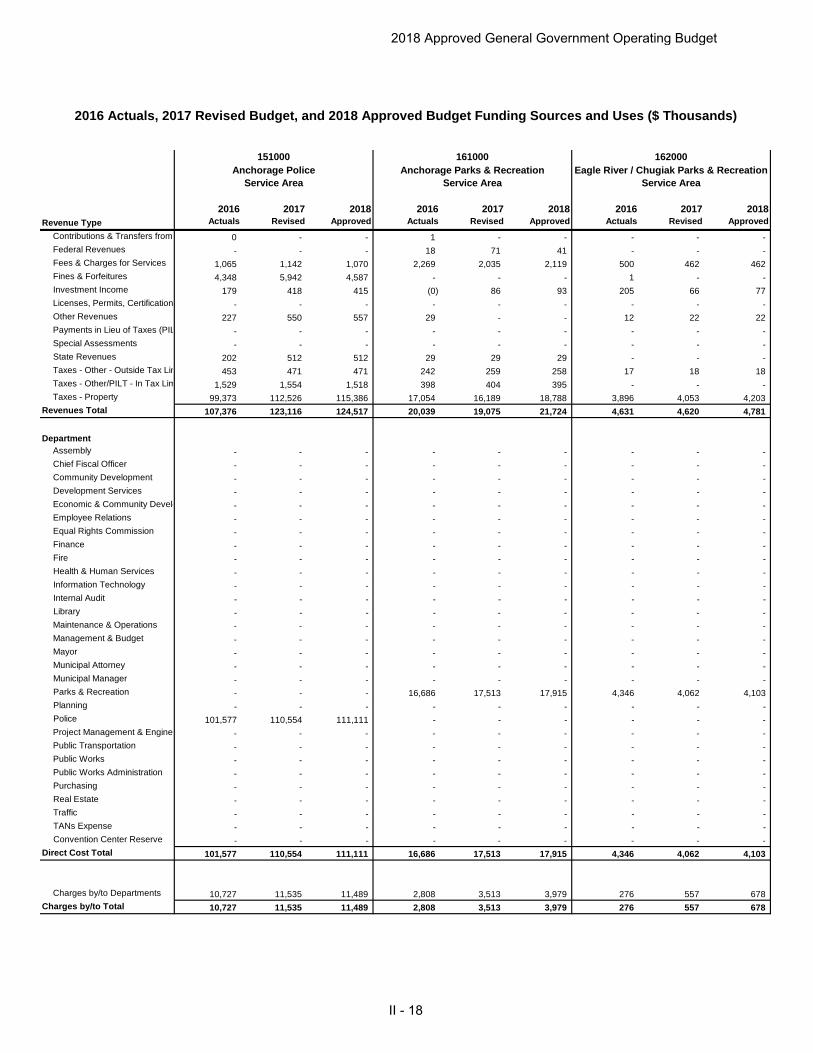
2016 Actuals, 2017 Revised Budget, and 2018 Approved Budget Funding Sources and Uses ($ Thousands)
2016 2017 2018 2016 2017 2018 2016 2017 2018Revenue Type Actuals Revised Approved Actuals Revised Approved Actuals Revised Approved
Contributions & Transfers from 0 - - 1 - - - - - Federal Revenues - - - 18 71 41 - - - Fees & Charges for Services 1,065 1,142 1,070 2,269 2,035 2,119 500 462 462 Fines & Forfeitures 4,348 5,942 4,587 - - - 1 - - Investment Income 179 418 415 (0) 86 93 205 66 77 Licenses, Permits, Certifications - - - - - - - - - Other Revenues 227 550 557 29 - - 12 22 22 Payments in Lieu of Taxes (PIL - - - - - - - - - Special Assessments - - - - - - - - - State Revenues 202 512 512 29 29 29 - - - Taxes - Other - Outside Tax Lim 453 471 471 242 259 258 17 18 18 Taxes - Other/PILT - In Tax Lim 1,529 1,554 1,518 398 404 395 - - - Taxes - Property 99,373 112,526 115,386 17,054 16,189 18,788 3,896 4,053 4,203
Revenues Total 107,376 123,116 124,517 20,039 19,075 21,724 4,631 4,620 4,781
DepartmentAssembly - - - - - - - - - Chief Fiscal Officer - - - - - - - - - Community Development - - - - - - - - - Development Services - - - - - - - - - Economic & Community Develo - - - - - - - - - Employee Relations - - - - - - - - - Equal Rights Commission - - - - - - - - - Finance - - - - - - - - - Fire - - - - - - - - - Health & Human Services - - - - - - - - - Information Technology - - - - - - - - - Internal Audit - - - - - - - - - Library - - - - - - - - - Maintenance & Operations - - - - - - - - - Management & Budget - - - - - - - - - Mayor - - - - - - - - - Municipal Attorney - - - - - - - - - Municipal Manager - - - - - - - - - Parks & Recreation - - - 16,686 17,513 17,915 4,346 4,062 4,103 Planning - - - - - - - - - Police 101,577 110,554 111,111 - - - - - - Project Management & Enginee - - - - - - - - - Public Transportation - - - - - - - - - Public Works - - - - - - - - - Public Works Administration - - - - - - - - - Purchasing - - - - - - - - - Real Estate - - - - - - - - - Traffic - - - - - - - - - TANs Expense - - - - - - - - - Convention Center Reserve - - - - - - - - -
Direct Cost Total 101,577 110,554 111,111 16,686 17,513 17,915 4,346 4,062 4,103
Charges by/to Departments 10,727 11,535 11,489 2,808 3,513 3,979 276 557 678 Charges by/to Total 10,727 11,535 11,489 2,808 3,513 3,979 276 557 678
151000 161000 162000Anchorage Police
Service AreaAnchorage Parks & Recreation
Service AreaEagle River / Chugiak Parks & Recreation
Service Area
2018 Approved General Government Operating Budget
II - 18
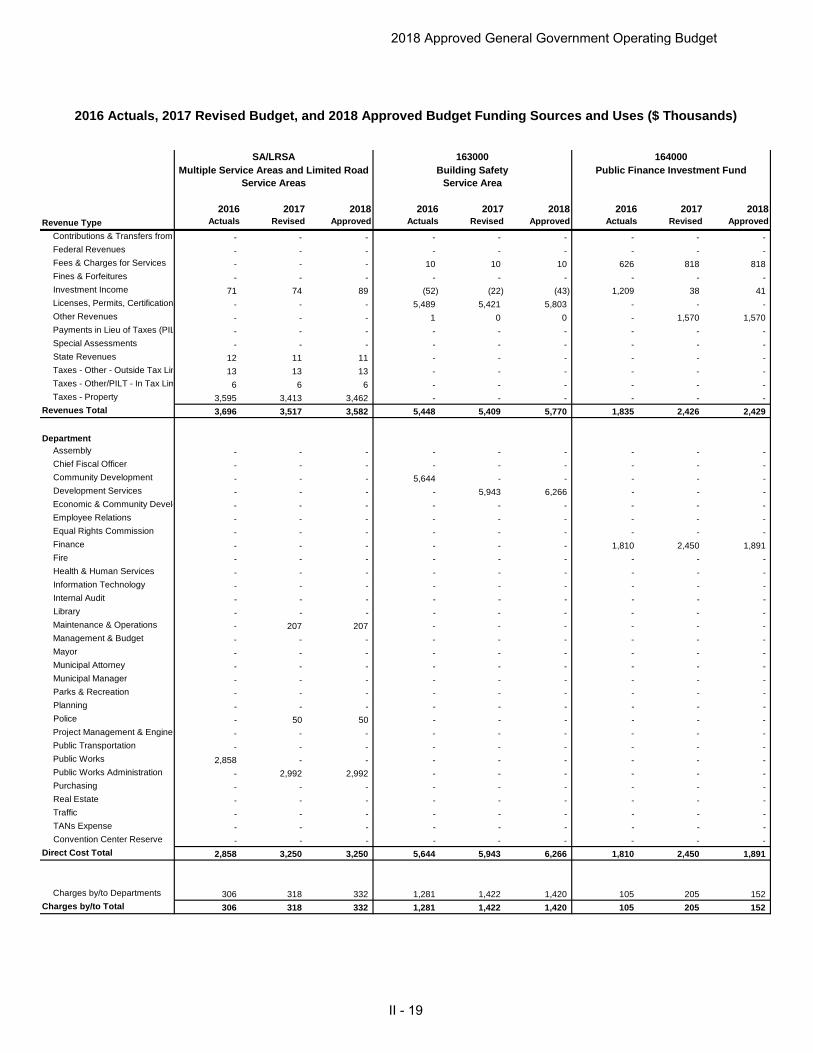
2016 Actuals, 2017 Revised Budget, and 2018 Approved Budget Funding Sources and Uses ($ Thousands)
2016 2017 2018 2016 2017 2018 2016 2017 2018Revenue Type Actuals Revised Approved Actuals Revised Approved Actuals Revised Approved
Contributions & Transfers from - - - - - - - - - Federal Revenues - - - - - - - - - Fees & Charges for Services - - - 10 10 10 626 818 818 Fines & Forfeitures - - - - - - - - - Investment Income 71 74 89 (52) (22) (43) 1,209 38 41 Licenses, Permits, Certifications - - - 5,489 5,421 5,803 - - - Other Revenues - - - 1 0 0 - 1,570 1,570 Payments in Lieu of Taxes (PIL - - - - - - - - - Special Assessments - - - - - - - - - State Revenues 12 11 11 - - - - - - Taxes - Other - Outside Tax Lim 13 13 13 - - - - - - Taxes - Other/PILT - In Tax Lim 6 6 6 - - - - - - Taxes - Property 3,595 3,413 3,462 - - - - - -
Revenues Total 3,696 3,517 3,582 5,448 5,409 5,770 1,835 2,426 2,429
DepartmentAssembly - - - - - - - - - Chief Fiscal Officer - - - - - - - - - Community Development - - - 5,644 - - - - - Development Services - - - - 5,943 6,266 - - - Economic & Community Develo - - - - - - - - - Employee Relations - - - - - - - - - Equal Rights Commission - - - - - - - - - Finance - - - - - - 1,810 2,450 1,891 Fire - - - - - - - - - Health & Human Services - - - - - - - - - Information Technology - - - - - - - - - Internal Audit - - - - - - - - - Library - - - - - - - - - Maintenance & Operations - 207 207 - - - - - - Management & Budget - - - - - - - - - Mayor - - - - - - - - - Municipal Attorney - - - - - - - - - Municipal Manager - - - - - - - - - Parks & Recreation - - - - - - - - - Planning - - - - - - - - - Police - 50 50 - - - - - - Project Management & Enginee - - - - - - - - - Public Transportation - - - - - - - - - Public Works 2,858 - - - - - - - - Public Works Administration - 2,992 2,992 - - - - - - Purchasing - - - - - - - - - Real Estate - - - - - - - - - Traffic - - - - - - - - - TANs Expense - - - - - - - - - Convention Center Reserve - - - - - - - - -
Direct Cost Total 2,858 3,250 3,250 5,644 5,943 6,266 1,810 2,450 1,891
Charges by/to Departments 306 318 332 1,281 1,422 1,420 105 205 152 Charges by/to Total 306 318 332 1,281 1,422 1,420 105 205 152
SA/LRSA 163000 164000Multiple Service Areas and Limited Road
Service AreasBuilding Safety
Service AreaPublic Finance Investment Fund
2018 Approved General Government Operating Budget
II - 19
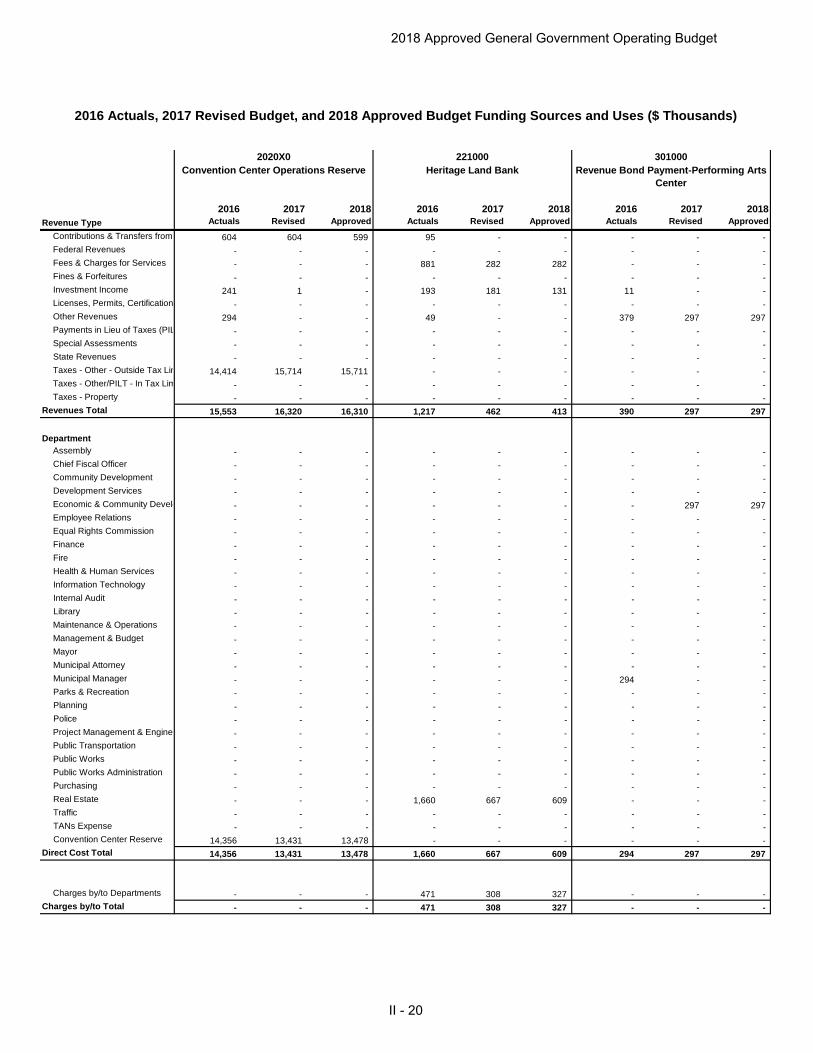
2016 Actuals, 2017 Revised Budget, and 2018 Approved Budget Funding Sources and Uses ($ Thousands)
2016 2017 2018 2016 2017 2018 2016 2017 2018Revenue Type Actuals Revised Approved Actuals Revised Approved Actuals Revised Approved
Contributions & Transfers from 604 604 599 95 - - - - - Federal Revenues - - - - - - - - - Fees & Charges for Services - - - 881 282 282 - - - Fines & Forfeitures - - - - - - - - - Investment Income 241 1 - 193 181 131 11 - - Licenses, Permits, Certifications - - - - - - - - - Other Revenues 294 - - 49 - - 379 297 297 Payments in Lieu of Taxes (PIL - - - - - - - - - Special Assessments - - - - - - - - - State Revenues - - - - - - - - - Taxes - Other - Outside Tax Lim 14,414 15,714 15,711 - - - - - - Taxes - Other/PILT - In Tax Lim - - - - - - - - - Taxes - Property - - - - - - - - -
Revenues Total 15,553 16,320 16,310 1,217 462 413 390 297 297
DepartmentAssembly - - - - - - - - - Chief Fiscal Officer - - - - - - - - - Community Development - - - - - - - - - Development Services - - - - - - - - - Economic & Community Develo - - - - - - - 297 297 Employee Relations - - - - - - - - - Equal Rights Commission - - - - - - - - - Finance - - - - - - - - - Fire - - - - - - - - - Health & Human Services - - - - - - - - - Information Technology - - - - - - - - - Internal Audit - - - - - - - - - Library - - - - - - - - - Maintenance & Operations - - - - - - - - - Management & Budget - - - - - - - - - Mayor - - - - - - - - - Municipal Attorney - - - - - - - - - Municipal Manager - - - - - - 294 - - Parks & Recreation - - - - - - - - - Planning - - - - - - - - - Police - - - - - - - - - Project Management & Enginee - - - - - - - - - Public Transportation - - - - - - - - - Public Works - - - - - - - - - Public Works Administration - - - - - - - - - Purchasing - - - - - - - - - Real Estate - - - 1,660 667 609 - - - Traffic - - - - - - - - - TANs Expense - - - - - - - - - Convention Center Reserve 14,356 13,431 13,478 - - - - - -
Direct Cost Total 14,356 13,431 13,478 1,660 667 609 294 297 297
Charges by/to Departments - - - 471 308 327 - - - Charges by/to Total - - - 471 308 327 - - -
2020X0 221000 301000Convention Center Operations Reserve Heritage Land Bank Revenue Bond Payment-Performing Arts
Center
2018 Approved General Government Operating Budget
II - 20
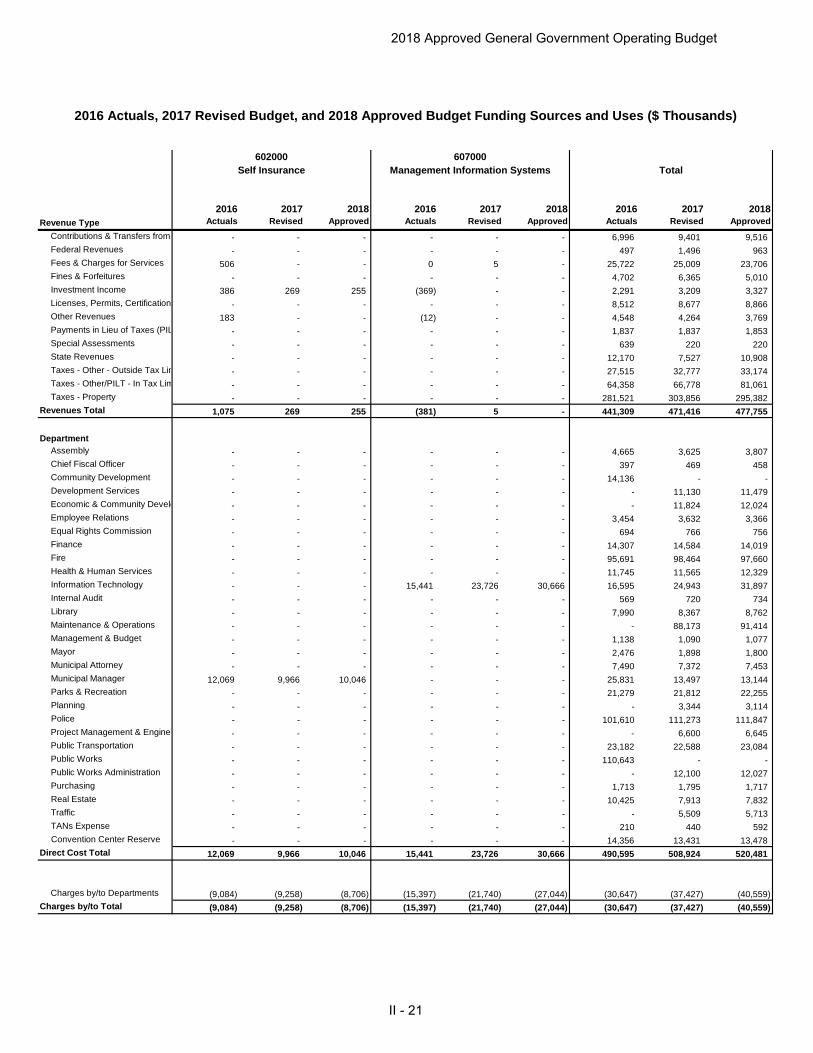
2016 Actuals, 2017 Revised Budget, and 2018 Approved Budget Funding Sources and Uses ($ Thousands)
2016 2017 2018 2016 2017 2018 2016 2017 2018Revenue Type Actuals Revised Approved Actuals Revised Approved Actuals Revised Approved
Contributions & Transfers from - - - - - - 6,996 9,401 9,516 Federal Revenues - - - - - - 497 1,496 963 Fees & Charges for Services 506 - - 0 5 - 25,722 25,009 23,706 Fines & Forfeitures - - - - - - 4,702 6,365 5,010 Investment Income 386 269 255 (369) - - 2,291 3,209 3,327 Licenses, Permits, Certifications - - - - - - 8,512 8,677 8,866 Other Revenues 183 - - (12) - - 4,548 4,264 3,769 Payments in Lieu of Taxes (PIL - - - - - - 1,837 1,837 1,853 Special Assessments - - - - - - 639 220 220 State Revenues - - - - - - 12,170 7,527 10,908 Taxes - Other - Outside Tax Lim - - - - - - 27,515 32,777 33,174 Taxes - Other/PILT - In Tax Lim - - - - - - 64,358 66,778 81,061 Taxes - Property - - - - - - 281,521 303,856 295,382
Revenues Total 1,075 269 255 (381) 5 - 441,309 471,416 477,755
DepartmentAssembly - - - - - - 4,665 3,625 3,807 Chief Fiscal Officer - - - - - - 397 469 458 Community Development - - - - - - 14,136 - - Development Services - - - - - - - 11,130 11,479 Economic & Community Develo - - - - - - - 11,824 12,024 Employee Relations - - - - - - 3,454 3,632 3,366 Equal Rights Commission - - - - - - 694 766 756 Finance - - - - - - 14,307 14,584 14,019 Fire - - - - - - 95,691 98,464 97,660 Health & Human Services - - - - - - 11,745 11,565 12,329 Information Technology - - - 15,441 23,726 30,666 16,595 24,943 31,897 Internal Audit - - - - - - 569 720 734 Library - - - - - - 7,990 8,367 8,762 Maintenance & Operations - - - - - - - 88,173 91,414 Management & Budget - - - - - - 1,138 1,090 1,077 Mayor - - - - - - 2,476 1,898 1,800 Municipal Attorney - - - - - - 7,490 7,372 7,453 Municipal Manager 12,069 9,966 10,046 - - - 25,831 13,497 13,144 Parks & Recreation - - - - - - 21,279 21,812 22,255 Planning - - - - - - - 3,344 3,114 Police - - - - - - 101,610 111,273 111,847 Project Management & Enginee - - - - - - - 6,600 6,645 Public Transportation - - - - - - 23,182 22,588 23,084 Public Works - - - - - - 110,643 - - Public Works Administration - - - - - - - 12,100 12,027 Purchasing - - - - - - 1,713 1,795 1,717 Real Estate - - - - - - 10,425 7,913 7,832 Traffic - - - - - - - 5,509 5,713 TANs Expense - - - - - - 210 440 592 Convention Center Reserve - - - - - - 14,356 13,431 13,478
Direct Cost Total 12,069 9,966 10,046 15,441 23,726 30,666 490,595 508,924 520,481
Charges by/to Departments (9,084) (9,258) (8,706) (15,397) (21,740) (27,044) (30,647) (37,427) (40,559) Charges by/to Total (9,084) (9,258) (8,706) (15,397) (21,740) (27,044) (30,647) (37,427) (40,559)
Total602000 607000
Self Insurance Management Information Systems
2018 Approved General Government Operating Budget
II - 21