Embed Size (px)
Citation preview
Mayfield/EastsideNeighborhood Action
PlanFall Research
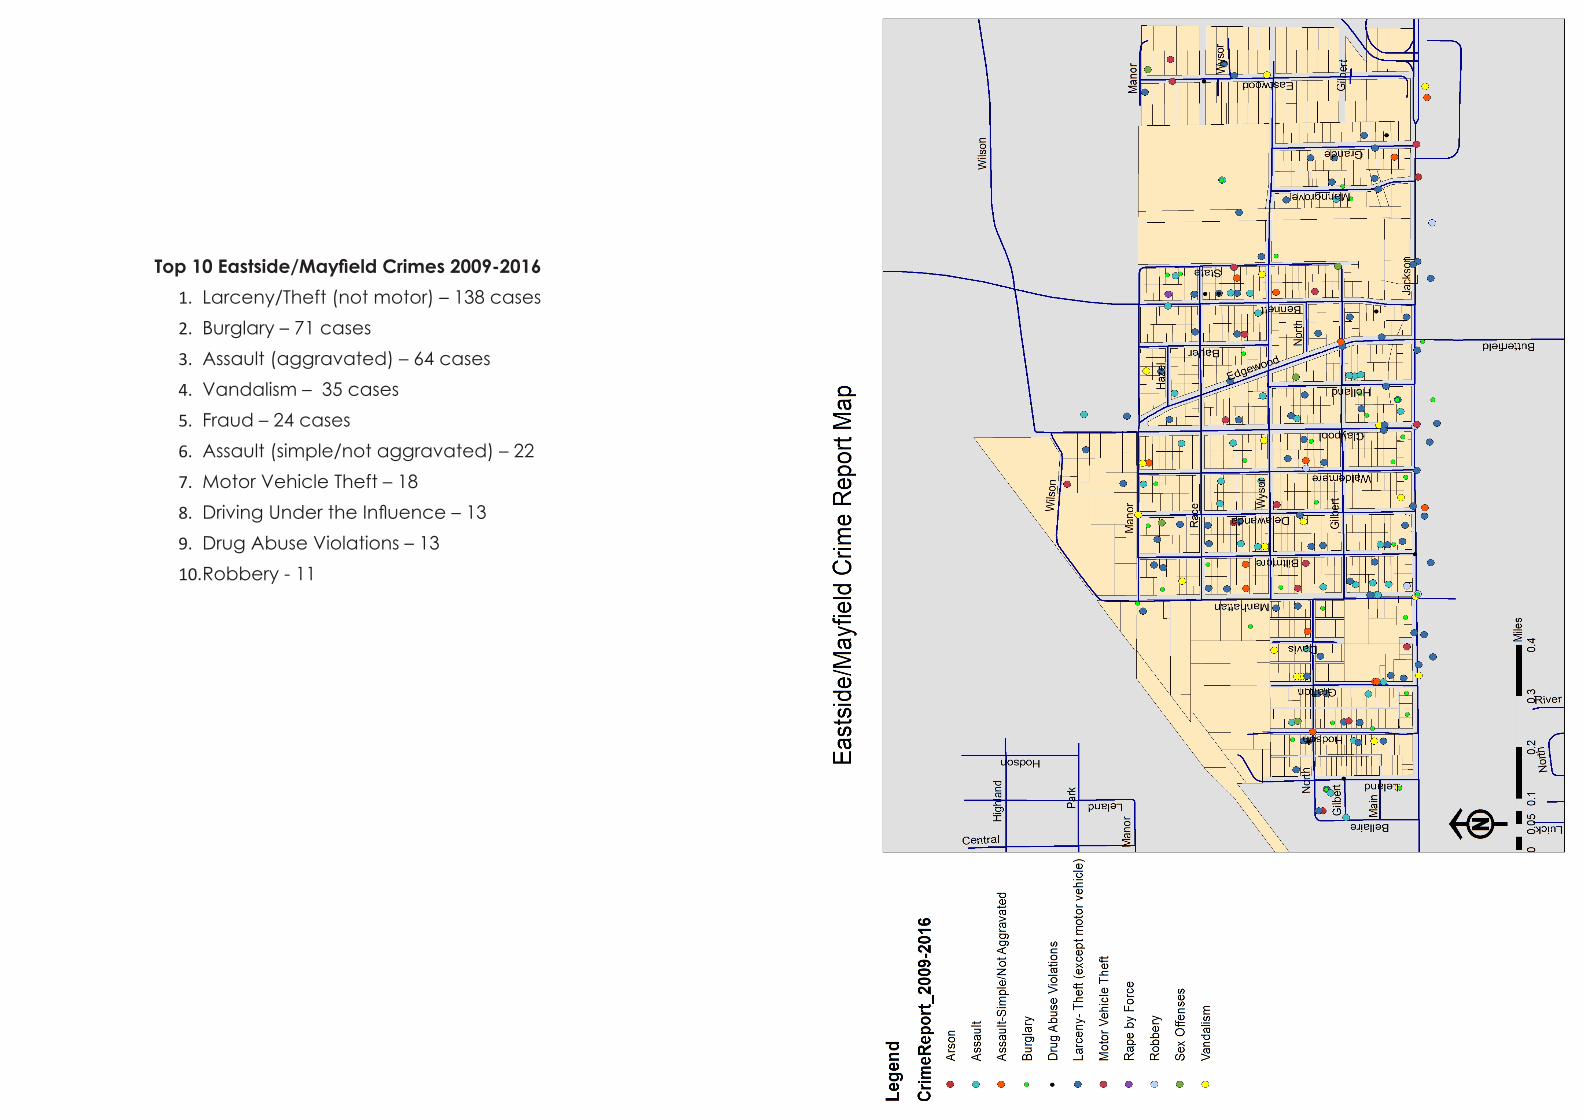
Top 10 Eastside/Mayfield Crimes 2009-20161. Larceny/Theft (not motor) – 138 cases2. Burglary – 71 cases3. Assault (aggravated) – 64 cases4. Vandalism – 35 cases5. Fraud – 24 cases6. Assault (simple/not aggravated) – 227. Motor Vehicle Theft – 188. Driving Under the Influence – 139. Drug Abuse Violations – 1310. Robbery - 11
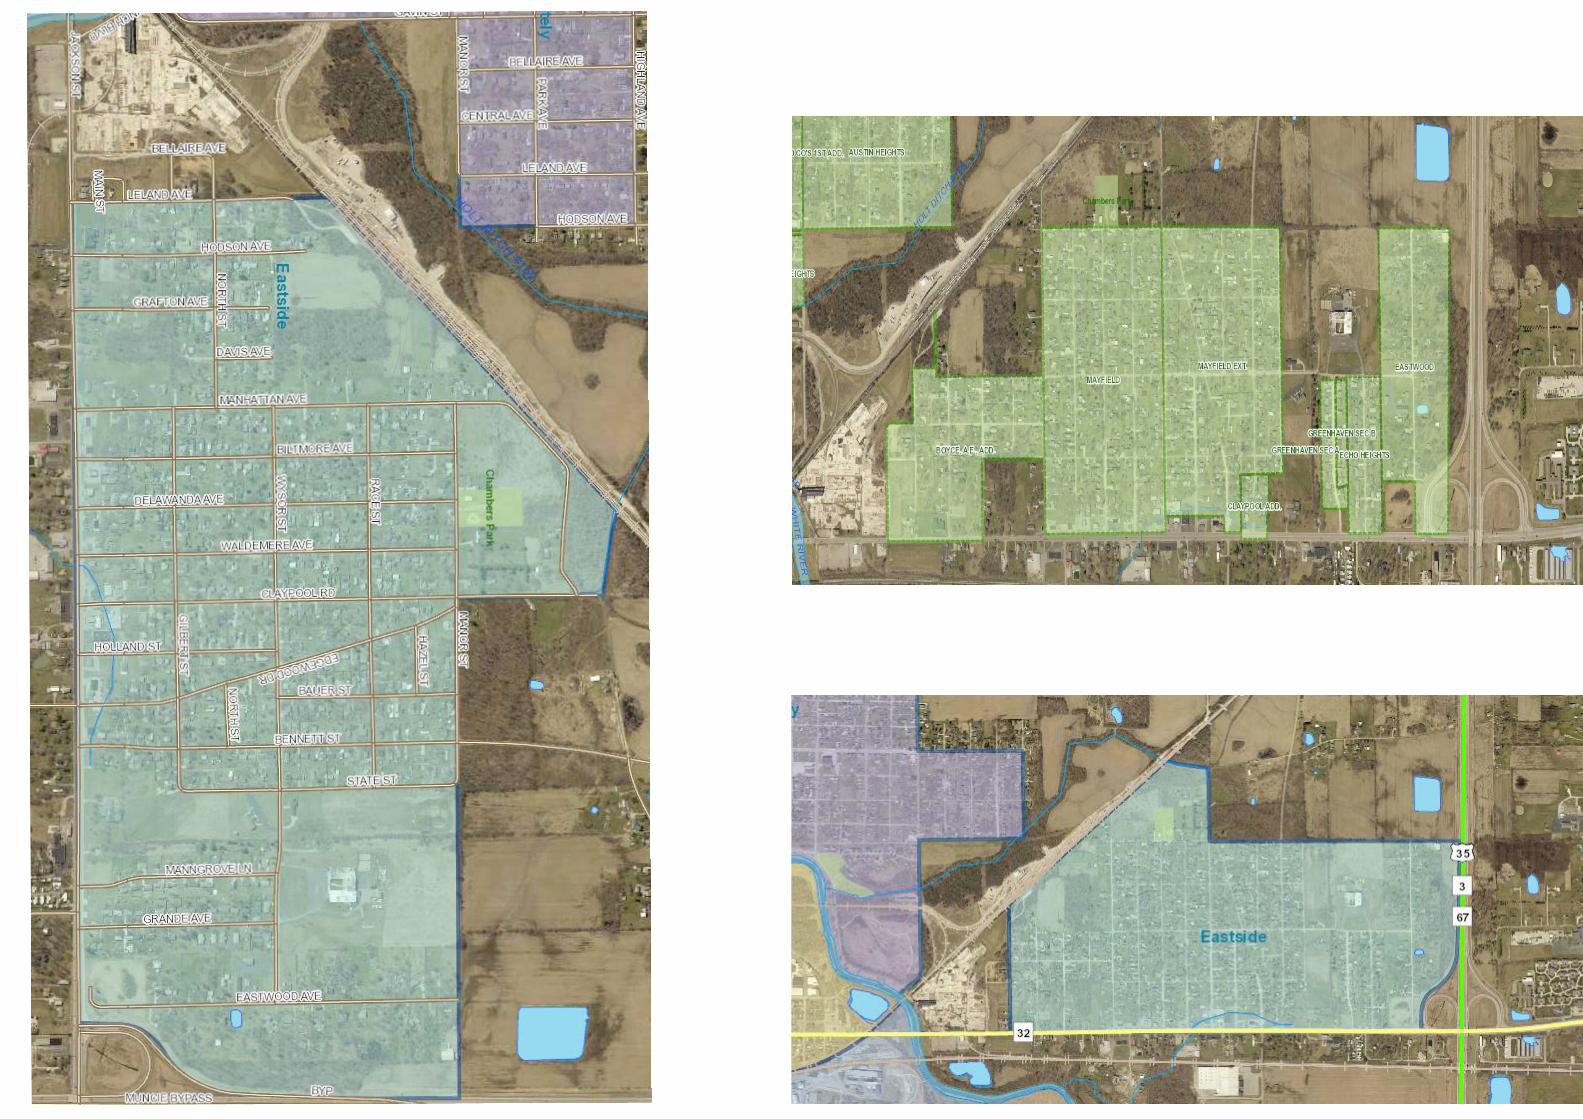
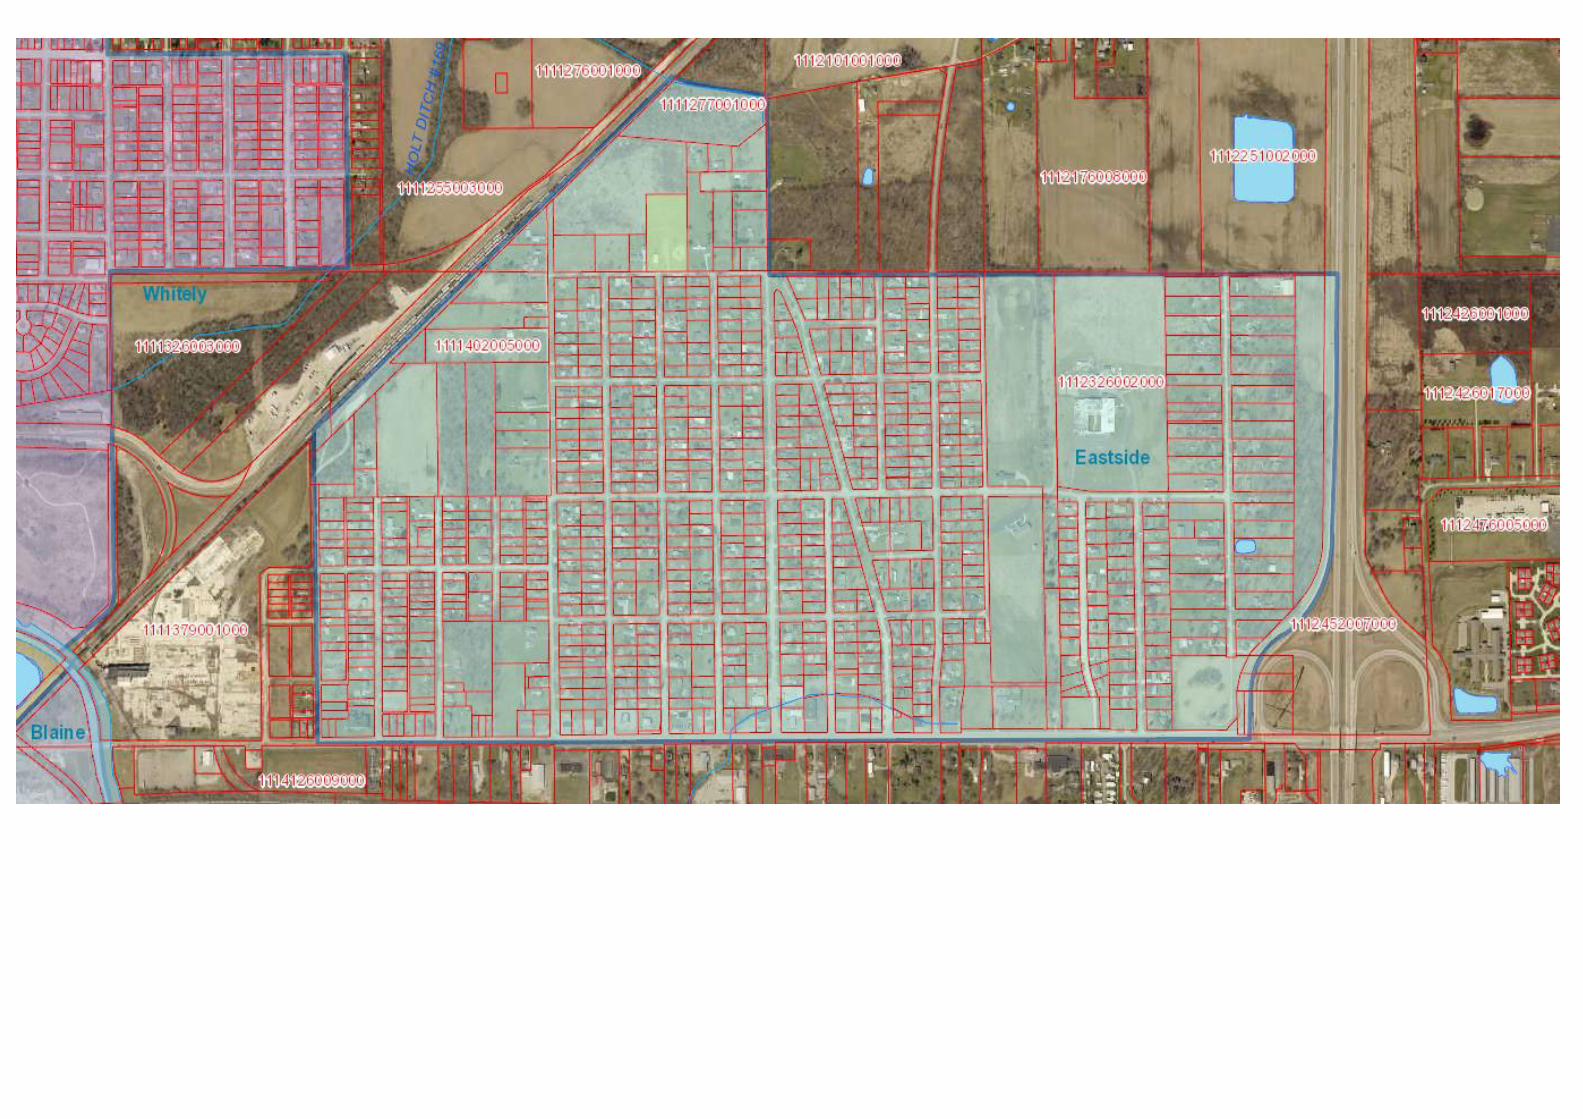
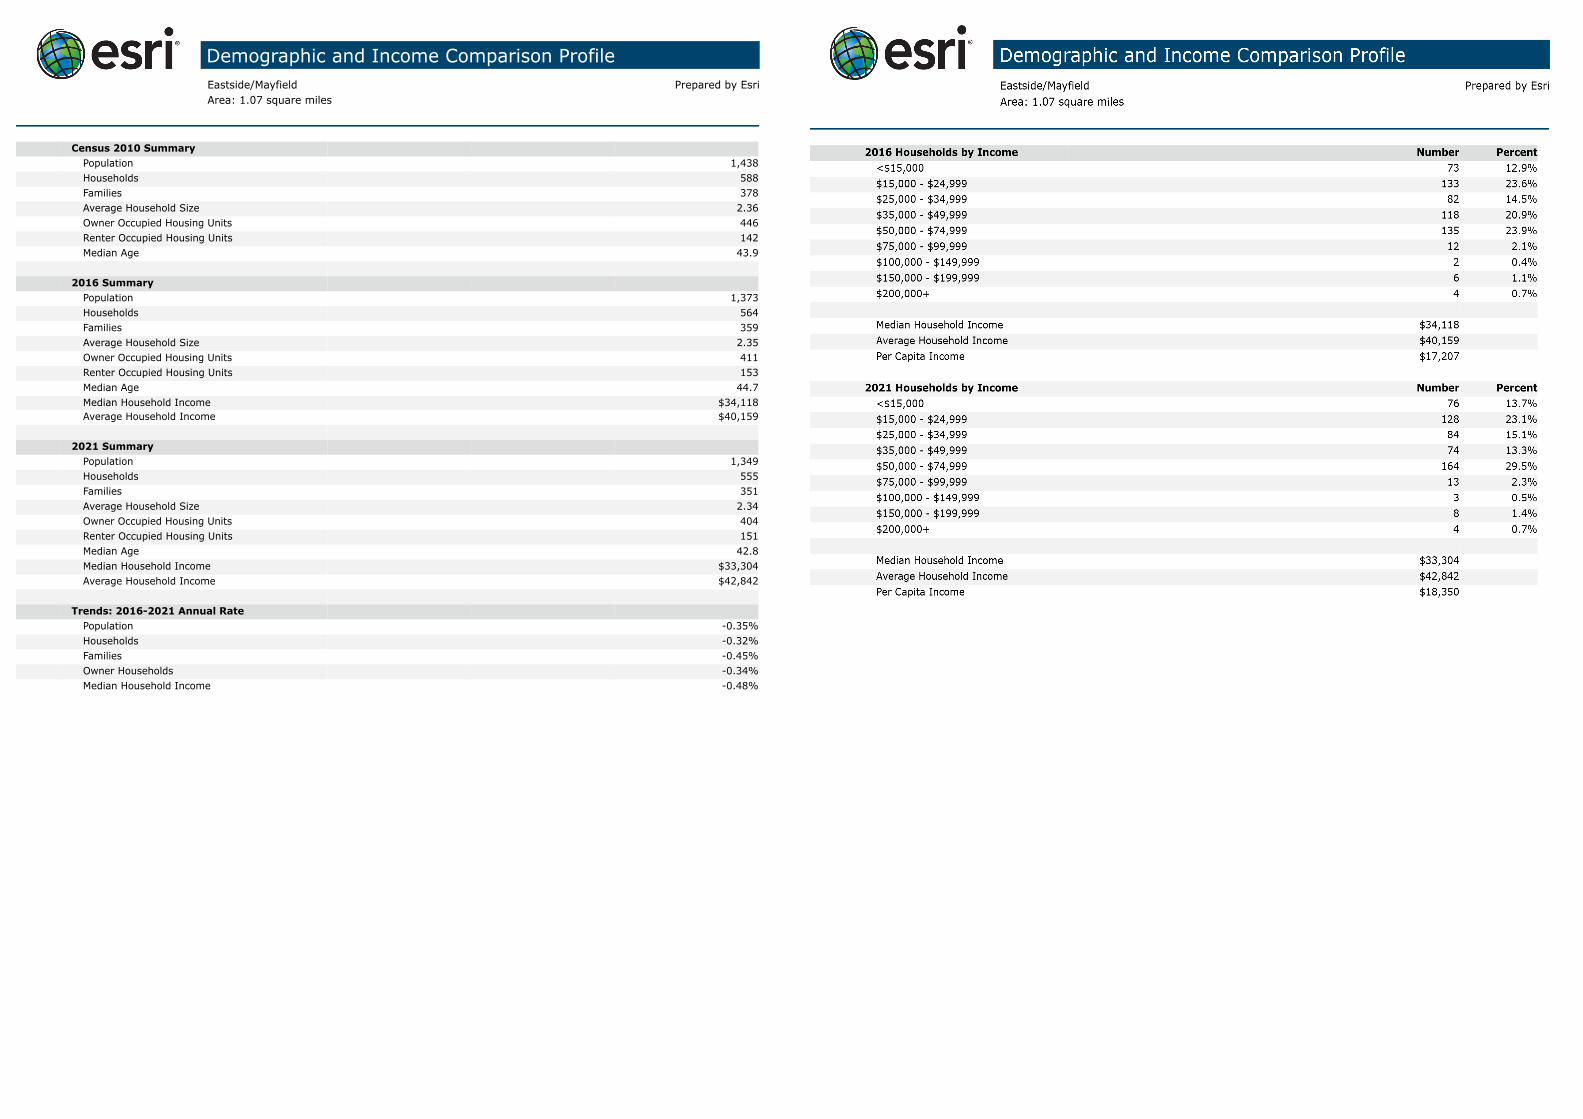
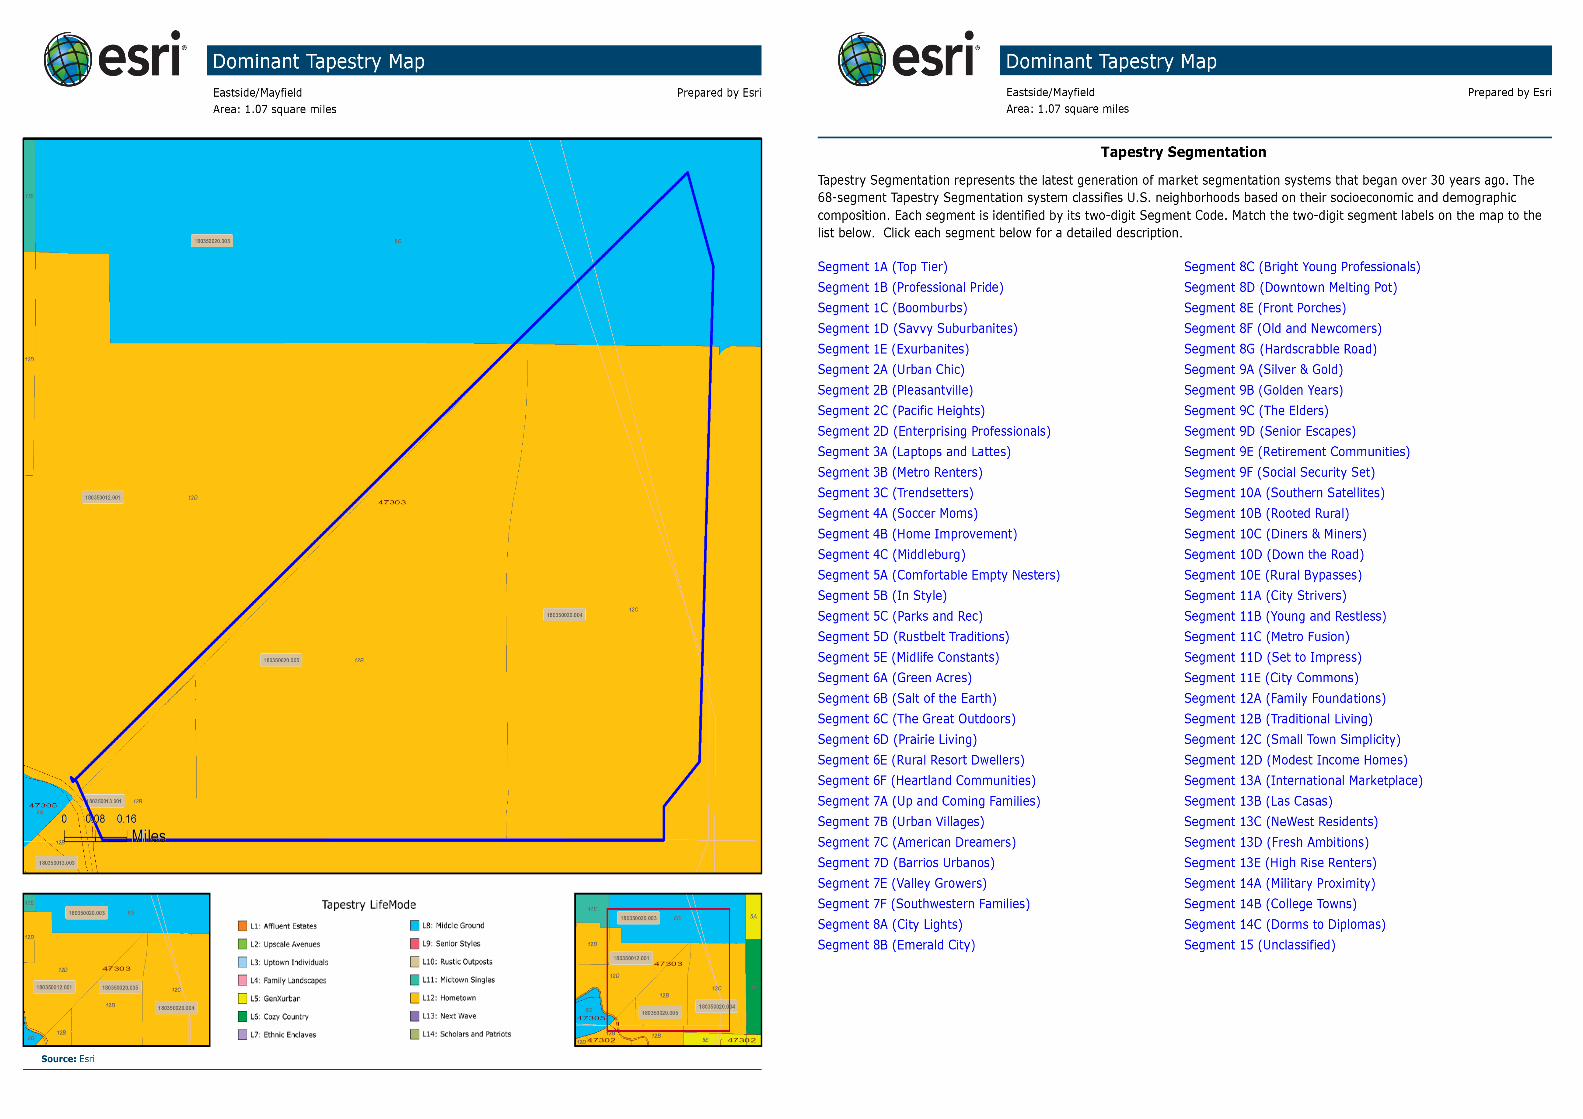
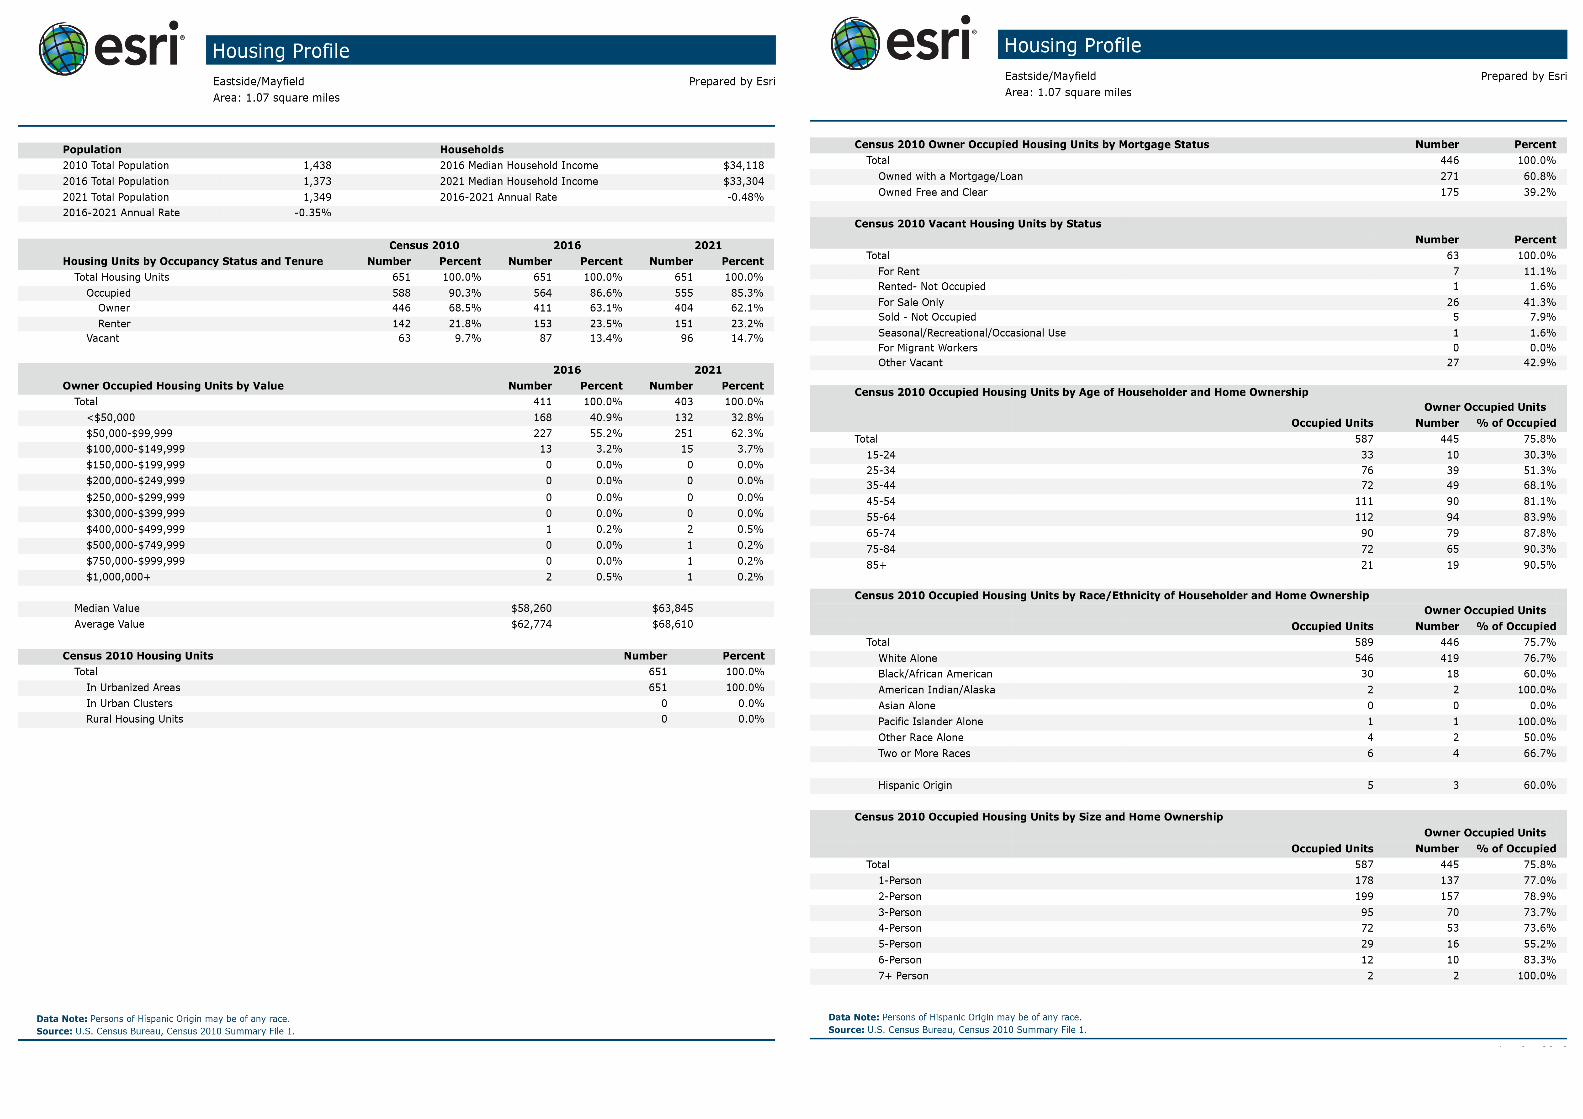
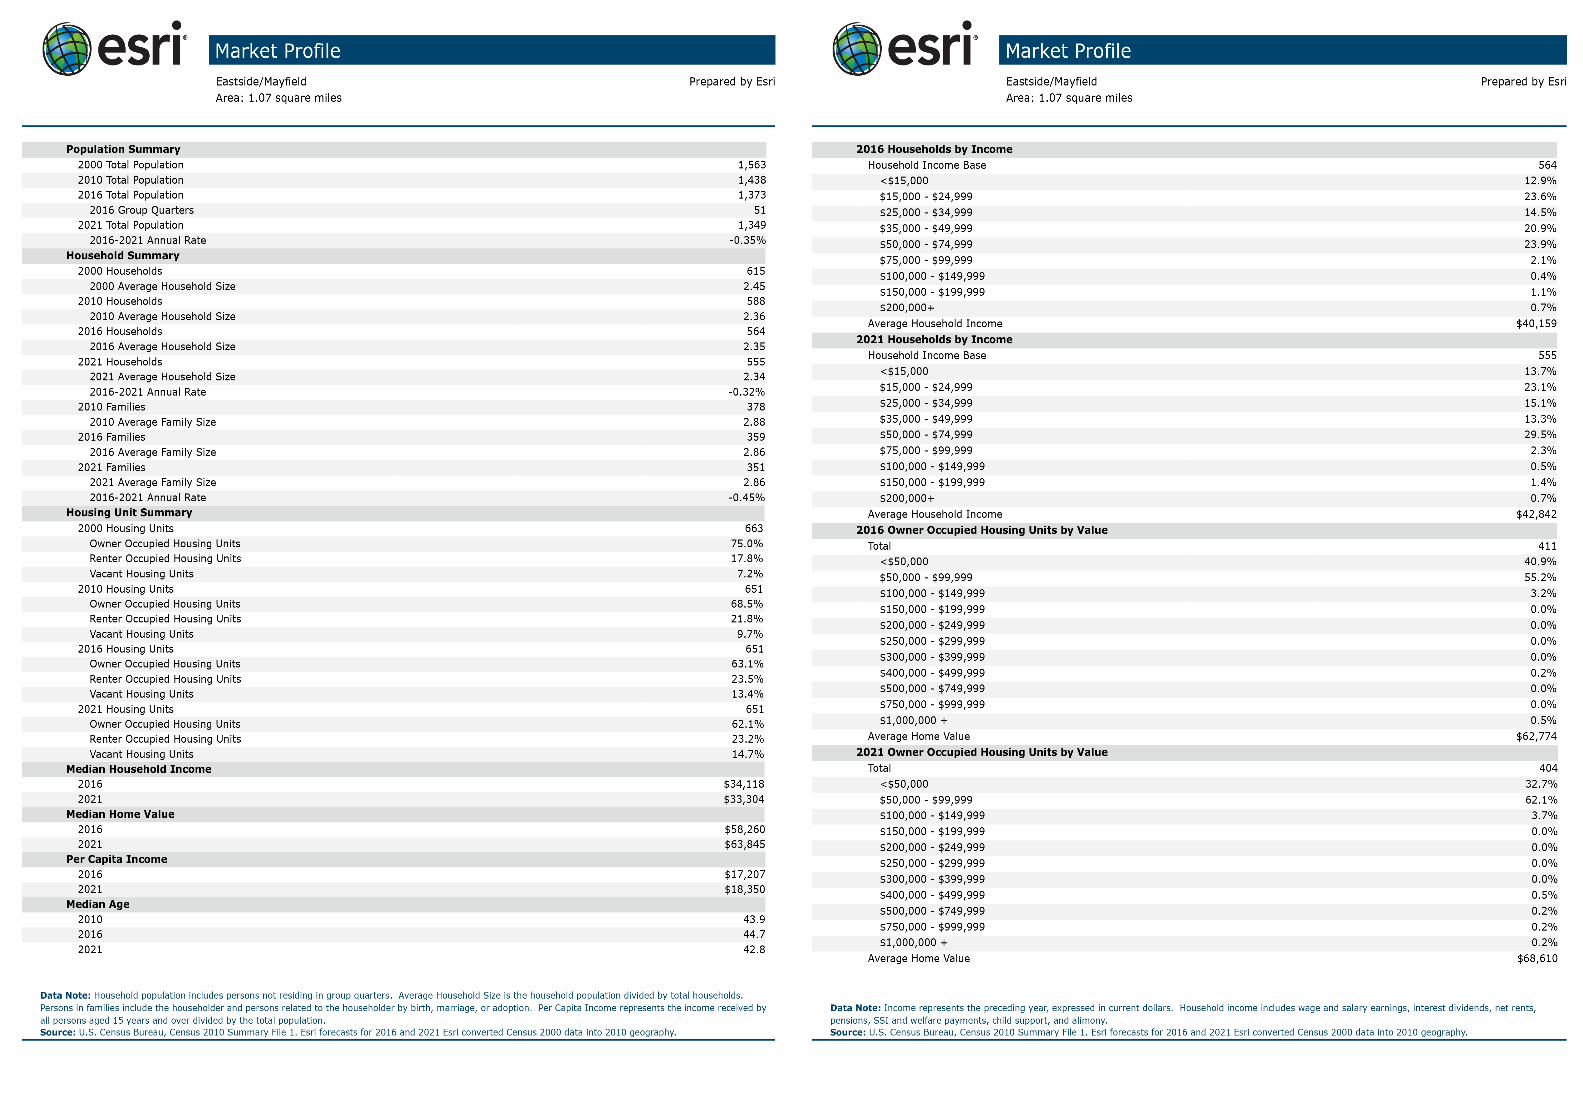
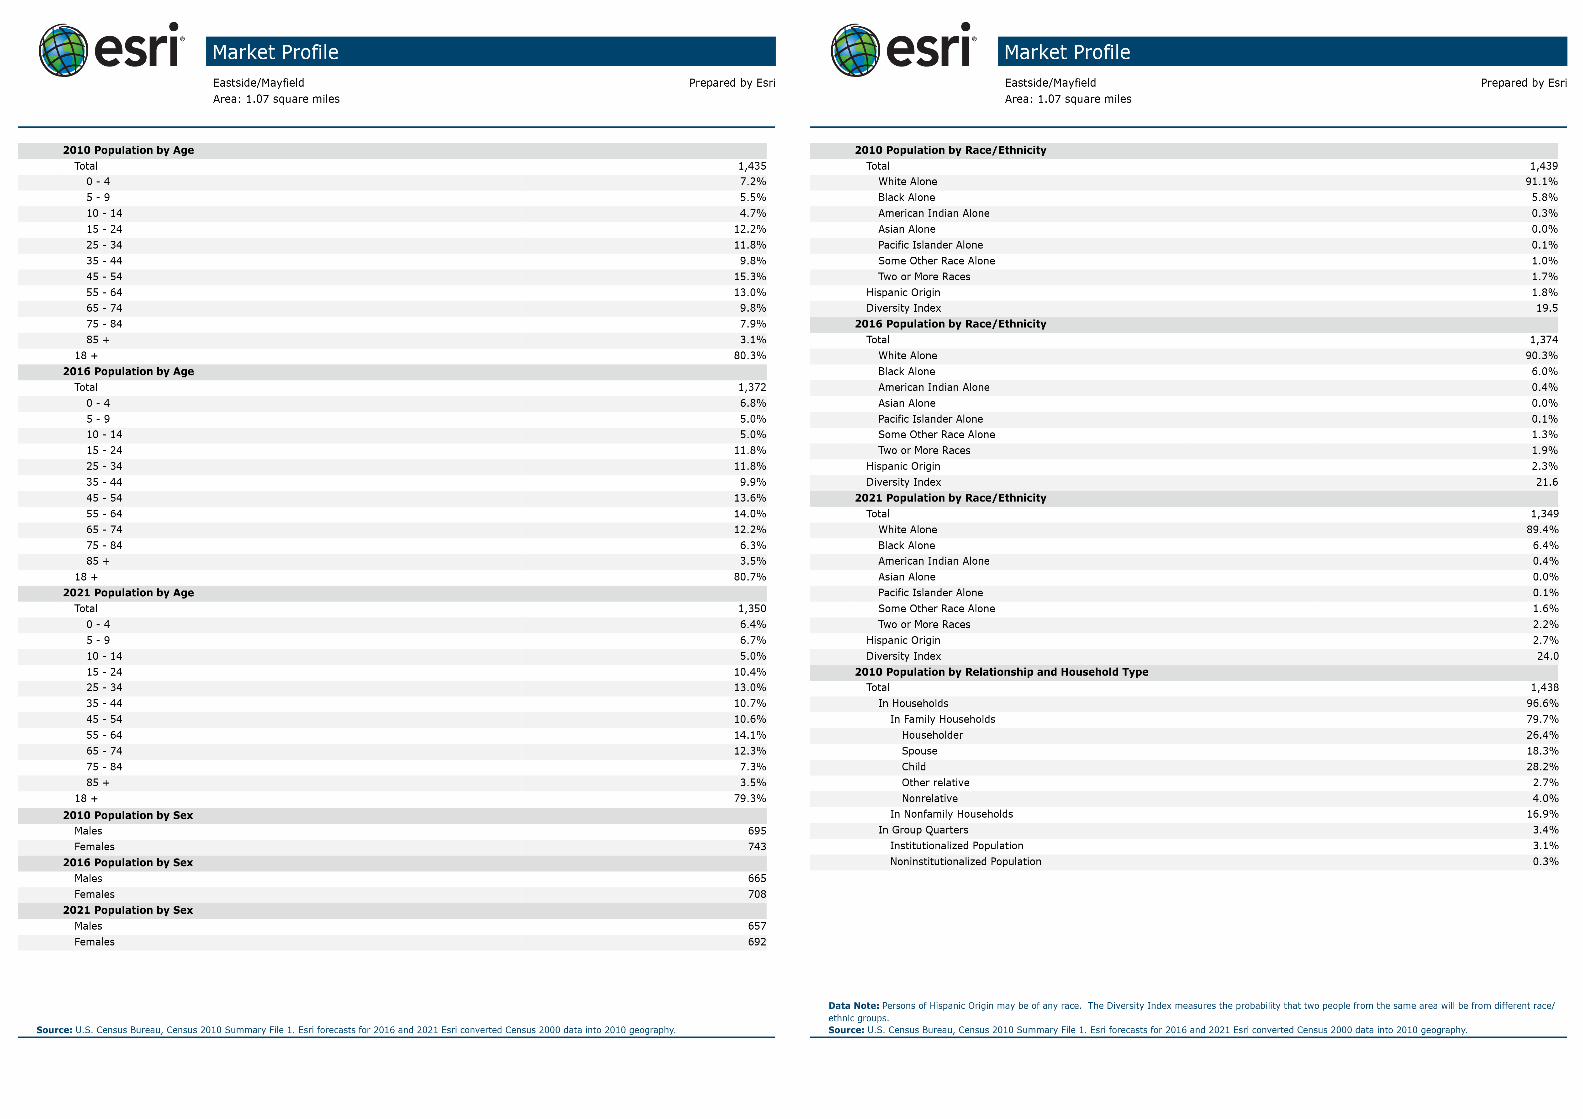
Demographic and Income Comparison ProfileEastside/Mayfield Prepared by EsriArea: 1.07 square miles
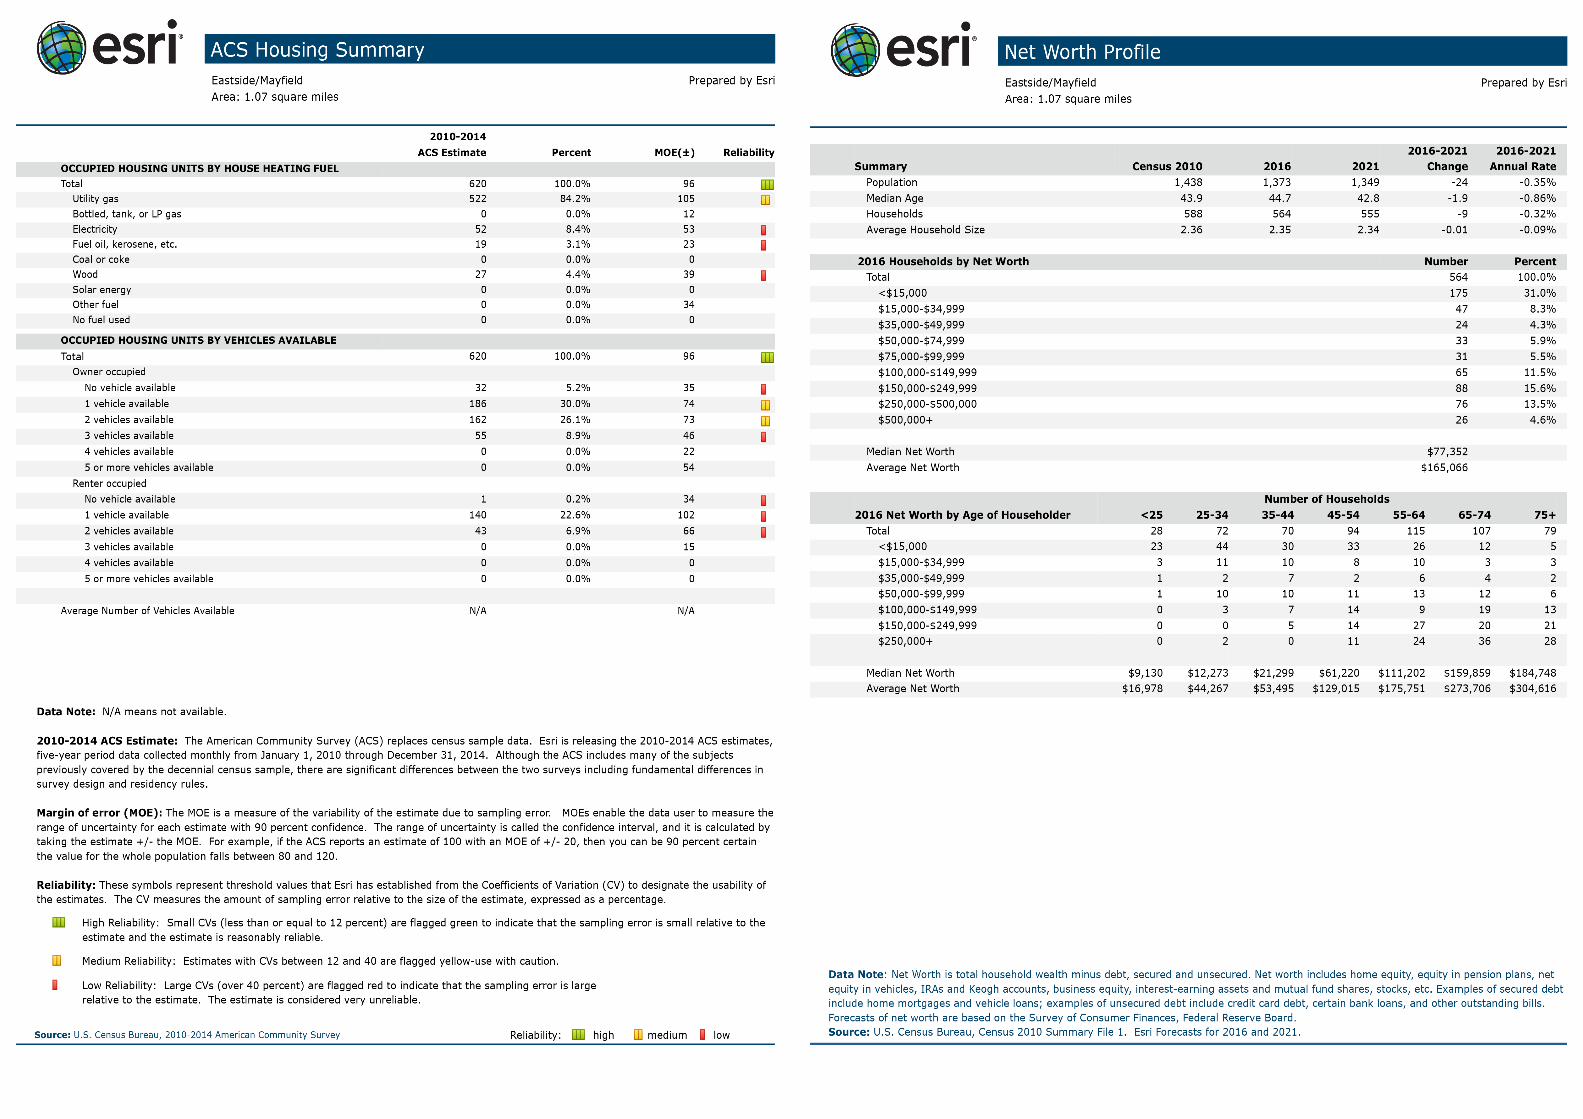
Census 2010 SummaryPopulation 1,438Households 588Families 378Average Household Size 2.36Owner Occupied Housing Units 446Renter Occupied Housing Units 142Median Age 43.9
2016 SummaryPopulation 1,373Households 564Families 359Average Household Size 2.35Owner Occupied Housing Units 411Renter Occupied Housing Units 153Median Age 44.7Median Household Income $34,118Average Household Income $40,159
2021 SummaryPopulation 1,349Households 555Families 351Average Household Size 2.34Owner Occupied Housing Units 404Renter Occupied Housing Units 151Median Age 42.8Median Household Income $33,304Average Household Income $42,842
Trends: 2016-2021 Annual RatePopulation -0.35%Households -0.32%Families -0.45%Owner Households -0.34%Median Household Income -0.48%
Source: U.S. Census Bureau, Census 2010 Summary File 1. Esri forecasts for 2016 and 2021.
December 07, 2016
©2016 Esri Page 1 of 5
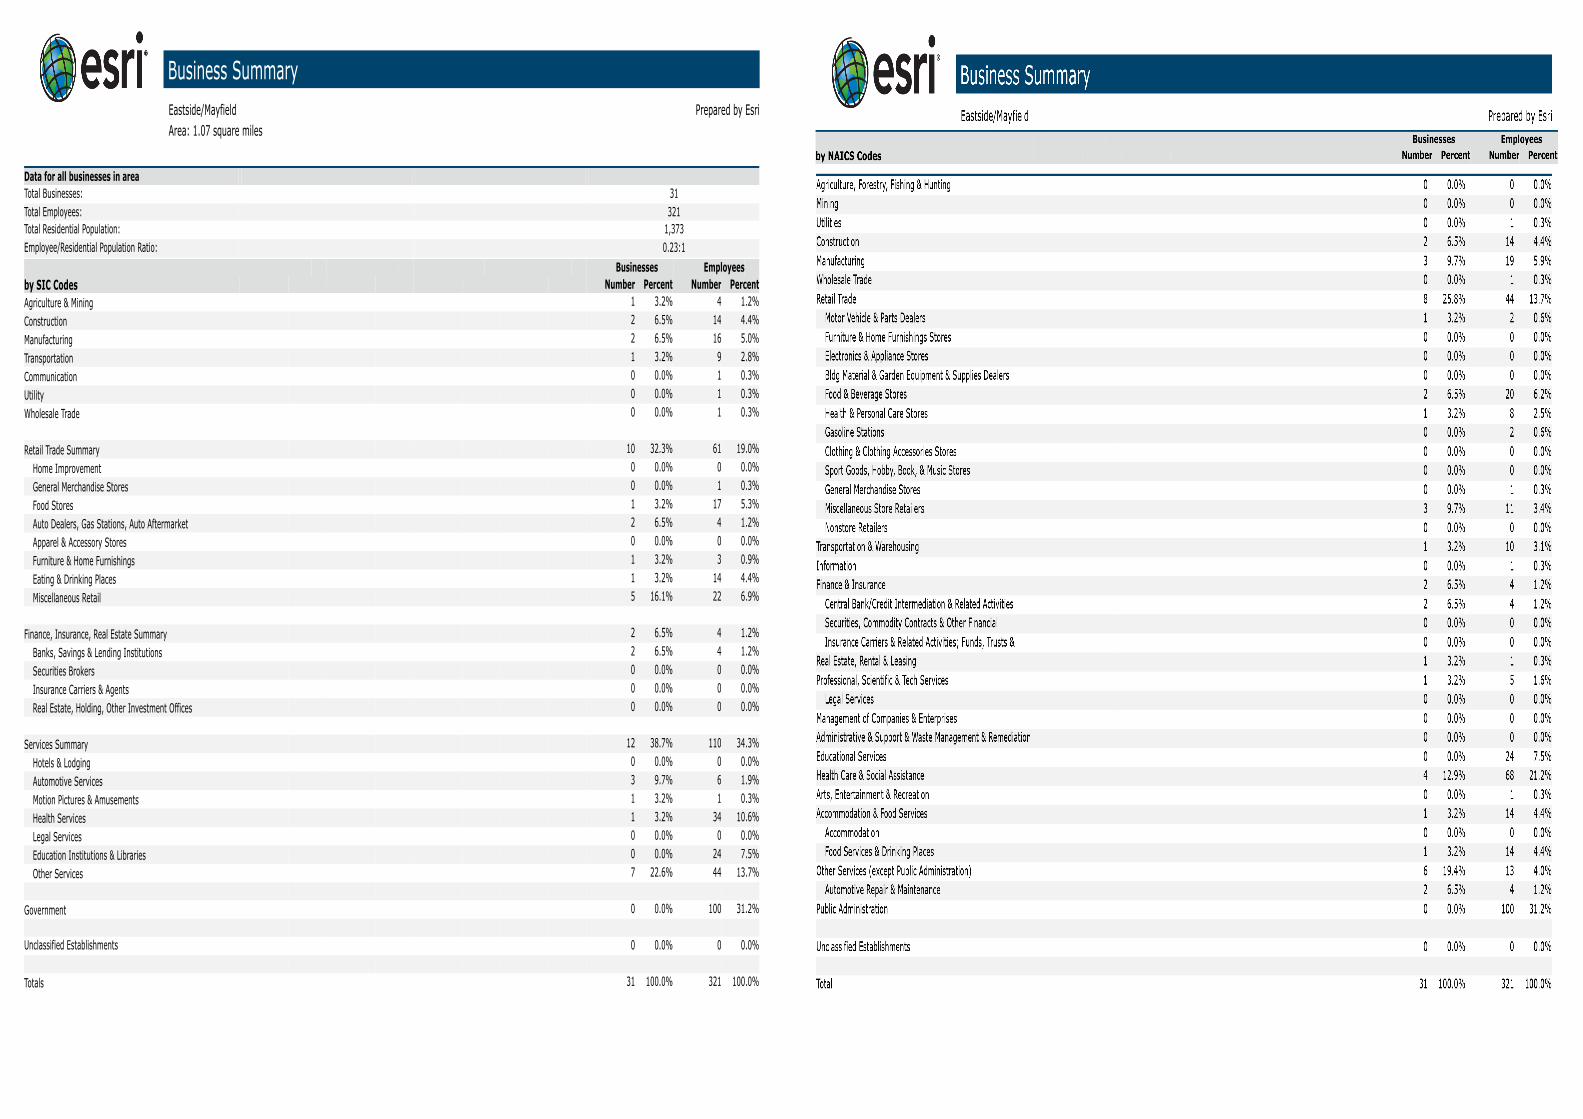
Business SummaryEastside/Mayfield Prepared by EsriArea: 1.07 square miles
Data for all businesses in areaTotal Businesses: 31Total Employees: 321Total Residential Population: 1,373Employee/Residential Population Ratio: 0.23:1
Businesses Employeesby SIC Codes Number Percent Number PercentAgriculture & Mining 1 3.2% 4 1.2%Construction 2 6.5% 14 4.4%Manufacturing 2 6.5% 16 5.0%Transportation 1 3.2% 9 2.8%Communication 0 0.0% 1 0.3%Utility 0 0.0% 1 0.3%Wholesale Trade 0 0.0% 1 0.3%
Retail Trade Summary 10 32.3% 61 19.0%Home Improvement 0 0.0% 0 0.0%General Merchandise Stores 0 0.0% 1 0.3%Food Stores 1 3.2% 17 5.3%Auto Dealers, Gas Stations, Auto Aftermarket 2 6.5% 4 1.2%Apparel & Accessory Stores 0 0.0% 0 0.0%Furniture & Home Furnishings 1 3.2% 3 0.9%Eating & Drinking Places 1 3.2% 14 4.4%Miscellaneous Retail 5 16.1% 22 6.9%
Finance, Insurance, Real Estate Summary 2 6.5% 4 1.2%Banks, Savings & Lending Institutions 2 6.5% 4 1.2%Securities Brokers 0 0.0% 0 0.0%Insurance Carriers & Agents 0 0.0% 0 0.0%Real Estate, Holding, Other Investment Offices 0 0.0% 0 0.0%
Services Summary 12 38.7% 110 34.3%Hotels & Lodging 0 0.0% 0 0.0%Automotive Services 3 9.7% 6 1.9%Motion Pictures & Amusements 1 3.2% 1 0.3%Health Services 1 3.2% 34 10.6%Legal Services 0 0.0% 0 0.0%Education Institutions & Libraries 0 0.0% 24 7.5%Other Services 7 22.6% 44 13.7%
Government 0 0.0% 100 31.2%
Unclassified Establishments 0 0.0% 0 0.0%
Totals 31 100.0% 321 100.0%
Source: Copyright 2016 Infogroup, Inc. All rights reserved. Esri Total Residential Population forecasts for 2016.Date Note: Data on the Business Summary report is calculated using Esri’s Data allocation method which uses census block groups to allocate business summary data to custom areas.
December 07, 2016
©2016 Esri Page 1 of 3


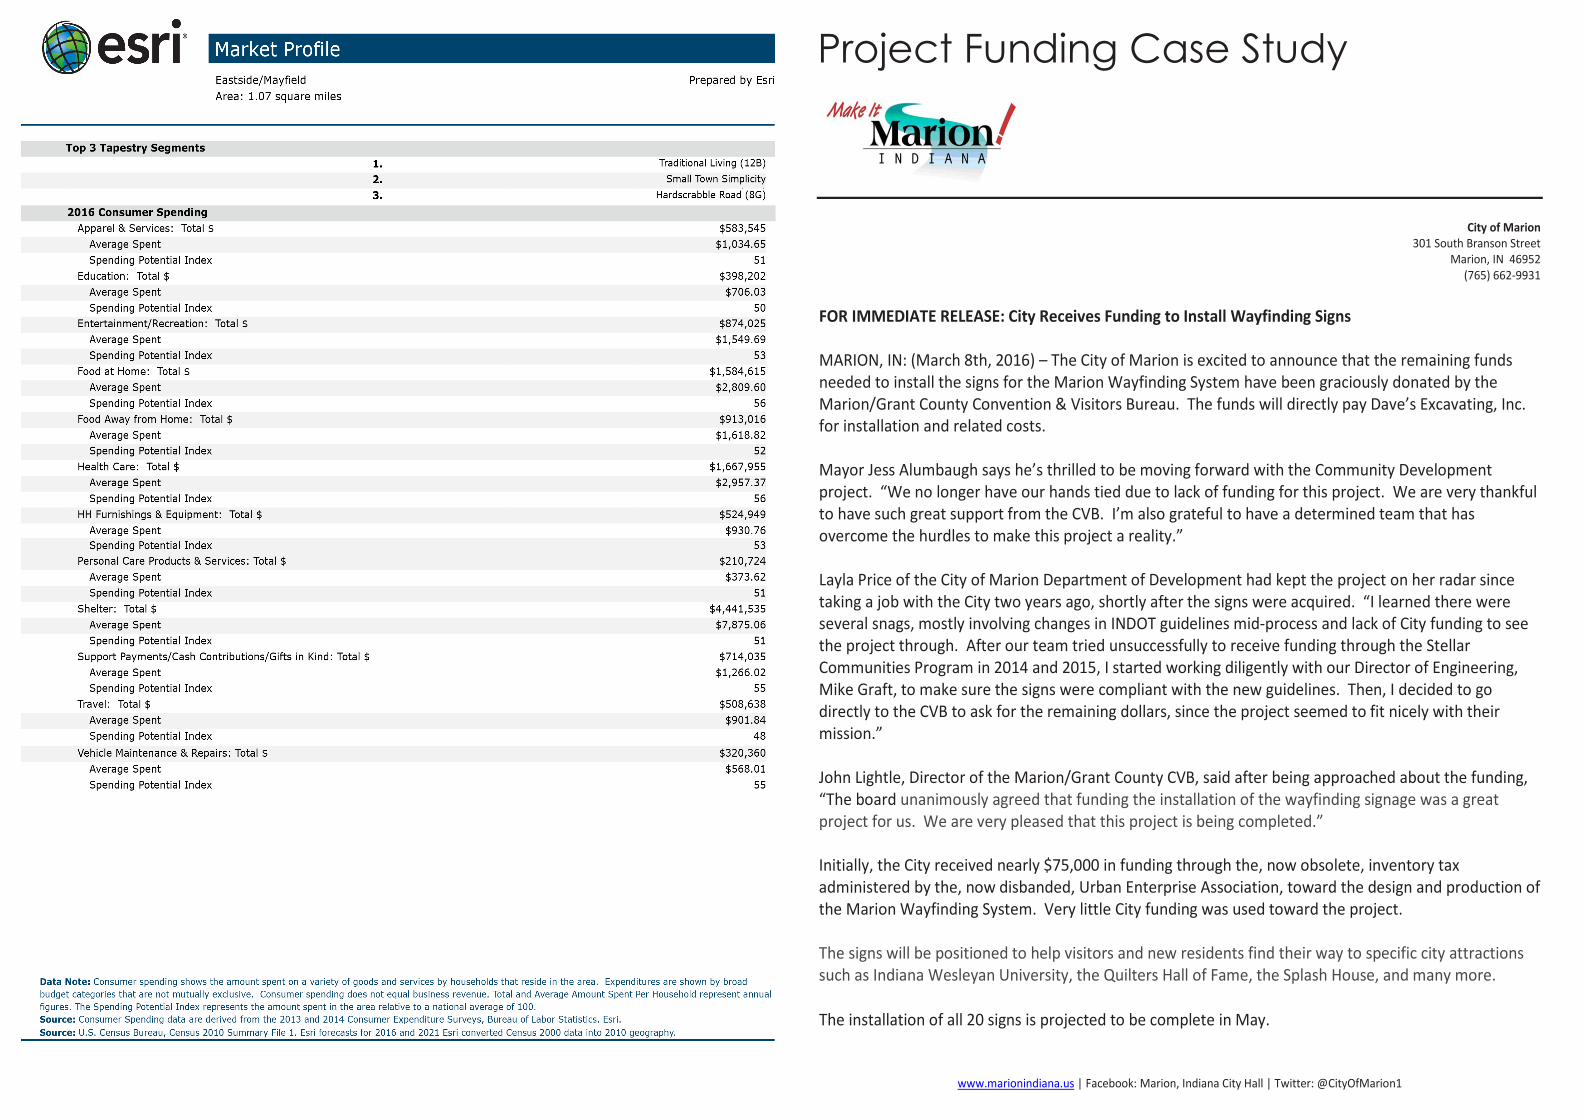
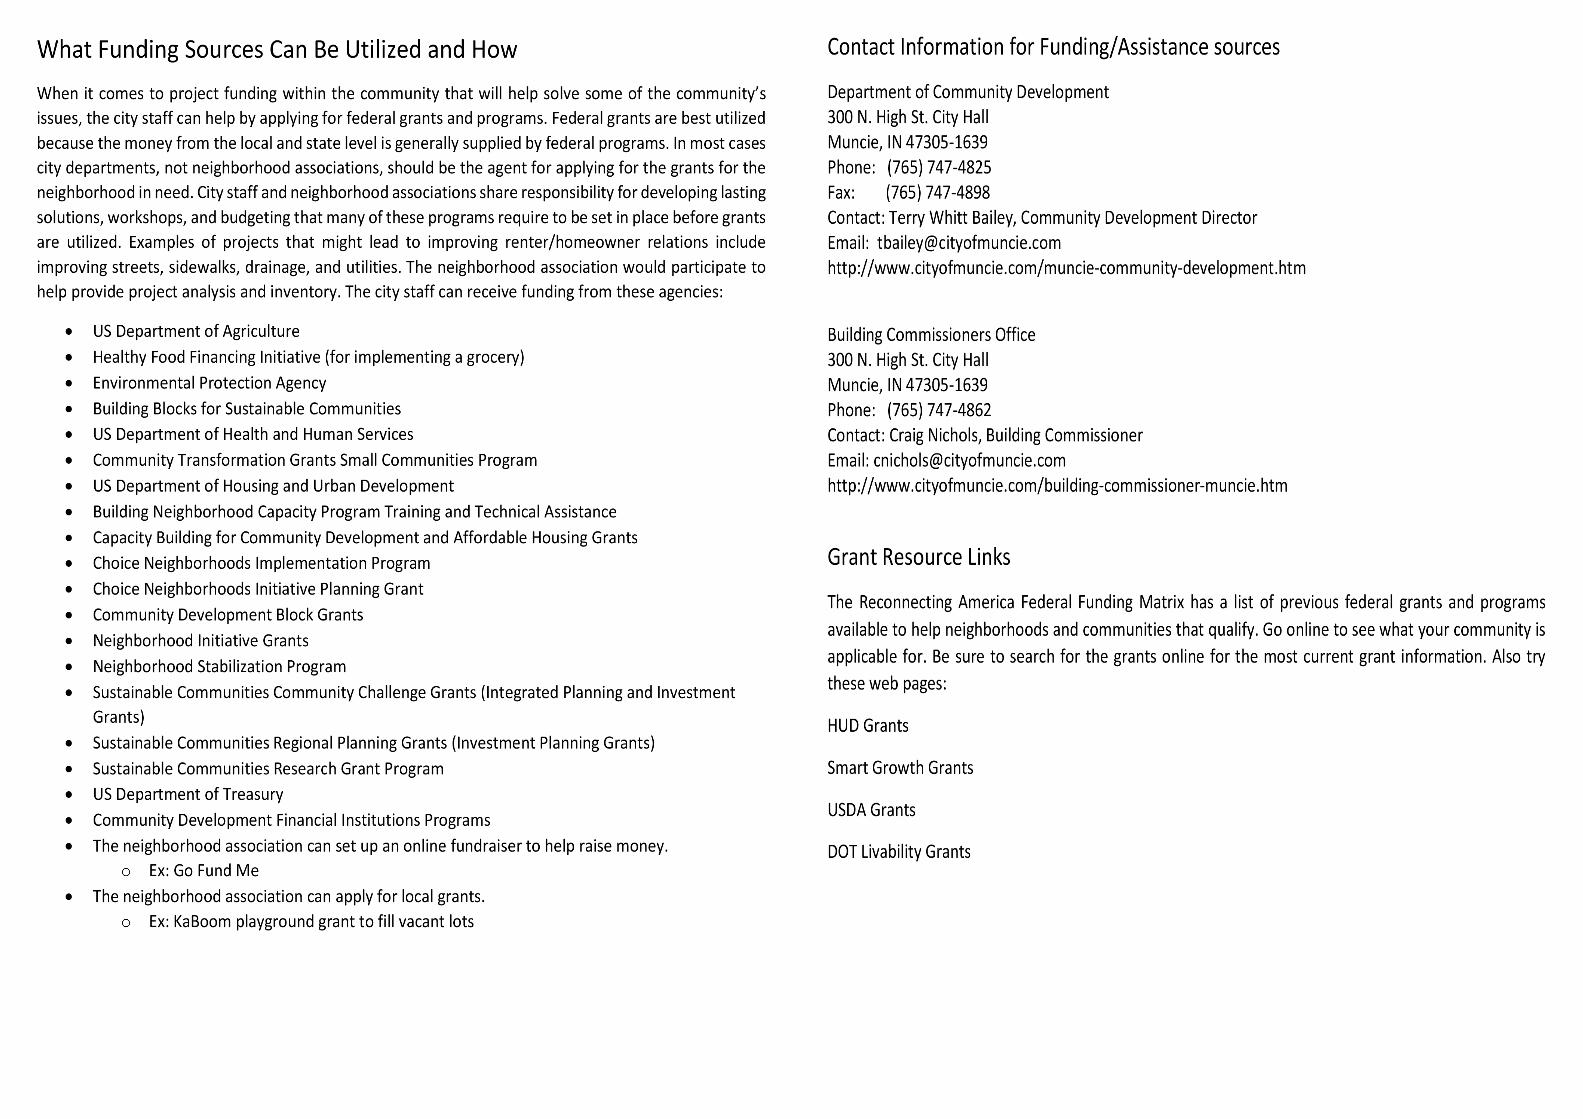
City of Marion 301 South Branson Street
Marion, IN 46952 (765) 662-9931
FOR IMMEDIATE RELEASE: City Receives Funding to Install Wayfinding Signs MARION, IN: (March 8th, 2016) – The City of Marion is excited to announce that the remaining funds needed to install the signs for the Marion Wayfinding System have been graciously donated by the Marion/Grant County Convention & Visitors Bureau. The funds will directly pay Dave’s Excavating, Inc. for installation and related costs. Mayor Jess Alumbaugh says he’s thrilled to be moving forward with the Community Development project. “We no longer have our hands tied due to lack of funding for this project. We are very thankful to have such great support from the CVB. I’m also grateful to have a determined team that has overcome the hurdles to make this project a reality.” Layla Price of the City of Marion Department of Development had kept the project on her radar since taking a job with the City two years ago, shortly after the signs were acquired. “I learned there were several snags, mostly involving changes in INDOT guidelines mid-process and lack of City funding to see the project through. After our team tried unsuccessfully to receive funding through the Stellar Communities Program in 2014 and 2015, I started working diligently with our Director of Engineering, Mike Graft, to make sure the signs were compliant with the new guidelines. Then, I decided to go directly to the CVB to ask for the remaining dollars, since the project seemed to fit nicely with their mission.” John Lightle, Director of the Marion/Grant County CVB, said after being approached about the funding, “The board unanimously agreed that funding the installation of the wayfinding signage was a great project for us. We are very pleased that this project is being completed.” Initially, the City received nearly $75,000 in funding through the, now obsolete, inventory tax administered by the, now disbanded, Urban Enterprise Association, toward the design and production of the Marion Wayfinding System. Very little City funding was used toward the project. The signs will be positioned to help visitors and new residents find their way to specific city attractions such as Indiana Wesleyan University, the Quilters Hall of Fame, the Splash House, and many more.
The installation of all 20 signs is projected to be complete in May.
www.marionindiana.us | Facebook: Marion, Indiana City Hall | Twitter: @CityOfMarion1
Project Funding Case Study
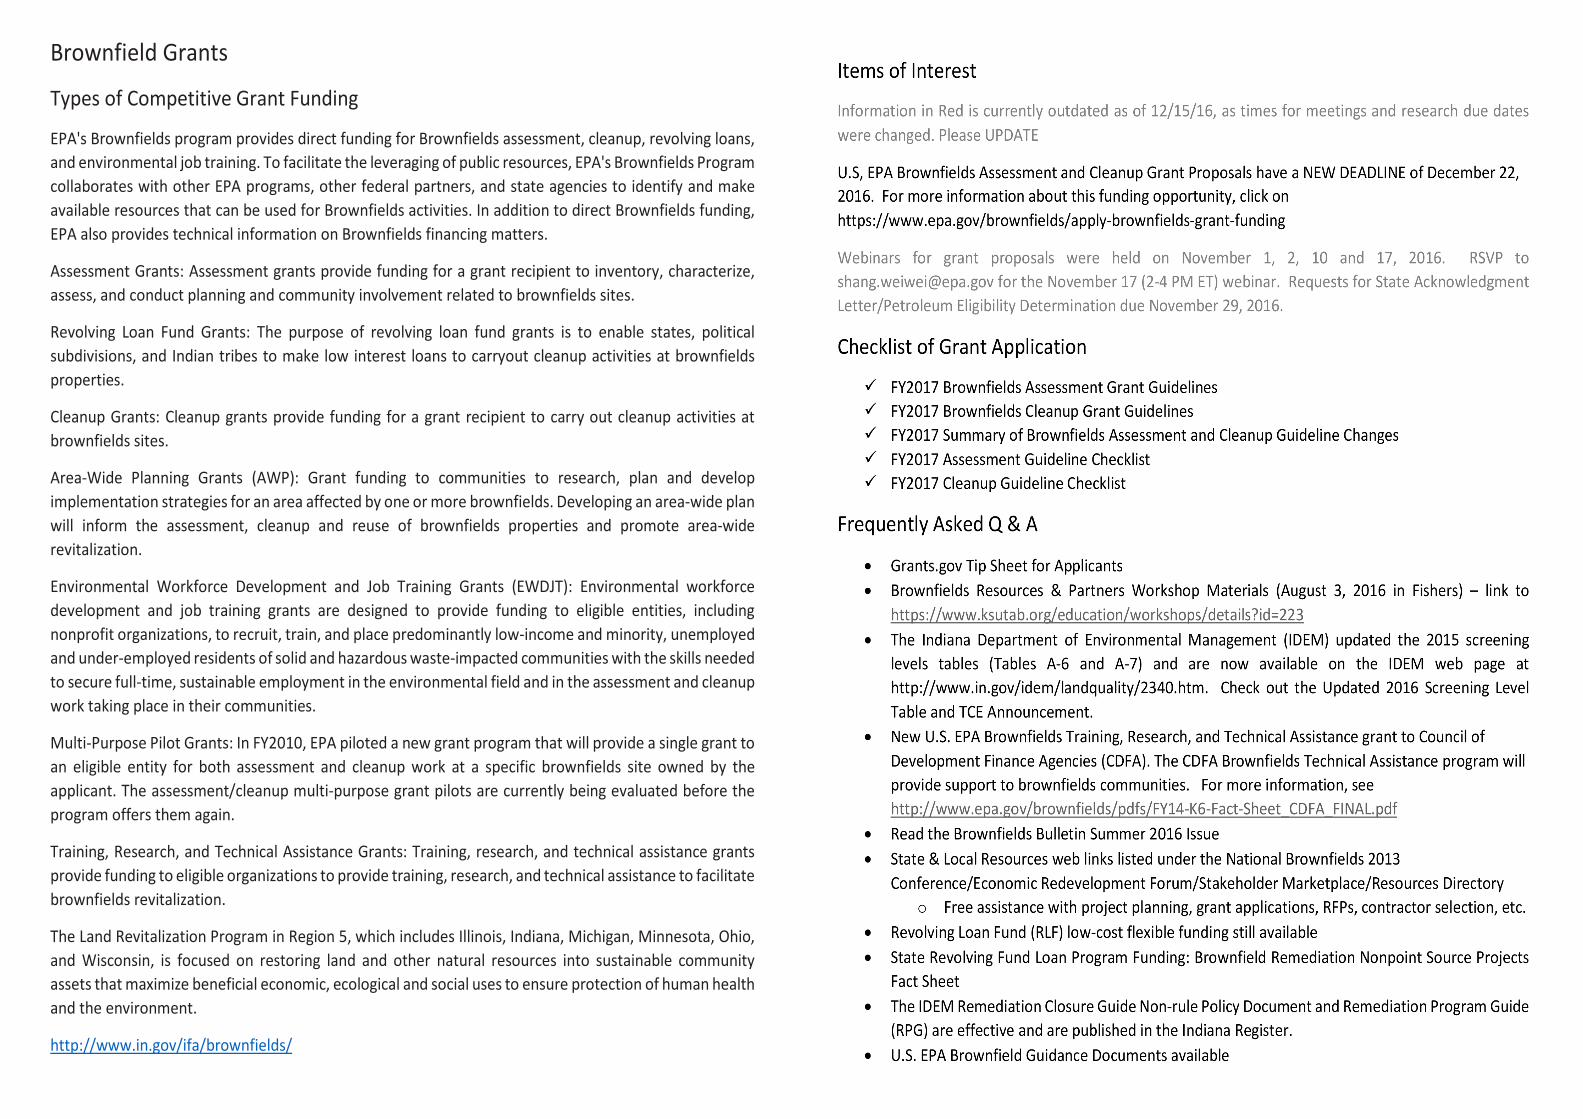
Brownfield Grants
Types of Competitive Grant Funding
EPA's Brownfields program provides direct funding for Brownfields assessment, cleanup, revolving loans, and environmental job training. To facilitate the leveraging of public resources, EPA's Brownfields Program collaborates with other EPA programs, other federal partners, and state agencies to identify and make available resources that can be used for Brownfields activities. In addition to direct Brownfields funding, EPA also provides technical information on Brownfields financing matters.
Assessment Grants: Assessment grants provide funding for a grant recipient to inventory, characterize, assess, and conduct planning and community involvement related to brownfields sites.
Revolving Loan Fund Grants: The purpose of revolving loan fund grants is to enable states, political subdivisions, and Indian tribes to make low interest loans to carryout cleanup activities at brownfields properties.
Cleanup Grants: Cleanup grants provide funding for a grant recipient to carry out cleanup activities at brownfields sites.
Area-Wide Planning Grants (AWP): Grant funding to communities to research, plan and develop implementation strategies for an area affected by one or more brownfields. Developing an area-wide plan will inform the assessment, cleanup and reuse of brownfields properties and promote area-wide revitalization.
Environmental Workforce Development and Job Training Grants (EWDJT): Environmental workforce development and job training grants are designed to provide funding to eligible entities, including nonprofit organizations, to recruit, train, and place predominantly low-income and minority, unemployed and under-employed residents of solid and hazardous waste-impacted communities with the skills needed to secure full-time, sustainable employment in the environmental field and in the assessment and cleanup work taking place in their communities.
Multi-Purpose Pilot Grants: In FY2010, EPA piloted a new grant program that will provide a single grant to an eligible entity for both assessment and cleanup work at a specific brownfields site owned by the applicant. The assessment/cleanup multi-purpose grant pilots are currently being evaluated before the program offers them again.
Training, Research, and Technical Assistance Grants: Training, research, and technical assistance grants provide funding to eligible organizations to provide training, research, and technical assistance to facilitate brownfields revitalization.
The Land Revitalization Program in Region 5, which includes Illinois, Indiana, Michigan, Minnesota, Ohio, and Wisconsin, is focused on restoring land and other natural resources into sustainable community assets that maximize beneficial economic, ecological and social uses to ensure protection of human health and the environment.
http://www.in.gov/ifa/brownfields/

Researched and Com-posited by MAP Fall Intern
Jasmine Mason


