Embed Size (px)
Citation preview
Principal’sVocabularyWords
2005-2006

All of these vocabulary words will increaseincrease testing achievement.
Essential QuestionWhat are the definitions of words students must know for CRCT testing?
oBar GraphoLine GraphoCircle GraphoDataoMean and Median
Words to help students do well on the CRCT.
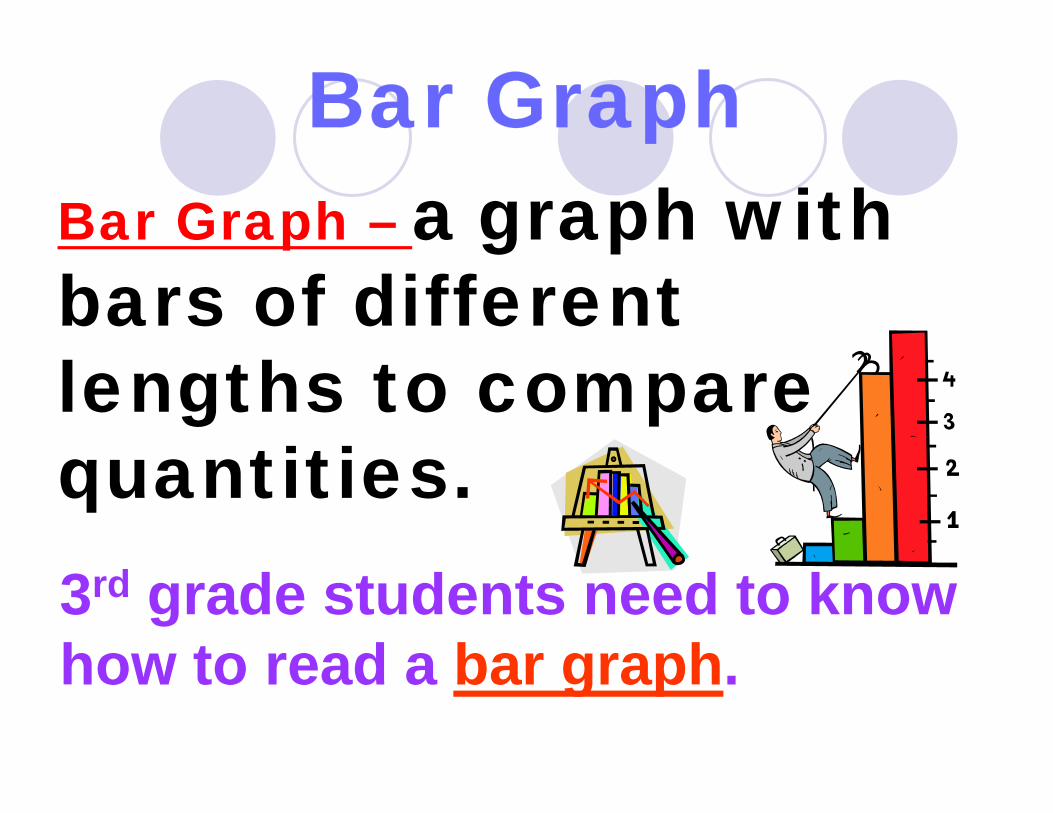
Bar GraphBar Graph – a graph with bars of different lengths to compare quantities.3rd grade students need to know how to read a bar graph.
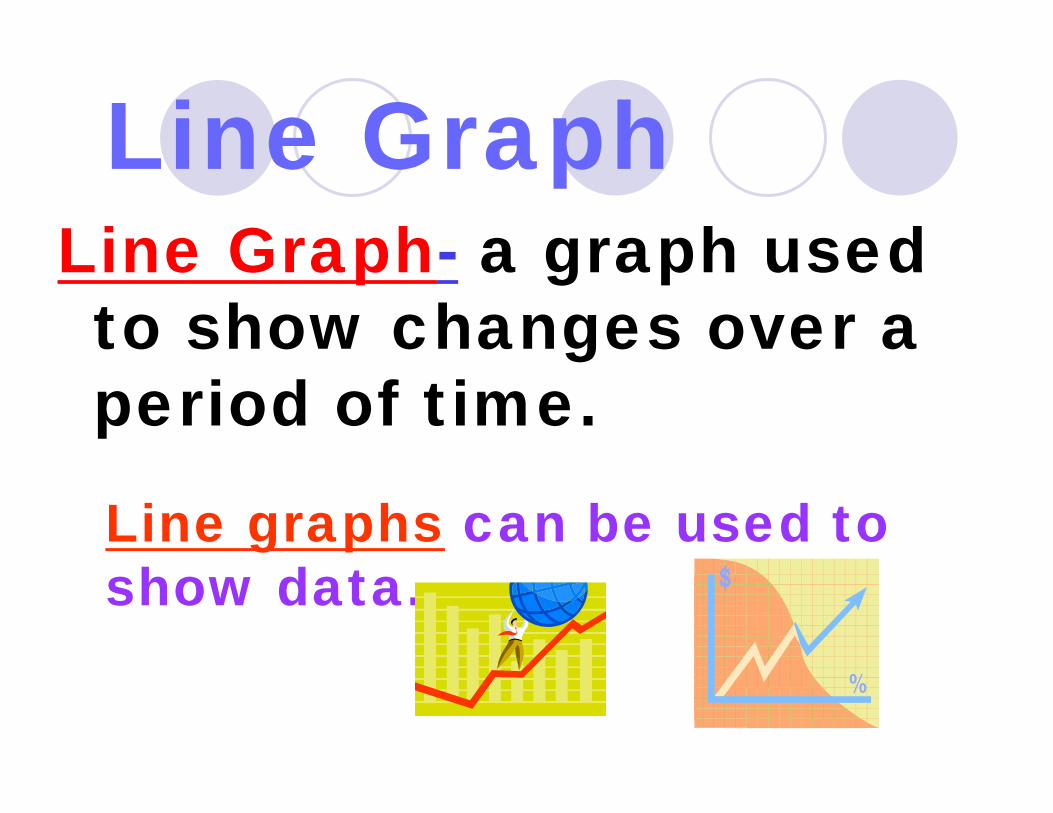
Line GraphLine Graph- a graph used to show changes over a period of time.
Line graphs can be used to show data.
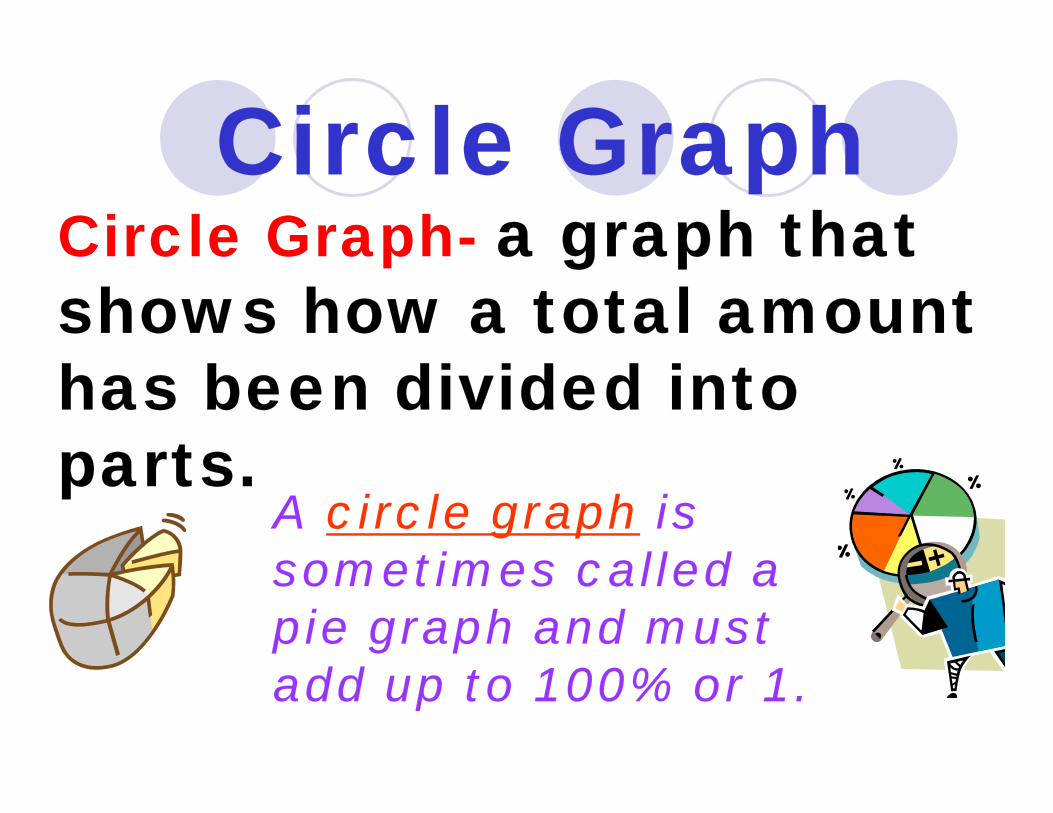
Circle GraphCircle Graph- a graph that shows how a total amount has been divided into parts.
A circle graph is sometimes called a pie graph and must add up to 100% or 1.
DataData- information or facts that describe some situation.
The data was entered into the computer.
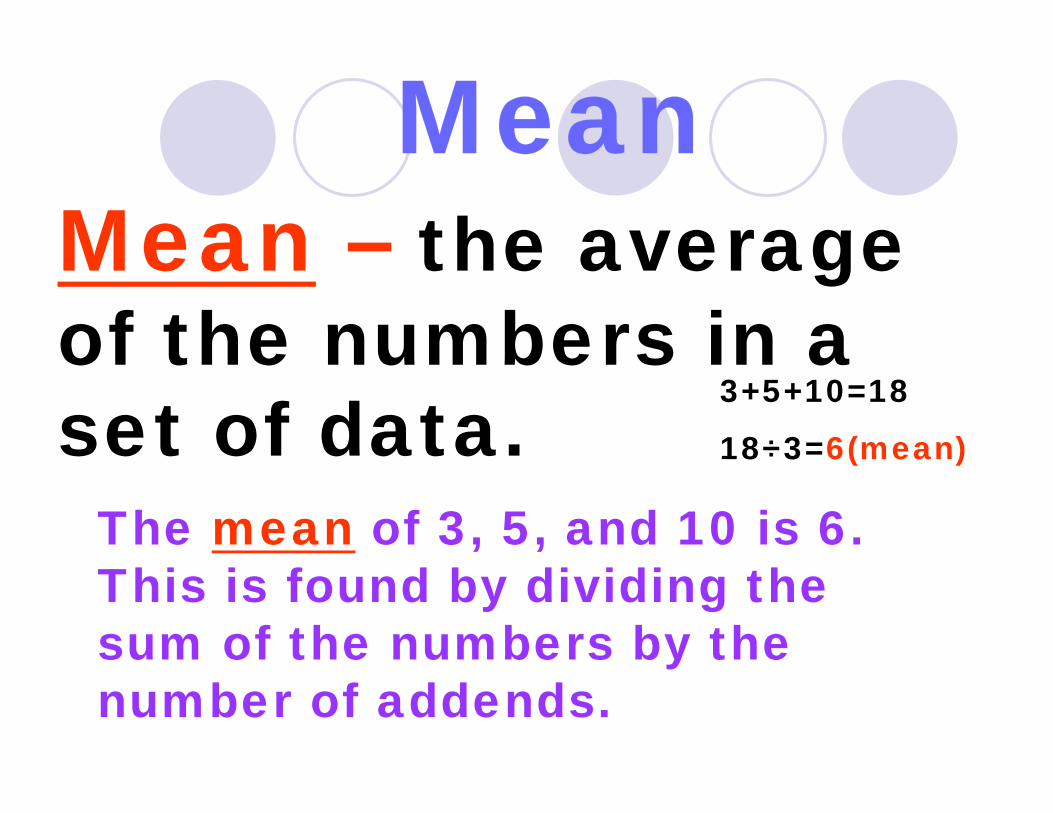
MeanMean – the average of the numbers in a set of data.
The mean of 3, 5, and 10 is 6. This is found by dividing the sum of the numbers by the number of addends.
3+5+10=18
18÷3=6(mean)
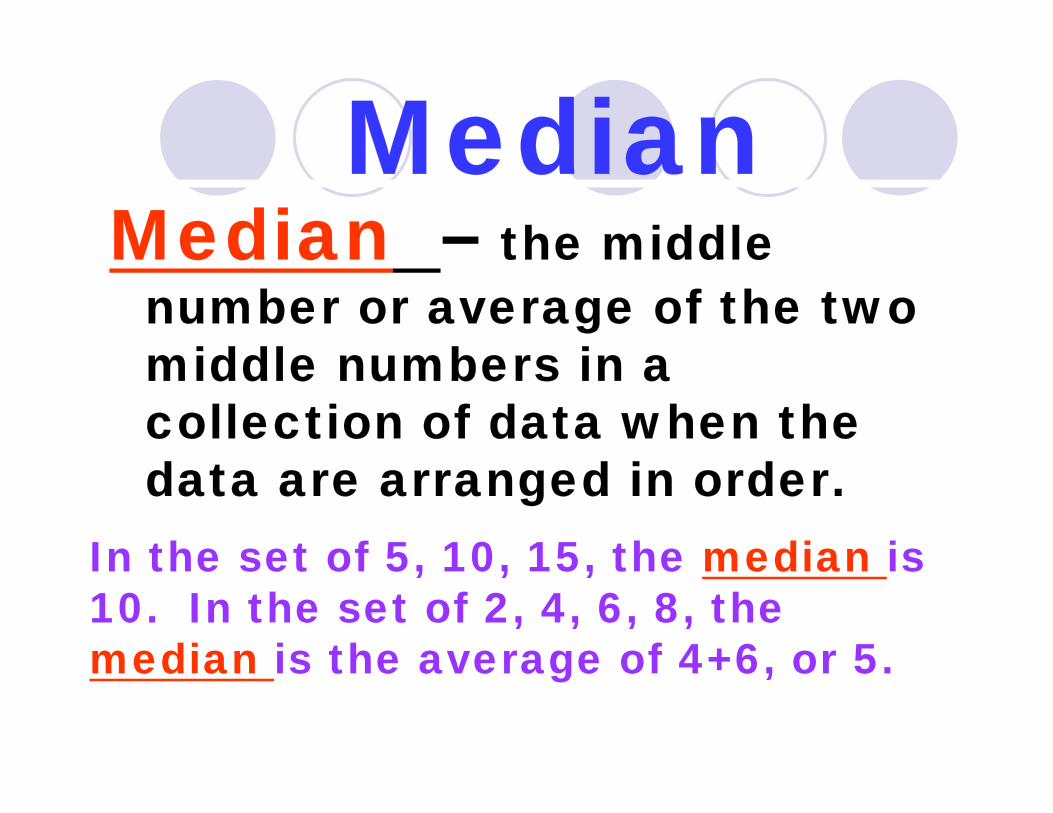
MedianMedian – the middle
number or average of the two middle numbers in a collection of data when the data are arranged in order.
In the set of 5, 10, 15, the median is 10. In the set of 2, 4, 6, 8, the median is the average of 4+6, or 5.
Essential QuestionWhat are the 4 math operations students must know for testing?(Remember DAMS)D.A.M.S.- Division, Addition, Multiplication, Subtraction.
Math OperationsOperations - D.A.M.S.Division ÷ Addition + Multiplication xSubtraction -
ProbabilityProbability – the chance of an event happening. (Something told or facts learned.)
The probability of the Atlanta Falcons winning next year’s Super Bowl is not very likely.
Ordinal Number
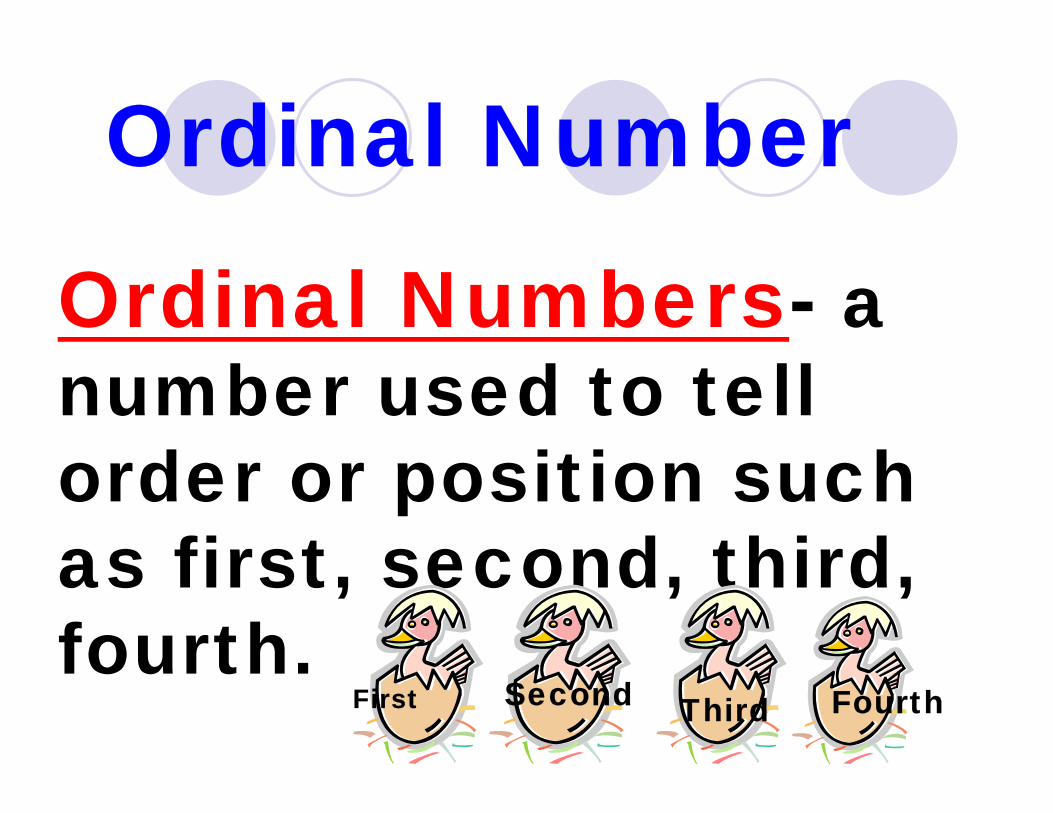
Ordinal Numbers- a number used to tell order or position such as first, second, third, fourth.
First Second Third Fourth
ProductProduct- the answer
in multiplication.3 x 4 = 12
The product (or answer) is 12.
QuotientQuotient- the answer in division
In the problem 12 divided by 4, the quotient is 3.
12÷ 4 = 3 (quotient)
SumSum– the answer in addition.
3 + 6 + 9 = 18 (sum)

DifferenceDifference –the answer for subtraction
25 – 10 = 15 (Difference)
72 – 20 = 52 (Difference)
ConsecutiveConsecutive – happening or following one after another.
Mrs. Lindsay was away for four consecutive days.
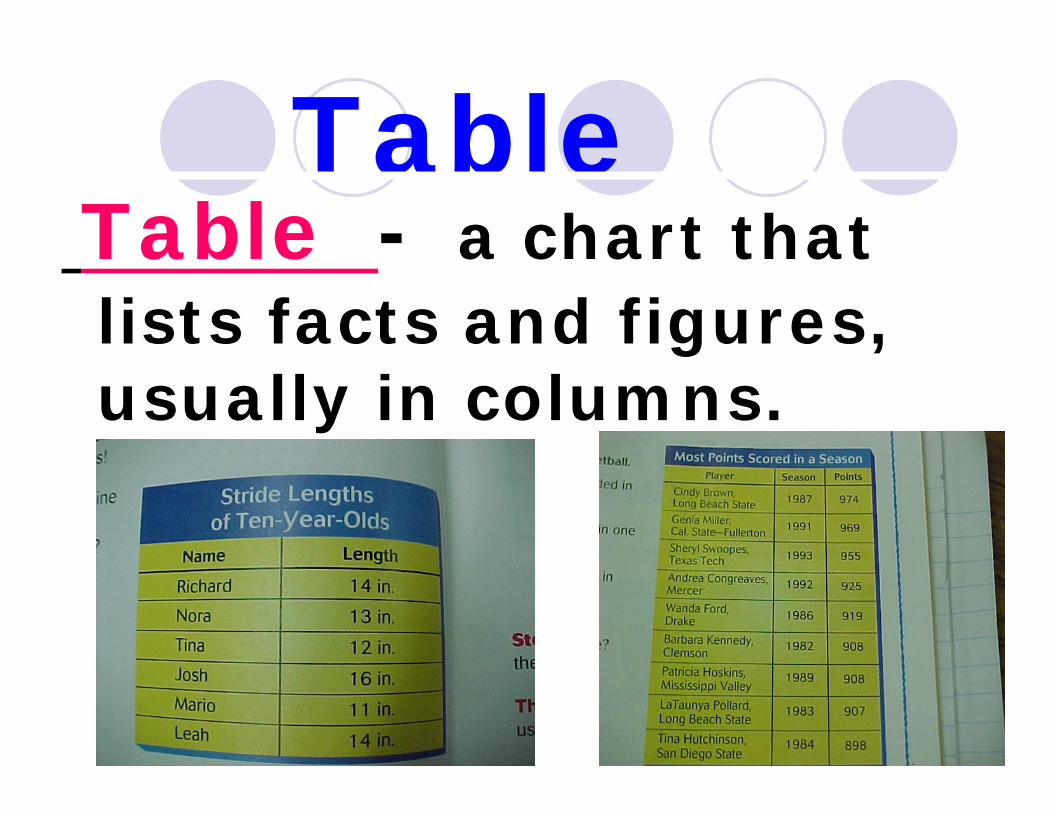
Table Table - a chart that lists facts and figures, usually in columns.
Bonus WordPrime Number – a whole number greater than 1 whose factors are only 1 and itself. It can only be divided by 1 and itself.
The numbers 2, 3, 5, 7,11, 13, 17, and 19 are the first eight prime numbers.

Bonus WordTessellationshapes that fit together on a flat surface without leaving gaps. The formation spirals outward from a central shape.