Embed Size (px)
Citation preview
T H E B U S H S C H O O L O F G O V E R N M E N T & P U B L I C S E R V I C E
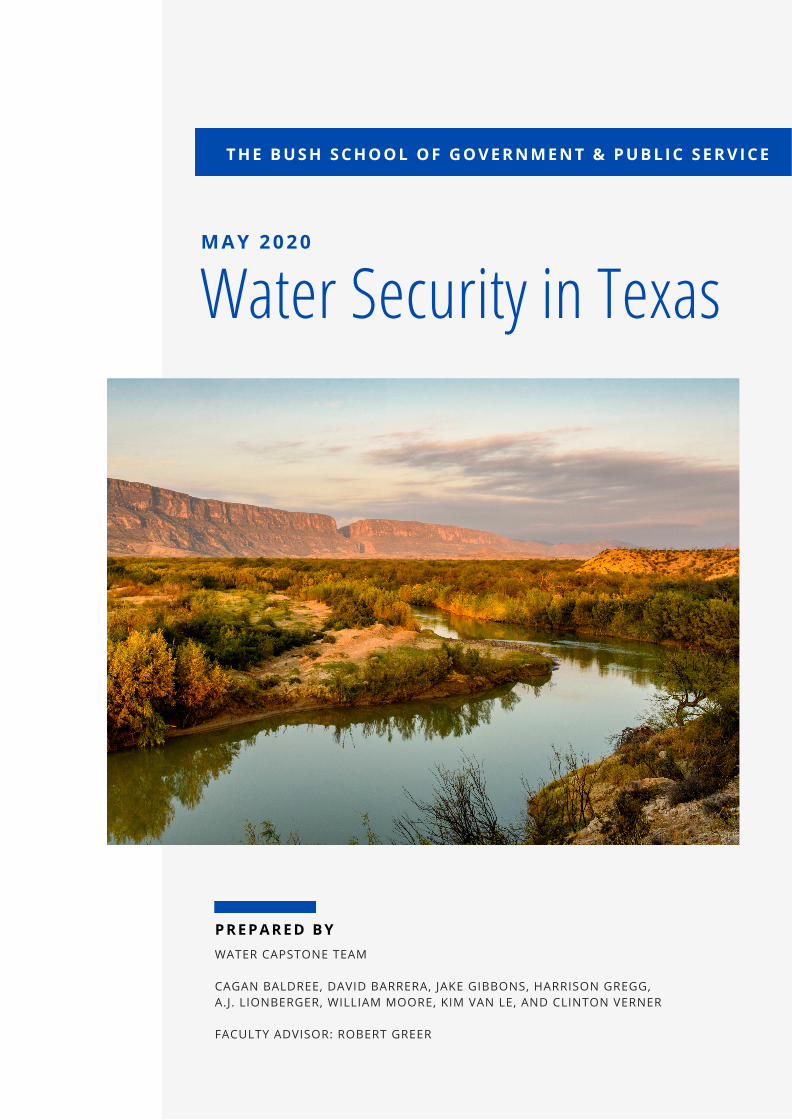
Water Security in TexasM A Y 2 0 2 0
WATER CAPSTONE TEAM CAGAN BALDREE, DAVID BARRERA, JAKE GIBBONS, HARRISON GREGG, A.J. LIONBERGER, WILLIAM MOORE, KIM VAN LE, AND CLINTON VERNER FACULTY ADVISOR: ROBERT GREER
P R E P A R E D B Y
About the Capstone Project 1
Executive Summary 2
Chapter One: Water Security in Texas 4
Importance of Water Security 4
Theories Relating to Water Management 7
Identified Strategies for Water Security 10
Chapter Two: Financing Water Infrastructure 16
Finance Literature Review 16
Local Financing in Texas 18
State Financing in Texas 19
Federal Financing 23
Public-Private Partnerships 24
Nonprofit Financing 26
Chapter Three: Studying Water Security in Texas 28
Public Water as the Unit of Analysis 28
Population and Metropolitan Statistical Area Status as Criteria for Selection 30
Using “Phase” Framework as a Final Criteria for Selection 31
Research Design 34
Chapter Four: Case Study Discussion 36
Descriptive Statistics 36
Comparison & Discussion 40
Phase One: Conservation 40
Phase Two: Non-Potable Reuse & Recycling 43
Phase Three: Advanced Water System Technology 46
Chapter Five: Policy Takeaways & Conclusions 51
Policy and Management Tools 51 Limitations 54
Conclusions 56
Appendices 58
1
About the Capstone Project This project is a collaboration between The Bush School of Government and Public Service at Texas A&M University and the Texas Water Foundation. At the Bush School, teams of graduate students conduct collaborative applied research projects for client agencies. The research project is intended to enhance team members analytical and research capacity, while also equipping them with relevant professional and interpersonal skills. The Mission This capstone aims to provide a foundational understanding to readers about the current state of water security in Texas and the effective methods available to address challenges associated with water security. The Client Texas Water Foundation Advisor Dr. Robert Greer, The Bush School of Government & Public Service, Texas A&M University Team: Cagan Baldree, MPSA 2020; David Barrera, MPSA 2020; Jake Gibbons, MPSA 2020; Harrison Gregg, MPSA 2020; A.J. Lionberger, MPSA 2020; William Moore, MPSA 2020; Kim Van Le, MPSA 2020; and Clinton Verner, MPSA 2020 Acknowledgments The Bush School of Government and Public Service and the Texas Water Security Capstone Team wishes to extend our gratitude to Sarah Schlessinger, Executive Director of the Texas Water Foundation, for this opportunity and the support she provided to the project. Thank you to the Texas A&M Pathways to Sustainable Urban Water Security X-Grant Team for laying the groundwork for this capstone to contribute to Texas water security research. We would also like to recognize all of the water professionals who volunteered their time to assist this team in the data collection portion of this project. We thank you for the meaningful work you do. Lastly, we would like to thank Dr. Robert Greer for the mentoring, guidance, and learning gifted to the group throughout this project.
2
Executive Summary Purpose This capstone group set out to examine the current water security challenges faced by Texas municipalities and to identify the strategies a select group of cities have employed to address these challenges. This report synthesizes interviews with municipal water professionals with technical reports and management documents from local and state governments to provide readers with a better understanding of these water security challenges and the strategies and technologies used to resolve them. This report does not seek to evaluate these water security strategies, but rather to present possible options for municipalities looking to become more water secure. In summary, this report seeks to answer the question “what options do Texas municipalities have to become more water secure?” Framework of Research There are no one-size-fits-all solutions to water security in Texas, but municipalities can benefit from learning best practices of other municipalities in the state of Texas. Preliminary research revealed that the most widespread water security challenges facing Texas municipalities are population growth, irregular drought patterns, and aging infrastructures, but a diverse array of unique challenges exist in different communities. Given the diversity of water challenges, available water sources, management strategies, and technologies, it is critical that municipal water professionals properly assess the particular water needs of their respective cities. For the purpose of this report, a “three phase” framework was developed to categorize the strategies and technologies identified from the literature review, a review of technical documents, and interviews with water professionals. To facilitate the studying of options Texas municipalities had to become more water secure, we found categorizing municipalities based on similarities of strategies or technologies utilized to be useful in identifying patterns across cities. We categorize municipalities into one of three phases - “Phase One”, “Phase Two” and “Phase Three” - and we organize each phase as a particular set of strategies or technologies that are similar to each other. Municipalities are identified by the highest phase strategy they utilize. We are deliberate in our use of the term “phase”, rather than simply using the term “category”, to reflect the fact that municipalities vary in what types of strategies they use. Takeaways The following are general takeaways from our research: Phase One: Decrease demand of water through the utilization of conservation efforts
(1) An important first step for Texas municipalities is to diversify their water portfolio and take full advantage of available water resources.
3
(2) Advanced metering infrastructure to decrease water usage, rebate programs to incentivize behavior changes, educational programs and social media campaigns are all useful strategies to encourage limiting water consumption.
Phase Two: Increase supply of water through partnerships or advanced technology
(3) Utilizing non-potable water reuse and recycling technologies allow municipalities to expand their water supply, which may be needed when municipalities cannot sufficiently meet their water demand through management strategies alone.
(4) Adopting new city code requirements to mandate that new developments connect to existing reuse water systems is an innovative way to facilitate the continued expansion of municipal reuse capabilities.
(5) Engaging in inter-municipality partnerships is an innovative way to share and build capabilities.
(6) The TWDB offers financing programs to assist Texas communities in expanding reuse capacities.
Phase Three: Diversify water supply through direct potable reuse or desalination technology
(7) For municipalities facing severe water security issues, the most expensive and technologically advanced water management strategies include direct potable reuse (DPR) and desalination, which tend to supplement existing water systems.
(8) These types of infrastructure require foresight and long term planning as these types of infrastructure require large capital investment, organizational capacity, and project management coordination.
(9) While both DPR and desalination are expensive strategies, the TWDB has provided financial assistance through loan programs to help finance both systems.
Report Organization The following section details how this report is organized. Chapter One: Defining Water Security explores different definitions of water security as well as common strategies and technologies used by municipalities to become more water secure. Chapter Two: Finance includes a literature review of water infrastructure finance. Chapter Three: Studying Water Security offers an explanation of the methodology used for selecting municipalities and their water professionals for this report’s case studies as well as an explanation of the development of the three phase methodology used to frame the research. Chapter Four: Case Study Discussion details the findings of our interviews with 13 Texas municipalities using the three phase framework. Lastly, Chapter Five: Policy Takeaways & Conclusions identifies common themes of strategy and technology use and offers a discussion of the implications of water policy for Texas cities.
4
Chapter One: Water Security in Texas
Water is a natural resource that touches many facets of everyday life, but future projections of its availability in Texas have led to concerns of water security. Texas’ population is expected to grow from approximately 29.5 million to 51 million between 2020 and 2070. This increase will impact some areas of Texas more than others, but the entire state will face water security challenges as a result. The most recent Texas State Water Plan recommended implementing approximately 5,500 water management strategies, and 2,500 projects at a cost of approximately $63 billion, to meet this growing demand by 2070. Conversely, not implementing these recommendations could lead to a potential water shortage of up to 8.9 million acre-feet per year, and annual economic losses of approximately $151 billion, by 2070 (Texas Water Development Board, 2017a). The acknowledgement of these trends has led to Texas municipalities adopting innovative approaches to become more water secure. These approaches range from conservation strategies, such as progressive user fees which charge users more as they use more water, to the use of advanced technology, such as desalination technology which can turn brackish or salt water into potable water. Importance of Water Security Water supply shortages have been exacerbated by severe droughts that have ravaged Texas throughout its history. Two of the most notable droughts include the drought of record in the 1950s, and the more recent drought which lasted from 2010-2014, and encompassed the worst one-year drought in Texas history in 2011. In fact, Texas’ state water plans are based on the future conditions in the event of a historic drought (Texas Water Development Board, 2017). The water security issues resulting from the most recent drought catalyzed major changes and considerations in water management. In 2013, the Texas legislature created the State Water Implementation Fund for Texas (SWIFT), distributing $2 million from the Texas Economic Stabilization Fund, commonly referred to as the state’s rainy-day fund, to finance low-cost loans for projects in the state water plan. Kathleen Jackson, a Texas Water Development Board (TWDB) board member stated, “I believe the intent of the Legislature in establishing SWIFT was to incentivize communities to invest now and move big water supply projects forward” (Texas Water Resources Institute, 2019). Public awareness of water supply and security issues has also increased in recent years. The importance of water security is not lost on the public, and Texans are generally supportive of government efforts to manage water resources during a drought (Stoutenborough & Vedlitz, 2013). Notably, the percentage of the Texas population indicating that water quantity issues are becoming
5
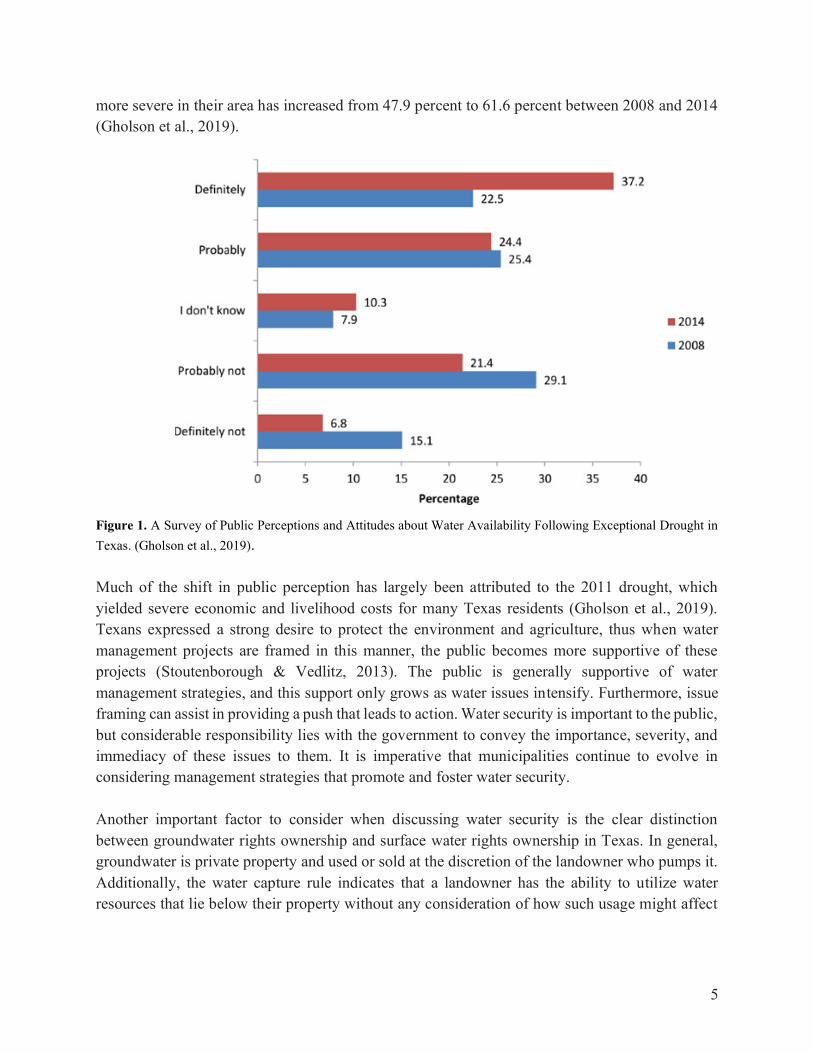
more severe in their area has increased from 47.9 percent to 61.6 percent between 2008 and 2014 (Gholson et al., 2019).
Figure 1. A Survey of Public Perceptions and Attitudes about Water Availability Following Exceptional Drought in Texas. (Gholson et al., 2019). Much of the shift in public perception has largely been attributed to the 2011 drought, which yielded severe economic and livelihood costs for many Texas residents (Gholson et al., 2019). Texans expressed a strong desire to protect the environment and agriculture, thus when water management projects are framed in this manner, the public becomes more supportive of these projects (Stoutenborough & Vedlitz, 2013). The public is generally supportive of water management strategies, and this support only grows as water issues intensify. Furthermore, issue framing can assist in providing a push that leads to action. Water security is important to the public, but considerable responsibility lies with the government to convey the importance, severity, and immediacy of these issues to them. It is imperative that municipalities continue to evolve in considering management strategies that promote and foster water security. Another important factor to consider when discussing water security is the clear distinction between groundwater rights ownership and surface water rights ownership in Texas. In general, groundwater is private property and used or sold at the discretion of the landowner who pumps it. Additionally, the water capture rule indicates that a landowner has the ability to utilize water resources that lie below their property without any consideration of how such usage might affect
6
neighboring wells (Texas Water, n.d.b). Groundwater Conservation Districts (GCDs), which were first created in 1949 by the Texas Legislature, allowed for groundwater resources to be managed and protected locally. GCDs intend to responsibly manage their groundwater resources by developing groundwater management plans mandated by law (Texas Water, n.d.a). Surface water rights ownership works differently. The state of Texas owns the surface water, while it is managed by the Texas Commission on Environmental Equality (TCEQ). Surface water rights are governed by the doctrine of prior appropriation. The doctrine of prior appropriation provides seniority to the first person or entity to receive a permit from TCEQ and grants them a property interest in the water (Dowell Lashmet, 2018). Due to the distinction between groundwater and surface water rights, municipalities have discretionary power in selecting available water sources and forming their plans. Water planning is a practice Texas has become familiar with since the drought of record in the 1950s resulted in the formation of TWDB in 1957. TWDB is the state’s lead water planning and infrastructure financing agency. In 1997, TWDB implemented a “bottom-up” approach that established regional water planning districts (Texas Water Development Board, 2017). There are sixteen regional water planning groups that prepare plans during a five-year planning cycle. Each regional plan proposes water management strategies specific to their region. Once each plan is approved, they serve as the basis for the state water plan. Optimizing arrangements and adhering to regional and state requirements creates an organized process for assessing what needs across the state are. The planning process at the regional and state level ultimately identifies the states’ demand and the possible shortfall in the availability of water, which provides crucial information to plan for and mitigate water issues. The projections of future conditions outlined in the 2017 State Water Plan indicate that water demand in Texas will increase from 18.4 million acre-feet per year to 21.6 million acre-feet per year between 2020 and 2070 (Texas Water Development Board, 2017). At the same time, total water use for irrigation purposes is expected to decline, but an increase in water use for municipal purposes will more than offset the decrease. The increase in municipal water use can be contributed directly to the increase in population because conservation efforts have led to a decrease in per capita water consumption across the state (Loftus, 2018). This indicates some success due to existing water management practices, but gives way to the question of how different municipalities will deal with the change in demand. Much of the expected population growth will be concentrated in a handful of regions in the Eastern portion of Texas. Some rural areas could actually decrease in population. Some regions are expected to slightly increase in population and slightly decline in water demand. Texans are aware that one-size-fits-all solutions cannot address water security challenges that lie ahead.
7
Regional variation of water supply and demand shapes the context of water security in Texas. Proximity to surface or groundwater does not necessarily indicate that regions are unsusceptible to water insecurity. In fact, by 2060 the Ogallala and Gulf Coast Aquifers are expected to experience significant reductions in groundwater supply (George et al., 2011). Regions supplied groundwater by the Gulf Coast Aquifer meet more municipal needs, while the regions supplied groundwater by the Ogallala Aquifer meet more irrigation needs. In regions where the oil and gas industry is active, fracking will produce a larger share of the water use pie. In the 2017 State Water Plan, only one region recommended water management strategies capable of meeting all water user groups’ needs (Texas Water Development Board, 2017). Despite the advantages that some regions may have over others, across the board regions face rapidly growing demand. Regional variation leads to different demands, uses, and management strategies across the state. However, varied these regions may be, it is critical that planning groups are aware of and utilizing the strategies and tools available to them. Although state planning is divided regionally, much of the adoption and implementation of water management strategies occur at the municipal level. There is coordination among planning groups, but municipalities bear considerable responsibility for the financing of such strategies and arrangement of collaborations. A primary challenge, especially for smaller municipalities and utilities, has been focused on reducing demand as options for building their way out of shortages have become limited (Mullin, 2009). It is expected that larger municipalities would have greater capacity to engage in more advanced and expensive water management strategies. Still, even with thinner margins, smaller municipalities have some opportunities to seek financial assistance and make strategic capital budgeting decisions. Certain water management strategies may scale well across municipalities, while other municipalities may require more tailored approaches. Municipalities face the brunt of water scarcity and have to make difficult decisions regarding increased demand, aging infrastructure, and other water security challenges. Often, these decisions encompass concerns of resiliency and sustainability. Theories Relating to Water Management This section will examine the historic usage of security, resilience, and sustainability and will discuss the definition and usage of these terms in the context of policy making. Water is a natural resource that is foundational to sustaining society, however the provision of water faces increasing challenges as it is a common resource. Moreover, as a fugitive resource, it faces the challenge of individuals and firms taking more than what is sustainable for the group, and thus lead to a collapse of the common pool resource. The issues with the distribution of common pool resources largely stem from free-rider issues (Ostrom, 1993). Maintaining common pool resources without the “Leviathan of Government” requires knowledge of all those who draw from the resource. This dichotomy has been portrayed as the, “Tragedy of the Commons versus
8
the Tragedy of the Leviathans” (Ostrum, 1993). Perhaps a bit dramatic of a portrayal, common pool resources the size of Texas’ waters with competing users such as municipalities, agriculture, and the oil industry makes non-governmental administration difficult. It is therefore unsurprising to see city governments using a wide variety of tools in maintaining the commons. Definition of Security One of the core goals of this report is to provide information to Texas municipalities that can help them pursue and develop water security strategies. In order to use this term throughout, a definitive definition is needed to set the parameters for the conversation. Water security is a multi-dimensional concept that encompasses geographical, social, and economic factors that involve a municipality’s capacity to deliver clean, reliable water, practice sound water management practices, and long-term-minded economic policies (Gain et al., 2016). Another definition of water security references maximizing the productive potential of water, while limiting the destructive impact it can have (Grey & Sadoff, 2007). Thus, water security can be understood as a concept that relates to the success or failure of water management, governance, and delivery practices to navigate threats to water sources in a given area. As for this paper, water security is developed along a continuum; below, the phases by which cities have typically worked towards this goal are explained in-depth. In summary, water security can be developed through effective governance, dependable water sourcing, water conservation, and various reuse and recycling practices. Definition of Resilience Resilience is the ability of a system, community, or society exposed to hazards to resist, absorb, accommodate, and recover from the effects of a hazard promptly and efficiently (Jha et al., 2013). Our capstone will explore municipalities' approach toward enacting policies and management decisions that fosters resilience to enable their cities to adjust to increasing population, risk of drought, and reduce future vulnerability. A holistic approach to resilience in water security may consist of individual resilience, social resilience, risk mitigation and management, and absorption and accommodation of risks that cannot be fully avoided or be recovered from (Jha et al., 2013; Southwick & Charney, 2018). In the context of urban resilience, a growing body of definitions has emerged to encompass the relationship between the different systems of society, ecological, and urban, and the ability of these systems to be flexible, functional, and resilient to disturbance. The social-ecological system encompasses the human networks that make up cities with the idea of resilience while also illustrating the need for systems to be bolstered to serve human networks. The idea of urban resilience is crucial as water professionals must ask what systems must become resilient, against what anticipated challenges, and for whom resilience systems are being designed for (Meerow & Newell, 2016). For this paper, resilient systems are represented by infrastructure, operation plans,
9
or cultural changes that have a measurable effect on municipalities' water supplies in an attempt to accommodate a future with restricted supply. Definition of Sustainability Sustainability continues to rise in relevance as understanding of the relationships between us and our natural resources expands. Sustainability is the practice of consuming a resource in a way that does not harm future generations (United Nations, 2019). In an era of increasing water scarcity, municipalities must approach water management in a sustainable manner that can support present and future generations. Moreover, sustainability involves a three-pronged approach that includes the environment, the economy, and equity (Portney, 2015). Thus, the goal of sustainability is intimately connected to water governance and management. Urban planners must take water scarcity into account when designing distribution systems. Population growth and climate change are just two of many frontline issues that threaten the long-term viability of our water resources (Franks & Cleaver, 2009). Water managers must pursue strategies that allow for the preservation of the environment, the growth of the economy, which is inextricably tied to water, and the equitable dispersion and delivery of water to all people. All of these goals directly contribute to the overarching concept in this report on the development of water security. The study and usage of the terms “security”, “resilience”, and “sustainability” are often used interchangeably in common parlance. The interchange of these terms may suggest that the concepts of security, resilience, and sustainability form a nexus of urban planning. Some practitioners in the field view the security, resilience, and sustainability nexus as dependent on the food, water, and energy nexus. The general theory is that the use of one element (food, water, or energy) affects the supply and therefore the use and the security of the other elements (Hannibal & Portney, 2019). In the context of this paper, Security, Resilience, and Sustainability form an independent nexus wherein the approach taken by planners affects the Security, Resilience, or Sustainability of the system. For example, a system may be sustainable, but it may not be secure or resilient (and vice-versa). One Water Management Concept An emerging concept in water security is the concept of “One Water”, which is defined by the Water Research Foundation (2017) as an integrated planning and implementation approach to managing finite water resources for long-term resilience and reliability to meet the needs of both the community and ecosystem (Brown & Caldwell et al., 2017). This approach views the varying water sources such as surface water, ground water, reuse water, urban runoff, effluent, and stormwater as one connected resource, and encourages the development of policy and infrastructure that plans with the interaction of the hydrological water cycle and “urban” water
10
cycle in mind (Cardone & Howe, 2018). The “urban” water cycle is defined by the impact and interaction between urban management and the water cycle. For example, water is used in housing, health, energy, agriculture, parks and recreation, construction, and waste, and wastewater is produced that eventually makes its way into local bodies of water, potentially contaminating or polluting the environment. At the same time, storms, flooding, drought, and waterborne parasitic diseases (that can be exacerbated by human processes) can damage infrastructure and present health risks (Cardone & Howe, 2018). One Water management seeks to find a balance between urban management and the ecosystem by encouraging the use of concepts like “green infrastructure” and “closed loop systems” to provide alternatives to water management that minimize the impact on the environment. Examples of green infrastructure would be San Antonio’s incentive bundling program that includes plumbing efficiency targets or its conservation program that incentivizes the use of rainwater through rainwater barrel coupons. An example of a “closed loop system” would be the collaborative agreement between the Tarrant Regional Water District, the North Texas Municipal Water District, and local stakeholders to pump wastewater into designated wetlands for a “natural filtration” process through a series of sedimentation basins and aquatic plants. Once the water makes its way through the wetland, it is captured and pumped back into a reservoir that is then treated to drinking standards for local customers. This proposed project is estimated to have the potential to provide 3.8 million people with a new supply of water in North Texas (NTMWD & TRWD, 2018). Identified Strategies for Water Security Water security strategies, management, and tools typically refer to the use, incentivizing, or subsidizing of water-efficient practices or fixtures that either reduce the consumption of water or help to maintain or increase supply. In this section, we begin by acknowledging that some strategies are compulsory by Texas Water Code. We continue by then separating these strategies and tools into two categories, “Demand” and “Supply” management. Demand management strategies and tools refer to any practices which specifically reduce the consumption of water either by implementing conservation regulations or more water-efficient technologies. Supply management strategies and tools refer to any practices which increase or help to maintain the supply of water. Texas Water Code: Conservation The Texas Water Code was amended by the Texas Legislature in 2007 and 2011 to require mandatory reporting of water use, water conservation plans, and efforts to conserve water. Any retail public utility that provides potable water service to 3,300 or more connections is required to submit a conservation plan to the TWDB per Section 13.146 of the Texas Water Code (TWC §13.146) Any entity with surface water rights for 1,000 acre-feet or more for a municipality, industrial, and other non-irrigation uses, and surface water rights holder with 10,000 acre-free or
11
more for irrigation are required by Section 11.1271 of the Texas Water Code & Title 30 of the Texas Administrative Code Chapter 288 to submit both a Water Conservation Plan and Water Conservation Implementation Report to the TCEQ (TWC §11.1271; TAC 30 §288). A copy of the conservation plan needs to be provided to the Texas Water Development Board; updated annually to reflect the progress of the program implemented, and the entire plan needs to be reviewed and updated every five years.
Additionally, in 2004 the Texas Legislature passed House Bill 2660, which charged the TWDB and TCEQ to develop water conservation programs for different types of water suppliers with best management practices (BMP) for achieving water conservation. It led to the development of the Water Conservation Advisory Council creating BMP for water users in the area of agriculture, commercial and institutions, industrial, municipal water providers, and wholesale water providers. The specific best management practices for municipal water providers range from conservation analysis and planning, financial (pricing), system operations, landscaping, education and public awareness, rebate, retrofit, and incentive programs, conservation technology, and regulatory and enforcement. It is anticipated that water conservation strategies for the year 2070 are projected to provide approximately 2 million acre-feet to assist with the state’s projected needs (Texas Water Development Board, 2017). In fact, of the identified strategies to meet water supply needs, water conservation strategies lead in terms of volume at approximately 28 percent, irrigation conservation will account for 15 percent, municipal conservation is 9 percent and other conservation is 2 percent. The TWDB defines conservation practices, techniques, programs, and technologies that will protect water resources, reduce the consumption of water, reduce the loss or waste of water, improve the efficiency in the use of water, or increase the recycling and reuse of water so that the water supply is made available for future or alternative uses.
The requirements of the conservation plan include:
❖ Providing an evaluation of the organization’s water and wastewater system and customer use characteristic to identify potential targets and goals
❖ Designating an individual in the organization to serve as the water conservation coordinator responsible for the implementation
❖ Specifying five and ten-year goals for municipal and residential use, in gallons per capita per day, which should consider state and regional goals, local climate, and demographics
❖ Scheduling the implementation plan and describing the method to track the implementation and effectiveness
❖ Installing production meters to measure and account for water diverted from the source of supply to the system
12
❖ Establishing universal metering program, water loss control program, leak detection program, and continuing public education and information program
❖ Institutionalizing water rate structures that is cost-based, not promotional, which discourages excessive use of water
❖ Adopting the plan, with means of implementation and enforcement, via a signed official ordinance, resolution, or tariff
Municipalities are expected to clearly define their practices in the schedule of implementation, outline the expected water savings and total costs of implementation. Moreover, municipalities should describe and outline efficiency measures, water savings estimating procedures and cost-effectiveness considerations. Texas Water Code: Water Reuse/Recycling The Texas Administrative Code defines reclaimed or reused water as “domestic or municipal waste-water that has been treated to a quality suitable for beneficial use” (TAC 30 §210.32) There are two major categories of water reuse, “direct” and “indirect” use. Direct reuse refers to water that is piped directly from a wastewater treatment facility to a distribution system, while indirect reuse refers to the discharge of reclaimed water back into a lake, river, aquifer, or another body of water with the intent of retrieving it for later use (Texas Water Development Board, 2019c). Both types of water reuse can be used for potable (drinking or bathing) or non-potable uses (irrigation or commercial). On top of complying with Texas Water Code, any water reuse project in Texas, that involves discharging into bodies of water in the United States must comply with the Federal Clean Water Act (1972) and the Safe Drinking Water Act (1974). Additionally, non-potable reclaimed water is categorized into two types, with Type I non-potable water being that which the public may come into contact with and Type II being that which the public does not come into contact (TAC 30 §210.32). According to the 2017 Texas State Water Plan, only 4 percent of total water supplies come from reuse sources, with 41 percent of the reuse supply coming from Region C alone. However, supplies are recommended to increase this amount to 14% of the total Texas water portfolio by 2070 to keep up with the water demand in Texas (Texas Water Development Board, 2017). Demand Management Municipal Municipal use of water is defined as any water used in single-family residences, multi-family residences, nonresidential commercial establishments, for purposes that include drinking, cooking, sanitation, cooling, and landscape watering (Texas Water Development Board, 2017). Water used
13
for industrial purposes (such as in large manufacturing plants and mining operations) are not included in this category. Municipal demand management includes, but is not limited to: ❖ the installation of water-efficient plumbing fixtures; ❖ the use of a progressive water user rate, meaning customers that use more water pay more; ❖ advanced water metering, which allows customers to see their consumption in real-time; ❖ landscape irrigation restrictions; ❖ the use of subsidies, rebates or incentives to encourage the use of water-efficient fixtures.
An example of an innovative municipal demand management strategy is Austin’s Advanced Metering Infrastructure (AMI), which aims to build an online infrastructure that can both be used to monitor for leaks and inform users of their water consumption. Users will be able to see via an cellphone application, in real time, how much water their household has consumed in a given period and compare it to nearby households. The idea is that increased monitoring, along with billing information will encourage users to reduce their consumption. Additionally, this technology can catch leaks early on, instead of waiting for water damage to become visible or being prompted by an abnormally high water bill. Austin hopes to implement this technology citywide by 2024 (Austin Water, 2018a). Industrial, Mining & Agriculture Unlike other commercial establishments that use water for their day-to-day processes, industrial and mining use of water includes large scale cooling, drilling, and product processing procedures (Texas Water Development Board, 2017). Management strategies include (1) modifying high power cleaning equipment with high pressure-low volume nozzles, to reduce the use of water; (2) installation of a trigger operated nozzles in high power cleaning equipment, to better control flow of water; (3) submetering equipment and systems that alert operators when water consumption surpasses a specific threshold; (4) a separate and progressive commercial user fee rate, to incentivize the reduction of water consumption; (5) mandating routine inspections of areas that are most likely to leak, such as pipe-work joints, connections, and fittings (Danielsson & Spuhler, 2019). Supply Management Drought Drought can be defined in four ways, all of which are not mutually exclusive: (1) meteorological drought, a period when dry weather yields less than average long term rainfall that does not necessarily affect water supply; (2) agricultural drought, when a reduction in soil moisture begins to significantly and negatively impact crop production - increasing water demands; (3) hydrological drought, when water supplies begin to significantly deplete from streamflows with a
14
constant period of below-average recharge; and (4) socioeconomic drought, when lack of water supply begins to affect the health and quality of life of the public, as well as, impacting the production of goods and services (Wilhite & Glantz, 1985). Developing a drought contingency plan (DCP) is a key strategy in preparing for and responding to drought, and DCPs vary according to the needs of the entity. In Texas, three types of entities are mandated to submit updated Drought Contingency Plans to the Texas Commission on Environmental Quality (TCEQ) every five years: retail public water supplies with 3,300 or more connections, wholesale public water supplies, and irrigation water providers (or irrigation districts) (TAC 30 § 288.20-22). TCEQ provides a template that lists stages of drought defined by “triggers”, or thresholds of water supply that when reached “triggers” restrictions are intended to stymie drought. These restrictions increase in stringency as stages progress, and typically follow this order: in stage 1, water customers are asked to voluntarily limit their irrigation of landscaping to certain days of the week; in stage 2, penalties are imposed on anyone who does not comply with mandatory restrictions relating to irrigation, washing vehicles, swimming pools, and ornamental fountains; in stage 3, use of a fire hydrant is prohibited to only emergency personnel; in stage 4, commercial car washes and commercial service stations are subject to time restrictions and new, additional or expanded water service connections must be halted immediately; in stage 5, use of water for both irrigation and to clean vehicles of any kind is prohibited; in stage 6, residences are placed on a monthly water allocation plan that is calculated based on the number of persons in each household (Texas Commission on Environmental Quality, 2019a). Aquifer Storage and Recovery Another strategy for supply management would be to create a new supply of water altogether; Aquifer Storage and Recovery (ASR) is the practice of storing water in aquifers during times of abundance and recovering that water in times of need (TAC § 27.151) Currently, there are only three ASR facilities operating in the state of Texas, (El Paso, Kerrville, San Antonio), but there are currently 17 other listed project sites that are in the process of acquiring ASR capabilities (Texas Water Development Board, 2019b). Indirect or Direct Water Reuse Water Reuse, or water reclamation, is another method of supply management that focuses on using treated wastewater for either potable or non-potable use. There are two major categories of water reuse, “direct” and “indirect” use. Direct reuse refers to water that is piped directly from a wastewater treatment facility to a distribution system, while indirect reuse refers to the discharge of reclaimed water back into a lake, river, aquifer, or another body of water with the intent of retrieving it for later use (Texas Water Development Board, 2019g). Both types of water reuse can be used for potable (drinking or bathing) or non-potable uses (irrigation or commercial).
15
Seawater or Groundwater Desalination Sea or groundwater desalination involves removing salt and or other dissolved solids from saline water to turn it into freshwater (Texas Living Waters, 2020). All 49 Texas desalination plants currently only desalinate “brackish” groundwater (water that contains between 1,000 and 10,000 milligrams of salt and or other dissolved solids per liter of water) (Texas Water Development Board, 2020a). This list of strategies is not exhaustive, and is merely a reflection of the strategies that were identified when researching and interviewing municipalities for this report. Another topic of discussion is the implementation of these strategies, and what allows for or limits municipalities. A municipality’s financing options is a major factor in what strategies it ultimately utilizes, and is discussed in the following section.
16
Chapter Two: Financing Water Infrastructure
A significant aspect of the state water planning process is estimating the number of projects required to meet growing demand, and the costs of those projects. For municipalities, investing in projects that address water security is wise and often necessary. However, there are decisions that need to be made in the municipal budgeting process about when and how to invest in these projects. There are costs associated with pre-development and financial planning, development of the project itself, and the ongoing operations and maintenance of the project that must be accounted for (United States Environmental Protection Agency, 2017). Projects need to be funded and possibly financed. A combination of users and taxpayers will ultimately pay for the infrastructure mostly in the form of user fees. Municipalities must recognize what their fiscal capacity is and what infrastructure projects they can realistically pursue through funding or financing. Water infrastructure is essential, and being aware of the various financial options available to municipalities to pay for the infrastructure will assist them in making these important decisions. Finance Literature Review Deteriorating infrastructure remains a major concern across the U.S. According to the American Society of Civil Engineers (ASCE), the cumulative infrastructure grade of the US in 2017 was a D+ (American Society of Civil Engineers, 2017). Improving and maintaining water and wastewater infrastructure, however, sometimes does not receive the attention it deserves. Infrastructure projects that are more visible such as roads and bridges usually receive more attention from the general public. Water infrastructure is usually out-of-sight and out-of-mind, but it too relies on a network of aging pipes and pumps in need of improvement and maintenance. In the same 2017 ASCE infrastructure report card, drinking water infrastructure specifically received a D grade (American Society of Civil Engineers, 2017). Estimates differ on the total cost of meeting water infrastructure needs, but it is clear that it will be significant. In a 2015 needs survey and assessment, the EPA estimated a need of $472.6 billion over the next 20 years in infrastructure investments (United States Environmental Protection Agency, 2018a). The American Water Works Association estimates that the cost of restoring underground pipes alone would exceed $1 trillion over the next 25 years. This estimation does not include the cost of constructing new infrastructure or repairing treatment plants (Buckley et al., 2016). At the state level, Texas also faces water infrastructure financing and funding challenges. There is a strong need for water infrastructure construction and renovation that will be quite costly. It is estimated that to construct the TWDB’s recommended 2,500 water projects, it will require a total investment of about $63 billion by 2070 (Texas Water Development Board, 2017). Failure to
17
adequately invest in the suggested water projects could result in an estimated annual economic loss of somewhere between $73 billion in 2020 to $151 billion by 2070 (Texas Water Development Board, 2017). These projections are beholden to changes in water demand and supply. Moreover, municipal water authorities alone do not have the capacity to directly and unilaterally finance the required capital projects that their jurisdictions demand. In January 2016, a report from water providers indicated that an estimated $36.2 billion would be needed in state financial assistance (Texas Water Development Board, 2017). In this section, various water resource financing options that are available in Texas will be reviewed. Water-related capital projects tend to be expensive endeavors for municipal governments. The scale of these projects can often be too costly for many local governments to fund internally. As a result, a wide suite of financing tools that involve internal resources and external resources, such as state-provided financing options and private investment, are used to meet the water infrastructure needs of Texas communities. Funding of Capital Infrastructure There are distinct differences between financing and funding of capital infrastructure investment. Financing involves the acquisition of capital for project purposes that is to be repaid in principal and with interest. For example, bonds issued by government entities usually have maturity dates that correspond with when the borrower is expected to fully pay off the issued debt. Thus, financing provides a plan for the allocation of funds over a period of time, but it does not actually provide the money needed to pay off the project costs. Alternatively, funding is the actual means to which the capital project costs will be paid off, which can include funding from grants and user fees. Grant opportunities for communities are provided by the federal government through programs such as the US Department of Agriculture (USDA) Rural Development Water and Environmental Program and Housing and Urban Development (HUD) Community Development Block Grants. Grant funding tends to be the most popular form of state funding across the United States as it does not place any additional constraints or burden upon the resources of states like loan programs do. Further explanation of the financing programs involved are included below in the state financing subsection. The primary funding source for most municipal water services at the local level is through the levying of user fees. There are several different designs for how these user fees are structured. The conventional fee structure is a simple uniform rate that may or may not involve a simple fixed cost. In this model, water usage is effectively charged the same rate regardless of the quantity consumed (Grigg, 2011). An alternative method to this is to use block rate pricing that involves different tiers dependent on how much water the individual or entity consumes (Tiger et al., 2014). There are other structures that come into play here, such as surcharges, time of day pricing, and seasonal
18
pricing (United States Environmental Protection Agency, n.d.a). These pricing structures serve not only to address the marginal costs associated with the provision of water utilities, but also to serve other ancillary goals, such as increased water conservation (Tiger et al., 2014). Conservation being a conflicting goal that aims to decrease water demand has been a point of conflict in terms of a sustainable funding structure. Local Financing in Texas Local governments are responsible for building and maintaining a significant portion of the water infrastructure in Texas. However, water infrastructure projects often require more financial capital investment than what is immediately available through local governments’ cash funds. Due to this lack of liquid funds, those in charge of water resources will seek to issue tax-exempt municipal bonds to obtain the necessary capital. The tax exemption allows local governments to borrow cheaply and therefore functions as a subsidy for investment (Tax Policy Center, 2020). General Obligation & Revenue Backed Bonds The two major types of bonds are general obligation (GO) bonds and revenue backed bonds. GO Bonds pledge any assets and available revenue to repay debt, while revenue bonds come from a dedicated revenue like utility fees. The more common way of financing water infrastructure is through the issuance of revenue bonds that are repaid through water servicing fees. It is difficult to isolate the bond issues for just water and sewer related projects since many fund various projects all in one issuance, but its use for water infrastructure is significant. Overall, the total outstanding bonds for water districts within Texas are currently at roughly $48 billion (Texas Bond Review Board, 2019). Other Bonds Although it is a relatively new segment of the bond market, green bonds are gaining some attention. Green Bonds are intended to finance particular climate and environmental projects and can encourage more sustainably-minded infrastructure. Some have found green bonds to be priced at a premium, but their use has grown in recent years (Baker et al., 2019). Private-activity bonds are another available segment of the bond market. Private-activity bonds are issued by local governments to fund private projects that serve some public purpose (Maguire & Negley, 2008). This can be used as a tool for attracting private investment into a public-private partnership (P3) arrangement. Certificates of Obligation Another debt instrument afforded to local governments in Texas are certificates of obligation. Initially authorized by Texas’ Certificate of Obligation (CO) Act of 1971, COs can be issued to fund public works projects without voter approval (Vela, 2017). This can be useful when municipalities need the flexibility to pursue certain projects, especially in cases of emergency.
19
However, the public can then become burdened with debt levels and projects that they do not fully understand the consequences of. CO issuance has been on the rise in Texas, and in major metropolitan areas where political subdivisions overlap, the overall CO debt can grow rapidly (Vela, 2017). Apart from the conventional municipal bonds, these additional options have pros and cons that must be weighed to finance water infrastructure at the local level. In many cases, municipal governments that are responsible for the governance of water supply and water security simply do not have the means to finance major water projects using their own resources. A variety of barriers may prevent municipalities from issuing the necessary debt needed to finance water infrastructure projects. In some cases, the local government entity might have a poor credit rating that prevents them from issuing bonds at a manageable interest rate that are appealing to investors. In other instances, issuing debt for pertinent water projects might be infeasible due to costs exceeding the threshold for the government’s binding debt policy. In these instances, municipal water managers must look to external sources at the state and federal levels, as well the nonprofit sector and through public-private-partnerships in order to acquire needed capital. State Financing in Texas The state government of Texas, through the TWDB, offers a varied suite of financing tools and options for local governments to access capital for water utility projects. These options include grants as well as loan opportunities that allow for local governments to use the state’s credit to attain lower interest debt. These tools vary in specialization and focus. These include loans and grants targeted towards rural communities or even loans targeted at serving groundwater conservation districts. Federally supported SRFs are also options provided by the state. The array of options provides municipalities with many cost-effective choices. Some municipalities may be more limited in their choices than others, but each program provides favorable terms for financial assistance. Clean Water Act of 1972: State Revolving Funds States’ difficulty in financing water infrastructure projects has long been federally recognized. In 1972, Congress passed the Clean Water Act, which included an expanded role for the federal government to provide financial assistance to state and local governments for water infrastructure projects. This financial assistance came primarily in the form of grants, but overtime, the process became unsustainable. The Construction Grant Program, a product of the 1972 Clean Water Act, led to the construction of many wastewater treatment facilities. However, local governments began to undervalue less expensive but more appropriate projects and underinvest in the operation and maintenance of its services (Pollock, 1991). In order to redirect these incentives, in 1987, Congress amended the Clean Water Act to provide SRFs as a permanent source of funding at the state level.
20
Additionally, the EPA became the facilitator of these programs by providing guidance and overseeing reporting and monitoring requirements (Pollock, 1991). The intention of SRFs is to provide low-interest loans for investments in water infrastructure with a flexible regulatory and statutory framework uniquely suited to address the specific challenges of states (Pollock, 1991). With much of the financial burden shifted from the federal government to states and municipalities, states’ ability to shape institutional features has also shifted. Loan repayments, interest, and fees allow the SRFs to replenish and be used by future recipients (Mullin & Daley, 2018). SRFs are also viewed as financial intermediaries that can perform the functions of brokerage and qualitative asset transformation (Johnson, 1995). Using effective debt management strategies, Texas has developed a relatively efficient financing structure. The cash flow structure of Texas’ SRFs are above the state’s general obligation bonds quality and provide a high level of debt service protection (Johnson, 1995). For each SRF, there is a strategic plan in place to address its programmatic goals, and each state uses different fund management strategies to ensure the program’s success (United States Environmental Protection Agency, 2018). Each year the federal government provides grants to SRF programs, and each state is required to provide a 20% match. Those funds are provided to communities in the form of loans, and the repayment of those loans helps the fund remain perpetual (Johnson, 1995). The federal provision and the state match can often be pooled and then leveraged by selling state bonds to generate a higher return on investment (Travis et al., 2004). However, the benefits of leveraging come with the increased costs of making investments riskier and potentially costlier via financial intermediaries. States should ensure they have the demand and internal resources to manage a leveraged SRF program (United States Environmental Protection Agency, 2018).
Clean Water & Drinking Water State Revolving Funds The two primary SRFs in Texas are CWSRF and DWSRF. Each fund involves meeting requirements set by the EPA, and the low-cost financing for a wide range of projects makes these funds accessible for municipalities. The projects these two SRFs address are wide-ranging and are offered year-round to municipalities. Both funds are funded by annual capitalization grants made by the US Congress through the EPA, requiring a twenty percent state funding match, loan repayments, and revenue bonds (Texas Water Development Board, 2017). The CWSRF and DWSRF have accounted for $9 billion and $3 billion in total investments over the course of each programs’ existence, respectively (Texas Water Development Board, 2019d; Texas Water Development Board, 2019e). Additionally, in FY 2018, CWSRF and DWSRF both made a total of 44 and 62 project commitments, respectively (Texas Water Development Board, 2018a; Texas Water Development Board, 2018b).
21
Another interesting aspect of SRFs is the idea of using them in conjunction with Energy Savings Performance Contracts for energy-efficient projects. SRFs can finance projects at a lower cost, allowing the project to capture more energy savings. In Texas, the LoanSTAR Revolving Loan Program is run by the Texas State Energy Conservation Office. The fund has been widely successful in allowing borrowers to benefit from energy savings and capital improvements (Booth et al., 2011). This is attractive to energy service companies in promoting low-interest loans to borrowers to have more energy-efficient infrastructure. Many states are also beginning to consider how to build climate-resilient communities. In order to integrate green infrastructure into SRFs states must prioritize and promote the use of SRF funds for green infrastructure projects and programs (Chou et al., 2014). Other industries and stakeholders are interconnected to and by water, and more integrated approaches to water resource management like these lead to community vitality overall (US Water Alliance, 2016). These are facets of SRFs that could be explored. Some program initiatives that are built, or are being built, into SRF funds have indeed helped to address and incentivize resiliency and sustainability. The Green Project Reserve present in both SRF funds offers eligible green projects a subsidy in the form of loan forgiveness (Texas Water Development Board, 2019a). Additionally, subsidies are offered to small disadvantaged communities. It should also be noted that technical assistance is provided to communities in need in order to fulfill the requirements of the SRF funds. Two of these programs are the Asset Management Program for Small Systems and the CPA to Go program. These programs were piloted in 2018 and 2019 respectively, and are additional benefits to an already wide-ranging program. State Water Implementation Fund for Texas (SWIFT) In 2013, Texas established SWIFT through a one-time $2 billion transfer from the state’s economic stabilization fund. SWIFT was created by the Texas Legislature and approved by Texas voters through a constitutional provision to provide necessary financial assistance to fund projects specified in the state water plan (Harris, n.d.). Assistance from this fund is made available to all government entities and nonprofit organizations that have projects that are included in the state water plan (Texas Water Development Board, 2017). There is no funding cap on this financial assistance and various repayment structures are available. As of 2019, a total of about $8.3 billion has been allocated towards projects across the state of Texas from SWIFT (Texas Water Development Board, 2019f). It was the intention of SWIFT to create a robust fund that incentivizes community involvement and investment into big but necessary infrastructure projects. Programs funded by SWIFT first need to be proposed in regional plans and ultimately adopted in the state water plan. Thus, intergovernmental coordination and regional planning is encouraged in order to receive the benefits of SWIFT funding. SWIFT provides 3 flexible financing structures which are low-interest
22
obligations, deferred obligations, and board participation (Texas Water Development Board, 2019). SWIFT funding still utilizes a prioritization process in order to rank and pursue the highest priority projects. The State Water Implementation Revenue Fund for Texas (SWIRFT) was authorized along with SWIFT in 2013. SWIRFT is authorized to issue revenue bonds to fund SWIFT loans and maintain SWIFT’s financial sustainability (Texas Comptroller of Public Accounts, 2016). The first two SWIRFT bonds issued by Texas were assigned an ‘AAA’ rating by Fitch Ratings partly based on their importance to the Water Plan and TWDB’s financial history (Texas Comptroller of Public Accounts, 2016). Loans repayments are typically repaid by the bond issued. Surplus repayments from SWIRFT Revenue Bonds are used to fund SWIFT, while bond enhancement agreements are transferred from SWIFT to SWIRFT in cases of loans with reduced interest or deferred payments (Texas Comptroller of Public Accounts, 2016). Overall, this relatively new program provides a much-needed dedicated source of funds to address the increasing number of water projects in Texas. The TWDB has never experienced a default in its history of initiating loans and grants. Maintaining its financial standing is an important consideration for Texas and municipalities when applying for SWIFT financial assistance. State-Funded Programs The oldest of TWDB’s state-funded programs is the Texas Water Development Fund (DFund). The program is supported by the issuance of general obligation bonds and funds together projects with typically separate components. For example, water and wastewater components can be combined into one loan under the DFund. It does not receive federal subsidies and it is not subject to federal crosscutters (Texas Water Development Board, 2020f). The State Participation (SP) Program encourages political subdivisions to pursue optimal needs, even if they cannot meet all of the funding commitments, so that necessary projects can still be pursued. As the name indicates, the SP program enables the TWDB to provide funding and assume a temporary ownership interest in a project when local sponsors cannot assume debt for optimal facilities (Texas Water Development Board, 2020e). Some projects require a 50-50 split in the financial commitments between the state and local entity, while other projects can be funded up to 80 percent by the TWDB. Groundwater District Conservation Loan Program & Regional Water Planning Group Grants Two other forms of financial assistance are the Groundwater District Conservation Loan Program (GDLP) and Regional Water Planning Group Grants (RWPGs). GDLP loans specifically finance the start-up costs of GCDs. As new GCDs are formed, the TWDB will provide GDLP loans for costs such as salaries, travel, utilities, building and office leases, and legal fees among other things (Texas Water Development Board, 2020c). RWPG grants are grants associated with the planning processes of each of the sixteen regions in Texas. At the discretion of the TWDB it will provide
23
financial assistance to planning groups where needed that will ensure each regional plan, and the larger state water plan, is as accurate and useful as possible (Texas Water Development Board, 2020d). While these programs do not directly finance water infrastructure or are directly applicable to municipalities, they are forms of financial assistance that are useful for municipalities to be aware of in partnerships. Economically Distressed Areas Program One of the programs aimed at addressing smaller or underserved water systems is the Economically Distressed Areas Program (EDAP). EDAP provides grants and loans to areas where service is unavailable or inadequate to meet state standards. The program originally operated on a first-come first-serve basis, but it has since instituted a prioritization process. In late 2019, voters approved GO bonds in an amount not to exceed $200 million for EDAP projects (Texas Water Development Board, 2020b). EDAP provides more substantial funding, but the Agricultural Water Conservation Grants and Loans, and Rural Water Assistance Fund are also aimed at serving smaller systems and specific purposes. Smaller municipalities can often have a more difficult time receiving financing as they may lack the resources and fiscal capacity of larger entities. Auditing or other technicalities of financing are one of these barriers as they are required in order to be eligible for state financing. TWDB, TCEQ, and the Texas Water Infrastructure Coordination Committee (TWICC) are three entities that have provided financial, technical, and managerial assistance that might be of particular use to small municipalities that face these problems. With many water infrastructure projects, the projects are broken up into several different forms of funding and financing. If part of a project can be funded partially by a grant, municipalities will take advantage of a grant and finance the remainder of a project with a loan. Particularly for smaller municipalities, taking advantage of subsidies and grants is imperative when receiving financing is difficult. Many grants are available through different agencies but can still be used for water infrastructure. The Texas Office of Rural and Community Affairs administers the Community Development Block Grant, a flexible, community-based, federal grant program that can be used for water and wastewater facilities among other projects (Theodori & Jensen, 2019). It is imperative for smaller municipalities to be creative in seeking financial resources and building capacity because receiving larger-scale financing can be difficult. Federal Financing The federal government has a vested interest in providing financing opportunities for water infrastructure projects across the country. The first implementation of federal financing was established with the passage of the Clean Water Act of 1972. This original provision allocated grant money to be used by local governments to construct sewage treatment plans in order to help meet the stringent water quality standards of the Clean Water Act. The original capital investment allocated by the federal government was designated at 75% of the total cost with the remainder
24
being picked up at the state level (Copeland, 2016). This was later modified in the 1987 Water Quality Act when the federal portions of these grants were significantly reduced and the financing was moved to a revolving loan model under Title VI resulting in the creation of CWSRF (United States Environmental Protection Agency, n.d.b). Water Infrastructure and Financing Innovation Act The CWSRF was further expanded in 2014 with the passage of the Water Infrastructure and Financing Innovation Act (WIFIA), which expanded the eligibility of the program thus enabling more municipalities to receive funds for projects. This also allowed for more innovative financing structures for water projects such as the further development of P3 options that could be used to secure capital investment. The program structure allows for up to 49% of project costs to be funded through it as well as minimum project size requirements that are dependent on community size (United States Environmental Protection Agency, 2019b). An important benefit of WIFIA loans is that they can be combined with various funding sources such as private equity, revenue bonds, corporate debt, grants, and SRFs (United States Environmental Protection Agency, 2019). For projects that need to be broken into different financing parts, this loan can be especially useful. The ultimate goal of this funding is to address the chronic water infrastructure deficiencies that have been pervasive throughout the U.S., and including in Texas. Other Loans & Grants Federal financing for water infrastructure can also come in the form of loans and grants through other agencies. For example, the United States Department of Agriculture provides funds specifically for rural development projects related to water and wastewater. It also provides financing to Colonias in addition to rural areas. Some of this is provided directly from the federal government, while other programs are administered through the Texas department of Agriculture. Many projects have utilized rural development and TWDB financing sources in the past. This also demonstrates the cross-financing aspect of most water infrastructure projects. Structuring financing in this way can help municipalities take advantage of multiple forms of financial assistance that may be available to them. Public-Private Partnerships Unfortunately, there are budgetary constraints with both local and state government entities that surround the management and financing of vital water projects, therefore the usage of private-public partnerships (P3) has proven to be a pervasive tool. Since the 1980s, there has been a notable trend towards the privatization of various components of water utility management and financing (Grigg, 2011). The trend toward the use of P3 has been attributed to the deficiencies in financial resources that have been provided by the federal government over the past few decades (Deye, 2015). Financing and management of water projects through public-private partnerships manifest in a number of different forms including Build-Own-Operate (BOO), Build-Operate-Transfer
25
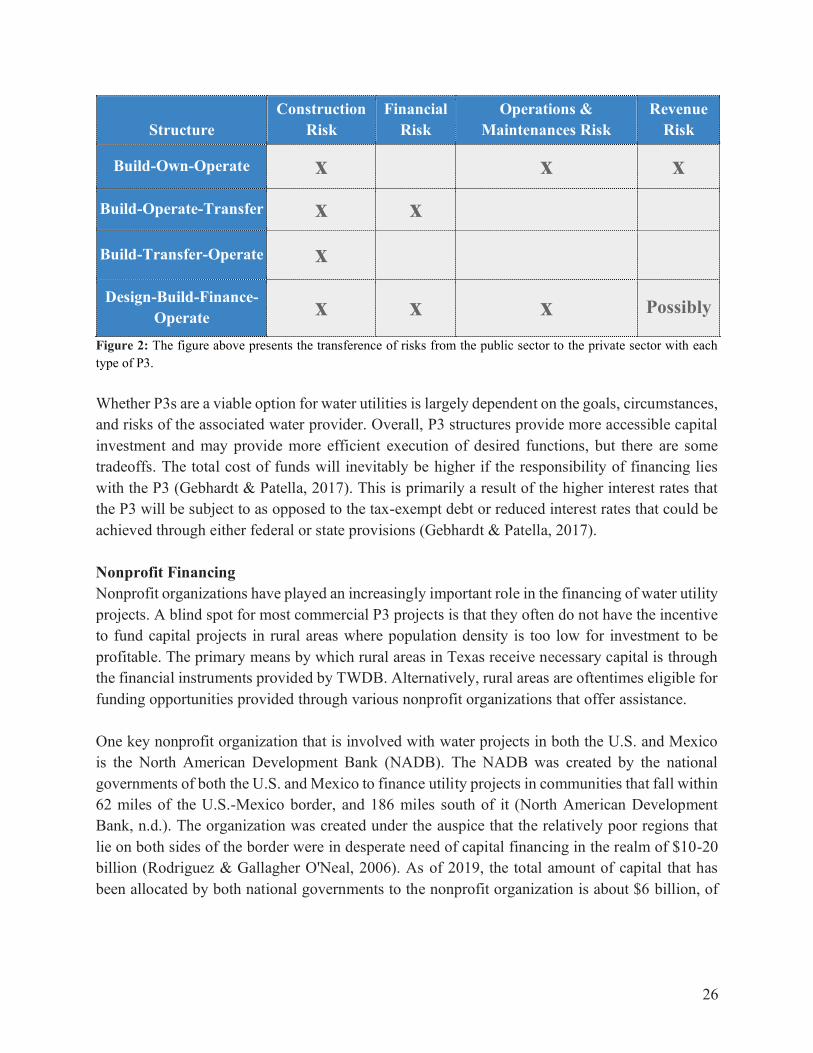
(BOT), Build-Transfer-Operate (BTO), and Design-Build-Finance-Operate (DBFO). These models exist along a spectrum that ranges from relatively close to the traditional approach to a more complete P3 model. The BOO model has traditionally been used for business to business contracts on projects, but public-sector usage has become more common. In this model, a government entity sells the rights to build a project to a private firm with the intention that the design specifications are met. Subsequently, the firms are then allowed to operate the project for the remainder of the project’s livelihood. In the realm of water supply management, an example can be found in the operation of water treatment plants. The public entity contracts with a private firm to build a desired water treatment plant, which is then owned and operated by the private firm perpetually. This model allows for the recoupment of investment costs by local governments in a timely manner but has the particular disadvantage of difficulties arising in administrative power over the constructed facility (Algarni et al., 2007). A specific example of this model is illustrated in the 130 Pipeline located in the Austin metropolitan area. The project provides wholesale water to three different municipalities in the area while being completely owned and operated by a multinational utility corporation called EPCOR (EPCOR, 2019). With the acquisition of the pipeline, EPCOR took on the full $71 million in contracts and debt (EPCOR, 2016). BOT and BTO both involve the same building agreement that exists for BOO, but there is an additional step added in the transfer of the project to the governmental entity at a specified point in time. In the BOT arrangement, this happens after a period of private operation whereas in a BTO partnership this occurs immediately after the finished construction of the project (Algarni et al., 2007). The BTO format allows for the private party to either receive a specified payment within the operation time period or to collect revenue payments from users within the operation time frame in order to cover the cost associated with the project (Schaufelberger & Wipadapisut, 2003). Even though these arrangements present opportunities for capital investment that would otherwise be unavailable, political barriers and resistance to change might result in these P3s not being utilized (Yescombe, 2007). Under a DBFO contract, the private entity is granted the right to operate the facility and collect resulting revenues, but the owner of the facility itself remains under the domain of the public entity. This model allegedly provides for allocated risk towards the party that is able to more adequately manage the project while still allowing for the public sector actor to still maintain control of the project (Yescombe, 2007). In the cases of water supply management and wastewater treatment, this is a valuable P3 option since it allows for the use of capital that would otherwise be unavailable, but also provides those responsible to the public for water supply and water security issues control of assets.
26
Structure Construction
Risk Financial
Risk Operations &
Maintenances Risk Revenue
Risk
Build-Own-Operate x x x Build-Operate-Transfer x x Build-Transfer-Operate x Design-Build-Finance-
Operate x x x Possibly
Figure 2: The figure above presents the transference of risks from the public sector to the private sector with each type of P3. Whether P3s are a viable option for water utilities is largely dependent on the goals, circumstances, and risks of the associated water provider. Overall, P3 structures provide more accessible capital investment and may provide more efficient execution of desired functions, but there are some tradeoffs. The total cost of funds will inevitably be higher if the responsibility of financing lies with the P3 (Gebhardt & Patella, 2017). This is primarily a result of the higher interest rates that the P3 will be subject to as opposed to the tax-exempt debt or reduced interest rates that could be achieved through either federal or state provisions (Gebhardt & Patella, 2017). Nonprofit Financing Nonprofit organizations have played an increasingly important role in the financing of water utility projects. A blind spot for most commercial P3 projects is that they often do not have the incentive to fund capital projects in rural areas where population density is too low for investment to be profitable. The primary means by which rural areas in Texas receive necessary capital is through the financial instruments provided by TWDB. Alternatively, rural areas are oftentimes eligible for funding opportunities provided through various nonprofit organizations that offer assistance. One key nonprofit organization that is involved with water projects in both the U.S. and Mexico is the North American Development Bank (NADB). The NADB was created by the national governments of both the U.S. and Mexico to finance utility projects in communities that fall within 62 miles of the U.S.-Mexico border, and 186 miles south of it (North American Development Bank, n.d.). The organization was created under the auspice that the relatively poor regions that lie on both sides of the border were in desperate need of capital financing in the realm of $10-20 billion (Rodriguez & Gallagher O'Neal, 2006). As of 2019, the total amount of capital that has been allocated by both national governments to the nonprofit organization is about $6 billion, of
27
which $415 million is paid-in capital and roughly $2.4 billion in callable capital (North American Development Bank, n.d.). The Paisano Water Valley Project, located in the El Paso area, provides a relevant example of the financing that the NADB provides towards water utility projects. The purpose of this project was to ultimately replace a large set of water utility lines that had originally been constructed in 1955 (North American Development Bank, n.d.). The project involved the completion of two separate project phases that were designated for different geographic regions in the Paisano Valley area. The final project costs totaled up to about $18 million with loans from the NADB financing $15 million of the sum (North American Development Bank, n.d.). Municipalities have a range of options when it comes to financing their water infrastructure needs. They can seek different forms of financing from different levels of government, or utilize the private and nonprofit sectors. TWDB programs are the most commonly utilized due to the attractive financial conditions associated with programs that the state can offer. However, private and nonprofit financing options can be a useful choice for municipalities with certain conditions. Often different sources of funding and financing are used in conjunction to pursue water infrastructure projects. Exploring the options to finance water infrastructure projects is an ongoing process that municipalities must constantly account for.
28
Chapter Three: Studying Water Security in Texas
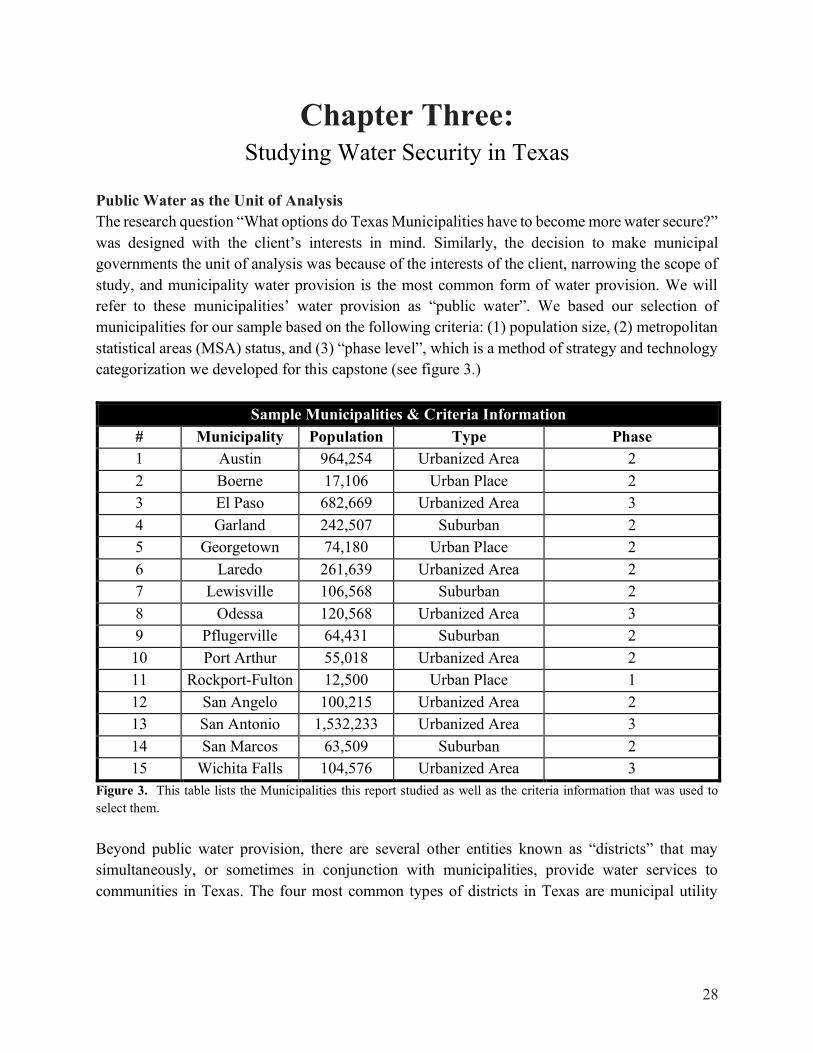
Public Water as the Unit of Analysis The research question “What options do Texas Municipalities have to become more water secure?” was designed with the client’s interests in mind. Similarly, the decision to make municipal governments the unit of analysis was because of the interests of the client, narrowing the scope of study, and municipality water provision is the most common form of water provision. We will refer to these municipalities’ water provision as “public water”. We based our selection of municipalities for our sample based on the following criteria: (1) population size, (2) metropolitan statistical areas (MSA) status, and (3) “phase level”, which is a method of strategy and technology categorization we developed for this capstone (see figure 3.)
Sample Municipalities & Criteria Information # Municipality Population Type Phase 1 Austin 964,254 Urbanized Area 2 2 Boerne 17,106 Urban Place 2 3 El Paso 682,669 Urbanized Area 3 4 Garland 242,507 Suburban 2 5 Georgetown 74,180 Urban Place 2 6 Laredo 261,639 Urbanized Area 2 7 Lewisville 106,568 Suburban 2 8 Odessa 120,568 Urbanized Area 3 9 Pflugerville 64,431 Suburban 2 10 Port Arthur 55,018 Urbanized Area 2 11 Rockport-Fulton 12,500 Urban Place 1 12 San Angelo 100,215 Urbanized Area 2 13 San Antonio 1,532,233 Urbanized Area 3 14 San Marcos 63,509 Suburban 2 15 Wichita Falls 104,576 Urbanized Area 3
Figure 3. This table lists the Municipalities this report studied as well as the criteria information that was used to select them. Beyond public water provision, there are several other entities known as “districts” that may simultaneously, or sometimes in conjunction with municipalities, provide water services to communities in Texas. The four most common types of districts in Texas are municipal utility
29
districts (MUDS), water control and improvement districts (WCIDs), special utility districts (SUDs), and river authorities (Texas Commission on Environmental Quality, 2019b). To further illustrate the diverse nature of these entities, each of these four districts have differing levels of authority and ability to incur debt, raise taxes, charge for services, enter into contracts, obtain easements, or exercise eminent domain (Texas Commission on Environmental Quality, 2019b). For example, while SUDS provide water, wastewater, and firefighting services like MUDs, they cannot levy taxes and thus cannot expand in the same way MUDs tend to expand. While river authorities mostly operate major reservoirs to sell untreated water on a wholesale basis, they also cannot levy taxes but are able to issue revenue bonds based on projected revenue (Texas Commission on Environmental Quality, 2019b). WCIDs have broad authority to supply and store water for purposes that include commercial and industrial use, and like SUDs and MUDs can also operate sanitary wastewater systems, providing irrigation, drainage, and water-quality services (Texas Commission on Environmental Quality, 2019b). Additionally, MUDs and river authorities provide services that do not necessarily relate to water provision, such as garbage collection and disposal, and flood control, respectively (Texas Commission on Environmental Quality, 2019b). With so much variation, and after consideration and input from our client, our capstone decided to focus on just one aspect of the water provision system in Texas - water managed by municipalities.
30
Figure 4: Municipal Utility Districts are listed in red on this map. MUDs tend to cluster around urban or population dense areas, with many Texas MUDs found in the Austin, San Antonio, Dallas-Fort Worth, and Houston areas (TCEQ, 2017). An advantage of selecting municipal government water provision as the unit of analysis is how common this water provider is, increasing the likelihood of finding this form of water provision across a variety of settings, such as rural, suburban, and urban, as opposed to Municipal Utility Districts, to name one example, which tend to cluster in more population dense areas (see figure 4). Additionally, the commonality of municipal water providers would provide more information to conduct analysis. However, not all Texas municipalities are the same. Texas municipalities can vary widely by factors such as population, density, demography, and access to water resources. Population and Metropolitan Statistical Area Status as Criteria for Selection Population and metropolitan statistical area status were selected as a criterion for the selection of cases to study because of the possible link between these variables and the financial considerations municipalities may have when deciding their water management strategies, technologies, or future investment. For example, rural municipalities may rely on strategies that cost less compared to
31
urban municipalities because their tax bases may not be small and thus their ability to fund or debt finance water projects may be limited. In addition, we consider MSA status because it allows us to identify municipalities that are considered “suburbs”. Identifying which municipalities are suburbs is important because, while small in size, suburbs often have proportionally large tax bases and higher median income levels than even large cities. Additionally, rural, suburban, and urban settings may have different industries that require different levels of water demand and, thus, deriving different types of strategies. This study uses a combination of the State of Texas and US Census Bureau definitions that overlap to define municipality, as well as whether or not a municipality is rural, suburban or urban. Texas has over 46 different definitions of what “rural” is, depending on the context, and because “municipality” is interpreted to be the geographic equivalent of the Census Bureau’s term “incorporated place” (Texas Legislative Council, 2018). In order to standardize the language, the following definitions were selected: The 2010 Decennial Census lists 1,752 recognized “places” within Texas (United States Census Bureau, 2010), with “places” being defined as “a concentration of population [that is not a county]” (United States Census Bureau, 2015). This “place” variable accounts for the fact that states vary in how they define villages, towns, municipalities and incorporated areas - instead of simply identifying any concentration of population no matter how small. For Texas, we define “rural” as being a place with a population that is smaller than 5,000. To be defined as a suburb, a place must be a part of a metropolitan statistical area, but may not be a principal city, and have a population below 50,000. We divide urban categorization into two components, an “urban place”, which is larger than 5,000 but smaller than 50,000, and an “urbanized place”, which is larger than 50,000. This division of the term urban is meant to reflect the reality that, while some populations are small in number, it may not be entirely accurate to label them as rural. Using these definitions, we use the Census data to compile descriptive statistics of the places in Texas. Of the 1,752 places in Texas, 1,368 are classified as Rural, 317 as Urban areas, 23 as Suburbs, and 44 as Urbanized Areas. The average median income for rural, urban areas, suburban, and urbanized places in Texas is $46,000, $48,877, $60,360, and $48,424 respectively. While the majority of places in Texas are rural, the majority of the population is concentrated in increasingly urban areas; only 9% of the Texas population is found in rural areas (1.68 million), followed by 11% in suburbs (2.11 million), 23% in urban places (4.5 million) and 58% in Urbanized Areas (11.36 million). Using this understanding of what municipalities look like from a population point of view, we move on to our final criteria which uses our own “phases framework”. Using “Phase” Framework as a Final Criteria for Selection Given that our team was studying the options Texas municipalities had to become more water secure, we found categorizing municipalities based on similarities of strategies or technologies
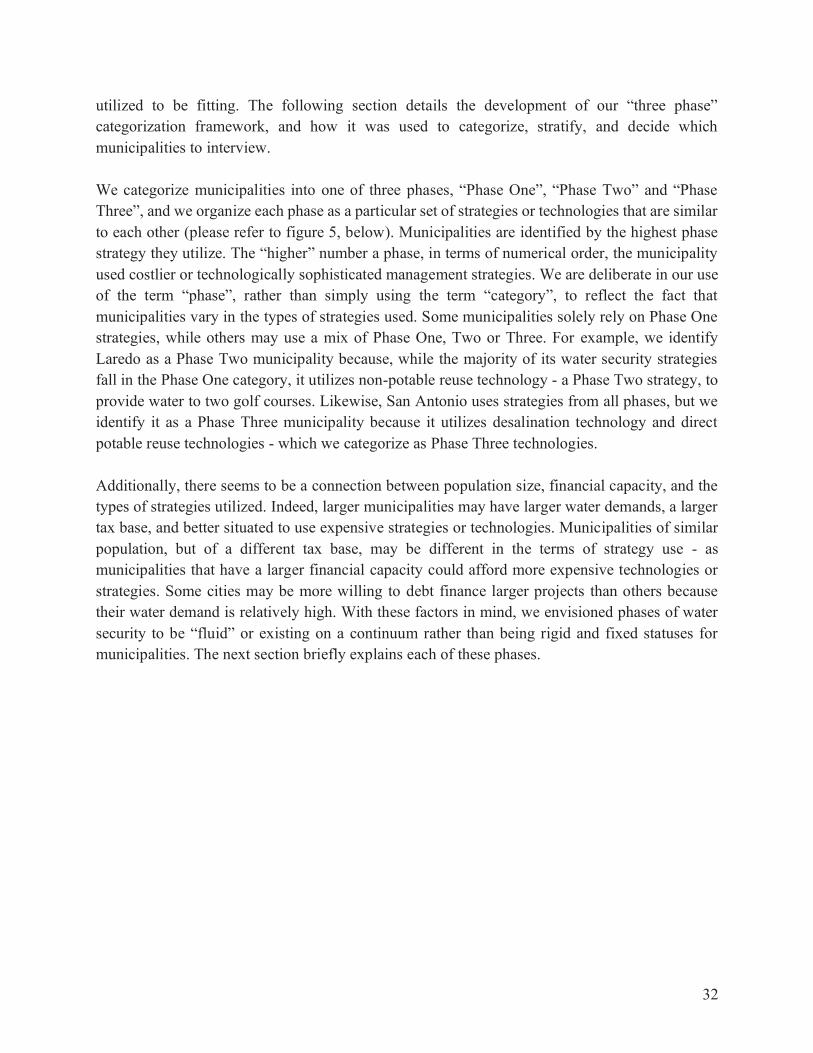
32
utilized to be fitting. The following section details the development of our “three phase” categorization framework, and how it was used to categorize, stratify, and decide which municipalities to interview. We categorize municipalities into one of three phases, “Phase One”, “Phase Two” and “Phase Three”, and we organize each phase as a particular set of strategies or technologies that are similar to each other (please refer to figure 5, below). Municipalities are identified by the highest phase strategy they utilize. The “higher” number a phase, in terms of numerical order, the municipality used costlier or technologically sophisticated management strategies. We are deliberate in our use of the term “phase”, rather than simply using the term “category”, to reflect the fact that municipalities vary in the types of strategies used. Some municipalities solely rely on Phase One strategies, while others may use a mix of Phase One, Two or Three. For example, we identify Laredo as a Phase Two municipality because, while the majority of its water security strategies fall in the Phase One category, it utilizes non-potable reuse technology - a Phase Two strategy, to provide water to two golf courses. Likewise, San Antonio uses strategies from all phases, but we identify it as a Phase Three municipality because it utilizes desalination technology and direct potable reuse technologies - which we categorize as Phase Three technologies. Additionally, there seems to be a connection between population size, financial capacity, and the types of strategies utilized. Indeed, larger municipalities may have larger water demands, a larger tax base, and better situated to use expensive strategies or technologies. Municipalities of similar population, but of a different tax base, may be different in the terms of strategy use - as municipalities that have a larger financial capacity could afford more expensive technologies or strategies. Some cities may be more willing to debt finance larger projects than others because their water demand is relatively high. With these factors in mind, we envisioned phases of water security to be “fluid” or existing on a continuum rather than being rigid and fixed statuses for municipalities. The next section briefly explains each of these phases.
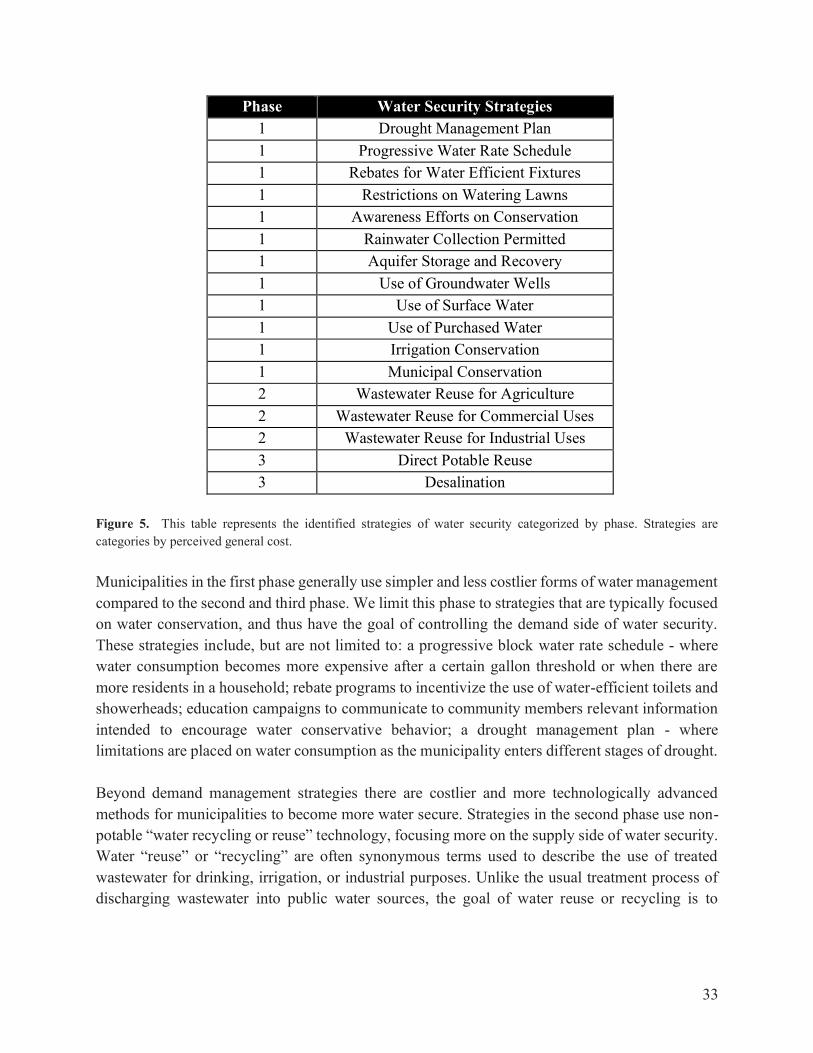
33
Phase Water Security Strategies 1 Drought Management Plan 1 Progressive Water Rate Schedule 1 Rebates for Water Efficient Fixtures 1 Restrictions on Watering Lawns 1 Awareness Efforts on Conservation 1 Rainwater Collection Permitted 1 Aquifer Storage and Recovery 1 Use of Groundwater Wells 1 Use of Surface Water 1 Use of Purchased Water 1 Irrigation Conservation 1 Municipal Conservation 2 Wastewater Reuse for Agriculture 2 Wastewater Reuse for Commercial Uses 2 Wastewater Reuse for Industrial Uses 3 Direct Potable Reuse 3 Desalination
Figure 5. This table represents the identified strategies of water security categorized by phase. Strategies are categories by perceived general cost. Municipalities in the first phase generally use simpler and less costlier forms of water management compared to the second and third phase. We limit this phase to strategies that are typically focused on water conservation, and thus have the goal of controlling the demand side of water security. These strategies include, but are not limited to: a progressive block water rate schedule - where water consumption becomes more expensive after a certain gallon threshold or when there are more residents in a household; rebate programs to incentivize the use of water-efficient toilets and showerheads; education campaigns to communicate to community members relevant information intended to encourage water conservative behavior; a drought management plan - where limitations are placed on water consumption as the municipality enters different stages of drought. Beyond demand management strategies there are costlier and more technologically advanced methods for municipalities to become more water secure. Strategies in the second phase use non-potable “water recycling or reuse” technology, focusing more on the supply side of water security. Water “reuse” or “recycling” are often synonymous terms used to describe the use of treated wastewater for drinking, irrigation, or industrial purposes. Unlike the usual treatment process of discharging wastewater into public water sources, the goal of water reuse or recycling is to
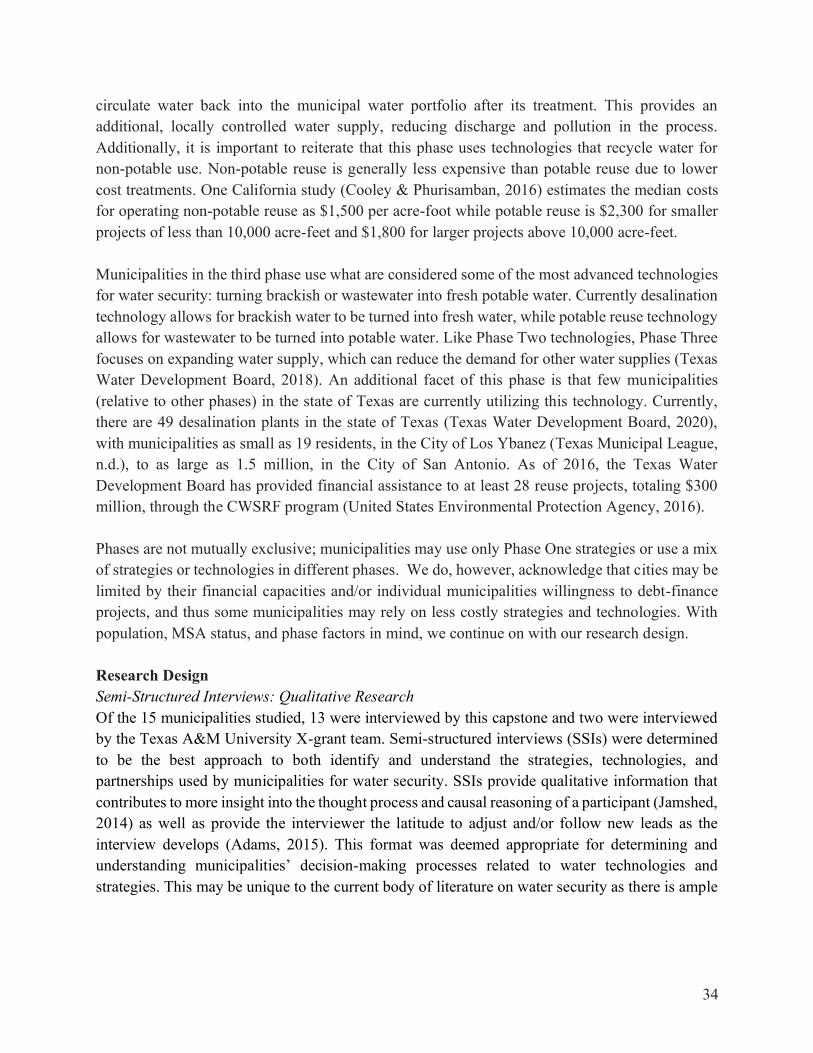
34
circulate water back into the municipal water portfolio after its treatment. This provides an additional, locally controlled water supply, reducing discharge and pollution in the process. Additionally, it is important to reiterate that this phase uses technologies that recycle water for non-potable use. Non-potable reuse is generally less expensive than potable reuse due to lower cost treatments. One California study (Cooley & Phurisamban, 2016) estimates the median costs for operating non-potable reuse as $1,500 per acre-foot while potable reuse is $2,300 for smaller projects of less than 10,000 acre-feet and $1,800 for larger projects above 10,000 acre-feet. Municipalities in the third phase use what are considered some of the most advanced technologies for water security: turning brackish or wastewater into fresh potable water. Currently desalination technology allows for brackish water to be turned into fresh water, while potable reuse technology allows for wastewater to be turned into potable water. Like Phase Two technologies, Phase Three focuses on expanding water supply, which can reduce the demand for other water supplies (Texas Water Development Board, 2018). An additional facet of this phase is that few municipalities (relative to other phases) in the state of Texas are currently utilizing this technology. Currently, there are 49 desalination plants in the state of Texas (Texas Water Development Board, 2020), with municipalities as small as 19 residents, in the City of Los Ybanez (Texas Municipal League, n.d.), to as large as 1.5 million, in the City of San Antonio. As of 2016, the Texas Water Development Board has provided financial assistance to at least 28 reuse projects, totaling $300 million, through the CWSRF program (United States Environmental Protection Agency, 2016). Phases are not mutually exclusive; municipalities may use only Phase One strategies or use a mix of strategies or technologies in different phases. We do, however, acknowledge that cities may be limited by their financial capacities and/or individual municipalities willingness to debt-finance projects, and thus some municipalities may rely on less costly strategies and technologies. With population, MSA status, and phase factors in mind, we continue on with our research design. Research Design Semi-Structured Interviews: Qualitative Research Of the 15 municipalities studied, 13 were interviewed by this capstone and two were interviewed by the Texas A&M University X-grant team. Semi-structured interviews (SSIs) were determined to be the best approach to both identify and understand the strategies, technologies, and partnerships used by municipalities for water security. SSIs provide qualitative information that contributes to more insight into the thought process and causal reasoning of a participant (Jamshed, 2014) as well as provide the interviewer the latitude to adjust and/or follow new leads as the interview develops (Adams, 2015). This format was deemed appropriate for determining and understanding municipalities’ decision-making processes related to water technologies and strategies. This may be unique to the current body of literature on water security as there is ample
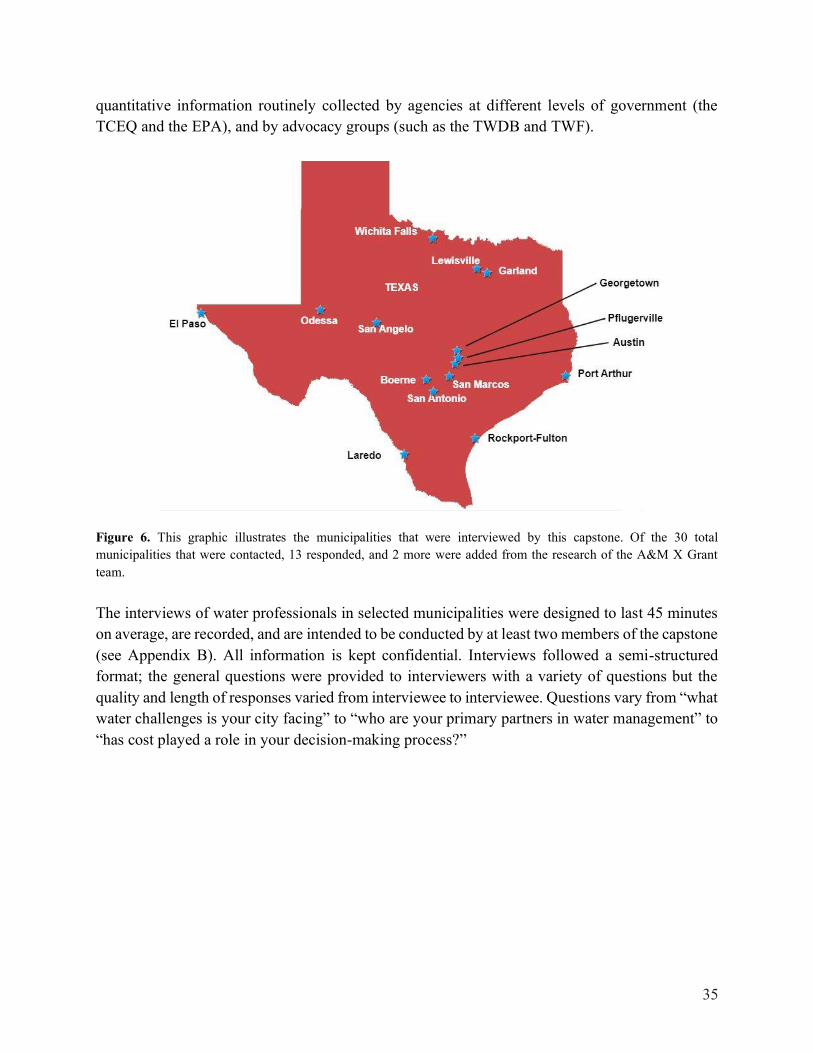
35
quantitative information routinely collected by agencies at different levels of government (the TCEQ and the EPA), and by advocacy groups (such as the TWDB and TWF).
Figure 6. This graphic illustrates the municipalities that were interviewed by this capstone. Of the 30 total municipalities that were contacted, 13 responded, and 2 more were added from the research of the A&M X Grant team. The interviews of water professionals in selected municipalities were designed to last 45 minutes on average, are recorded, and are intended to be conducted by at least two members of the capstone (see Appendix B). All information is kept confidential. Interviews followed a semi-structured format; the general questions were provided to interviewers with a variety of questions but the quality and length of responses varied from interviewee to interviewee. Questions vary from “what water challenges is your city facing” to “who are your primary partners in water management” to “has cost played a role in your decision-making process?”
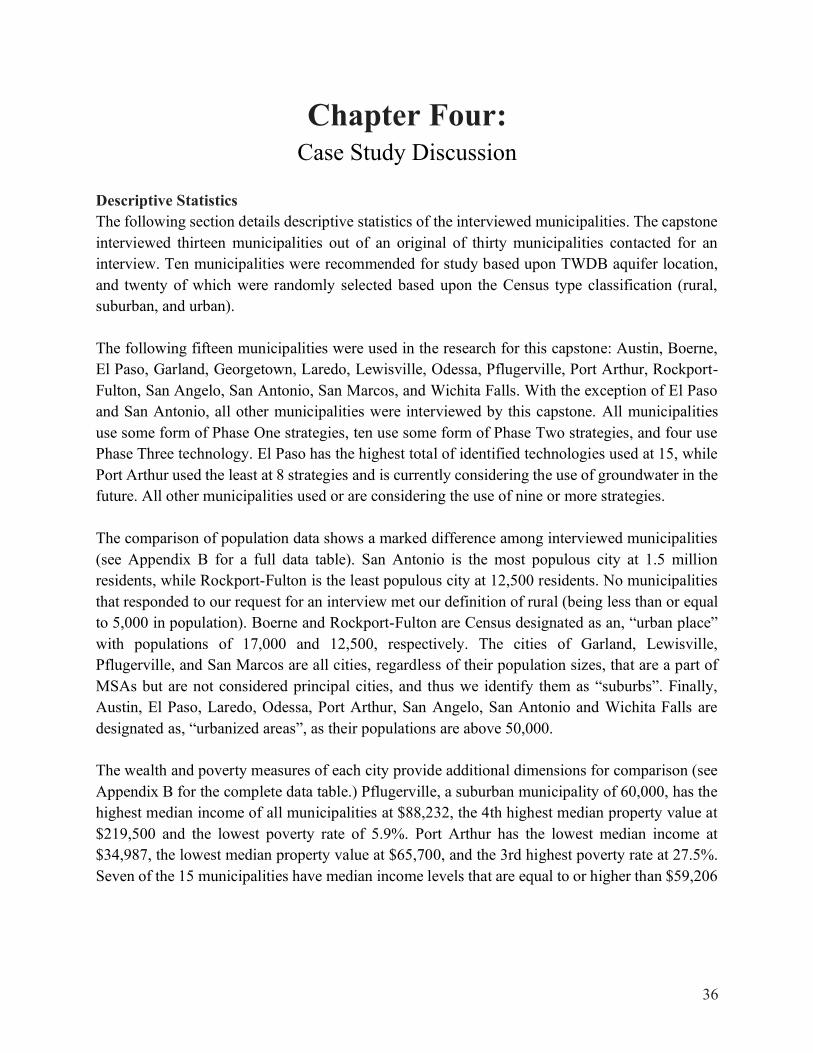
36
Chapter Four: Case Study Discussion
Descriptive Statistics The following section details descriptive statistics of the interviewed municipalities. The capstone interviewed thirteen municipalities out of an original of thirty municipalities contacted for an interview. Ten municipalities were recommended for study based upon TWDB aquifer location, and twenty of which were randomly selected based upon the Census type classification (rural, suburban, and urban). The following fifteen municipalities were used in the research for this capstone: Austin, Boerne, El Paso, Garland, Georgetown, Laredo, Lewisville, Odessa, Pflugerville, Port Arthur, Rockport-Fulton, San Angelo, San Antonio, San Marcos, and Wichita Falls. With the exception of El Paso and San Antonio, all other municipalities were interviewed by this capstone. All municipalities use some form of Phase One strategies, ten use some form of Phase Two strategies, and four use Phase Three technology. El Paso has the highest total of identified technologies used at 15, while Port Arthur used the least at 8 strategies and is currently considering the use of groundwater in the future. All other municipalities used or are considering the use of nine or more strategies. The comparison of population data shows a marked difference among interviewed municipalities (see Appendix B for a full data table). San Antonio is the most populous city at 1.5 million residents, while Rockport-Fulton is the least populous city at 12,500 residents. No municipalities that responded to our request for an interview met our definition of rural (being less than or equal to 5,000 in population). Boerne and Rockport-Fulton are Census designated as an, “urban place” with populations of 17,000 and 12,500, respectively. The cities of Garland, Lewisville, Pflugerville, and San Marcos are all cities, regardless of their population sizes, that are a part of MSAs but are not considered principal cities, and thus we identify them as “suburbs”. Finally, Austin, El Paso, Laredo, Odessa, Port Arthur, San Angelo, San Antonio and Wichita Falls are designated as, “urbanized areas”, as their populations are above 50,000. The wealth and poverty measures of each city provide additional dimensions for comparison (see Appendix B for the complete data table.) Pflugerville, a suburban municipality of 60,000, has the highest median income of all municipalities at $88,232, the 4th highest median property value at $219,500 and the lowest poverty rate of 5.9%. Port Arthur has the lowest median income at $34,987, the lowest median property value at $65,700, and the 3rd highest poverty rate at 27.5%. Seven of the 15 municipalities have median income levels that are equal to or higher than $59,206
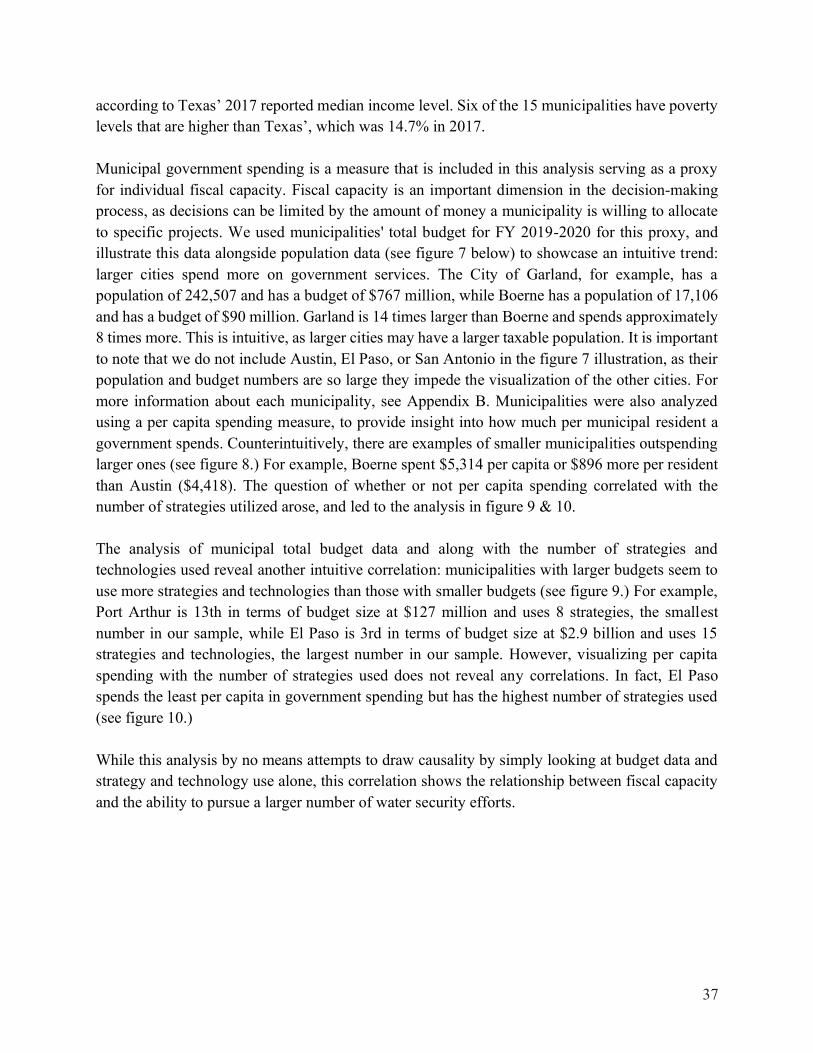
37
according to Texas’ 2017 reported median income level. Six of the 15 municipalities have poverty levels that are higher than Texas’, which was 14.7% in 2017. Municipal government spending is a measure that is included in this analysis serving as a proxy for individual fiscal capacity. Fiscal capacity is an important dimension in the decision-making process, as decisions can be limited by the amount of money a municipality is willing to allocate to specific projects. We used municipalities' total budget for FY 2019-2020 for this proxy, and illustrate this data alongside population data (see figure 7 below) to showcase an intuitive trend: larger cities spend more on government services. The City of Garland, for example, has a population of 242,507 and has a budget of $767 million, while Boerne has a population of 17,106 and has a budget of $90 million. Garland is 14 times larger than Boerne and spends approximately 8 times more. This is intuitive, as larger cities may have a larger taxable population. It is important to note that we do not include Austin, El Paso, or San Antonio in the figure 7 illustration, as their population and budget numbers are so large they impede the visualization of the other cities. For more information about each municipality, see Appendix B. Municipalities were also analyzed using a per capita spending measure, to provide insight into how much per municipal resident a government spends. Counterintuitively, there are examples of smaller municipalities outspending larger ones (see figure 8.) For example, Boerne spent $5,314 per capita or $896 more per resident than Austin ($4,418). The question of whether or not per capita spending correlated with the number of strategies utilized arose, and led to the analysis in figure 9 & 10. The analysis of municipal total budget data and along with the number of strategies and technologies used reveal another intuitive correlation: municipalities with larger budgets seem to use more strategies and technologies than those with smaller budgets (see figure 9.) For example, Port Arthur is 13th in terms of budget size at $127 million and uses 8 strategies, the smallest number in our sample, while El Paso is 3rd in terms of budget size at $2.9 billion and uses 15 strategies and technologies, the largest number in our sample. However, visualizing per capita spending with the number of strategies used does not reveal any correlations. In fact, El Paso spends the least per capita in government spending but has the highest number of strategies used (see figure 10.) While this analysis by no means attempts to draw causality by simply looking at budget data and strategy and technology use alone, this correlation shows the relationship between fiscal capacity and the ability to pursue a larger number of water security efforts.
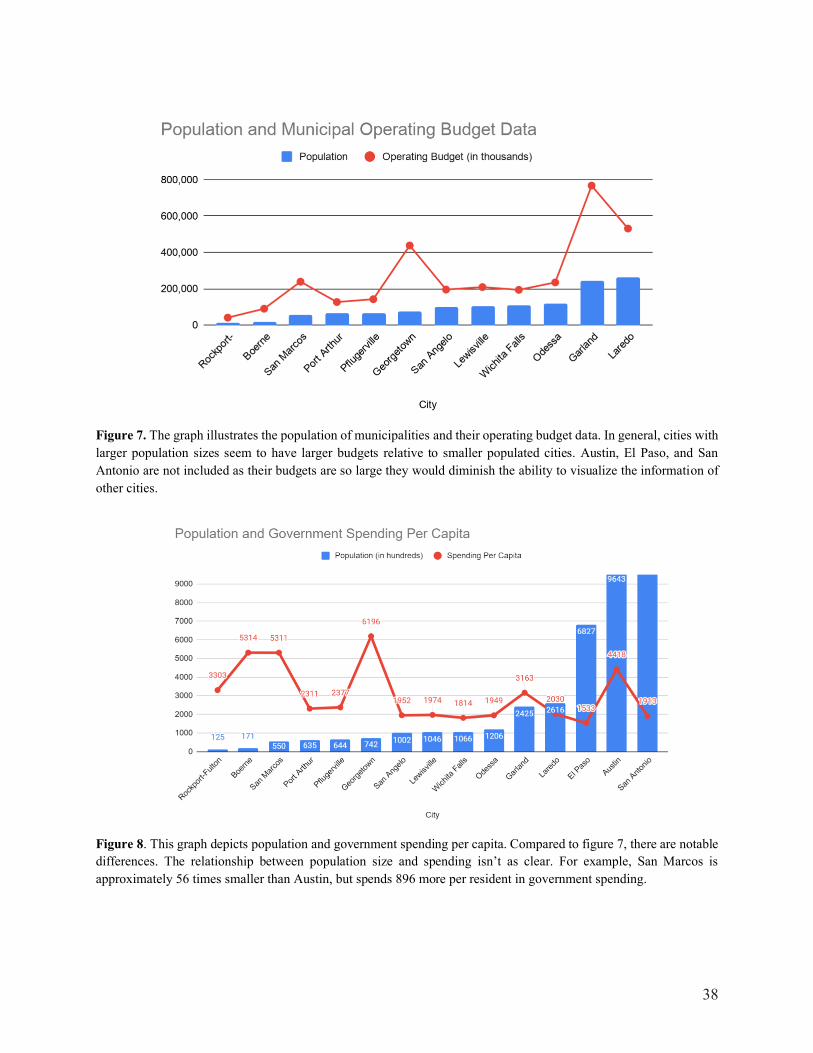
38
Figure 7. The graph illustrates the population of municipalities and their operating budget data. In general, cities with larger population sizes seem to have larger budgets relative to smaller populated cities. Austin, El Paso, and San Antonio are not included as their budgets are so large they would diminish the ability to visualize the information of other cities.
Figure 8. This graph depicts population and government spending per capita. Compared to figure 7, there are notable differences. The relationship between population size and spending isn’t as clear. For example, San Marcos is approximately 56 times smaller than Austin, but spends 896 more per resident in government spending.
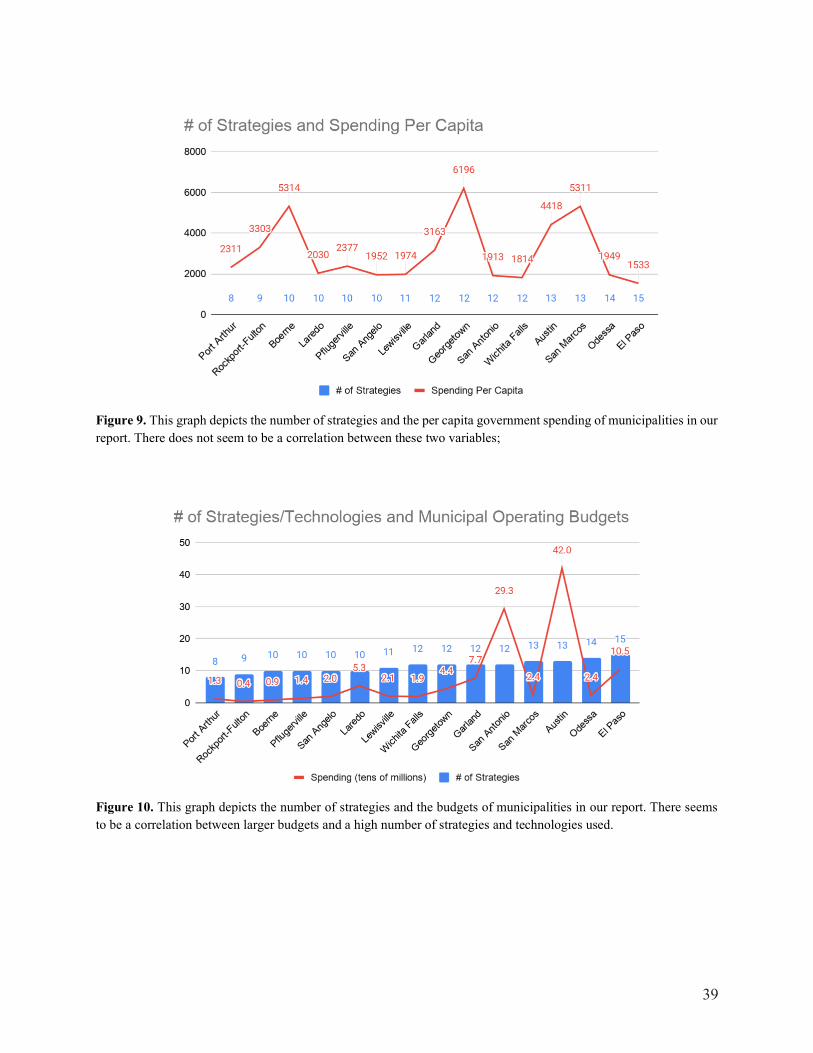
39
Figure 9. This graph depicts the number of strategies and the per capita government spending of municipalities in our report. There does not seem to be a correlation between these two variables;
Figure 10. This graph depicts the number of strategies and the budgets of municipalities in our report. There seems to be a correlation between larger budgets and a high number of strategies and technologies used.
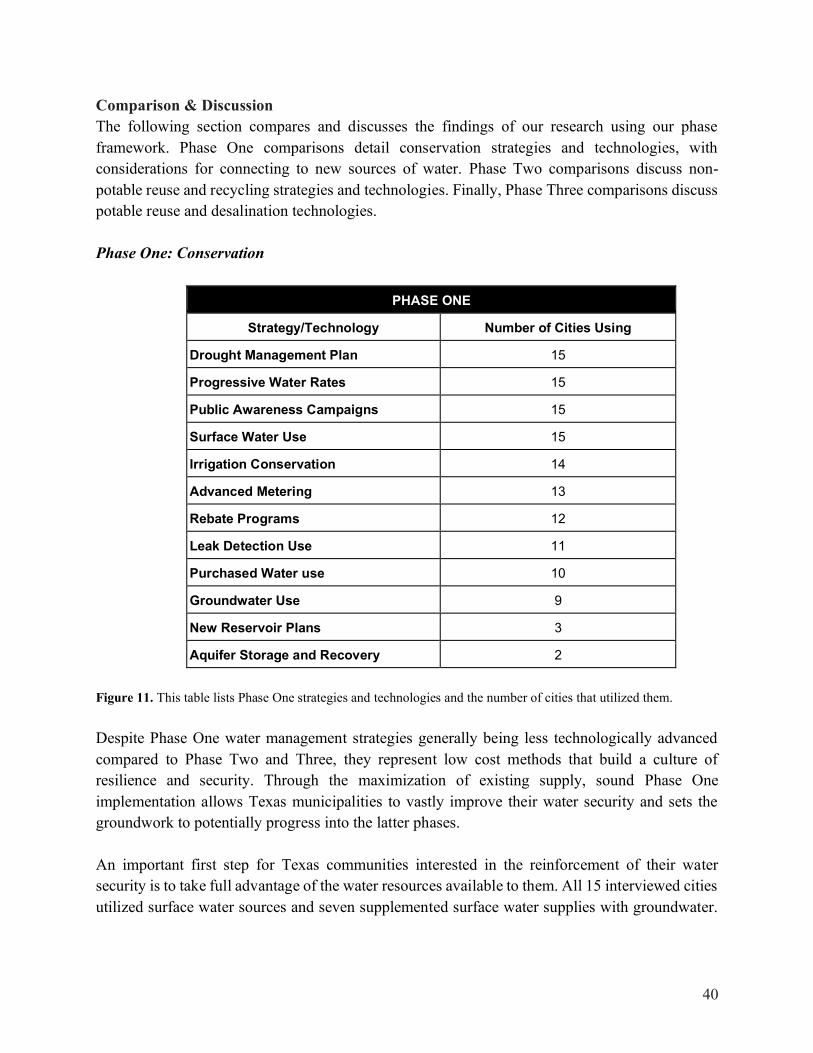
40
Comparison & Discussion The following section compares and discusses the findings of our research using our phase framework. Phase One comparisons detail conservation strategies and technologies, with considerations for connecting to new sources of water. Phase Two comparisons discuss non-potable reuse and recycling strategies and technologies. Finally, Phase Three comparisons discuss potable reuse and desalination technologies. Phase One: Conservation
PHASE ONE
Strategy/Technology Number of Cities Using
Drought Management Plan 15
Progressive Water Rates 15
Public Awareness Campaigns 15
Surface Water Use 15
Irrigation Conservation 14
Advanced Metering 13
Rebate Programs 12
Leak Detection Use 11
Purchased Water use 10
Groundwater Use 9
New Reservoir Plans 3
Aquifer Storage and Recovery 2
Figure 11. This table lists Phase One strategies and technologies and the number of cities that utilized them. Despite Phase One water management strategies generally being less technologically advanced compared to Phase Two and Three, they represent low cost methods that build a culture of resilience and security. Through the maximization of existing supply, sound Phase One implementation allows Texas municipalities to vastly improve their water security and sets the groundwork to potentially progress into the latter phases. An important first step for Texas communities interested in the reinforcement of their water security is to take full advantage of the water resources available to them. All 15 interviewed cities utilized surface water sources and seven supplemented surface water supplies with groundwater.
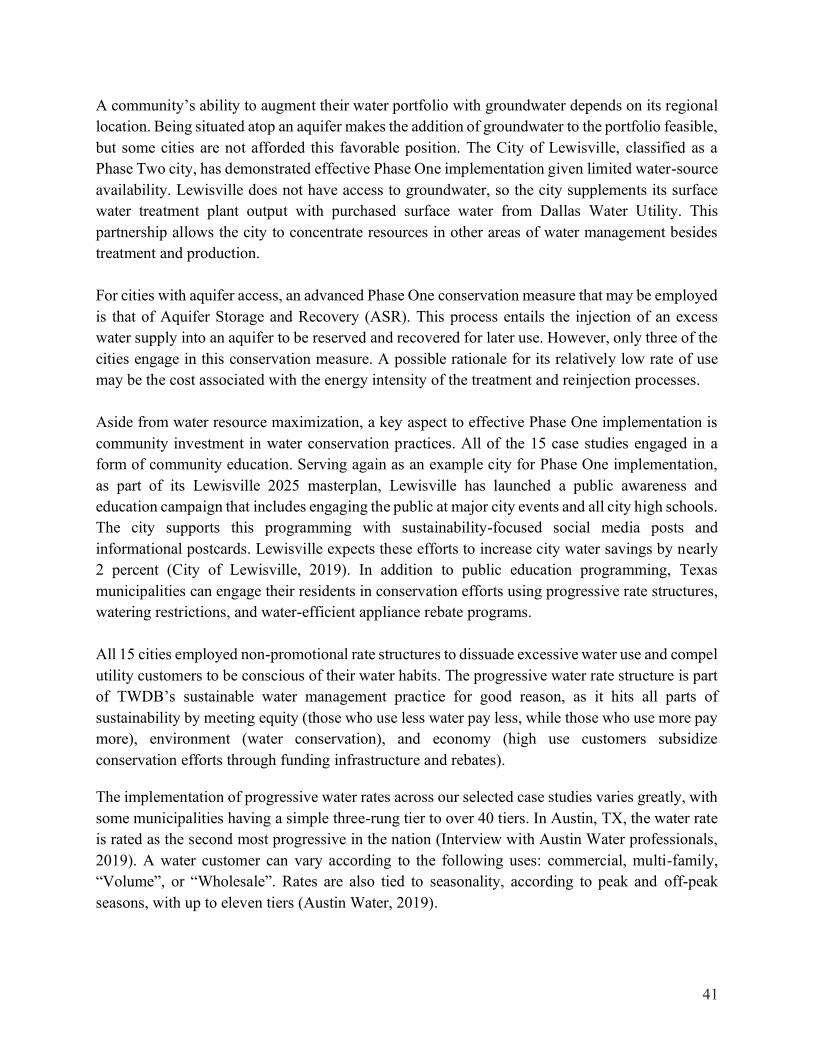
41
A community’s ability to augment their water portfolio with groundwater depends on its regional location. Being situated atop an aquifer makes the addition of groundwater to the portfolio feasible, but some cities are not afforded this favorable position. The City of Lewisville, classified as a Phase Two city, has demonstrated effective Phase One implementation given limited water-source availability. Lewisville does not have access to groundwater, so the city supplements its surface water treatment plant output with purchased surface water from Dallas Water Utility. This partnership allows the city to concentrate resources in other areas of water management besides treatment and production. For cities with aquifer access, an advanced Phase One conservation measure that may be employed is that of Aquifer Storage and Recovery (ASR). This process entails the injection of an excess water supply into an aquifer to be reserved and recovered for later use. However, only three of the cities engage in this conservation measure. A possible rationale for its relatively low rate of use may be the cost associated with the energy intensity of the treatment and reinjection processes. Aside from water resource maximization, a key aspect to effective Phase One implementation is community investment in water conservation practices. All of the 15 case studies engaged in a form of community education. Serving again as an example city for Phase One implementation, as part of its Lewisville 2025 masterplan, Lewisville has launched a public awareness and education campaign that includes engaging the public at major city events and all city high schools. The city supports this programming with sustainability-focused social media posts and informational postcards. Lewisville expects these efforts to increase city water savings by nearly 2 percent (City of Lewisville, 2019). In addition to public education programming, Texas municipalities can engage their residents in conservation efforts using progressive rate structures, watering restrictions, and water-efficient appliance rebate programs. All 15 cities employed non-promotional rate structures to dissuade excessive water use and compel utility customers to be conscious of their water habits. The progressive water rate structure is part of TWDB’s sustainable water management practice for good reason, as it hits all parts of sustainability by meeting equity (those who use less water pay less, while those who use more pay more), environment (water conservation), and economy (high use customers subsidize conservation efforts through funding infrastructure and rebates).
The implementation of progressive water rates across our selected case studies varies greatly, with some municipalities having a simple three-rung tier to over 40 tiers. In Austin, TX, the water rate is rated as the second most progressive in the nation (Interview with Austin Water professionals, 2019). A water customer can vary according to the following uses: commercial, multi-family, “Volume”, or “Wholesale”. Rates are also tied to seasonality, according to peak and off-peak seasons, with up to eleven tiers (Austin Water, 2019).
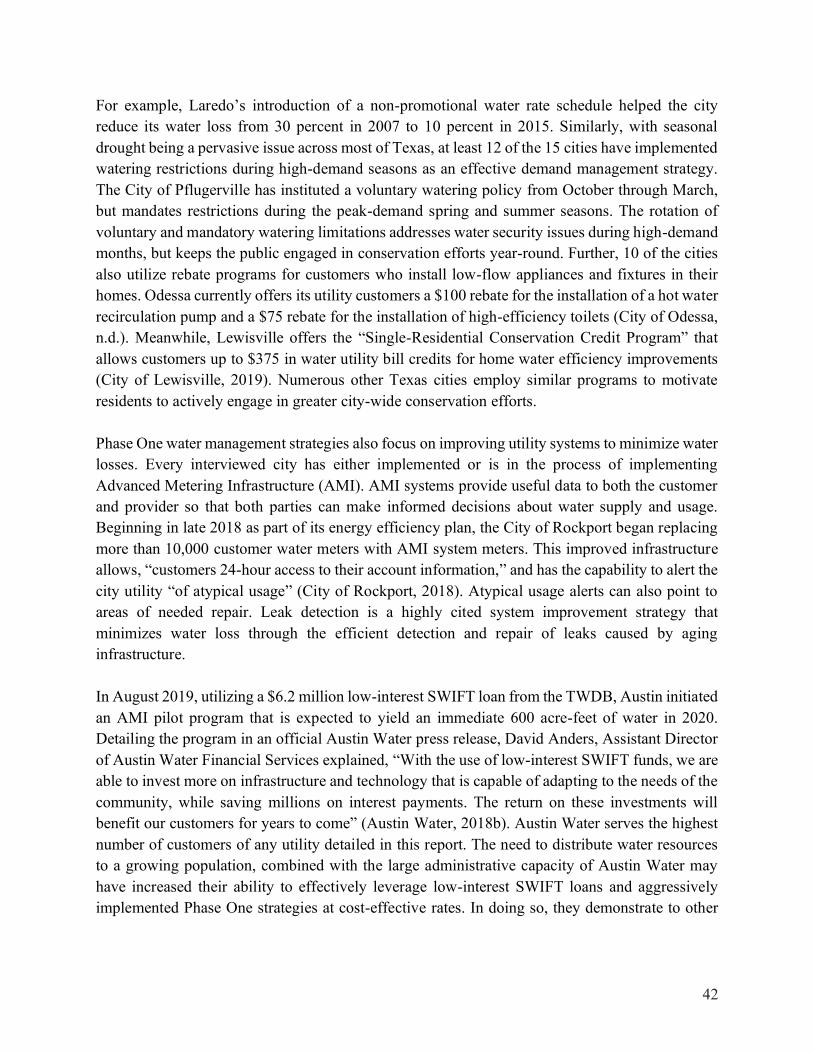
42
For example, Laredo’s introduction of a non-promotional water rate schedule helped the city reduce its water loss from 30 percent in 2007 to 10 percent in 2015. Similarly, with seasonal drought being a pervasive issue across most of Texas, at least 12 of the 15 cities have implemented watering restrictions during high-demand seasons as an effective demand management strategy. The City of Pflugerville has instituted a voluntary watering policy from October through March, but mandates restrictions during the peak-demand spring and summer seasons. The rotation of voluntary and mandatory watering limitations addresses water security issues during high-demand months, but keeps the public engaged in conservation efforts year-round. Further, 10 of the cities also utilize rebate programs for customers who install low-flow appliances and fixtures in their homes. Odessa currently offers its utility customers a $100 rebate for the installation of a hot water recirculation pump and a $75 rebate for the installation of high-efficiency toilets (City of Odessa, n.d.). Meanwhile, Lewisville offers the “Single-Residential Conservation Credit Program” that allows customers up to $375 in water utility bill credits for home water efficiency improvements (City of Lewisville, 2019). Numerous other Texas cities employ similar programs to motivate residents to actively engage in greater city-wide conservation efforts. Phase One water management strategies also focus on improving utility systems to minimize water losses. Every interviewed city has either implemented or is in the process of implementing Advanced Metering Infrastructure (AMI). AMI systems provide useful data to both the customer and provider so that both parties can make informed decisions about water supply and usage. Beginning in late 2018 as part of its energy efficiency plan, the City of Rockport began replacing more than 10,000 customer water meters with AMI system meters. This improved infrastructure allows, “customers 24-hour access to their account information,” and has the capability to alert the city utility “of atypical usage” (City of Rockport, 2018). Atypical usage alerts can also point to areas of needed repair. Leak detection is a highly cited system improvement strategy that minimizes water loss through the efficient detection and repair of leaks caused by aging infrastructure. In August 2019, utilizing a $6.2 million low-interest SWIFT loan from the TWDB, Austin initiated an AMI pilot program that is expected to yield an immediate 600 acre-feet of water in 2020. Detailing the program in an official Austin Water press release, David Anders, Assistant Director of Austin Water Financial Services explained, “With the use of low-interest SWIFT funds, we are able to invest more on infrastructure and technology that is capable of adapting to the needs of the community, while saving millions on interest payments. The return on these investments will benefit our customers for years to come” (Austin Water, 2018b). Austin Water serves the highest number of customers of any utility detailed in this report. The need to distribute water resources to a growing population, combined with the large administrative capacity of Austin Water may have increased their ability to effectively leverage low-interest SWIFT loans and aggressively implemented Phase One strategies at cost-effective rates. In doing so, they demonstrate to other
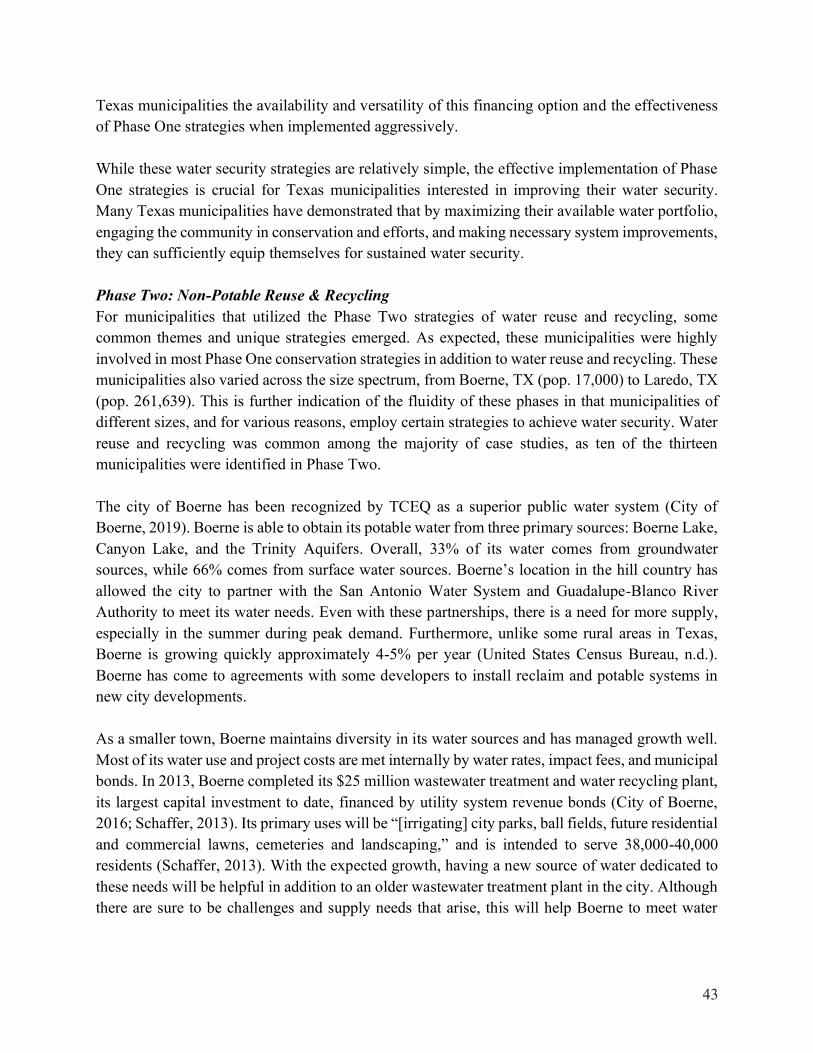
43
Texas municipalities the availability and versatility of this financing option and the effectiveness of Phase One strategies when implemented aggressively. While these water security strategies are relatively simple, the effective implementation of Phase One strategies is crucial for Texas municipalities interested in improving their water security. Many Texas municipalities have demonstrated that by maximizing their available water portfolio, engaging the community in conservation and efforts, and making necessary system improvements, they can sufficiently equip themselves for sustained water security. Phase Two: Non-Potable Reuse & Recycling For municipalities that utilized the Phase Two strategies of water reuse and recycling, some common themes and unique strategies emerged. As expected, these municipalities were highly involved in most Phase One conservation strategies in addition to water reuse and recycling. These municipalities also varied across the size spectrum, from Boerne, TX (pop. 17,000) to Laredo, TX (pop. 261,639). This is further indication of the fluidity of these phases in that municipalities of different sizes, and for various reasons, employ certain strategies to achieve water security. Water reuse and recycling was common among the majority of case studies, as ten of the thirteen municipalities were identified in Phase Two. The city of Boerne has been recognized by TCEQ as a superior public water system (City of Boerne, 2019). Boerne is able to obtain its potable water from three primary sources: Boerne Lake, Canyon Lake, and the Trinity Aquifers. Overall, 33% of its water comes from groundwater sources, while 66% comes from surface water sources. Boerne’s location in the hill country has allowed the city to partner with the San Antonio Water System and Guadalupe-Blanco River Authority to meet its water needs. Even with these partnerships, there is a need for more supply, especially in the summer during peak demand. Furthermore, unlike some rural areas in Texas, Boerne is growing quickly approximately 4-5% per year (United States Census Bureau, n.d.). Boerne has come to agreements with some developers to install reclaim and potable systems in new city developments. As a smaller town, Boerne maintains diversity in its water sources and has managed growth well. Most of its water use and project costs are met internally by water rates, impact fees, and municipal bonds. In 2013, Boerne completed its $25 million wastewater treatment and water recycling plant, its largest capital investment to date, financed by utility system revenue bonds (City of Boerne, 2016; Schaffer, 2013). Its primary uses will be “[irrigating] city parks, ball fields, future residential and commercial lawns, cemeteries and landscaping,” and is intended to serve 38,000-40,000 residents (Schaffer, 2013). With the expected growth, having a new source of water dedicated to these needs will be helpful in addition to an older wastewater treatment plant in the city. Although there are sure to be challenges and supply needs that arise, this will help Boerne to meet water
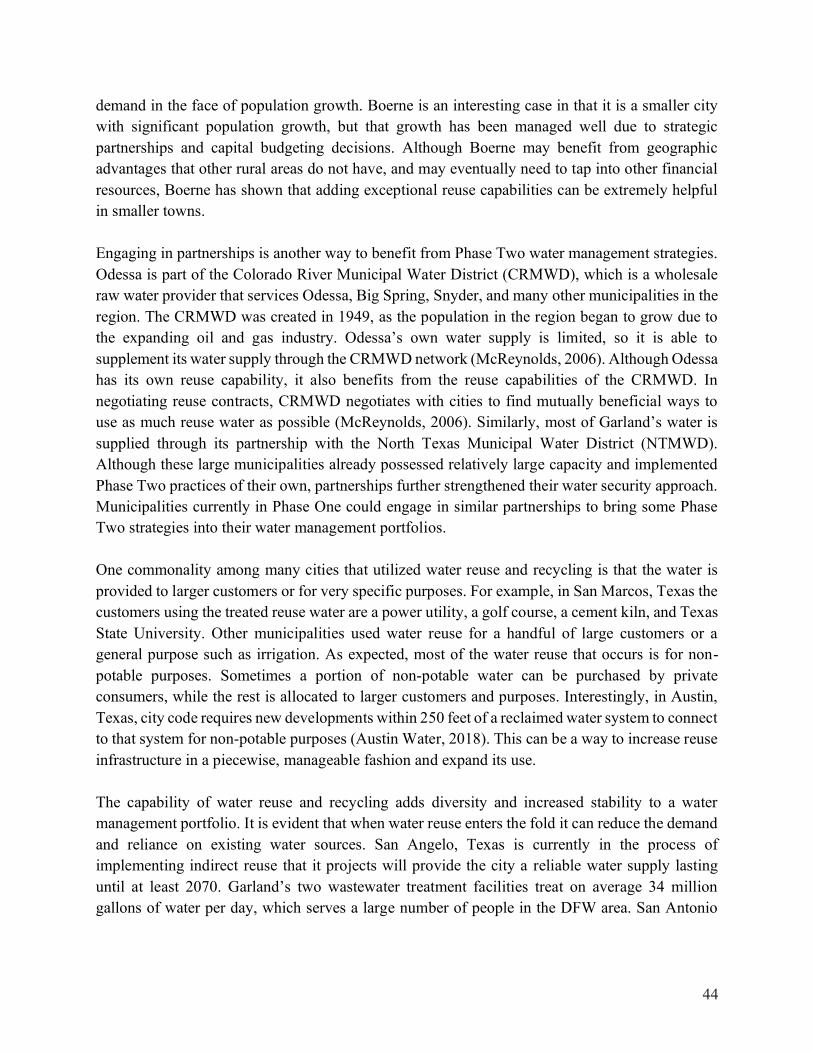
44
demand in the face of population growth. Boerne is an interesting case in that it is a smaller city with significant population growth, but that growth has been managed well due to strategic partnerships and capital budgeting decisions. Although Boerne may benefit from geographic advantages that other rural areas do not have, and may eventually need to tap into other financial resources, Boerne has shown that adding exceptional reuse capabilities can be extremely helpful in smaller towns. Engaging in partnerships is another way to benefit from Phase Two water management strategies. Odessa is part of the Colorado River Municipal Water District (CRMWD), which is a wholesale raw water provider that services Odessa, Big Spring, Snyder, and many other municipalities in the region. The CRMWD was created in 1949, as the population in the region began to grow due to the expanding oil and gas industry. Odessa’s own water supply is limited, so it is able to supplement its water supply through the CRMWD network (McReynolds, 2006). Although Odessa has its own reuse capability, it also benefits from the reuse capabilities of the CRMWD. In negotiating reuse contracts, CRMWD negotiates with cities to find mutually beneficial ways to use as much reuse water as possible (McReynolds, 2006). Similarly, most of Garland’s water is supplied through its partnership with the North Texas Municipal Water District (NTMWD). Although these large municipalities already possessed relatively large capacity and implemented Phase Two practices of their own, partnerships further strengthened their water security approach. Municipalities currently in Phase One could engage in similar partnerships to bring some Phase Two strategies into their water management portfolios. One commonality among many cities that utilized water reuse and recycling is that the water is provided to larger customers or for very specific purposes. For example, in San Marcos, Texas the customers using the treated reuse water are a power utility, a golf course, a cement kiln, and Texas State University. Other municipalities used water reuse for a handful of large customers or a general purpose such as irrigation. As expected, most of the water reuse that occurs is for non-potable purposes. Sometimes a portion of non-potable water can be purchased by private consumers, while the rest is allocated to larger customers and purposes. Interestingly, in Austin, Texas, city code requires new developments within 250 feet of a reclaimed water system to connect to that system for non-potable purposes (Austin Water, 2018). This can be a way to increase reuse infrastructure in a piecewise, manageable fashion and expand its use. The capability of water reuse and recycling adds diversity and increased stability to a water management portfolio. It is evident that when water reuse enters the fold it can reduce the demand and reliance on existing water sources. San Angelo, Texas is currently in the process of implementing indirect reuse that it projects will provide the city a reliable water supply lasting until at least 2070. Garland’s two wastewater treatment facilities treat on average 34 million gallons of water per day, which serves a large number of people in the DFW area. San Antonio
45
has a network of Water Recycling Centers that each serve separate purposes. Some cities have produced more reuse water than needed and have sold their water to neighboring cities and jurisdictions willing to purchase water, generating revenue for themselves.
Figure 12. San Antonio Water System’s (SAWS) Water Recycling Centers (WRCs) (United States Environmental Protection Agency, 2016) Some municipalities have financed their water treatment facilities internally through water rates, impact fees, and municipal bonds. However, water treatment facilities are expensive endeavors and many municipalities have tapped into TWDB resources for these projects. In 2015, the city of Port Arthur utilized roughly $7 million from the CWSRF to replace aging pipes and valves on the city's main wastewater treatment plant (Texas Water Development Board, 2015a). Wichita Falls also utilized roughly $34 million from the CWSRF in 2015 when it decided to construct its indirect potable reuse facility (Texas Water Development Board, 2015). This demonstrates that not only are there large up-front costs, but municipalities must also consider the maintenance costs down the road. Large-scale efforts to implement reuse technology will need significant financing and investment. However, use of reuse technology is growing and the addition or improvement of it to one's system provides a municipality significantly more capacity and flexibility. Following the recommended water management strategies in the state water plan, reuse will account for 13 percent of all new water supplies by 2070 (Texas Water Development Board, 2017).
46
Phase Three: Advanced Water System Technology The third phase of water management strategies involves the more advanced and expensive technologies of direct potable reuse (DPR) and desalination. Two case studies that highlighted DPR use in Texas were that of Odessa and Wichita Falls. Although they were not included as case studies, our research of San Antonio and El Paso highlighted the use of brackish desalination in Texas. Not only do these municipalities highlight the uses of these advanced technologies, but they have been heavily involved in Phase One and Two strategies. Although movement between the phases can be fluid, the natural progression of water management strategies suggests that municipalities implementing more advanced technology are also quite successful in their Phase One and Two efforts. These municipalities have been recognized for having exceptional diversified portfolios of water management strategies. They demonstrate the benefit of having multiple strategies at the disposal of a municipality. Direct Potable Reuse While DPR exists in other parts of the world, there has been growing interest in the US and Texas. Odessa operates its own wastewater treatment plant and also benefits from a raw water production facility operated by CRMWD. This raw water production facility was the nation’s first “direct potable reuse” facility that reclaimed and used water for municipal purposes (Colorado River Municipal Water District, n.d.). The facility has the capability of desalinating brackish groundwater, although it does not presently do so (Interview Participant 07). The project began in 2002, when CRMWD determined it would need an alternative to increase water supply, not fully aware that alternative would be DPR. It took roughly a decade to research and test this alternative, but the result was a DPR plant capable of treating two million gallons of wastewater to drinking water standards (Martin, 2014). The TWDB provided $11.9 million in loan assistance through its previous Water Infrastructure Fund to help fund the project (United States Environmental Protection Agency, 2016). Soon after its construction, the TWDB studied this facility and produced a report that provides monitoring guidelines for future direct potable reuse facilities. This report has led other municipalities to explore their own reuse capabilities (Texas Water Development Board, 2015b). Wichita Falls, Texas has historically faced brutal droughts and water security issues and developed many water management strategies out of necessity. In 2014, the city in conjunction with the TCEQ operated an emergency direct potable reuse treatment plant for roughly a year to increase its water supply during the drought. The plant was decommissioned after serving its purpose and Wichita Falls implemented an indirect potable reuse project that was completed in 2017. Although they have now moved away from DPR, implementing the technology at a moment's notice was a huge success for Wichita Falls and Texas at large. Further, other cities (including El Paso uses desalination and is in the process of obtaining a DPR plant) have given direct potable reuse some thought when considering how to diversify their water supply. One of the big hurdles with direct
47
potable reuse is public acceptance and demonstrating to the public that this process is safe (Texas Water Development Board, 2015). Interestingly, the citizens of Wichita Falls wanted the DPR plant to stay operational and many expressed that the taste of DPR water was superior to their regular drinking water (Nix, 2019). Desalination System Desalination, similar to DPR, has not been widely adopted across Texas but has recently gained attention. It too has been a technology used internationally before making its way to the US and Texas. According to the TWDB, as of 2019, there are 49 municipal water facilities desalinating brackish water. Between 2004 and 2009, 17 projects related to brackish water desalination were funded by the TWDB at a total of $2.7 million (Texas Water Development Board, 2020). Desalination is costly and sometimes infeasible, but unlocking untapped brackish water supplies, or potentially seawater along the coast, brings municipalities one step closer toward water security. With attention to desalination building, a seawater desalination plant, of which none currently exist in Texas, has been in the works for Corpus Christi. Many of the desalination facilities in Texas are small and operate intermittently, but the Kay Bailey Hutchinson (KBH) plant in El Paso is the largest inland municipal desalination facility in the nation and can produce 27.5 million gallons of freshwater daily (Texas Desalination Association, 2020). From conceptualization to implementation the KBH plant took 10 years to finalize. For El Paso, pursuing desalination was an easy decision. The realities of being a large metropolitan area located in the desert means desalination technology could supplement an already dwindling supply of water. El Paso has historically been a model for what exceptional water conservation looks like in desert-like regions; its conservation initiatives have steadily reduced the average water consumption per day (in gallons) since the late 1980s (Schlanger, 2018). Furthermore, having interstate and international neighbors in New Mexico and Mexico respectively, it has had to negotiate optimal water rights to all parties sharing these water resources. This resourcefulness was a crucial part of getting the KBH plant up and running.
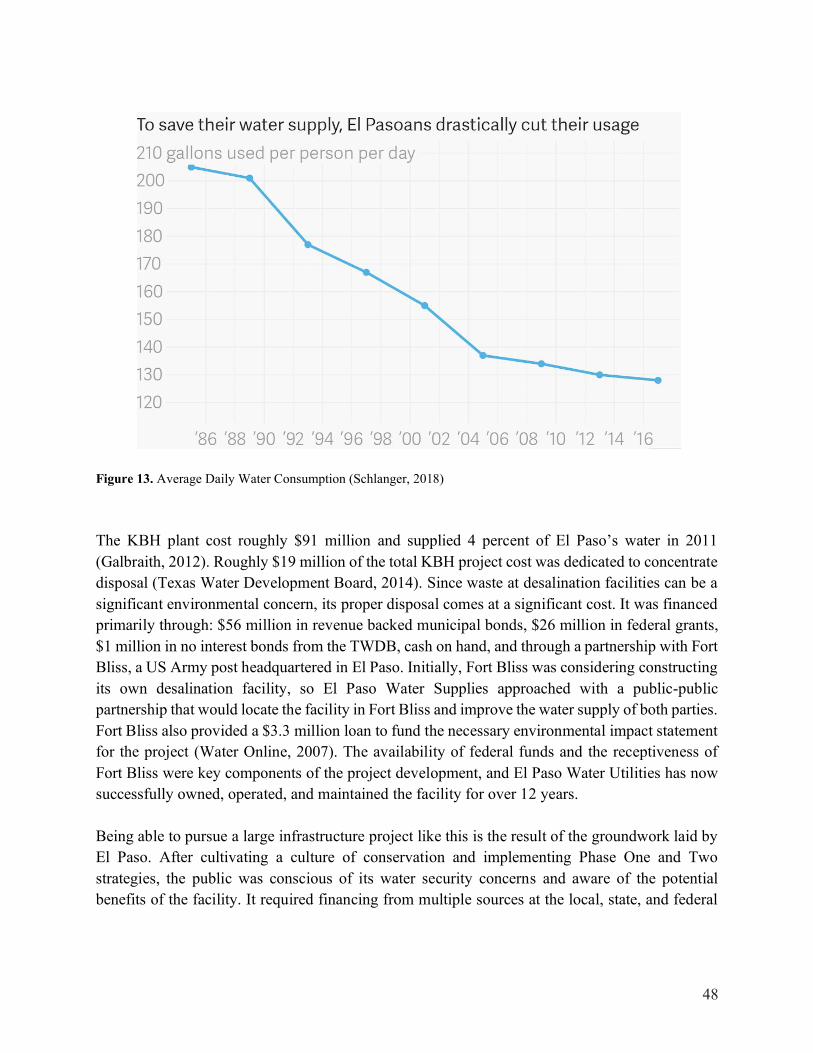
48
Figure 13. Average Daily Water Consumption (Schlanger, 2018) The KBH plant cost roughly $91 million and supplied 4 percent of El Paso’s water in 2011 (Galbraith, 2012). Roughly $19 million of the total KBH project cost was dedicated to concentrate disposal (Texas Water Development Board, 2014). Since waste at desalination facilities can be a significant environmental concern, its proper disposal comes at a significant cost. It was financed primarily through: $56 million in revenue backed municipal bonds, $26 million in federal grants, $1 million in no interest bonds from the TWDB, cash on hand, and through a partnership with Fort Bliss, a US Army post headquartered in El Paso. Initially, Fort Bliss was considering constructing its own desalination facility, so El Paso Water Supplies approached with a public-public partnership that would locate the facility in Fort Bliss and improve the water supply of both parties. Fort Bliss also provided a $3.3 million loan to fund the necessary environmental impact statement for the project (Water Online, 2007). The availability of federal funds and the receptiveness of Fort Bliss were key components of the project development, and El Paso Water Utilities has now successfully owned, operated, and maintained the facility for over 12 years. Being able to pursue a large infrastructure project like this is the result of the groundwork laid by El Paso. After cultivating a culture of conservation and implementing Phase One and Two strategies, the public was conscious of its water security concerns and aware of the potential benefits of the facility. It required financing from multiple sources at the local, state, and federal
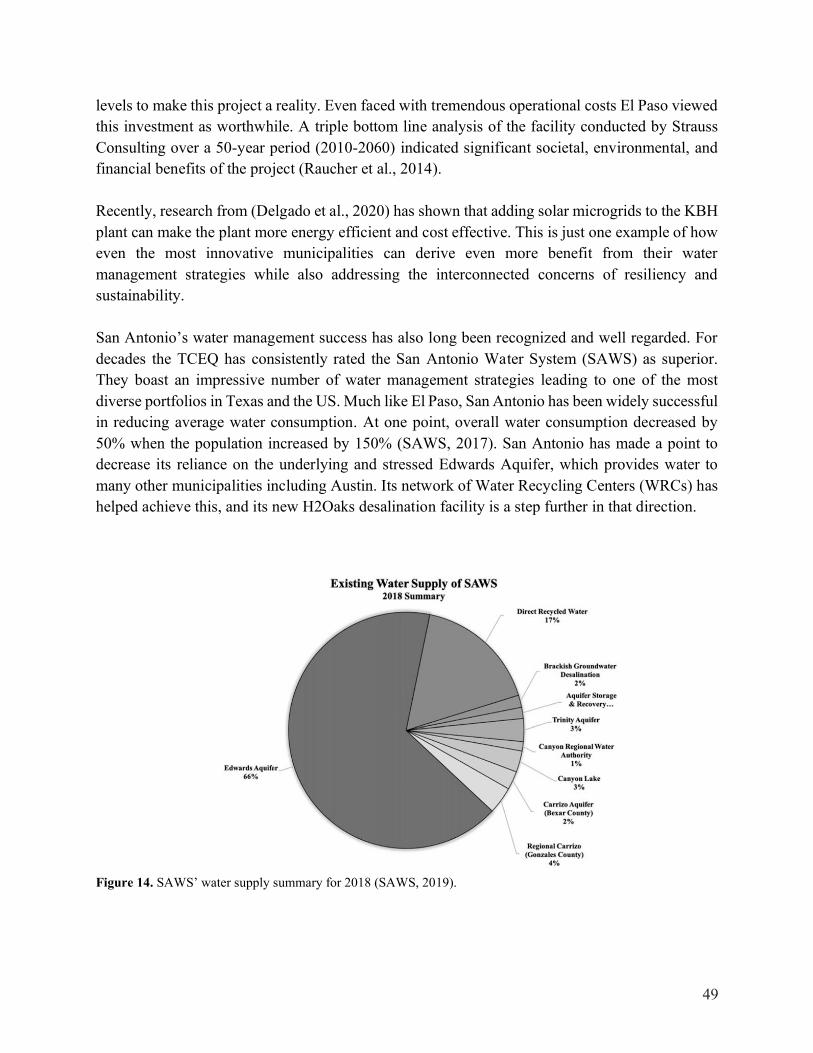
49
levels to make this project a reality. Even faced with tremendous operational costs El Paso viewed this investment as worthwhile. A triple bottom line analysis of the facility conducted by Strauss Consulting over a 50-year period (2010-2060) indicated significant societal, environmental, and financial benefits of the project (Raucher et al., 2014). Recently, research from (Delgado et al., 2020) has shown that adding solar microgrids to the KBH plant can make the plant more energy efficient and cost effective. This is just one example of how even the most innovative municipalities can derive even more benefit from their water management strategies while also addressing the interconnected concerns of resiliency and sustainability. San Antonio’s water management success has also long been recognized and well regarded. For decades the TCEQ has consistently rated the San Antonio Water System (SAWS) as superior. They boast an impressive number of water management strategies leading to one of the most diverse portfolios in Texas and the US. Much like El Paso, San Antonio has been widely successful in reducing average water consumption. At one point, overall water consumption decreased by 50% when the population increased by 150% (SAWS, 2017). San Antonio has made a point to decrease its reliance on the underlying and stressed Edwards Aquifer, which provides water to many other municipalities including Austin. Its network of Water Recycling Centers (WRCs) has helped achieve this, and its new H2Oaks desalination facility is a step further in that direction.
Figure 14. SAWS’ water supply summary for 2018 (SAWS, 2019).
50
The project is being completed in phases, with phase one costing roughly $192 million and producing 12 million gallons of freshwater daily. The full project (3 phases) is expected to cost $411.4 million, financed primarily through water supply fees of SAWS customers, and $110 million in a TWDB loan (Dimmick, 2017). Interestingly, the same facility was constructed as an ASR facility in 2004 and now is a one of a kind facility that houses 3 water supplies: desalinated brackish groundwater, ASR, and fresh water from the Carrizo Aquifer (Texas Water Development Board, 2017b). The costliness and time it takes to first test and study the feasibility of desalination projects can be a barrier to some municipalities, but San Antonio has often been at the forefront of testing and leading the state in innovative efforts. San Antonio has also sold its water to neighbors in need to generate revenue. This demonstrates that for San Antonio many options or arrangements to solve water security needs are all on the table. The diversity of the San Antonio’s water management portfolio reflects a diversity of water sources, management strategies, and financial arrangements. There are no one-size-fits-all solutions to water security in Texas, but municipalities can be aware of the options available to them and learn from the results of other areas. Having as diverse of a water management portfolio as possible can benefit municipalities in a multitude of ways. As some of the Phase Three case studies demonstrated, even meeting 4 or 5 percent of supply through desalination provides the entire system with more capacity to meet other needs. Or, having additional supply in periods of drought hits close to home for many municipalities in Texas. Furthermore, more advanced strategies often come as a result of successfully employing and sustaining basic water management strategies over long periods of time. As our case studies as a whole demonstrated, municipalities in Texas are attempting to get ahead of the curve and implement water management strategies that will make them more water secure far into the future.
51
Chapter Five: Policy Takeaways & Conclusions
Examining these case studies provides an interesting view of how some municipalities in Texas are currently addressing water security. We identify three common themes in this section in regards to policy and management tools: (1) Management and Implementation; (2) Communication and Education; and (3) Government Regulations. These themes spanned across phase strategies. It's important to note that while we acknowledge while some strategies may seem more widely used than others, this capstone does not endorse the use of a strategy over another nor does it attempt to evaluate the effectiveness of any strategy within these themes. Policy and Management Tools Management & Implementation The case studies showcase that the management and implementation of these tools makes a difference in efficacy. An example, TWDB’s best practices and the Texas Water Code mandate a progressive water rate be implemented in Texas. As such, progressive water rates are present in each of our case studies. Austin has structured its rate system to the point that it has rates designed for the needs of individual firms (eg, University of Texas, Samsung). Only two customers are in the highest tier of potable water consumption, which allows Austin Water to target those customers directly for conservation programs (Interview 01, 2019). The steep water rate, charging high volume customers significantly more than low volume customers, allows Austin to fund and pursue the most water strategies of any city in our interview segment (15 total strategies implemented, many more in some stage of planning). Austin’s water rates show how aggressive implementation of seemingly simply policy tools can form the cornerstone of a city’s water security plans. Implementing measurable water goals is another effective management tool. By creating an audit of water inputs and outputs, goals are developed and programs are created to meet projected needs. Every city in our case study has implemented measurable water use goals in some way, whether that be a reduction in water loss through leakage, per capita day water usage, or new water supplies gained. A powerful tool that managers use to aid in water audits is AMI, with nearly all of our cities having implemented or in process of implementing AMI systems. Communication & Education Creating a culture of security is crucial to municipal water security. A culture of security can stem from the environment in which the city is in. Odessa underwent an examination of its water piping
52
infrastructure, which made the city aware of the damage done by grease, fats and oils to its water security. This awareness by the city has translated into a public awareness campaign (see Odessa Case Study). Cities such as San Angelo, Rockport-Fulton, San Marcos, Odessa and Lewisville have addressed the culture of security through the implementation of education and public awareness campaigns. Cities that can effectively tie awareness of risk (drought exposure, natural resources to maintain) to identity are most effective in creating a culture of security. Cultural resilience is perhaps most effectively built during times of emergency. Throughout our case studies, water professionals cited the drought of 2010-2013 as an instance where public willingness or public pressure for water conservation mandates and programs that would have otherwise been politically unfeasible. Programs such as mandates against car-washing, lawn-watering, installation of efficient water devices, showering instead of bathing, etc., can be effectively implemented in times of crisis as the public itself has situational awareness and wishes to heighten its water security. Examples include the city of Wichita Falls’ implementation of direct-potable reuse infrastructure, Austin’s 100-year Water Plan, and Rockport-Fulton’s seasonal peak-use water guidance. Government Regulations All cities have varying degrees of monopoly power over water. This power comes from mandates in the Texas Water Code that states that surface water is property of the state of Texas, and the ability of governments to set mandates that restrict competition to common pool resources. From our case studies, mandates come in the form of setting fines and fees regarding water use, and rules and regulations regarding development. All cities have fees regarding water use and have leveraged water use mandates in times of drought. Mandates around development are more rare, but there are examples in our case studies. The cities of Boerne and Austin are examples of cities using their strength as water providers in water-scarce regions as leverage for new development. In the Boerne case study, any development seeking annexation by the city must comply with conservation mandates and efficiency standards (see Boerne case study). Austin has water conservation mandates for all new development, and has additional mandates for direct non-potable reuse infrastructure for new developments within 250 yards of their non-potable reuse facilities. Mandates can be an unpopular way of implementing policy, so it is worth examining the forces in play that have made implementation of mandates successful. Boerne and Austin are experiencing rapid growth that undermines their ability to serve future customers. Since rapid development is in some ways a source of water insecurity, the cities may not fear deterring development the way other regions may. These two forces, market demand for development and little means for private developers to access water independent of the city, make mandates effective.
53
Intergovernmental Collaboration & Economies of Scale Governments have the unique requirement to provide water to its citizens, which requires the implementation of infrastructure projects on the scale that private developers would often find unprofitable or lack the authority to enact (lack of eminent domain, lack of certificate). Municipal governments also have access to low interest bonds and loans for water infrastructure, this combination of factors makes governments one of the few buyers of water infrastructure projects. The monopsony power of government lowers the cost by driving down the bidding power of contractors, and the economy of scale upon which city governments are able to work allows for lower cost that private developers are often unable to compete with. This allows cities to secure water sources by being able to beat competitors to common pool resources. An example of this is the interview with city of Austin water professionals, wherein they expressed confidence that the Aquifer-Storage-Recharge (ASR) plans for post-2040 would entail buying up enough of the land around their ASR area that competition for the resource would be minimal (see Austin case study). Inter-governmental collaboration has the effect of reducing cost through economies of scale. An example of this is the city of San Marcos, which is collaborating with three other water agencies in the construction of a new pipeline. The ability of four water agencies to combine resources for a single water pipeline reduces the overall cost, compared to if all four agencies had to build their own pipeline to access the common pool resource of this new water source (see San Marcos Case Study). The municipal water agencies also have access to state and municipal bonds, and SWIFT and TWDB loans that private firms may not have access to. The access to low interest loans gives cities additional monopsony power in addition to the power of economies of scale that lowers water costs for the public. Cities are in constant competition to attract and retain industry, including industries that may be heavy water users. The cities of Port Arthur and Odessa exemplify this relationship in action as both cities are host to firms in the oil and gas sector, which come with TWDB mandates for increased capacity. This requirement for increased capacity comes with outsized capital investment and maintenance costs. Port Arthur and Odessa have mitigated these costs by partnering with industry. These partnerships take the form of direct investment from industry, such as Port Arthur’s partnership with a liquid-natural gas provider allowing for increased capacity, and in Odessa’s wholesale water distribution system that delivers water to regional petroleum firms (see Port Arthur & Odessa Case Studies). Both cities and industry benefit from this partnership. By utilizing economies of scale, industry and governments can lower the cost of water infrastructure. In addition, by avoiding direct competition with industry over common pool resources cities can help maintain their monopoly power over the common pool resource. Moreover, the state of Texas and TWDB provide a suite of financing options for municipalities to advance water infrastructure. However, most municipal water professionals interviewed did not deem these crucial to their water security financing plans. Indeed, many cities did not take advantage of any state loans or grants at all. This could be an issue of organizational capacity or
54
that, as public authorities, raising revenues through rate increases is the most efficient way to finance projects. Financing Tools & Strategies Despite the wide variety of financing options that are made available to local governments through state agencies, such as TWDB, it seems that there is routine underutilization of these resources by municipalities. This tended to be especially true of the cities that were used as case studies for this report. State programs such as the CWSRF and DWSRF provide reductions in borrowing costs that yield strong potential benefits and aid for Texas cities in accomplishing their water management and resiliency goals. Rural communities are at a unique disadvantage compared to urban areas due to their constrained ability to issue their own debt. For this reason, the TWDB offers them special financing through the RWAF. P3s provide other financing models that present strong potential benefit for municipalities in effectively managing and financing necessary water projects. Currently, these models are largely underutilized due to the political and governance issues that the models present. Regardless, the suite of P3 financing options available to Texas municipalities provide a comprehensive set of options that can be used to support projects in the three water security phases. As with water management strategies themselves, there are no one-size fits all financial solutions to financing water infrastructure. Rather, municipalities must understand the tradeoffs across the available financing options and have clear goals in mind about what they aim to achieve. Most infrastructure projects, particularly when they become larger and more expensive, will rely on a combination of different sources of financing to complete the project. Some infrastructure projects will rely on one financing source, but all of the existing options should be considered and properly analyzed because it could be costly in the long run to overlook what would have been a viable financing option. Larger projects require a significant investment of time, money, and public support, so municipalities must have the foresight to piece together an optimal financing strategy, and communicate why certain projects are worthy of these investments. Also, because the financial burden of infrastructure falls on users and taxpayers, being clear about why certain fees and water rate structures are necessary, and what goals those revenues meet, is crucial to shaping the dialogue about infrastructure decisions. Financing will play an increasingly significant role in addressing challenges going forward, because as water security concerns continue to rise, so too will the need to invest in bigger, bolder strategies. Limitations There are several limitations to the information gathered, and how it relates to the water security picture as a whole. First, the thirteen respondent municipalities represented individual case studies. While there are interesting water management strategies and similarities to be identified from these cases, no two municipalities will deal with water the same way. Representing the entire state was impracticable, but obtaining a small diverse number of cases was the goal. It was our intention to gather cases from municipalities with different regional characteristics, sociodemographic characteristics, sizes, and financial capacities. In some respects, such as financial capacity, the
55
cases were quite diverse. However, in other respects such as region and size, the discussion would benefit from additional cases. As interviews were being pursued, we found it to be the case that larger municipalities were more responsive than smaller ones. Municipalities may have self-selected into the sample due to the administrative capacity to have staff available for interviews. We attempted to contact five rural municipalities (populations of less than 5,000), and were unsuccessful in scheduling a time for an interview. Some respondents like Rockport-Fulton and Boerne had somewhat small populations, but still were far beyond being defined as rural. Urbanized areas and suburbs were the bulk of cases, likely due to having dedicated personnel to public relations. Having a handful of rural perspectives would have been useful, considering that a large part of Texas is rural. Furthermore, having more rural respondents could have bolstered regional representation as several of the rural municipalities we intended to speak with were geographically further away from the other case studies. Another aspect of regional representation is the sources of water available to municipalities. Unexpectedly, many of the case studies utilized much more surface water resources than they did groundwater ones. The capacity and approach to water management for municipalities is highly dependent on the water resources that are most immediately available to them. In this respect, the discussion would benefit from additional cases that were more reliant on groundwater. Furthermore, water governance in Texas, and the US more broadly, is complex and relies on a network of political subdivisions. While municipalities were the focus of this report, other political subdivisions such as MUDs, GCDs, river authorities, and counties among many others, play a significant role in water governance. In particular, many large water infrastructure projects that service residents across different political boundaries will be financed by subdivisions other than municipalities. There is often coordination between subdivisions, and looking into the operations of one subdivision will inevitably lead to its relationships with others. One topic that did not come up in our interviews was the effect internal municipal organizational capacity can have on a municipalities’ decision-making. In the context of water management, organizational capacity includes dimensions such financial resources, staffing, technical expertise, coordination and leadership (Brody et al., 2010; Brown, 2007). While this report does include analysis of water security strategy use and fiscal measures, such as local government spending and government spending per capita, we did not study the other technical dimensions of organizational capacity. Of the municipalities that were studied, sometimes the full extent of all intended water management strategies could not be captured. For example, some municipalities have plans to diversify their water management portfolios in a specific way, like implementing new technology
56
or educational programs, but have not yet done so. To the extent possible, we identified future plans in addition to present strategies, but cannot identify the impact of those future plans. However, the fact that many municipalities did have deliberate plans to increase their capacity suggests that a greater diversity of water management strategies is being adopted. Another limitation is that our three phase framework does not factor in the intensity of strategy or technology use, or how developed or how heavily utilized a strategy or technology is used. For example, Laredo and Austin both utilize non-potable reuse technology, but they differ in their intensity of use. Laredo provides water to two golf courses totaling approximately 700,000 gallons of non-potable reuse water (Interview 05, 2019). In contracts Austin does/has the following: (1) mandates that any new commercial developments or redevelopments within 250 feet of a reclaimed water main to connect for irrigation, cooling, and other non-potable uses (City of Austin, n.d.); (2) 59.3 miles of reclaimed water pipe with 120 metered customers annually’ (3) three “bulk water” facilities for customers with haul trucks to access. The combination of these efforts results in Austin supplying approximately 1.3 billion gallons of reused water annually (Austin Water, 2018). Thus, while Laredo and Austin use a form of non-potable reuse, it would be incorrect to assume they are the same in terms of output and infrastructure. Conclusion Texas municipalities recognize the importance of addressing the challenge of water security. Different municipalities have taken various approaches to meet this challenge depending on their operational capacity and environments. The phases framework was useful in identifying the specific strategies municipalities had implemented and learning about their decision-making process. Again, no two municipalities will address water security in the same way, but the case studies provided an interesting insight into many of the approaches that exist in Texas. Phase One Texas municipalities interested in becoming more water secure can first focus their efforts in the area of demand management. In order to diversify their water portfolios and maximize their existing water supply, communities should aim to take full advantage of the water resources available to them. While not all municipalities will be positioned to utilize multiple water source alternatives, those that can, have the capability to add valuable supplies. Other effective demand management strategies demonstrated by the case studies are those that involve the community in conservation efforts. Educational programs and social media campaigns represent useful strategies to encourage sound water habits while rebate programs and progressive rate schedules incentivize efficient water usage. A public that is educated on and conscious of its water security concerns leads to a culture of water conservation, allowing municipalities to make critical water security decisions. Beyond community involvement, community water utility services have found great success in decreasing water loss through the installation of advanced metering infrastructure.
57
These Phase One water security strategies are simple, yet effective in helping communities manage demand pressures on their water systems. For those communities that find that Phase One strategies do not sufficiently address their water security challenges, a progression towards the more technologically-advanced Phase Two strategies may be considered. Phase Two Communities that progress into Phase Two generally seek to increase their water supply through technological means and in many cases, are interested in developing inter-municipality partnerships to bolster system capabilities. Non-potable water reuse exists as a sensible next step when the implementation of Phase One strategies fails to fully meet community water demands. Recycled water can be used for water-intensive activities like irrigation and facility maintenance, meaning valuable resources can be conserved for potable needs. Communities can take advantage of their reuse infrastructure by mandating that new developments connect to reuse systems. In doing so, communities ensure that as they grow they become increasingly water efficient. Another popular strategy utilized by many case study cities was that of the engagement in inter-municipality partnerships. Water security being an intergovernmental issue means that municipalities should explore areas of collaboration and potential partnerships. This collaboration can mean further utilizing state and other non-local financing options, or increasing capacity through strategic partnerships. Having collaborative partnerships and planning processes in place can lead to an optimization, expansion, and diversification of water management strategies for municipalities. For those municipalities facing more severe water security issues, a progression into Phase Three may be necessary to increase water supply. Phase Three Direct potable reuse and desalination are the most expensive and technologically advanced water management strategies detailed in this report. The implementation of these strategies requires intensive long-term community planning. These types of infrastructure require large capital investment, organizational capacity, and project management coordination. Despite the expense of these strategies, the TWDB has provided financial assistance through loan programs to help communities finance both systems. Using the information presented in this report and other existing resources, municipalities should aim to understand available water management strategies and their relevant costs and benefits. This may seem obvious, but different municipalities are presented with different regional, financial, and managerial opportunities and challenges. There will be diversity in the water management strategies utilized by municipalities based on this context, so it is important that the water security needs of a given municipality are assessed properly. Overall, this window into how various municipalities deal with water security can assist other municipalities in thinking about their own water security issues.
58
Appendices Appendix A: Semi-Structured Interview Script --------------------------------------------------------------------------------------------------------------------- Introduction ❖ Reiterate confidentiality - audio recording, personal identity never used ❖ Audio will be used to extract statements that best encapsulate a particular perspective on a particular aspect
and additional quotes may be used in published materials, however again, speak confidentiality will be upheld.
❖ Any questions for me before we begin? I will begin recording: This is an interview with [NAME]. On [DATE] @ [TIME]. I’m going to start off by asking you some general questions about yourself and your thoughts on water in [CASE STUDY]. Then I will move on to some themes I have identified in my secondary data research, which include themes of strategy, collaboration, and finance. __________________________________________________________________________________________ General ❖ How did you get interested in water? ❖ What water challenges is your city facing? ❖ What is your career trajectory? ❖ What water challenges do you see Texas having in the next couple of years? ❖ What is your workforce capacity? ❖ What is the state or regulatory doing wrong or inhibit your manager?
Available water sources: ❖ What water sources does your city have access to and which source do you most heavily rely on? ❖ What percentage of the overall water portfolio is processed water? ❖ Do you use any produced water, in addition to ground/surface water? ❖ "What type of processes do you use?
➢ Recaptured ➢ Reclaimed ➢ Desalinated
❖ Possible follow up: If Ground or Surface, are they fresh or brackish? Strategy/Partnerships/Current and Recent Projects ❖ Has your city invested in any project to become more water-secure? ❖ Has your city used the following type of water strategies or technology?
➢ Conservation efforts ➢ Surface water storage ➢ Groundwater collection ➢ Green infrastructure ➢ Water recycling
59
➢ Brackish water desalination ➢ On-site water reuse
❖ Who are your primary partners in water management? ❖ What barriers have you faced in implementing water security projects? ❖ What other water projects are you thinking about doing, or are in the process of doing? ❖ Do you see water security as an issue for your city in the next five years? ❖ Can you describe your relationship with state entities like TCEQ, TWDB, Ground Water Conservation? ❖ Was your partnership initiated by one of the current members, or was it a partnership mandated by the state? ❖ How important is collaboration to managing your water resource? ❖ What type of collaborative agreements do you have with them? ❖ Are your partnerships important in the planning process and actual operation of the facility?
Finance ❖ Has cost played a role in your decision-making process? ❖ Do you conduct any analyses to measure the efficiencies of projects? ❖ Do you have a grant officer? ❖ Has your city identified specific funding mechanisms for water security projects? ❖ Do you have any public-private partnerships for water infrastructure projects? ❖ If so, can you describe some of the benefits and challenges? ❖ Do you conduct a cost-benefit analysis on water infrastructure prior to approval? ❖ Do you do any follow up to compare costs and efficiencies after completion of the project? ❖ If you were head of city council or TWDB, what kind of water project would you prioritize? ❖ How are water security projects prioritized in the budget process? ❖ Does it depend on user fees, taxes, grants, bonds? ❖ If you use grants which ones? ❖ Are you in the process of applying for grants? Which ones? ❖ If you’ve issued bonds have they been tax-exempt, or revenue backed?
End of interview ❖ Snowballing sampling: Ask the people we interview, if they can suggest who I should talk to? ❖ Have I missed anything that you find important?
Closing Thank you for your time! Are there any questions that you have for me? Is there anything else I may have missed that you believe is an important component of water resource planning management in Texas? --------------------------------------------------------------------------------------------------------------------------------------------
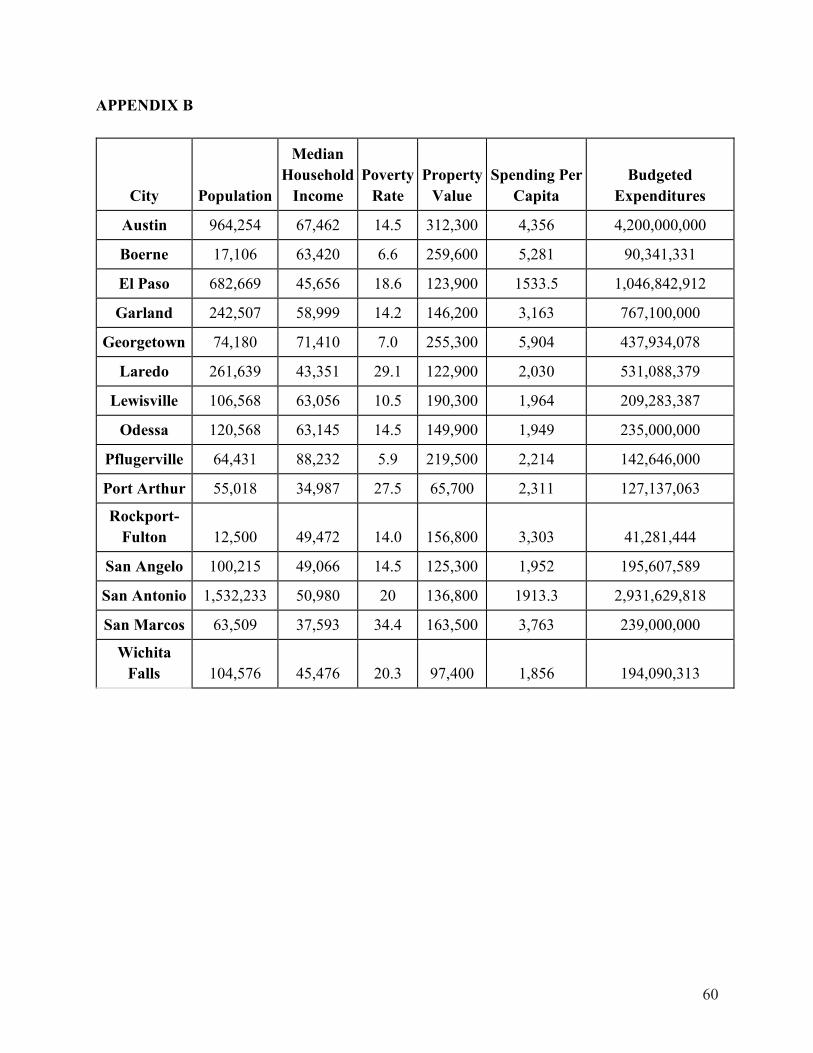
60
APPENDIX B
City Population
Median Household
Income Poverty
Rate Property
Value Spending Per
Capita Budgeted
Expenditures
Austin 964,254 67,462 14.5 312,300 4,356 4,200,000,000
Boerne 17,106 63,420 6.6 259,600 5,281 90,341,331
El Paso 682,669 45,656 18.6 123,900 1533.5 1,046,842,912
Garland 242,507 58,999 14.2 146,200 3,163 767,100,000
Georgetown 74,180 71,410 7.0 255,300 5,904 437,934,078
Laredo 261,639 43,351 29.1 122,900 2,030 531,088,379
Lewisville 106,568 63,056 10.5 190,300 1,964 209,283,387
Odessa 120,568 63,145 14.5 149,900 1,949 235,000,000
Pflugerville 64,431 88,232 5.9 219,500 2,214 142,646,000
Port Arthur 55,018 34,987 27.5 65,700 2,311 127,137,063
Rockport-Fulton 12,500 49,472 14.0 156,800 3,303 41,281,444
San Angelo 100,215 49,066 14.5 125,300 1,952 195,607,589
San Antonio 1,532,233 50,980 20 136,800 1913.3 2,931,629,818
San Marcos 63,509 37,593 34.4 163,500 3,763 239,000,000
Wichita Falls 104,576 45,476 20.3 97,400 1,856 194,090,313
61
References
Adams, W. (2015). Conducting Semi-Structured Interviews. Handbook of Practical Program Evaluation. Wiley.
American Society of Civil Engineers. (2017). Infrastructure Report Card.
https://www.infrastructurereportcard.org/ Austin Water. (2018a). Advanced Metering Infrastructure (AMI).
http://www.austintexas.gov/sites/default/files/files/Water/AMI/AW_AMI_Primer.pdf Austin Water. (2018b). Water Forward: Integrated Water Resource Plan.
http://austintexas.gov/sites/default/files/files/Water/WaterForward/Water_Forward_Plan_Report_-_A_Water_Plan_for_the_Next_100_Years.pdf
Baker, M., Bergstresser, D., Serafeim, G., & Wurgler, J. (2019). Financing the Response to
Climate Change: The Pricing & Ownership of U.S. Green Bonds. https://dx.doi.org/10.2139/ssrn.3275327
Booth, S., Doris, E., Knutson, D. & Regenthal, S. (2011). Using Revolving Loan Funds to
Finance Energy Savings Performance Contracts in State and Local Agency Applications. National Renewable Energy Laboratory. https://pdfs.semanticscholar.org/e025/be62c2b8fb5d498cb13e1f07341edb58567d.pdf
Brody, S. D., Kang, J. E., & Bernhardt, S. (2010). Identifying Factors Influencing Flood
Mitigation at the Local Level in Texas and Florida: the role of Organizational Capacity. Nat Hazards, 52, 167-184. https://doi.org/10.1007/s11069-009-9364-5
Brown & Caldwell, Paulson, C., Broley, W. & Stephens, L. (2017). Blueprint for One Water.
Water Research Foundation. https://savepaloaltosgroundwater.org/files/Blueprint-for-One-Water.pdf
Brown, R. (2007). Local Institutional Development and Organizational Change for Advancing
Sustainable Urban Water Futures. Environmental Management, 41(2), 221-233. https://doi.org/10.1007/s00267-007-9046-6
Buckley, P., Gunnion, L. & Sarni, W. (2016). The aging water infrastructure:
Out of sight, out of mind? Deloitte University Press. https://www2.deloitte.com/content/dam/insights/us/articles/us-aging-water-infrastructure-investment-opportunities/DUP2795_Water_Report_042416.pdf
Cardone, R., & Howe, C. (2018). Advancing One Water in Texas. The Cynthia and George
Mitchell Foundation. https://cgmf.org/graphics/cgmf_one_water_report_02_14_18_final.pdf
62
Chou, B., Hammer, B. & Levine, L. (2014). Using State Revolving Funds to Build Climate-Resilient Communities. National Resources Defense Council. https://www.nrdc.org/sites/default/files/state-revolving-funds-IP.pdf
City of Austin, T. (n.d.). Mandatory Connections.
http://www.austintexas.gov/sites/default/files/files/Water/Water_Reclamation/mandatoryconnwebpage.pdf
City of Boerne. (2016). 2016 Comprehensive Annual Financial Report. City of Boerne, Texas.
https://www.ci.boerne.tx.us/DocumentCenter/View/7306/2016-CAFR---Final?bidId= City of Boerne. (2019). Utilities. City of Boerne, Texas. https://www.ci.boerne.tx.us/149/Utilities City of Lewisville, T. (2019). Lewisville 2025 Vision Annual Report.
https://www.cityoflewisville.com/home/showdocument?id=17888 City of Odessa, T. (n.d.). Water Efficient Rebate Program. https://www.odessa-
tx.gov/residents/water-efficient-rebate-program City of Rockport. (2018). News Release: City to Begin Installation of "Smart Meters" on
September 24. City of Rockport, Texas. Colorado River Municipal Water District. (n.d.). Reclaimed Water. CRMWD.
https://www.crmwd.org/water-sources/reuse/ Cooley, H., & Phurisamban, R. (2016). The Cost of Alternative Water Supply and Efficiency
Options in California. The Pacific Institute. https://pacinst.org/wp-content/uploads/2016/10/PI_TheCostofAlternativeWaterSupplyEfficiencyOptionsinCA.pdf
Copeland, C. (2016). Clean Water Act: A Summary of the Law. Congressional Research Service.
https://fas.org/sgp/crs/misc/RL30030.pdf Danielsson, M., & Spuhler, D. (2019). Reduce Water Consumption in Industry. Sustainable
Sanitation and Water Management Toolbox. https://sswm.info/water-nutrient-cycle/water-use/hardwares/optimisation-water-use-industries/reduce-water-consumption-in-industry
Delgado, W., Beach, T., & Luzzadder-Beach, S. (2020). Solar Rich and Water Poor: The Case
for Solar Desalination in El Paso, Texas. The Professional Geographer, 72(1), 9-21. https://doi.org/10.1080/00330124.2019.1653776
Deye, A. (2015). US infrastructure public-private partnerships: ready for takeoff? Kennedy
School Review, 15, 6-12. https://ksr.hkspublications.org/2015/06/16/us-infrastructure-public-private-partnerships-ready-for-takeoff/
63
Dimmick, I. (2017, Jan 27,). H2Oaks Desalinated Water Passes the Taste Test. Rivard Report https://therivardreport.com/h2oaks-desalination-plant-latest-in-move-to-diversify-water-sources/
Dowell Lashmet, T. (2018). Basics of Texas Water Law. Texas A&M AgriLife Extension.
https://agrilife.org/texasaglaw/files/2018/01/Basics-of-Texas-Water-Law.pdf Franks, T. R., & Cleaver, F. (2009). Analyzing Water Governance: A Tool for Sustainability?
Engineering Sustainability, 162(4), 207-213. https://doi.org/10.1680/ensu.2009.162.4.207 Gain, A. K., Giupponi, C., & Wada, Y. (2016). Measuring global water security towards
sustainable development goals. Environmental Research Letters, 11(12) https://iopscience.iop.org/article/10.1088/1748-9326/11/12/124015/pdf
Galbraith, K. (2012, June10,). Amid Scramble for Water, a Push for Desalination. Texas Tribune
https://www.texastribune.org/2012/06/10/texas-water-woes-spark-interest-desalination/ Gebhardt, J., & Patella, M. (2017). Perspective: “The Financial Impact of Alternative Water
Project Delivery Models” in the Water Sector. United States Environmental Protection Agency. https://www.epa.gov/sites/production/files/2017-03/documents/epa_p3_perspective_final_2.24.17.pdf
George, P. G., Mace, R. E. & Petrossian, R. (2011). Aquifers of Texas. Texas Water
Development Board. https://www.twdb.texas.gov/publications/reports/numbered_reports/doc/R380_AquifersofTexas.pdf
Gholson, D. M., Boellstorff, D. E., Cummings, S. R., Wagner, K. L., & Dozier, M. C. (2019). A
Survey of Public Perceptions and Attitudes about Water Availability Following Exceptional Drought in Texas. Journal of Contemporary Water Research & Education, 166(1), 1-11. https://doi.org/10.1111/j.1936-704X.2019.03297.x
Grigg, N. S. (2011). Water Finance: Public Responsibilities and Private Opportunities. John
Wiley & Sons Inc. Hannibal, B., & Portney, K. (2019). Correlates of Food–Energy–Water Nexus Awareness
Among the American Public*. Social Science Quarterly, 100(3), 762-778. https://doi.org/10.1111/ssqu.12590
Harris, S. (n.d.). What the Minimum 20 Percent Conservation and Reuse Mandate in the SWIFT
Process in Texas Means for Sustainably Designed Water Methods. https://www.sustainability.utexas.edu/sites/sustainability.utexas.edu/files/SWIFT_ShannonHarris.pdf
Jamshed, S. (2014). Qualitative Research Method-Interviewing and Observation. Journal of
64
Basic and Clinical Pharmacy, 5(4), 87-88. https://www.google.com/url?q=http://www.ncbi.nlm.nih.gov/pmc/articles/PMC4194943/&sa=D&ust=1588237959698000&usg=AFQjCNHN9xNudxTRQNp2kJEVnqjJRwtknw
Jha, A. K., Minor, T. W., & Stanton-Geddes, Z. (2013). Building Urban Resilience: Principles,
Tools, and Practice. The World Bank. Johnson, C. L. (1995). Managing Financial Resources to Meet Environmental Infrastructure
Needs: The Case of State Revolving Funds. Public Productivity & Management Review, 18(3), 263-275. https://www.jstor.org/stable/3380847
Loftus, T. T. (2018). Estimating the Potential of Urban Water-Use Conservation in Texas:
A Pilot Study of Two Planning Regions. The Meadows Center for Water and the Environment. https://gato-docs.its.txstate.edu/jcr:a5aaeff7-3822-4c54-a5f6-fb1b6ff0e138
Maguire, S., & Negley, H. D. (2008). Private Activity Bonds: An Analysis of State Use, 2001 to
2006. Congressional Information Service, Library of Congress. Martin, L. (2014). Texas Leads The Way With First Direct Potable Reuse Facilities In U.S.
Water Online. https://www.wateronline.com/doc/texas-leads-the-way-with-first-direct-potable-reuse-facilities-in-u-s-0001
McReynolds, D. (2006). Texas' Oldest Living Reuse System Tells All. WEFTEC.
https://d3pcsg2wjq9izr.cloudfront.net/files/5306/articles/12454/372.pdf Meerow, S., & Newell, J. P. (2016). Urban resilience for whom, what, when, where, and why?
Urban Geography, 40(3), 309-329. http://dx.doi.org/10.1080/02723638.2016.1206395 Mullin, M. (2009). Governing the Tap: Special District Governance and the New Local Politics
of Water. MIT Press. Mullin, M., & Daley, D. M. (2018). Multilevel Instruments for Infrastructure Investment:
Evaluating State Revolving Funds for Water. The Policy Studies Journal, 46(3), 629-650. https://doi.org/10.1111/psj.12228
Nix, D. K. (2019). 2019 Texas OCEA Award Winner: Wichita Falls DPR & IPR Project. ASCE
Texas Section. https://www.texasce.org/tce-news/2019-texas-ocea-award-winner-wichita-falls-dpr-ipr-project/
North American Development Bank. (n.d.). Infrastructure Financing.
https://www.nadb.org/infrastructure-financing NTMWD, & TRWD. (2018). Constructed Wetlands. Conservation Wrangler Texan By Nature.
https://texanbynature.org/wp-content/uploads/2018/06/Constructed-Wetlands-Project-Overview-2018-CW.pdf
65
Pollock, L. M. (1991). Financing Under the Clean Water Act: The Move from Federal Grants to
State Loans. The Clean Water Act. Portney, K. (2015). Sustinability. MIT Press. Raucher, R., Archuleta, E. & Reinert, S. (2014). Desalination Concentrate Management Policy
for the Arid West. Water Research Foundation. http://www.waterrf.org/resources/webcasts/Lists/Webcasts/Attachments/98/4417%20Desal%20CM%20Webcast%20Slides.pdf
Rodriguez, R. &., & Gallagher O'Neal, S. (2006). Water Quality Management: North American
Development Bank Experience. Water Quality Management in the Americas (pp. 167-177). Springer, Berlin, Heidelberg.
SAWS. (2017). Water Management Report. San Antonio Water System.
http://www.saws.org/Your_Water/WaterResources/2017_WMP/docs/20171107_SAWS-2017-Water- Management-Plan.pdf
SAWS. (2019). Water supply fee semiannual report : July-December 2018. San Antonio Water
System. http://www.saws.org/Your_Water/WaterResources/Reports/docs/WaterMgmtSemi annualReport_Jul-Dec%202018_.pdf
Schaffer, K. (2013). Boerne city leaders cut ribbon on new waste water treatment plant. KSAT.
https://www.ksat.com/news/2013/06/27/boerne-city-leaders-cut-ribbon-on-new-waste-water-treatment-plant/
Schlanger, Z. (2018). A major US city will start drinking its own sewage. Others need to follow.
Quartz. https://qz.com/1353825/a-major-us-city-will-start-drinking-its-own-sewage-others-need-to-follow/
Southwick, S. M., & Charney, D. S. (2018). Resilience: The Science of Mastering Life's Greatest
Challenges. Cambridge University Press. Stoutenborough, J. W., & Vedlitz, A. (2013). Public attitudes toward water management and
drought in Texas. Texas Water Journal, 4(2), 47-61. http://hdl.handle.net/1969.1/154338 Texas Administrative Code. TAC § 27.151. Texas Administrative Code. TAC 30 § 288.20-22. Texas Administrative Code. TAC 30 §210.32. Texas Administrative Code. TAC 30 §288.
66
Tax Policy Center. (2020). Briefing Book: The State of State (and Local) Tax Policy. https://www.taxpolicycenter.org/briefing-book/what-are-municipal-bonds-and-how-are-they-used
Texas Bond Review Board. (2019). State of Texas Debt.
http://www.brb.state.tx.us/state_debt.aspx Texas Commission on Environmental Quality. (2019a). Drought Contingency Plan
for a Retail Public Water Supplier. https://www.tceq.texas.gov/assets/public/permitting/watersupply/drought/20191.pdf
Texas Commission on Environmental Quality. (2019b). Texas Water Districts: A General Guide.
https://www.tceq.texas.gov/assets/public/comm_exec/pubs/gi/gi-043.pdf Texas Comptroller of Public Accounts. (2016). Special Report: Funding The State Water Plan
Through The SWIFT Program. https://comptroller.texas.gov/ Texas Desalination Association. (2020). Desal FAQs.
https://www.twdb.texas.gov/innovativewater/desal/facts.asp Texas Legislative Council. (2018). Data. https://tlc.texas.gov/data Texas Living Waters. (2020). Desalination.
https://texaslivingwaters.org/bestbets/desalination.html Texas Municipal League. (n.d.). City of Los Ybanez.
https://www.google.com/url?q=https://directory.tml.org/profile/city/1955&sa=D&ust=1588044464851000&usg=AFQjCNGsxyQURcQgw9_zCdPAdJQ1mGArJA
Texas Water. (n.d.a). Groundwater conservation districts. https://texaswater.tamu.edu/groundwater/groundwater-conservation-districts.html
Texas Water. (n.d.b). Texas water law. https://texaswater.tamu.edu/water-law.html Texas Water Development Board. (2014). Worth Its Salt: El Paso Water Utilities
Kay Bailey Hutchison Desalination Plant. https://www.twdb.texas.gov/innovativewater/desal/worthitssalt/doc/Worth_Its_Salt_Jan2014_KBH.pdf
Texas Water Development Board. (2015a). Annual Report: Clean Water State Revolving Fund.
https://www.twdb.texas.gov/publications/reports/administrative/doc/FY15-CWSRF-AnnualReport.pdf
Texas Water Development Board. (2015b). Direct Potable Reuse Resource Document.
https://www.twdb.texas.gov/publications/reports/contracted_reports/doc/1248321508_Vol1.pdf
67
Texas Water Development Board. (2017a). Water for Texas - 2017 State Water Plan.
https://www.twdb.texas.gov/waterplanning/swp/2017/doc/SWP17-Water-for-Texas.pdf?d=13315.38499999806
Texas Water Development Board. (2017b). When science, planning, and financing work
together. https://www.twdb.texas.gov/newsmedia/featured/stories/2017/04/index.asp Texas Water Development Board. (2018a). Annual Report: Clean Water State Revolving Fund.
https://www.twdb.texas.gov/publications/reports/administrative/doc/FY18-CWSRF-AnnualReport.pdf
Texas Water Development Board. (2018b). Annual Report: Drinking Water State Revolving
Fund. https://www.twdb.texas.gov/publications/reports/administrative/doc/FY18-DWSRF-AnnualReport.pdf
Texas Water Development Board. (2019a). 2019 Annual Financial Report.
https://www.twdb.texas.gov/financial/investor/financial-reports.asp?d=acknowledged Texas Water Development Board. (2019b). Aquifer Storage and Recovery (ASR) in Texas.
http://www.twdb.texas.gov/innovativewater/asr/img/ASR_phase_030817.jpg Texas Water Development Board. (2019c). Best Management Practices for Municipal Water
Users. https://www.twdb.texas.gov/conservation/BMPs/Mun/doc/2019%20Update%20Files/MuniGuide2019.pdf
Texas Water Development Board. (2019d). CWSRF Information Sheet. http://www.twdb.texas.gov/financial/programs/CWSRF/index.asp
Texas Water Development Board. (2019e). DWSRF Information Sheet.
http://www.twdb.texas.gov/financial/programs/DWSRF/index.asp Texas Water Development Board. (2019f). SWIFT Program Information Sheet.
https://www.twdb.texas.gov/financial/programs/SWIFT/index.asp Texas Water Development Board. (2019g). Water Reuse.
http://www.twdb.texas.gov/publications/shells/WaterReuse.pdf Texas Water Development Board. (2020a). Desalination Plants.
https://www3.twdb.texas.gov/apps/desal/DesalPlants.aspx Texas Water Development Board. (2020b). Economically Distressed Areas Program.
http://www.twdb.texas.gov/financial/programs/EDAP/index.asp Texas Water Development Board. (2020c). Groundwater Conservation District Loan Program
68
(GDLP). http://www.twdb.texas.gov/financial/programs/GDLP/index.asp Texas Water Development Board. (2020d). Regional Water Plans/Planning Group Grants.
http://www.twdb.texas.gov/financial/programs/RWPG/index.asp Texas Water Development Board. (2020e). State Participation.
http://www.twdb.texas.gov/financial/programs/SPP/index.asp Texas Water Development Board. (2020f). Texas Water Development Fund (DFund).
http://www.twdb.texas.gov/financial/programs/TWDF/index.asp Texas Water Resources Institute. (2019). Water Utilities Challenges. txH20, 13(2)
https://twri.tamu.edu/media/4333/txh2o_summer-2019-webopt.pdf Theodori, G., & Jensen, R. (2019). Resources for Small Water Systems in Texas. Texas A&M
AgriLife Extension. https://agrilifeextension.tamu.edu/library/water/resources-for-small-water-systems-in-texas/
Tiger, M., Hughes, J. & Eskaf, S. (2014). Designing Water Rate Structures
for Conservation & Revenue Stability. UNC Environmental Finance Center. https://efc.sog.unc.edu/sites/default/files/Texas%20Rate%20Report%202014%20Final_0.pdf
Travis, R., Morris, J. C., & Morris, E. D. (2004). State Implementation of Federal Environmental
Policy: Explaining Leveraging in the Clean Water State Revolving Fund. Policy Studies Journal, 32(3), 461-480. https://doi.org/10.1111/j.1541-0072.2004.00075.x
TWC §11.1271. TWC §13.146. United States Census Bureau. (2010). Profile of General Population and Housing
Demographics: 2010. https://factfinder.census.gov/faces/nav/jsf/pages/download_center.xhtml United States Census Bureau. (2015). Geographic Areas Reference Manual.
https://www2.census.gov/geo/pdfs/reference/GARM/Ch9GARM.pdf United States Census Bureau. (n.d.). Quickfacts.
https://www.census.gov/quickfacts/fact/table/kendallcountytexas,boernecitytexas,US/PST045218
United States Environmental Protection Agency. (2016). Project of Interest - Waste Not, Want
Not: Water Reuse and Recycling in Texas. https://www.epa.gov/sites/production/files/2016-09/documents/final_texas_poi2.pdf
United States Environmental Protection Agency. (2017). Water Infrastructure Financial
69
Leadership: Successful Financial Tools for Local Decision Makers. https://www.epa.gov/sites/production/files/2017-09/documents/financial_leadership_practices_document_final_draft_9-25-17_0.pdf
United States Environmental Protection Agency. (2018a). Drinking Water Infrastructure Needs
Survey and Assessment: Sixth Report to Congress. https://www.epa.gov/sites/production/files/2018-10/documents/corrected_sixth_drinking_water_infrastructure_needs_survey_and_assessment.pdf
United States Environmental Protection Agency. (2018b). SRF Fund Management Handbook.
https://www.epa.gov/sites/production/files/2018-04/documents/fund_management_handbook_2018final.pdf
United States Environmental Protection Agency. (2019a). EPA Announces Availability of $2.6
Billion in New Funding to Improve Water Infrastructure Across the United States. https://www.epa.gov/newsreleases/epa-announces-availability-26-billion-new-funding-improve-water-infrastructure-across-5
United States Environmental Protection Agency. (2019b). Learn About the WIFIA Program.
https://www.epa.gov/wifia/learn-about-wifia-program#overview United States Environmental Protection Agency. (n.d.a). Pricing and Affordability of Water
Services. https://www.epa.gov/sustainable-water-infrastructure/pricing-and-affordability-water-services#pricing
United States Environmental Protection Agency. (n.d.b). Summary of the Clean Water Act: 33
U.S.C. §1251 et seq. (1972). https://www.epa.gov/laws-regulations/summary-clean-water-act US Water Alliance. (2016). One Water Roadmap: The Sustainable Management of Life's Most
Essential Resource. http://uswateralliance.org/sites/uswateralliance.org/files/publications/Roadmap%20FINAL.pdf
Vela, L. (2017). Certificates of Obligation: A Flexible Funding Tool for Local Projects. Texas
Comptroller. https://comptroller.texas.gov/economy/fiscal-notes/2017/january/co.php Water Online. (2007). El Paso To Dedicate 'World's Largest Inland Desalination Plant'.
https://www.wateronline.com/doc/el-paso-to-dedicate-worlds-largest-inland-des-0001 Wilhite, D. A., & Glantz, M. H. (1985). Understanding the Drought Phenomenon: The Role of
Definitions . Water International, 10(3), 111-120. http://digitalcommons.unl.edu/droughtfacpub/20?utm_source=digitalcommons.unl.edu%2Fdroughtfacpub%2F20&utm_medium=PDF&utm_campaign=PDFCoverPages