Embed Size (px)
Citation preview

U.S. Department of the InteriorU.S. Geological Survey
Scientific Investigations Report 2006–5301
In cooperation with the U.S. Environmental Protection Agency
Sources of Polychlorinated Biphenyls to Devils Swamp Lake Near Baton Rouge, Louisiana

CoverTop left: Sign near wastewater drainage ditch that enters Devils Swamp Lake (October 2004).Top right: Capping gravity core collected from Devils Swamp Lake (October 2004).Bottom: Portable watercraft on Devils Swamp Lake (October 2004).

Sources of Polychlorinated Biphenyls to Devils Swamp Lake Near Baton Rouge, Louisiana
By Peter C. Van Metre, Jennifer T. Wilson, and Briant A. Kimball
U.S. Department of the InteriorU.S. Geological Survey
In cooperation with the U.S. Environmental Protection Agency
Scientific Investigations Report 2006–5301
U.S. Department of the InteriorDIRK KEMPTHORNE, Secretary
U.S. Geological SurveyMark D. Myers, Director
U.S. Geological Survey, Reston, Virginia: 2006For sale by U.S. Geological Survey, Information ServicesBox 25286, Denver Federal CenterDenver, CO 80225
For more information about the USGS and its products:Telephone: 1-888-ASK-USGSWorld Wide Web: http://www.usgs.gov/
Any use of trade, product, or firm names in this publication is for descriptive purposes only and does not implyendorsement by the U.S. Government.
Although this report is in the public domain, permission must be secured from the individual copyright owners toreproduce any copyrighted materials contained within this report.
Suggested citation:
Van Metre, P.C., Wilson, J.T., and Kimball, B.A., 2006, Sources of polychlorinated biphenyls to Devils Swamp Lake near Baton Rouge, Louisiana: U.S. Geological Survey Scientific Investigations Report 2006–5301, 50 p.

iii
Contents
Abstract . . . . . . . . . . . . . . . . . . . . . . . . . . . . . . . . . . . . . . . . . . . . . . . . . . . . . . . . . . . . . . . . . . . . . . . . . . . . . . . . . . . . . . . . . . . . . . . . . . . . 1Introduction . . . . . . . . . . . . . . . . . . . . . . . . . . . . . . . . . . . . . . . . . . . . . . . . . . . . . . . . . . . . . . . . . . . . . . . . . . . . . . . . . . . . . . . . . . . . . . . . . 1Methods . . . . . . . . . . . . . . . . . . . . . . . . . . . . . . . . . . . . . . . . . . . . . . . . . . . . . . . . . . . . . . . . . . . . . . . . . . . . . . . . . . . . . . . . . . . . . . . . . . . . 3
Core Collection . . . . . . . . . . . . . . . . . . . . . . . . . . . . . . . . . . . . . . . . . . . . . . . . . . . . . . . . . . . . . . . . . . . . . . . . . . . . . . . . . . . . . . . 3Chemical Analysis . . . . . . . . . . . . . . . . . . . . . . . . . . . . . . . . . . . . . . . . . . . . . . . . . . . . . . . . . . . . . . . . . . . . . . . . . . . . . . . . . . . . 4Quality Assurance . . . . . . . . . . . . . . . . . . . . . . . . . . . . . . . . . . . . . . . . . . . . . . . . . . . . . . . . . . . . . . . . . . . . . . . . . . . . . . . . . . . . 5
Sources of Polychlorinated Biphenyls . . . . . . . . . . . . . . . . . . . . . . . . . . . . . . . . . . . . . . . . . . . . . . . . . . . . . . . . . . . . . . . . . . . . . . . 5Concentrations and Trends . . . . . . . . . . . . . . . . . . . . . . . . . . . . . . . . . . . . . . . . . . . . . . . . . . . . . . . . . . . . . . . . 7Polychlorinated Biphenyl Congener Patterns . . . . . . . . . . . . . . . . . . . . . . . . . . . . . . . . . . . . . . . . . . . . . . . . . 8Multivariate Analysis of Polychlorinated Biphenyls . . . . . . . . . . . . . . . . . . . . . . . . . . . . . . . . . . . . . . . . . . . . 8Metals and Polycyclic Aromatic Hydrocarbons as Source Indicators . . . . . . . . . . . . . . . . . . . . . . . . . . . 12Historical Data Regarding a Second Source . . . . . . . . . . . . . . . . . . . . . . . . . . . . . . . . . . . . . . . . . . . . . . . . . 12
Summary . . . . . . . . . . . . . . . . . . . . . . . . . . . . . . . . . . . . . . . . . . . . . . . . . . . . . . . . . . . . . . . . . . . . . . . . . . . . . . . . . . . . 15Selected References . . . . . . . . . . . . . . . . . . . . . . . . . . . . . . . . . . . . . . . . . . . . . . . . . . . . . . . . . . . . . . . . . . . . . . . . . . . . . . . . . . . . . . 16Appendixes . . . . . . . . . . . . . . . . . . . . . . . . . . . . . . . . . . . . . . . . . . . . . . . . . . . . . . . . . . . . . . . . . . . . . . . . . . . . . . . . . . . . . . . . . . . . . . . . 19
1. Analytical Results for Selected Chlorinated Hydrocarbon Compounds . . . . . . . . . . . . . . . . . . . . . . . . . . . 192. Analytical Results for Polycyclic Aromatic Hydrocarbons . . . . . . . . . . . . . . . . . . . . . . . . . . . . . . . . . . . 293. Analytical Results for Major and Trace Elements . . . . . . . . . . . . . . . . . . . . . . . . . . . . . . . . . . . . . . . . . . 43
Figures
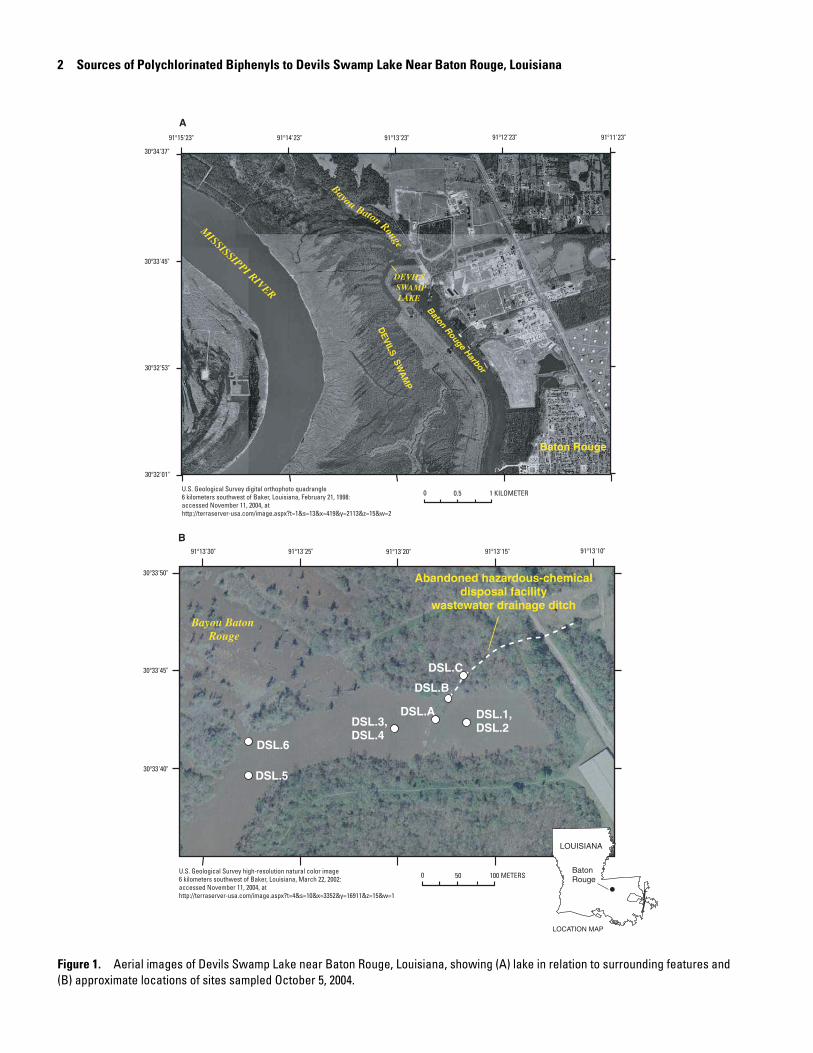
1. Aerial images of Devils Swamp Lake near Baton Rouge, Louisiana, showing (A) lake in relation to surrounding features and (B) approximate locations of sites sampled October 5, 2004 . . . . . . . . . . . . . . . . . . . . . . . . . . . . . . . . . . . . . . . . . . . . . . . . . . . . . . . . . . . . . . . . . . . . . . . . . . . . . . . . . . . 2
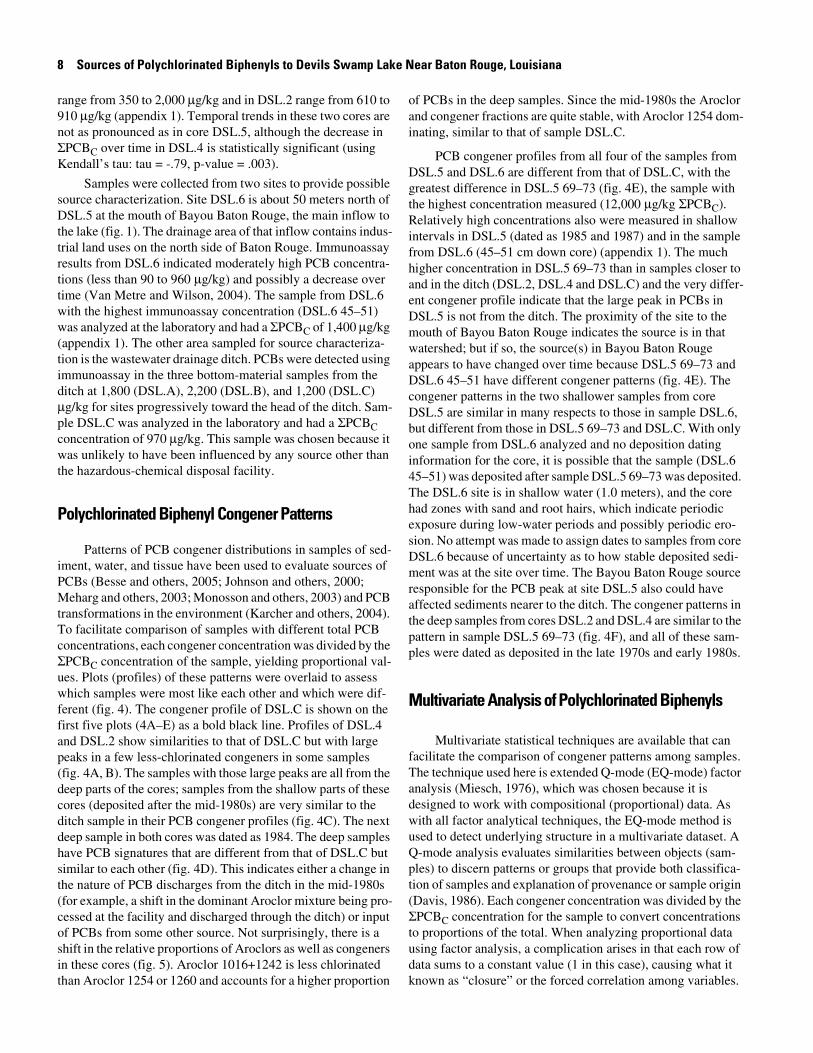
2. Photograph showing core DSL.5 collected from Devils Swamp Lake, Louisiana, October 5, 2004, split lengthwise for description and subsampling . . . . . . . . . . . . . . . . . . . . . . . . . . . . . . . . . . . . . . . . . . . . 4
3–7. Graphs showing: 3. Concentrations of polychlorinated biphenyls (PCBs) in Devils Swamp Lake,
Louisiana, cores—comparison of immunoassay screening results and laboratory analyses using gas chromatography with electron capture detection (GC–ECD) . . . . . . . . . . . . . 7
4. Polychlorinated biphenyl (PCB) congener patterns in various groups of bed sediment samples collected in and near Devils Swamp Lake, Louisiana . . . . . . . . . . . . . . . . . . . . . 9
5. Temporal shifts in relative concentrations (to total) of polychlorinated biphenyl (PCB) Aroclors in Devils Swamp Lake, Louisiana, bed sediments . . . . . . . . . . . . . . . . . . . . . . . . . . . 10
6. Factor loadings determined using proportions of polychlorinated biphenyl (PCB) congeners in samples from Devils Swamp Lake, Louisiana . . . . . . . . . . . . . . . . . . . . . . . . . . . . . . . . . 11
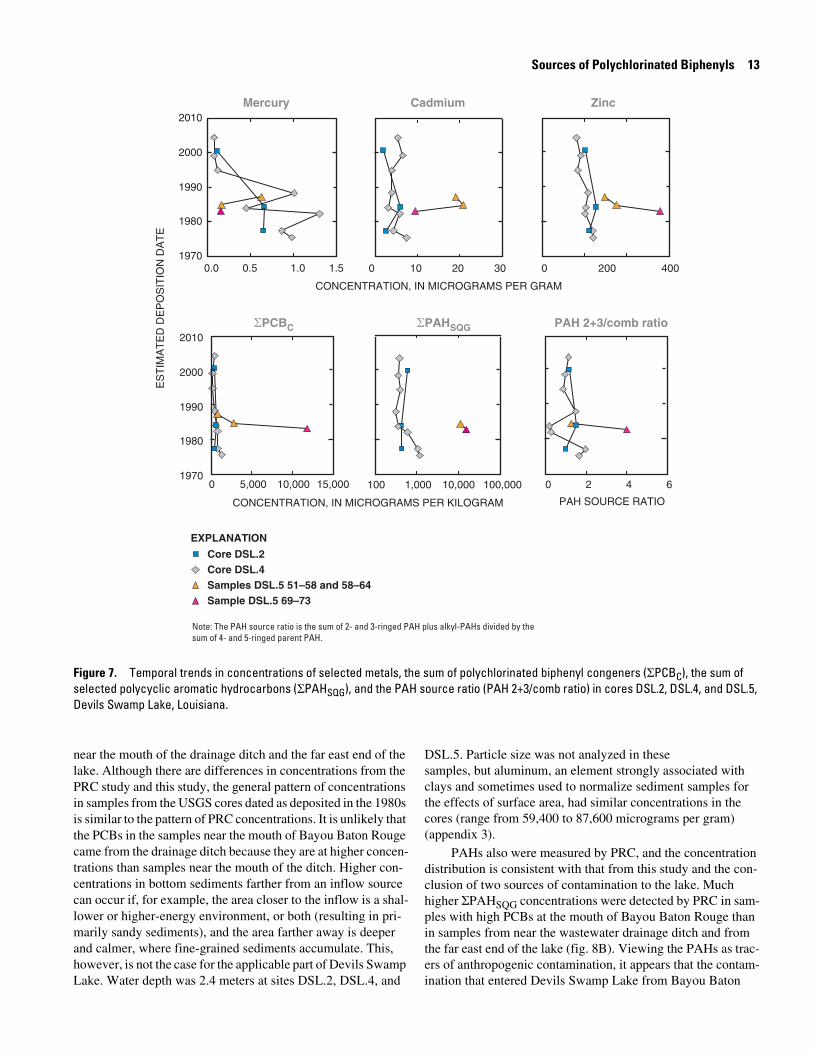
7. Temporal trends in concentrations of selected metals, the sum of polychlorinated biphenyl congeners (ΣPCBC), the sum of selected polycyclic aromatic hydrocarbons (ΣPAHSQG), and the PAH source ratio (PAH 2+3/comb ratio) in cores DSL.2, DSL.4, and DSL.5, Devils Swamp Lake, Louisiana . . . . . . . . . . . . . . . . . . . . . . . . . . . . . . . . . . . . . . . . . . . . . . . . . . 13

iv
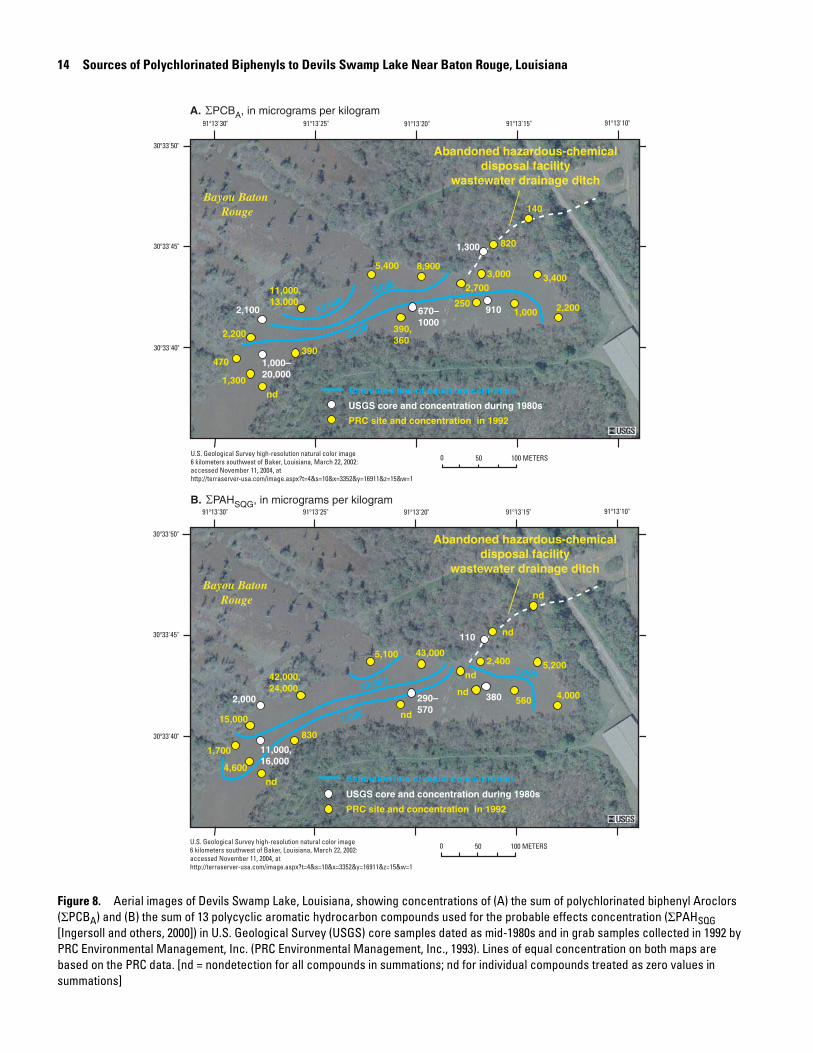
8. Aerial images of Devils Swamp Lake, Louisiana, showing concentrations of (A) the sum of polychlorinated biphenyl Aroclors (ΣPCBA) and (B) the sum of 13 polycyclic aromatic hydrocarbon compounds used for the probable effects concentration (ΣPAHSQG) in U.S. Geological Survey (USGS) core samples dated as mid-1980s and in grab samples collected in 1992 by PRC Environmental Management, Inc. . . . . . . . . . . . . . . . . . . . . . . . . . . . . . . . . . . . . . . . 14
Tables
1. Compound type, common name, abbreviation, and registry number for chlorinated hydrocarbon compounds . . . . . . . . . . . . . . . . . . . . . . . . . . . . . . . . . . . . . . . . . . . . . . . . . . . . . . . . . . . . . . . 6
2. Scores for factors representing three end-members determined using EQ-mode factor analysis of polychlorinated biphenyl (PCB) congener concentrations in sediment from Devils Swamp Lake, Louisiana . . . . . . . . . . . . . . . . . . . . . . . . . . . . . . . . . . . . . . . . . . . . . . . . . . . . . . . . . . . . . . . . . . . 10
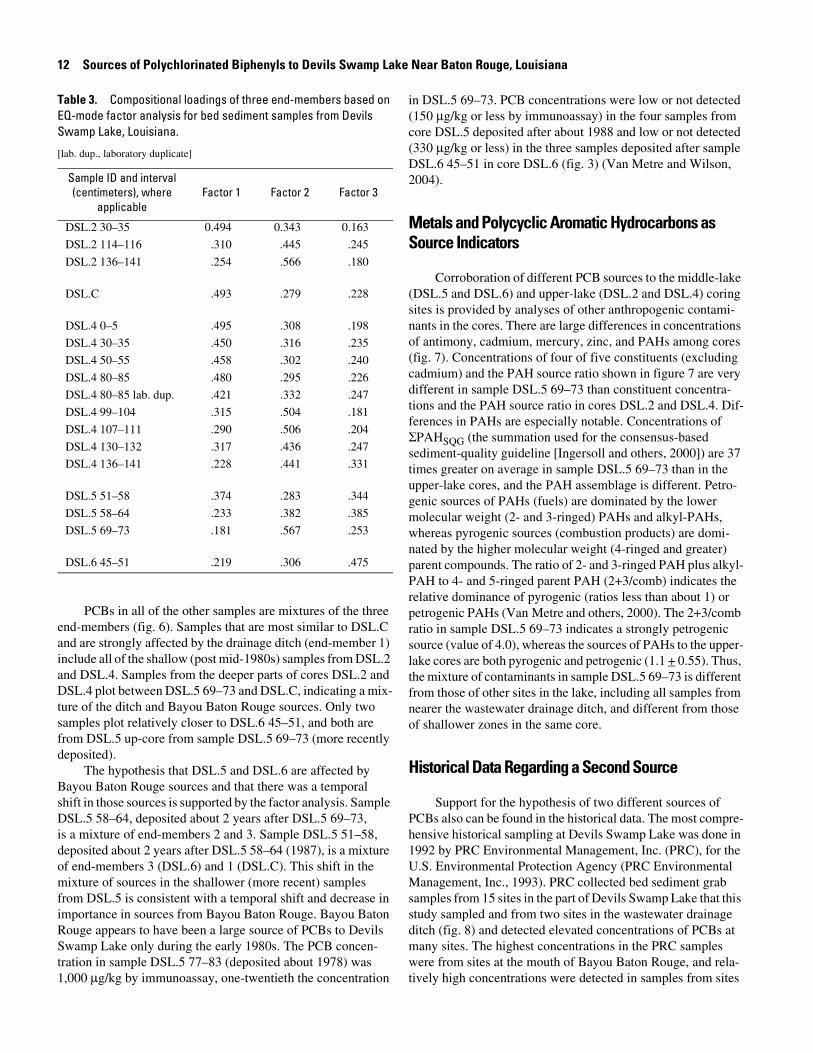
3. Compositional loadings of three end-members based on EQ-mode factor analysis for sediment samples from Devils Swamp Lake, Louisiana . . . . . . . . . . . . . . . . . . . . . . . . . . . . . . . . . . . . . . . . . . . 12
Sources of Polychlorinated Biphenyls to Devils Swamp Lake Near Baton Rouge, Louisiana
By Peter C. Van Metre, Jennifer T. Wilson, and Briant A. Kimball
Abstract
Devils Swamp Lake near Baton Rouge, Louisiana, created in 1973 by dredging in Devils Swamp along the Mississippi River, is contaminated with polychlorinated biphenyls (PCBs) from historical industrial discharges. This study involved the investigation of the occurrence, distribution, and sources of PCBs in the lake, including the possible historical contribution of PCBs from a hazardous-chemical disposal facility by way of a wastewater drainage ditch that was used from 1971 to 1993. Six bed sediment cores from the lake and three bed sediment grab samples from the drainage ditch were collected; 61 sub-samples from selected intervals in five of the six cores and the three grab samples from the ditch were analyzed for PCBs using an immunoassay screening method. Sixteen of the core subsam-ples and one ditch sample were analyzed for organochlorine pesticides, PCBs, polycyclic aromatic hydrocarbons (PAHs) (15 samples), and major and trace elements. PCB congener pro-files and a factor analysis of congener composition indicate that PCBs in sediment from the drainage ditch and in lake sediment deposited near the canal since the mid-1980s are similar, which indicates the disposal facility, by way of the wastewater drain-age ditch, is the source of the PCBs. Sediment from several hun-dred meters down the lake to the west, near where Bayou Baton Rouge enters the lake, had a different PCB composition and in a sample deposited in the early 1980s, a much higher concentra-tion, indicating a second source of PCBs in the watershed of Bayou Baton Rouge. Large differences in PAHs and metals between sediment near the ditch and sediment near Bayou Baton Rouge support this conclusion. The identity of the Bayou Baton Rouge source(s) cannot be established using available data. The short duration and relatively high concentrations of PCBs from the bayou source indicate either a spill or a flood-related release—there was a large flood on the Mississippi River in 1983. Older (deeper) samples from cores near the drainage ditch (dated as deposited before the mid-1980s) had PCB compositions that indicate a mixture of sources (Bayou Baton Rouge and the drainage ditch). Elevated PCB concentra-tions in sediment from the drainage ditch and cores from near
the mouth of the ditch in recent (post-2000) samples indicate that some PCB inputs from the ditch might still be occurring.
Introduction
Polychlorinated biphenyls (PCBs) were first synthesized in the laboratory in 1929, and an estimated 6.8 x 10⁸ kilograms were produced in the United States prior to cessation of produc-tion in 1977 (U.S. Environmental Protection Agency, 2006). PCBs were used in hundreds of commercial and industrial applications, including as plasticizers, as hydraulic lubricants in gas turbines and vacuum pumps, in heat-transfer systems, and as dielectric fluids in electrical transformers. PCBs are, in gen-eral, highly resistant to chemical or biological transformation. Because PCBs are persistent in the environment and strongly hydrophobic, sediment deposited in lakes and reservoirs can provide a historical record of PCB contamination in the water-shed. Sediment cores have been used to reconstruct water-quality histories in a variety of hydrologic and land-use settings (Davis, 1980). PCBs pose a threat to biota in aquatic systems because they are persistent, bioaccumulative, and toxic (U.S. Environmental Protection Agency, 1997).
Devils Swamp Lake is on the north side of Baton Rouge, La., along the east bank of the Mississippi River (fig. 1). The lake was constructed by dredging in 1973, and the material removed was used to reinforce the levee along the north and west sides of the Baton Rouge Harbor (U.S. Environmental Pro-tection Agency, 2004a). During flooding, the lake and sur-rounding swamp are inundated by water from the Mississippi River. A hazardous-chemical disposal facility is northeast of the lake. The facility began operating in 1971 and discharged wastewater to the north end of Devils Swamp Lake through a ditch. Presumably, discharges during 1971–73 were to the area of the wetland that was dredged to form the upper (east) end of the lake. The wastewater drainage ditch remained in use until 1993 when a discharge pipe to the Mississippi River was installed and permitted. Runoff from the facility also entered Devils Swamp upstream from the lake through one or more nat-ural drainage areas (U.S. Environmental Protection Agency,
2 Sources of Polychlorinated Biphenyls to Devils Swamp Lake Near Baton Rouge, Louisiana
Figure 1. Aerial images of Devils Swamp Lake near Baton Rouge, Louisiana, showing (A) lake in relation to surrounding features and (B) approximate locations of sites sampled October 5, 2004.
Baton Rouge Harbor
Baton Rouge
MISSISSIPPI RIVER
DEVILS SWAMP LAKE
Bayou Baton Rouge
DE
VILS
SW
AM
P
A
B
91o12'23" 91o11'23"91o13'23"91o14'23"91o15'23"
30o34'37"
30o33'45"
30o32'53"
30o32'01"
91o13'10"91o13'15"91o13'25"91o13'30"
30o33'50"
30o33'45"
30o33'40"
91o13'20"
U.S. Geological Survey digital orthophoto quadrangle6 kilometers southwest of Baker, Louisiana, February 21, 1998:accessed November 11, 2004, at http://terraserver-usa.com/image.aspx?t=1&s=13&x=419&y=2113&z=15&w=2
U.S. Geological Survey high-resolution natural color image6 kilometers southwest of Baker, Louisiana, March 22, 2002:accessed November 11, 2004, at http://terraserver-usa.com/image.aspx?t=4&s=10&x=3352&y=16911&z=15&w=1
Bayou Baton Rouge
Abandoned hazardous-chemicaldisposal facility
wastewater drainage ditch
DSL.A
DSL.B
DSL.C
DSL.3,DSL.4
DSL.1,DSL.2
DSL.5
DSL.6
0 0.5 1 KILOMETER
0 50 100 METERSBatonRouge
LOUISIANA
LOCATION MAP

Methods 3
2004b). Sediment sampling done by the Louisiana Department of Environmental Quality and the U.S. Environmental Protec-tion Agency in 1986 yielded PCBs in Devils Swamp Lake and in the wastewater drainage ditch (U.S. Environmental Protec-tion Agency, 2004a; PRC Environmental Management, Inc., 1993).
The objective of this study, done by the U.S. Geological Survey (USGS) in cooperation with the U.S. Environmental Protection Agency, was to determine if PCBs in all or parts of Devils Swamp Lake are from historical discharges into the lake from the hazardous-chemical disposal facility wastewater drainage ditch. Attribution was attempted on the basis of (1) the spatial and temporal record of PCB inputs preserved in bed sed-iments in relation to the effluent discharge history of the dis-posal facility, (2) the chemical signature of PCBs preserved in bed sediment in the lake in comparison to the chemical signa-ture of PCBs in bed sediment from the wastewater drainage ditch, and (3) relative concentrations of other anthropogenic contaminants (polycyclic aromatic hydrocarbons [PAHs] and trace elements [metals]) preserved in bed sediments as indica-tors of anthropogenic sources.
The purpose of this report is to document the findings of the study and describe sources of PCBs to Devils Swamp Lake. Bed sediment samples were collected from the drainage ditch, and bed sediment cores were collected from several sites in Devils Swamp Lake near where the drainage ditch enters the lake and down-lake to the west near where Bayou Baton Rouge enters the lake. Cores were split lengthwise, visually described, photographed, and selected intervals of the cores were subsam-pled. Sixty-one core subsamples and three drainage ditch bed sediment samples were analyzed for PCBs using an immunoas-say screening method. On the basis of those results, 16 of the core subsamples and one drainage ditch bed sediment sample were analyzed for PCB congeners and other organic and inor-ganic constituents in the laboratory and interpreted to evaluate historical sources of PCBs to the lake.
Methods
Six bed sediment cores were collected from four sites in Devils Swamp Lake and grab bed sediment samples were collected from three sites in the drainage ditch on October 5, 2004 (Van Metre and Wilson, 2004). Cores DSL.1 and DSL.2 were collected near each other from a site in the upper (east) end of the lake, east of the low spit of land where the drainage ditch enters the lake (fig. 1). This spit separates the upper end from the main body of the lake during low water. Cores DSL.3 and DSL.4 were collected near each other at the approximate lake center and about the same distance west of the spit as the locations of DSL.1 and DSL.2 were to the east or about 50 meters. Core DSL.5 was collected from a location about 300 meters southwest of where the drainage ditch enters the lake at the approximate lake center. Core DSL.6 was collected north of DSL.5, near the shore in front of a channel entering the
lake from the large area of wetlands to the north and where Bayou Baton Rouge enters the lake. The bayou is a 248-square-kilometer watershed to the north and west of the lake. Three bed sediment samples were collected from the drainage ditch: DSL.A, on the spit of land about 40 meters into the lake from where the canal crosses the north shore of the lake; DSL.B, about even with the north shore of the lake; and DSL.C, about 40 meters upstream from the north shore of the lake. The spit of land containing the drainage ditch extends across the lake and the remains of the ditch banks and bottom were covered with vegetation during sampling in 2004. The spit probably repre-sents the pre-dredging level of the wetland prior to lake con-struction in 1973. Except during floods, the spit is exposed and probably contained ditch flow as far as the middle of the lake, where erosion of the ditch banks was apparent in 2004. All three ditch samples were of the top 10 to 15 centimeters (cm) of bed sediment at the center of the 3- to 4-meter-wide canal and were scooped directly into glass jars.
Core Collection
Cores were collected using a 6.7-cm-diameter push corer with a polybutyrate liner attached to a check valve and an alu-minum rod that is pushed into the lake bed sediment to obtain a core. The liners were washed with phosphate-free detergent and tap water prior to use and only used once. Cores were pushed into the bed sediment until firm sediment prevented further penetration. Sediment recovery ranged from 51 to 148 cm. Cores were returned to the USGS office in Austin, Tex., where they were sampled the following day. Each core was split lengthwise by cutting most of the way through the liner on opposite sides using a circular saw, cutting the rest of the way through using a utility knife, then slicing the sediment with a washed, Teflon-coated blade. Each core was photographed (fig. 2) and described. Description included color, texture, odor, and presence or absence of visible organic detritus, biota, and gas pockets. Subsamples of selected intervals from the cores were transferred to baked-glass or Nalgene jars for chemical analysis. Intervals were selected either using a constant length (for example, 5 cm) or on the basis of distinct changes in color and odor. Color changes were mostly alternating light (olive-gray) and dark (black) bands in the cores thought to correspond to less- and more-contaminated sediments, respectively. Sedi-ments, especially in the dark layers, had a hydrocarbon odor. Subsamples for chemical analysis were scooped from the open liner using a Teflon-coated spatula taking care to not include material in contact with the walls of the liner. Subsampling tools were cleaned between each sample by rinsing with tap water, washing with phosphate-free detergent, and rinsing again with tap water. A subsample for analysis of organic compounds was transferred to a baked-glass jar and chilled pending ship-ment to the laboratory. A subsample for analysis of major and trace elements was transferred to a polypropylene jar, frozen, freeze-dried, and ground to a fine powder before shipment to the laboratory.

4 Sources of Polychlorinated Biphenyls to Devils Swamp Lake Near Baton Rouge, Louisiana
Chemical Analysis
Selected sediment samples were analyzed for total PCBs using the RaPID Assay® immunoassay kit (Strategic Diagnos-tics, Inc., 2004) as reported in Van Metre and Wilson (2004). A subset of samples analyzed by immunoassay were analyzed for organochlorine pesticides (OCs), PCBs, PAHs, and major and trace elements at the USGS National Water Quality Laboratory (NWQL).
Organochlorine pesticides, PCBs, PAHs, and alkyl-substi-tuted PAHs (alkyl-PAHs) were extracted, isolated, and ana-lyzed using the procedures of Noriega and others (2003) and Olson and others (2003). Briefly, wet bed sediment was extracted overnight with dichloromethane in a Soxhlet appara-tus. The extract was reduced in volume and filtered. Two aliquots of the sample extract were quantitatively injected into a polystyrene-divinylbenzene gel permeation column and eluted with dichloromethane to remove sulfur and partially iso-late the target analytes from coextracted high-molecular-weight interferences such as humic substances. The first aliquot was
passed through a silica column cleanup step and then analyzed for PAHs and alkyl-PAHs by capillary-column gas chromatog-raphy with detection by mass spectrometry. Parent PAHs were identified and quantified by comparison to authentic stan-dards. Individual alkyl-PAHs were quantified when authentic alkyl-substituted standards were available. The multiple iso-meric alkyl-PAHs were quantified from mass chromatograms as the sum of all isomers at each alkylation level (C1-naphtha-lenes, C2-naphthalenes, and so forth). When authentic alkyl-substituted standards were unavailable, a parent PAH was used as the standard for quantification. Nineteen parent PAHs, 10 specific alkyl-PAHs, and the homologous series of alkyl-PAHs were determined. The second aliquot was further split into two fractions by combined alumina/silica adsorption chro-matography followed by a micro Florisil column cleanup step prior to determination of the OCs and PCBs by dual capillary-column gas chromatography with electron capture detection (GC–ECD). The OCs were reported as individual compounds. PCBs were reported as individual Aroclor (1016+1242, 1254, or 1260) equivalents (Noriega and others, 2003).
Figure 2. Core DSL.5 collected from Devils Swamp Lake, Louisiana, October 5, 2004, split lengthwise for description and subsampling.
Top of
core
Bottom of
core
SampleDSL.5 69–73
from herePre-reservoirfirm clay layer

Sources of Polychlorinated Biphenyls 5
For this study, fraction 1 (PCB fraction) of the second aliquot was analyzed for 27 (of 209 possible) PCB congeners (table 1) along with the other fraction 1 analytes during GC–ECD analysis. The congeners chosen for this analysis were some of the more dominant congeners in the most widely used Aroclors (1016, 1242, 1254, and 1260). In addition to the dom-inance of these congeners, potential co-elution issues and signal response for this analytical method also was considered. A series of dilutions of a custom mixture containing the 27 selected PCB congeners was used to make the calibration stan-dards. Calibration standards were prepared at four levels and a minimum of three points was used for the calibration curves. An additional congener solution was prepared at a concentration that was mid-range on the curve and was used as a check stan-dard to verify the calibration curve. The method reporting level (MRL) for PCB Aroclors is 5 micrograms per kilogram (μg/kg). An MRL has not been established for individual congeners because the analytical method is new; however, it is thought to be conservatively about 1 μg/kg. Concentrations less thanthe MRL were reported when the analyst was confident in the detection; those concentrations are identified in the tables of analytical results as estimated (E) (appendixes 1, 2). The quan-tification of individual congeners is thought to be more precise than the Aroclor equivalents; hence, the sum of the 27 conge-ners (ΣPCBC) is used for most interpretations. A comparison of all samples indicated that ΣPCBC accounted for 67 percent (mean), ±10 percent (1 standard deviation), of the sum of the Aroclors (ΣPCBA).
Samples for analysis of major and trace elements were completely digested using a mixture of hydrochloric-nitric-perchloric-hydrofluoric acids and analyzed by inductively coupled plasma/mass spectrometry (Briggs and Meier, 2003). Mercury was analyzed by cold vapor atomic absorption spec-trometry (Arbogast, 1996).
Quality Assurance
Quality assurance for chlorinated hydrocarbon compounds and PAH analyses was provided by analyzing laboratory dupli-cate, analytical blank, and spiked samples (appendixes 1, 2), and by monitoring recovery of surrogate compounds. The NWQL analyzes one duplicate, one analytical blank, and one spiked sample with each set of 12 environmental samples (not necessarily all from the same study) (Noriega and others, 2003; Olson and others, 2003). Two duplicate samples analyzed for this study (both for OCs and PCBs, although PCB congeners were not reported for one of the two) had a median relative percent difference (RPD) of 8.8 percent. There were no detec-tions in the blank samples. Two blank samples (set numbers 200504607 and 200504608) were ruined during preparation at the laboratory, and no results were reported. Median spike recoveries for sample sets that included samples from this study were 84 percent for OCs and PCBs and 72 percent for PAHs. Spike recoveries met control limits in 78 percent of the OC and PCB and 99 percent of the PAH spike results. All spike results
with poor recovery were above control limits. One spiked sam-ple (set number 200503908) was ruined during preparation at the laboratory, and no results were reported. Surrogate recover-ies were within acceptable ranges for 98 percent of the samples analyzed for OCs and PCBs, 93 percent of the samples analyzed for PAHs, and 96 percent of the blank and spiked samples. A problem was encountered during preparation of one OC and PCB sample (DSL.4 99–104) that required a 10-to-1 dilution, which subsequently raised the MRLs by a factor of 10.
Quality assurance for analyses of major and trace elements was provided by analyzing four standard reference materials (SRMs) (appendix 3). Median RPD for all elements for all SRMs was 3.4 percent.
Sources of Polychlorinated Biphenyls
Undisturbed bed sediment cores from lakes and reservoirs can be used to reconstruct contaminant release histories in the watershed for persistent, hydrophobic compounds like PCBs if a sediment chronology can be established (Eisenreich and others, 1989; Van Metre and others, 1998). In reservoirs, one useful date marker is the boundary between lacustrine sediment and pre-reservoir material (Van Metre and others, 1997; Van Metre and others, 2004). That interface usually is charac-terized by an abrupt change from soft, fine-grained, high-porosity sediment typical of lake-bottom environments to firmer, drier soil or sandy sediment. The nature of the pre-reservoir sediment varies depending on what existed at the loca-tion prior to the emplacement of the lake. Devils Swamp Lake was created by dredging, so it is expected that material underly-ing the lacustrine sediment is an alluvial clay or a deeper soil horizon and that it is much firmer and of lower porosity than the overlying lacustrine sediment.
Six cores were collected using a push corer. Each time, the push corer initially encountered little resistance as it penetrated the lacustrine sediment, then encountered firm resistance, rela-tively suddenly, at depth. Maximum recovery was 148 cm at DSL.2. No obvious pre-reservoir material was recovered in the cores, with the possible exception of a 1-cm layer of firm, silty clay at the bottom of DSL.5 (fig. 2). The initial ease of pene-tration and the relatively abrupt resistance to penetration at depth indicate the corer could easily penetrate soft lacustrine sediment but was stopped by pre-reservoir soil or clay. Deposi-tion dates for samples from cores DSL.2, DSL.4, and DSL.5 were assigned assuming cores penetrated almost to the pre-reservoir soil marking 1973, when dredging formed the lake, and assuming a constant mass accumulation rate of sediment for each core. Mass accumulation rate in each core was calculated using measured porosity and an assumed density of solids (2.0 grams per cubic centimeter, typical of lake sediments with moderate organic carbon content [Van Metre and others, 2004]) for sediment samples over the time interval thought to be repre-sented by the core. The time interval was from 1975 (the bottom of the core, assuming the bottom was just above the late-1973

6 Sources of Polychlorinated Biphenyls to Devils Swamp Lake Near Baton Rouge, Louisiana
Table 1. Compound type, common name, abbreviation, and registry number for chlorinated hydrocarbon compounds.
[CAS, Chemical Abstracts Service; μg/kg, micrograms per kilogram --, none assigned]
Compoundtype
Compoundcommon name Abbreviation
CAS registrynumber
Methodreporting level
(μg/kg)
Organochlorine pesticides Aldrin -- 309–00–2 2.0cis-Chlordane -- 5103–71–9 1.0trans-Chlordane -- 5103–74–2 .5p,p'-DDD p,p'-DDD 72–54–8 2.5p,p'-DDE p,p'-DDE 72–55–9 1.5p,p'-DDT p,p'-DDT 50–29–3 1.0Dieldrin -- 60–57–1 .5Endosulfan I (alpha-Endosulfan) -- 959–98–8 .5Endrin -- 72–20–8 1.0Heptachlor -- 76–44–8 1.0Heptachlor epoxide (Isomer B) -- 1024–57–3 1.5gamma-Hexachlorocyclohexane (Lindane) γ-HCH 58–89–9 .5Mirex -- 2385–85–5 1.5trans-Nonachlor -- 39765–80–5 1.0Toxaphene (technical) -- 8001–35–2 200
PCB Aroclors PCB Aroclor 1016+1242 -- -- 5PCB Aroclor 1254 -- 11097–69–1 5PCB Aroclor 1260 -- 11096–82–5 5
PCB congeners PCB 8 -- 34883–43–7 1PCB 18 -- 37680–65–2 1PCB 22 -- 38444–85–8 1PCB 26 -- 38444–81–4 1PCB 28 -- 7012–37–5 1PCB 31 -- 16606–02–3 1PCB 33 -- 38444–86–9 1PCB 44 -- 41464–39–5 1PCB 49 -- 41464–40–8 1PCB 52 -- 35693–99–3 1PCB 70 -- 32598–11–1 1PCB 95 -- 38379–99–6 1PCB 101 -- 37680–73–2 1PCB 110 -- 38380–03–9 1PCB 118 -- 31508–00–6 1PCB 138 -- 35065–28–2 1PCB 146 -- 51908–16–8 1PCB 149 -- 38380–04–0 1PCB 151 -- 52663–63–5 1PCB 170 -- 35065–30–6 1PCB 174 -- 38411–25–5 1PCB 177 -- 52663–70–4 1PCB 180 -- 35065–29–3 1PCB 183 -- 52663–69–1 1PCB 187 -- 52663–68–0 1PCB 194 -- 35694–08–7 1PCB 206 -- 40186–72–9 1
Surrogates alpha-Hexachlorocyclohexane-dλ α-HCH-dλ 434–90–2 --Isodrin -- 465–73–6 --2,2',3,3',4,4',5,6,6'-Nonachlorobiphenyl (PCB 207) PCB-207 52663–79–3 --

Sources of Polychlorinated Biphenyls 7
completion of dredging) to the sampling date in October 2004 (the top of the core). This approach is similar to the approach used by Van Metre and others (2004) for reservoir cores where a single depth-date marker was known at depth in the core, usu-ally either the construction date of the reservoir or the peak in radioactive cesium-137 activity.
All five cores from along the axis of the lake (excluding core DSL.6) had alternating light and dark layering, with dark layers more common in deeper sediments (Van Metre and Wilson, 2004). DSL.2, for example, was a relatively uniform olive gray to a depth of 75 cm, then alternated between streaks of olive gray and black, some as thick as 2 cm, to the bottom of the core at 148 cm. Although the overall pattern of increasing numbers of dark sediment layers with increasing depth occurred in all five cores, there were differences between cores, and the dark layers could not be directly correlated between cores, even for cores collected close to one another.
Concentrations and Trends
PCBs were detected in about 70 percent of the 64 samples analyzed by immunoassay (excluding duplicates) (Van Metre and Wilson, 2004) and in all 16 samples analyzed in the labora-tory (appendix 1). Immunoassay concentrations generally were lower than laboratory analyses of PCBs—the immunoassay
results were 57 and 42 percent (median) of ΣPCBC and ΣPCBA concentrations, respectively—but reasonably represented the occurrence and patterns in trends (fig. 3). The highest concentrations were less than 58 cm (1985) in core DSL.5; the maximum ΣPCBC concentration was 12,000 μg/kg in sample DSL.5 69–73 (1982). ΣPCBA and the immunoassay concentra-tions were 20,000 and 14,500 μg/kg in this sample, respec-tively. The large, narrow peak in concentration and the non-detections using immunoassay in the upper part of the core indicate a short-term release for most of the PCBs and that the most contaminated bed sediment has since been buried by sub-sequent sediment deposition.
Concentrations of PCBs in cores DSL.4 and DSL.2 are about 10 to 20 times lower than the peak concentration in DSL.5 but are high compared with urban lake sediments in the United States and sediment-quality guidelines. The median ΣPCBA concentrations in the 1970s and 1990s in 14 densely urban lakes (greater than 50-percent urban land use in the watershed) in 10 major urban areas across the United States were 275 and 108 μg/kg, respectively (Van Metre and Mahler, 2005). The proba-ble effect concentration (PEC) for PCBs is 676 μg/kg (Mac-Donald and others, 2000). The PEC is the concentration above which adverse effects on benthic biota in freshwater systems are expected. The PEC does not consider bioaccumulation in wild-life and its consequences, such as human health risk from inges-tion of contaminated fish. Concentrations of ΣPCBA in DSL.4
Figure 3. Concentrations of polychlorinated biphenyls (PCBs) in Devils Swamp Lake, Louisiana, cores—comparison of immunoassay screening results and laboratory analyses using gas chromatography with electron capture detection (GC–ECD).
Core DSL.5Core DSL.4Core DSL.2
0 5 10 15 200 0.5 1.0 1.5
POLYCHLORINATED BIPHENYL CONCENTRATION, IN MILLIGRAMS PER KILOGRAM
0 0.2 0.4 0.6 0.81970
1975
1980
1985
1990
1995
2000
2005E
ST
IMA
TE
D D
EP
OS
ITIO
N D
AT
E
Nondetection using immunoassay
Detection using immunoassay
Sum of PCB congener concentrations (ΣPCBC) using GC-ECD
EXPLANATION
8 Sources of Polychlorinated Biphenyls to Devils Swamp Lake Near Baton Rouge, Louisiana
range from 350 to 2,000 μg/kg and in DSL.2 range from 610 to 910 μg/kg (appendix 1). Temporal trends in these two cores are not as pronounced as in core DSL.5, although the decrease in ΣPCBC over time in DSL.4 is statistically significant (using Kendall’s tau: tau = -.79, p-value = .003).
Samples were collected from two sites to provide possible source characterization. Site DSL.6 is about 50 meters north of DSL.5 at the mouth of Bayou Baton Rouge, the main inflow to the lake (fig. 1). The drainage area of that inflow contains indus-trial land uses on the north side of Baton Rouge. Immunoassay results from DSL.6 indicated moderately high PCB concentra-tions (less than 90 to 960 μg/kg) and possibly a decrease over time (Van Metre and Wilson, 2004). The sample from DSL.6 with the highest immunoassay concentration (DSL.6 45–51) was analyzed at the laboratory and had a ΣPCBC of 1,400 μg/kg (appendix 1). The other area sampled for source characteriza-tion is the wastewater drainage ditch. PCBs were detected using immunoassay in the three bottom-material samples from the ditch at 1,800 (DSL.A), 2,200 (DSL.B), and 1,200 (DSL.C) μg/kg for sites progressively toward the head of the ditch. Sam-ple DSL.C was analyzed in the laboratory and had a ΣPCBC concentration of 970 μg/kg. This sample was chosen because it was unlikely to have been influenced by any source other than the hazardous-chemical disposal facility.
Polychlorinated Biphenyl Congener Patterns
Patterns of PCB congener distributions in samples of sed-iment, water, and tissue have been used to evaluate sources of PCBs (Besse and others, 2005; Johnson and others, 2000; Meharg and others, 2003; Monosson and others, 2003) and PCB transformations in the environment (Karcher and others, 2004). To facilitate comparison of samples with different total PCB concentrations, each congener concentration was divided by the ΣPCBC concentration of the sample, yielding proportional val-ues. Plots (profiles) of these patterns were overlaid to assess which samples were most like each other and which were dif-ferent (fig. 4). The congener profile of DSL.C is shown on the first five plots (4A–E) as a bold black line. Profiles of DSL.4 and DSL.2 show similarities to that of DSL.C but with large peaks in a few less-chlorinated congeners in some samples (fig. 4A, B). The samples with those large peaks are all from the deep parts of the cores; samples from the shallow parts of these cores (deposited after the mid-1980s) are very similar to the ditch sample in their PCB congener profiles (fig. 4C). The next deep sample in both cores was dated as 1984. The deep samples have PCB signatures that are different from that of DSL.C but similar to each other (fig. 4D). This indicates either a change in the nature of PCB discharges from the ditch in the mid-1980s (for example, a shift in the dominant Aroclor mixture being pro-cessed at the facility and discharged through the ditch) or input of PCBs from some other source. Not surprisingly, there is a shift in the relative proportions of Aroclors as well as congeners in these cores (fig. 5). Aroclor 1016+1242 is less chlorinated than Aroclor 1254 or 1260 and accounts for a higher proportion
of PCBs in the deep samples. Since the mid-1980s the Aroclor and congener fractions are quite stable, with Aroclor 1254 dom-inating, similar to that of sample DSL.C.
PCB congener profiles from all four of the samples from DSL.5 and DSL.6 are different from that of DSL.C, with the greatest difference in DSL.5 69–73 (fig. 4E), the sample with the highest concentration measured (12,000 μg/kg ΣPCBC). Relatively high concentrations also were measured in shallow intervals in DSL.5 (dated as 1985 and 1987) and in the sample from DSL.6 (45–51 cm down core) (appendix 1). The much higher concentration in DSL.5 69–73 than in samples closer to and in the ditch (DSL.2, DSL.4 and DSL.C) and the very differ-ent congener profile indicate that the large peak in PCBs in DSL.5 is not from the ditch. The proximity of the site to the mouth of Bayou Baton Rouge indicates the source is in that watershed; but if so, the source(s) in Bayou Baton Rouge appears to have changed over time because DSL.5 69–73 and DSL.6 45–51 have different congener patterns (fig. 4E). The congener patterns in the two shallower samples from core DSL.5 are similar in many respects to those in sample DSL.6, but different from those in DSL.5 69–73 and DSL.C. With only one sample from DSL.6 analyzed and no deposition dating information for the core, it is possible that the sample (DSL.6 45–51) was deposited after sample DSL.5 69–73 was deposited. The DSL.6 site is in shallow water (1.0 meters), and the core had zones with sand and root hairs, which indicate periodic exposure during low-water periods and possibly periodic ero-sion. No attempt was made to assign dates to samples from core DSL.6 because of uncertainty as to how stable deposited sedi-ment was at the site over time. The Bayou Baton Rouge source responsible for the PCB peak at site DSL.5 also could have affected sediments nearer to the ditch. The congener patterns in the deep samples from cores DSL.2 and DSL.4 are similar to the pattern in sample DSL.5 69–73 (fig. 4F), and all of these sam-ples were dated as deposited in the late 1970s and early 1980s.
Multivariate Analysis of Polychlorinated Biphenyls
Multivariate statistical techniques are available that can facilitate the comparison of congener patterns among samples. The technique used here is extended Q-mode (EQ-mode) factor analysis (Miesch, 1976), which was chosen because it is designed to work with compositional (proportional) data. As with all factor analytical techniques, the EQ-mode method is used to detect underlying structure in a multivariate dataset. A Q-mode analysis evaluates similarities between objects (sam-ples) to discern patterns or groups that provide both classifica-tion of samples and explanation of provenance or sample origin (Davis, 1986). Each congener concentration was divided by the ΣPCBC concentration for the sample to convert concentrations to proportions of the total. When analyzing proportional data using factor analysis, a complication arises in that each row of data sums to a constant value (1 in this case), causing what it known as “closure” or the forced correlation among variables.

Sources of Polychlorinated Biphenyls 9
Figure 4. Polychlorinated biphenyl (PCB) congener patterns in various groups of bed sediment samples collected in and near Devils Swamp Lake, Louisiana.
A. Site DSL.4, all samples B. Site DSL.2, all samples
D. Sites DSL.2 and 4, deep samples
E. Sites DSL.5 and 6, all samples F. Sites DSL.5 69–73 and DSL.2 and DSL.4, deep samples
C. Sites DSL.2 and 4, shallow samples
PCB 8
PCB 206
27 PCB CONGENERS
PCB 95
PCB 149... ... ...
PCB 8
27 PCB CONGENERS
PCB 95
PCB 149... ... ...
PCB 206
0
0.02
0.04
0.06
0.08
0.1
0.12
0.14
0.16
0
0.02
0.04
0.06
0.08
0.1
0.12
0.14
0.16
0
0.02
0.04
0.06
0.08
0.1
0.12
0.14
0.16
CO
NC
EN
TR
AT
ION
OF
IND
IVID
UA
L C
ON
GE
NE
R, I
N M
ICR
OG
RA
MS
PE
R K
ILO
GR
AM
, DIV
IDE
D B
YC
ON
CE
NT
RA
TIO
N O
F S
UM
OF
27
CO
NG
EN
ER
S, I
N M
ICR
OG
RA
MS
PE
R K
ILO
GR
AM
0
0.04
0.08
0.12
0.16
0.2
0.24
0
0.04
0.08
0.12
0.16
0.2
0.24
0
0.04
0.08
0.12
0.16
0.2
0.24
Core sample1
DSL.5 69–73 (1982)DSL.2 114–116 (1984)DSL.2 136–141 (1977)DSL.4 107–111 (1982)DSL.4 130–132 (1977)DSL.4 136–141 (1976)
EXPLANATION
Wastewaterdrainage ditchDSL.CCore sample1
DSL.2 114–116 (1984)DSL.2 136–141 (1977)DSL.4 107–111 (1982)DSL.4 130–132 (1977)DSL.4 136–141 (1976)
EXPLANATION
Wastewaterdrainage ditchDSL.CCore sample1
DSL.2 30–35 (2001)DSL.2 114–116 (1984)DSL.2 136–141 (1977)
EXPLANATIONWastewaterdrainage ditchDSL.CCore sample1
DSL.4 0–5 (2004)DSL.4 30–35 (1999)DSL.4 50–55 (1995)DSL.4 80–85 (1988)DSL.4 80–85duplicate (1988)DSL.4 99–104 (1984)DSL.4 107–111 (1982)DSL.4 130–132 (1977)DSL.4 136–141 (1976)
EXPLANATION
Wastewaterdrainage ditchDSL.CCore sample1
DSL.4 0–5 (2004)DSL.4 30–35 (1999)DSL.4 50–55 (1995)DSL.4 80–85 (1988)DSL.4 80–85duplicate(1988)DSL.2 30–35 (2001)
EXPLANATION
Wastewaterdrainage ditchDSL.CCore sample1
DSL.5 51–58 (1987)DSL.5 58–64 (1985)DSL.5 69–73 (1982)DSL.6 45–51 (unknown)
EXPLANATION
1Range in sample identifier indicates sample depth (centimeters) down core. Estimated sediment deposition date of samples follows in parenthesis.

10 Sources of Polychlorinated Biphenyls to Devils Swamp Lake Near Baton Rouge, Louisiana
The special routines of EQ-mode analysis were developed to handle such data (Miesch, 1976).
Results of EQ-mode factor analysis are expressed as com-positional loadings for each sample. These loadings represent the proportion of each end-member in a given sample. On the basis of eigenvalues and the evaluation of plots of congener pro-files (fig. 4), three end-members adequately accounted for the variance in PCB congener composition among the samples. Three factors were determined using EQ-mode analysis and varimax normalized rotation, an orthogonal rotation technique that maximizes the variance of the elements in the columns of a factor matrix. These three factors accounted for 81.3 percent of the variance in the data. Scores that represent an idealized com-position of the end-members in terms of the congeners and com-positional loadings for samples are listed in tables 2 and 3, respectively. Because the loadings are compositional, they sum to 1 for each sample.
Plotting compositional loadings on a tri-linear graph indi-cates which samples are most similar to the end-members, which samples should represent distinct sources, and which samples are most affected by those sources (fig. 6). DSL.C is most similar to end-member 1, indicating that this end-member represents sediment influenced by the wastewater drainage
ditch source. Samples DSL.5 69–73 and DSL.6 45–51 are most similar to end-members 2 and 3, respectively, indicating two other PCB sources. The locations of cores DSL.5 and DSL.6 near the mouth of Bayou Baton Rouge and the different compo-sitional loadings from samples near the wastewater drainage ditch, including DSL.C, indicate Bayou Baton Rouge as the source of end-members 2 and 3. As noted above, the deposition date of DSL.6 45–51 is unknown, and it is possible that this sample and DSL.5 69–73 represent Bayou Baton Rouge sources active during different time periods.
Figure 5. Temporal shifts in relative concentrations (to total) of polychlorinated biphenyl (PCB) Aroclors in Devils Swamp Lake, Louisiana, bed sediments.
Ditch and shallow parts of DSL2 and DSL.4
Deep parts of DSL2 and DSL.4
PCB 1016+1242 PCB 1254
AROCLOR FRACTION OF TOTAL PCB
0.00 0.20 0.40 0.60 0.80
ES
TIM
AT
ED
DE
PO
SIT
ION
DA
TE
1970
1980
1990
2000
2010
EXPLANATION
PCB 1016+1242, by siteCore DSL.4Core DSL.2Ditch DSL.CPCB 1254, by siteCore DSL.4Core DSL.2Ditch DSL.C
Table 2. Scores for factors representing three end-members determined using EQ-mode factor analysis of polychlorinated biphenyl (PCB) congener concentrations in bed sediment from Devils Swamp Lake, Louisiana.
Congener Factor 1 Factor 2 Factor 3
PCB 8 -0.01214 0.01647 0.01866
PCB 18 -.05722 .01661 .11603
PCB 22 -.01230 .02203 .01145
PCB 26 -.07536 .23367 -.06497
PCB 28 -.05172 .10364 .07816
PCB 31 -.04802 .05029 .09132
PCB 33 .00249 .02630 .00095
PCB 44 -.00900 .08080 .00008
PCB 49 -.03516 .30550 -.03231
PCB 52 -.02393 .13889 .08125
PCB 70 .05620 -.07520 .22721
PCB 95 .20932 -.02979 .21394
PCB 101 .14710 -.03802 .10949
PCB 110 .15435 .04733 .06731
PCB 118 .24214 -.01771 .04430
PCB 138 .17339 .02943 -.01036
PCB 146 .02834 .00916 .00157
PCB 149 .07897 .01149 .08513
PCB 151 .02158 .01368 -.00277
PCB 170 .03775 .00743 -.00922
PCB 174 .02784 .00450 -.00101
PCB 177 .01833 .00688 -.00186
PCB 180 .06412 .01226 -.01231
PCB 183 .01838 .00222 -.00060
PCB 187 .03238 .01425 -.00990
PCB 194 .01010 .00504 -.00034
PCB 206 .00209 .00285 -.00118

Sources of Polychlorinated Biphenyls 11
Figure 6. Factor loadings determined using proportions of polychlorinated biphenyl (PCB) congeners in samples from Devils Swamp Lake, Louisiana. Plotting positions of points on the two graphs are the same.
DSL.C
DSL.5 51–58 DSL.4 0–5DSL.2 30–35
DSL.5 58–64
DSL.5 69–73
DSL.2 114–116
DSL.2 136–141
DSL.4 99–104
DSL.4 30–35
DSL.4 107–111
DSL.4 130–132DSL.4 136–141
DSL.C
DSL.5 69–73
DSL.6 45–51
DSL.6 45–51
DSL.2 and 4 deep
DSL.2 and 4 shallow
Hypothetical mixing
DSL.5 58–64
DSL.5 51–58
DSL.4 80–85(+dup.)
DSL.4 50–55
Part of graphenlarged below
FACTOR 1
0.500.25 0.75
FAC
TOR
3
0.25
0.50
0.75
FACTO
R 2
0.25
0.50
0.75
FAC
TOR
3
0.00
0.25
0.50
0.75
1.00
FACTO
R 2
0.00
0.25
0.50
0.75
1.00
FACTOR 1
0.00 0.25 0.50 0.75 1.00
12 Sources of Polychlorinated Biphenyls to Devils Swamp Lake Near Baton Rouge, Louisiana
PCBs in all of the other samples are mixtures of the three end-members (fig. 6). Samples that are most similar to DSL.C and are strongly affected by the drainage ditch (end-member 1) include all of the shallow (post mid-1980s) samples from DSL.2 and DSL.4. Samples from the deeper parts of cores DSL.2 and DSL.4 plot between DSL.5 69–73 and DSL.C, indicating a mix-ture of the ditch and Bayou Baton Rouge sources. Only two samples plot relatively closer to DSL.6 45–51, and both are from DSL.5 up-core from sample DSL.5 69–73 (more recently deposited).
The hypothesis that DSL.5 and DSL.6 are affected by Bayou Baton Rouge sources and that there was a temporal shift in those sources is supported by the factor analysis. Sample DSL.5 58–64, deposited about 2 years after DSL.5 69–73, is a mixture of end-members 2 and 3. Sample DSL.5 51–58, deposited about 2 years after DSL.5 58–64 (1987), is a mixture of end-members 3 (DSL.6) and 1 (DSL.C). This shift in the mixture of sources in the shallower (more recent) samples from DSL.5 is consistent with a temporal shift and decrease in importance in sources from Bayou Baton Rouge. Bayou Baton Rouge appears to have been a large source of PCBs to Devils Swamp Lake only during the early 1980s. The PCB concen-tration in sample DSL.5 77–83 (deposited about 1978) was 1,000 μg/kg by immunoassay, one-twentieth the concentration
in DSL.5 69–73. PCB concentrations were low or not detected (150 μg/kg or less by immunoassay) in the four samples from core DSL.5 deposited after about 1988 and low or not detected (330 μg/kg or less) in the three samples deposited after sample DSL.6 45–51 in core DSL.6 (fig. 3) (Van Metre and Wilson, 2004).
Metals and Polycyclic Aromatic Hydrocarbons as Source Indicators
Corroboration of different PCB sources to the middle-lake (DSL.5 and DSL.6) and upper-lake (DSL.2 and DSL.4) coring sites is provided by analyses of other anthropogenic contami-nants in the cores. There are large differences in concentrations of antimony, cadmium, mercury, zinc, and PAHs among cores (fig. 7). Concentrations of four of five constituents (excluding cadmium) and the PAH source ratio shown in figure 7 are very different in sample DSL.5 69–73 than constituent concentra-tions and the PAH source ratio in cores DSL.2 and DSL.4. Dif-ferences in PAHs are especially notable. Concentrations of ΣPAHSQG (the summation used for the consensus-based sediment-quality guideline [Ingersoll and others, 2000]) are 37 times greater on average in sample DSL.5 69–73 than in the upper-lake cores, and the PAH assemblage is different. Petro-genic sources of PAHs (fuels) are dominated by the lower molecular weight (2- and 3-ringed) PAHs and alkyl-PAHs, whereas pyrogenic sources (combustion products) are domi-nated by the higher molecular weight (4-ringed and greater) parent compounds. The ratio of 2- and 3-ringed PAH plus alkyl-PAH to 4- and 5-ringed parent PAH (2+3/comb) indicates the relative dominance of pyrogenic (ratios less than about 1) or petrogenic PAHs (Van Metre and others, 2000). The 2+3/comb ratio in sample DSL.5 69–73 indicates a strongly petrogenic source (value of 4.0), whereas the sources of PAHs to the upper-lake cores are both pyrogenic and petrogenic (1.1 + 0.55). Thus, the mixture of contaminants in sample DSL.5 69–73 is different from those of other sites in the lake, including all samples from nearer the wastewater drainage ditch, and different from those of shallower zones in the same core.
Historical Data Regarding a Second Source
Support for the hypothesis of two different sources of PCBs also can be found in the historical data. The most compre-hensive historical sampling at Devils Swamp Lake was done in 1992 by PRC Environmental Management, Inc. (PRC), for the U.S. Environmental Protection Agency (PRC Environmental Management, Inc., 1993). PRC collected bed sediment grab samples from 15 sites in the part of Devils Swamp Lake that this study sampled and from two sites in the wastewater drainage ditch (fig. 8) and detected elevated concentrations of PCBs at many sites. The highest concentrations in the PRC samples were from sites at the mouth of Bayou Baton Rouge, and rela-tively high concentrations were detected in samples from sites
Table 3. Compositional loadings of three end-members based on EQ-mode factor analysis for bed sediment samples from Devils Swamp Lake, Louisiana.
[lab. dup., laboratory duplicate]
Sample ID and interval(centimeters), where
applicableFactor 1 Factor 2 Factor 3
DSL.2 30–35 0.494 0.343 0.163
DSL.2 114–116 .310 .445 .245
DSL.2 136–141 .254 .566 .180
DSL.C .493 .279 .228
DSL.4 0–5 .495 .308 .198
DSL.4 30–35 .450 .316 .235
DSL.4 50–55 .458 .302 .240
DSL.4 80–85 .480 .295 .226
DSL.4 80–85 lab. dup. .421 .332 .247
DSL.4 99–104 .315 .504 .181
DSL.4 107–111 .290 .506 .204
DSL.4 130–132 .317 .436 .247
DSL.4 136–141 .228 .441 .331
DSL.5 51–58 .374 .283 .344
DSL.5 58–64 .233 .382 .385
DSL.5 69–73 .181 .567 .253
DSL.6 45–51 .219 .306 .475
Sources of Polychlorinated Biphenyls 13
near the mouth of the drainage ditch and the far east end of the lake. Although there are differences in concentrations from the PRC study and this study, the general pattern of concentrations in samples from the USGS cores dated as deposited in the 1980s is similar to the pattern of PRC concentrations. It is unlikely that the PCBs in the samples near the mouth of Bayou Baton Rouge came from the drainage ditch because they are at higher concen-trations than samples near the mouth of the ditch. Higher con-centrations in bottom sediments farther from an inflow source can occur if, for example, the area closer to the inflow is a shal-lower or higher-energy environment, or both (resulting in pri-marily sandy sediments), and the area farther away is deeper and calmer, where fine-grained sediments accumulate. This, however, is not the case for the applicable part of Devils Swamp Lake. Water depth was 2.4 meters at sites DSL.2, DSL.4, and
DSL.5. Particle size was not analyzed in these samples, but aluminum, an element strongly associated with clays and sometimes used to normalize sediment samples for the effects of surface area, had similar concentrations in the cores (range from 59,400 to 87,600 micrograms per gram) (appendix 3).
PAHs also were measured by PRC, and the concentration distribution is consistent with that from this study and the con-clusion of two sources of contamination to the lake. Much higher ΣPAHSQG concentrations were detected by PRC in sam-ples with high PCBs at the mouth of Bayou Baton Rouge than in samples from near the wastewater drainage ditch and from the far east end of the lake (fig. 8B). Viewing the PAHs as trac-ers of anthropogenic contamination, it appears that the contam-ination that entered Devils Swamp Lake from Bayou Baton
Figure 7. Temporal trends in concentrations of selected metals, the sum of polychlorinated biphenyl congeners (ΣPCBC), the sum of selected polycyclic aromatic hydrocarbons (ΣPAHSQG), and the PAH source ratio (PAH 2+3/comb ratio) in cores DSL.2, DSL.4, and DSL.5, Devils Swamp Lake, Louisiana.
CONCENTRATION, IN MICROGRAMS PER GRAM
CONCENTRATION, IN MICROGRAMS PER KILOGRAM PAH SOURCE RATIO
0.0 0.5 1.0 1.5 0 10 20 30 0 200 400
100 1,000 10,000 100,0000 5,000 10,000 15,000 0 2 4 6
ES
TIM
AT
ED
DE
PO
SIT
ION
DA
TE
1970
1980
1990
2000
2010
1970
1980
1990
2000
2010
Mercury ZincCadmium
PAH 2+3/comb ratioΣPCBC ΣPAHSQG
Samples DSL.5 51–58 and 58–64Sample DSL.5 69–73
EXPLANATION
Core DSL.4Core DSL.2
Note: The PAH source ratio is the sum of 2- and 3-ringed PAH plus alkyl-PAHs divided by thesum of 4- and 5-ringed parent PAH.
14 Sources of Polychlorinated Biphenyls to Devils Swamp Lake Near Baton Rouge, Louisiana
Figure 8. Aerial images of Devils Swamp Lake, Louisiana, showing concentrations of (A) the sum of polychlorinated biphenyl Aroclors (ΣPCBA) and (B) the sum of 13 polycyclic aromatic hydrocarbon compounds used for the probable effects concentration (ΣPAHSQG [Ingersoll and others, 2000]) in U.S. Geological Survey (USGS) core samples dated as mid-1980s and in grab samples collected in 1992 by PRC Environmental Management, Inc. (PRC Environmental Management, Inc., 1993). Lines of equal concentration on both maps are based on the PRC data. [nd = nondetection for all compounds in summations; nd for individual compounds treated as zero values in summations]
Bayou Baton Rouge
Bayou Baton Rouge
U.S. Geological Survey high-resolution natural color image6 kilometers southwest of Baker, Louisiana, March 22, 2002:accessed November 11, 2004, at http://terraserver-usa.com/image.aspx?t=4&s=10&x=3352&y=16911&z=15&w=1
U.S. Geological Survey high-resolution natural color image6 kilometers southwest of Baker, Louisiana, March 22, 2002:accessed November 11, 2004, at http://terraserver-usa.com/image.aspx?t=4&s=10&x=3352&y=16911&z=15&w=1
0 50 100 METERS
0 50 100 METERS
Abandoned hazardous-chemicaldisposal facility
wastewater drainage ditch
Abandoned hazardous-chemicaldisposal facility
wastewater drainage ditch
10,000
2,000
5,000
1,000
10,0001,000
470
2,700
1,000 2,200
8,900
390,360
5,400
1,300
11,000,13,000
390
nd
140
820
3,4003,000
250
2,200
1,700
nd
560 4,000
43,000
nd
5,100
4,600
42,000,24,000
830
nd
nd
nd
5,2002,400
nd
15,000
1,300
670–1000
9102,100
1,000–20,000
110
290–570
3802,000
11,000,16,000
Estimated line of equal concentration
PRC site and concentration in 1992
USGS core and concentration during 1980s
PRC site and concentration in 1992
USGS core and concentration during 1980s
Estimated line of equal concentration
B. ΣPAHSQG, in micrograms per kilogram
A. ΣPCBA, in micrograms per kilogram
91o13'10"91o13'15"91o13'25"91o13'30"
30o33'50"
30o33'45"
30o33'40"
91o13'20"
91o13'10"91o13'15"91o13'25"91o13'30"
30o33'50"
30o33'45"
30o33'40"
91o13'20"
Summary 15
Rouge had high concentrations of PCBs and PAHs, whereas the contamination that entered from the wastewater drainage ditch had high concentrations of PCBs but low concentrations of PAHs (fig. 8). A similar conclusion, higher concentrations from the Bayou Baton Rouge source, can be drawn for most metals. Metals with notably higher concentrations in cores DSL.5 and DSL.6 (and sample DSL.5 69–73) compared with those in cores DSL.2 and DSL.4 include antimony, arsenic, cadmium, chro-mium, lead, nickel, and zinc (appendix 3).
The duration of the PCB inputs varied as well, with a rela-tively short period of input from Bayou Baton Rouge and a much longer period of input from the drainage ditch. The short period of input from Bayou Baton Rouge is indicated by PCB concentration trends in core DSL.5 (fig. 3) and by the PCB con-gener profiles in deeper, older samples from DSL.2 and DSL.4 that show inputs from the Bayou Baton Rouge source(s) only in intervals deposited in the late 1970s and early 1980s (fig. 4D). The long duration of PCB inputs from the drainage ditch is indi-cated by PCB concentrations and congener profiles in cores DSL.2 and DSL.4, which indicate a mixture of sources (Bayou Baton Rouge and the drainage ditch) in the late 1970s and early 1980s and primarily the drainage ditch source after the mid-1980s. On the basis of the elevated PCB concentrations (greater than the median of 108 μg/kg from urban lakes and in many cases greater than the PEC of 676 μg/kg) in recent (post-2000) drainage ditch sediment and in recently deposited sediments at DSL.2 and DSL.4, some PCB inputs from the ditch might still be occurring.
The identity of the Bayou Baton Rouge source(s) could not be established using available data. The short duration and rel-atively high concentration of PCBs from the bayou source (as indicated by PCB concentration trends in core DSL.5 and con-centration in sample DSL.5 69–73) indicate either a spill or a flood-related release. There was a large flood on the Mississippi River in 1983, and a sediment plume was visible emanating from a natural drainage channel from the hazardous-chemical disposal facility in an aerial photograph taken in 1984 (U.S. Environmental Protection Agency, 2004b). The natural channel entered Bayou Baton Rouge upstream from Devils Swamp Lake and flowed through a “soil-borrow pit” at the disposal facility that was filled with “standing-liquid” pits. Other indus-trial and waste-processing facilities are in the watershed of Bayou Baton Rouge (Agency for Toxic Substances and Disease Registry, 1996). PCB congener data and other chemical data that might help identify sources, however, are not available from the other disposal facility channel(s), Bayou Baton Rouge, or other industrial sites in its watershed. If the source was the disposal facility by way of another channel, it must have come from a very different waste stream than material discharged by the wastewater drainage ditch sampled in this study. Alterna-tively, if the source was another facility farther upstream, a chemical record of those releases during the early 1980s might not be preserved in bottom sediments in Bayou Baron Rouge because of the dynamic nature of stream channels, where higher flows can remobilize and transport deposited sediments.
Summary
Devils Swamp Lake near Baton Rouge, La., created by dredging in 1973 in Devils Swamp along the Mississippi River, is contaminated with PCBs from historical industrial dis-charges. This report describes a study, done by the U.S. Geolog-ical Survey in cooperation with the U.S. Environmental Protec-tion Agency, involved investigation of the occurrence and sources of PCBs in the lake, including the possible historical contribution of PCBs from a hazardous-chemical disposal facil-ity by way of a wastewater drainage ditch that was used from 1971 to 1993. Six bed sediment cores from the lake and three bed sediment grab samples from the drainage ditch were col-lected; 61 subsamples from five of the six cores and the three grab samples from the ditch were analyzed for PCBs using an immunoassay screening method. Sixteen of the core subsam-ples and one ditch sample were analyzed for organochlorine pesticides, PCBs as Aroclor mixtures and as 27 specific conge-ners, PAHs (15 samples), and major and trace elements. The immunoassay screening method reasonably represented the overall patterns in concentrations in the laboratory analytical data.
The highest concentration of PCBs was in a sample depos-ited in about 1983 in core DSL.5, about 300 meters southwest of where the drainage ditch enters the lake and near the mouth of Bayou Baton Rouge. The PCB profile in this core defined a sharp peak in the early 1980s, with low concentrations after about 1990, indicating a short-term release in the early 1980s. Concentrations decreased much more slowly in core DSL.4 and have remained variable but elevated over the past 25 years in core DSL.2, both of those sites about 50 meters west and east, respectively, from the low spit of land that marks the entrance of the ditch into the lake. PCBs were elevated in three samples of bed sediment from the ditch analyzed by immunoassay and confirmed in the one sample analyzed using GC–ECD at the laboratory.
PCB congener profiles and a factor analysis of congener composition indicate that PCBs in bed sediment from the drain-age ditch and in lake bed sediment deposited near the ditch (cores DSL.2 and DSL.4) since the mid-1980s are similar, which indicate the hazardous-chemical disposal facility, by way of the wastewater drainage ditch, is the source of the PCBs. Bed sediment from several hundred meters to the west, near where Bayou Baton Rouge enters the lake (cores DSL.5 and DSL.6), had a different PCB composition, and in one sample deposited in the early 1980s, a much higher concentration, which indi-cates a second source of PCBs in the watershed of Bayou Baton Rouge. Large differences in PAHs and metals in cores from the two areas of the lake support the conclusion that there was a sec-ond PCB source. Older (deeper) samples from cores near the ditch (before the mid-1980s; cores DSL.2 and DSL.4) had PCB compositions indicating a mixture of the ditch source and the Bayou Baton Rouge source.
PCB profiles in the sediment cores indicate that the Bayou Baton Rouge source was large but of short duration, whereas
16 Sources of Polychlorinated Biphenyls to Devils Swamp Lake Near Baton Rouge, Louisiana
the drainage ditch source appears to have introduced PCBs to the lake at relatively steady, elevated levels, since the lake was formed. The long duration of PCB releases from the drainage ditch source is indicated by PCB concentrations and congener profiles in cores DSL.2 and DSL.4, which reflect a mixture of sources (Bayou Baton Rouge and the drainage ditch) in the late 1970s and early 1980s and primarily the drainage ditch source after the mid-1980s. Elevated PCB concentrations (greater than the median of 108 μg/kg from urban lakes and in many cases above the PEC of 676 μg/kg) in recent (pre-2000) drainage ditch sediment and in recently deposited sediment at DSL.2 and DSL.4 indicate that some PCB inputs from the ditch might still be occurring.
The identity of the Bayou Baton Rouge source(s) could not be established using available data. The short duration and rel-atively high concentrations of PCBs of the bayou source (as indicated by PCB concentration trends in core DSL.5 and con-centration in sample DSL.5 69–73) indicate either a spill or a flood-related release—there was a large flood on the Missis-sippi River in 1983.
Selected References
Arbogast, B.F, ed., 1996, Analytical methods manual for the Mineral Resource Surveys Program: U.S. Geological Survey Open-File Report 96–525, 248 p.
Agency for Toxic Substances and Disease Registry, 1996, Public health assessment—Petro-Processors of Louisiana Incorporated, Baton Rouge, East Baton Rouge Parish, Loui-siana: Agency for Toxic Substances and Disease Registry, accessed June 19, 2006, at http://www.atsdr.cdc.gov/HAC/PHA/petro/pet_p1.html
Besse, R.E., Van Metre, P.C., and Wilson, J.T., 2005, Distribu-tion and sources of polychlorinated biphenyls in Woods Inlet, Lake Worth, Fort Worth, Texas, 2003: U.S. Geological Survey Scientific Investigations Report 2005–5064, 46 p.
Briggs, P.H., and Meier, A.L., 2003, The determination of forty-two elements in geological materials by inductively-coupled plasma-mass spectrometry for NAWQA, in Taggart, J.E.J., ed., Analytical methods for chemical analysis of geologic and other materials, U.S. Geological Survey: U.S. Geological Survey Open-File Report 2002–223, 16 p.
Davis, J.C., 1986, Statistics and data analysis in geology (2d ed.): New York, Wiley, 646 p.
Davis, R.B., 1980, The scope of Quaternary paleolimnology, in Davis, R.B., ed., Paleolimnology and the reconstruction of ancient environments: Boston, Kluwer Academic, p. 1–24.
Eisenreich, S.J., Capel, P.D., Robbins, J.A., and Boubonniere, R.A., 1989, Accumulation and diagenesis of chlorinated hydrocarbons in lacustrine sediments: Environmental Science and Technology, v. 23, no. 9, p. 1,116–1,126.
Ingersoll, C.G., MacDonald, D.D., Wang, N., Crane, J.L., Field, L.J., Haverland, P.S., Kemble, N.E., Lingskoog, R.A., Severn C., and Smorong, D.E., 2000, Prediction of sediment
toxicity using consensus-based freshwater sediment quality guidelines: U.S. Environmental Protection Agency EPA 905/R-00/007, 25 p.
Johnson, G.W., Jarman, W.M., Bacon, C.E., Davis, J.A., Ehr-lich, R., and Risenbough, R.W., 2000, Resolving polychlori-nated biphenyl source fingerprints in suspended particulate matter of San Francisco Bay: Environmental Science and Technology, v. 34, no. 4, p. 552–559.
Karcher, S.C., Small, J.M., and Vanbriesen, J.M., 2004, Statis-tical method to evaluate the occurrence of PCB transforma-tions in river sediments with application to Hudson River data: Environmental Science and Technology, v. 38, no. 24, p. 6,760–6,766.
MacDonald, D.D., Ingersoll, C.G., and Berger, T.A., 2000, Development and evaluation of consensus-based sediment quality guidelines for freshwater ecosystems: Archives of Environmental Contamination and Toxicology, v. 39, p. 20–31.
Meharg, A.A., Wright, J., Leeks, G.J.L., Wass, P.D., Owens, P.N., Walling, D.E., and Osborn, D., 2003, PCB congener dynamics in a heavily industrialized river catchment: The Science of the Total Environment, v. 314–316, p. 439–450.
Miesch, A.T., 1976, Interactive computer programs for petro-logic modeling with extended Q-mode factor analysis: Com-puters and Geosciences, v. 2, p. 439–492.
Monosson, E., Ashley, J.T.F., McElroy, A.E., Woltering, D., and Elshus, A.A., 2003, PCB congener distributions in mus-cle, liver and gonad of Fundulus heteroclitus from the lower Hudson River Estuary and Newark Bay: Chemosphere, v. 52, p. 777–787.
Noriega, M.C., Wydoski, D.S., and Foreman, W.T., 2003, Methods of analysis by the U.S. Geological Survey National Water Quality Laboratory—Determination of organochlo-rine pesticides and polychlorinated biphenyls in bottom and suspended sediment by gas chromatography with electron-capture detection: U.S. Geological Survey Water-Resources Investigations Report 03–4293, 46 p.
Olson, M.C., Iverson, J.L., Furlong, E.T., and Schroeder, M.P., 2003, Methods of analysis by the U.S. Geological Survey National Water Quality Laboratory—Determination of poly-cyclic aromatic hydrocarbon compounds in sediment by gas chromatography/mass spectrometry: U.S. Geological Survey Water-Resources Investigations Report 03–4318, 45 p.
Potts, P.J., Tindle, A.G., and Webb, P.C., 1992, Geochemical reference material compositions—Rocks, minerals, sedi-ments, soils, carbonates, refractories, and ores used in research and industry: Boca Raton, Fla., CRC Press, 313 p.
PRC Environmental Management, Inc., 1993, Expanded site inspection for Devil's Swamp Lake, East Baton Rouge Par-ish, Louisiana—Final report: U.S. Environmental Protection Agency LAD985202464.
Strategic Diagnostics, Inc., 2004, Remediation, assessment, & industrial testing: RaPID Assay, [description], accessed October 2, 2006, at http://www.sdix.com/PDF/Products/rapcbpp.pdf

Selected References 17
U.S. Environmental Protection Agency, 1997, The incidence and severity of sediment contamination in surface waters of the United States: Volume 1—National sediment quality survey: U.S. Environmental Protection Agency EPA 823–R–97–006.
U.S. Environmental Protection Agency, 2004a, Devil's Swamp Lake, Baton Rouge, Louisiana: U.S. Environmental Protec-tion Agency, accessed June 19, 2006, at http://www.epa.gov/earth1r6/6sf/pdffiles/devils_swamp.pdf
U.S. Environmental Protection Agency, 2004b, Aerial photo-graphic analysis of Devil's Swamp Lake site, Scotlandville, Louisiana: U.S. Environmental Protection Agency Report no. TS–PIC–20506006S.
U.S. Environmental Protection Agency, 2006, Polychlorinated biphenyls (PCBs): U.S. Environmental Protection Agency, accessed June 19, 2006, at http://www.epa.gov/pcb/index.html
Van Metre, P.C., Callender, Edward, and Fuller, C.C., 1997, Historical trends in organochlorine compounds in river basins identified using sediment cores from reservoirs: “Environmental Science and Technology, v. 31, no. 8, p. 2,339–2,344.
Van Metre, P.C., and Mahler, B.J., 2005, Trends in hydrophobic organic contaminants in lake sediments across the United States, 1970–2001: Environmental Science and Technology, v. 39, no. 15, p. 5,567–5,574.
Van Metre, P.C., Mahler, B.J., and Furlong, E.T., 2000, Urban sprawl leaves its PAH signature: Environmental Science and Technology, v. 34, p. 4,064–4,070.
Van Metre, P.C., and Wilson, J.T., 2004, Immunoassay screen-ing of sediment cores for polychlorinated biphenyls, Devils Swamp Lake near Baton Rouge, Louisiana, 2004: U.S. Geological Survey Open-File Report 2004–1397, 10 p.
Van Metre, P.C., Wilson, J.T., Callender, Edward, and Fuller, C.C., 1998, Similar rates of decrease of persistent, hydropho-bic contaminants in riverine systems: Environmental Science and Technology, v. 32, no. 21, p. 3,312–3,317.
Van Metre, P.C., Wilson, J.T., Fuller, C.C., Callender, Edward, and Mahler, B.J., 2004, Collection, analysis, and age-dating of sediment cores from 56 U.S. lakes and reservoirs sampled by the U.S. Geological Survey, 1992–2001: U.S. Geological Survey Scientific Investigations Report 2004–5184, 180 p.

Blank Page

Appendix 1—Analytical Results for Selected Chlorinated Hydrocarbon Compounds

Blank Page

Appendix 1 21
Sources of Polychlorinated Biphenyls to Devils Swamp Lake Near Baton Rouge, Louisiana
Appendix 1
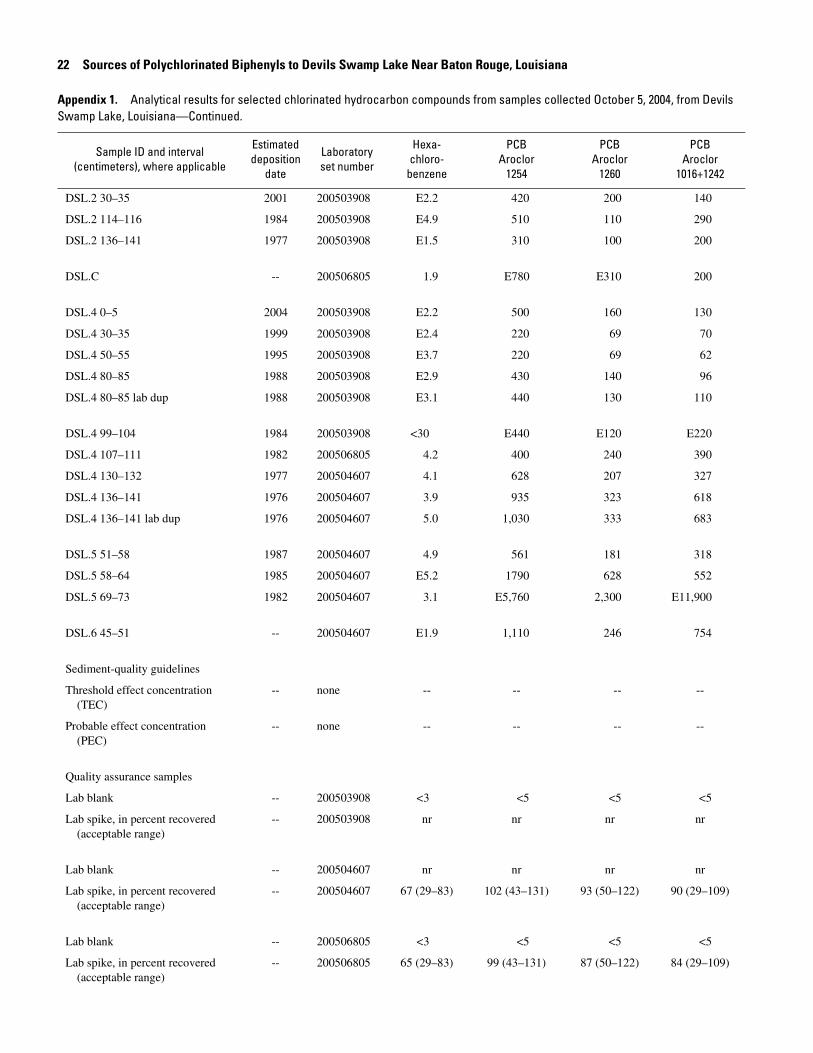
Appendix 1. Analytical results for selected chlorinated hydrocarbon compounds from samples collected October 5, 2004, from Devils Swamp Lake, Louisiana.
[In micrograms per kilogram except as indicated. Concentration in bold exceeds probable effect concentration (MacDonald and others, 2000). ID, identifier;
<, nondetection at indicated value; E, estimated; --, not calculated; lab dup, laboratory duplicate; lab, laboratory; nr, not reported]
Sample ID and interval(centimeters), where applicable
Estimateddeposition
date
Laboratoryset number
p,p’-DDD
p,p’-DDE
p,p’-DDT Dieldrin Heptachlor
epoxide
DSL.2 30–35 2001 200503908 <2.5 1.8 <1.0 <0.5 <1.0
DSL.2 114–116 1984 200503908 <5.0 E1.5 <2.0 <1.0 <2.0
DSL.2 136–141 1977 200503908 1.3 1.7 <1.0 <.5 <1.0
DSL.C -- 200506805 <2.5 15 <1.0 <.5 <1.0
DSL.4 0–5 2004 200503908 <2.5 E1.0 E1.0 <.5 <1.0
DSL.4 30–35 1999 200503908 <2.5 E.9 E.8 <.5 <1.0
DSL.4 50–55 1995 200503908 <2.5 E1.1 <1.0 <.5 <1.0
DSL.4 80–85 1988 200503908 <2.5 E1.3 E1.2 <.5 <1.0
DSL.4 80–85 lab dup 1988 200503908 <2.5 1.5 E.8 <.5 <1.0
DSL.4 99–104 1984 200503908 <25 <15 <10 <5.0 <10
DSL.4 107–111 1982 200506805 2.9 5.8 <1.0 <.5 <1.0
DSL.4 130–132 1977 200504607 E1.4 2.9 <1.0 <.5 <1.0
DSL.4 136–141 1976 200504607 <2.5 4.2 <1.0 <.5 <1.0
DSL.4 136–-141 lab dup 1976 200504607 <2.5 3.8 <1.0 <.5 E.9
DSL.5 51–58 1987 200504607 E1.6 2.7 <1.0 <.5 E.6
DSL.5 58–64 1985 200504607 5.6 10.5 6.9 <1.0 <2.0
DSL.5 69–73 1982 200504607 19 34 2.7 2.3 <1.0
DSL.6 45–51 -- 200504607 E1.0 3.5 3.4 <.5 <1.0
Sediment-quality guidelines
Threshold effect concentration (TEC)
-- none 4.88 3.16 4.16 1.9 2.47
Probable effect concentration (PEC)
-- none 28.0 31.3 62.9 61.8 16.0
Quality assurance samples
Lab blank -- 200503908 <2.5 <1.5 <1 <.5 <1.5
Lab spike, in percent recovered (acceptable range)
-- 200503908 nr nr nr nr nr
Lab blank -- 200504607 nr nr nr nr nr
Lab spike, in percent recovered (acceptable range)
-- 200504607 70 (22–110) 81 (49–121) 102 (37–99) 93 (40–98) 94 (43–88)
Lab blank -- 200506805 <2.5 <1.5 <1 <.5 <1.5
Lab spike, in percent recovered (acceptable range)
-- 200506805 84 (22–110) 75 (49–121) nr (37–99) 64 (40–98) 57 (43–88)
22 Sources of Polychlorinated Biphenyls to Devils Swamp Lake Near Baton Rouge, Louisiana
Appendix 1. Analytical results for selected chlorinated hydrocarbon compounds from samples collected October 5, 2004, from Devils Swamp Lake, Louisiana—Continued.
Sample ID and interval(centimeters), where applicable
Estimateddeposition
date
Laboratoryset number
Hexa-chloro-
benzene
PCBAroclor
1254
PCBAroclor
1260
PCBAroclor
1016+1242
DSL.2 30–35 2001 200503908 E2.2 420 200 140
DSL.2 114–116 1984 200503908 E4.9 510 110 290
DSL.2 136–141 1977 200503908 E1.5 310 100 200
DSL.C -- 200506805 1.9 E780 E310 200
DSL.4 0–5 2004 200503908 E2.2 500 160 130
DSL.4 30–35 1999 200503908 E2.4 220 69 70
DSL.4 50–55 1995 200503908 E3.7 220 69 62
DSL.4 80–85 1988 200503908 E2.9 430 140 96
DSL.4 80–85 lab dup 1988 200503908 E3.1 440 130 110
DSL.4 99–104 1984 200503908 <30 E440 E120 E220
DSL.4 107–111 1982 200506805 4.2 400 240 390
DSL.4 130–132 1977 200504607 4.1 628 207 327
DSL.4 136–141 1976 200504607 3.9 935 323 618
DSL.4 136–141 lab dup 1976 200504607 5.0 1,030 333 683
DSL.5 51–58 1987 200504607 4.9 561 181 318
DSL.5 58–64 1985 200504607 E5.2 1790 628 552
DSL.5 69–73 1982 200504607 3.1 E5,760 2,300 E11,900
DSL.6 45–51 -- 200504607 E1.9 1,110 246 754
Sediment-quality guidelines
Threshold effect concentration (TEC)
-- none -- -- -- --
Probable effect concentration (PEC)
-- none -- -- -- --
Quality assurance samples
Lab blank -- 200503908 <3 <5 <5 <5
Lab spike, in percent recovered (acceptable range)
-- 200503908 nr nr nr nr
Lab blank -- 200504607 nr nr nr nr
Lab spike, in percent recovered (acceptable range)
-- 200504607 67 (29–83) 102 (43–131) 93 (50–122) 90 (29–109)
Lab blank -- 200506805 <3 <5 <5 <5
Lab spike, in percent recovered (acceptable range)
-- 200506805 65 (29–83) 99 (43–131) 87 (50–122) 84 (29–109)

Appendix 1 23
Appendix 1. Analytical results for selected chlorinated hydrocarbon compounds from samples collected October 5, 2004, from Devils Swamp Lake, Louisiana—Continued.
Sample ID and interval(centimeters), where applicable
Estimateddeposition
date
Laboratoryset number
cis-Chlordane
trans-Chlordane
trans-Nonachlor
PCB8
PCB18
DSL.2 30–35 2001 200503908 <1.0 <0.5 <1.0 1.3 2.8
DSL.2 114–116 1984 200503908 <2.0 <1.0 <2.0 2.9 6.5
DSL.2 136–141 1977 200503908 <1.0 1.0 <1.0 1.1 4.4
DSL.C -- 200506805 E.6 E.6 <1.0 E.8 3.1
DSL.4 0–5 2004 200503908 <1.0 <.5 <1.0 1.6 2.5
DSL.4 30–35 1999 200503908 <1.0 <.5 <1.0 1.2 1.4
DSL.4 50–55 1995 200503908 <1.0 <.5 <1.0 1.5 1.2
DSL.4 80–85 1988 200503908 <1.0 <.5 <1.0 E.9 2.0
DSL.4 80–85 lab dup 1988 200503908 <1.0 <.5 <1.0 1.0 3.0
DSL.4 99–104 1984 200503908 <10 <5.0 <10 <10 E6.9
DSL.4 107–111 1982 200506805 <1.0 <.5 <1.0 9.4 11
DSL.4 130–132 1977 200504607 <1.0 E.7 E.9 6.8 7.0
DSL.4 136–141 1976 200504607 <1.0 <.5 <1.0 8.7 46
DSL.4 136–141 lab dup 1976 200504607 <1.0 <.8 <1.0 nr nr
DSL.5 51–58 1987 200504607 <1.0 <.5 <1.0 7.9 11
DSL.5 58–64 1985 200504607 <2.0 <1.0 <2.0 28 130
DSL.5 69–73 1982 200504607 4.2 3.4 <1.0 300 510
DSL.6 45–51 -- 200504607 <1.0 <.50 <1.0 14 67
Sediment-quality guidelines
Threshold effect concentration (TEC)
-- none -- -- -- -- --
Probable effect concentration (PEC)
-- none -- -- -- -- --
Quality assurance samples
Lab blank -- 200503908 <1 <.5 <1 nr nr
Lab spike, in percent recovered (acceptable range)
-- 200503908 nr nr nr nr nr
Lab blank -- 200504607 nr nr nr nr nr
Lab spike, in percent recovered (acceptable range)
-- 200504607 102 (43–87) 103 (48–84) 102 (46–90) nr nr
Lab blank -- 200506805 <1 <.5 <1 nr nr
Lab spike, in percent recovered (acceptable range)
-- 200506805 59 (43–87) 60 (48–84) 53 (46–90) nr nr

24 Sources of Polychlorinated Biphenyls to Devils Swamp Lake Near Baton Rouge, Louisiana
Appendix 1. Analytical results for selected chlorinated hydrocarbon compounds from samples collected October 5, 2004, from Devils Swamp Lake, Louisiana—Continued.
Sample ID and interval(centimeters), where applicable
Estimateddeposition
date
Laboratoryset number
PCB22
PCB26
PCB28
PCB31
PCB33
PCB44
DSL.2 30–35 2001 200503908 2.1 9.7 11 5.9 5.0 8.5
DSL.2 114–116 1984 200503908 4.4 42 39 12 9.4 15
DSL.2 136–141 1977 200503908 3.0 40 22 15 6.3 20
DSL.C -- 200506805 3.2 5.6 18 10 7.9 25
DSL.4 0–5 2004 200503908 1.8 11 8.5 6.4 2.7 7.5
DSL.4 30–35 1999 200503908 E.8 3.9 5.3 3.9 2.6 4.4
DSL.4 50–55 1995 200503908 1.3 2.4 5.7 3.7 3.3 4.0
DSL.4 80–85 1988 200503908 1.1 10 10 5.2 2.6 9.3
DSL.4 80–85 lab dup 1988 200503908 1.9 14 17 8.2 2.7 12
DSL.4 99–104 1984 200503908 <10 E55 E28 E16 E8.7 E22
DSL.4 107–111 1982 200506805 7.5 E63 40 30 15 35
DSL.4 130–132 1977 200504607 4.9 64 41 9.5 4.3 17
DSL.4 136–141 1976 200504607 8.7 96 77 57 7.0 39
DSL.4 136–141 lab dup 1976 200504607 nr nr nr nr nr nr
DSL.5 51–58 1987 200504607 5.7 6.6 15 14 9.1 15
DSL.5 58–64 1985 200504607 22 180 140 130 18 75
DSL.5 69–73 1982 200504607 350 E1,000 E900 E610 280 E690
DSL.6 45–51 -- 200504607 14 13 94 76 19 36
Sediment-quality guidelines
Threshold effect concentration (TEC)
-- none -- -- -- -- -- --
Probable effect concentration (PEC)
-- none -- -- -- -- -- --
Quality assurance samples
Lab blank -- 200503908 nr nr nr nr nr nr
Lab spike, in percent recovered (acceptable range)
-- 200503908 nr nr nr nr nr nr
Lab blank -- 200504607 nr nr nr nr nr nr
Lab spike, in percent recovered (acceptable range)
-- 200504607 nr nr nr nr nr nr
Lab blank -- 200506805 nr nr nr nr nr nr
Lab spike, in percent recovered (acceptable range)
-- 200506805 nr nr nr nr nr nr
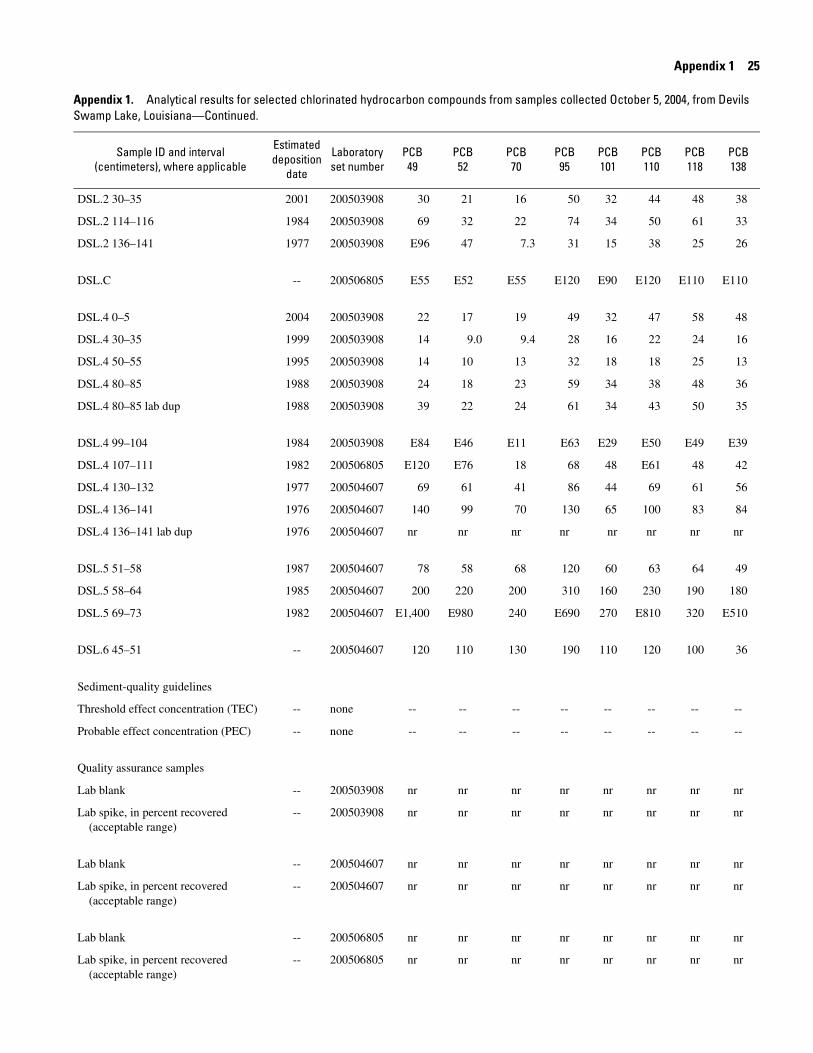
Appendix 1 25
Appendix 1. Analytical results for selected chlorinated hydrocarbon compounds from samples collected October 5, 2004, from Devils Swamp Lake, Louisiana—Continued.
Sample ID and interval(centimeters), where applicable
Estimateddeposition
date
Laboratoryset number
PCB49
PCB52
PCB70
PCB95
PCB101
PCB110
PCB118
PCB138
DSL.2 30–35 2001 200503908 30 21 16 50 32 44 48 38
DSL.2 114–116 1984 200503908 69 32 22 74 34 50 61 33
DSL.2 136–141 1977 200503908 E96 47 7.3 31 15 38 25 26
DSL.C -- 200506805 E55 E52 E55 E120 E90 E120 E110 E110
DSL.4 0–5 2004 200503908 22 17 19 49 32 47 58 48
DSL.4 30–35 1999 200503908 14 9.0 9.4 28 16 22 24 16
DSL.4 50–55 1995 200503908 14 10 13 32 18 18 25 13
DSL.4 80–85 1988 200503908 24 18 23 59 34 38 48 36
DSL.4 80–85 lab dup 1988 200503908 39 22 24 61 34 43 50 35
DSL.4 99–104 1984 200503908 E84 E46 E11 E63 E29 E50 E49 E39
DSL.4 107–111 1982 200506805 E120 E76 18 68 48 E61 48 42
DSL.4 130–132 1977 200504607 69 61 41 86 44 69 61 56
DSL.4 136–141 1976 200504607 140 99 70 130 65 100 83 84
DSL.4 136–141 lab dup 1976 200504607 nr nr nr nr nr nr nr nr
DSL.5 51–58 1987 200504607 78 58 68 120 60 63 64 49
DSL.5 58–64 1985 200504607 200 220 200 310 160 230 190 180
DSL.5 69–73 1982 200504607 E1,400 E980 240 E690 270 E810 320 E510
DSL.6 45–51 -- 200504607 120 110 130 190 110 120 100 36
Sediment-quality guidelines
Threshold effect concentration (TEC) -- none -- -- -- -- -- -- -- --
Probable effect concentration (PEC) -- none -- -- -- -- -- -- -- --
Quality assurance samples
Lab blank -- 200503908 nr nr nr nr nr nr nr nr
Lab spike, in percent recovered (acceptable range)
-- 200503908 nr nr nr nr nr nr nr nr
Lab blank -- 200504607 nr nr nr nr nr nr nr nr
Lab spike, in percent recovered (acceptable range)
-- 200504607 nr nr nr nr nr nr nr nr
Lab blank -- 200506805 nr nr nr nr nr nr nr nr
Lab spike, in percent recovered (acceptable range)
-- 200506805 nr nr nr nr nr nr nr nr

26 Sources of Polychlorinated Biphenyls to Devils Swamp Lake Near Baton Rouge, Louisiana
Appendix 1. Analytical results for selected chlorinated hydrocarbon compounds from samples collected October 5, 2004, from Devils Swamp Lake, Louisiana—Continued.
Sample ID and interval(centimeters), where applicable
Estimateddeposition
date
Laboratoryset number
PCB146
PCB149
PCB151
PCB170
PCB174
PCB177
PCB180
PCB183
DSL.2 30–35 2001 200503908 7.8 31 7.1 11 8.8 5.8 19 4.9
DSL.2 114–116 1984 200503908 6.5 24 5.7 6.2 5.3 3.9 11 3.2
DSL.2 136–141 1977 200503908 5.8 19 3.6 5.2 3.4 3.2 8.6 2.2
DSL.C -- 200506805 19 E54 17 18 12 9.2 27 8.0
DSL.4 0–5 2004 200503908 6.8 24 6.0 9.5 6.8 4.5 15 4.1
DSL.4 30–35 1999 200503908 3.2 12 2.1 3.8 2.6 2.0 6.4 1.7
DSL.4 50–55 1995 200503908 3.8 13 2.9 4.3 2.7 2.4 7.6 2.0
DSL.4 80–85 1988 200503908 6.6 24 5.5 7.8 6.3 4.3 13 4.0
DSL.4 80–85 lab dup 1988 200503908 7.1 23 5.5 2.4 6.4 4.3 12 4.0
DSL.4 99–104 1984 200503908 E8.8 E25 <10 E8.5 E5.0 <10 E13 <10
DSL.4 107–111 1982 200506805 10 40 14 12 10 6.9 19 6.2
DSL.4 130–132 1977 200504607 8.6 41 7.8 7.5 7.0 5.8 9.8 3.5
DSL.4 136–141 1976 200504607 11 70 11 10 9.5 7.6 38 2.9
DSL.4 136–141 lab dup 1976 200504607 nr nr nr nr nr nr nr nr
DSL.5 51–58 1987 200504607 8.8 53 8.7 8.4 7.6 6.1 12 5.6
DSL.5 58–64 1985 200504607 41 160 23 24 23 17 34 17
DSL.5 69–73 1982 200504607 160 E530 200 140 130 120 200 77
DSL.6 45–51 -- 200504607 13 82 12 13 11 7.9 18 7.3
Sediment-quality guidelines
Threshold effect concentration (TEC) -- none -- -- -- -- -- -- -- --
Probable effect concentration (PEC) -- none -- -- -- -- -- -- -- --
Quality assurance samples
Lab blank -- 200503908 nr nr nr nr nr nr nr nr
Lab spike, in percent recovered (acceptable range)
-- 200503908 nr nr nr nr nr nr nr nr
Lab blank -- 200504607 nr nr nr nr nr nr nr nr
Lab spike, in percent recovered (acceptable range)
-- 200504607 nr nr nr nr nr nr nr nr
Lab blank -- 200506805 nr nr nr nr nr nr nr nr
Lab spike, in percent recovered (acceptable range)
-- 200506805 nr nr nr nr nr nr nr nr

Appendix 1 27
Appendix 1. Analytical results for selected chlorinated hydrocarbon compounds from samples collected October 5, 2004, from Devils Swamp Lake, Louisiana—Continued.
Sample ID and interval(centimeters), where applicable
Estimateddeposition
date
Laboratoryset number
PCB187
PCB194
PCB206
Calculated values
TotalDDT ΣPCBC ΣPCBA
DSL.2 30–35 2001 200503908 11 4.1 E1.0 E1.8 E440 760
DSL.2 114–116 1984 200503908 6.4 2.1 E.8 E1.5 E580 910
DSL.2 136–141 1977 200503908 6.5 2.1 E.7 E3.0 E460 610
DSL.C -- 200506805 15 4.8 1.3 E15 E970 E1,300
DSL.4 0–5 2004 200503908 7.2 2.8 E.7 E2.0 E420 790
DSL.4 30–35 1999 200503908 3.4 1.3 <1.0 E1.8 E200 360
DSL.4 50–55 1995 200503908 4.2 1.5 <1.0 E1.1 E210 350
DSL.4 80–85 1988 200503908 7.1 2.4 E.6 E2.5 E400 670
DSL.4 80–85 lab dup 1988 200503908 7.2 2.3 E.7 E2.3 E440 680
DSL.4 99–104 1984 200503908 E8.5 <10 <10 <50 E580 E780
DSL.4 107–111 1982 200506805 13 4.3 1.3 E8.7 E830 1,000
DSL.4 130–132 1977 200504607 8.3 3.9 1.4 E4.3 750 1,200
DSL.4 136–141 1976 200504607 11 5.8 2.3 E4.2 1,300 1,900
DSL.4 136–141 lab dup 1976 200504607 nr nr nr E3.8 -- 2,000
DSL.5 51–58 1987 200504607 9.0 4.0 E1.0 E4.3 E770 1,100
DSL.5 58–64 1985 200504607 26 12 3.3 23 2,800 3,000
DSL.5 69–73 1982 200504607 190 84 28 56 E12,000 E20,000
DSL.6 45–51 -- 200504607 12 5.0 E.5 E7.9 E1,400 2,100
Sediment-quality guidelines
Threshold effect concentration (TEC) -- none -- -- -- 5.28 59.8 59.8
Probable effect concentration (PEC) -- none -- -- -- 572 676 676
Quality assurance samples
Lab blank -- 200503908 nr nr nr -- -- --
Lab spike, in percent recovered (acceptable range)
-- 200503908 nr nr nr -- -- --
Lab blank -- 200504607 nr nr nr -- -- --
Lab spike, in percent recovered (acceptable range)
-- 200504607 nr nr nr -- -- --
Lab blank -- 200506805 nr nr nr -- -- --
Lab spike, in percent recovered (acceptable range)
-- 200506805 nr nr nr -- -- --
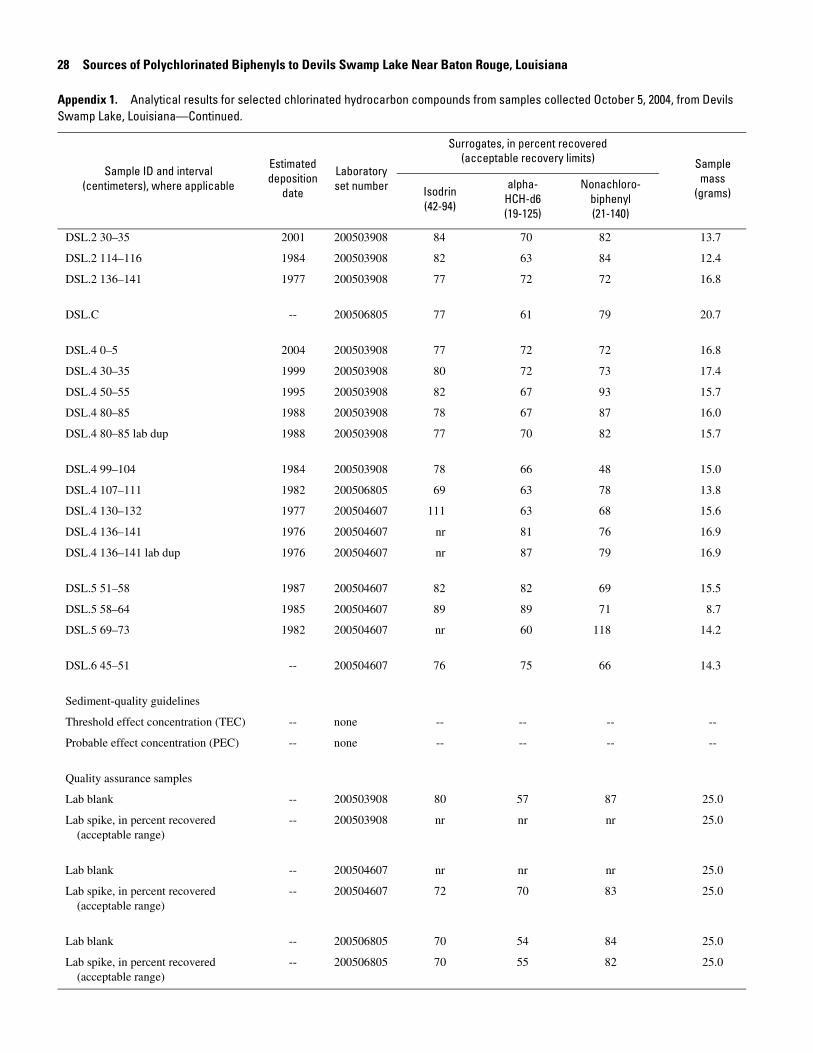
28 Sources of Polychlorinated Biphenyls to Devils Swamp Lake Near Baton Rouge, Louisiana
Appendix 1. Analytical results for selected chlorinated hydrocarbon compounds from samples collected October 5, 2004, from Devils Swamp Lake, Louisiana—Continued.
Sample ID and interval(centimeters), where applicable
Estimateddeposition
date
Laboratoryset number
Surrogates, in percent recovered(acceptable recovery limits) Sample
mass(grams)Isodrin
(42-94)
alpha-HCH-d6(19-125)
Nonachloro-biphenyl(21-140)
DSL.2 30–35 2001 200503908 84 70 82 13.7
DSL.2 114–116 1984 200503908 82 63 84 12.4
DSL.2 136–141 1977 200503908 77 72 72 16.8
DSL.C -- 200506805 77 61 79 20.7
DSL.4 0–5 2004 200503908 77 72 72 16.8
DSL.4 30–35 1999 200503908 80 72 73 17.4
DSL.4 50–55 1995 200503908 82 67 93 15.7
DSL.4 80–85 1988 200503908 78 67 87 16.0
DSL.4 80–85 lab dup 1988 200503908 77 70 82 15.7
DSL.4 99–104 1984 200503908 78 66 48 15.0
DSL.4 107–111 1982 200506805 69 63 78 13.8
DSL.4 130–132 1977 200504607 111 63 68 15.6
DSL.4 136–141 1976 200504607 nr 81 76 16.9
DSL.4 136–141 lab dup 1976 200504607 nr 87 79 16.9
DSL.5 51–58 1987 200504607 82 82 69 15.5
DSL.5 58–64 1985 200504607 89 89 71 8.7
DSL.5 69–73 1982 200504607 nr 60 118 14.2
DSL.6 45–51 -- 200504607 76 75 66 14.3
Sediment-quality guidelines
Threshold effect concentration (TEC) -- none -- -- -- --
Probable effect concentration (PEC) -- none -- -- -- --
Quality assurance samples
Lab blank -- 200503908 80 57 87 25.0
Lab spike, in percent recovered (acceptable range)
-- 200503908 nr nr nr 25.0
Lab blank -- 200504607 nr nr nr 25.0
Lab spike, in percent recovered (acceptable range)
-- 200504607 72 70 83 25.0
Lab blank -- 200506805 70 54 84 25.0
Lab spike, in percent recovered (acceptable range)
-- 200506805 70 55 82 25.0

Appendix 2—Analytical Results for Polycyclic Aromatic Hydrocarbons

Blank Page
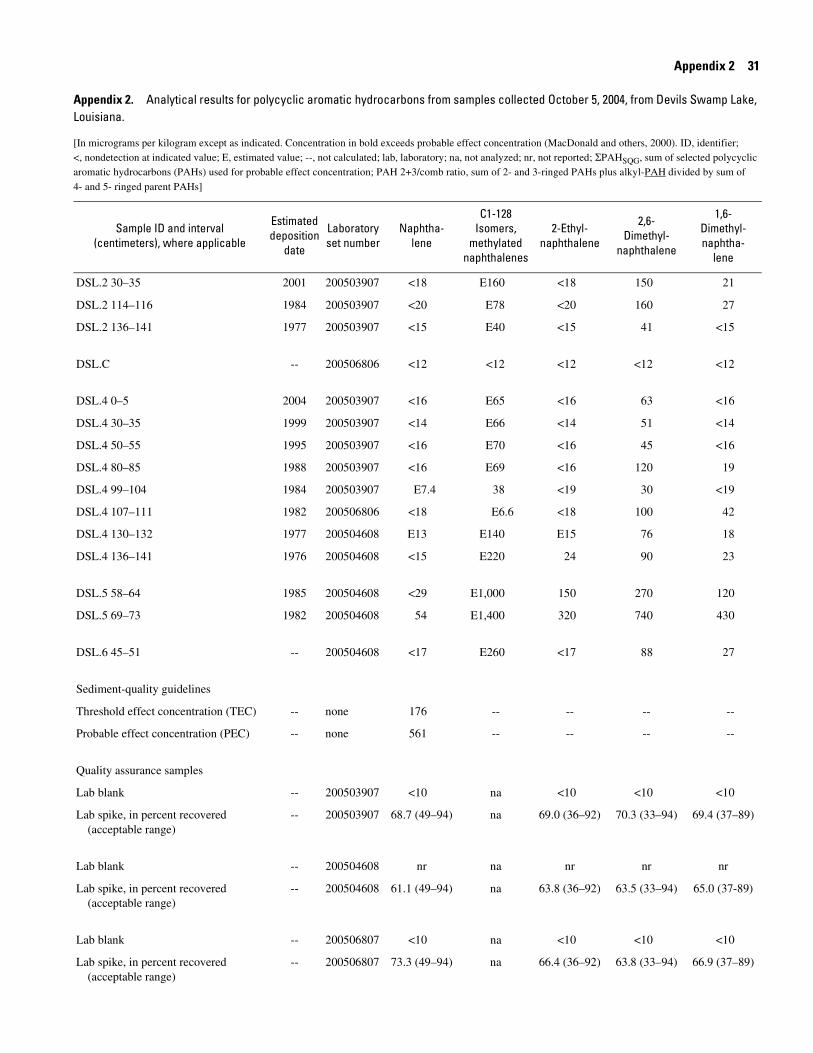
Appendix 2 31
Appendix 2
Appendix 2. Analytical results for polycyclic aromatic hydrocarbons from samples collected October 5, 2004, from Devils Swamp Lake, Louisiana.
[In micrograms per kilogram except as indicated. Concentration in bold exceeds probable effect concentration (MacDonald and others, 2000). ID, identifier; <, nondetection at indicated value; E, estimated value; --, not calculated; lab, laboratory; na, not analyzed; nr, not reported; ΣPAHSQG, sum of selected polycyclic aromatic hydrocarbons (PAHs) used for probable effect concentration; PAH 2+3/comb ratio, sum of 2- and 3-ringed PAHs plus alkyl-PAH divided by sum of 4- and 5- ringed parent PAHs]
Sample ID and interval(centimeters), where applicable
Estimateddeposition
date
Laboratoryset number
Naphtha-lene
C1-128Isomers,
methylatednaphthalenes
2-Ethyl-naphthalene
2,6-Dimethyl-
naphthalene
1,6-Dimethyl-naphtha-
lene
DSL.2 30–35 2001 200503907 <18 E160 <18 150 21
DSL.2 114–116 1984 200503907 <20 E78 <20 160 27
DSL.2 136–141 1977 200503907 <15 E40 <15 41 <15
DSL.C -- 200506806 <12 <12 <12 <12 <12
DSL.4 0–5 2004 200503907 <16 E65 <16 63 <16
DSL.4 30–35 1999 200503907 <14 E66 <14 51 <14
DSL.4 50–55 1995 200503907 <16 E70 <16 45 <16
DSL.4 80–85 1988 200503907 <16 E69 <16 120 19
DSL.4 99–104 1984 200503907 E7.4 38 <19 30 <19
DSL.4 107–111 1982 200506806 <18 E6.6 <18 100 42
DSL.4 130–132 1977 200504608 E13 E140 E15 76 18
DSL.4 136–141 1976 200504608 <15 E220 24 90 23
DSL.5 58–64 1985 200504608 <29 E1,000 150 270 120
DSL.5 69–73 1982 200504608 54 E1,400 320 740 430
DSL.6 45–51 -- 200504608 <17 E260 <17 88 27
Sediment-quality guidelines
Threshold effect concentration (TEC) -- none 176 -- -- -- --
Probable effect concentration (PEC) -- none 561 -- -- -- --
Quality assurance samples
Lab blank -- 200503907 <10 na <10 <10 <10
Lab spike, in percent recovered (acceptable range)
-- 200503907 68.7 (49–94) na 69.0 (36–92) 70.3 (33–94) 69.4 (37–89)
Lab blank -- 200504608 nr na nr nr nr
Lab spike, in percent recovered (acceptable range)
-- 200504608 61.1 (49–94) na 63.8 (36–92) 63.5 (33–94) 65.0 (37-89)
Lab blank -- 200506807 <10 na <10 <10 <10
Lab spike, in percent recovered (acceptable range)
-- 200506807 73.3 (49–94) na 66.4 (36–92) 63.8 (33–94) 66.9 (37–89)

32 Sources of Polychlorinated Biphenyls to Devils Swamp Lake Near Baton Rouge, Louisiana
Appendix 2. Analytical results for polycyclic aromatic hydrocarbons from samples collected October 5, 2004, from Devils Swamp Lake, Louisiana—Continued.
Sample ID and interval(centimeters), where applicable
Estimateddeposition
date
Laboratoryset number
C2-128Isomers,
C2-alkyatednaphthalenes
Acenaph-thylene
1,2-Dimethyl-naphtha-
lene
Acenaph-thene
C3-128Isomers,
C3-alkylatednaphthalenes
DSL.2 30–35 2001 200503907 E220 69 <18 <18 <55
DSL.2 114–116 1984 200503907 E230 37 <20 <20 E86
DSL.2 136–141 1977 200503907 E80 43 <15 E14 E55
DSL.C -- 200506806 <12 40 <12 <12 <12
DSL.4 0–5 2004 200503907 E100 40 <16 <16 E45
DSL.4 30–35 1999 200503907 E85 27 <14 <14 <40
DSL.4 50–55 1995 200503907 E90 28 <16 E14 E50
DSL.4 80–85 1988 200503907 E170 34 <16 <16 <50
DSL.4 99–104 1984 200503907 78 42 <19 E13 88
DSL.4 107–111 1982 200506806 E19 110 <18 32 E12
DSL.4 130–132 1977 200504608 E180 180 <16 18 E200
DSL.4 136–141 1976 200504608 E220 260 <15 24 E190
DSL.5 58–64 1985 200504608 E1,500 1,600 56 220 E2,200
DSL.5 69–73 1982 200504608 E4,000 1,400 140 410 E6,900
DSL.6 45–51 -- 200504608 E270 290 <17 31 <270
Sediment-quality guidelines
Threshold effect concentration (TEC) -- none -- -- -- -- --
Probable effect concentration (PEC) -- none -- -- -- -- --
Quality assurance samples
Lab blank -- 200503907 na <10 <10 <10 na
Lab spike, in percent recovered (acceptable range)
-- 200503907 na 69.8 (33–84) 69.3 (44–89) 71.1 (49–81) na
Lab blank -- 200504608 na nr nr nr na
Lab spike, in percent recovered (acceptable range)
-- 200504608 na 67.2 (33–84) 65.3 (44–89) 70.9 (49–81) na
Lab blank -- 200506807 na <10 <10 <10 na
Lab spike, in percent recovered (acceptable range)
-- 200506807 na 71.3 (33–84) 73.1 (44–89) 72.9 (49–81) na
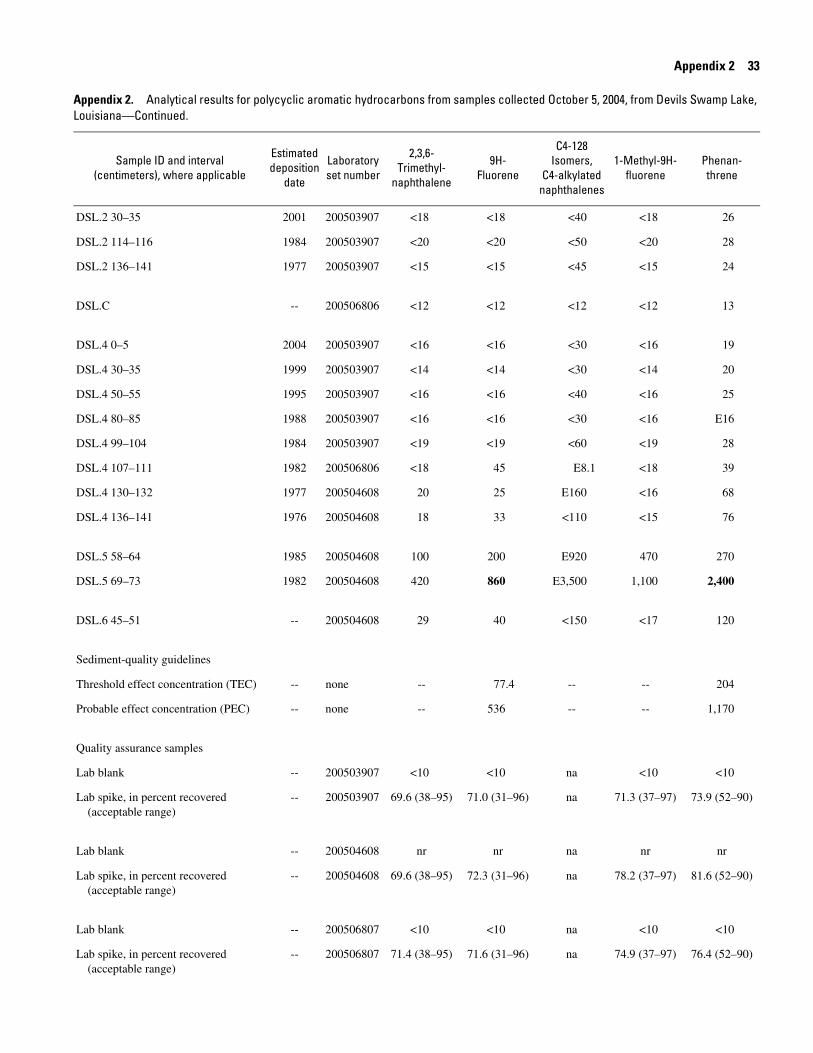
Appendix 2 33
Appendix 2. Analytical results for polycyclic aromatic hydrocarbons from samples collected October 5, 2004, from Devils Swamp Lake, Louisiana—Continued.
Sample ID and interval(centimeters), where applicable
Estimateddeposition
date
Laboratoryset number
2,3,6-Trimethyl-
naphthalene
9H-Fluorene
C4-128Isomers,
C4-alkylatednaphthalenes
1-Methyl-9H-fluorene
Phenan-threne
DSL.2 30–35 2001 200503907 <18 <18 <40 <18 26
DSL.2 114–116 1984 200503907 <20 <20 <50 <20 28
DSL.2 136–141 1977 200503907 <15 <15 <45 <15 24
DSL.C -- 200506806 <12 <12 <12 <12 13
DSL.4 0–5 2004 200503907 <16 <16 <30 <16 19
DSL.4 30–35 1999 200503907 <14 <14 <30 <14 20
DSL.4 50–55 1995 200503907 <16 <16 <40 <16 25
DSL.4 80–85 1988 200503907 <16 <16 <30 <16 E16
DSL.4 99–104 1984 200503907 <19 <19 <60 <19 28
DSL.4 107–111 1982 200506806 <18 45 E8.1 <18 39
DSL.4 130–132 1977 200504608 20 25 E160 <16 68
DSL.4 136–141 1976 200504608 18 33 <110 <15 76
DSL.5 58–64 1985 200504608 100 200 E920 470 270
DSL.5 69–73 1982 200504608 420 860 E3,500 1,100 2,400
DSL.6 45–51 -- 200504608 29 40 <150 <17 120
Sediment-quality guidelines
Threshold effect concentration (TEC) -- none -- 77.4 -- -- 204
Probable effect concentration (PEC) -- none -- 536 -- -- 1,170
Quality assurance samples
Lab blank -- 200503907 <10 <10 na <10 <10
Lab spike, in percent recovered (acceptable range)
-- 200503907 69.6 (38–95) 71.0 (31–96) na 71.3 (37–97) 73.9 (52–90)
Lab blank -- 200504608 nr nr na nr nr
Lab spike, in percent recovered (acceptable range)
-- 200504608 69.6 (38–95) 72.3 (31–96) na 78.2 (37–97) 81.6 (52–90)
Lab blank -- 200506807 <10 <10 na <10 <10
Lab spike, in percent recovered (acceptable range)
-- 200506807 71.4 (38–95) 71.6 (31–96) na 74.9 (37–97) 76.4 (52–90)
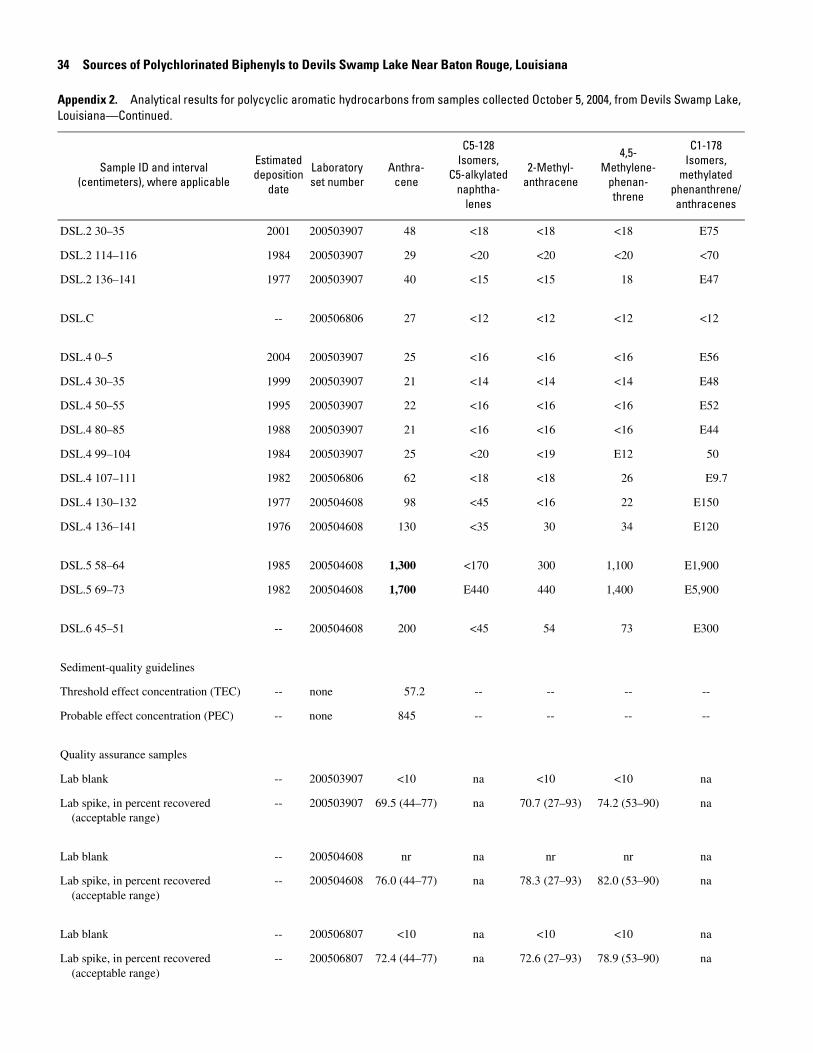
34 Sources of Polychlorinated Biphenyls to Devils Swamp Lake Near Baton Rouge, Louisiana
Appendix 2. Analytical results for polycyclic aromatic hydrocarbons from samples collected October 5, 2004, from Devils Swamp Lake, Louisiana—Continued.
Sample ID and interval(centimeters), where applicable
Estimateddeposition
date
Laboratoryset number
Anthra-cene
C5-128Isomers,
C5-alkylatednaphtha-
lenes
2-Methyl-anthracene
4,5-Methylene-
phenan-threne
C1-178Isomers,
methylatedphenanthrene/anthracenes
DSL.2 30–35 2001 200503907 48 <18 <18 <18 E75
DSL.2 114–116 1984 200503907 29 <20 <20 <20 <70
DSL.2 136–141 1977 200503907 40 <15 <15 18 E47
DSL.C -- 200506806 27 <12 <12 <12 <12
DSL.4 0–5 2004 200503907 25 <16 <16 <16 E56
DSL.4 30–35 1999 200503907 21 <14 <14 <14 E48
DSL.4 50–55 1995 200503907 22 <16 <16 <16 E52
DSL.4 80–85 1988 200503907 21 <16 <16 <16 E44
DSL.4 99–104 1984 200503907 25 <20 <19 E12 50
DSL.4 107–111 1982 200506806 62 <18 <18 26 E9.7
DSL.4 130–132 1977 200504608 98 <45 <16 22 E150
DSL.4 136–141 1976 200504608 130 <35 30 34 E120
DSL.5 58–64 1985 200504608 1,300 <170 300 1,100 E1,900
DSL.5 69–73 1982 200504608 1,700 E440 440 1,400 E5,900
DSL.6 45–51 -- 200504608 200 <45 54 73 E300
Sediment-quality guidelines
Threshold effect concentration (TEC) -- none 57.2 -- -- -- --
Probable effect concentration (PEC) -- none 845 -- -- -- --
Quality assurance samples
Lab blank -- 200503907 <10 na <10 <10 na
Lab spike, in percent recovered (acceptable range)
-- 200503907 69.5 (44–77) na 70.7 (27–93) 74.2 (53–90) na
Lab blank -- 200504608 nr na nr nr na
Lab spike, in percent recovered (acceptable range)
-- 200504608 76.0 (44–77) na 78.3 (27–93) 82.0 (53–90) na
Lab blank -- 200506807 <10 na <10 <10 na
Lab spike, in percent recovered (acceptable range)
-- 200506807 72.4 (44–77) na 72.6 (27–93) 78.9 (53–90) na

Appendix 2 35
Appendix 2. Analytical results for polycyclic aromatic hydrocarbons from samples collected October 5, 2004, from Devils Swamp Lake, Louisiana—Continued.
Sample ID and interval(centimeters), where applicable
Estimateddeposition
date
Laboratoryset number
1-Methyl-phenanthrene
C2-178 Isomers,C2-alkylated
phenanthrene/anthracenes
Fluoranthene Pyrene
C3-178Isomers,
C3-alkylatedphenanthrene/anthracenes
DSL.2 30–35 2001 200503907 <18 E61 37 55 E63
DSL.2 114–116 1984 200503907 <20 <70 30 40 <40
DSL.2 136–141 1977 200503907 <15 E52 72 69 E47
DSL.C -- 200506806 <12 <12 16 17 <12
DSL.4 0–5 2004 200503907 <16 E47 29 41 E46
DSL.4 30–35 1999 200503907 <14 E50 25 35 E40
DSL.4 50–55 1995 200503907 <16 E56 27 38 <45
DSL.4 80–85 1988 200503907 <16 E41 21 28 <40
DSL.4 99–104 1984 200503907 <19 69 34 38 24
DSL.4 107–111 1982 200506806 26 E9.8 50 69 E9.4
DSL.4 130–132 1977 200504608 <16 E200 82 110 E150
DSL.4 136–141 1976 200504608 <15 E110 69 130 E100
DSL.5 58–64 1985 200504608 880 E1,000 1,900 2,800 E680
DSL.5 69–73 1982 200504608 1,200 E6,600 1,800 2,600 E5,500
DSL.6 45–51 -- 200504608 56 E390 170 340 E460
Sediment-quality guidelines
Threshold effect concentration (TEC) -- none -- -- 423 195 --
Probable effect concentration (PEC) -- none -- -- 2,230 1,520 --
Quality assurance samples
Lab blank -- 200503907 <10 na <10 <10 na
Lab spike, in percent recovered (acceptable range)
-- 200503907 75.1 (57–87) na 75.0 (65–92) 73.4 (64–94) na
Lab blank -- 200504608 nr na nr nr na
Lab spike, in percent recovered (acceptable range)
-- 200504608 85.8 (57–87) na 84.4 (65–92) 84.8 (64–94) na
Lab blank -- 200506807 <10 na <10 <10 na
Lab spike, in percent recovered (acceptable range)
-- 200506807 77.5 (57–87) na 78.9 (65–92) 78.8 (64–94) na
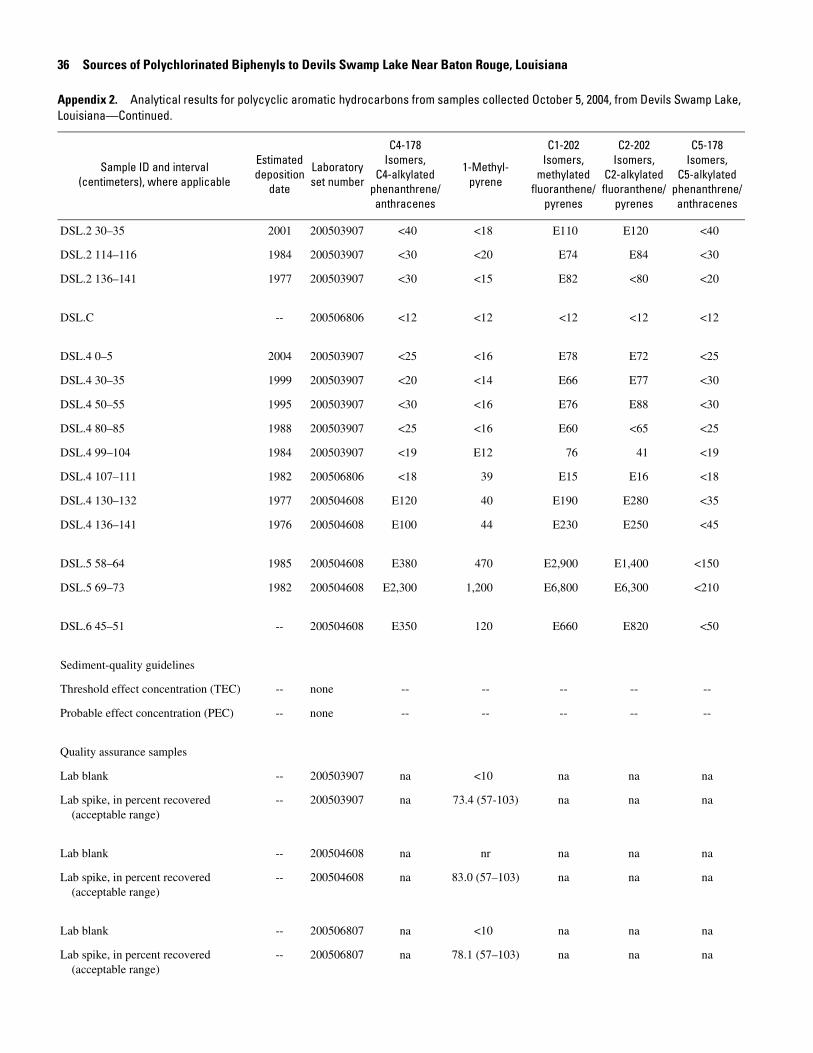
36 Sources of Polychlorinated Biphenyls to Devils Swamp Lake Near Baton Rouge, Louisiana
Appendix 2. Analytical results for polycyclic aromatic hydrocarbons from samples collected October 5, 2004, from Devils Swamp Lake, Louisiana—Continued.
Sample ID and interval(centimeters), where applicable
Estimateddeposition
date
Laboratoryset number
C4-178Isomers,
C4-alkylatedphenanthrene/anthracenes
1-Methyl-pyrene
C1-202Isomers,
methylatedfluoranthene/
pyrenes
C2-202Isomers,
C2-alkylatedfluoranthene/
pyrenes
C5-178Isomers,
C5-alkylatedphenanthrene/anthracenes
DSL.2 30–35 2001 200503907 <40 <18 E110 E120 <40
DSL.2 114–116 1984 200503907 <30 <20 E74 E84 <30
DSL.2 136–141 1977 200503907 <30 <15 E82 <80 <20
DSL.C -- 200506806 <12 <12 <12 <12 <12
DSL.4 0–5 2004 200503907 <25 <16 E78 E72 <25
DSL.4 30–35 1999 200503907 <20 <14 E66 E77 <30
DSL.4 50–55 1995 200503907 <30 <16 E76 E88 <30
DSL.4 80–85 1988 200503907 <25 <16 E60 <65 <25
DSL.4 99–104 1984 200503907 <19 E12 76 41 <19
DSL.4 107–111 1982 200506806 <18 39 E15 E16 <18
DSL.4 130–132 1977 200504608 E120 40 E190 E280 <35
DSL.4 136–141 1976 200504608 E100 44 E230 E250 <45
DSL.5 58–64 1985 200504608 E380 470 E2,900 E1,400 <150
DSL.5 69–73 1982 200504608 E2,300 1,200 E6,800 E6,300 <210
DSL.6 45–51 -- 200504608 E350 120 E660 E820 <50
Sediment-quality guidelines
Threshold effect concentration (TEC) -- none -- -- -- -- --
Probable effect concentration (PEC) -- none -- -- -- -- --
Quality assurance samples
Lab blank -- 200503907 na <10 na na na
Lab spike, in percent recovered (acceptable range)
-- 200503907 na 73.4 (57-103) na na na
Lab blank -- 200504608 na nr na na na
Lab spike, in percent recovered (acceptable range)
-- 200504608 na 83.0 (57–103) na na na
Lab blank -- 200506807 na <10 na na na
Lab spike, in percent recovered (acceptable range)
-- 200506807 na 78.1 (57–103) na na na
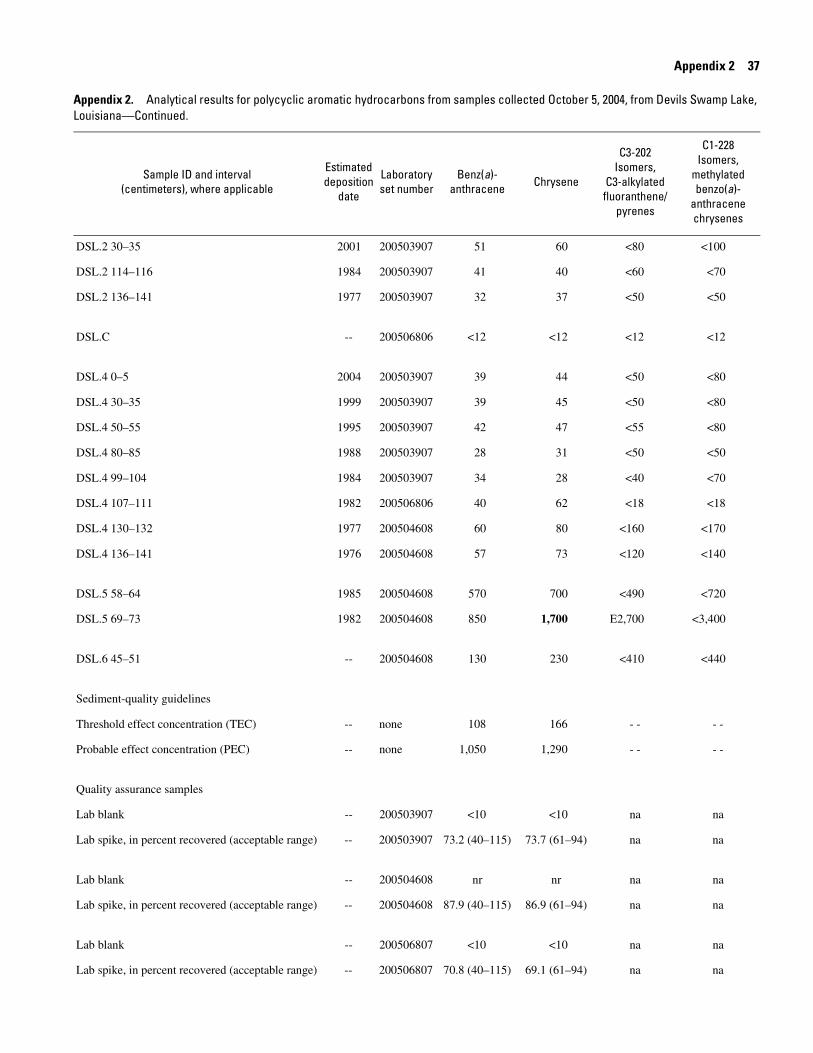
Appendix 2 37
Appendix 2. Analytical results for polycyclic aromatic hydrocarbons from samples collected October 5, 2004, from Devils Swamp Lake, Louisiana—Continued.
Sample ID and interval(centimeters), where applicable
Estimateddeposition
date
Laboratoryset number
Benz(a)-anthracene Chrysene
C3-202Isomers,
C3-alkylatedfluoranthene/
pyrenes
C1-228Isomers,
methylated benzo(a)-
anthracenechrysenes
DSL.2 30–35 2001 200503907 51 60 <80 <100
DSL.2 114–116 1984 200503907 41 40 <60 <70
DSL.2 136–141 1977 200503907 32 37 <50 <50
DSL.C -- 200506806 <12 <12 <12 <12
DSL.4 0–5 2004 200503907 39 44 <50 <80
DSL.4 30–35 1999 200503907 39 45 <50 <80
DSL.4 50–55 1995 200503907 42 47 <55 <80
DSL.4 80–85 1988 200503907 28 31 <50 <50
DSL.4 99–104 1984 200503907 34 28 <40 <70
DSL.4 107–111 1982 200506806 40 62 <18 <18
DSL.4 130–132 1977 200504608 60 80 <160 <170
DSL.4 136–141 1976 200504608 57 73 <120 <140
DSL.5 58–64 1985 200504608 570 700 <490 <720
DSL.5 69–73 1982 200504608 850 1,700 E2,700 <3,400
DSL.6 45–51 -- 200504608 130 230 <410 <440
Sediment-quality guidelines
Threshold effect concentration (TEC) -- none 108 166 - - - -
Probable effect concentration (PEC) -- none 1,050 1,290 - - - -
Quality assurance samples
Lab blank -- 200503907 <10 <10 na na
Lab spike, in percent recovered (acceptable range) -- 200503907 73.2 (40–115) 73.7 (61–94) na na
Lab blank -- 200504608 nr nr na na
Lab spike, in percent recovered (acceptable range) -- 200504608 87.9 (40–115) 86.9 (61–94) na na
Lab blank -- 200506807 <10 <10 na na
Lab spike, in percent recovered (acceptable range) -- 200506807 70.8 (40–115) 69.1 (61–94) na na

38 Sources of Polychlorinated Biphenyls to Devils Swamp Lake Near Baton Rouge, Louisiana
Appendix 2. Analytical results for polycyclic aromatic hydrocarbons from samples collected October 5, 2004, from Devils Swamp Lake, Louisiana—Continued.
Sample ID and interval(centimeters), where applicable
Estimateddeposition
date
Laboratoryset number
C4-202Isomers,
C4-alkylatedfluoranthene/
pyrenes
C5-202Isomers,
C5-alkylatedfluoranthene/
pyrenes
C2-228Isomers,
C2-alkylatedbenzo(a)-
anthracene/chrysenes
Benzo(b)-fluoranthene
Benzo(k)-fluoranthene
DSL.2 30–35 2001 200503907 <60 <50 <90 40 47
DSL.2 114–116 1984 200503907 <50 <50 <60 <20 <20
DSL.2 136–141 1977 200503907 <40 <30 <40 25 34
DSL.C -- 200506806 <12 <12 <12 <12 <12
DSL.4 0–5 2004 200503907 <45 <40 <60 31 35
DSL.4 30–35 1999 200503907 <40 <40 <60 <14 <14
DSL.4 50–55 1995 200503907 <50 <50 <60 32 37
DSL.4 80–85 1988 200503907 <40 <30 <50 <16 <16
DSL.4 99–104 1984 200503907 <30 <25 <55 E31 E8.7
DSL.4 107–111 1982 200506806 <18 <18 <18 <18 <18
DSL.4 130–132 1977 200504608 <70 <50 <160 62 33
DSL.4 136–141 1976 200504608 <60 <55 <130 45 52
DSL.5 58–64 1985 200504608 <190 <120 <460 260 270
DSL.5 69–73 1982 200504608 E1,100 <540 <4,000 370 350
DSL.6 45–51 -- 200504608 <190 <80 <440 81 73
Sediment-quality guidelines
Threshold effect concentration (TEC) -- none -- -- -- -- --
Probable effect concentration (PEC) -- none -- -- -- -- --
Quality assurance samples
Lab blank -- 200503907 na na na <10 <10
Lab spike, in percent recovered (acceptable range)
-- 200503907 na na na 74.6 (49–104) 70.1 (40–101)
Lab blank -- 200504608 na na na nr nr
Lab spike, in percent recovered (acceptable range)
-- 200504608 na na na 88.9 (49–104) 82.0 (40–101)
Lab blank -- 200506807 na na na <10 <10
Lab spike, in percent recovered (acceptable range)
-- 200506807 na na na 64.7 (49–104) 62.3 (40–101)

Appendix 2 39
Appendix 2. Analytical results for polycyclic aromatic hydrocarbons from samples collected October 5, 2004, from Devils Swamp Lake, Louisiana—Continued.
Sample ID and interval(centimeters), where applicable
Estimateddeposition
date
Laboratoryset number
Benzo(e)-pyrene
Benzo(a)-pyrene Perylene
C1-252 Isomers,C1-methylatedbenzopyrene/
perylenes
C3-228Isomers,
C3-benzo(a)-anthracene/chrysenes
DSL.2 30–35 2001 200503907 62 67 210 E170 <80
DSL.2 114–116 1984 200503907 50 59 120 E120 <70
DSL.2 136–141 1977 200503907 34 37 44 <85 <50
DSL.C -- 200506806 <12 <12 <12 <12 <12
DSL.4 0–5 2004 200503907 48 55 99 <130 <50
DSL.4 30–35 1999 200503907 50 54 260 E140 <55
DSL.4 50–55 1995 200503907 51 56 330 E160 <60
DSL.4 80–85 1988 200503907 37 44 200 <100 <45
DSL.4 99–104 1984 200503907 36 35 100 84 <45
DSL.4 107–111 1982 200506806 51 58 150 <18 <18
DSL.4 130–132 1977 200504608 60 71 66 E170 <120
DSL.4 136–141 1976 200504608 73 84 100 E180 <120
DSL.5 58–64 1985 200504608 350 490 240 E700 <370
DSL.5 69–73 1982 200504608 570 670 250 E1,700 <2,700
DSL.6 45–51 -- 200504608 110 130 330 E310 <380
Sediment-quality guidelines
Threshold effect concentration (TEC) -- none -- 150 -- -- --
Probable effect concentration (PEC) -- none -- 1,450 -- -- --
Quality assurance samples
Lab blank -- 200503907 <10 <10 <10 na na
Lab spike, in percent recovered (acceptable range)
-- 200503907 72.7 (35–81) 68.0 (26–101) 68.2 (53–94) na na
Lab blank -- 200504608 nr nr nr na na
Lab spike, in percent recovered (acceptable range)
-- 200504608 83.3 (35–81) 80.2 (26–101) 80.7 (53–94) na na
Lab blank -- 200506807 <10 <10 <10 na na
Lab spike, in percent recovered (acceptable range)
-- 200506807 63.1 (35–81) 58.4 (26–101) 60.0 (53–94) na na
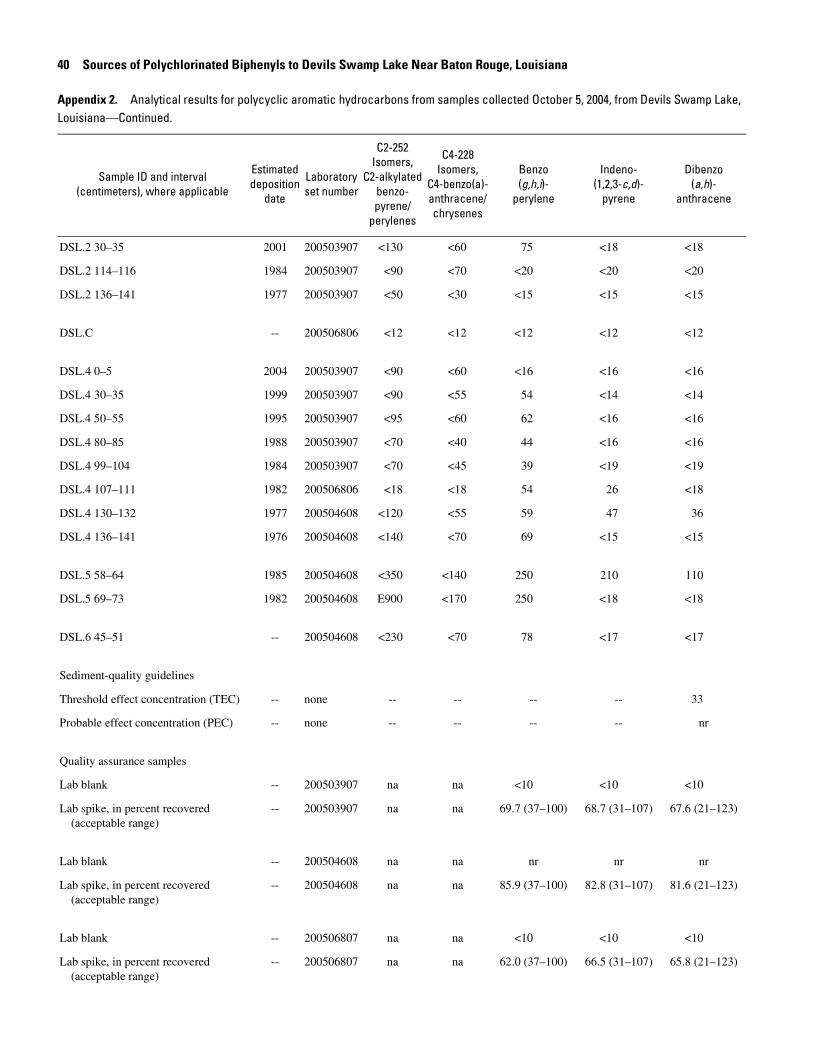
40 Sources of Polychlorinated Biphenyls to Devils Swamp Lake Near Baton Rouge, Louisiana
Appendix 2. Analytical results for polycyclic aromatic hydrocarbons from samples collected October 5, 2004, from Devils Swamp Lake, Louisiana—Continued.
Sample ID and interval(centimeters), where applicable
Estimateddeposition
date
Laboratoryset number
C2-252Isomers,
C2-alkylatedbenzo-pyrene/
perylenes
C4-228Isomers,
C4-benzo(a)-anthracene/chrysenes
Benzo(g,h,i)-
perylene
Indeno-(1,2,3-c,d)-
pyrene
Dibenzo(a,h)-
anthracene
DSL.2 30–35 2001 200503907 <130 <60 75 <18 <18
DSL.2 114–116 1984 200503907 <90 <70 <20 <20 <20
DSL.2 136–141 1977 200503907 <50 <30 <15 <15 <15
DSL.C -- 200506806 <12 <12 <12 <12 <12
DSL.4 0–5 2004 200503907 <90 <60 <16 <16 <16
DSL.4 30–35 1999 200503907 <90 <55 54 <14 <14
DSL.4 50–55 1995 200503907 <95 <60 62 <16 <16
DSL.4 80–85 1988 200503907 <70 <40 44 <16 <16
DSL.4 99–104 1984 200503907 <70 <45 39 <19 <19
DSL.4 107–111 1982 200506806 <18 <18 54 26 <18
DSL.4 130–132 1977 200504608 <120 <55 59 47 36
DSL.4 136–141 1976 200504608 <140 <70 69 <15 <15
DSL.5 58–64 1985 200504608 <350 <140 250 210 110
DSL.5 69–73 1982 200504608 E900 <170 250 <18 <18
DSL.6 45–51 -- 200504608 <230 <70 78 <17 <17
Sediment-quality guidelines
Threshold effect concentration (TEC) -- none -- -- -- -- 33
Probable effect concentration (PEC) -- none -- -- -- -- nr
Quality assurance samples
Lab blank -- 200503907 na na <10 <10 <10
Lab spike, in percent recovered (acceptable range)
-- 200503907 na na 69.7 (37–100) 68.7 (31–107) 67.6 (21–123)
Lab blank -- 200504608 na na nr nr nr
Lab spike, in percent recovered (acceptable range)
-- 200504608 na na 85.9 (37–100) 82.8 (31–107) 81.6 (21–123)
Lab blank -- 200506807 na na <10 <10 <10
Lab spike, in percent recovered (acceptable range)
-- 200506807 na na 62.0 (37–100) 66.5 (31–107) 65.8 (21–123)
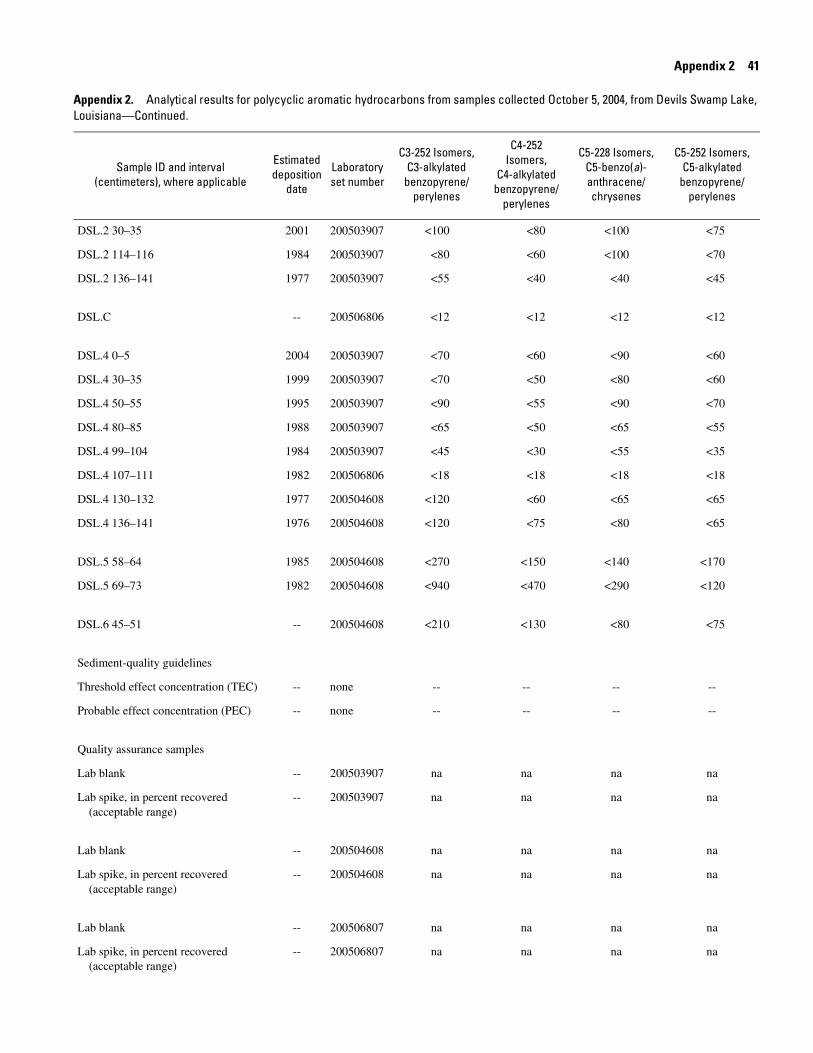
Appendix 2 41
Appendix 2. Analytical results for polycyclic aromatic hydrocarbons from samples collected October 5, 2004, from Devils Swamp Lake, Louisiana—Continued.
Sample ID and interval(centimeters), where applicable
Estimateddeposition
date
Laboratoryset number
C3-252 Isomers,C3-alkylated
benzopyrene/perylenes
C4-252Isomers,
C4-alkylatedbenzopyrene/
perylenes
C5-228 Isomers,C5-benzo(a)-anthracene/chrysenes
C5-252 Isomers,C5-alkylated
benzopyrene/perylenes
DSL.2 30–35 2001 200503907 <100 <80 <100 <75
DSL.2 114–116 1984 200503907 <80 <60 <100 <70
DSL.2 136–141 1977 200503907 <55 <40 <40 <45
DSL.C -- 200506806 <12 <12 <12 <12
DSL.4 0–5 2004 200503907 <70 <60 <90 <60
DSL.4 30–35 1999 200503907 <70 <50 <80 <60
DSL.4 50–55 1995 200503907 <90 <55 <90 <70
DSL.4 80–85 1988 200503907 <65 <50 <65 <55
DSL.4 99–104 1984 200503907 <45 <30 <55 <35
DSL.4 107–111 1982 200506806 <18 <18 <18 <18
DSL.4 130–132 1977 200504608 <120 <60 <65 <65
DSL.4 136–141 1976 200504608 <120 <75 <80 <65
DSL.5 58–64 1985 200504608 <270 <150 <140 <170
DSL.5 69–73 1982 200504608 <940 <470 <290 <120
DSL.6 45–51 -- 200504608 <210 <130 <80 <75
Sediment-quality guidelines
Threshold effect concentration (TEC) -- none -- -- -- --
Probable effect concentration (PEC) -- none -- -- -- --
Quality assurance samples
Lab blank -- 200503907 na na na na
Lab spike, in percent recovered (acceptable range)
-- 200503907 na na na na
Lab blank -- 200504608 na na na na
Lab spike, in percent recovered (acceptable range)
-- 200504608 na na na na
Lab blank -- 200506807 na na na na
Lab spike, in percent recovered (acceptable range)
-- 200506807 na na na na

42 Sources of Polychlorinated Biphenyls to Devils Swamp Lake Near Baton Rouge, Louisiana
Appendix 2. Analytical results for polycyclic aromatic hydrocarbons from samples collected October 5, 2004, from Devils Swamp Lake, Louisiana—Continued.
Sample ID and interval(centimeters), where applicable
Estimateddeposition
date
Laboratoryset number
Calculated values Surrogates, in percent recovered(acceptable recovery limits) Sample
mass(grams)ΣPAHSQG PAH 2+3/
comb ratio
2-Fluoro-biphenyl(46-88)
Nitrobenzene-d5 (46-88)
p-Terphenyl-d14
(46-88)
DSL.2 30–35 2001 200503907 570 1.2 55 44 71 13.7
DSL.2 114–116 1984 200503907 380 1.5 55 50 61 12.4
DSL.2 136–141 1977 200503907 410 .98 62 58 75 16.8
DSL.C -- 200506806 110 .83 65 83 63 20.7
DSL.4 0–5 2004 200503907 360 1.1 58 52 62 15.4
DSL.4 30–35 1999 200503907 330 .96 61 63 70 17.4
DSL.4 50–55 1995 200503907 370 .85 62 55 67 15.7
DSL.4 80–85 1988 200503907 290 1.5 57 53 61 16.0
DSL.4 99–104 1984 200503907 320 .16 66 78 69 15.0
DSL.4 107–111 1982 200506806 570 .28 64 84 56 13.8
DSL.4 130–132 1977 200504608 980 2.0 49 42 57 15.6
DSL.4 136–141 1976 200504608 1,100 1.6 57 59 69 16.9
DSL.5 58–64 1985 200504608 11,000 1.2 58 54 71 8.7
DSL.5 69–73 1982 200504608 16,000 4.0 69 76 102 14.2
DSL.6 45–51 -- 200504608 2,000 1.5 67 59 73 14.3
Sediment-quality guidelines
Threshold effect concentration (TEC) -- none 1,610 -- -- -- -- --
Probable effect concentration (PEC) -- none 22,800 -- -- -- -- --
Quality assurance samples
Lab blank -- 200503907 -- -- 59 55 65 25.0
Lab spike, in percent recovered (acceptable range)
-- 200503907 -- -- 67 60 69 25.0
Lab blank -- 200504608 -- -- nr nr nr nr
Lab spike, in percent recovered (acceptable range)
-- 200504608 -- -- 59 59 81 25.0
Lab blank -- 200506807 -- -- 47 56 94 25.0
Lab spike, in percent recovered (acceptable range)
-- 200506807 -- -- 68 56 74 25.0

Appendix 3—Analytical Results for Major and Trace Elements

Blank Page

Appendix 3 45
Appendix 3
Appendix 3. Analytical results for major and trace elements from samples collected October 5, 2004, from Devils Swamp Lake, Louisiana.
[In micrograms per gram except as indicated. Concentration in bold exceeds probable effect concentration (MacDonald and others, 2000). ID, identifier; --, not calculated; SRMs, standard reference materials; nr, not reported; <, nondetection at indicated value]
Footnote at end of table.
Sample ID and interval(centimeters), where applicable
Estimateddeposition
date
Totalcarbon
(percent)
Inorganiccarbon
(percent)
Organiccarbon
(percent)Aluminum Calcium Iron Potassium
DSL.2 30–35 2001 1.35 0.02 1.33 87,600 5,240 40,100 15,700
DSL.2 114–116 1984 .74 .03 .71 86,400 4,460 39,600 15,600
DSL.2 136–141 1977 .41 .04 .37 73,500 4,510 30,700 15,000
DSL.C -- .81 .03 .78 43,900 5,180 27,200 13,300
DSL.4 0–5 2004 1.38 .01 1.37 63,800 4,260 25,600 14,200
DSL.4 30–35 1999 1.13 .01 1.12 70,400 4,580 30,600 15,900
DSL.4 50–55 1995 .95 .02 .93 76,600 4,210 32,600 14,900
DSL.4 80–85 1988 .85 .03 .82 73,800 4,140 35,200 15,800
DSL.4 99–104 1984 .50 .08 .42 67,400 4,320 30,100 14,600
DSL.4 107–111 1982 .68 .02 .66 62,400 3,830 27,400 14,300
DSL.4 130–132 1977 .56 .02 .54 59,400 3,790 23,500 14,600
DSL.4 136–141 1976 .80 .04 .76 66,200 4,150 29,800 14,800
DSL.5 51–58 1987 1.53 .02 1.51 78,600 4,160 37,100 15,800
DSL.5 58–64 1985 2.39 .02 2.37 87,600 4,530 47,700 16,000
DSL.5 69–73 1982 2.39 .01 2.38 87,100 4,010 41,600 13,900
DSL.6 45–51 -- 2.25 .01 2.24 78,400 5,160 36,400 17,200
Sediment-quality guidelines
Threshold effect concentration (TEC) -- -- -- -- -- -- -- --
Probable effect concentration (PEC) -- -- -- -- -- -- -- --
Quality assurance samples (SRMs)
PACS-2 found -- nr nr nr 65,250 20,000 41,550 12,400
PACS-2 true1 -- nr nr nr 66,200 19,600 40,900 12,400
Relative percent difference -- -- -- -- 1.4 2.0 1.6 0
MESS-1 found -- nr nr nr 57,700 5,050 31,700 19,000
MESS-1 true1 -- nr nr nr 58,400 4,820 30,490 18,600
Relative percent difference -- -- -- -- 1.2 4.7 3.9 2.1
LKSD-1 found -- nr nr nr 41,750 77,200 28,500 9,315
LKSD-1 true1 -- nr nr nr 41,300 77,200 28,700 9,460
Relative percent difference -- -- -- -- 1.1 0 .7 1.5
MAG-1 found -- nr nr nr 84,700 10,100 49,900 30,400
MAG-1 true1 -- nr nr nr 86,660 9,790 47,600 29,500
Relative percent difference -- -- -- -- 2.3 3.1 4.7 3.0
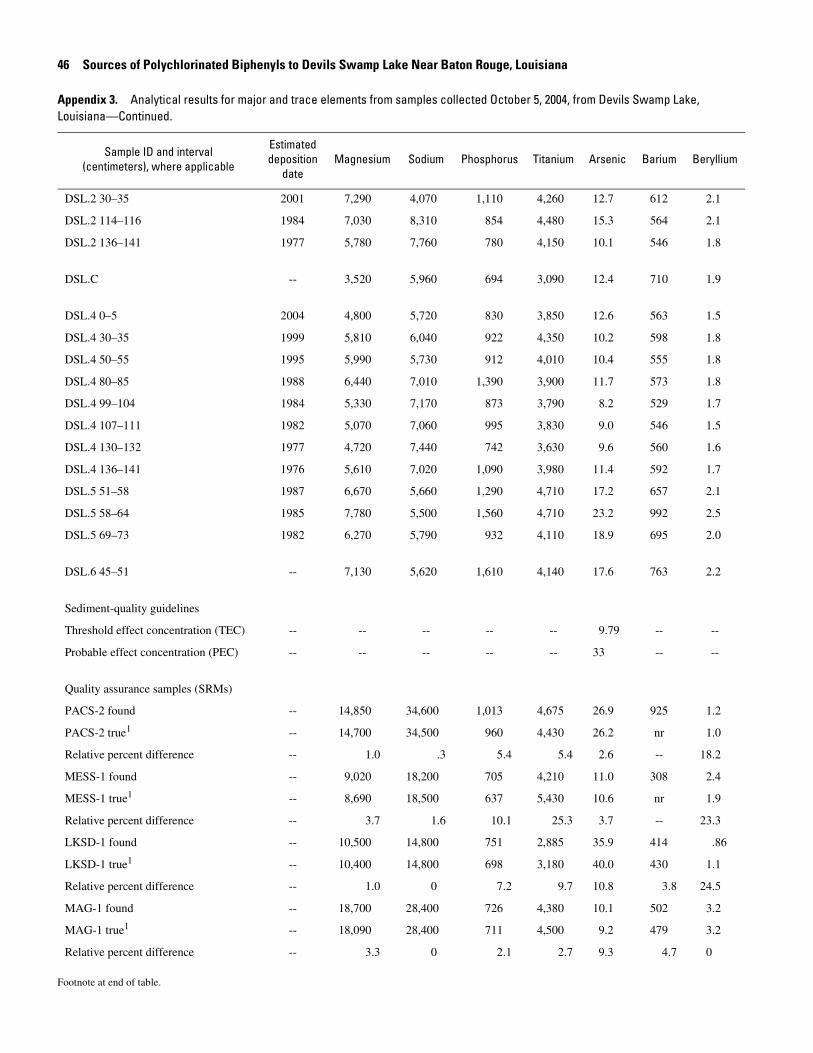
46 Sources of Polychlorinated Biphenyls to Devils Swamp Lake Near Baton Rouge, Louisiana
Appendix 3. Analytical results for major and trace elements from samples collected October 5, 2004, from Devils Swamp Lake, Louisiana—Continued.
Footnote at end of table.
Sample ID and interval(centimeters), where applicable
Estimateddeposition
dateMagnesium Sodium Phosphorus Titanium Arsenic Barium Beryllium
DSL.2 30–35 2001 7,290 4,070 1,110 4,260 12.7 612 2.1
DSL.2 114–116 1984 7,030 8,310 854 4,480 15.3 564 2.1
DSL.2 136–141 1977 5,780 7,760 780 4,150 10.1 546 1.8
DSL.C -- 3,520 5,960 694 3,090 12.4 710 1.9
DSL.4 0–5 2004 4,800 5,720 830 3,850 12.6 563 1.5
DSL.4 30–35 1999 5,810 6,040 922 4,350 10.2 598 1.8
DSL.4 50–55 1995 5,990 5,730 912 4,010 10.4 555 1.8
DSL.4 80–85 1988 6,440 7,010 1,390 3,900 11.7 573 1.8
DSL.4 99–104 1984 5,330 7,170 873 3,790 8.2 529 1.7
DSL.4 107–111 1982 5,070 7,060 995 3,830 9.0 546 1.5
DSL.4 130–132 1977 4,720 7,440 742 3,630 9.6 560 1.6
DSL.4 136–141 1976 5,610 7,020 1,090 3,980 11.4 592 1.7
DSL.5 51–58 1987 6,670 5,660 1,290 4,710 17.2 657 2.1
DSL.5 58–64 1985 7,780 5,500 1,560 4,710 23.2 992 2.5
DSL.5 69–73 1982 6,270 5,790 932 4,110 18.9 695 2.0
DSL.6 45–51 -- 7,130 5,620 1,610 4,140 17.6 763 2.2
Sediment-quality guidelines
Threshold effect concentration (TEC) -- -- -- -- -- 9.79 -- --
Probable effect concentration (PEC) -- -- -- -- -- 33 -- --
Quality assurance samples (SRMs)
PACS-2 found -- 14,850 34,600 1,013 4,675 26.9 925 1.2
PACS-2 true1 -- 14,700 34,500 960 4,430 26.2 nr 1.0
Relative percent difference -- 1.0 .3 5.4 5.4 2.6 -- 18.2
MESS-1 found -- 9,020 18,200 705 4,210 11.0 308 2.4
MESS-1 true1 -- 8,690 18,500 637 5,430 10.6 nr 1.9
Relative percent difference -- 3.7 1.6 10.1 25.3 3.7 -- 23.3
LKSD-1 found -- 10,500 14,800 751 2,885 35.9 414 .86
LKSD-1 true1 -- 10,400 14,800 698 3,180 40.0 430 1.1
Relative percent difference -- 1.0 0 7.2 9.7 10.8 3.8 24.5
MAG-1 found -- 18,700 28,400 726 4,380 10.1 502 3.2
MAG-1 true1 -- 18,090 28,400 711 4,500 9.2 479 3.2
Relative percent difference -- 3.3 0 2.1 2.7 9.3 4.7 0
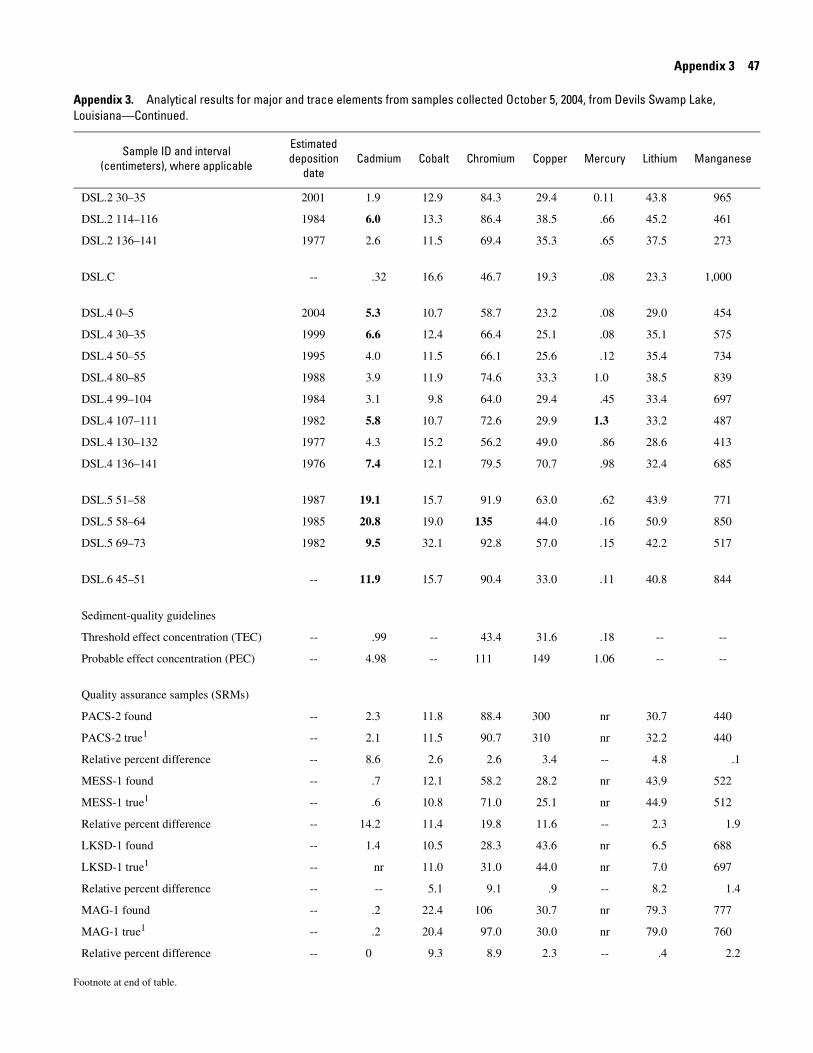
Appendix 3 47
Appendix 3. Analytical results for major and trace elements from samples collected October 5, 2004, from Devils Swamp Lake, Louisiana—Continued.
Footnote at end of table.
Sample ID and interval(centimeters), where applicable
Estimateddeposition
dateCadmium Cobalt Chromium Copper Mercury Lithium Manganese
DSL.2 30–35 2001 1.9 12.9 84.3 29.4 0.11 43.8 965
DSL.2 114–116 1984 6.0 13.3 86.4 38.5 .66 45.2 461
DSL.2 136–141 1977 2.6 11.5 69.4 35.3 .65 37.5 273
DSL.C -- .32 16.6 46.7 19.3 .08 23.3 1,000
DSL.4 0–5 2004 5.3 10.7 58.7 23.2 .08 29.0 454
DSL.4 30–35 1999 6.6 12.4 66.4 25.1 .08 35.1 575
DSL.4 50–55 1995 4.0 11.5 66.1 25.6 .12 35.4 734
DSL.4 80–85 1988 3.9 11.9 74.6 33.3 1.0 38.5 839
DSL.4 99–104 1984 3.1 9.8 64.0 29.4 .45 33.4 697
DSL.4 107–111 1982 5.8 10.7 72.6 29.9 1.3 33.2 487
DSL.4 130–132 1977 4.3 15.2 56.2 49.0 .86 28.6 413
DSL.4 136–141 1976 7.4 12.1 79.5 70.7 .98 32.4 685
DSL.5 51–58 1987 19.1 15.7 91.9 63.0 .62 43.9 771
DSL.5 58–64 1985 20.8 19.0 135 44.0 .16 50.9 850
DSL.5 69–73 1982 9.5 32.1 92.8 57.0 .15 42.2 517
DSL.6 45–51 -- 11.9 15.7 90.4 33.0 .11 40.8 844
Sediment-quality guidelines
Threshold effect concentration (TEC) -- .99 -- 43.4 31.6 .18 -- --
Probable effect concentration (PEC) -- 4.98 -- 111 149 1.06 -- --
Quality assurance samples (SRMs)
PACS-2 found -- 2.3 11.8 88.4 300 nr 30.7 440
PACS-2 true1 -- 2.1 11.5 90.7 310 nr 32.2 440
Relative percent difference -- 8.6 2.6 2.6 3.4 -- 4.8 .1
MESS-1 found -- .7 12.1 58.2 28.2 nr 43.9 522
MESS-1 true1 -- .6 10.8 71.0 25.1 nr 44.9 512
Relative percent difference -- 14.2 11.4 19.8 11.6 -- 2.3 1.9
LKSD-1 found -- 1.4 10.5 28.3 43.6 nr 6.5 688
LKSD-1 true1 -- nr 11.0 31.0 44.0 nr 7.0 697
Relative percent difference -- -- 5.1 9.1 .9 -- 8.2 1.4
MAG-1 found -- .2 22.4 106 30.7 nr 79.3 777
MAG-1 true1 -- .2 20.4 97.0 30.0 nr 79.0 760
Relative percent difference -- 0 9.3 8.9 2.3 -- .4 2.2
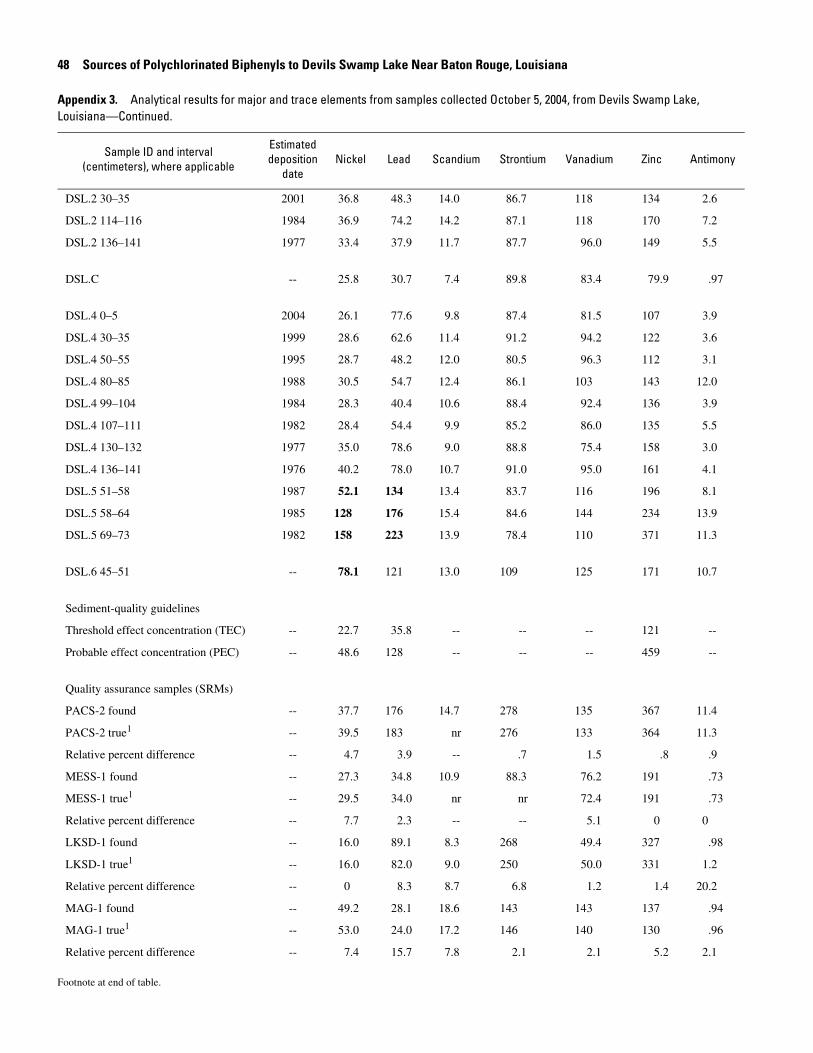
48 Sources of Polychlorinated Biphenyls to Devils Swamp Lake Near Baton Rouge, Louisiana
Appendix 3. Analytical results for major and trace elements from samples collected October 5, 2004, from Devils Swamp Lake, Louisiana—Continued.
Footnote at end of table.
Sample ID and interval(centimeters), where applicable
Estimateddeposition
dateNickel Lead Scandium Strontium Vanadium Zinc Antimony
DSL.2 30–35 2001 36.8 48.3 14.0 86.7 118 134 2.6
DSL.2 114–116 1984 36.9 74.2 14.2 87.1 118 170 7.2
DSL.2 136–141 1977 33.4 37.9 11.7 87.7 96.0 149 5.5
DSL.C -- 25.8 30.7 7.4 89.8 83.4 79.9 .97
DSL.4 0–5 2004 26.1 77.6 9.8 87.4 81.5 107 3.9
DSL.4 30–35 1999 28.6 62.6 11.4 91.2 94.2 122 3.6
DSL.4 50–55 1995 28.7 48.2 12.0 80.5 96.3 112 3.1
DSL.4 80–85 1988 30.5 54.7 12.4 86.1 103 143 12.0
DSL.4 99–104 1984 28.3 40.4 10.6 88.4 92.4 136 3.9
DSL.4 107–111 1982 28.4 54.4 9.9 85.2 86.0 135 5.5
DSL.4 130–132 1977 35.0 78.6 9.0 88.8 75.4 158 3.0
DSL.4 136–141 1976 40.2 78.0 10.7 91.0 95.0 161 4.1
DSL.5 51–58 1987 52.1 134 13.4 83.7 116 196 8.1
DSL.5 58–64 1985 128 176 15.4 84.6 144 234 13.9
DSL.5 69–73 1982 158 223 13.9 78.4 110 371 11.3
DSL.6 45–51 -- 78.1 121 13.0 109 125 171 10.7
Sediment-quality guidelines
Threshold effect concentration (TEC) -- 22.7 35.8 -- -- -- 121 --
Probable effect concentration (PEC) -- 48.6 128 -- -- -- 459 --
Quality assurance samples (SRMs)
PACS-2 found -- 37.7 176 14.7 278 135 367 11.4
PACS-2 true1 -- 39.5 183 nr 276 133 364 11.3
Relative percent difference -- 4.7 3.9 -- .7 1.5 .8 .9
MESS-1 found -- 27.3 34.8 10.9 88.3 76.2 191 .73
MESS-1 true1 -- 29.5 34.0 nr nr 72.4 191 .73
Relative percent difference -- 7.7 2.3 -- -- 5.1 0 0
LKSD-1 found -- 16.0 89.1 8.3 268 49.4 327 .98
LKSD-1 true1 -- 16.0 82.0 9.0 250 50.0 331 1.2
Relative percent difference -- 0 8.3 8.7 6.8 1.2 1.4 20.2
MAG-1 found -- 49.2 28.1 18.6 143 143 137 .94
MAG-1 true1 -- 53.0 24.0 17.2 146 140 130 .96
Relative percent difference -- 7.4 15.7 7.8 2.1 2.1 5.2 2.1

Appendix 3 49
Appendix 3. Analytical results for major and trace elements from samples collected October 5, 2004, from Devils Swamp Lake, Louisiana—Continued.
Footnote at end of table.
Sample ID and interval(centimeters), where applicable
Estimateddeposition
dateBismuth Cerium Cesium Gallium Lan-
thanumMoly-
bdenumRubid-
ium Niobium
DSL.2 30–35 2001 0.30 77.9 7.3 19.0 42.0 1.3 96.2 21
DSL.2 114–116 1984 .35 80.1 26.4 19.2 46.0 9.9 97.3 23
DSL.2 136–141 1977 .42 69.5 18.4 16.1 40.3 3.1 83.3 21
DSL.C -- .21 88.0 3.1 10.7 32.5 1.4 59.8 11
DSL.4 0–5 2004 .22 69.0 4.2 13.6 36.8 .93 73.8 18
DSL.4 30–35 1999 .24 73.4 5.0 15.8 39.7 1.0 84.9 21
DSL.4 50–55 1995 .27 68.7 8.6 16.1 38.3 1.1 84.2 18
DSL.4 80–85 1988 .30 70.0 25.2 17.0 39.7 3.0 91.0 19
DSL.4 99–104 1984 .36 66.7 14.7 14.6 36.8 2.0 77.1 16
DSL.4 107–111 1982 .37 62.6 11.1 14.6 34.6 2.2 75.6 16
DSL.4 130–132 1977 .58 59.8 4.5 13.4 34.2 1.5 71.7 16
DSL.4 136–141 1976 .35 67.9 4.6 15.9 37.1 1.4 81.5 18
DSL.5 51–58 1987 .36 80.0 5.6 18.7 43.6 2.3 95.4 21
DSL.5 58–64 1985 .36 83.8 6.6 21.1 45.7 5.0 103 25
DSL.5 69–73 1982 .29 76.1 5.4 18.4 44.6 12.3 89.8 21
DSL.6 45–51 -- .30 81.3 5.8 17.9 42.2 2.2 97.9 20
Sediment-quality guidelines
Threshold effect concentration (TEC) -- -- -- -- -- -- -- -- --
Probable effect concentration (PEC) -- -- -- -- -- -- -- -- --
Quality assurance samples (SRMs)
PACS-2 found -- .34 32.0 2.1 13.6 16.0 5.3 42.0 11.0
PACS-2 true1 -- nr nr nr nr nr 5.4 nr nr
Relative percent difference -- -- -- -- -- -- 3.4 -- --
MESS-1 found -- .33 74.4 4.2 13.5 39 2.3 94.7 17.0
MESS-1 true1 -- nr nr nr nr nr nr nr nr
Relative percent difference -- -- -- -- -- -- -- -- --
LKSD-1 found -- .87 26.6 .69 8.8 15.2 9.6 23.0 4.4
LKSD-1 true1 -- nr 27.0 nr nr 16.0 10.0 24.0 nr
Relative percent difference -- -- 1.5 -- -- 5.5 4.1 4.5 --
MAG-1 found -- .36 86.5 8.4 22.3 43.4 1.1 154 22.0
MAG-1 true1 -- .34 88.0 8.6 20.4 43.0 1.6 149 12.0
Relative percent difference -- 5.7 1.7 2.4 8.9 .9 37.0 3.3 58.8
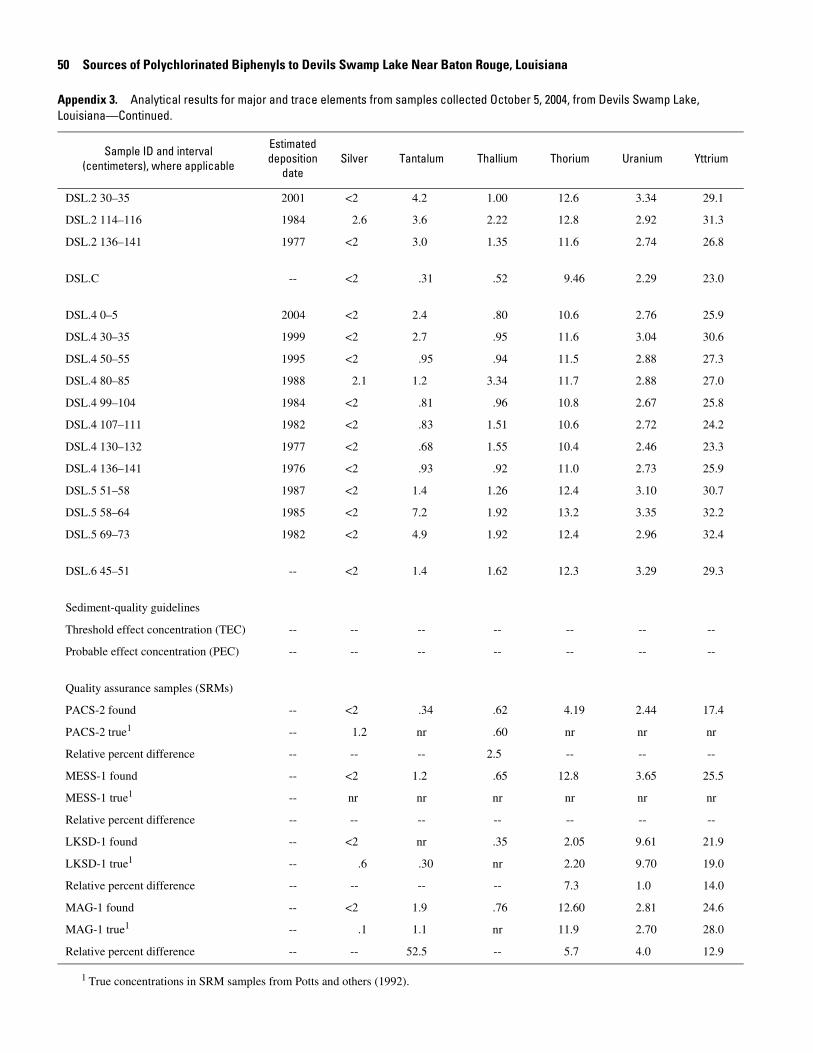
50 Sources of Polychlorinated Biphenyls to Devils Swamp Lake Near Baton Rouge, Louisiana
Appendix 3. Analytical results for major and trace elements from samples collected October 5, 2004, from Devils Swamp Lake, Louisiana—Continued.
1 True concentrations in SRM samples from Potts and others (1992).
Sample ID and interval(centimeters), where applicable
Estimateddeposition
dateSilver Tantalum Thallium Thorium Uranium Yttrium
DSL.2 30–35 2001 <2 4.2 1.00 12.6 3.34 29.1
DSL.2 114–116 1984 2.6 3.6 2.22 12.8 2.92 31.3
DSL.2 136–141 1977 <2 3.0 1.35 11.6 2.74 26.8
DSL.C -- <2 .31 .52 9.46 2.29 23.0
DSL.4 0–5 2004 <2 2.4 .80 10.6 2.76 25.9
DSL.4 30–35 1999 <2 2.7 .95 11.6 3.04 30.6
DSL.4 50–55 1995 <2 .95 .94 11.5 2.88 27.3
DSL.4 80–85 1988 2.1 1.2 3.34 11.7 2.88 27.0
DSL.4 99–104 1984 <2 .81 .96 10.8 2.67 25.8
DSL.4 107–111 1982 <2 .83 1.51 10.6 2.72 24.2
DSL.4 130–132 1977 <2 .68 1.55 10.4 2.46 23.3
DSL.4 136–141 1976 <2 .93 .92 11.0 2.73 25.9
DSL.5 51–58 1987 <2 1.4 1.26 12.4 3.10 30.7
DSL.5 58–64 1985 <2 7.2 1.92 13.2 3.35 32.2
DSL.5 69–73 1982 <2 4.9 1.92 12.4 2.96 32.4
DSL.6 45–51 -- <2 1.4 1.62 12.3 3.29 29.3
Sediment-quality guidelines
Threshold effect concentration (TEC) -- -- -- -- -- -- --
Probable effect concentration (PEC) -- -- -- -- -- -- --
Quality assurance samples (SRMs)
PACS-2 found -- <2 .34 .62 4.19 2.44 17.4
PACS-2 true1 -- 1.2 nr .60 nr nr nr
Relative percent difference -- -- -- 2.5 -- -- --
MESS-1 found -- <2 1.2 .65 12.8 3.65 25.5
MESS-1 true1 -- nr nr nr nr nr nr
Relative percent difference -- -- -- -- -- -- --
LKSD-1 found -- <2 nr .35 2.05 9.61 21.9
LKSD-1 true1 -- .6 .30 nr 2.20 9.70 19.0
Relative percent difference -- -- -- -- 7.3 1.0 14.0
MAG-1 found -- <2 1.9 .76 12.60 2.81 24.6
MAG-1 true1 -- .1 1.1 nr 11.9 2.70 28.0
Relative percent difference -- -- 52.5 -- 5.7 4.0 12.9

Prepared by the USGS Texas Water Science Center:8027 Exchange DriveAustin, TX 78754–4733
Information regarding water resources in Texas is available at http: //tx.usgs.gov/