Embed Size (px)
Citation preview
California & Metro
C E N T E R F O R B U S I N E S S A N D P O L I C Y R E S E A R C H
U N I V E R S I T Y O F T H E P A C I F I C E B E R H A R D T S C H O O L O F B U S I N E S S
May 2016
ContraCosta
Los Angeles
Los Angeles
Calaveras
El Dorado
DelNorte
Humboldt
AlamedaSan Francisco
Amador
Imperial
Madera
Mariposa
Alpine
Butte
Colusa
Fresno
Glenn
Lassen
Marin
Mendocino
Inyo
Kern
Kings
Lake
Merced
Modoc
Mono
Monterey
Napa
Nevada
Orange
Placer
Plumas
Riverside
Sacra-mento
SanBenito
San Bernardino
San Diego
SanJoaquin
San Luis Obispo
San Mateo
Santa Barbara
Santa Barbara
SantaBarbara
SantaClara
Santa Cruz
Shasta
Sierra
Siskiyou
Solano
Sonoma
Stanislaus
Sutter
Tehama
Trinity
Tulare
Tuolumne
Ventura
Ventura
Yolo
Yuba
C E N T E R F O R B U S I N E S S A N D P O L I C Y R E S E A R C H
U N I V E R S I T Y O F T H E P A C I F I C E B E R H A R D T S C H O O L O F B U S I N E S S
Dr. Jeffrey A. Michael, DirectorDr. Thomas Pogue, Associate DirectorNahila Ahsan, Research AnalystJesse Neumann, Economic Research AnalystNeriah Howard, Student ResearcherAnjul Shingal, Student ResearcherSydney Stanfill, Student Researcher
E-mailWebStocktonSacramento
[email protected]/CBPR209.946.7385916.340.6084
California & Metro Forecast is published by the Center for Business and Policy ResearchUniversity of the PacificEberhardt School of Business
Staff
2016-2020
Published quarterly by the Center for Business and Policy Research at the University of the Pacific Eberhardt School of Business.
Copyright © 2016 Center for Business and Policy Research. All rights reserved.
This forecast was prepared based upon assumptions reflecting the Center’s judgments as of the date it bears. Actual results could vary materially from the forecast. Neither the Center for Business and Policy Research nor The Regents of the University of the Pacific shall be held responsible as a consequence of any such variance. Unless approved by the Center for Business and Policy Research, the publication or distribution of this forecast and the preparation, publication or distribution of any excerpts from this forecast are prohibited.
California & Metro
May 2016
Contents
California Highlights .................................................. 5
Forecast Summary .............................................6 - 10
California Forecast Tables .................................11 - 19
California Forecast Charts .................................21 - 25
Fresno MSA .....................................................27 - 30
Merced MSA ....................................................31 - 34
Modesto MSA .................................................. 35 - 38
Oakland MSA ....................................................39 - 42
Sacramento MSA ............................................. 43 - 46
San Francisco MSA ...........................................47 - 50
San Jose MSA ..................................................51 - 54
Stockton MSA ................................................. 55 - 58
Center for Business and Policy Research 5
FORECAST HIGHLIGHTS
Highlights of the May 2016 California Forecast
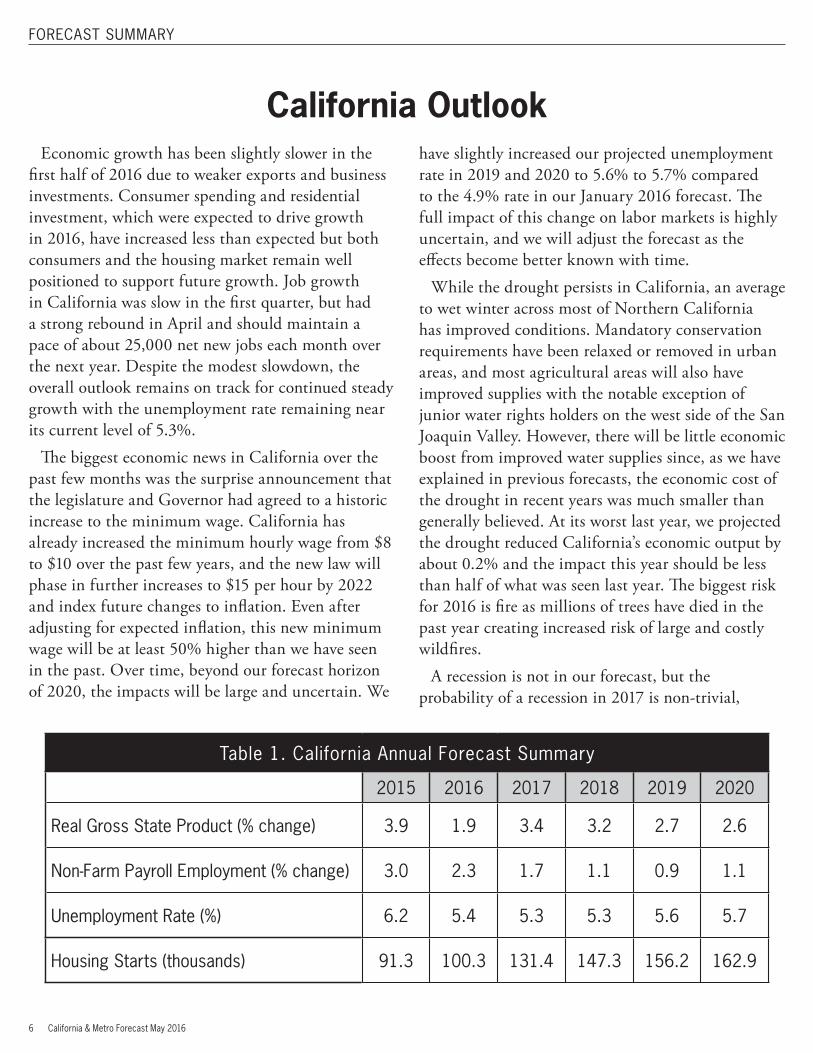
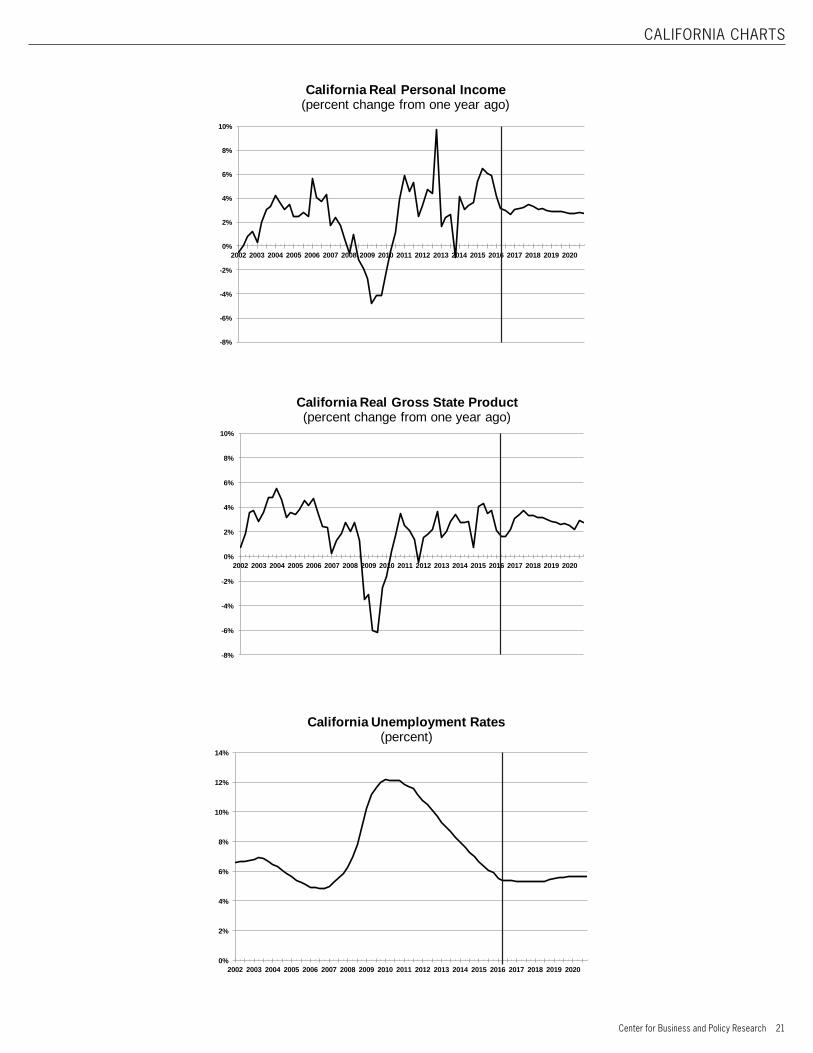
• California is forecast to maintain steady growth in real gross state product at approximately 3% through 2019.
• The California unemployment rate has fallen to 5.3% and it should stabilize near this level for the next two years.
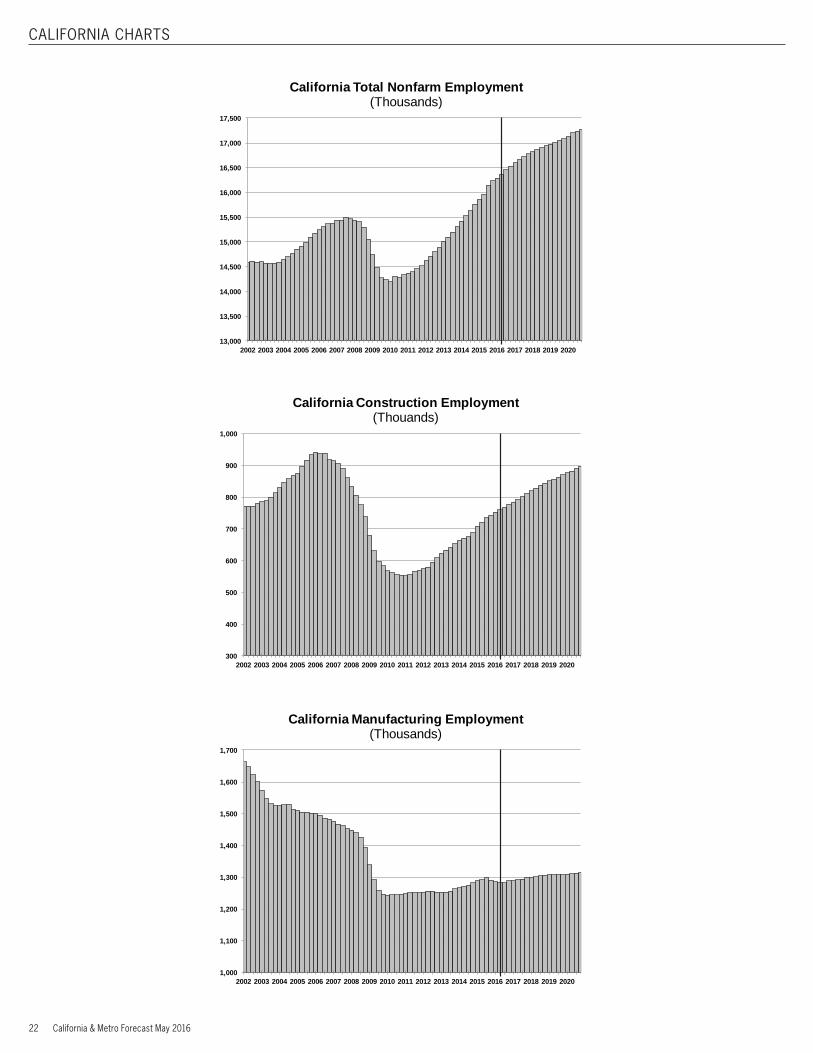
• Nonfarm payroll jobs have grown at a strong 3% pace for the past three years, but we project more moderate 2.3% growth in 2016, 1.7% growth in 2017, and approximately 1% growth from 2018 through the end of the forecast in 2020.
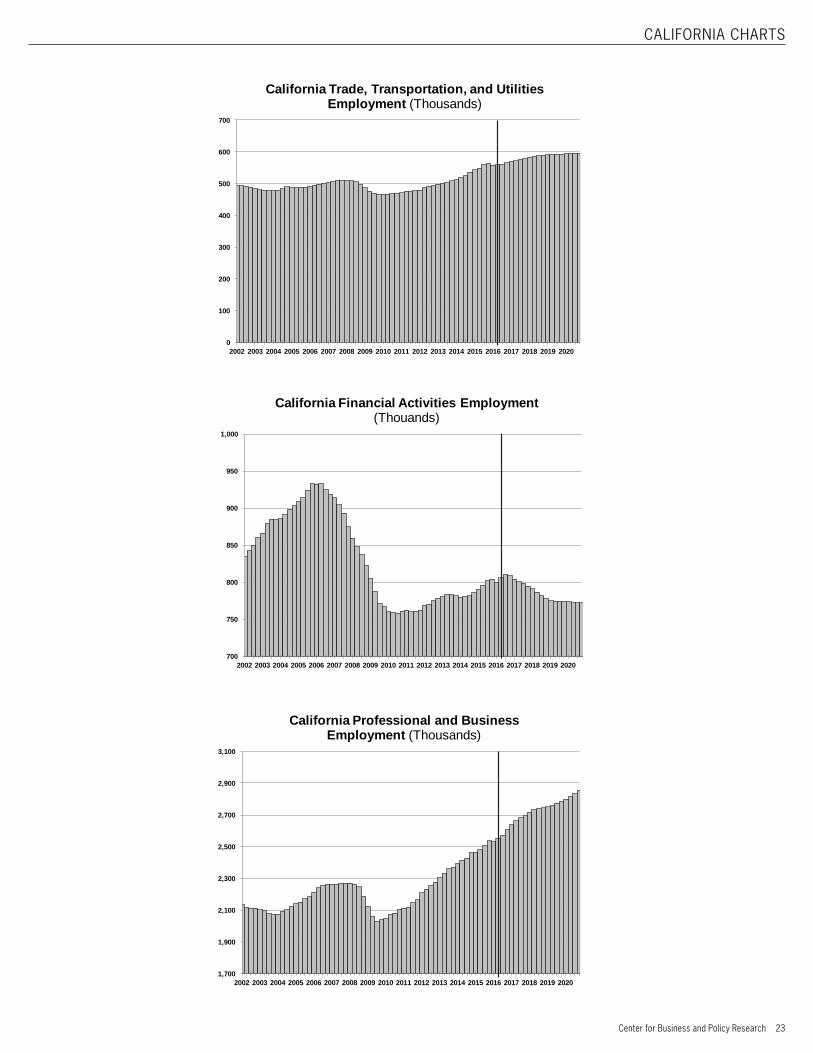
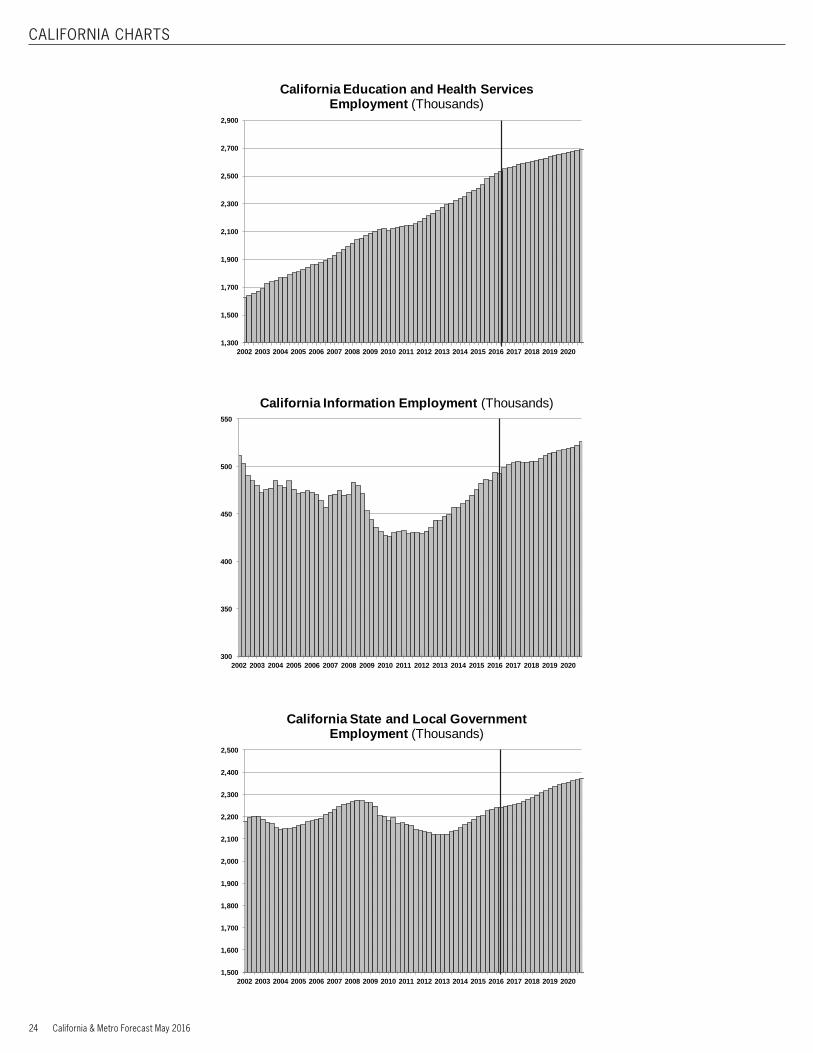
• Health Services has become the largest employment sector in the state, and is projected to add an additional 55,000 positions over the next 12 months, slightly less than the 70,000 jobs added annually in recent years.
• Professional Scientific & Technical Services is a high-paying sector that has fueled the recovery. Growth in this sector will slow to about 30,000 jobs over the next year as Silicon Valley growth cools.
• Growing tourism and a gradual shift in consumer spending from retail to restaurants has led the Leisure and Hospitality sector to exceed 4% job growth in each of the past 4 years, and is projected to add more than 35,000 additional jobs over the next year.
• State and local government employment is one of the slowest growing sectors, projected to grow less than 1% over the next year. State and local government payrolls in California will finally regain their 2008 level in late 2017.
• Nearly 40,000 new Construction jobs are anticipated in each of the next three years, just below a 5% annual growth rate. Despite this expected growth, there will still be fewer Construction jobs in 2020 than before the recession.
• Single-family housing starts are beginning to increase, but fell short of 50,000 units in 2015 and are on track for a modest gain to 57,000 units in 2016. We project a substantial increase to 79,000 units in 2017, and 90,000 units in 2018.
• Multi-family housing starts have surpassed pre-recession levels, but growth has stalled in recent months and 2016 is on track to be similar to the 45,000 multi-family units produced in 2015. We expect multi-family growth to resume in 2017 and exceed 60,000 units by 2019.
6 California & Metro Forecast May 2016
FORECAST SUMMARY
California OutlookEconomic growth has been slightly slower in the
first half of 2016 due to weaker exports and business investments. Consumer spending and residential investment, which were expected to drive growth in 2016, have increased less than expected but both consumers and the housing market remain well positioned to support future growth. Job growth in California was slow in the first quarter, but had a strong rebound in April and should maintain a pace of about 25,000 net new jobs each month over the next year. Despite the modest slowdown, the overall outlook remains on track for continued steady growth with the unemployment rate remaining near its current level of 5.3%.
The biggest economic news in California over the past few months was the surprise announcement that the legislature and Governor had agreed to a historic increase to the minimum wage. California has already increased the minimum hourly wage from $8 to $10 over the past few years, and the new law will phase in further increases to $15 per hour by 2022 and index future changes to inflation. Even after adjusting for expected inflation, this new minimum wage will be at least 50% higher than we have seen in the past. Over time, beyond our forecast horizon of 2020, the impacts will be large and uncertain. We
have slightly increased our projected unemployment rate in 2019 and 2020 to 5.6% to 5.7% compared to the 4.9% rate in our January 2016 forecast. The full impact of this change on labor markets is highly uncertain, and we will adjust the forecast as the effects become better known with time.
While the drought persists in California, an average to wet winter across most of Northern California has improved conditions. Mandatory conservation requirements have been relaxed or removed in urban areas, and most agricultural areas will also have improved supplies with the notable exception of junior water rights holders on the west side of the San Joaquin Valley. However, there will be little economic boost from improved water supplies since, as we have explained in previous forecasts, the economic cost of the drought in recent years was much smaller than generally believed. At its worst last year, we projected the drought reduced California’s economic output by about 0.2% and the impact this year should be less than half of what was seen last year. The biggest risk for 2016 is fire as millions of trees have died in the past year creating increased risk of large and costly wildfires.
A recession is not in our forecast, but the probability of a recession in 2017 is non-trivial,
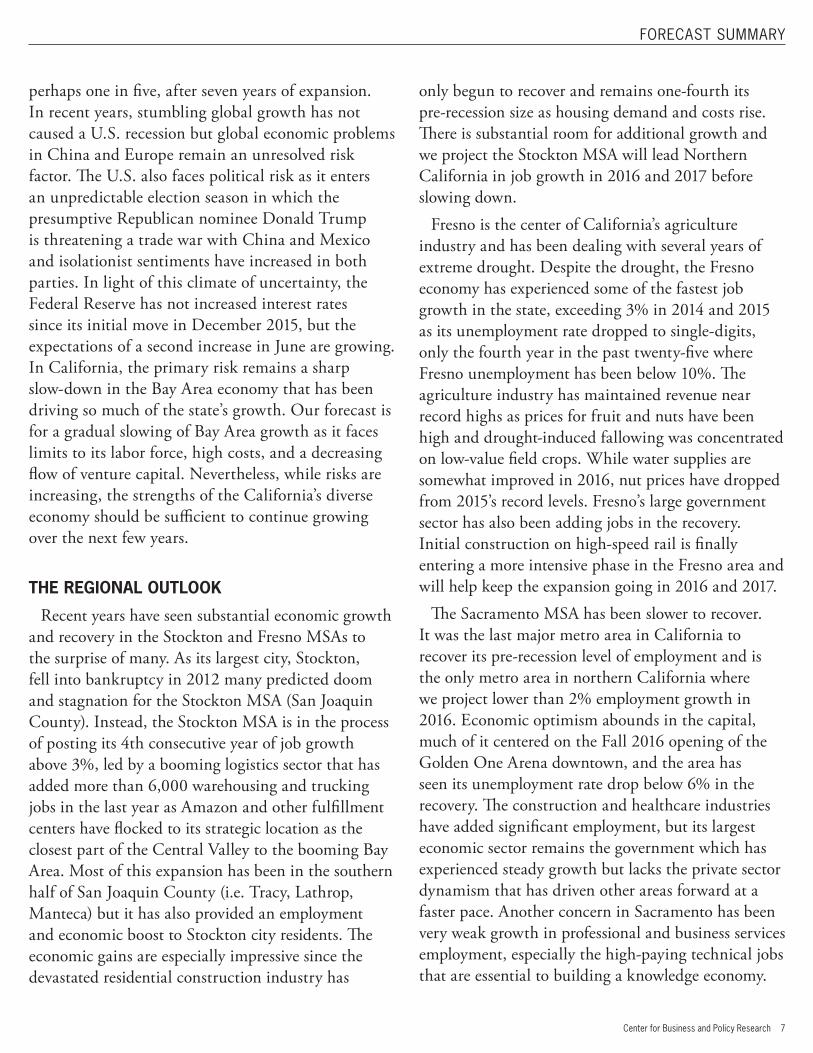
Table 1. California Annual Forecast Summary
2015 2016 2017 2018 2019 2020
Real Gross State Product (% change) 3.9 1.9 3.4 3.2 2.7 2.6
Non-Farm Payroll Employment (% change) 3.0 2.3 1.7 1.1 0.9 1.1
Unemployment Rate (%) 6.2 5.4 5.3 5.3 5.6 5.7
Housing Starts (thousands) 91.3 100.3 131.4 147.3 156.2 162.9
Center for Business and Policy Research 7
FORECAST SUMMARY
perhaps one in five, after seven years of expansion. In recent years, stumbling global growth has not caused a U.S. recession but global economic problems in China and Europe remain an unresolved risk factor. The U.S. also faces political risk as it enters an unpredictable election season in which the presumptive Republican nominee Donald Trump is threatening a trade war with China and Mexico and isolationist sentiments have increased in both parties. In light of this climate of uncertainty, the Federal Reserve has not increased interest rates since its initial move in December 2015, but the expectations of a second increase in June are growing. In California, the primary risk remains a sharp slow-down in the Bay Area economy that has been driving so much of the state’s growth. Our forecast is for a gradual slowing of Bay Area growth as it faces limits to its labor force, high costs, and a decreasing flow of venture capital. Nevertheless, while risks are increasing, the strengths of the California’s diverse economy should be sufficient to continue growing over the next few years.
THE REGIONAL OUTLOOK
Recent years have seen substantial economic growth and recovery in the Stockton and Fresno MSAs to the surprise of many. As its largest city, Stockton, fell into bankruptcy in 2012 many predicted doom and stagnation for the Stockton MSA (San Joaquin County). Instead, the Stockton MSA is in the process of posting its 4th consecutive year of job growth above 3%, led by a booming logistics sector that has added more than 6,000 warehousing and trucking jobs in the last year as Amazon and other fulfillment centers have flocked to its strategic location as the closest part of the Central Valley to the booming Bay Area. Most of this expansion has been in the southern half of San Joaquin County (i.e. Tracy, Lathrop, Manteca) but it has also provided an employment and economic boost to Stockton city residents. The economic gains are especially impressive since the devastated residential construction industry has
only begun to recover and remains one-fourth its pre-recession size as housing demand and costs rise. There is substantial room for additional growth and we project the Stockton MSA will lead Northern California in job growth in 2016 and 2017 before slowing down.
Fresno is the center of California’s agriculture industry and has been dealing with several years of extreme drought. Despite the drought, the Fresno economy has experienced some of the fastest job growth in the state, exceeding 3% in 2014 and 2015 as its unemployment rate dropped to single-digits, only the fourth year in the past twenty-five where Fresno unemployment has been below 10%. The agriculture industry has maintained revenue near record highs as prices for fruit and nuts have been high and drought-induced fallowing was concentrated on low-value field crops. While water supplies are somewhat improved in 2016, nut prices have dropped from 2015’s record levels. Fresno’s large government sector has also been adding jobs in the recovery. Initial construction on high-speed rail is finally entering a more intensive phase in the Fresno area and will help keep the expansion going in 2016 and 2017.
The Sacramento MSA has been slower to recover. It was the last major metro area in California to recover its pre-recession level of employment and is the only metro area in northern California where we project lower than 2% employment growth in 2016. Economic optimism abounds in the capital, much of it centered on the Fall 2016 opening of the Golden One Arena downtown, and the area has seen its unemployment rate drop below 6% in the recovery. The construction and healthcare industries have added significant employment, but its largest economic sector remains the government which has experienced steady growth but lacks the private sector dynamism that has driven other areas forward at a faster pace. Another concern in Sacramento has been very weak growth in professional and business services employment, especially the high-paying technical jobs that are essential to building a knowledge economy.
8 California & Metro Forecast May 2016
FORECAST SUMMARY
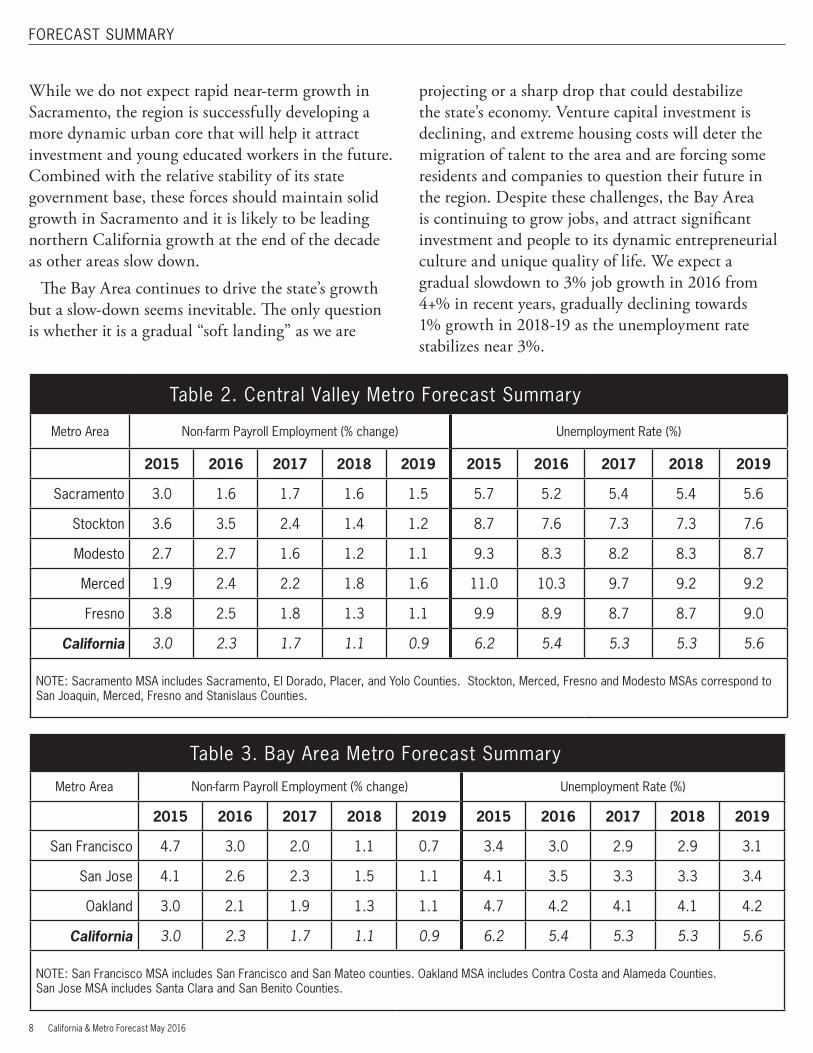
While we do not expect rapid near-term growth in Sacramento, the region is successfully developing a more dynamic urban core that will help it attract investment and young educated workers in the future. Combined with the relative stability of its state government base, these forces should maintain solid growth in Sacramento and it is likely to be leading northern California growth at the end of the decade as other areas slow down.
The Bay Area continues to drive the state’s growth but a slow-down seems inevitable. The only question is whether it is a gradual “soft landing” as we are
projecting or a sharp drop that could destabilize the state’s economy. Venture capital investment is declining, and extreme housing costs will deter the migration of talent to the area and are forcing some residents and companies to question their future in the region. Despite these challenges, the Bay Area is continuing to grow jobs, and attract significant investment and people to its dynamic entrepreneurial culture and unique quality of life. We expect a gradual slowdown to 3% job growth in 2016 from 4+% in recent years, gradually declining towards 1% growth in 2018-19 as the unemployment rate stabilizes near 3%.
Table 3. Bay Area Metro Forecast Summary
Metro Area Non-farm Payroll Employment (% change) Unemployment Rate (%)
2015 2016 2017 2018 2019 2015 2016 2017 2018 2019
San Francisco 4.7 3.0 2.0 1.1 0.7 3.4 3.0 2.9 2.9 3.1
San Jose 4.1 2.6 2.3 1.5 1.1 4.1 3.5 3.3 3.3 3.4
Oakland 3.0 2.1 1.9 1.3 1.1 4.7 4.2 4.1 4.1 4.2
California 3.0 2.3 1.7 1.1 0.9 6.2 5.4 5.3 5.3 5.6
NOTE: San Francisco MSA includes San Francisco and San Mateo counties. Oakland MSA includes Contra Costa and Alameda Counties. San Jose MSA includes Santa Clara and San Benito Counties.
Table 2. Central Valley Metro Forecast Summary
Metro Area Non-farm Payroll Employment (% change) Unemployment Rate (%)
2015 2016 2017 2018 2019 2015 2016 2017 2018 2019
Sacramento 3.0 1.6 1.7 1.6 1.5 5.7 5.2 5.4 5.4 5.6
Stockton 3.6 3.5 2.4 1.4 1.2 8.7 7.6 7.3 7.3 7.6
Modesto 2.7 2.7 1.6 1.2 1.1 9.3 8.3 8.2 8.3 8.7
Merced 1.9 2.4 2.2 1.8 1.6 11.0 10.3 9.7 9.2 9.2
Fresno 3.8 2.5 1.8 1.3 1.1 9.9 8.9 8.7 8.7 9.0
California 3.0 2.3 1.7 1.1 0.9 6.2 5.4 5.3 5.3 5.6
NOTE: Sacramento MSA includes Sacramento, El Dorado, Placer, and Yolo Counties. Stockton, Merced, Fresno and Modesto MSAs correspond to San Joaquin, Merced, Fresno and Stanislaus Counties.
Center for Business and Policy Research 9
FORECAST SUMMARY
THE IMPACT OF MINIMUM WAGE INCREASES
The recent move to increase California’s minimum wage to $15 over time will have larger impacts in the Central Valley than any other region in the state. We estimate that it will impact up to 50% of jobs in the Central Valley over time, double the percentage in coastal areas, and the redistribution of local income spurred by the change will also be substantially larger in the Valley.1
The general arguments of the policy debate are well known. Proponents of the minimum-wage point to increasing inequality, the difficulty of making ends meet on minimum wage jobs, and argue that minimum wages will boost the economy as they are more likely to spend their income and boost demand. Opponents argue that the minimum wage will reduce employment and slow economic growth, and that the minimum wage is poorly targeted towards the poor and that there are more effective policies to reduce poverty. Both sides are right, and little is known about the magnitude of these impacts in the face of such a large and unprecedented change in policy.
Two of the less discussed impacts of the minimum wage are its impact on migration and the agriculture industry. These impacts are particularly important for the Central Valley whose economy is heavily influenced by changes to population growth and its largest industry.
Migration: In recent decades, California migration patterns have been dominated by low and moderate income households moving out of coastal areas due to the high cost of living. Most of these households leave the state altogether, but many have relocated to the lower cost Central Valley. Higher wages will make the working poor less likely to move from coastal areas, possibly reducing migration into the Central Valley. However, the higher minimum wage will attract some in-migration from other states with much lower minimum wages and those in-migrants could be
1 For more details, see our fact sheet on regional differences http://goo.gl/Xfl7aw
attracted to the Central Valley’s combination of a high minimum wage and comparably lower housing costs. Higher wages will also pull some current residents into the labor force. Overall, it should increase the pool of people willing to work low-wage jobs in areas such as agriculture and fast food while employers in these industries will be searching for ways to reduce their labor needs. Changes to migration and labor force participation could lead to displacement in the labor market which could stimulate some offsetting out-migration. As with so many aspects of this large and unprecedented increase to the minimum wage, there will be offsetting impacts on migration and population growth and the net impacts are uncertain. The geographical patterns and demographics of migration in the Valley could change significantly even if total net migration and population growth changes little. These migration patterns could change the skills profile of the Valley workforce as policy and economic changes increase employer demands for higher-skilled workers.
Agriculture: Farmers sell their output into global markets and have very little ability to raise prices in response to cost increases. Thus, the minimum wage increases are more likely to be absorbed by farmers. If prices and profits remain at the high-levels of recent years, farmers do have some capacity to absorb these costs and the minimum wage will have the effect desired by its backers of reducing income inequality. Shifting income from farmers to farm workers will probably lead to more spending and consumer economic activity in the Valley, boosting the demand for some goods.
California agriculture is the most labor-intensive in the nation and labor costs were equal to about 32% of gross farm revenue in 2014, the most recent year with available data and when the minimum wage averaged only $8.50. As the $15 minimum wage is fully phased in over the next six years, labor costs could increase to as much as 45% of revenue if other costs and revenue grow at the rate of inflation. Such a large change would reduce farm profit margins from
10 California & Metro Forecast May 2016
FORECAST SUMMARY
typical values of 25% of revenues to below 15% of revenues and could reduce farmland values that have increased sharply over the past decade. Given the magnitude of this shift, this scenario where everything stays the same except wages is unlikely, and the higher minimum wage is likely to accelerate the pace of mechanization, spur the development of new labor-saving technologies and shifts away from more labor intensive crops such as vegetables and fruit where California farms would become less competitive in global markets. It could also have significant impacts on water policy as the reduction in farm profits will have a substantial negative impact on farmers’ capacity to pay their share of the costs of multi-billion dollar new water infrastructure such as the Delta tunnels and dams.
In summary, the minimum wage increase will result in fewer, but higher-paying and higher-skill jobs in agriculture and lower profits for farmers. This will be
a significant change for the Central Valley economy. If farmers are able to successfully adapt and remain competitive at the higher wages, it could benefit the overall Valley economy. The high labor turnover and poverty among farm workers has resulted in concentrated poverty and high unemployment that has deterred investment in other industries in the Valley. If higher wages and technological change were to make the average farm job more comparable to construction or low-skill manufacturing, it could significantly benefit the Valley economy in the long-run. However, the sharp increase in cost will also generate some displacement of vulnerable, low-income workers and threaten the global competitive position of the region’s largest industry. The risk and uncertainty surrounding this policy change on the agricultural economy are great, and adjusting the law so that there is a slower phase-in of the $15 per hour wage in the Valley or a more moderate increase like Oregon’s $12.50 wage in rural areas would reduce these risks.
Center for Business and Policy Research 11
CALIFORNIA TABLES
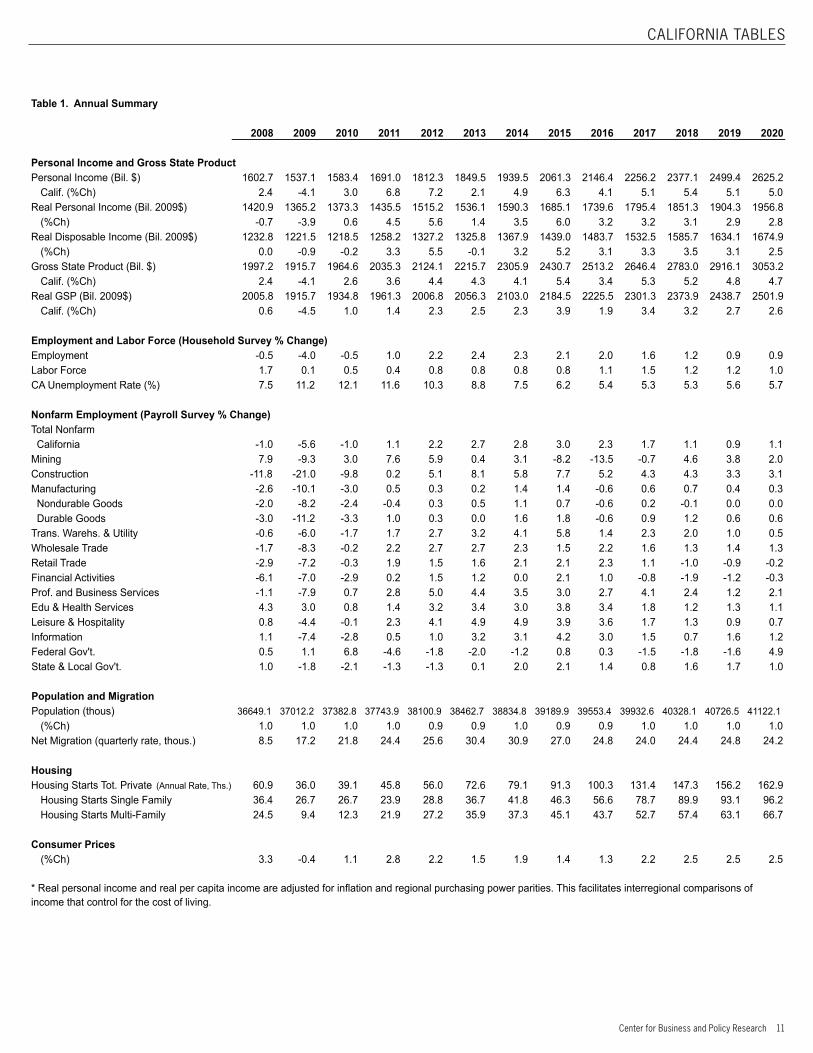
Table 1. Annual Summary
2008 2009 2010 2011 2012 2013 2014 2015 2016 2017 2018 2019 2020
Personal Income and Gross State ProductPersonal Income (Bil. $) 1602.7 1537.1 1583.4 1691.0 1812.3 1849.5 1939.5 2061.3 2146.4 2256.2 2377.1 2499.4 2625.2
Calif. (%Ch) 2.4 -4.1 3.0 6.8 7.2 2.1 4.9 6.3 4.1 5.1 5.4 5.1 5.0Real Personal Income (Bil. 2009$) 1420.9 1365.2 1373.3 1435.5 1515.2 1536.1 1590.3 1685.1 1739.6 1795.4 1851.3 1904.3 1956.8
(%Ch) -0.7 -3.9 0.6 4.5 5.6 1.4 3.5 6.0 3.2 3.2 3.1 2.9 2.8Real Disposable Income (Bil. 2009$) 1232.8 1221.5 1218.5 1258.2 1327.2 1325.8 1367.9 1439.0 1483.7 1532.5 1585.7 1634.1 1674.9
(%Ch) 0.0 -0.9 -0.2 3.3 5.5 -0.1 3.2 5.2 3.1 3.3 3.5 3.1 2.5Gross State Product (Bil. $) 1997.2 1915.7 1964.6 2035.3 2124.1 2215.7 2305.9 2430.7 2513.2 2646.4 2783.0 2916.1 3053.2
Calif. (%Ch) 2.4 -4.1 2.6 3.6 4.4 4.3 4.1 5.4 3.4 5.3 5.2 4.8 4.7Real GSP (Bil. 2009$) 2005.8 1915.7 1934.8 1961.3 2006.8 2056.3 2103.0 2184.5 2225.5 2301.3 2373.9 2438.7 2501.9
Calif. (%Ch) 0.6 -4.5 1.0 1.4 2.3 2.5 2.3 3.9 1.9 3.4 3.2 2.7 2.6
Employment and Labor Force (Household Survey % Change)Employment -0.5 -4.0 -0.5 1.0 2.2 2.4 2.3 2.1 2.0 1.6 1.2 0.9 0.9Labor Force 1.7 0.1 0.5 0.4 0.8 0.8 0.8 0.8 1.1 1.5 1.2 1.2 1.0CA Unemployment Rate (%) 7.5 11.2 12.1 11.6 10.3 8.8 7.5 6.2 5.4 5.3 5.3 5.6 5.7
Nonfarm Employment (Payroll Survey % Change)Total Nonfarm California -1.0 -5.6 -1.0 1.1 2.2 2.7 2.8 3.0 2.3 1.7 1.1 0.9 1.1Mining 7.9 -9.3 3.0 7.6 5.9 0.4 3.1 -8.2 -13.5 -0.7 4.6 3.8 2.0Construction -11.8 -21.0 -9.8 0.2 5.1 8.1 5.8 7.7 5.2 4.3 4.3 3.3 3.1Manufacturing -2.6 -10.1 -3.0 0.5 0.3 0.2 1.4 1.4 -0.6 0.6 0.7 0.4 0.3 Nondurable Goods -2.0 -8.2 -2.4 -0.4 0.3 0.5 1.1 0.7 -0.6 0.2 -0.1 0.0 0.0 Durable Goods -3.0 -11.2 -3.3 1.0 0.3 0.0 1.6 1.8 -0.6 0.9 1.2 0.6 0.6Trans. Warehs. & Utility -0.6 -6.0 -1.7 1.7 2.7 3.2 4.1 5.8 1.4 2.3 2.0 1.0 0.5Wholesale Trade -1.7 -8.3 -0.2 2.2 2.7 2.7 2.3 1.5 2.2 1.6 1.3 1.4 1.3Retail Trade -2.9 -7.2 -0.3 1.9 1.5 1.6 2.1 2.1 2.3 1.1 -1.0 -0.9 -0.2Financial Activities -6.1 -7.0 -2.9 0.2 1.5 1.2 0.0 2.1 1.0 -0.8 -1.9 -1.2 -0.3Prof. and Business Services -1.1 -7.9 0.7 2.8 5.0 4.4 3.5 3.0 2.7 4.1 2.4 1.2 2.1Edu & Health Services 4.3 3.0 0.8 1.4 3.2 3.4 3.0 3.8 3.4 1.8 1.2 1.3 1.1Leisure & Hospitality 0.8 -4.4 -0.1 2.3 4.1 4.9 4.9 3.9 3.6 1.7 1.3 0.9 0.7Information 1.1 -7.4 -2.8 0.5 1.0 3.2 3.1 4.2 3.0 1.5 0.7 1.6 1.2Federal Gov't. 0.5 1.1 6.8 -4.6 -1.8 -2.0 -1.2 0.8 0.3 -1.5 -1.8 -1.6 4.9State & Local Gov't. 1.0 -1.8 -2.1 -1.3 -1.3 0.1 2.0 2.1 1.4 0.8 1.6 1.7 1.0
Population and MigrationPopulation (thous) 36649.1 37012.2 37382.8 37743.9 38100.9 38462.7 38834.8 39189.9 39553.4 39932.6 40328.1 40726.5 41122.1
(%Ch) 1.0 1.0 1.0 1.0 0.9 0.9 1.0 0.9 0.9 1.0 1.0 1.0 1.0Net Migration (quarterly rate, thous.) 8.5 17.2 21.8 24.4 25.6 30.4 30.9 27.0 24.8 24.0 24.4 24.8 24.2
HousingHousing Starts Tot. Private (Annual Rate, Ths.) 60.9 36.0 39.1 45.8 56.0 72.6 79.1 91.3 100.3 131.4 147.3 156.2 162.9
Housing Starts Single Family 36.4 26.7 26.7 23.9 28.8 36.7 41.8 46.3 56.6 78.7 89.9 93.1 96.2Housing Starts Multi-Family 24.5 9.4 12.3 21.9 27.2 35.9 37.3 45.1 43.7 52.7 57.4 63.1 66.7
Consumer Prices(%Ch) 3.3 -0.4 1.1 2.8 2.2 1.5 1.9 1.4 1.3 2.2 2.5 2.5 2.5
* Real personal income and real per capita income are adjusted for inflation and regional purchasing power parities. This facilitates interregional comparisons of income that control for the cost of living.
12 California & Metro Forecast May 2016
CALIFORNIA TABLES
Table 2. Quarterly Summary
2015Q1 2015Q2 2015Q3 2015Q4 2016Q1 2016Q2 2016Q3 2016Q4 2017Q1 2017Q2 2017Q3 2017Q4
Personal Income and Gross State ProductPersonal Income (Annual Rate, Bil. $) 2011.3 2056.6 2078.2 2099.3 2114.8 2133.5 2155.1 2182.2 2212.1 2242.2 2270.6 2299.7
Calif. (%Ch) 5.7 6.8 6.3 6.3 5.1 3.7 3.7 3.9 4.6 5.1 5.4 5.4Real Personal Income (Bil. 2009$) 1654.1 1682.0 1694.3 1709.9 1722.8 1735.1 1745.1 1755.6 1774.7 1789.7 1801.1 1816.2
(%Ch) 5.4 6.5 6.0 5.8 4.2 3.2 3.0 2.7 3.0 3.1 3.2 3.5Real Disposable Income (Bil. 2009$) 1412.3 1436.0 1446.9 1460.6 1469.5 1479.2 1488.3 1497.8 1514.1 1527.0 1537.4 1551.5
(%Ch) 4.7 5.7 5.3 5.1 4.0 3.0 2.9 2.5 3.0 3.2 3.3 3.6Gross State Product (Bil. $) 2386.7 2424.0 2448.5 2463.6 2474.5 2498.0 2521.9 2558.6 2594.1 2630.7 2666.8 2693.9
Calif. (%Ch) 5.6 5.7 5.0 5.2 3.7 3.1 3.0 3.9 4.8 5.3 5.7 5.3Real GSP (Bil. 2009$) 2158.9 2182.5 2193.8 2202.6 2204.0 2217.6 2229.8 2250.4 2272.1 2293.7 2313.2 2326.2
Calif. (%Ch) 4.1 4.3 3.5 3.7 2.1 1.6 1.6 2.2 3.1 3.4 3.7 3.4
Employment and Labor Force (Household Survey % Change)Employment 2.5 2.3 2.0 1.7 1.9 2.0 2.0 2.2 1.9 1.6 1.5 1.4Labor Force 1.1 1.0 0.7 0.5 0.6 1.0 1.3 1.6 1.7 1.6 1.5 1.3CA Unemployment Rate (%) 6.7 6.3 6.1 5.9 5.5 5.4 5.4 5.4 5.3 5.3 5.3 5.3
Non-farm Employment (Payroll Survey % Change)Total Non-farm California 2.9 2.8 3.3 3.0 2.7 2.5 1.9 1.9 1.9 1.8 1.6 1.4Mining -2.2 -6.8 -10.7 -13.2 -13.5 -14.1 -14.0 -12.3 -7.2 -2.5 2.7 4.2Construction 6.7 7.5 8.8 8.0 6.5 5.5 4.4 4.6 4.0 4.3 4.5 4.5Manufacturing 1.7 1.7 1.6 0.6 -0.3 -0.8 -1.1 -0.2 0.3 0.7 0.9 0.7 Nondurable Goods 1.0 1.1 0.9 -0.1 -0.7 -0.8 -1.0 0.1 0.3 0.3 0.2 -0.1 Durable Goods 2.1 2.1 2.1 1.0 0.0 -0.7 -1.1 -0.4 0.2 0.9 1.3 1.2Trans. Warehs. & Utility 5.9 5.6 6.6 4.9 3.1 2.1 0.1 0.3 1.6 2.2 2.9 2.7Wholesale Trade 1.0 1.2 1.8 2.1 2.4 2.5 2.0 1.8 1.7 1.7 1.6 1.3Retail Trade 2.1 1.9 2.4 2.0 2.0 2.4 2.3 2.7 2.3 1.5 0.7 0.0Financial Activities 1.4 1.9 2.6 2.4 1.2 1.2 1.1 0.5 0.5 -0.6 -1.6 -1.7Prof. and Business Services 2.9 2.6 3.3 3.1 2.8 2.9 2.5 2.7 4.2 4.4 4.3 3.6Edu. & Health Services 3.2 3.6 4.2 4.1 4.2 4.0 2.7 2.7 2.2 2.0 1.6 1.4Leisure & Hospitality 4.0 3.7 3.9 4.1 4.2 4.0 3.5 2.6 1.9 1.7 1.7 1.6Information 4.1 4.8 4.7 3.3 3.9 2.1 2.5 3.4 1.9 2.5 1.0 0.5Federal Gov't. 0.1 0.8 1.0 1.3 1.0 0.6 0.1 -0.5 -1.1 -1.4 -1.7 -1.9State & Local Gov't. 2.3 1.8 2.5 1.9 1.9 1.8 0.9 0.8 0.5 0.7 0.9 1.2
Population and MigrationPopulation (Ths.) 39056.7 39144.8 39233.9 39324.3 39415.1 39506.8 39599.2 39692.3 39786.9 39883.1 39980.9 40079.5
(%Ch) 0.9 0.9 0.9 0.9 0.9 0.9 0.9 0.9 0.9 1.0 1.0 1.0Net Migration (Ths.) 27.2 27.1 27.0 26.8 25.8 25.2 24.5 23.7 23.8 23.9 24.1 24.3
HousingHousing Starts Tot. Private (Annual Rate, Ths.) 83.5 106.1 94.8 80.9 87.4 96.4 103.4 114.1 121.6 129.7 134.6 139.6
Housing Starts Single Family 42.2 49.2 46.8 46.8 45.9 53.5 61.3 65.8 70.5 77.3 81.8 85.2Housing Starts Multi-Family 41.3 56.9 48.1 34.1 41.5 42.8 42.1 48.3 51.1 52.4 52.8 54.4
Consumer Prices(%Ch) 1.0 1.4 1.3 1.7 1.7 1.0 0.9 1.5 1.9 2.3 2.5 2.1
* Real personal income and real per capita income are adjusted for inflation and regional purchasing power parities. This facilitates interregional comparisons of income that control for the cost of living.
Center for Business and Policy Research 13
CALIFORNIA TABLES
Table 2. Quarterly Summary
2018Q1 2018Q2 2018Q3 2018Q4 2019Q1 2019Q2 2019Q3 2019Q4 2020Q1 2020Q2 2020Q3 2020Q4
Personal Income and Gross State ProductPersonal Income (Bil. $) 2333.5 2362.0 2391.2 2421.7 2454.8 2484.8 2514.1 2543.8 2577.6 2609.9 2641.2 2672.2
Calif. (%Ch) 5.5 5.3 5.3 5.3 5.2 5.2 5.1 5.0 5.0 5.0 5.1 5.0Real Personal Income (Bil. $) 1833.1 1844.8 1857.1 1870.3 1885.7 1898.5 1910.5 1922.5 1937.4 1950.8 1963.6 1975.5
(%Ch) 3.3 3.1 3.1 3.0 2.9 2.9 2.9 2.8 2.7 2.8 2.8 2.8Real Disposable Income (Bil. $) 1568.8 1579.6 1591.1 1603.4 1618.3 1629.7 1639.5 1648.9 1660.6 1670.6 1679.6 1688.9
(%Ch) 3.6 3.4 3.5 3.3 3.2 3.2 3.0 2.8 2.6 2.5 2.4 2.4Gross State Product (Bil. $) 2731.7 2766.8 2803.4 2830.1 2866.7 2899.5 2934.2 2963.9 2997.7 3024.8 3081.9 3108.4
Calif. (%Ch) 5.3 5.2 5.1 5.1 4.9 4.8 4.7 4.7 4.6 4.3 5.0 4.9Real GSP (Bil. 2009$) 2347.9 2365.5 2385.8 2396.4 2415.3 2430.9 2448.0 2460.7 2474.7 2485.2 2519.4 2528.3
Calif. (%Ch) 3.3 3.1 3.1 3.0 2.9 2.8 2.6 2.7 2.5 2.2 2.9 2.7
Employment and Labor Force (Household Survey % Change)Employment 1.3 1.2 1.2 1.1 1.0 1.0 0.9 0.8 0.8 0.9 0.9 0.9Labor Force 1.2 1.2 1.2 1.2 1.2 1.2 1.2 1.1 1.0 1.0 1.0 0.9CA Unemployment Rate (%) 5.3 5.3 5.3 5.4 5.5 5.6 5.6 5.7 5.7 5.7 5.7 5.7
Non-farm Employment (Payroll Survey % Change)Total Non-farm California 1.3 1.1 1.1 1.0 1.0 0.9 0.9 0.9 0.9 1.1 1.1 1.1Mining 4.5 4.8 4.5 4.5 4.6 3.9 3.5 3.2 2.5 2.2 1.9 1.4Construction 4.6 4.5 4.3 4.0 3.7 3.4 3.1 3.1 3.0 3.0 3.2 3.1Manufacturing 0.8 0.7 0.7 0.7 0.6 0.4 0.3 0.2 0.2 0.3 0.4 0.5 Nondurable Goods -0.2 -0.2 -0.1 0.0 0.1 0.0 0.0 0.0 0.0 -0.1 0.0 0.0 Durable Goods 1.4 1.3 1.2 1.1 0.9 0.7 0.5 0.3 0.4 0.5 0.7 0.7Trans. Warehs. & Utility 2.4 2.2 1.9 1.7 1.5 1.1 0.8 0.7 0.7 0.5 0.5 0.4Wholesale Trade 1.2 1.2 1.2 1.3 1.5 1.4 1.4 1.4 1.4 1.3 1.3 1.3Retail Trade -0.5 -0.9 -1.3 -1.4 -1.3 -1.1 -0.8 -0.5 -0.4 -0.2 -0.2 -0.1Financial Activities -1.7 -1.8 -2.1 -2.2 -2.0 -1.5 -0.9 -0.5 -0.2 -0.3 -0.3 -0.2Prof. and Business Services 3.0 2.7 2.3 1.7 1.3 1.0 1.1 1.5 1.8 2.0 2.2 2.4Edu. & Health Services 1.4 1.1 1.2 1.3 1.4 1.3 1.3 1.2 1.1 1.0 1.1 1.0Leisure & Hospitality 1.4 1.3 1.2 1.3 1.2 1.1 0.8 0.6 0.7 0.7 0.7 0.8Information 0.4 0.1 0.9 1.5 1.6 1.9 1.6 1.1 1.0 0.9 1.3 1.7Federal Gov't. -1.9 -1.9 -1.8 -1.7 -1.6 -1.6 -1.7 -1.6 -0.5 14.5 5.6 -0.1State & Local Gov't. 1.4 1.6 1.7 1.8 1.9 1.8 1.6 1.4 1.2 1.0 1.0 1.0
Population and MigrationPopulation (Ths.) 40178.6 40278.3 40377.9 40477.5 40577.2 40676.9 40776.3 40875.7 40974.6 41073.3 41171.5 41269.0
(%Ch) 1.0 1.0 1.0 1.0 1.0 1.0 1.0 1.0 1.0 1.0 1.0 1.0Net Migration (Ths.) 24.4 24.4 24.4 24.6 24.8 24.9 24.7 24.8 24.6 24.4 24.1 23.7
HousingHousing Starts Tot. Private (Annual Rate, Ths.) 143.9 145.7 148.7 150.8 152.9 154.5 157.5 160.0 161.6 162.4 163.6 164.0
Housing Starts Single Family 87.9 89.9 91.1 90.7 90.9 92.1 94.2 95.1 96.1 96.4 96.3 95.9Housing Starts Multi-Family 56.0 55.9 57.5 60.1 62.0 62.4 63.3 64.8 65.5 66.1 67.3 68.0
Consumer Prices(%Ch) 2.5 2.5 2.4 2.7 2.6 2.5 2.5 2.5 2.5 2.6 2.6 2.6
* Real personal income and real per capita income are adjusted for inflation and regional purchasing power parities. This facilitates interregional comparisons of income that control for the cost of living.
14 California & Metro Forecast May 2016
CALIFORNIA TABLES
Table 3. Employment Quarterly2015Q1 2015Q2 2015Q3 2015Q4 2016Q1 2016Q2 2016Q3 2016Q4 2017Q1 2017Q2 2017Q3 2017Q4
California Payroll Employment (Thousands)Total Nonfarm 15862.1 15965.6 16146.9 16232.6 16296.2 16371.3 16452.5 16537.8 16603.4 16668.9 16723.5 16773.4Manufacturing 1288.9 1292.5 1296.8 1290.6 1285.6 1282.8 1282.8 1288.3 1289.0 1291.7 1294.4 1297.4 Durable Goods 807.2 810.0 813.5 811.4 807.2 804.2 804.2 808.5 808.9 811.8 814.9 818.1 Wood Products 22.1 22.3 22.7 22.6 22.7 22.4 22.4 22.6 22.9 23.3 23.6 24.0 Computer & Electronics 264.7 266.2 266.8 266.9 266.4 266.0 266.9 269.1 270.1 272.7 275.5 278.0 Transportation Equipment 115.4 115.6 117.2 116.4 116.2 115.9 115.8 115.8 115.3 114.9 114.5 114.2 Nondurables 481.7 482.5 483.3 479.2 478.4 478.6 478.6 479.8 480.1 479.9 479.5 479.3 Foods 154.5 155.4 156.0 152.9 151.6 152.0 152.1 153.0 153.6 154.0 154.4 154.7Non-Manufacturing 14573.2 14673.0 14850.1 14942.0 15010.5 15088.5 15169.7 15249.5 15314.4 15377.2 15429.1 15476.0Mining 30.4 29.5 28.3 27.7 26.3 25.3 24.4 24.3 24.4 24.7 25.0 25.3Construction 707.9 720.5 735.7 742.3 753.7 760.4 768.0 776.4 783.9 792.9 802.7 811.5Transportation, Warehouse & Util. 542.4 548.3 560.3 562.8 559.0 560.1 560.8 564.6 568.0 572.6 576.7 579.6Wholesale Trade 714.5 717.1 723.4 728.4 731.8 734.7 737.9 741.7 744.4 747.3 749.9 751.6Retail Trade 1650.9 1657.4 1671.4 1673.8 1683.9 1697.4 1709.2 1718.7 1722.1 1722.5 1721.9 1718.6Information 475.4 482.6 486.5 485.5 494.2 492.7 498.6 502.0 503.6 505.1 503.7 504.5Prof. & Bus. Services 2461.8 2477.8 2508.0 2537.6 2531.2 2550.3 2571.3 2604.9 2637.6 2661.6 2681.1 2698.4 Admin. & Support 1046.1 1048.0 1060.3 1081.1 1066.7 1076.0 1086.6 1111.9 1142.1 1165.5 1184.3 1199.5 Prof. Sci. & Tech. 1187.1 1199.6 1217.1 1225.9 1231.3 1240.5 1250.2 1258.3 1260.7 1261.6 1262.4 1264.9 Mgmt. of Co. 228.6 230.2 230.6 230.6 233.2 233.8 234.5 234.7 234.8 234.6 234.4 234.0Financial Activities 790.2 795.5 802.2 804.4 800.0 805.2 811.0 808.5 804.3 800.8 798.0 794.5 Real Estate & Rent 268.5 270.4 273.1 275.6 274.0 275.1 276.3 277.6 278.5 279.0 279.3 279.8 Finance & Insurance 521.7 525.1 529.0 528.9 525.9 530.1 534.6 530.9 525.8 521.8 518.7 514.7Education & Health Service 2413.7 2436.1 2479.7 2493.9 2515.4 2533.4 2547.9 2560.2 2569.8 2583.6 2588.0 2596.3 Education Services 342.0 343.2 350.8 349.2 358.0 360.1 359.0 357.6 356.5 356.1 355.3 355.2 Health Services 2071.7 2092.9 2128.9 2144.8 2157.4 2173.4 2188.9 2202.6 2213.3 2227.5 2232.7 2241.1Leisure & Hospitality 1802.6 1816.8 1835.1 1858.5 1878.5 1889.8 1899.4 1907.1 1914.9 1921.7 1931.4 1937.6Other Services 540.4 543.0 548.2 549.6 549.5 549.8 549.1 547.5 545.3 543.4 542.7 542.2Government 2442.8 2448.6 2471.3 2477.5 2487.2 2489.3 2492.3 2493.6 2496.1 2500.9 2508.0 2516.1 Federal Gov't. 243.2 244.1 244.8 245.5 245.7 245.5 245.0 244.2 243.1 242.1 240.9 239.6 State & Local Gov't. 2199.6 2204.5 2226.5 2232.0 2241.5 2243.8 2247.4 2249.4 2253.0 2258.8 2267.2 2276.5
Center for Business and Policy Research 15
CALIFORNIA TABLES
Table 3. Employment Quarterly2018Q1 2018Q2 2018Q3 2018Q4 2019Q1 2019Q2 2019Q3 2019Q4 2020Q1 2020Q2 2020Q3 2020Q4
California Payroll Employment (Thousands)Total Nonfarm 16815.7 16860.5 16903.6 16941.0 16977.7 17011.1 17050.0 17089.6 17134.3 17204.5 17236.1 17271.7Manufacturing 1299.3 1301.4 1303.6 1306.4 1307.3 1307.2 1307.6 1308.5 1310.3 1311.0 1312.8 1314.5 Durable Goods 820.2 822.3 824.5 827.0 827.9 827.9 828.4 829.3 831.0 832.0 833.8 835.5 Wood Products 24.4 24.7 25.0 25.3 25.4 25.5 25.6 25.8 26.0 26.4 26.7 27.0 Computer & Electronics 279.6 280.8 281.9 282.8 282.7 282.8 283.2 283.7 284.5 284.6 284.9 285.3 Transportation Equipment 113.9 113.7 113.4 112.9 112.2 111.5 110.6 110.0 109.4 109.0 108.6 108.0 Nondurables 479.1 479.0 479.2 479.4 479.4 479.3 479.2 479.2 479.2 479.0 479.1 479.0 Foods 155.2 155.6 156.0 156.4 156.6 156.9 157.1 157.4 157.9 158.3 158.8 159.2Non-Manufacturing 15516.4 15559.1 15599.9 15634.5 15670.5 15703.9 15742.3 15781.0 15824.0 15893.5 15923.2 15957.2Mining 25.5 25.9 26.2 26.5 26.7 26.9 27.1 27.3 27.4 27.5 27.6 27.7Construction 819.9 828.2 837.2 844.0 850.1 856.3 863.0 869.9 875.9 882.2 890.6 896.7Transportation, Warehouse & Util. 581.8 585.1 587.8 589.2 590.3 591.3 592.3 593.4 594.4 594.6 595.2 595.9Wholesale Trade 753.6 756.5 759.2 761.7 764.6 767.2 769.7 772.1 775.1 777.0 779.5 781.9Retail Trade 1712.7 1706.3 1699.8 1694.4 1690.4 1687.3 1686.4 1685.3 1684.3 1684.2 1683.7 1684.1Information 505.5 505.5 508.0 511.8 513.7 515.3 516.2 517.4 519.1 520.0 522.8 525.9Prof. & Bus. Services 2716.3 2732.4 2741.7 2744.0 2751.5 2760.1 2772.9 2785.7 2799.8 2815.0 2834.3 2853.6 Admin. & Support 1214.9 1231.0 1240.6 1244.3 1248.1 1254.4 1264.2 1273.8 1283.0 1291.8 1302.9 1314.3 Prof. Sci. & Tech. 1267.7 1268.3 1268.3 1267.1 1271.2 1274.4 1277.9 1281.8 1287.1 1294.1 1302.8 1311.4 Mgmt. of Co. 233.8 233.1 232.9 232.6 232.2 231.4 230.8 230.1 229.7 229.1 228.7 227.9Financial Activities 790.6 786.1 781.4 777.3 775.0 774.3 774.2 773.7 773.6 771.9 771.9 771.8 Real Estate & Rent 280.0 280.3 280.6 280.9 281.0 280.9 280.7 280.7 280.8 280.7 280.7 280.6 Finance & Insurance 510.6 505.8 500.8 496.5 494.0 493.5 493.5 493.0 492.7 491.2 491.2 491.2Education & Health Service 2604.5 2612.3 2619.4 2629.1 2640.7 2647.4 2653.3 2660.9 2669.9 2673.7 2681.7 2688.9 Education Services 356.0 356.3 356.7 356.6 356.4 355.9 355.4 354.7 354.1 352.5 351.5 350.2 Health Services 2248.6 2256.0 2262.7 2272.5 2284.2 2291.5 2297.9 2306.2 2315.8 2321.1 2330.2 2338.7Leisure & Hospitality 1941.0 1946.1 1954.9 1962.2 1963.8 1967.1 1971.1 1974.7 1976.9 1980.5 1985.4 1989.6Other Services 542.1 541.6 541.5 541.5 541.5 541.0 540.4 540.0 539.7 539.1 538.7 538.4Government 2522.8 2533.1 2543.1 2552.8 2562.2 2569.8 2575.7 2580.7 2588.1 2628.0 2611.8 2602.9 Federal Gov't. 238.5 237.4 236.5 235.5 234.5 233.5 232.5 231.6 233.4 267.4 245.6 231.5 State & Local Gov't. 2284.4 2295.7 2306.6 2317.3 2327.6 2336.2 2343.1 2349.1 2354.7 2360.6 2366.2 2371.5
16 California & Metro Forecast May 2016
CALIFORNIA TABLES
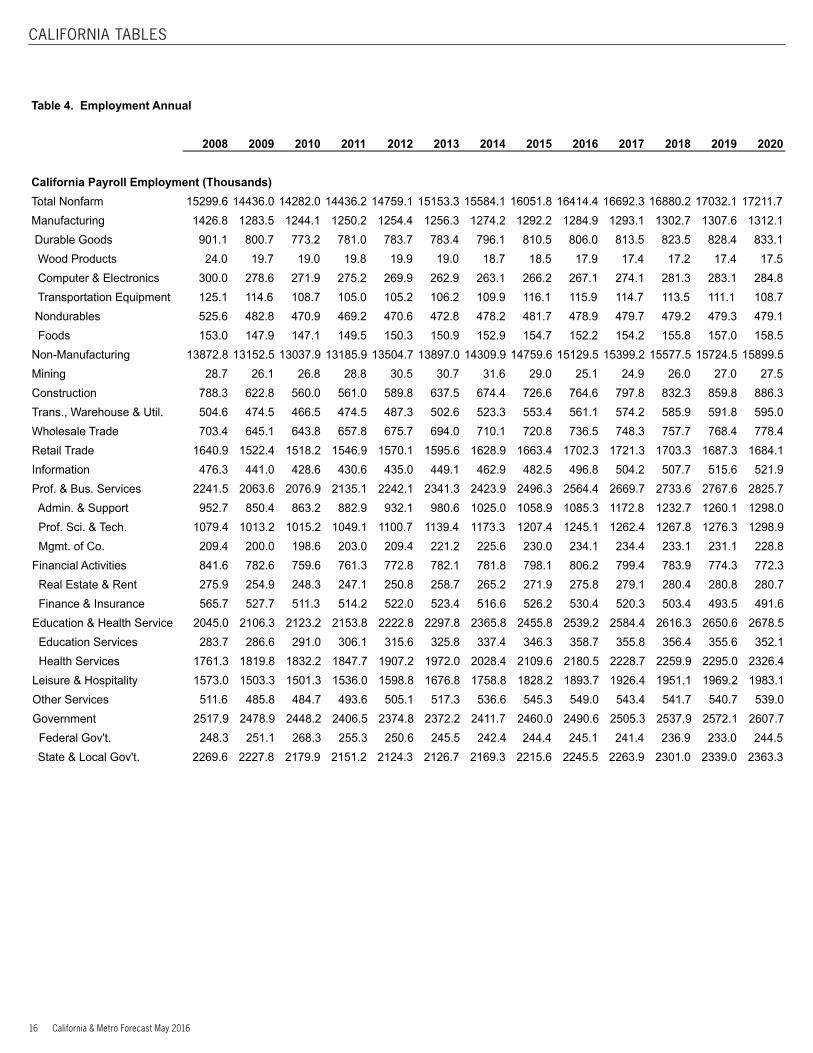
Table 4. Employment Annual
2008 2009 2010 2011 2012 2013 2014 2015 2016 2017 2018 2019 2020
California Payroll Employment (Thousands)Total Nonfarm 15299.6 14436.0 14282.0 14436.2 14759.1 15153.3 15584.1 16051.8 16414.4 16692.3 16880.2 17032.1 17211.7Manufacturing 1426.8 1283.5 1244.1 1250.2 1254.4 1256.3 1274.2 1292.2 1284.9 1293.1 1302.7 1307.6 1312.1 Durable Goods 901.1 800.7 773.2 781.0 783.7 783.4 796.1 810.5 806.0 813.5 823.5 828.4 833.1 Wood Products 24.0 19.7 19.0 19.8 19.9 19.0 18.7 18.5 17.9 17.4 17.2 17.4 17.5 Computer & Electronics 300.0 278.6 271.9 275.2 269.9 262.9 263.1 266.2 267.1 274.1 281.3 283.1 284.8 Transportation Equipment 125.1 114.6 108.7 105.0 105.2 106.2 109.9 116.1 115.9 114.7 113.5 111.1 108.7 Nondurables 525.6 482.8 470.9 469.2 470.6 472.8 478.2 481.7 478.9 479.7 479.2 479.3 479.1 Foods 153.0 147.9 147.1 149.5 150.3 150.9 152.9 154.7 152.2 154.2 155.8 157.0 158.5Non-Manufacturing 13872.8 13152.5 13037.9 13185.9 13504.7 13897.0 14309.9 14759.6 15129.5 15399.2 15577.5 15724.5 15899.5Mining 28.7 26.1 26.8 28.8 30.5 30.7 31.6 29.0 25.1 24.9 26.0 27.0 27.5Construction 788.3 622.8 560.0 561.0 589.8 637.5 674.4 726.6 764.6 797.8 832.3 859.8 886.3Trans., Warehouse & Util. 504.6 474.5 466.5 474.5 487.3 502.6 523.3 553.4 561.1 574.2 585.9 591.8 595.0Wholesale Trade 703.4 645.1 643.8 657.8 675.7 694.0 710.1 720.8 736.5 748.3 757.7 768.4 778.4Retail Trade 1640.9 1522.4 1518.2 1546.9 1570.1 1595.6 1628.9 1663.4 1702.3 1721.3 1703.3 1687.3 1684.1Information 476.3 441.0 428.6 430.6 435.0 449.1 462.9 482.5 496.8 504.2 507.7 515.6 521.9Prof. & Bus. Services 2241.5 2063.6 2076.9 2135.1 2242.1 2341.3 2423.9 2496.3 2564.4 2669.7 2733.6 2767.6 2825.7 Admin. & Support 952.7 850.4 863.2 882.9 932.1 980.6 1025.0 1058.9 1085.3 1172.8 1232.7 1260.1 1298.0 Prof. Sci. & Tech. 1079.4 1013.2 1015.2 1049.1 1100.7 1139.4 1173.3 1207.4 1245.1 1262.4 1267.8 1276.3 1298.9 Mgmt. of Co. 209.4 200.0 198.6 203.0 209.4 221.2 225.6 230.0 234.1 234.4 233.1 231.1 228.8Financial Activities 841.6 782.6 759.6 761.3 772.8 782.1 781.8 798.1 806.2 799.4 783.9 774.3 772.3 Real Estate & Rent 275.9 254.9 248.3 247.1 250.8 258.7 265.2 271.9 275.8 279.1 280.4 280.8 280.7 Finance & Insurance 565.7 527.7 511.3 514.2 522.0 523.4 516.6 526.2 530.4 520.3 503.4 493.5 491.6Education & Health Service 2045.0 2106.3 2123.2 2153.8 2222.8 2297.8 2365.8 2455.8 2539.2 2584.4 2616.3 2650.6 2678.5 Education Services 283.7 286.6 291.0 306.1 315.6 325.8 337.4 346.3 358.7 355.8 356.4 355.6 352.1 Health Services 1761.3 1819.8 1832.2 1847.7 1907.2 1972.0 2028.4 2109.6 2180.5 2228.7 2259.9 2295.0 2326.4Leisure & Hospitality 1573.0 1503.3 1501.3 1536.0 1598.8 1676.8 1758.8 1828.2 1893.7 1926.4 1951.1 1969.2 1983.1Other Services 511.6 485.8 484.7 493.6 505.1 517.3 536.6 545.3 549.0 543.4 541.7 540.7 539.0Government 2517.9 2478.9 2448.2 2406.5 2374.8 2372.2 2411.7 2460.0 2490.6 2505.3 2537.9 2572.1 2607.7 Federal Gov't. 248.3 251.1 268.3 255.3 250.6 245.5 242.4 244.4 245.1 241.4 236.9 233.0 244.5 State & Local Gov't. 2269.6 2227.8 2179.9 2151.2 2124.3 2126.7 2169.3 2215.6 2245.5 2263.9 2301.0 2339.0 2363.3
Center for Business and Policy Research 17
CALIFORNIA TABLES
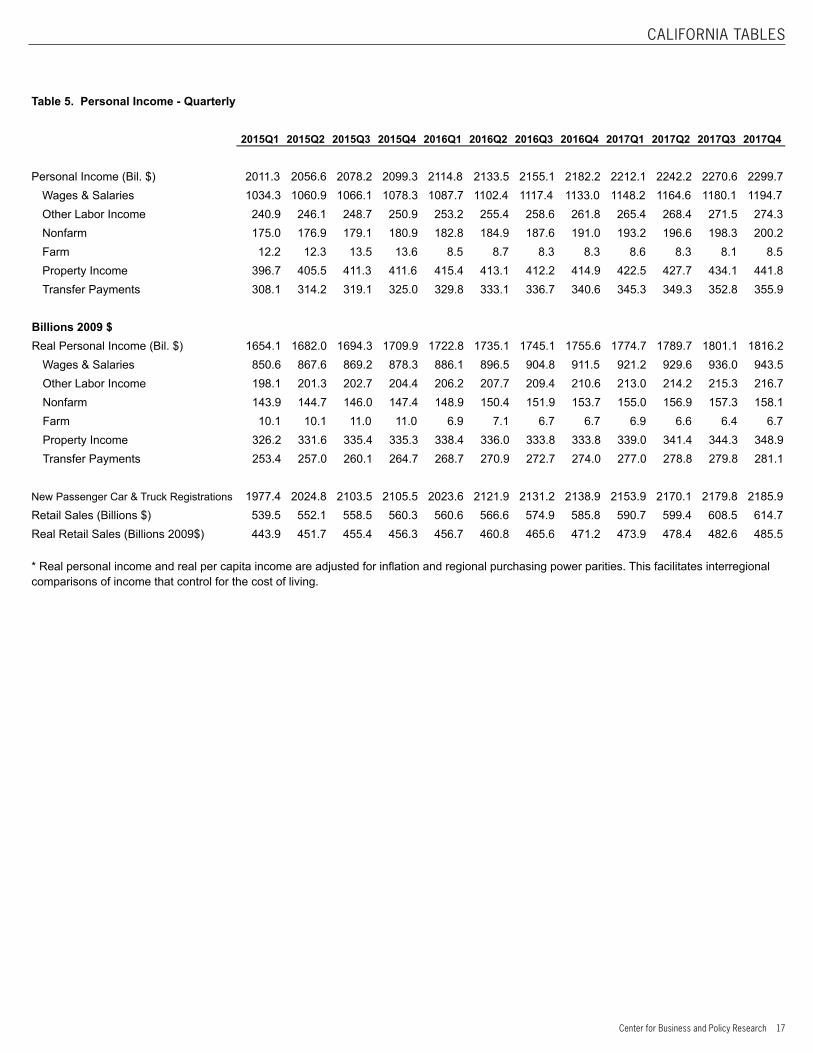
Table 5. Personal Income - Quarterly
2015Q1 2015Q2 2015Q3 2015Q4 2016Q1 2016Q2 2016Q3 2016Q4 2017Q1 2017Q2 2017Q3 2017Q4
Personal Income (Bil. $) 2011.3 2056.6 2078.2 2099.3 2114.8 2133.5 2155.1 2182.2 2212.1 2242.2 2270.6 2299.7Wages & Salaries 1034.3 1060.9 1066.1 1078.3 1087.7 1102.4 1117.4 1133.0 1148.2 1164.6 1180.1 1194.7Other Labor Income 240.9 246.1 248.7 250.9 253.2 255.4 258.6 261.8 265.4 268.4 271.5 274.3Nonfarm 175.0 176.9 179.1 180.9 182.8 184.9 187.6 191.0 193.2 196.6 198.3 200.2Farm 12.2 12.3 13.5 13.6 8.5 8.7 8.3 8.3 8.6 8.3 8.1 8.5Property Income 396.7 405.5 411.3 411.6 415.4 413.1 412.2 414.9 422.5 427.7 434.1 441.8Transfer Payments 308.1 314.2 319.1 325.0 329.8 333.1 336.7 340.6 345.3 349.3 352.8 355.9
Billions 2009 $Real Personal Income (Bil. $) 1654.1 1682.0 1694.3 1709.9 1722.8 1735.1 1745.1 1755.6 1774.7 1789.7 1801.1 1816.2
Wages & Salaries 850.6 867.6 869.2 878.3 886.1 896.5 904.8 911.5 921.2 929.6 936.0 943.5Other Labor Income 198.1 201.3 202.7 204.4 206.2 207.7 209.4 210.6 213.0 214.2 215.3 216.7Nonfarm 143.9 144.7 146.0 147.4 148.9 150.4 151.9 153.7 155.0 156.9 157.3 158.1Farm 10.1 10.1 11.0 11.0 6.9 7.1 6.7 6.7 6.9 6.6 6.4 6.7Property Income 326.2 331.6 335.4 335.3 338.4 336.0 333.8 333.8 339.0 341.4 344.3 348.9Transfer Payments 253.4 257.0 260.1 264.7 268.7 270.9 272.7 274.0 277.0 278.8 279.8 281.1
New Passenger Car & Truck Registrations 1977.4 2024.8 2103.5 2105.5 2023.6 2121.9 2131.2 2138.9 2153.9 2170.1 2179.8 2185.9Retail Sales (Billions $) 539.5 552.1 558.5 560.3 560.6 566.6 574.9 585.8 590.7 599.4 608.5 614.7Real Retail Sales (Billions 2009$) 443.9 451.7 455.4 456.3 456.7 460.8 465.6 471.2 473.9 478.4 482.6 485.5
* Real personal income and real per capita income are adjusted for inflation and regional purchasing power parities. This facilitates interregional comparisons of income that control for the cost of living.
18 California & Metro Forecast May 2016
CALIFORNIA TABLES
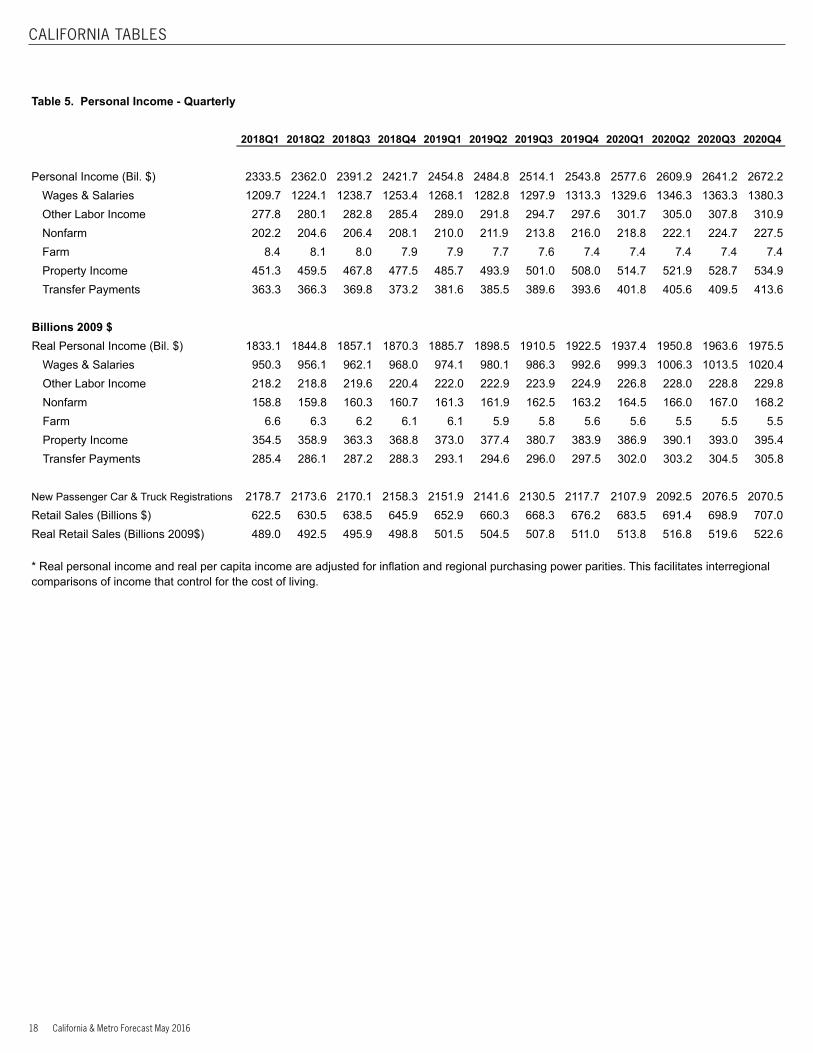
Table 5. Personal Income - Quarterly
2018Q1 2018Q2 2018Q3 2018Q4 2019Q1 2019Q2 2019Q3 2019Q4 2020Q1 2020Q2 2020Q3 2020Q4
Personal Income (Bil. $) 2333.5 2362.0 2391.2 2421.7 2454.8 2484.8 2514.1 2543.8 2577.6 2609.9 2641.2 2672.2Wages & Salaries 1209.7 1224.1 1238.7 1253.4 1268.1 1282.8 1297.9 1313.3 1329.6 1346.3 1363.3 1380.3Other Labor Income 277.8 280.1 282.8 285.4 289.0 291.8 294.7 297.6 301.7 305.0 307.8 310.9Nonfarm 202.2 204.6 206.4 208.1 210.0 211.9 213.8 216.0 218.8 222.1 224.7 227.5Farm 8.4 8.1 8.0 7.9 7.9 7.7 7.6 7.4 7.4 7.4 7.4 7.4Property Income 451.3 459.5 467.8 477.5 485.7 493.9 501.0 508.0 514.7 521.9 528.7 534.9Transfer Payments 363.3 366.3 369.8 373.2 381.6 385.5 389.6 393.6 401.8 405.6 409.5 413.6
Billions 2009 $Real Personal Income (Bil. $) 1833.1 1844.8 1857.1 1870.3 1885.7 1898.5 1910.5 1922.5 1937.4 1950.8 1963.6 1975.5
Wages & Salaries 950.3 956.1 962.1 968.0 974.1 980.1 986.3 992.6 999.3 1006.3 1013.5 1020.4Other Labor Income 218.2 218.8 219.6 220.4 222.0 222.9 223.9 224.9 226.8 228.0 228.8 229.8Nonfarm 158.8 159.8 160.3 160.7 161.3 161.9 162.5 163.2 164.5 166.0 167.0 168.2Farm 6.6 6.3 6.2 6.1 6.1 5.9 5.8 5.6 5.6 5.5 5.5 5.5Property Income 354.5 358.9 363.3 368.8 373.0 377.4 380.7 383.9 386.9 390.1 393.0 395.4Transfer Payments 285.4 286.1 287.2 288.3 293.1 294.6 296.0 297.5 302.0 303.2 304.5 305.8
New Passenger Car & Truck Registrations 2178.7 2173.6 2170.1 2158.3 2151.9 2141.6 2130.5 2117.7 2107.9 2092.5 2076.5 2070.5Retail Sales (Billions $) 622.5 630.5 638.5 645.9 652.9 660.3 668.3 676.2 683.5 691.4 698.9 707.0Real Retail Sales (Billions 2009$) 489.0 492.5 495.9 498.8 501.5 504.5 507.8 511.0 513.8 516.8 519.6 522.6
* Real personal income and real per capita income are adjusted for inflation and regional purchasing power parities. This facilitates interregional comparisons of income that control for the cost of living.
Center for Business and Policy Research 19
CALIFORNIA TABLES
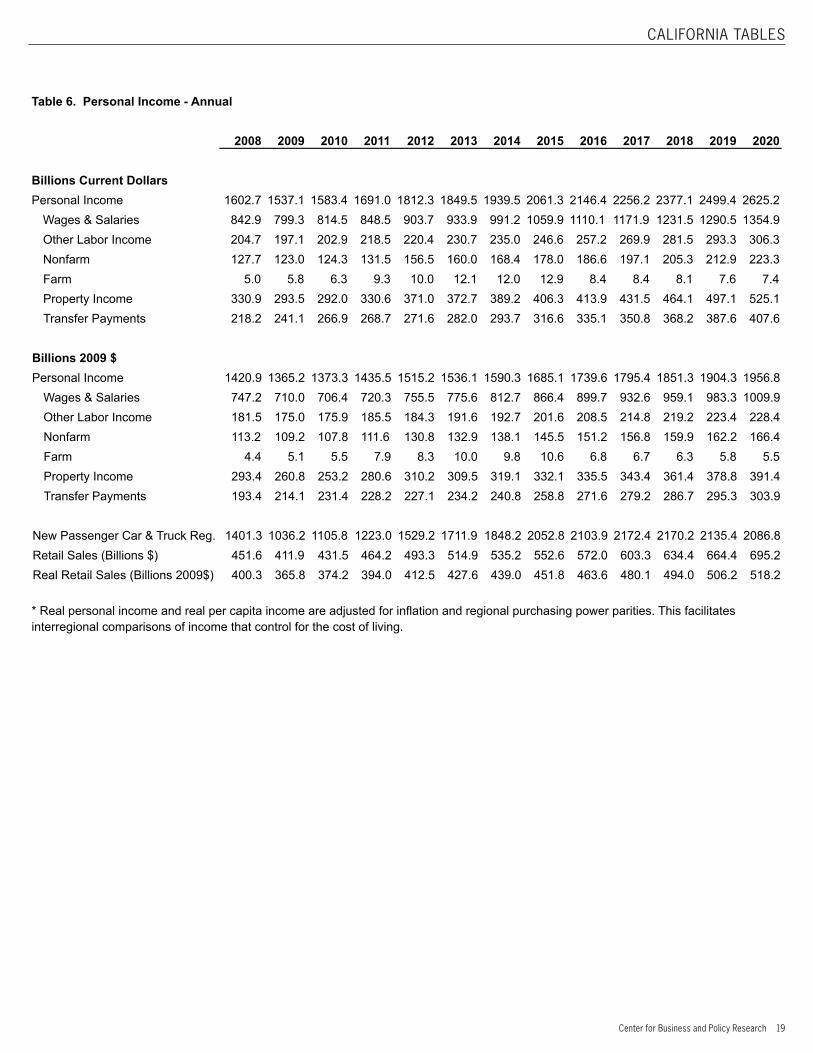
Table 6. Personal Income - Annual
2008 2009 2010 2011 2012 2013 2014 2015 2016 2017 2018 2019 2020
Billions Current DollarsPersonal Income 1602.7 1537.1 1583.4 1691.0 1812.3 1849.5 1939.5 2061.3 2146.4 2256.2 2377.1 2499.4 2625.2
Wages & Salaries 842.9 799.3 814.5 848.5 903.7 933.9 991.2 1059.9 1110.1 1171.9 1231.5 1290.5 1354.9Other Labor Income 204.7 197.1 202.9 218.5 220.4 230.7 235.0 246.6 257.2 269.9 281.5 293.3 306.3Nonfarm 127.7 123.0 124.3 131.5 156.5 160.0 168.4 178.0 186.6 197.1 205.3 212.9 223.3Farm 5.0 5.8 6.3 9.3 10.0 12.1 12.0 12.9 8.4 8.4 8.1 7.6 7.4Property Income 330.9 293.5 292.0 330.6 371.0 372.7 389.2 406.3 413.9 431.5 464.1 497.1 525.1Transfer Payments 218.2 241.1 266.9 268.7 271.6 282.0 293.7 316.6 335.1 350.8 368.2 387.6 407.6
Billions 2009 $Personal Income 1420.9 1365.2 1373.3 1435.5 1515.2 1536.1 1590.3 1685.1 1739.6 1795.4 1851.3 1904.3 1956.8
Wages & Salaries 747.2 710.0 706.4 720.3 755.5 775.6 812.7 866.4 899.7 932.6 959.1 983.3 1009.9Other Labor Income 181.5 175.0 175.9 185.5 184.3 191.6 192.7 201.6 208.5 214.8 219.2 223.4 228.4Nonfarm 113.2 109.2 107.8 111.6 130.8 132.9 138.1 145.5 151.2 156.8 159.9 162.2 166.4Farm 4.4 5.1 5.5 7.9 8.3 10.0 9.8 10.6 6.8 6.7 6.3 5.8 5.5Property Income 293.4 260.8 253.2 280.6 310.2 309.5 319.1 332.1 335.5 343.4 361.4 378.8 391.4Transfer Payments 193.4 214.1 231.4 228.2 227.1 234.2 240.8 258.8 271.6 279.2 286.7 295.3 303.9
New Passenger Car & Truck Reg. 1401.3 1036.2 1105.8 1223.0 1529.2 1711.9 1848.2 2052.8 2103.9 2172.4 2170.2 2135.4 2086.8Retail Sales (Billions $) 451.6 411.9 431.5 464.2 493.3 514.9 535.2 552.6 572.0 603.3 634.4 664.4 695.2Real Retail Sales (Billions 2009$) 400.3 365.8 374.2 394.0 412.5 427.6 439.0 451.8 463.6 480.1 494.0 506.2 518.2
* Real personal income and real per capita income are adjusted for inflation and regional purchasing power parities. This facilitates interregional comparisons of income that control for the cost of living.

CH
ART
S
Center for Business and Policy Research 21
CALIFORNIA CHARTS
-8%
-6%
-4%
-2%
0%
2%
4%
6%
8%
10%
2002 2003 2004 2005 2006 2007 2008 2009 2010 2011 2012 2013 2014 2015 2016 2017 2018 2019 2020
California Real Personal Income(percent change from one year ago)
-8%
-6%
-4%
-2%
0%
2%
4%
6%
8%
10%
2002 2003 2004 2005 2006 2007 2008 2009 2010 2011 2012 2013 2014 2015 2016 2017 2018 2019 2020
California Real Gross State Product(percent change from one year ago)
0%
2%
4%
6%
8%
10%
12%
14%
2002 2003 2004 2005 2006 2007 2008 2009 2010 2011 2012 2013 2014 2015 2016 2017 2018 2019 2020
California Unemployment Rates(percent)
22 California & Metro Forecast May 2016
CALIFORNIA CHARTS
13,000
13,500
14,000
14,500
15,000
15,500
16,000
16,500
17,000
17,500
2002 2003 2004 2005 2006 2007 2008 2009 2010 2011 2012 2013 2014 2015 2016 2017 2018 2019 2020
California Total Nonfarm Employment(Thousands)
300
400
500
600
700
800
900
1,000
2002 2003 2004 2005 2006 2007 2008 2009 2010 2011 2012 2013 2014 2015 2016 2017 2018 2019 2020
California Construction Employment (Thouands)
1,000
1,100
1,200
1,300
1,400
1,500
1,600
1,700
2002 2003 2004 2005 2006 2007 2008 2009 2010 2011 2012 2013 2014 2015 2016 2017 2018 2019 2020
California Manufacturing Employment (Thousands)
Center for Business and Policy Research 23
CALIFORNIA CHARTS
0
100
200
300
400
500
600
700
2002 2003 2004 2005 2006 2007 2008 2009 2010 2011 2012 2013 2014 2015 2016 2017 2018 2019 2020
California Trade, Transportation, and Utilities Employment (Thousands)
700
750
800
850
900
950
1,000
2002 2003 2004 2005 2006 2007 2008 2009 2010 2011 2012 2013 2014 2015 2016 2017 2018 2019 2020
California Financial Activities Employment (Thouands)
1,700
1,900
2,100
2,300
2,500
2,700
2,900
3,100
2002 2003 2004 2005 2006 2007 2008 2009 2010 2011 2012 2013 2014 2015 2016 2017 2018 2019 2020
California Professional and Business Employment (Thousands)
24 California & Metro Forecast May 2016
CALIFORNIA CHARTS
1,300
1,500
1,700
1,900
2,100
2,300
2,500
2,700
2,900
2002 2003 2004 2005 2006 2007 2008 2009 2010 2011 2012 2013 2014 2015 2016 2017 2018 2019 2020
California Education and Health Services Employment (Thousands)
300
350
400
450
500
550
2002 2003 2004 2005 2006 2007 2008 2009 2010 2011 2012 2013 2014 2015 2016 2017 2018 2019 2020
California Information Employment (Thousands)
1,500
1,600
1,700
1,800
1,900
2,000
2,100
2,200
2,300
2,400
2,500
2002 2003 2004 2005 2006 2007 2008 2009 2010 2011 2012 2013 2014 2015 2016 2017 2018 2019 2020
California State and Local Government Employment (Thousands)
Center for Business and Policy Research 25
CALIFORNIA CHARTS
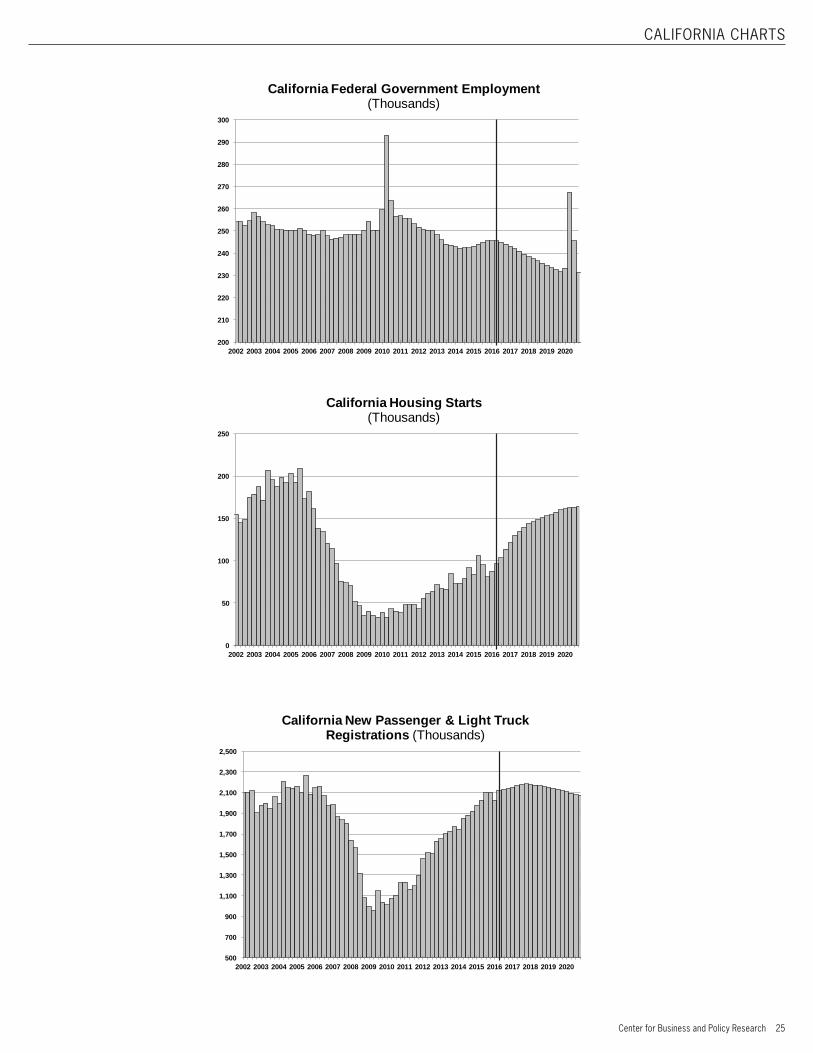
200
210
220
230
240
250
260
270
280
290
300
2002 2003 2004 2005 2006 2007 2008 2009 2010 2011 2012 2013 2014 2015 2016 2017 2018 2019 2020
California Federal Government Employment (Thousands)
0
50
100
150
200
250
2002 2003 2004 2005 2006 2007 2008 2009 2010 2011 2012 2013 2014 2015 2016 2017 2018 2019 2020
California Housing Starts (Thousands)
500
700
900
1,100
1,300
1,500
1,700
1,900
2,100
2,300
2,500
2002 2003 2004 2005 2006 2007 2008 2009 2010 2011 2012 2013 2014 2015 2016 2017 2018 2019 2020
California New Passenger & Light Truck Registrations (Thousands)

MET
ROS
Center for Business and Policy Research 27
F r e s n o M S A
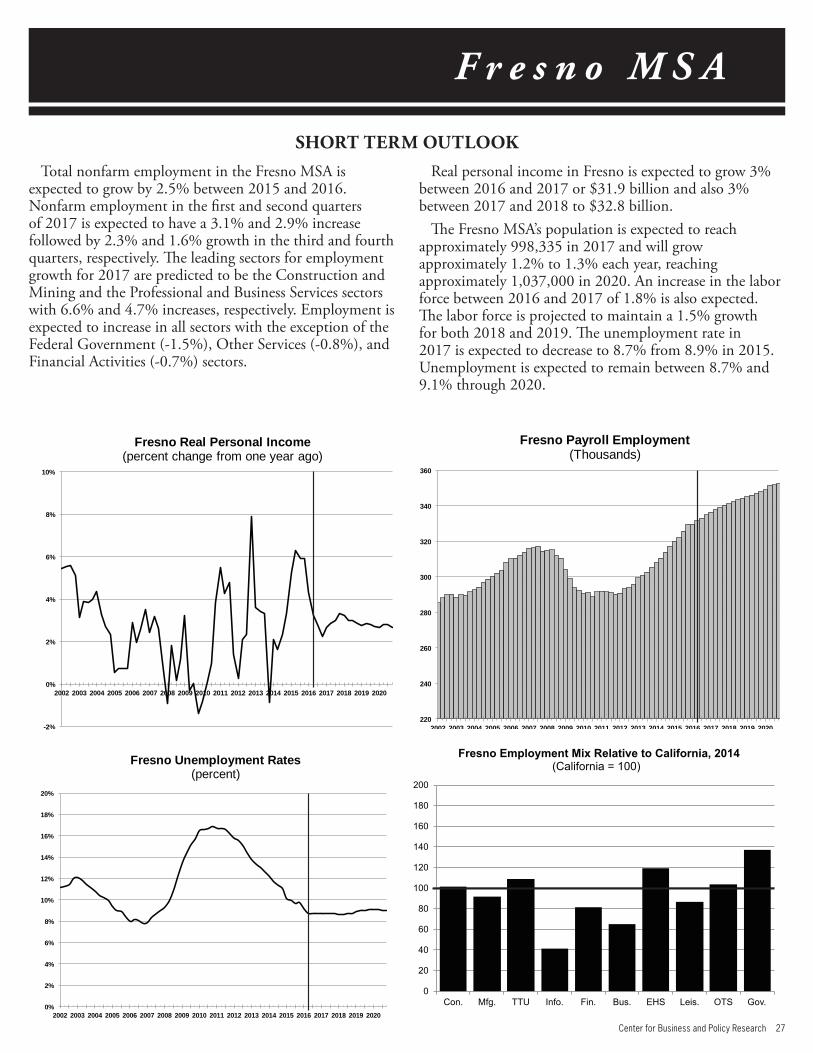
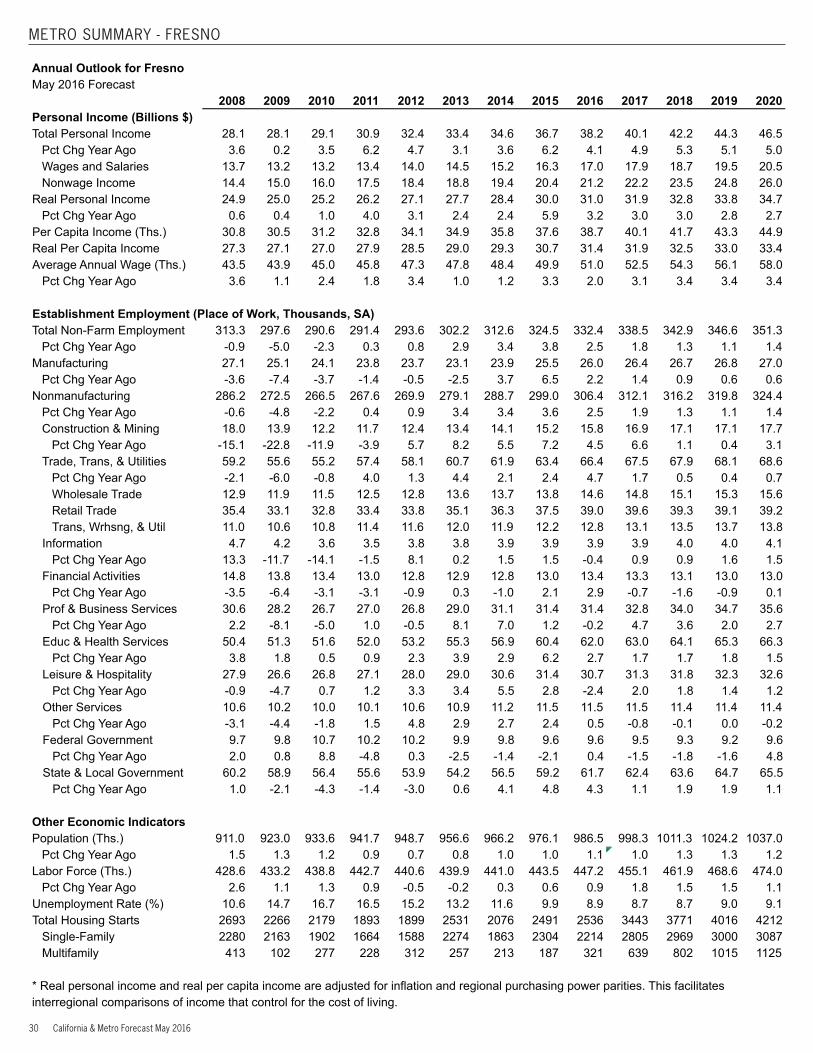
Total nonfarm employment in the Fresno MSA is expected to grow by 2.5% between 2015 and 2016. Nonfarm employment in the first and second quarters of 2017 is expected to have a 3.1% and 2.9% increase followed by 2.3% and 1.6% growth in the third and fourth quarters, respectively. The leading sectors for employment growth for 2017 are predicted to be the Construction and Mining and the Professional and Business Services sectors with 6.6% and 4.7% increases, respectively. Employment is expected to increase in all sectors with the exception of the Federal Government (-1.5%), Other Services (-0.8%), and Financial Activities (-0.7%) sectors.
SHORT TERM OUTLOOK
0
20
40
60
80
100
120
140
160
180
200
Con. Mfg. TTU Info. Fin. Bus. EHS Leis. OTS Gov.
Fresno Employment Mix Relative to California, 2014(California = 100)
-2%
0%
2%
4%
6%
8%
10%
2002 2003 2004 2005 2006 2007 2008 2009 2010 2011 2012 2013 2014 2015 2016 2017 2018 2019 2020
Fresno Real Personal Income (percent change from one year ago)
0%
2%
4%
6%
8%
10%
12%
14%
16%
18%
20%
2002 2003 2004 2005 2006 2007 2008 2009 2010 2011 2012 2013 2014 2015 2016 2017 2018 2019 2020
Fresno Unemployment Rates(percent)
220
240
260
280
300
320
340
360
2002 2003 2004 2005 2006 2007 2008 2009 2010 2011 2012 2013 2014 2015 2016 2017 2018 2019 2020
Fresno Payroll Employment (Thousands)
Real personal income in Fresno is expected to grow 3% between 2016 and 2017 or $31.9 billion and also 3% between 2017 and 2018 to $32.8 billion.
The Fresno MSA’s population is expected to reach approximately 998,335 in 2017 and will grow approximately 1.2% to 1.3% each year, reaching approximately 1,037,000 in 2020. An increase in the labor force between 2016 and 2017 of 1.8% is also expected. The labor force is projected to maintain a 1.5% growth for both 2018 and 2019. The unemployment rate in 2017 is expected to decrease to 8.7% from 8.9% in 2015. Unemployment is expected to remain between 8.7% and 9.1% through 2020.
28 California & Metro Forecast May 2016
METRO SUMMARY - FRESNO
Quarterly Outlook for FresnoMay 2016 Forecast 2015Q1 2015Q2 2015Q3 2015Q4 2016Q1 2016Q2 2016Q3 2016Q4 2017Q1 2017Q2 2017Q3 2017Q4Personal Income (Annual Rate, Billions $) Total Personal Income 35.8 36.6 37.0 37.5 37.7 38.0 38.3 38.8 39.3 39.8 40.3 40.8
Pct Chg Year Ago 5.6 6.6 6.2 6.4 5.3 3.9 3.5 3.5 4.3 4.8 5.2 5.3Wages and Salaries 15.9 16.3 16.4 16.6 16.7 16.9 17.1 17.3 17.5 17.8 18.0 18.2Nonwage Income 19.9 20.3 20.7 20.8 21.0 21.1 21.2 21.5 21.8 22.1 22.3 22.6
Real Personal Income 29.4 29.9 30.2 30.5 30.7 30.9 31.0 31.2 31.5 31.8 32.0 32.3Pct Chg Year Ago 5.3 6.3 5.9 5.9 4.3 3.2 2.8 2.3 2.7 2.9 3.0 3.3
Per Capita Income (Ths.) 36.8 37.5 37.9 38.2 38.4 38.6 38.8 39.2 39.5 39.9 40.3 40.7Real Per Capita Income 30.3 30.7 30.9 31.1 31.3 31.4 31.4 31.5 31.7 31.9 32.0 32.2Average Annual Wage (Ths.) 49.3 50.2 50.0 50.2 50.4 50.8 51.1 51.5 51.8 52.3 52.8 53.2
Pct Chg Year Ago 3.3 4.8 2.5 2.5 2.2 1.1 2.3 2.5 2.8 3.0 3.2 3.4 Establishment Employment (Place of Work, Thousands, SA)Total Non-Farm Employment 319.9 322.3 325.8 329.9 329.8 331.6 333.3 335.1 336.4 337.9 339.2 340.5
Pct Chg Year Ago 3.8 3.7 3.8 4.0 3.1 2.9 2.3 1.6 2.0 1.9 1.8 1.6Manufacturing 25.2 25.2 25.6 25.9 25.9 25.9 26.1 26.3 26.3 26.4 26.4 26.5
Pct Chg Year Ago 7.4 6.8 6.5 5.4 2.7 3.0 1.6 1.5 1.6 1.7 1.5 0.9Nonmanufacturing 294.7 297.1 300.2 304.0 304.0 305.6 307.2 308.8 310.1 311.5 312.7 314.0
Pct Chg Year Ago 3.5 3.4 3.5 3.9 3.2 2.9 2.3 1.6 2.0 1.9 1.8 1.7Construction & Mining 14.9 15.3 15.2 15.2 15.3 15.7 16.0 16.5 16.6 16.8 17.0 17.1
Pct Chg Year Ago 6.9 10.0 7.9 3.7 2.5 2.2 4.9 8.3 8.9 7.2 6.1 4.2Trade, Trans, & Utilities 62.7 62.6 63.6 64.9 65.8 66.2 66.6 67.0 67.2 67.5 67.7 67.8
Pct Chg Year Ago 1.7 0.9 2.8 4.2 4.9 5.8 4.7 3.2 2.2 1.9 1.7 1.2Wholesale Trade 13.5 13.5 13.8 14.2 14.5 14.5 14.6 14.7 14.7 14.8 14.9 14.9Retail Trade 37.1 37.0 37.6 38.2 38.6 38.9 39.2 39.4 39.5 39.6 39.6 39.6Trans, Wrhsng, & Util 12.1 12.0 12.2 12.5 12.7 12.7 12.8 12.9 13.0 13.1 13.2 13.3
Information 3.9 3.9 3.9 3.9 3.9 3.9 3.9 3.9 4.0 4.0 3.9 3.9Pct Chg Year Ago 2.6 3.4 1.0 -0.7 -0.4 -1.3 -0.4 0.4 1.5 1.8 0.0 0.3
Financial Activities 12.9 12.9 13.1 13.1 13.3 13.4 13.5 13.4 13.4 13.3 13.3 13.3Pct Chg Year Ago 1.0 2.0 3.6 1.9 3.2 3.4 2.8 2.3 0.5 -0.5 -1.4 -1.4
Prof & Business Services 31.4 31.9 31.3 31.1 31.0 31.2 31.4 31.9 32.3 32.7 33.0 33.4Pct Chg Year Ago 4.2 4.5 -1.6 -2.1 -1.3 -2.2 0.4 2.4 4.4 4.8 5.1 4.7
Educ & Health Services 58.7 59.4 61.2 62.3 61.7 61.9 62.2 62.3 62.6 63.0 63.2 63.4Pct Chg Year Ago 5.0 5.0 7.0 7.7 5.1 4.2 1.6 0.0 1.5 1.7 1.6 1.9
Leisure & Hospitality 31.1 31.4 31.4 31.7 30.4 30.6 30.8 30.9 31.0 31.2 31.3 31.5Pct Chg Year Ago 3.1 2.8 2.6 2.6 -2.4 -2.5 -2.2 -2.6 2.1 1.9 1.9 2.0
Other Services 11.4 11.4 11.6 11.6 11.6 11.6 11.5 11.5 11.5 11.5 11.4 11.4Pct Chg Year Ago 2.0 2.6 2.8 2.2 1.7 1.1 -0.2 -0.6 -0.6 -1.0 -0.9 -0.6
Federal Government 9.6 9.5 9.8 9.5 9.6 9.6 9.6 9.6 9.6 9.5 9.5 9.4Pct Chg Year Ago -1.9 -3.0 -1.8 -1.7 0.9 2.0 -1.6 0.5 -1.0 -1.4 -1.6 -1.8
State & Local Government 58.2 58.7 59.1 60.7 61.5 61.6 61.8 61.9 62.0 62.2 62.5 62.8Pct Chg Year Ago 4.7 4.4 4.4 5.7 5.7 4.9 4.5 2.0 0.8 1.0 1.1 1.5
Other Economic Indicators Population (Ths.) 972.4 974.9 977.4 979.9 982.4 985.1 987.8 990.6 993.6 996.7 999.9 1003.2
Pct Chg Year Ago 1.0 1.0 1.0 1.0 1.0 1.1 1.1 1.1 1.1 1.2 1.2 1.3Labor Force (Ths.) 442.6 444.9 443.6 442.7 444.4 446.1 448.1 450.2 452.5 454.2 456.1 457.7
Pct Chg Year Ago 0.6 1.0 0.7 0.0 0.4 0.3 1.0 1.7 1.8 1.8 1.8 1.7Unemployment Rate (%) 10.2 10.0 9.7 9.7 9.1 8.8 8.8 8.8 8.8 8.7 8.7 8.7Total Housing Starts (Annual Rate) 2720 2808 2346 2090 2036 2398 2726 2982 3206 3419 3529 3618
Single-Family 2530 2463 2248 1974 1840 2128 2385 2505 2638 2788 2868 2924Multifamily 190 346 98 116 196 271 342 477 568 632 661 694
* Real personal income and real per capita income are adjusted for inflation and regional purchasing power parities. This facilitates interregional comparisons of income that control for the cost of living.
Center for Business and Policy Research 29
METRO SUMMARY - FRESNO
Quarterly Outlook for FresnoMay 2016 Forecast 2018Q1 2018Q2 2018Q3 2018Q4 2019Q1 2019Q2 2019Q3 2019Q4 2020Q1 2020Q2 2020Q3 2020Q4Personal Income (Annual Rate, Billions $) Total Personal Income 41.4 41.9 42.4 42.9 43.5 44.1 44.6 45.1 45.7 46.3 46.8 47.3
Pct Chg Year Ago 5.4 5.3 5.2 5.2 5.1 5.1 5.1 5.0 4.9 5.1 5.1 5.0Wages and Salaries 18.4 18.6 18.8 19.0 19.2 19.4 19.6 19.9 20.1 20.4 20.6 20.8Nonwage Income 23.0 23.3 23.6 23.9 24.3 24.6 24.9 25.2 25.6 25.9 26.2 26.5
Real Personal Income 32.5 32.7 32.9 33.2 33.4 33.7 33.9 34.1 34.3 34.6 34.8 35.0Pct Chg Year Ago 3.2 3.0 3.0 2.8 2.8 2.8 2.8 2.7 2.7 2.8 2.8 2.7
Per Capita Income (Ths.) 41.2 41.5 41.9 42.3 42.7 43.1 43.4 43.8 44.2 44.7 45.1 45.4Real Per Capita Income 32.3 32.4 32.5 32.6 32.8 32.9 33.0 33.1 33.3 33.4 33.5 33.6Average Annual Wage (Ths.) 53.6 54.1 54.5 55.0 55.4 55.9 56.3 56.9 57.3 57.7 58.2 58.8
Pct Chg Year Ago 3.5 3.4 3.3 3.3 3.3 3.3 3.4 3.4 3.4 3.3 3.4 3.4 Establishment Employment (Place of Work, Thousands, SA)Total Non-Farm Employment 341.5 342.4 343.4 344.3 345.2 346.1 347.1 348.1 349.2 351.5 352.0 352.6
Pct Chg Year Ago 1.5 1.4 1.2 1.1 1.1 1.1 1.1 1.1 1.2 1.6 1.4 1.3Manufacturing 26.6 26.6 26.7 26.8 26.8 26.8 26.8 26.9 26.9 26.9 27.0 27.1
Pct Chg Year Ago 1.0 0.9 0.9 0.9 0.8 0.7 0.5 0.4 0.4 0.5 0.7 0.8Nonmanufacturing 314.9 315.8 316.7 317.5 318.4 319.3 320.3 321.2 322.3 324.6 325.0 325.6
Pct Chg Year Ago 1.5 1.4 1.3 1.1 1.1 1.1 1.1 1.2 1.2 1.6 1.5 1.3Construction & Mining 17.1 17.1 17.1 17.0 16.9 17.1 17.2 17.3 17.5 17.6 17.7 17.9
Pct Chg Year Ago 3.1 1.8 0.5 -0.8 -1.1 -0.2 0.8 1.9 3.1 3.1 3.2 3.1Trade, Trans, & Utilities 67.8 67.9 67.9 67.9 68.0 68.0 68.2 68.3 68.4 68.5 68.6 68.8
Pct Chg Year Ago 0.8 0.6 0.3 0.2 0.3 0.3 0.4 0.6 0.7 0.7 0.7 0.7Wholesale Trade 15.0 15.0 15.1 15.2 15.2 15.3 15.4 15.4 15.5 15.5 15.6 15.7Retail Trade 39.5 39.4 39.3 39.2 39.1 39.1 39.1 39.1 39.1 39.2 39.2 39.3Trans, Wrhsng, & Util 13.4 13.4 13.5 13.6 13.6 13.7 13.7 13.7 13.8 13.8 13.8 13.9
Information 3.9 4.0 4.0 4.0 4.0 4.0 4.0 4.1 4.1 4.1 4.1 4.1Pct Chg Year Ago -0.8 0.0 2.0 2.3 2.3 2.0 1.3 1.0 1.0 1.2 1.7 2.0
Financial Activities 13.2 13.1 13.1 13.0 13.0 13.0 13.0 13.0 13.0 13.0 13.0 13.0Pct Chg Year Ago -1.3 -1.4 -1.7 -1.9 -1.7 -1.2 -0.6 -0.2 0.2 0.0 0.1 0.2
Prof & Business Services 33.7 34.0 34.1 34.3 34.5 34.6 34.8 35.0 35.2 35.5 35.8 36.1Pct Chg Year Ago 4.3 3.9 3.4 2.7 2.2 1.9 1.9 2.0 2.1 2.5 2.9 3.2
Educ & Health Services 63.7 64.0 64.2 64.6 64.9 65.1 65.4 65.6 65.9 66.1 66.4 66.6Pct Chg Year Ago 1.8 1.6 1.7 1.7 1.9 1.8 1.8 1.7 1.6 1.5 1.6 1.5
Leisure & Hospitality 31.6 31.7 31.9 32.1 32.1 32.2 32.3 32.4 32.5 32.6 32.7 32.8Pct Chg Year Ago 1.8 1.8 1.7 1.8 1.7 1.6 1.3 1.1 1.1 1.2 1.2 1.2
Other Services 11.5 11.4 11.4 11.4 11.5 11.4 11.4 11.4 11.4 11.4 11.4 11.4Pct Chg Year Ago -0.3 -0.1 0.0 0.0 0.0 0.0 0.0 -0.1 -0.2 -0.2 -0.3 -0.2
Federal Government 9.4 9.3 9.3 9.3 9.2 9.2 9.2 9.1 9.2 10.5 9.7 9.1Pct Chg Year Ago -1.9 -1.9 -1.8 -1.6 -1.6 -1.6 -1.6 -1.6 -0.4 14.3 5.5 -0.2
State & Local Government 63.0 63.4 63.7 64.1 64.4 64.7 64.9 65.1 65.2 65.4 65.6 65.8Pct Chg Year Ago 1.6 1.9 2.0 2.0 2.1 2.0 1.8 1.6 1.3 1.1 1.1 1.1
Other Economic Indicators Population (Ths.) 1006.4 1009.7 1013.0 1016.2 1019.4 1022.6 1025.8 1029.0 1032.2 1035.4 1038.6 1041.7
Pct Chg Year Ago 1.3 1.3 1.3 1.3 1.3 1.3 1.3 1.3 1.3 1.3 1.2 1.2Labor Force (Ths.) 459.3 461.0 462.6 464.5 466.4 468.0 469.4 470.7 472.2 473.6 474.6 475.6
Pct Chg Year Ago 1.5 1.5 1.4 1.5 1.5 1.5 1.5 1.3 1.2 1.2 1.1 1.0Unemployment Rate (%) 8.7 8.7 8.7 8.8 8.9 9.0 9.1 9.1 9.1 9.1 9.1 9.0Total Housing Starts (Annual Rate) 3692 3735 3808 3850 3876 3961 4049 4177 4197 4194 4216 4241
Single-Family 2965 2988 2988 2936 2938 2966 3026 3072 3103 3092 3081 3073Multifamily 727 748 820 914 938 995 1023 1105 1094 1102 1135 1167
* Real personal income and real per capita income are adjusted for inflation and regional purchasing power parities. This facilitates interregional comparisons of income that control for the cost of living.
30 California & Metro Forecast May 2016
METRO SUMMARY - FRESNO
Annual Outlook for FresnoMay 2016 Forecast 2008 2009 2010 2011 2012 2013 2014 2015 2016 2017 2018 2019 2020Personal Income (Billions $) Total Personal Income 28.1 28.1 29.1 30.9 32.4 33.4 34.6 36.7 38.2 40.1 42.2 44.3 46.5
Pct Chg Year Ago 3.6 0.2 3.5 6.2 4.7 3.1 3.6 6.2 4.1 4.9 5.3 5.1 5.0Wages and Salaries 13.7 13.2 13.2 13.4 14.0 14.5 15.2 16.3 17.0 17.9 18.7 19.5 20.5Nonwage Income 14.4 15.0 16.0 17.5 18.4 18.8 19.4 20.4 21.2 22.2 23.5 24.8 26.0
Real Personal Income 24.9 25.0 25.2 26.2 27.1 27.7 28.4 30.0 31.0 31.9 32.8 33.8 34.7Pct Chg Year Ago 0.6 0.4 1.0 4.0 3.1 2.4 2.4 5.9 3.2 3.0 3.0 2.8 2.7
Per Capita Income (Ths.) 30.8 30.5 31.2 32.8 34.1 34.9 35.8 37.6 38.7 40.1 41.7 43.3 44.9Real Per Capita Income 27.3 27.1 27.0 27.9 28.5 29.0 29.3 30.7 31.4 31.9 32.5 33.0 33.4Average Annual Wage (Ths.) 43.5 43.9 45.0 45.8 47.3 47.8 48.4 49.9 51.0 52.5 54.3 56.1 58.0
Pct Chg Year Ago 3.6 1.1 2.4 1.8 3.4 1.0 1.2 3.3 2.0 3.1 3.4 3.4 3.4 Establishment Employment (Place of Work, Thousands, SA)Total Non-Farm Employment 313.3 297.6 290.6 291.4 293.6 302.2 312.6 324.5 332.4 338.5 342.9 346.6 351.3
Pct Chg Year Ago -0.9 -5.0 -2.3 0.3 0.8 2.9 3.4 3.8 2.5 1.8 1.3 1.1 1.4Manufacturing 27.1 25.1 24.1 23.8 23.7 23.1 23.9 25.5 26.0 26.4 26.7 26.8 27.0
Pct Chg Year Ago -3.6 -7.4 -3.7 -1.4 -0.5 -2.5 3.7 6.5 2.2 1.4 0.9 0.6 0.6Nonmanufacturing 286.2 272.5 266.5 267.6 269.9 279.1 288.7 299.0 306.4 312.1 316.2 319.8 324.4
Pct Chg Year Ago -0.6 -4.8 -2.2 0.4 0.9 3.4 3.4 3.6 2.5 1.9 1.3 1.1 1.4Construction & Mining 18.0 13.9 12.2 11.7 12.4 13.4 14.1 15.2 15.8 16.9 17.1 17.1 17.7
Pct Chg Year Ago -15.1 -22.8 -11.9 -3.9 5.7 8.2 5.5 7.2 4.5 6.6 1.1 0.4 3.1Trade, Trans, & Utilities 59.2 55.6 55.2 57.4 58.1 60.7 61.9 63.4 66.4 67.5 67.9 68.1 68.6
Pct Chg Year Ago -2.1 -6.0 -0.8 4.0 1.3 4.4 2.1 2.4 4.7 1.7 0.5 0.4 0.7Wholesale Trade 12.9 11.9 11.5 12.5 12.8 13.6 13.7 13.8 14.6 14.8 15.1 15.3 15.6Retail Trade 35.4 33.1 32.8 33.4 33.8 35.1 36.3 37.5 39.0 39.6 39.3 39.1 39.2Trans, Wrhsng, & Util 11.0 10.6 10.8 11.4 11.6 12.0 11.9 12.2 12.8 13.1 13.5 13.7 13.8
Information 4.7 4.2 3.6 3.5 3.8 3.8 3.9 3.9 3.9 3.9 4.0 4.0 4.1Pct Chg Year Ago 13.3 -11.7 -14.1 -1.5 8.1 0.2 1.5 1.5 -0.4 0.9 0.9 1.6 1.5
Financial Activities 14.8 13.8 13.4 13.0 12.8 12.9 12.8 13.0 13.4 13.3 13.1 13.0 13.0Pct Chg Year Ago -3.5 -6.4 -3.1 -3.1 -0.9 0.3 -1.0 2.1 2.9 -0.7 -1.6 -0.9 0.1
Prof & Business Services 30.6 28.2 26.7 27.0 26.8 29.0 31.1 31.4 31.4 32.8 34.0 34.7 35.6Pct Chg Year Ago 2.2 -8.1 -5.0 1.0 -0.5 8.1 7.0 1.2 -0.2 4.7 3.6 2.0 2.7
Educ & Health Services 50.4 51.3 51.6 52.0 53.2 55.3 56.9 60.4 62.0 63.0 64.1 65.3 66.3Pct Chg Year Ago 3.8 1.8 0.5 0.9 2.3 3.9 2.9 6.2 2.7 1.7 1.7 1.8 1.5
Leisure & Hospitality 27.9 26.6 26.8 27.1 28.0 29.0 30.6 31.4 30.7 31.3 31.8 32.3 32.6Pct Chg Year Ago -0.9 -4.7 0.7 1.2 3.3 3.4 5.5 2.8 -2.4 2.0 1.8 1.4 1.2
Other Services 10.6 10.2 10.0 10.1 10.6 10.9 11.2 11.5 11.5 11.5 11.4 11.4 11.4Pct Chg Year Ago -3.1 -4.4 -1.8 1.5 4.8 2.9 2.7 2.4 0.5 -0.8 -0.1 0.0 -0.2
Federal Government 9.7 9.8 10.7 10.2 10.2 9.9 9.8 9.6 9.6 9.5 9.3 9.2 9.6Pct Chg Year Ago 2.0 0.8 8.8 -4.8 0.3 -2.5 -1.4 -2.1 0.4 -1.5 -1.8 -1.6 4.8
State & Local Government 60.2 58.9 56.4 55.6 53.9 54.2 56.5 59.2 61.7 62.4 63.6 64.7 65.5Pct Chg Year Ago 1.0 -2.1 -4.3 -1.4 -3.0 0.6 4.1 4.8 4.3 1.1 1.9 1.9 1.1
Other Economic Indicators Population (Ths.) 911.0 923.0 933.6 941.7 948.7 956.6 966.2 976.1 986.5 998.3 1011.3 1024.2 1037.0
Pct Chg Year Ago 1.5 1.3 1.2 0.9 0.7 0.8 1.0 1.0 1.1 1.0 1.3 1.3 1.2Labor Force (Ths.) 428.6 433.2 438.8 442.7 440.6 439.9 441.0 443.5 447.2 455.1 461.9 468.6 474.0
Pct Chg Year Ago 2.6 1.1 1.3 0.9 -0.5 -0.2 0.3 0.6 0.9 1.8 1.5 1.5 1.1Unemployment Rate (%) 10.6 14.7 16.7 16.5 15.2 13.2 11.6 9.9 8.9 8.7 8.7 9.0 9.1Total Housing Starts 2693 2266 2179 1893 1899 2531 2076 2491 2536 3443 3771 4016 4212
Single-Family 2280 2163 1902 1664 1588 2274 1863 2304 2214 2805 2969 3000 3087Multifamily 413 102 277 228 312 257 213 187 321 639 802 1015 1125
* Real personal income and real per capita income are adjusted for inflation and regional purchasing power parities. This facilitates interregional comparisons of income that control for the cost of living.
Center for Business and Policy Research 31
METRO SUMMARY - FRESNO
M e r c e d M S A
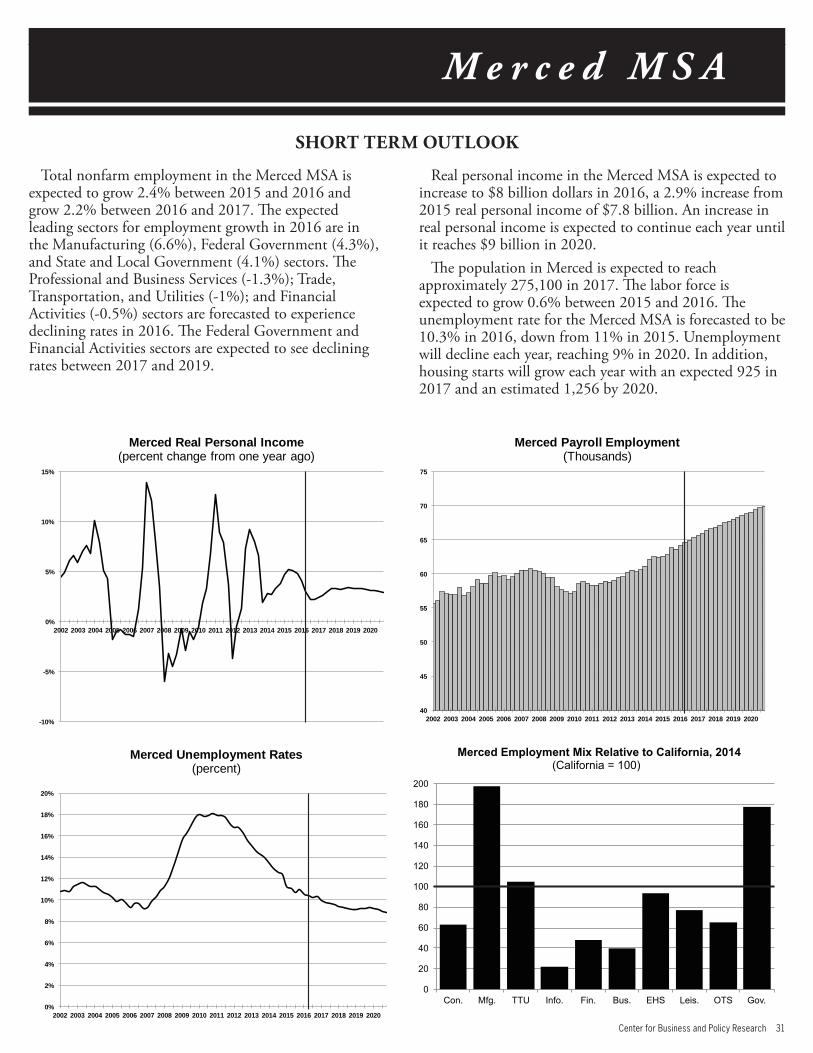
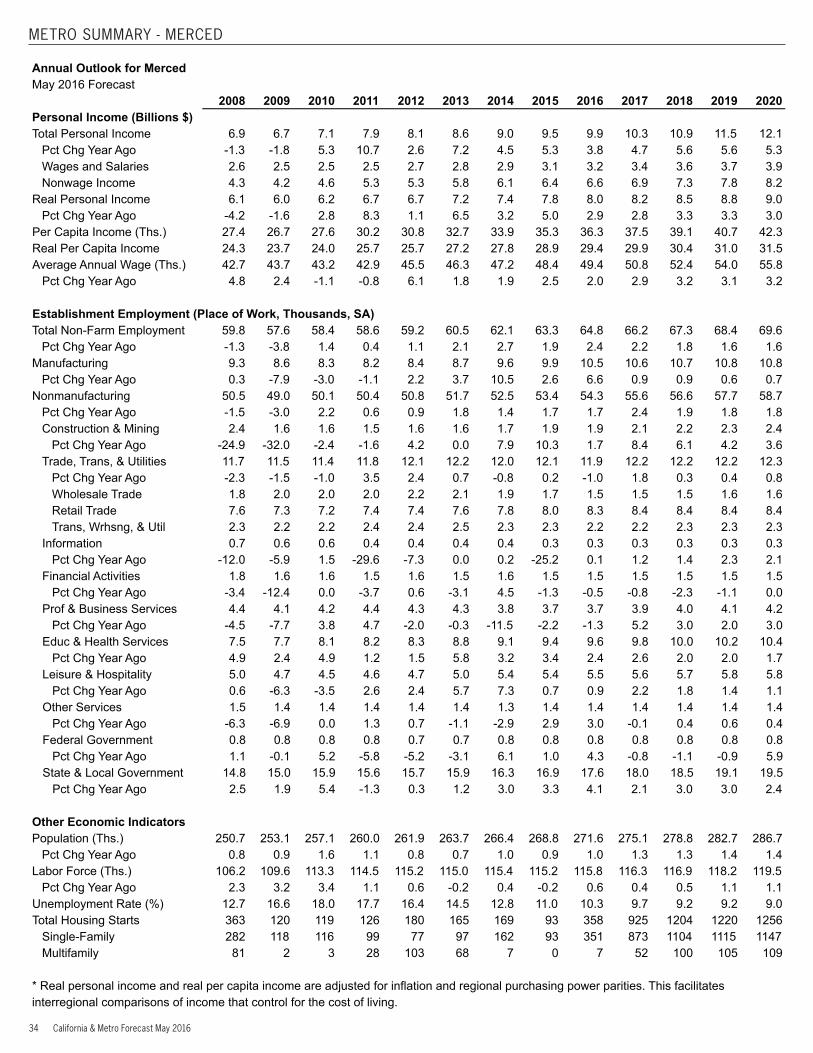
Total nonfarm employment in the Merced MSA is expected to grow 2.4% between 2015 and 2016 and grow 2.2% between 2016 and 2017. The expected leading sectors for employment growth in 2016 are in the Manufacturing (6.6%), Federal Government (4.3%), and State and Local Government (4.1%) sectors. The Professional and Business Services (-1.3%); Trade, Transportation, and Utilities (-1%); and Financial Activities (-0.5%) sectors are forecasted to experience declining rates in 2016. The Federal Government and Financial Activities sectors are expected to see declining rates between 2017 and 2019.
SHORT TERM OUTLOOK
0
20
40
60
80
100
120
140
160
180
200
Con. Mfg. TTU Info. Fin. Bus. EHS Leis. OTS Gov.
Merced Employment Mix Relative to California, 2014(California = 100)
-10%
-5%
0%
5%
10%
15%
2002 2003 2004 2005 2006 2007 2008 2009 2010 2011 2012 2013 2014 2015 2016 2017 2018 2019 2020
Merced Real Personal Income (percent change from one year ago)
0%
2%
4%
6%
8%
10%
12%
14%
16%
18%
20%
2002 2003 2004 2005 2006 2007 2008 2009 2010 2011 2012 2013 2014 2015 2016 2017 2018 2019 2020
Merced Unemployment Rates(percent)
40
45
50
55
60
65
70
75
2002 2003 2004 2005 2006 2007 2008 2009 2010 2011 2012 2013 2014 2015 2016 2017 2018 2019 2020
Merced Payroll Employment (Thousands)
Real personal income in the Merced MSA is expected to increase to $8 billion dollars in 2016, a 2.9% increase from 2015 real personal income of $7.8 billion. An increase in real personal income is expected to continue each year until it reaches $9 billion in 2020.
The population in Merced is expected to reach approximately 275,100 in 2017. The labor force is expected to grow 0.6% between 2015 and 2016. The unemployment rate for the Merced MSA is forecasted to be 10.3% in 2016, down from 11% in 2015. Unemployment will decline each year, reaching 9% in 2020. In addition, housing starts will grow each year with an expected 925 in 2017 and an estimated 1,256 by 2020.
32 California & Metro Forecast May 2016
METRO SUMMARY - MERCED
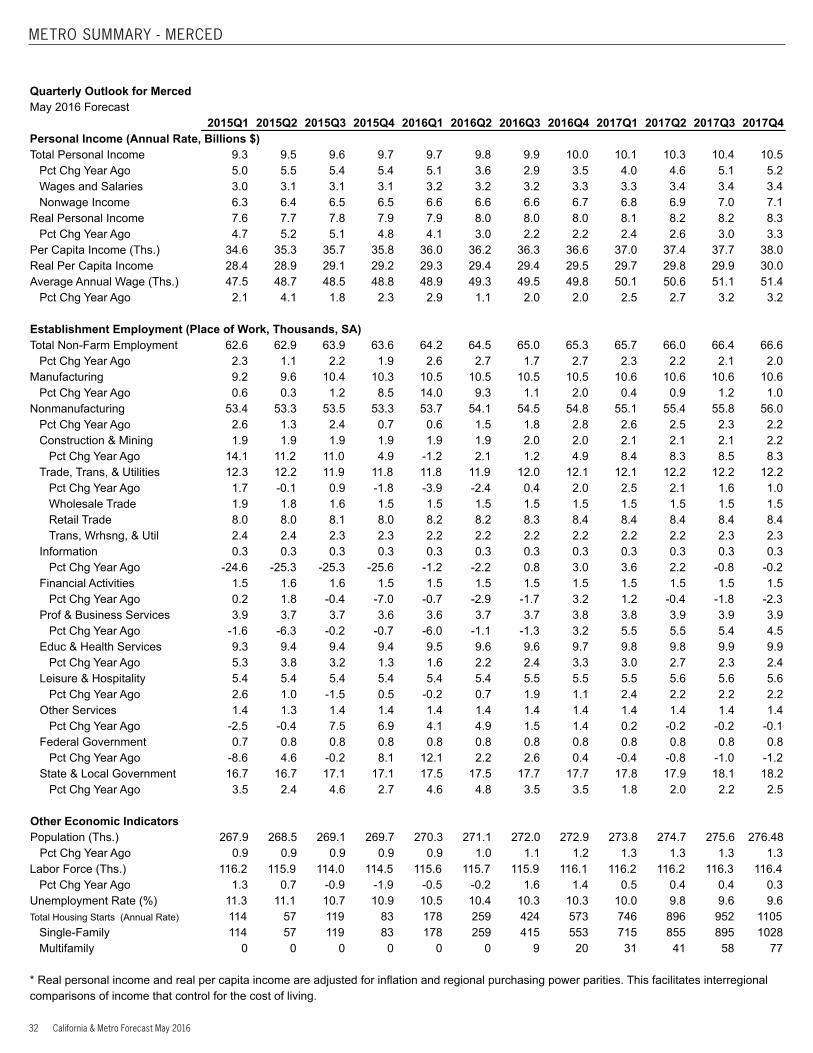
Quarterly Outlook for MercedMay 2016 Forecast 2015Q1 2015Q2 2015Q3 2015Q4 2016Q1 2016Q2 2016Q3 2016Q4 2017Q1 2017Q2 2017Q3 2017Q4Personal Income (Annual Rate, Billions $) Total Personal Income 9.3 9.5 9.6 9.7 9.7 9.8 9.9 10.0 10.1 10.3 10.4 10.5
Pct Chg Year Ago 5.0 5.5 5.4 5.4 5.1 3.6 2.9 3.5 4.0 4.6 5.1 5.2Wages and Salaries 3.0 3.1 3.1 3.1 3.2 3.2 3.2 3.3 3.3 3.4 3.4 3.4Nonwage Income 6.3 6.4 6.5 6.5 6.6 6.6 6.6 6.7 6.8 6.9 7.0 7.1
Real Personal Income 7.6 7.7 7.8 7.9 7.9 8.0 8.0 8.0 8.1 8.2 8.2 8.3Pct Chg Year Ago 4.7 5.2 5.1 4.8 4.1 3.0 2.2 2.2 2.4 2.6 3.0 3.3
Per Capita Income (Ths.) 34.6 35.3 35.7 35.8 36.0 36.2 36.3 36.6 37.0 37.4 37.7 38.0Real Per Capita Income 28.4 28.9 29.1 29.2 29.3 29.4 29.4 29.5 29.7 29.8 29.9 30.0Average Annual Wage (Ths.) 47.5 48.7 48.5 48.8 48.9 49.3 49.5 49.8 50.1 50.6 51.1 51.4
Pct Chg Year Ago 2.1 4.1 1.8 2.3 2.9 1.1 2.0 2.0 2.5 2.7 3.2 3.2 Establishment Employment (Place of Work, Thousands, SA)Total Non-Farm Employment 62.6 62.9 63.9 63.6 64.2 64.5 65.0 65.3 65.7 66.0 66.4 66.6
Pct Chg Year Ago 2.3 1.1 2.2 1.9 2.6 2.7 1.7 2.7 2.3 2.2 2.1 2.0Manufacturing 9.2 9.6 10.4 10.3 10.5 10.5 10.5 10.5 10.6 10.6 10.6 10.6
Pct Chg Year Ago 0.6 0.3 1.2 8.5 14.0 9.3 1.1 2.0 0.4 0.9 1.2 1.0Nonmanufacturing 53.4 53.3 53.5 53.3 53.7 54.1 54.5 54.8 55.1 55.4 55.8 56.0
Pct Chg Year Ago 2.6 1.3 2.4 0.7 0.6 1.5 1.8 2.8 2.6 2.5 2.3 2.2Construction & Mining 1.9 1.9 1.9 1.9 1.9 1.9 2.0 2.0 2.1 2.1 2.1 2.2
Pct Chg Year Ago 14.1 11.2 11.0 4.9 -1.2 2.1 1.2 4.9 8.4 8.3 8.5 8.3Trade, Trans, & Utilities 12.3 12.2 11.9 11.8 11.8 11.9 12.0 12.1 12.1 12.2 12.2 12.2
Pct Chg Year Ago 1.7 -0.1 0.9 -1.8 -3.9 -2.4 0.4 2.0 2.5 2.1 1.6 1.0Wholesale Trade 1.9 1.8 1.6 1.5 1.5 1.5 1.5 1.5 1.5 1.5 1.5 1.5Retail Trade 8.0 8.0 8.1 8.0 8.2 8.2 8.3 8.4 8.4 8.4 8.4 8.4Trans, Wrhsng, & Util 2.4 2.4 2.3 2.3 2.2 2.2 2.2 2.2 2.2 2.2 2.3 2.3
Information 0.3 0.3 0.3 0.3 0.3 0.3 0.3 0.3 0.3 0.3 0.3 0.3Pct Chg Year Ago -24.6 -25.3 -25.3 -25.6 -1.2 -2.2 0.8 3.0 3.6 2.2 -0.8 -0.2
Financial Activities 1.5 1.6 1.6 1.5 1.5 1.5 1.5 1.5 1.5 1.5 1.5 1.5Pct Chg Year Ago 0.2 1.8 -0.4 -7.0 -0.7 -2.9 -1.7 3.2 1.2 -0.4 -1.8 -2.3
Prof & Business Services 3.9 3.7 3.7 3.6 3.6 3.7 3.7 3.8 3.8 3.9 3.9 3.9Pct Chg Year Ago -1.6 -6.3 -0.2 -0.7 -6.0 -1.1 -1.3 3.2 5.5 5.5 5.4 4.5
Educ & Health Services 9.3 9.4 9.4 9.4 9.5 9.6 9.6 9.7 9.8 9.8 9.9 9.9Pct Chg Year Ago 5.3 3.8 3.2 1.3 1.6 2.2 2.4 3.3 3.0 2.7 2.3 2.4
Leisure & Hospitality 5.4 5.4 5.4 5.4 5.4 5.4 5.5 5.5 5.5 5.6 5.6 5.6Pct Chg Year Ago 2.6 1.0 -1.5 0.5 -0.2 0.7 1.9 1.1 2.4 2.2 2.2 2.2
Other Services 1.4 1.3 1.4 1.4 1.4 1.4 1.4 1.4 1.4 1.4 1.4 1.4Pct Chg Year Ago -2.5 -0.4 7.5 6.9 4.1 4.9 1.5 1.4 0.2 -0.2 -0.2 -0.1
Federal Government 0.7 0.8 0.8 0.8 0.8 0.8 0.8 0.8 0.8 0.8 0.8 0.8Pct Chg Year Ago -8.6 4.6 -0.2 8.1 12.1 2.2 2.6 0.4 -0.4 -0.8 -1.0 -1.2
State & Local Government 16.7 16.7 17.1 17.1 17.5 17.5 17.7 17.7 17.8 17.9 18.1 18.2Pct Chg Year Ago 3.5 2.4 4.6 2.7 4.6 4.8 3.5 3.5 1.8 2.0 2.2 2.5
Other Economic Indicators Population (Ths.) 267.9 268.5 269.1 269.7 270.3 271.1 272.0 272.9 273.8 274.7 275.6 276.48
Pct Chg Year Ago 0.9 0.9 0.9 0.9 0.9 1.0 1.1 1.2 1.3 1.3 1.3 1.3Labor Force (Ths.) 116.2 115.9 114.0 114.5 115.6 115.7 115.9 116.1 116.2 116.2 116.3 116.4
Pct Chg Year Ago 1.3 0.7 -0.9 -1.9 -0.5 -0.2 1.6 1.4 0.5 0.4 0.4 0.3Unemployment Rate (%) 11.3 11.1 10.7 10.9 10.5 10.4 10.3 10.3 10.0 9.8 9.6 9.6Total Housing Starts (Annual Rate) 114 57 119 83 178 259 424 573 746 896 952 1105
Single-Family 114 57 119 83 178 259 415 553 715 855 895 1028Multifamily 0 0 0 0 0 0 9 20 31 41 58 77
* Real personal income and real per capita income are adjusted for inflation and regional purchasing power parities. This facilitates interregional comparisons of income that control for the cost of living.
Center for Business and Policy Research 33
METRO SUMMARY - MERCED
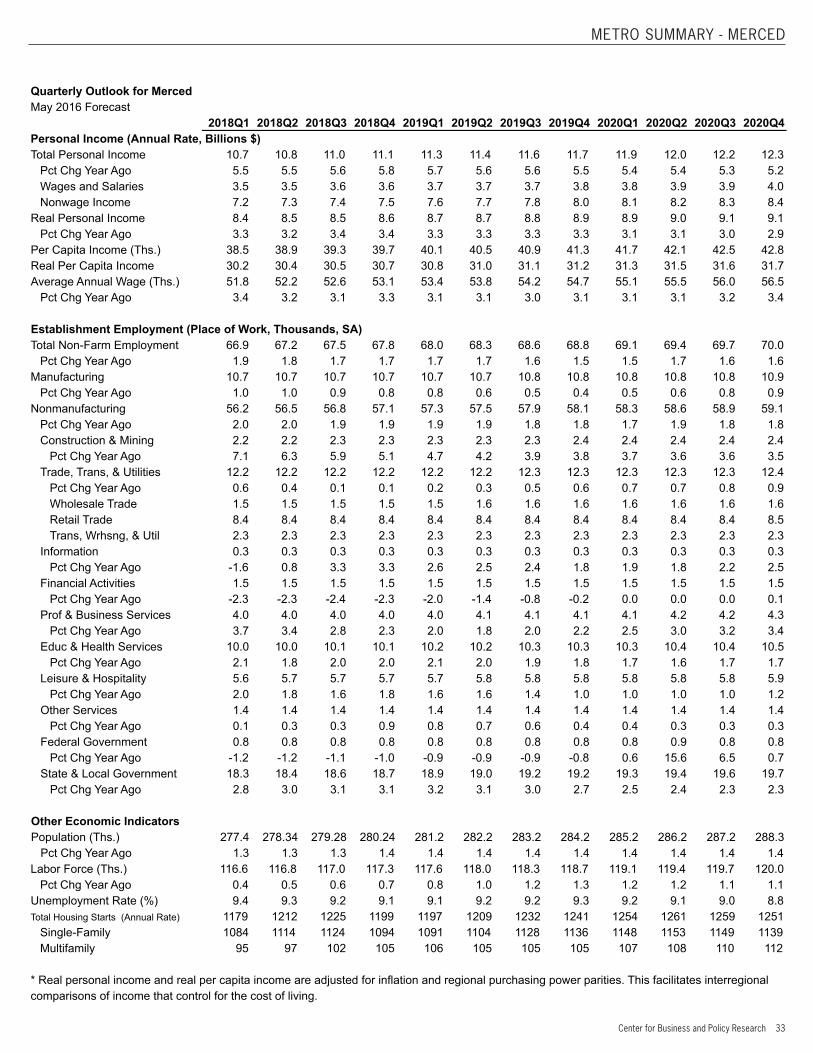
Quarterly Outlook for MercedMay 2016 Forecast 2018Q1 2018Q2 2018Q3 2018Q4 2019Q1 2019Q2 2019Q3 2019Q4 2020Q1 2020Q2 2020Q3 2020Q4Personal Income (Annual Rate, Billions $) Total Personal Income 10.7 10.8 11.0 11.1 11.3 11.4 11.6 11.7 11.9 12.0 12.2 12.3
Pct Chg Year Ago 5.5 5.5 5.6 5.8 5.7 5.6 5.6 5.5 5.4 5.4 5.3 5.2Wages and Salaries 3.5 3.5 3.6 3.6 3.7 3.7 3.7 3.8 3.8 3.9 3.9 4.0Nonwage Income 7.2 7.3 7.4 7.5 7.6 7.7 7.8 8.0 8.1 8.2 8.3 8.4
Real Personal Income 8.4 8.5 8.5 8.6 8.7 8.7 8.8 8.9 8.9 9.0 9.1 9.1Pct Chg Year Ago 3.3 3.2 3.4 3.4 3.3 3.3 3.3 3.3 3.1 3.1 3.0 2.9
Per Capita Income (Ths.) 38.5 38.9 39.3 39.7 40.1 40.5 40.9 41.3 41.7 42.1 42.5 42.8Real Per Capita Income 30.2 30.4 30.5 30.7 30.8 31.0 31.1 31.2 31.3 31.5 31.6 31.7Average Annual Wage (Ths.) 51.8 52.2 52.6 53.1 53.4 53.8 54.2 54.7 55.1 55.5 56.0 56.5
Pct Chg Year Ago 3.4 3.2 3.1 3.3 3.1 3.1 3.0 3.1 3.1 3.1 3.2 3.4 Establishment Employment (Place of Work, Thousands, SA)Total Non-Farm Employment 66.9 67.2 67.5 67.8 68.0 68.3 68.6 68.8 69.1 69.4 69.7 70.0
Pct Chg Year Ago 1.9 1.8 1.7 1.7 1.7 1.7 1.6 1.5 1.5 1.7 1.6 1.6Manufacturing 10.7 10.7 10.7 10.7 10.7 10.7 10.8 10.8 10.8 10.8 10.8 10.9
Pct Chg Year Ago 1.0 1.0 0.9 0.8 0.8 0.6 0.5 0.4 0.5 0.6 0.8 0.9Nonmanufacturing 56.2 56.5 56.8 57.1 57.3 57.5 57.9 58.1 58.3 58.6 58.9 59.1
Pct Chg Year Ago 2.0 2.0 1.9 1.9 1.9 1.9 1.8 1.8 1.7 1.9 1.8 1.8Construction & Mining 2.2 2.2 2.3 2.3 2.3 2.3 2.3 2.4 2.4 2.4 2.4 2.4
Pct Chg Year Ago 7.1 6.3 5.9 5.1 4.7 4.2 3.9 3.8 3.7 3.6 3.6 3.5Trade, Trans, & Utilities 12.2 12.2 12.2 12.2 12.2 12.2 12.3 12.3 12.3 12.3 12.3 12.4
Pct Chg Year Ago 0.6 0.4 0.1 0.1 0.2 0.3 0.5 0.6 0.7 0.7 0.8 0.9Wholesale Trade 1.5 1.5 1.5 1.5 1.5 1.6 1.6 1.6 1.6 1.6 1.6 1.6Retail Trade 8.4 8.4 8.4 8.4 8.4 8.4 8.4 8.4 8.4 8.4 8.4 8.5Trans, Wrhsng, & Util 2.3 2.3 2.3 2.3 2.3 2.3 2.3 2.3 2.3 2.3 2.3 2.3
Information 0.3 0.3 0.3 0.3 0.3 0.3 0.3 0.3 0.3 0.3 0.3 0.3Pct Chg Year Ago -1.6 0.8 3.3 3.3 2.6 2.5 2.4 1.8 1.9 1.8 2.2 2.5
Financial Activities 1.5 1.5 1.5 1.5 1.5 1.5 1.5 1.5 1.5 1.5 1.5 1.5Pct Chg Year Ago -2.3 -2.3 -2.4 -2.3 -2.0 -1.4 -0.8 -0.2 0.0 0.0 0.0 0.1
Prof & Business Services 4.0 4.0 4.0 4.0 4.0 4.1 4.1 4.1 4.1 4.2 4.2 4.3Pct Chg Year Ago 3.7 3.4 2.8 2.3 2.0 1.8 2.0 2.2 2.5 3.0 3.2 3.4
Educ & Health Services 10.0 10.0 10.1 10.1 10.2 10.2 10.3 10.3 10.3 10.4 10.4 10.5Pct Chg Year Ago 2.1 1.8 2.0 2.0 2.1 2.0 1.9 1.8 1.7 1.6 1.7 1.7
Leisure & Hospitality 5.6 5.7 5.7 5.7 5.7 5.8 5.8 5.8 5.8 5.8 5.8 5.9Pct Chg Year Ago 2.0 1.8 1.6 1.8 1.6 1.6 1.4 1.0 1.0 1.0 1.0 1.2
Other Services 1.4 1.4 1.4 1.4 1.4 1.4 1.4 1.4 1.4 1.4 1.4 1.4Pct Chg Year Ago 0.1 0.3 0.3 0.9 0.8 0.7 0.6 0.4 0.4 0.3 0.3 0.3
Federal Government 0.8 0.8 0.8 0.8 0.8 0.8 0.8 0.8 0.8 0.9 0.8 0.8Pct Chg Year Ago -1.2 -1.2 -1.1 -1.0 -0.9 -0.9 -0.9 -0.8 0.6 15.6 6.5 0.7
State & Local Government 18.3 18.4 18.6 18.7 18.9 19.0 19.2 19.2 19.3 19.4 19.6 19.7Pct Chg Year Ago 2.8 3.0 3.1 3.1 3.2 3.1 3.0 2.7 2.5 2.4 2.3 2.3
Other Economic Indicators Population (Ths.) 277.4 278.34 279.28 280.24 281.2 282.2 283.2 284.2 285.2 286.2 287.2 288.3
Pct Chg Year Ago 1.3 1.3 1.3 1.4 1.4 1.4 1.4 1.4 1.4 1.4 1.4 1.4Labor Force (Ths.) 116.6 116.8 117.0 117.3 117.6 118.0 118.3 118.7 119.1 119.4 119.7 120.0
Pct Chg Year Ago 0.4 0.5 0.6 0.7 0.8 1.0 1.2 1.3 1.2 1.2 1.1 1.1Unemployment Rate (%) 9.4 9.3 9.2 9.1 9.1 9.2 9.2 9.3 9.2 9.1 9.0 8.8Total Housing Starts (Annual Rate) 1179 1212 1225 1199 1197 1209 1232 1241 1254 1261 1259 1251
Single-Family 1084 1114 1124 1094 1091 1104 1128 1136 1148 1153 1149 1139Multifamily 95 97 102 105 106 105 105 105 107 108 110 112
* Real personal income and real per capita income are adjusted for inflation and regional purchasing power parities. This facilitates interregional comparisons of income that control for the cost of living.
34 California & Metro Forecast May 2016
METRO SUMMARY - MERCED
Annual Outlook for MercedMay 2016 Forecast 2008 2009 2010 2011 2012 2013 2014 2015 2016 2017 2018 2019 2020Personal Income (Billions $) Total Personal Income 6.9 6.7 7.1 7.9 8.1 8.6 9.0 9.5 9.9 10.3 10.9 11.5 12.1
Pct Chg Year Ago -1.3 -1.8 5.3 10.7 2.6 7.2 4.5 5.3 3.8 4.7 5.6 5.6 5.3Wages and Salaries 2.6 2.5 2.5 2.5 2.7 2.8 2.9 3.1 3.2 3.4 3.6 3.7 3.9Nonwage Income 4.3 4.2 4.6 5.3 5.3 5.8 6.1 6.4 6.6 6.9 7.3 7.8 8.2
Real Personal Income 6.1 6.0 6.2 6.7 6.7 7.2 7.4 7.8 8.0 8.2 8.5 8.8 9.0Pct Chg Year Ago -4.2 -1.6 2.8 8.3 1.1 6.5 3.2 5.0 2.9 2.8 3.3 3.3 3.0
Per Capita Income (Ths.) 27.4 26.7 27.6 30.2 30.8 32.7 33.9 35.3 36.3 37.5 39.1 40.7 42.3Real Per Capita Income 24.3 23.7 24.0 25.7 25.7 27.2 27.8 28.9 29.4 29.9 30.4 31.0 31.5Average Annual Wage (Ths.) 42.7 43.7 43.2 42.9 45.5 46.3 47.2 48.4 49.4 50.8 52.4 54.0 55.8
Pct Chg Year Ago 4.8 2.4 -1.1 -0.8 6.1 1.8 1.9 2.5 2.0 2.9 3.2 3.1 3.2 Establishment Employment (Place of Work, Thousands, SA)Total Non-Farm Employment 59.8 57.6 58.4 58.6 59.2 60.5 62.1 63.3 64.8 66.2 67.3 68.4 69.6
Pct Chg Year Ago -1.3 -3.8 1.4 0.4 1.1 2.1 2.7 1.9 2.4 2.2 1.8 1.6 1.6Manufacturing 9.3 8.6 8.3 8.2 8.4 8.7 9.6 9.9 10.5 10.6 10.7 10.8 10.8
Pct Chg Year Ago 0.3 -7.9 -3.0 -1.1 2.2 3.7 10.5 2.6 6.6 0.9 0.9 0.6 0.7Nonmanufacturing 50.5 49.0 50.1 50.4 50.8 51.7 52.5 53.4 54.3 55.6 56.6 57.7 58.7
Pct Chg Year Ago -1.5 -3.0 2.2 0.6 0.9 1.8 1.4 1.7 1.7 2.4 1.9 1.8 1.8Construction & Mining 2.4 1.6 1.6 1.5 1.6 1.6 1.7 1.9 1.9 2.1 2.2 2.3 2.4
Pct Chg Year Ago -24.9 -32.0 -2.4 -1.6 4.2 0.0 7.9 10.3 1.7 8.4 6.1 4.2 3.6Trade, Trans, & Utilities 11.7 11.5 11.4 11.8 12.1 12.2 12.0 12.1 11.9 12.2 12.2 12.2 12.3
Pct Chg Year Ago -2.3 -1.5 -1.0 3.5 2.4 0.7 -0.8 0.2 -1.0 1.8 0.3 0.4 0.8Wholesale Trade 1.8 2.0 2.0 2.0 2.2 2.1 1.9 1.7 1.5 1.5 1.5 1.6 1.6Retail Trade 7.6 7.3 7.2 7.4 7.4 7.6 7.8 8.0 8.3 8.4 8.4 8.4 8.4Trans, Wrhsng, & Util 2.3 2.2 2.2 2.4 2.4 2.5 2.3 2.3 2.2 2.2 2.3 2.3 2.3
Information 0.7 0.6 0.6 0.4 0.4 0.4 0.4 0.3 0.3 0.3 0.3 0.3 0.3Pct Chg Year Ago -12.0 -5.9 1.5 -29.6 -7.3 0.0 0.2 -25.2 0.1 1.2 1.4 2.3 2.1
Financial Activities 1.8 1.6 1.6 1.5 1.6 1.5 1.6 1.5 1.5 1.5 1.5 1.5 1.5Pct Chg Year Ago -3.4 -12.4 0.0 -3.7 0.6 -3.1 4.5 -1.3 -0.5 -0.8 -2.3 -1.1 0.0
Prof & Business Services 4.4 4.1 4.2 4.4 4.3 4.3 3.8 3.7 3.7 3.9 4.0 4.1 4.2Pct Chg Year Ago -4.5 -7.7 3.8 4.7 -2.0 -0.3 -11.5 -2.2 -1.3 5.2 3.0 2.0 3.0
Educ & Health Services 7.5 7.7 8.1 8.2 8.3 8.8 9.1 9.4 9.6 9.8 10.0 10.2 10.4Pct Chg Year Ago 4.9 2.4 4.9 1.2 1.5 5.8 3.2 3.4 2.4 2.6 2.0 2.0 1.7
Leisure & Hospitality 5.0 4.7 4.5 4.6 4.7 5.0 5.4 5.4 5.5 5.6 5.7 5.8 5.8Pct Chg Year Ago 0.6 -6.3 -3.5 2.6 2.4 5.7 7.3 0.7 0.9 2.2 1.8 1.4 1.1
Other Services 1.5 1.4 1.4 1.4 1.4 1.4 1.3 1.4 1.4 1.4 1.4 1.4 1.4Pct Chg Year Ago -6.3 -6.9 0.0 1.3 0.7 -1.1 -2.9 2.9 3.0 -0.1 0.4 0.6 0.4
Federal Government 0.8 0.8 0.8 0.8 0.7 0.7 0.8 0.8 0.8 0.8 0.8 0.8 0.8Pct Chg Year Ago 1.1 -0.1 5.2 -5.8 -5.2 -3.1 6.1 1.0 4.3 -0.8 -1.1 -0.9 5.9
State & Local Government 14.8 15.0 15.9 15.6 15.7 15.9 16.3 16.9 17.6 18.0 18.5 19.1 19.5Pct Chg Year Ago 2.5 1.9 5.4 -1.3 0.3 1.2 3.0 3.3 4.1 2.1 3.0 3.0 2.4
Other Economic Indicators Population (Ths.) 250.7 253.1 257.1 260.0 261.9 263.7 266.4 268.8 271.6 275.1 278.8 282.7 286.7
Pct Chg Year Ago 0.8 0.9 1.6 1.1 0.8 0.7 1.0 0.9 1.0 1.3 1.3 1.4 1.4Labor Force (Ths.) 106.2 109.6 113.3 114.5 115.2 115.0 115.4 115.2 115.8 116.3 116.9 118.2 119.5
Pct Chg Year Ago 2.3 3.2 3.4 1.1 0.6 -0.2 0.4 -0.2 0.6 0.4 0.5 1.1 1.1Unemployment Rate (%) 12.7 16.6 18.0 17.7 16.4 14.5 12.8 11.0 10.3 9.7 9.2 9.2 9.0Total Housing Starts 363 120 119 126 180 165 169 93 358 925 1204 1220 1256
Single-Family 282 118 116 99 77 97 162 93 351 873 1104 1115 1147Multifamily 81 2 3 28 103 68 7 0 7 52 100 105 109
* Real personal income and real per capita income are adjusted for inflation and regional purchasing power parities. This facilitates interregional comparisons of income that control for the cost of living.
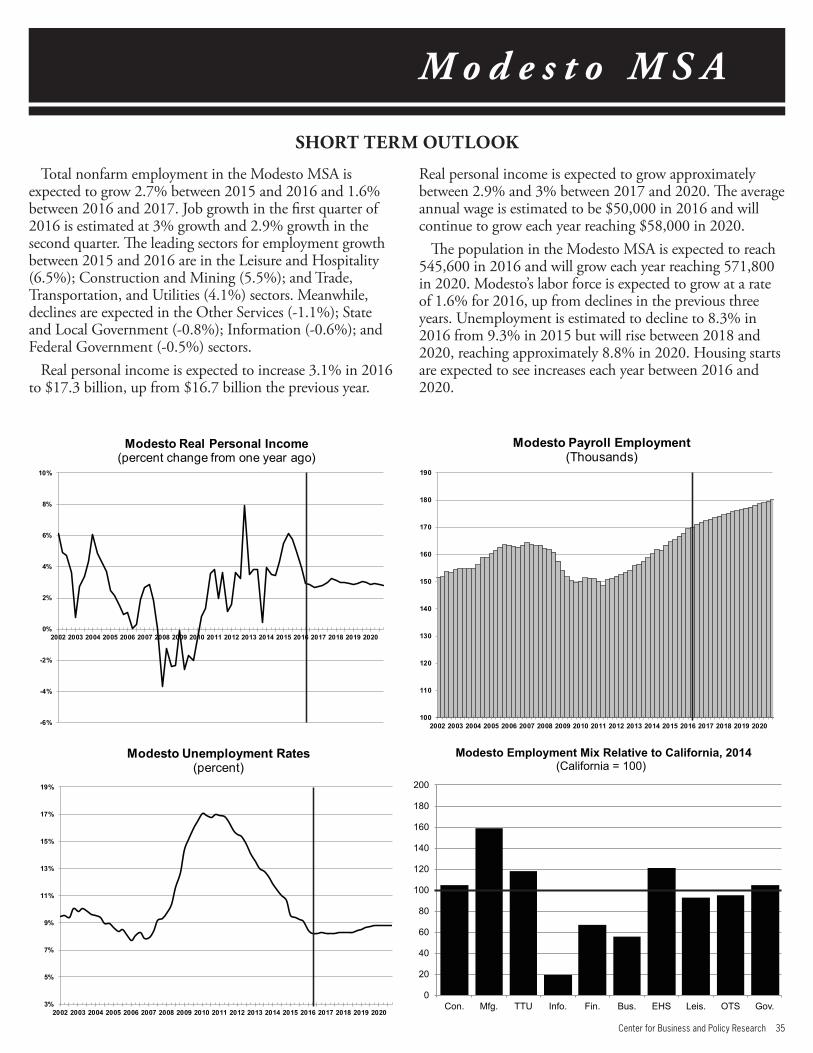
Center for Business and Policy Research 35
M o d e s t o M S A
Total nonfarm employment in the Modesto MSA is expected to grow 2.7% between 2015 and 2016 and 1.6% between 2016 and 2017. Job growth in the first quarter of 2016 is estimated at 3% growth and 2.9% growth in the second quarter. The leading sectors for employment growth between 2015 and 2016 are in the Leisure and Hospitality (6.5%); Construction and Mining (5.5%); and Trade, Transportation, and Utilities (4.1%) sectors. Meanwhile, declines are expected in the Other Services (-1.1%); State and Local Government (-0.8%); Information (-0.6%); and Federal Government (-0.5%) sectors.
Real personal income is expected to increase 3.1% in 2016 to $17.3 billion, up from $16.7 billion the previous year.
Real personal income is expected to grow approximately between 2.9% and 3% between 2017 and 2020. The average annual wage is estimated to be $50,000 in 2016 and will continue to grow each year reaching $58,000 in 2020.
The population in the Modesto MSA is expected to reach 545,600 in 2016 and will grow each year reaching 571,800 in 2020. Modesto’s labor force is expected to grow at a rate of 1.6% for 2016, up from declines in the previous three years. Unemployment is estimated to decline to 8.3% in 2016 from 9.3% in 2015 but will rise between 2018 and 2020, reaching approximately 8.8% in 2020. Housing starts are expected to see increases each year between 2016 and 2020.
SHORT TERM OUTLOOK
0
20
40
60
80
100
120
140
160
180
200
Con. Mfg. TTU Info. Fin. Bus. EHS Leis. OTS Gov.
Modesto Employment Mix Relative to California, 2014(California = 100)
-6%
-4%
-2%
0%
2%
4%
6%
8%
10%
2002 2003 2004 2005 2006 2007 2008 2009 2010 2011 2012 2013 2014 2015 2016 2017 2018 2019 2020
Modesto Real Personal Income (percent change from one year ago)
3%
5%
7%
9%
11%
13%
15%
17%
19%
2002 2003 2004 2005 2006 2007 2008 2009 2010 2011 2012 2013 2014 2015 2016 2017 2018 2019 2020
Modesto Unemployment Rates(percent)
100
110
120
130
140
150
160
170
180
190
2002 2003 2004 2005 2006 2007 2008 2009 2010 2011 2012 2013 2014 2015 2016 2017 2018 2019 2020
Modesto Payroll Employment (Thousands)
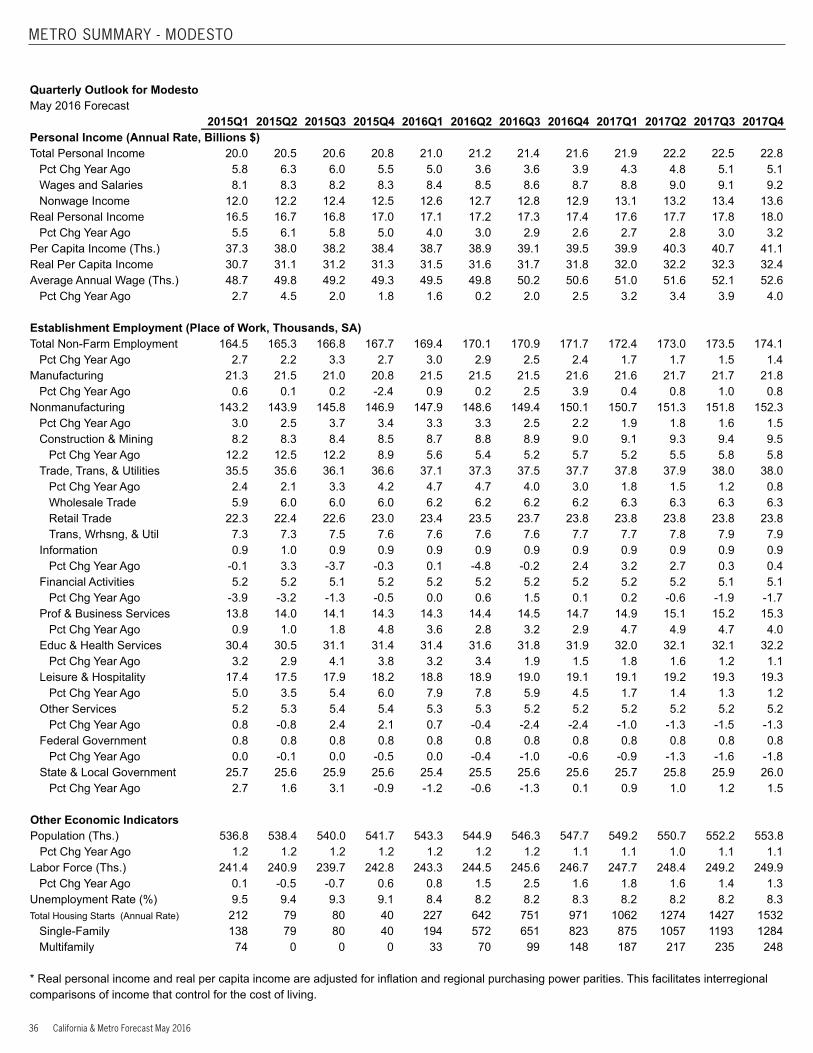
36 California & Metro Forecast May 2016
METRO SUMMARY - MODESTO
Quarterly Outlook for ModestoMay 2016 Forecast 2015Q1 2015Q2 2015Q3 2015Q4 2016Q1 2016Q2 2016Q3 2016Q4 2017Q1 2017Q2 2017Q3 2017Q4Personal Income (Annual Rate, Billions $) Total Personal Income 20.0 20.5 20.6 20.8 21.0 21.2 21.4 21.6 21.9 22.2 22.5 22.8
Pct Chg Year Ago 5.8 6.3 6.0 5.5 5.0 3.6 3.6 3.9 4.3 4.8 5.1 5.1Wages and Salaries 8.1 8.3 8.2 8.3 8.4 8.5 8.6 8.7 8.8 9.0 9.1 9.2Nonwage Income 12.0 12.2 12.4 12.5 12.6 12.7 12.8 12.9 13.1 13.2 13.4 13.6
Real Personal Income 16.5 16.7 16.8 17.0 17.1 17.2 17.3 17.4 17.6 17.7 17.8 18.0Pct Chg Year Ago 5.5 6.1 5.8 5.0 4.0 3.0 2.9 2.6 2.7 2.8 3.0 3.2
Per Capita Income (Ths.) 37.3 38.0 38.2 38.4 38.7 38.9 39.1 39.5 39.9 40.3 40.7 41.1Real Per Capita Income 30.7 31.1 31.2 31.3 31.5 31.6 31.7 31.8 32.0 32.2 32.3 32.4Average Annual Wage (Ths.) 48.7 49.8 49.2 49.3 49.5 49.8 50.2 50.6 51.0 51.6 52.1 52.6
Pct Chg Year Ago 2.7 4.5 2.0 1.8 1.6 0.2 2.0 2.5 3.2 3.4 3.9 4.0 Establishment Employment (Place of Work, Thousands, SA)Total Non-Farm Employment 164.5 165.3 166.8 167.7 169.4 170.1 170.9 171.7 172.4 173.0 173.5 174.1
Pct Chg Year Ago 2.7 2.2 3.3 2.7 3.0 2.9 2.5 2.4 1.7 1.7 1.5 1.4Manufacturing 21.3 21.5 21.0 20.8 21.5 21.5 21.5 21.6 21.6 21.7 21.7 21.8
Pct Chg Year Ago 0.6 0.1 0.2 -2.4 0.9 0.2 2.5 3.9 0.4 0.8 1.0 0.8Nonmanufacturing 143.2 143.9 145.8 146.9 147.9 148.6 149.4 150.1 150.7 151.3 151.8 152.3
Pct Chg Year Ago 3.0 2.5 3.7 3.4 3.3 3.3 2.5 2.2 1.9 1.8 1.6 1.5Construction & Mining 8.2 8.3 8.4 8.5 8.7 8.8 8.9 9.0 9.1 9.3 9.4 9.5
Pct Chg Year Ago 12.2 12.5 12.2 8.9 5.6 5.4 5.2 5.7 5.2 5.5 5.8 5.8Trade, Trans, & Utilities 35.5 35.6 36.1 36.6 37.1 37.3 37.5 37.7 37.8 37.9 38.0 38.0
Pct Chg Year Ago 2.4 2.1 3.3 4.2 4.7 4.7 4.0 3.0 1.8 1.5 1.2 0.8Wholesale Trade 5.9 6.0 6.0 6.0 6.2 6.2 6.2 6.2 6.3 6.3 6.3 6.3Retail Trade 22.3 22.4 22.6 23.0 23.4 23.5 23.7 23.8 23.8 23.8 23.8 23.8Trans, Wrhsng, & Util 7.3 7.3 7.5 7.6 7.6 7.6 7.6 7.7 7.7 7.8 7.9 7.9
Information 0.9 1.0 0.9 0.9 0.9 0.9 0.9 0.9 0.9 0.9 0.9 0.9Pct Chg Year Ago -0.1 3.3 -3.7 -0.3 0.1 -4.8 -0.2 2.4 3.2 2.7 0.3 0.4
Financial Activities 5.2 5.2 5.1 5.2 5.2 5.2 5.2 5.2 5.2 5.2 5.1 5.1Pct Chg Year Ago -3.9 -3.2 -1.3 -0.5 0.0 0.6 1.5 0.1 0.2 -0.6 -1.9 -1.7
Prof & Business Services 13.8 14.0 14.1 14.3 14.3 14.4 14.5 14.7 14.9 15.1 15.2 15.3Pct Chg Year Ago 0.9 1.0 1.8 4.8 3.6 2.8 3.2 2.9 4.7 4.9 4.7 4.0
Educ & Health Services 30.4 30.5 31.1 31.4 31.4 31.6 31.8 31.9 32.0 32.1 32.1 32.2Pct Chg Year Ago 3.2 2.9 4.1 3.8 3.2 3.4 1.9 1.5 1.8 1.6 1.2 1.1
Leisure & Hospitality 17.4 17.5 17.9 18.2 18.8 18.9 19.0 19.1 19.1 19.2 19.3 19.3Pct Chg Year Ago 5.0 3.5 5.4 6.0 7.9 7.8 5.9 4.5 1.7 1.4 1.3 1.2
Other Services 5.2 5.3 5.4 5.4 5.3 5.3 5.2 5.2 5.2 5.2 5.2 5.2Pct Chg Year Ago 0.8 -0.8 2.4 2.1 0.7 -0.4 -2.4 -2.4 -1.0 -1.3 -1.5 -1.3
Federal Government 0.8 0.8 0.8 0.8 0.8 0.8 0.8 0.8 0.8 0.8 0.8 0.8Pct Chg Year Ago 0.0 -0.1 0.0 -0.5 0.0 -0.4 -1.0 -0.6 -0.9 -1.3 -1.6 -1.8
State & Local Government 25.7 25.6 25.9 25.6 25.4 25.5 25.6 25.6 25.7 25.8 25.9 26.0Pct Chg Year Ago 2.7 1.6 3.1 -0.9 -1.2 -0.6 -1.3 0.1 0.9 1.0 1.2 1.5
Other Economic Indicators Population (Ths.) 536.8 538.4 540.0 541.7 543.3 544.9 546.3 547.7 549.2 550.7 552.2 553.8
Pct Chg Year Ago 1.2 1.2 1.2 1.2 1.2 1.2 1.2 1.1 1.1 1.0 1.1 1.1Labor Force (Ths.) 241.4 240.9 239.7 242.8 243.3 244.5 245.6 246.7 247.7 248.4 249.2 249.9
Pct Chg Year Ago 0.1 -0.5 -0.7 0.6 0.8 1.5 2.5 1.6 1.8 1.6 1.4 1.3Unemployment Rate (%) 9.5 9.4 9.3 9.1 8.4 8.2 8.2 8.3 8.2 8.2 8.2 8.3Total Housing Starts (Annual Rate) 212 79 80 40 227 642 751 971 1062 1274 1427 1532
Single-Family 138 79 80 40 194 572 651 823 875 1057 1193 1284Multifamily 74 0 0 0 33 70 99 148 187 217 235 248
* Real personal income and real per capita income are adjusted for inflation and regional purchasing power parities. This facilitates interregional comparisons of income that control for the cost of living.
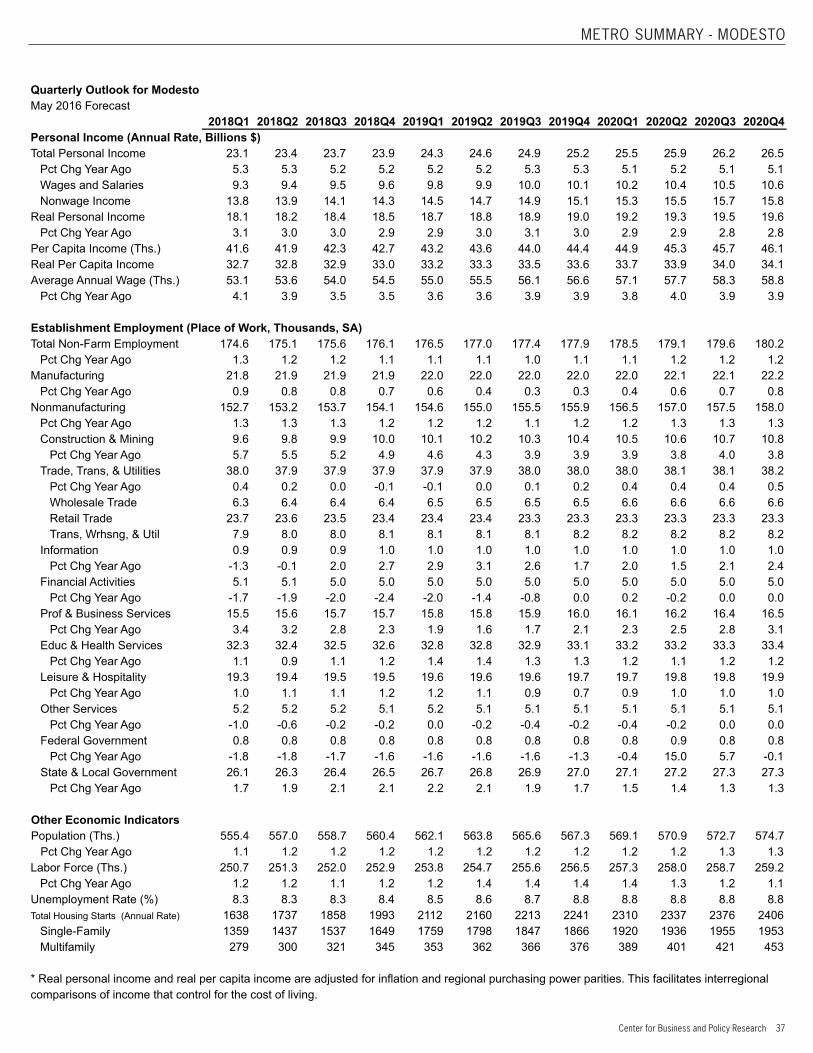
Center for Business and Policy Research 37
METRO SUMMARY - MODESTO
Quarterly Outlook for ModestoMay 2016 Forecast 2018Q1 2018Q2 2018Q3 2018Q4 2019Q1 2019Q2 2019Q3 2019Q4 2020Q1 2020Q2 2020Q3 2020Q4Personal Income (Annual Rate, Billions $) Total Personal Income 23.1 23.4 23.7 23.9 24.3 24.6 24.9 25.2 25.5 25.9 26.2 26.5
Pct Chg Year Ago 5.3 5.3 5.2 5.2 5.2 5.2 5.3 5.3 5.1 5.2 5.1 5.1Wages and Salaries 9.3 9.4 9.5 9.6 9.8 9.9 10.0 10.1 10.2 10.4 10.5 10.6Nonwage Income 13.8 13.9 14.1 14.3 14.5 14.7 14.9 15.1 15.3 15.5 15.7 15.8
Real Personal Income 18.1 18.2 18.4 18.5 18.7 18.8 18.9 19.0 19.2 19.3 19.5 19.6Pct Chg Year Ago 3.1 3.0 3.0 2.9 2.9 3.0 3.1 3.0 2.9 2.9 2.8 2.8
Per Capita Income (Ths.) 41.6 41.9 42.3 42.7 43.2 43.6 44.0 44.4 44.9 45.3 45.7 46.1Real Per Capita Income 32.7 32.8 32.9 33.0 33.2 33.3 33.5 33.6 33.7 33.9 34.0 34.1Average Annual Wage (Ths.) 53.1 53.6 54.0 54.5 55.0 55.5 56.1 56.6 57.1 57.7 58.3 58.8
Pct Chg Year Ago 4.1 3.9 3.5 3.5 3.6 3.6 3.9 3.9 3.8 4.0 3.9 3.9 Establishment Employment (Place of Work, Thousands, SA)Total Non-Farm Employment 174.6 175.1 175.6 176.1 176.5 177.0 177.4 177.9 178.5 179.1 179.6 180.2
Pct Chg Year Ago 1.3 1.2 1.2 1.1 1.1 1.1 1.0 1.1 1.1 1.2 1.2 1.2Manufacturing 21.8 21.9 21.9 21.9 22.0 22.0 22.0 22.0 22.0 22.1 22.1 22.2
Pct Chg Year Ago 0.9 0.8 0.8 0.7 0.6 0.4 0.3 0.3 0.4 0.6 0.7 0.8Nonmanufacturing 152.7 153.2 153.7 154.1 154.6 155.0 155.5 155.9 156.5 157.0 157.5 158.0
Pct Chg Year Ago 1.3 1.3 1.3 1.2 1.2 1.2 1.1 1.2 1.2 1.3 1.3 1.3Construction & Mining 9.6 9.8 9.9 10.0 10.1 10.2 10.3 10.4 10.5 10.6 10.7 10.8
Pct Chg Year Ago 5.7 5.5 5.2 4.9 4.6 4.3 3.9 3.9 3.9 3.8 4.0 3.8Trade, Trans, & Utilities 38.0 37.9 37.9 37.9 37.9 37.9 38.0 38.0 38.0 38.1 38.1 38.2
Pct Chg Year Ago 0.4 0.2 0.0 -0.1 -0.1 0.0 0.1 0.2 0.4 0.4 0.4 0.5Wholesale Trade 6.3 6.4 6.4 6.4 6.5 6.5 6.5 6.5 6.6 6.6 6.6 6.6Retail Trade 23.7 23.6 23.5 23.4 23.4 23.4 23.3 23.3 23.3 23.3 23.3 23.3Trans, Wrhsng, & Util 7.9 8.0 8.0 8.1 8.1 8.1 8.1 8.2 8.2 8.2 8.2 8.2
Information 0.9 0.9 0.9 1.0 1.0 1.0 1.0 1.0 1.0 1.0 1.0 1.0Pct Chg Year Ago -1.3 -0.1 2.0 2.7 2.9 3.1 2.6 1.7 2.0 1.5 2.1 2.4
Financial Activities 5.1 5.1 5.0 5.0 5.0 5.0 5.0 5.0 5.0 5.0 5.0 5.0Pct Chg Year Ago -1.7 -1.9 -2.0 -2.4 -2.0 -1.4 -0.8 0.0 0.2 -0.2 0.0 0.0
Prof & Business Services 15.5 15.6 15.7 15.7 15.8 15.8 15.9 16.0 16.1 16.2 16.4 16.5Pct Chg Year Ago 3.4 3.2 2.8 2.3 1.9 1.6 1.7 2.1 2.3 2.5 2.8 3.1
Educ & Health Services 32.3 32.4 32.5 32.6 32.8 32.8 32.9 33.1 33.2 33.2 33.3 33.4Pct Chg Year Ago 1.1 0.9 1.1 1.2 1.4 1.4 1.3 1.3 1.2 1.1 1.2 1.2
Leisure & Hospitality 19.3 19.4 19.5 19.5 19.6 19.6 19.6 19.7 19.7 19.8 19.8 19.9Pct Chg Year Ago 1.0 1.1 1.1 1.2 1.2 1.1 0.9 0.7 0.9 1.0 1.0 1.0
Other Services 5.2 5.2 5.2 5.1 5.2 5.1 5.1 5.1 5.1 5.1 5.1 5.1Pct Chg Year Ago -1.0 -0.6 -0.2 -0.2 0.0 -0.2 -0.4 -0.2 -0.4 -0.2 0.0 0.0
Federal Government 0.8 0.8 0.8 0.8 0.8 0.8 0.8 0.8 0.8 0.9 0.8 0.8Pct Chg Year Ago -1.8 -1.8 -1.7 -1.6 -1.6 -1.6 -1.6 -1.3 -0.4 15.0 5.7 -0.1
State & Local Government 26.1 26.3 26.4 26.5 26.7 26.8 26.9 27.0 27.1 27.2 27.3 27.3Pct Chg Year Ago 1.7 1.9 2.1 2.1 2.2 2.1 1.9 1.7 1.5 1.4 1.3 1.3
Other Economic Indicators Population (Ths.) 555.4 557.0 558.7 560.4 562.1 563.8 565.6 567.3 569.1 570.9 572.7 574.7
Pct Chg Year Ago 1.1 1.2 1.2 1.2 1.2 1.2 1.2 1.2 1.2 1.2 1.3 1.3Labor Force (Ths.) 250.7 251.3 252.0 252.9 253.8 254.7 255.6 256.5 257.3 258.0 258.7 259.2
Pct Chg Year Ago 1.2 1.2 1.1 1.2 1.2 1.4 1.4 1.4 1.4 1.3 1.2 1.1Unemployment Rate (%) 8.3 8.3 8.3 8.4 8.5 8.6 8.7 8.8 8.8 8.8 8.8 8.8Total Housing Starts (Annual Rate) 1638 1737 1858 1993 2112 2160 2213 2241 2310 2337 2376 2406
Single-Family 1359 1437 1537 1649 1759 1798 1847 1866 1920 1936 1955 1953Multifamily 279 300 321 345 353 362 366 376 389 401 421 453
* Real personal income and real per capita income are adjusted for inflation and regional purchasing power parities. This facilitates interregional comparisons of income that control for the cost of living.
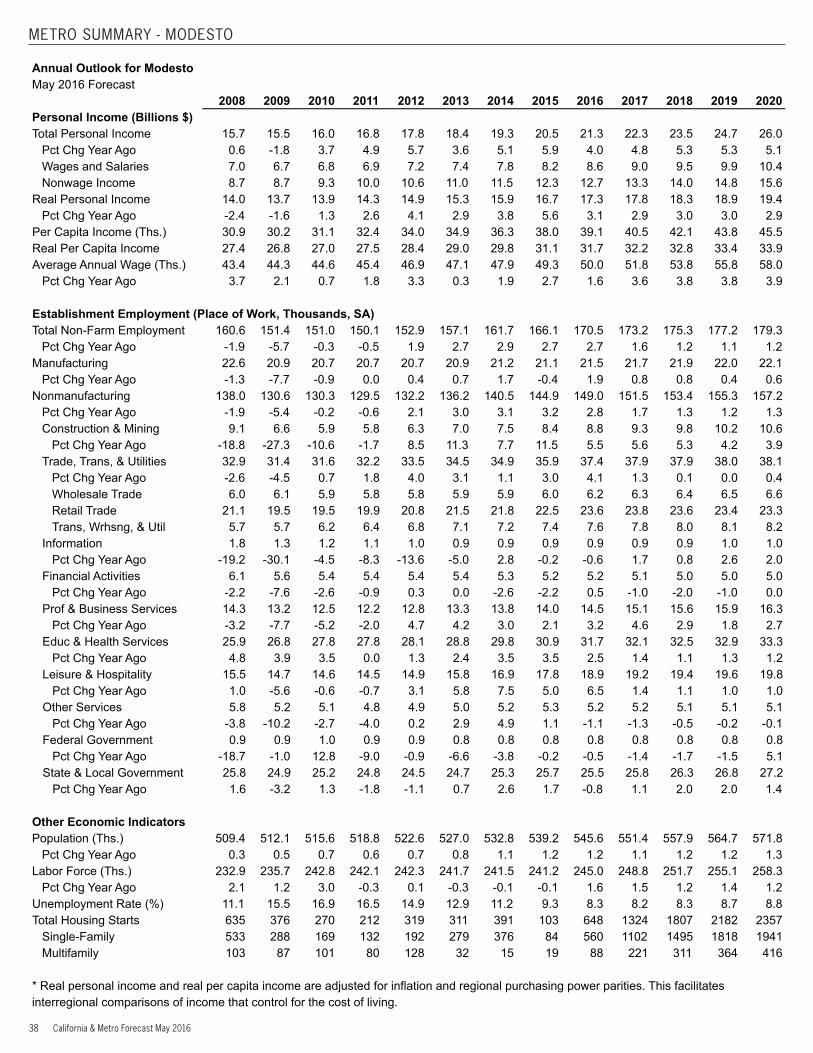
38 California & Metro Forecast May 2016
METRO SUMMARY - MODESTO
Annual Outlook for ModestoMay 2016 Forecast 2008 2009 2010 2011 2012 2013 2014 2015 2016 2017 2018 2019 2020Personal Income (Billions $) Total Personal Income 15.7 15.5 16.0 16.8 17.8 18.4 19.3 20.5 21.3 22.3 23.5 24.7 26.0
Pct Chg Year Ago 0.6 -1.8 3.7 4.9 5.7 3.6 5.1 5.9 4.0 4.8 5.3 5.3 5.1Wages and Salaries 7.0 6.7 6.8 6.9 7.2 7.4 7.8 8.2 8.6 9.0 9.5 9.9 10.4Nonwage Income 8.7 8.7 9.3 10.0 10.6 11.0 11.5 12.3 12.7 13.3 14.0 14.8 15.6
Real Personal Income 14.0 13.7 13.9 14.3 14.9 15.3 15.9 16.7 17.3 17.8 18.3 18.9 19.4Pct Chg Year Ago -2.4 -1.6 1.3 2.6 4.1 2.9 3.8 5.6 3.1 2.9 3.0 3.0 2.9
Per Capita Income (Ths.) 30.9 30.2 31.1 32.4 34.0 34.9 36.3 38.0 39.1 40.5 42.1 43.8 45.5Real Per Capita Income 27.4 26.8 27.0 27.5 28.4 29.0 29.8 31.1 31.7 32.2 32.8 33.4 33.9Average Annual Wage (Ths.) 43.4 44.3 44.6 45.4 46.9 47.1 47.9 49.3 50.0 51.8 53.8 55.8 58.0
Pct Chg Year Ago 3.7 2.1 0.7 1.8 3.3 0.3 1.9 2.7 1.6 3.6 3.8 3.8 3.9 Establishment Employment (Place of Work, Thousands, SA)Total Non-Farm Employment 160.6 151.4 151.0 150.1 152.9 157.1 161.7 166.1 170.5 173.2 175.3 177.2 179.3
Pct Chg Year Ago -1.9 -5.7 -0.3 -0.5 1.9 2.7 2.9 2.7 2.7 1.6 1.2 1.1 1.2Manufacturing 22.6 20.9 20.7 20.7 20.7 20.9 21.2 21.1 21.5 21.7 21.9 22.0 22.1
Pct Chg Year Ago -1.3 -7.7 -0.9 0.0 0.4 0.7 1.7 -0.4 1.9 0.8 0.8 0.4 0.6Nonmanufacturing 138.0 130.6 130.3 129.5 132.2 136.2 140.5 144.9 149.0 151.5 153.4 155.3 157.2
Pct Chg Year Ago -1.9 -5.4 -0.2 -0.6 2.1 3.0 3.1 3.2 2.8 1.7 1.3 1.2 1.3Construction & Mining 9.1 6.6 5.9 5.8 6.3 7.0 7.5 8.4 8.8 9.3 9.8 10.2 10.6
Pct Chg Year Ago -18.8 -27.3 -10.6 -1.7 8.5 11.3 7.7 11.5 5.5 5.6 5.3 4.2 3.9Trade, Trans, & Utilities 32.9 31.4 31.6 32.2 33.5 34.5 34.9 35.9 37.4 37.9 37.9 38.0 38.1
Pct Chg Year Ago -2.6 -4.5 0.7 1.8 4.0 3.1 1.1 3.0 4.1 1.3 0.1 0.0 0.4Wholesale Trade 6.0 6.1 5.9 5.8 5.8 5.9 5.9 6.0 6.2 6.3 6.4 6.5 6.6Retail Trade 21.1 19.5 19.5 19.9 20.8 21.5 21.8 22.5 23.6 23.8 23.6 23.4 23.3Trans, Wrhsng, & Util 5.7 5.7 6.2 6.4 6.8 7.1 7.2 7.4 7.6 7.8 8.0 8.1 8.2
Information 1.8 1.3 1.2 1.1 1.0 0.9 0.9 0.9 0.9 0.9 0.9 1.0 1.0Pct Chg Year Ago -19.2 -30.1 -4.5 -8.3 -13.6 -5.0 2.8 -0.2 -0.6 1.7 0.8 2.6 2.0
Financial Activities 6.1 5.6 5.4 5.4 5.4 5.4 5.3 5.2 5.2 5.1 5.0 5.0 5.0Pct Chg Year Ago -2.2 -7.6 -2.6 -0.9 0.3 0.0 -2.6 -2.2 0.5 -1.0 -2.0 -1.0 0.0
Prof & Business Services 14.3 13.2 12.5 12.2 12.8 13.3 13.8 14.0 14.5 15.1 15.6 15.9 16.3Pct Chg Year Ago -3.2 -7.7 -5.2 -2.0 4.7 4.2 3.0 2.1 3.2 4.6 2.9 1.8 2.7
Educ & Health Services 25.9 26.8 27.8 27.8 28.1 28.8 29.8 30.9 31.7 32.1 32.5 32.9 33.3Pct Chg Year Ago 4.8 3.9 3.5 0.0 1.3 2.4 3.5 3.5 2.5 1.4 1.1 1.3 1.2
Leisure & Hospitality 15.5 14.7 14.6 14.5 14.9 15.8 16.9 17.8 18.9 19.2 19.4 19.6 19.8Pct Chg Year Ago 1.0 -5.6 -0.6 -0.7 3.1 5.8 7.5 5.0 6.5 1.4 1.1 1.0 1.0
Other Services 5.8 5.2 5.1 4.8 4.9 5.0 5.2 5.3 5.2 5.2 5.1 5.1 5.1Pct Chg Year Ago -3.8 -10.2 -2.7 -4.0 0.2 2.9 4.9 1.1 -1.1 -1.3 -0.5 -0.2 -0.1
Federal Government 0.9 0.9 1.0 0.9 0.9 0.8 0.8 0.8 0.8 0.8 0.8 0.8 0.8Pct Chg Year Ago -18.7 -1.0 12.8 -9.0 -0.9 -6.6 -3.8 -0.2 -0.5 -1.4 -1.7 -1.5 5.1
State & Local Government 25.8 24.9 25.2 24.8 24.5 24.7 25.3 25.7 25.5 25.8 26.3 26.8 27.2Pct Chg Year Ago 1.6 -3.2 1.3 -1.8 -1.1 0.7 2.6 1.7 -0.8 1.1 2.0 2.0 1.4
Other Economic Indicators Population (Ths.) 509.4 512.1 515.6 518.8 522.6 527.0 532.8 539.2 545.6 551.4 557.9 564.7 571.8
Pct Chg Year Ago 0.3 0.5 0.7 0.6 0.7 0.8 1.1 1.2 1.2 1.1 1.2 1.2 1.3Labor Force (Ths.) 232.9 235.7 242.8 242.1 242.3 241.7 241.5 241.2 245.0 248.8 251.7 255.1 258.3
Pct Chg Year Ago 2.1 1.2 3.0 -0.3 0.1 -0.3 -0.1 -0.1 1.6 1.5 1.2 1.4 1.2Unemployment Rate (%) 11.1 15.5 16.9 16.5 14.9 12.9 11.2 9.3 8.3 8.2 8.3 8.7 8.8Total Housing Starts 635 376 270 212 319 311 391 103 648 1324 1807 2182 2357
Single-Family 533 288 169 132 192 279 376 84 560 1102 1495 1818 1941Multifamily 103 87 101 80 128 32 15 19 88 221 311 364 416
* Real personal income and real per capita income are adjusted for inflation and regional purchasing power parities. This facilitates interregional comparisons of income that control for the cost of living.
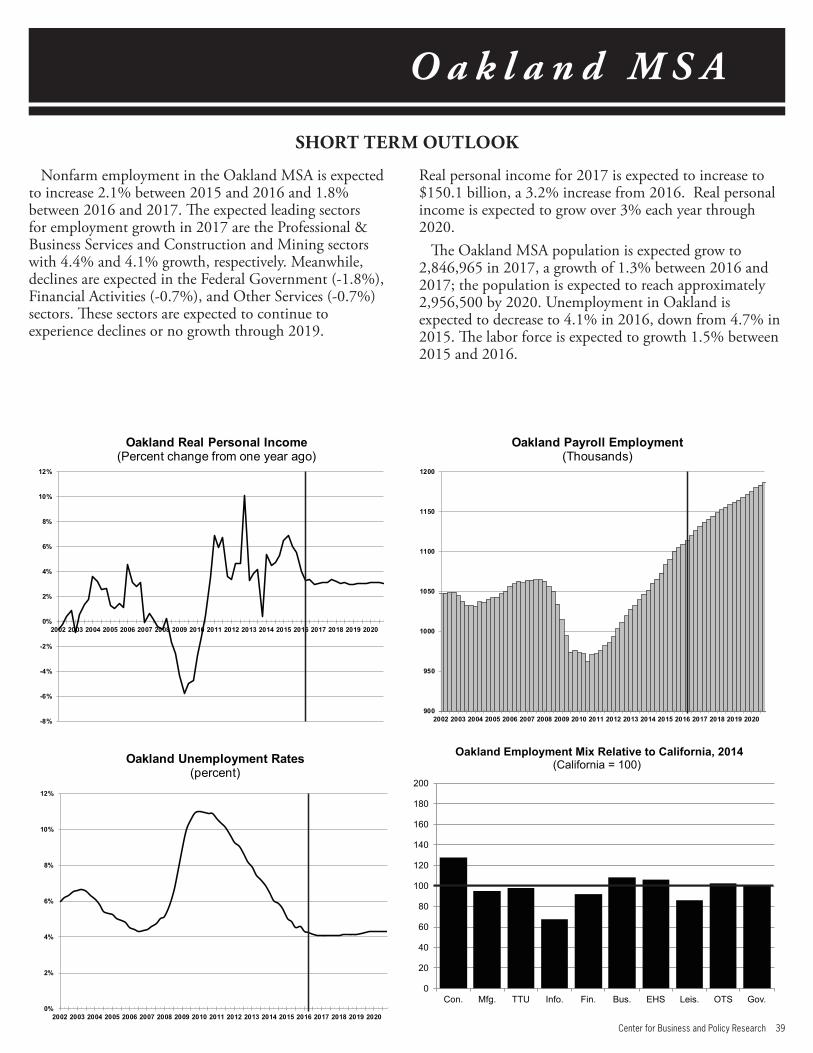
Center for Business and Policy Research 39
O a k l a n d M S A
Nonfarm employment in the Oakland MSA is expected to increase 2.1% between 2015 and 2016 and 1.8% between 2016 and 2017. The expected leading sectors for employment growth in 2017 are the Professional & Business Services and Construction and Mining sectors with 4.4% and 4.1% growth, respectively. Meanwhile, declines are expected in the Federal Government (-1.8%), Financial Activities (-0.7%), and Other Services (-0.7%) sectors. These sectors are expected to continue to experience declines or no growth through 2019.
Real personal income for 2017 is expected to increase to $150.1 billion, a 3.2% increase from 2016. Real personal income is expected to grow over 3% each year through 2020.
The Oakland MSA population is expected grow to 2,846,965 in 2017, a growth of 1.3% between 2016 and 2017; the population is expected to reach approximately 2,956,500 by 2020. Unemployment in Oakland is expected to decrease to 4.1% in 2016, down from 4.7% in 2015. The labor force is expected to growth 1.5% between 2015 and 2016.
SHORT TERM OUTLOOK
0
20
40
60
80
100
120
140
160
180
200
Con. Mfg. TTU Info. Fin. Bus. EHS Leis. OTS Gov.
Oakland Employment Mix Relative to California, 2014(California = 100)
-8%
-6%
-4%
-2%
0%
2%
4%
6%
8%
10%
12%
2002 2003 2004 2005 2006 2007 2008 2009 2010 2011 2012 2013 2014 2015 2016 2017 2018 2019 2020
Oakland Real Personal Income(Percent change from one year ago)
0%
2%
4%
6%
8%
10%
12%
2002 2003 2004 2005 2006 2007 2008 2009 2010 2011 2012 2013 2014 2015 2016 2017 2018 2019 2020
Oakland Unemployment Rates(percent)
900
950
1000
1050
1100
1150
1200
2002 2003 2004 2005 2006 2007 2008 2009 2010 2011 2012 2013 2014 2015 2016 2017 2018 2019 2020
Oakland Payroll Employment (Thousands)
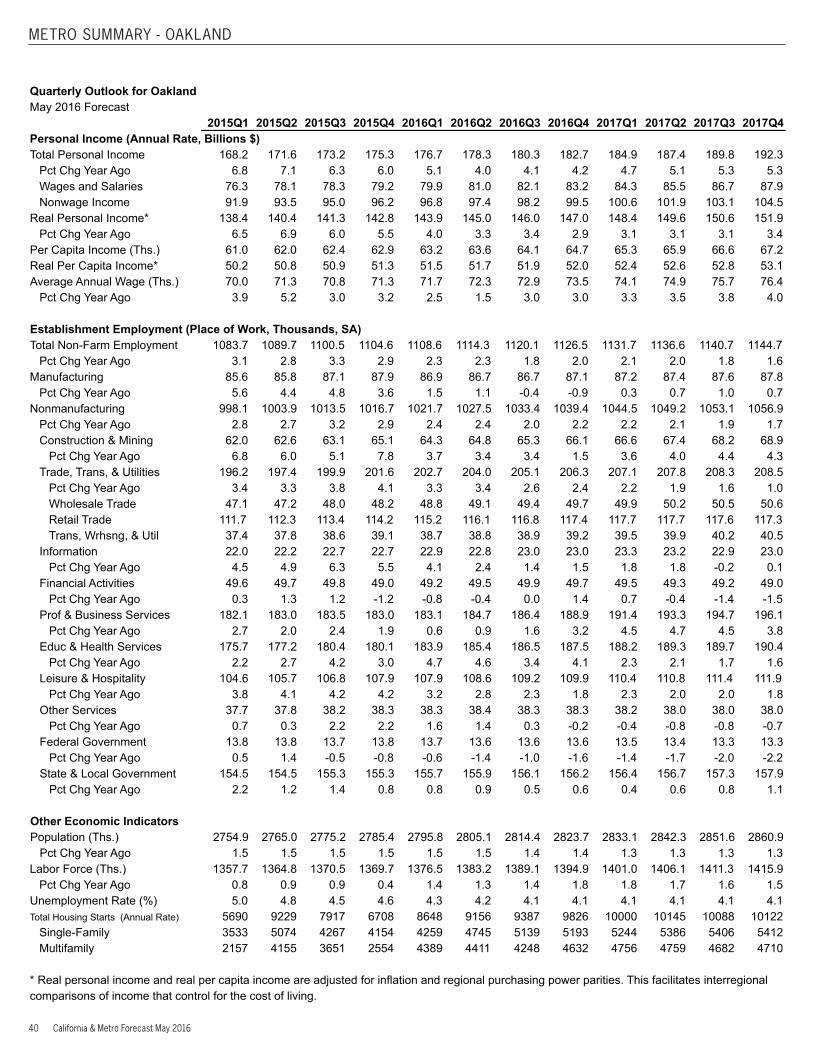
40 California & Metro Forecast May 2016
METRO SUMMARY - OAKLAND
Quarterly Outlook for OaklandMay 2016 Forecast 2015Q1 2015Q2 2015Q3 2015Q4 2016Q1 2016Q2 2016Q3 2016Q4 2017Q1 2017Q2 2017Q3 2017Q4Personal Income (Annual Rate, Billions $) Total Personal Income 168.2 171.6 173.2 175.3 176.7 178.3 180.3 182.7 184.9 187.4 189.8 192.3
Pct Chg Year Ago 6.8 7.1 6.3 6.0 5.1 4.0 4.1 4.2 4.7 5.1 5.3 5.3Wages and Salaries 76.3 78.1 78.3 79.2 79.9 81.0 82.1 83.2 84.3 85.5 86.7 87.9Nonwage Income 91.9 93.5 95.0 96.2 96.8 97.4 98.2 99.5 100.6 101.9 103.1 104.5
Real Personal Income* 138.4 140.4 141.3 142.8 143.9 145.0 146.0 147.0 148.4 149.6 150.6 151.9Pct Chg Year Ago 6.5 6.9 6.0 5.5 4.0 3.3 3.4 2.9 3.1 3.1 3.1 3.4
Per Capita Income (Ths.) 61.0 62.0 62.4 62.9 63.2 63.6 64.1 64.7 65.3 65.9 66.6 67.2Real Per Capita Income* 50.2 50.8 50.9 51.3 51.5 51.7 51.9 52.0 52.4 52.6 52.8 53.1Average Annual Wage (Ths.) 70.0 71.3 70.8 71.3 71.7 72.3 72.9 73.5 74.1 74.9 75.7 76.4
Pct Chg Year Ago 3.9 5.2 3.0 3.2 2.5 1.5 3.0 3.0 3.3 3.5 3.8 4.0 Establishment Employment (Place of Work, Thousands, SA)Total Non-Farm Employment 1083.7 1089.7 1100.5 1104.6 1108.6 1114.3 1120.1 1126.5 1131.7 1136.6 1140.7 1144.7
Pct Chg Year Ago 3.1 2.8 3.3 2.9 2.3 2.3 1.8 2.0 2.1 2.0 1.8 1.6Manufacturing 85.6 85.8 87.1 87.9 86.9 86.7 86.7 87.1 87.2 87.4 87.6 87.8
Pct Chg Year Ago 5.6 4.4 4.8 3.6 1.5 1.1 -0.4 -0.9 0.3 0.7 1.0 0.7Nonmanufacturing 998.1 1003.9 1013.5 1016.7 1021.7 1027.5 1033.4 1039.4 1044.5 1049.2 1053.1 1056.9
Pct Chg Year Ago 2.8 2.7 3.2 2.9 2.4 2.4 2.0 2.2 2.2 2.1 1.9 1.7Construction & Mining 62.0 62.6 63.1 65.1 64.3 64.8 65.3 66.1 66.6 67.4 68.2 68.9
Pct Chg Year Ago 6.8 6.0 5.1 7.8 3.7 3.4 3.4 1.5 3.6 4.0 4.4 4.3Trade, Trans, & Utilities 196.2 197.4 199.9 201.6 202.7 204.0 205.1 206.3 207.1 207.8 208.3 208.5
Pct Chg Year Ago 3.4 3.3 3.8 4.1 3.3 3.4 2.6 2.4 2.2 1.9 1.6 1.0Wholesale Trade 47.1 47.2 48.0 48.2 48.8 49.1 49.4 49.7 49.9 50.2 50.5 50.6Retail Trade 111.7 112.3 113.4 114.2 115.2 116.1 116.8 117.4 117.7 117.7 117.6 117.3Trans, Wrhsng, & Util 37.4 37.8 38.6 39.1 38.7 38.8 38.9 39.2 39.5 39.9 40.2 40.5
Information 22.0 22.2 22.7 22.7 22.9 22.8 23.0 23.0 23.3 23.2 22.9 23.0Pct Chg Year Ago 4.5 4.9 6.3 5.5 4.1 2.4 1.4 1.5 1.8 1.8 -0.2 0.1
Financial Activities 49.6 49.7 49.8 49.0 49.2 49.5 49.9 49.7 49.5 49.3 49.2 49.0Pct Chg Year Ago 0.3 1.3 1.2 -1.2 -0.8 -0.4 0.0 1.4 0.7 -0.4 -1.4 -1.5
Prof & Business Services 182.1 183.0 183.5 183.0 183.1 184.7 186.4 188.9 191.4 193.3 194.7 196.1Pct Chg Year Ago 2.7 2.0 2.4 1.9 0.6 0.9 1.6 3.2 4.5 4.7 4.5 3.8
Educ & Health Services 175.7 177.2 180.4 180.1 183.9 185.4 186.5 187.5 188.2 189.3 189.7 190.4Pct Chg Year Ago 2.2 2.7 4.2 3.0 4.7 4.6 3.4 4.1 2.3 2.1 1.7 1.6
Leisure & Hospitality 104.6 105.7 106.8 107.9 107.9 108.6 109.2 109.9 110.4 110.8 111.4 111.9Pct Chg Year Ago 3.8 4.1 4.2 4.2 3.2 2.8 2.3 1.8 2.3 2.0 2.0 1.8
Other Services 37.7 37.8 38.2 38.3 38.3 38.4 38.3 38.3 38.2 38.0 38.0 38.0Pct Chg Year Ago 0.7 0.3 2.2 2.2 1.6 1.4 0.3 -0.2 -0.4 -0.8 -0.8 -0.7
Federal Government 13.8 13.8 13.7 13.8 13.7 13.6 13.6 13.6 13.5 13.4 13.3 13.3Pct Chg Year Ago 0.5 1.4 -0.5 -0.8 -0.6 -1.4 -1.0 -1.6 -1.4 -1.7 -2.0 -2.2
State & Local Government 154.5 154.5 155.3 155.3 155.7 155.9 156.1 156.2 156.4 156.7 157.3 157.9Pct Chg Year Ago 2.2 1.2 1.4 0.8 0.8 0.9 0.5 0.6 0.4 0.6 0.8 1.1
Other Economic Indicators Population (Ths.) 2754.9 2765.0 2775.2 2785.4 2795.8 2805.1 2814.4 2823.7 2833.1 2842.3 2851.6 2860.9
Pct Chg Year Ago 1.5 1.5 1.5 1.5 1.5 1.5 1.4 1.4 1.3 1.3 1.3 1.3Labor Force (Ths.) 1357.7 1364.8 1370.5 1369.7 1376.5 1383.2 1389.1 1394.9 1401.0 1406.1 1411.3 1415.9
Pct Chg Year Ago 0.8 0.9 0.9 0.4 1.4 1.3 1.4 1.8 1.8 1.7 1.6 1.5Unemployment Rate (%) 5.0 4.8 4.5 4.6 4.3 4.2 4.1 4.1 4.1 4.1 4.1 4.1Total Housing Starts (Annual Rate) 5690 9229 7917 6708 8648 9156 9387 9826 10000 10145 10088 10122
Single-Family 3533 5074 4267 4154 4259 4745 5139 5193 5244 5386 5406 5412Multifamily 2157 4155 3651 2554 4389 4411 4248 4632 4756 4759 4682 4710
* Real personal income and real per capita income are adjusted for inflation and regional purchasing power parities. This facilitates interregional comparisons of income that control for the cost of living.
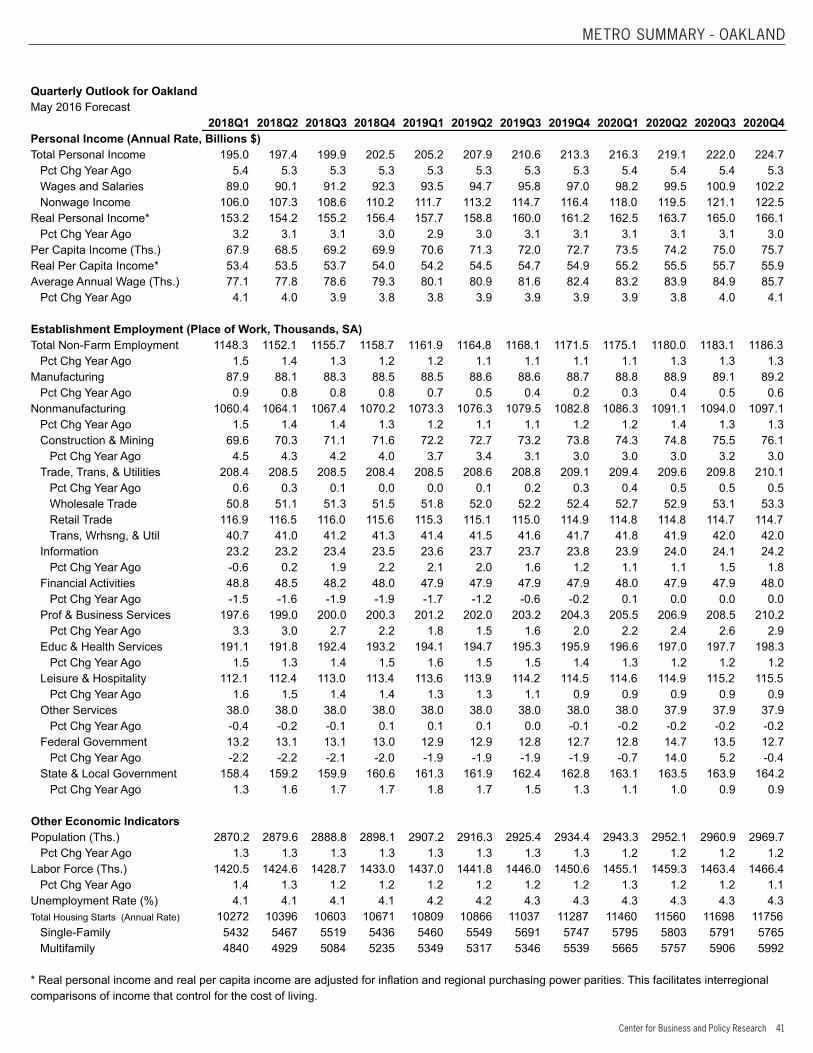
Center for Business and Policy Research 41
METRO SUMMARY - OAKLAND
Quarterly Outlook for OaklandMay 2016 Forecast 2018Q1 2018Q2 2018Q3 2018Q4 2019Q1 2019Q2 2019Q3 2019Q4 2020Q1 2020Q2 2020Q3 2020Q4Personal Income (Annual Rate, Billions $) Total Personal Income 195.0 197.4 199.9 202.5 205.2 207.9 210.6 213.3 216.3 219.1 222.0 224.7
Pct Chg Year Ago 5.4 5.3 5.3 5.3 5.3 5.3 5.3 5.3 5.4 5.4 5.4 5.3Wages and Salaries 89.0 90.1 91.2 92.3 93.5 94.7 95.8 97.0 98.2 99.5 100.9 102.2Nonwage Income 106.0 107.3 108.6 110.2 111.7 113.2 114.7 116.4 118.0 119.5 121.1 122.5
Real Personal Income* 153.2 154.2 155.2 156.4 157.7 158.8 160.0 161.2 162.5 163.7 165.0 166.1Pct Chg Year Ago 3.2 3.1 3.1 3.0 2.9 3.0 3.1 3.1 3.1 3.1 3.1 3.0
Per Capita Income (Ths.) 67.9 68.5 69.2 69.9 70.6 71.3 72.0 72.7 73.5 74.2 75.0 75.7Real Per Capita Income* 53.4 53.5 53.7 54.0 54.2 54.5 54.7 54.9 55.2 55.5 55.7 55.9Average Annual Wage (Ths.) 77.1 77.8 78.6 79.3 80.1 80.9 81.6 82.4 83.2 83.9 84.9 85.7
Pct Chg Year Ago 4.1 4.0 3.9 3.8 3.8 3.9 3.9 3.9 3.9 3.8 4.0 4.1 Establishment Employment (Place of Work, Thousands, SA)Total Non-Farm Employment 1148.3 1152.1 1155.7 1158.7 1161.9 1164.8 1168.1 1171.5 1175.1 1180.0 1183.1 1186.3
Pct Chg Year Ago 1.5 1.4 1.3 1.2 1.2 1.1 1.1 1.1 1.1 1.3 1.3 1.3Manufacturing 87.9 88.1 88.3 88.5 88.5 88.6 88.6 88.7 88.8 88.9 89.1 89.2
Pct Chg Year Ago 0.9 0.8 0.8 0.8 0.7 0.5 0.4 0.2 0.3 0.4 0.5 0.6Nonmanufacturing 1060.4 1064.1 1067.4 1070.2 1073.3 1076.3 1079.5 1082.8 1086.3 1091.1 1094.0 1097.1
Pct Chg Year Ago 1.5 1.4 1.4 1.3 1.2 1.1 1.1 1.2 1.2 1.4 1.3 1.3Construction & Mining 69.6 70.3 71.1 71.6 72.2 72.7 73.2 73.8 74.3 74.8 75.5 76.1
Pct Chg Year Ago 4.5 4.3 4.2 4.0 3.7 3.4 3.1 3.0 3.0 3.0 3.2 3.0Trade, Trans, & Utilities 208.4 208.5 208.5 208.4 208.5 208.6 208.8 209.1 209.4 209.6 209.8 210.1
Pct Chg Year Ago 0.6 0.3 0.1 0.0 0.0 0.1 0.2 0.3 0.4 0.5 0.5 0.5Wholesale Trade 50.8 51.1 51.3 51.5 51.8 52.0 52.2 52.4 52.7 52.9 53.1 53.3Retail Trade 116.9 116.5 116.0 115.6 115.3 115.1 115.0 114.9 114.8 114.8 114.7 114.7Trans, Wrhsng, & Util 40.7 41.0 41.2 41.3 41.4 41.5 41.6 41.7 41.8 41.9 42.0 42.0
Information 23.2 23.2 23.4 23.5 23.6 23.7 23.7 23.8 23.9 24.0 24.1 24.2Pct Chg Year Ago -0.6 0.2 1.9 2.2 2.1 2.0 1.6 1.2 1.1 1.1 1.5 1.8
Financial Activities 48.8 48.5 48.2 48.0 47.9 47.9 47.9 47.9 48.0 47.9 47.9 48.0Pct Chg Year Ago -1.5 -1.6 -1.9 -1.9 -1.7 -1.2 -0.6 -0.2 0.1 0.0 0.0 0.0
Prof & Business Services 197.6 199.0 200.0 200.3 201.2 202.0 203.2 204.3 205.5 206.9 208.5 210.2Pct Chg Year Ago 3.3 3.0 2.7 2.2 1.8 1.5 1.6 2.0 2.2 2.4 2.6 2.9
Educ & Health Services 191.1 191.8 192.4 193.2 194.1 194.7 195.3 195.9 196.6 197.0 197.7 198.3Pct Chg Year Ago 1.5 1.3 1.4 1.5 1.6 1.5 1.5 1.4 1.3 1.2 1.2 1.2
Leisure & Hospitality 112.1 112.4 113.0 113.4 113.6 113.9 114.2 114.5 114.6 114.9 115.2 115.5Pct Chg Year Ago 1.6 1.5 1.4 1.4 1.3 1.3 1.1 0.9 0.9 0.9 0.9 0.9
Other Services 38.0 38.0 38.0 38.0 38.0 38.0 38.0 38.0 38.0 37.9 37.9 37.9Pct Chg Year Ago -0.4 -0.2 -0.1 0.1 0.1 0.1 0.0 -0.1 -0.2 -0.2 -0.2 -0.2
Federal Government 13.2 13.1 13.1 13.0 12.9 12.9 12.8 12.7 12.8 14.7 13.5 12.7Pct Chg Year Ago -2.2 -2.2 -2.1 -2.0 -1.9 -1.9 -1.9 -1.9 -0.7 14.0 5.2 -0.4
State & Local Government 158.4 159.2 159.9 160.6 161.3 161.9 162.4 162.8 163.1 163.5 163.9 164.2Pct Chg Year Ago 1.3 1.6 1.7 1.7 1.8 1.7 1.5 1.3 1.1 1.0 0.9 0.9
Other Economic Indicators Population (Ths.) 2870.2 2879.6 2888.8 2898.1 2907.2 2916.3 2925.4 2934.4 2943.3 2952.1 2960.9 2969.7
Pct Chg Year Ago 1.3 1.3 1.3 1.3 1.3 1.3 1.3 1.3 1.2 1.2 1.2 1.2Labor Force (Ths.) 1420.5 1424.6 1428.7 1433.0 1437.0 1441.8 1446.0 1450.6 1455.1 1459.3 1463.4 1466.4
Pct Chg Year Ago 1.4 1.3 1.2 1.2 1.2 1.2 1.2 1.2 1.3 1.2 1.2 1.1Unemployment Rate (%) 4.1 4.1 4.1 4.1 4.2 4.2 4.3 4.3 4.3 4.3 4.3 4.3Total Housing Starts (Annual Rate) 10272 10396 10603 10671 10809 10866 11037 11287 11460 11560 11698 11756
Single-Family 5432 5467 5519 5436 5460 5549 5691 5747 5795 5803 5791 5765Multifamily 4840 4929 5084 5235 5349 5317 5346 5539 5665 5757 5906 5992
* Real personal income and real per capita income are adjusted for inflation and regional purchasing power parities. This facilitates interregional comparisons of income that control for the cost of living.
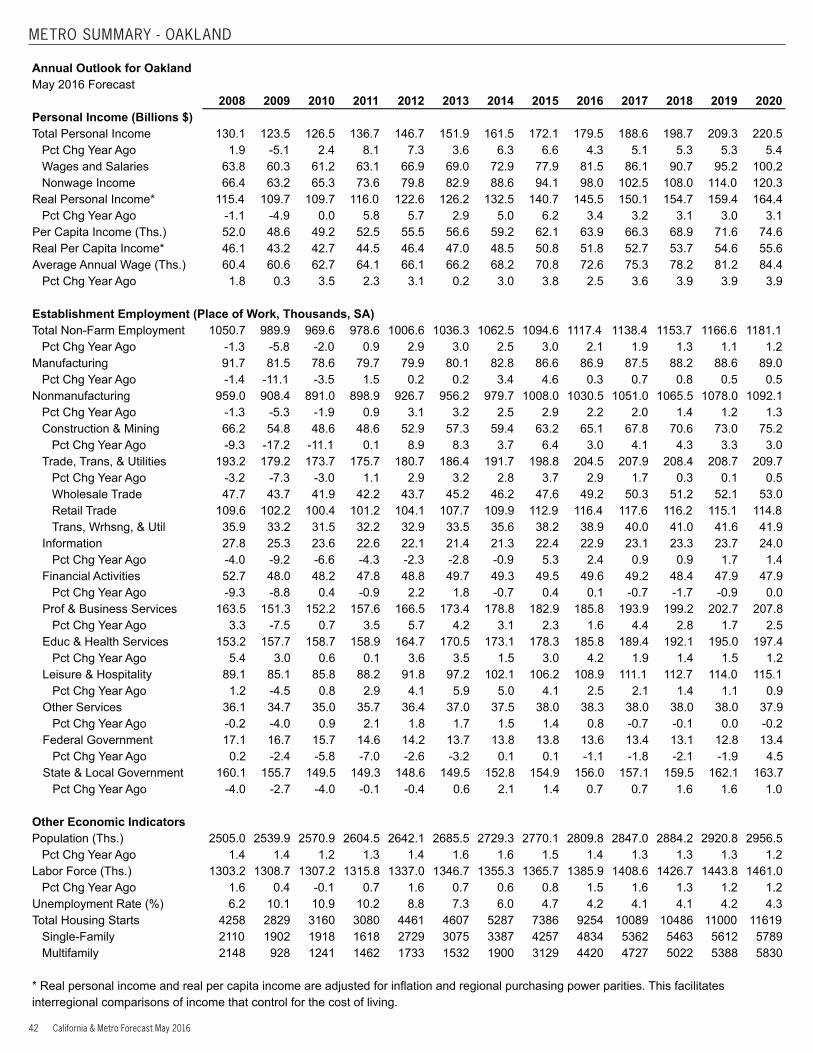
42 California & Metro Forecast May 2016
METRO SUMMARY - OAKLAND
Annual Outlook for OaklandMay 2016 Forecast 2008 2009 2010 2011 2012 2013 2014 2015 2016 2017 2018 2019 2020Personal Income (Billions $) Total Personal Income 130.1 123.5 126.5 136.7 146.7 151.9 161.5 172.1 179.5 188.6 198.7 209.3 220.5
Pct Chg Year Ago 1.9 -5.1 2.4 8.1 7.3 3.6 6.3 6.6 4.3 5.1 5.3 5.3 5.4Wages and Salaries 63.8 60.3 61.2 63.1 66.9 69.0 72.9 77.9 81.5 86.1 90.7 95.2 100.2Nonwage Income 66.4 63.2 65.3 73.6 79.8 82.9 88.6 94.1 98.0 102.5 108.0 114.0 120.3
Real Personal Income* 115.4 109.7 109.7 116.0 122.6 126.2 132.5 140.7 145.5 150.1 154.7 159.4 164.4Pct Chg Year Ago -1.1 -4.9 0.0 5.8 5.7 2.9 5.0 6.2 3.4 3.2 3.1 3.0 3.1
Per Capita Income (Ths.) 52.0 48.6 49.2 52.5 55.5 56.6 59.2 62.1 63.9 66.3 68.9 71.6 74.6Real Per Capita Income* 46.1 43.2 42.7 44.5 46.4 47.0 48.5 50.8 51.8 52.7 53.7 54.6 55.6Average Annual Wage (Ths.) 60.4 60.6 62.7 64.1 66.1 66.2 68.2 70.8 72.6 75.3 78.2 81.2 84.4
Pct Chg Year Ago 1.8 0.3 3.5 2.3 3.1 0.2 3.0 3.8 2.5 3.6 3.9 3.9 3.9 Establishment Employment (Place of Work, Thousands, SA)Total Non-Farm Employment 1050.7 989.9 969.6 978.6 1006.6 1036.3 1062.5 1094.6 1117.4 1138.4 1153.7 1166.6 1181.1
Pct Chg Year Ago -1.3 -5.8 -2.0 0.9 2.9 3.0 2.5 3.0 2.1 1.9 1.3 1.1 1.2Manufacturing 91.7 81.5 78.6 79.7 79.9 80.1 82.8 86.6 86.9 87.5 88.2 88.6 89.0
Pct Chg Year Ago -1.4 -11.1 -3.5 1.5 0.2 0.2 3.4 4.6 0.3 0.7 0.8 0.5 0.5Nonmanufacturing 959.0 908.4 891.0 898.9 926.7 956.2 979.7 1008.0 1030.5 1051.0 1065.5 1078.0 1092.1
Pct Chg Year Ago -1.3 -5.3 -1.9 0.9 3.1 3.2 2.5 2.9 2.2 2.0 1.4 1.2 1.3Construction & Mining 66.2 54.8 48.6 48.6 52.9 57.3 59.4 63.2 65.1 67.8 70.6 73.0 75.2
Pct Chg Year Ago -9.3 -17.2 -11.1 0.1 8.9 8.3 3.7 6.4 3.0 4.1 4.3 3.3 3.0Trade, Trans, & Utilities 193.2 179.2 173.7 175.7 180.7 186.4 191.7 198.8 204.5 207.9 208.4 208.7 209.7
Pct Chg Year Ago -3.2 -7.3 -3.0 1.1 2.9 3.2 2.8 3.7 2.9 1.7 0.3 0.1 0.5Wholesale Trade 47.7 43.7 41.9 42.2 43.7 45.2 46.2 47.6 49.2 50.3 51.2 52.1 53.0Retail Trade 109.6 102.2 100.4 101.2 104.1 107.7 109.9 112.9 116.4 117.6 116.2 115.1 114.8Trans, Wrhsng, & Util 35.9 33.2 31.5 32.2 32.9 33.5 35.6 38.2 38.9 40.0 41.0 41.6 41.9
Information 27.8 25.3 23.6 22.6 22.1 21.4 21.3 22.4 22.9 23.1 23.3 23.7 24.0Pct Chg Year Ago -4.0 -9.2 -6.6 -4.3 -2.3 -2.8 -0.9 5.3 2.4 0.9 0.9 1.7 1.4
Financial Activities 52.7 48.0 48.2 47.8 48.8 49.7 49.3 49.5 49.6 49.2 48.4 47.9 47.9Pct Chg Year Ago -9.3 -8.8 0.4 -0.9 2.2 1.8 -0.7 0.4 0.1 -0.7 -1.7 -0.9 0.0
Prof & Business Services 163.5 151.3 152.2 157.6 166.5 173.4 178.8 182.9 185.8 193.9 199.2 202.7 207.8Pct Chg Year Ago 3.3 -7.5 0.7 3.5 5.7 4.2 3.1 2.3 1.6 4.4 2.8 1.7 2.5
Educ & Health Services 153.2 157.7 158.7 158.9 164.7 170.5 173.1 178.3 185.8 189.4 192.1 195.0 197.4Pct Chg Year Ago 5.4 3.0 0.6 0.1 3.6 3.5 1.5 3.0 4.2 1.9 1.4 1.5 1.2
Leisure & Hospitality 89.1 85.1 85.8 88.2 91.8 97.2 102.1 106.2 108.9 111.1 112.7 114.0 115.1Pct Chg Year Ago 1.2 -4.5 0.8 2.9 4.1 5.9 5.0 4.1 2.5 2.1 1.4 1.1 0.9
Other Services 36.1 34.7 35.0 35.7 36.4 37.0 37.5 38.0 38.3 38.0 38.0 38.0 37.9Pct Chg Year Ago -0.2 -4.0 0.9 2.1 1.8 1.7 1.5 1.4 0.8 -0.7 -0.1 0.0 -0.2
Federal Government 17.1 16.7 15.7 14.6 14.2 13.7 13.8 13.8 13.6 13.4 13.1 12.8 13.4Pct Chg Year Ago 0.2 -2.4 -5.8 -7.0 -2.6 -3.2 0.1 0.1 -1.1 -1.8 -2.1 -1.9 4.5
State & Local Government 160.1 155.7 149.5 149.3 148.6 149.5 152.8 154.9 156.0 157.1 159.5 162.1 163.7Pct Chg Year Ago -4.0 -2.7 -4.0 -0.1 -0.4 0.6 2.1 1.4 0.7 0.7 1.6 1.6 1.0
Other Economic Indicators Population (Ths.) 2505.0 2539.9 2570.9 2604.5 2642.1 2685.5 2729.3 2770.1 2809.8 2847.0 2884.2 2920.8 2956.5
Pct Chg Year Ago 1.4 1.4 1.2 1.3 1.4 1.6 1.6 1.5 1.4 1.3 1.3 1.3 1.2Labor Force (Ths.) 1303.2 1308.7 1307.2 1315.8 1337.0 1346.7 1355.3 1365.7 1385.9 1408.6 1426.7 1443.8 1461.0
Pct Chg Year Ago 1.6 0.4 -0.1 0.7 1.6 0.7 0.6 0.8 1.5 1.6 1.3 1.2 1.2Unemployment Rate (%) 6.2 10.1 10.9 10.2 8.8 7.3 6.0 4.7 4.2 4.1 4.1 4.2 4.3Total Housing Starts 4258 2829 3160 3080 4461 4607 5287 7386 9254 10089 10486 11000 11619
Single-Family 2110 1902 1918 1618 2729 3075 3387 4257 4834 5362 5463 5612 5789Multifamily 2148 928 1241 1462 1733 1532 1900 3129 4420 4727 5022 5388 5830
* Real personal income and real per capita income are adjusted for inflation and regional purchasing power parities. This facilitates interregional comparisons of income that control for the cost of living.
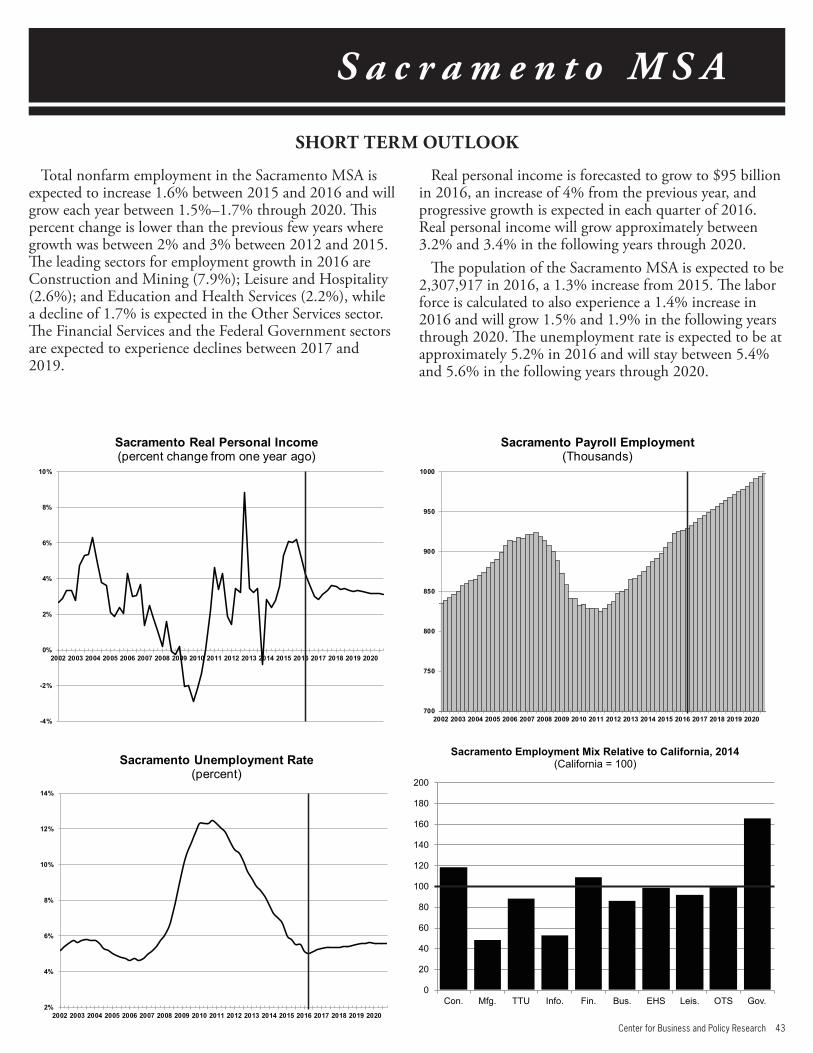
Center for Business and Policy Research 43
S a c r a m e n t o M S A
Total nonfarm employment in the Sacramento MSA is expected to increase 1.6% between 2015 and 2016 and will grow each year between 1.5%–1.7% through 2020. This percent change is lower than the previous few years where growth was between 2% and 3% between 2012 and 2015. The leading sectors for employment growth in 2016 are Construction and Mining (7.9%); Leisure and Hospitality (2.6%); and Education and Health Services (2.2%), while a decline of 1.7% is expected in the Other Services sector. The Financial Services and the Federal Government sectors are expected to experience declines between 2017 and 2019.
Real personal income is forecasted to grow to $95 billion in 2016, an increase of 4% from the previous year, and progressive growth is expected in each quarter of 2016. Real personal income will grow approximately between 3.2% and 3.4% in the following years through 2020.
The population of the Sacramento MSA is expected to be 2,307,917 in 2016, a 1.3% increase from 2015. The labor force is calculated to also experience a 1.4% increase in 2016 and will grow 1.5% and 1.9% in the following years through 2020. The unemployment rate is expected to be at approximately 5.2% in 2016 and will stay between 5.4% and 5.6% in the following years through 2020.
SHORT TERM OUTLOOK
0
20
40
60
80
100
120
140
160
180
200
Con. Mfg. TTU Info. Fin. Bus. EHS Leis. OTS Gov.
Sacramento Employment Mix Relative to California, 2014(California = 100)
-4%
-2%
0%
2%
4%
6%
8%
10%
2002 2003 2004 2005 2006 2007 2008 2009 2010 2011 2012 2013 2014 2015 2016 2017 2018 2019 2020
Sacramento Real Personal Income (percent change from one year ago)
2%
4%
6%
8%
10%
12%
14%
2002 2003 2004 2005 2006 2007 2008 2009 2010 2011 2012 2013 2014 2015 2016 2017 2018 2019 2020
Sacramento Unemployment Rate(percent)
700
750
800
850
900
950
1000
2002 2003 2004 2005 2006 2007 2008 2009 2010 2011 2012 2013 2014 2015 2016 2017 2018 2019 2020
Sacramento Payroll Employment (Thousands)
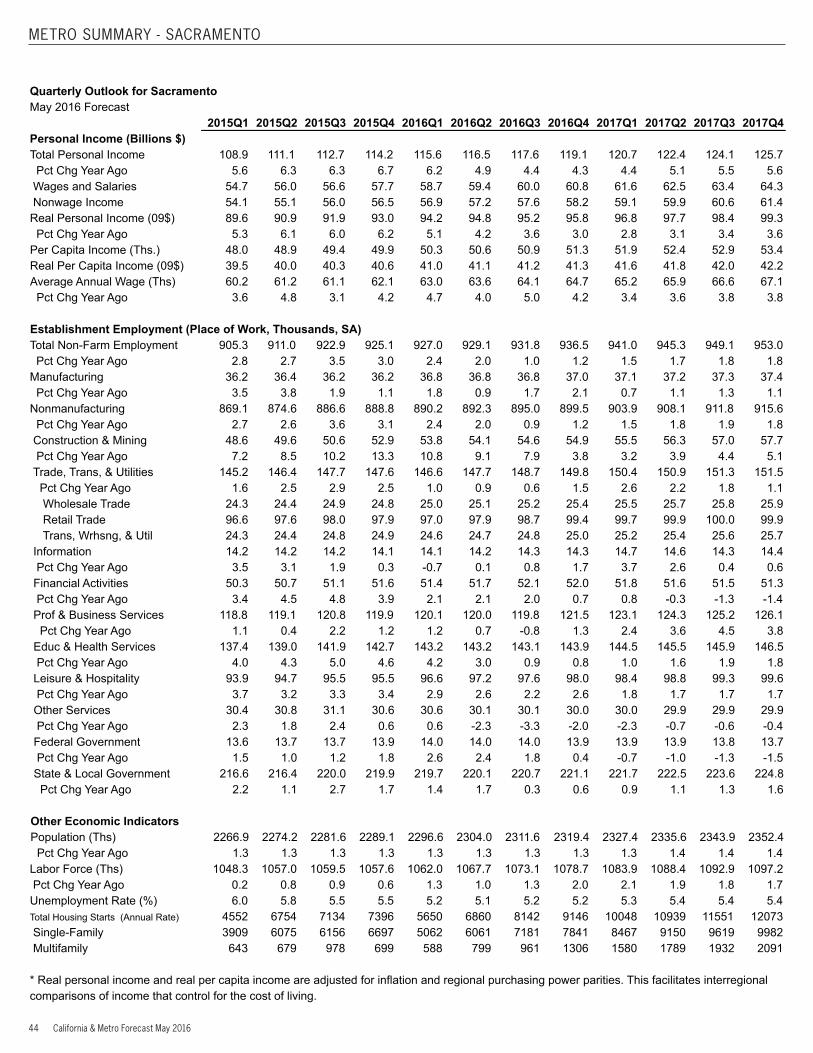
44 California & Metro Forecast May 2016
METRO SUMMARY - SACRAMENTO
Quarterly Outlook for SacramentoMay 2016 Forecast 2015Q1 2015Q2 2015Q3 2015Q4 2016Q1 2016Q2 2016Q3 2016Q4 2017Q1 2017Q2 2017Q3 2017Q4Personal Income (Billions $) Total Personal Income 108.9 111.1 112.7 114.2 115.6 116.5 117.6 119.1 120.7 122.4 124.1 125.7 Pct Chg Year Ago 5.6 6.3 6.3 6.7 6.2 4.9 4.4 4.3 4.4 5.1 5.5 5.6 Wages and Salaries 54.7 56.0 56.6 57.7 58.7 59.4 60.0 60.8 61.6 62.5 63.4 64.3 Nonwage Income 54.1 55.1 56.0 56.5 56.9 57.2 57.6 58.2 59.1 59.9 60.6 61.4Real Personal Income (09$) 89.6 90.9 91.9 93.0 94.2 94.8 95.2 95.8 96.8 97.7 98.4 99.3 Pct Chg Year Ago 5.3 6.1 6.0 6.2 5.1 4.2 3.6 3.0 2.8 3.1 3.4 3.6Per Capita Income (Ths.) 48.0 48.9 49.4 49.9 50.3 50.6 50.9 51.3 51.9 52.4 52.9 53.4Real Per Capita Income (09$) 39.5 40.0 40.3 40.6 41.0 41.1 41.2 41.3 41.6 41.8 42.0 42.2Average Annual Wage (Ths) 60.2 61.2 61.1 62.1 63.0 63.6 64.1 64.7 65.2 65.9 66.6 67.1 Pct Chg Year Ago 3.6 4.8 3.1 4.2 4.7 4.0 5.0 4.2 3.4 3.6 3.8 3.8 Establishment Employment (Place of Work, Thousands, SA)Total Non-Farm Employment 905.3 911.0 922.9 925.1 927.0 929.1 931.8 936.5 941.0 945.3 949.1 953.0 Pct Chg Year Ago 2.8 2.7 3.5 3.0 2.4 2.0 1.0 1.2 1.5 1.7 1.8 1.8Manufacturing 36.2 36.4 36.2 36.2 36.8 36.8 36.8 37.0 37.1 37.2 37.3 37.4 Pct Chg Year Ago 3.5 3.8 1.9 1.1 1.8 0.9 1.7 2.1 0.7 1.1 1.3 1.1Nonmanufacturing 869.1 874.6 886.6 888.8 890.2 892.3 895.0 899.5 903.9 908.1 911.8 915.6 Pct Chg Year Ago 2.7 2.6 3.6 3.1 2.4 2.0 0.9 1.2 1.5 1.8 1.9 1.8 Construction & Mining 48.6 49.6 50.6 52.9 53.8 54.1 54.6 54.9 55.5 56.3 57.0 57.7 Pct Chg Year Ago 7.2 8.5 10.2 13.3 10.8 9.1 7.9 3.8 3.2 3.9 4.4 5.1 Trade, Trans, & Utilities 145.2 146.4 147.7 147.6 146.6 147.7 148.7 149.8 150.4 150.9 151.3 151.5 Pct Chg Year Ago 1.6 2.5 2.9 2.5 1.0 0.9 0.6 1.5 2.6 2.2 1.8 1.1 Wholesale Trade 24.3 24.4 24.9 24.8 25.0 25.1 25.2 25.4 25.5 25.7 25.8 25.9 Retail Trade 96.6 97.6 98.0 97.9 97.0 97.9 98.7 99.4 99.7 99.9 100.0 99.9 Trans, Wrhsng, & Util 24.3 24.4 24.8 24.9 24.6 24.7 24.8 25.0 25.2 25.4 25.6 25.7 Information 14.2 14.2 14.2 14.1 14.1 14.2 14.3 14.3 14.7 14.6 14.3 14.4 Pct Chg Year Ago 3.5 3.1 1.9 0.3 -0.7 0.1 0.8 1.7 3.7 2.6 0.4 0.6 Financial Activities 50.3 50.7 51.1 51.6 51.4 51.7 52.1 52.0 51.8 51.6 51.5 51.3 Pct Chg Year Ago 3.4 4.5 4.8 3.9 2.1 2.1 2.0 0.7 0.8 -0.3 -1.3 -1.4 Prof & Business Services 118.8 119.1 120.8 119.9 120.1 120.0 119.8 121.5 123.1 124.3 125.2 126.1 Pct Chg Year Ago 1.1 0.4 2.2 1.2 1.2 0.7 -0.8 1.3 2.4 3.6 4.5 3.8 Educ & Health Services 137.4 139.0 141.9 142.7 143.2 143.2 143.1 143.9 144.5 145.5 145.9 146.5 Pct Chg Year Ago 4.0 4.3 5.0 4.6 4.2 3.0 0.9 0.8 1.0 1.6 1.9 1.8 Leisure & Hospitality 93.9 94.7 95.5 95.5 96.6 97.2 97.6 98.0 98.4 98.8 99.3 99.6 Pct Chg Year Ago 3.7 3.2 3.3 3.4 2.9 2.6 2.2 2.6 1.8 1.7 1.7 1.7 Other Services 30.4 30.8 31.1 30.6 30.6 30.1 30.1 30.0 30.0 29.9 29.9 29.9 Pct Chg Year Ago 2.3 1.8 2.4 0.6 0.6 -2.3 -3.3 -2.0 -2.3 -0.7 -0.6 -0.4 Federal Government 13.6 13.7 13.7 13.9 14.0 14.0 14.0 13.9 13.9 13.9 13.8 13.7 Pct Chg Year Ago 1.5 1.0 1.2 1.8 2.6 2.4 1.8 0.4 -0.7 -1.0 -1.3 -1.5 State & Local Government 216.6 216.4 220.0 219.9 219.7 220.1 220.7 221.1 221.7 222.5 223.6 224.8 Pct Chg Year Ago 2.2 1.1 2.7 1.7 1.4 1.7 0.3 0.6 0.9 1.1 1.3 1.6 Other Economic Indicators Population (Ths) 2266.9 2274.2 2281.6 2289.1 2296.6 2304.0 2311.6 2319.4 2327.4 2335.6 2343.9 2352.4 Pct Chg Year Ago 1.3 1.3 1.3 1.3 1.3 1.3 1.3 1.3 1.3 1.4 1.4 1.4Labor Force (Ths) 1048.3 1057.0 1059.5 1057.6 1062.0 1067.7 1073.1 1078.7 1083.9 1088.4 1092.9 1097.2 Pct Chg Year Ago 0.2 0.8 0.9 0.6 1.3 1.0 1.3 2.0 2.1 1.9 1.8 1.7Unemployment Rate (%) 6.0 5.8 5.5 5.5 5.2 5.1 5.2 5.2 5.3 5.4 5.4 5.4Total Housing Starts (Annual Rate) 4552 6754 7134 7396 5650 6860 8142 9146 10048 10939 11551 12073 Single-Family 3909 6075 6156 6697 5062 6061 7181 7841 8467 9150 9619 9982 Multifamily 643 679 978 699 588 799 961 1306 1580 1789 1932 2091
* Real personal income and real per capita income are adjusted for inflation and regional purchasing power parities. This facilitates interregional comparisons of income that control for the cost of living.
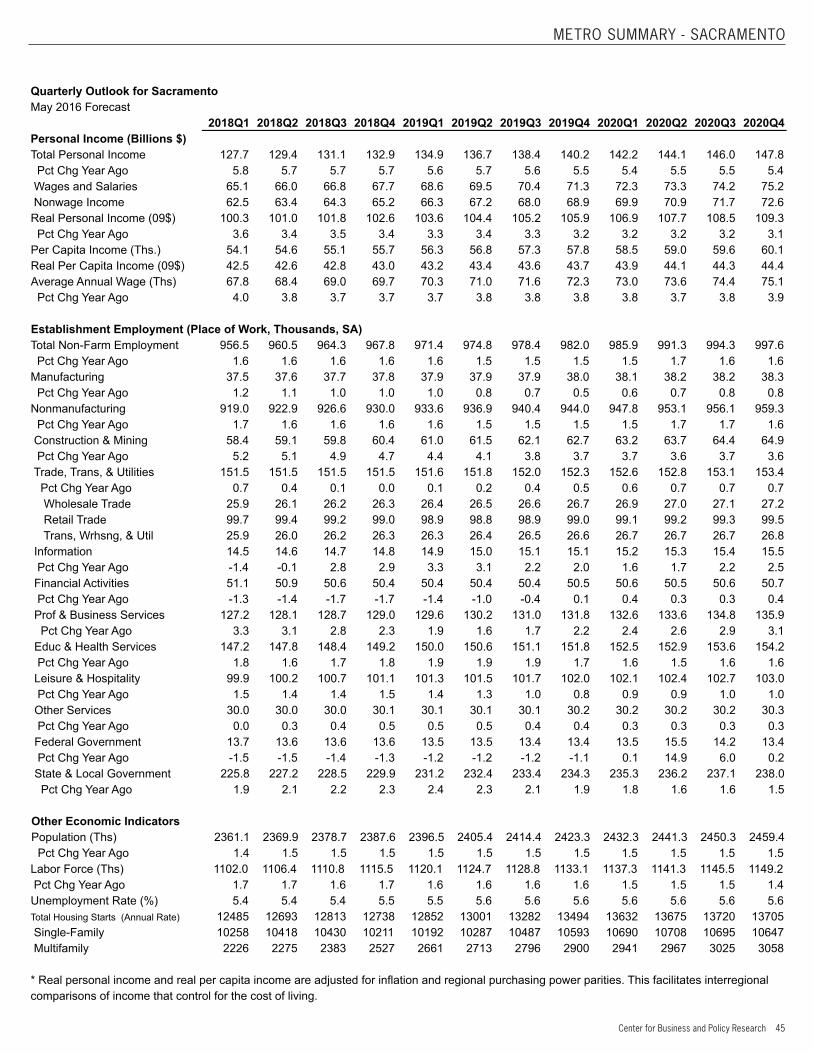
Center for Business and Policy Research 45
METRO SUMMARY - SACRAMENTO
Quarterly Outlook for SacramentoMay 2016 Forecast 2018Q1 2018Q2 2018Q3 2018Q4 2019Q1 2019Q2 2019Q3 2019Q4 2020Q1 2020Q2 2020Q3 2020Q4Personal Income (Billions $) Total Personal Income 127.7 129.4 131.1 132.9 134.9 136.7 138.4 140.2 142.2 144.1 146.0 147.8 Pct Chg Year Ago 5.8 5.7 5.7 5.7 5.6 5.7 5.6 5.5 5.4 5.5 5.5 5.4 Wages and Salaries 65.1 66.0 66.8 67.7 68.6 69.5 70.4 71.3 72.3 73.3 74.2 75.2 Nonwage Income 62.5 63.4 64.3 65.2 66.3 67.2 68.0 68.9 69.9 70.9 71.7 72.6Real Personal Income (09$) 100.3 101.0 101.8 102.6 103.6 104.4 105.2 105.9 106.9 107.7 108.5 109.3 Pct Chg Year Ago 3.6 3.4 3.5 3.4 3.3 3.4 3.3 3.2 3.2 3.2 3.2 3.1Per Capita Income (Ths.) 54.1 54.6 55.1 55.7 56.3 56.8 57.3 57.8 58.5 59.0 59.6 60.1Real Per Capita Income (09$) 42.5 42.6 42.8 43.0 43.2 43.4 43.6 43.7 43.9 44.1 44.3 44.4Average Annual Wage (Ths) 67.8 68.4 69.0 69.7 70.3 71.0 71.6 72.3 73.0 73.6 74.4 75.1 Pct Chg Year Ago 4.0 3.8 3.7 3.7 3.7 3.8 3.8 3.8 3.8 3.7 3.8 3.9 Establishment Employment (Place of Work, Thousands, SA)Total Non-Farm Employment 956.5 960.5 964.3 967.8 971.4 974.8 978.4 982.0 985.9 991.3 994.3 997.6 Pct Chg Year Ago 1.6 1.6 1.6 1.6 1.6 1.5 1.5 1.5 1.5 1.7 1.6 1.6Manufacturing 37.5 37.6 37.7 37.8 37.9 37.9 37.9 38.0 38.1 38.2 38.2 38.3 Pct Chg Year Ago 1.2 1.1 1.0 1.0 1.0 0.8 0.7 0.5 0.6 0.7 0.8 0.8Nonmanufacturing 919.0 922.9 926.6 930.0 933.6 936.9 940.4 944.0 947.8 953.1 956.1 959.3 Pct Chg Year Ago 1.7 1.6 1.6 1.6 1.6 1.5 1.5 1.5 1.5 1.7 1.7 1.6 Construction & Mining 58.4 59.1 59.8 60.4 61.0 61.5 62.1 62.7 63.2 63.7 64.4 64.9 Pct Chg Year Ago 5.2 5.1 4.9 4.7 4.4 4.1 3.8 3.7 3.7 3.6 3.7 3.6 Trade, Trans, & Utilities 151.5 151.5 151.5 151.5 151.6 151.8 152.0 152.3 152.6 152.8 153.1 153.4 Pct Chg Year Ago 0.7 0.4 0.1 0.0 0.1 0.2 0.4 0.5 0.6 0.7 0.7 0.7 Wholesale Trade 25.9 26.1 26.2 26.3 26.4 26.5 26.6 26.7 26.9 27.0 27.1 27.2 Retail Trade 99.7 99.4 99.2 99.0 98.9 98.8 98.9 99.0 99.1 99.2 99.3 99.5 Trans, Wrhsng, & Util 25.9 26.0 26.2 26.3 26.3 26.4 26.5 26.6 26.7 26.7 26.7 26.8 Information 14.5 14.6 14.7 14.8 14.9 15.0 15.1 15.1 15.2 15.3 15.4 15.5 Pct Chg Year Ago -1.4 -0.1 2.8 2.9 3.3 3.1 2.2 2.0 1.6 1.7 2.2 2.5 Financial Activities 51.1 50.9 50.6 50.4 50.4 50.4 50.4 50.5 50.6 50.5 50.6 50.7 Pct Chg Year Ago -1.3 -1.4 -1.7 -1.7 -1.4 -1.0 -0.4 0.1 0.4 0.3 0.3 0.4 Prof & Business Services 127.2 128.1 128.7 129.0 129.6 130.2 131.0 131.8 132.6 133.6 134.8 135.9 Pct Chg Year Ago 3.3 3.1 2.8 2.3 1.9 1.6 1.7 2.2 2.4 2.6 2.9 3.1 Educ & Health Services 147.2 147.8 148.4 149.2 150.0 150.6 151.1 151.8 152.5 152.9 153.6 154.2 Pct Chg Year Ago 1.8 1.6 1.7 1.8 1.9 1.9 1.9 1.7 1.6 1.5 1.6 1.6 Leisure & Hospitality 99.9 100.2 100.7 101.1 101.3 101.5 101.7 102.0 102.1 102.4 102.7 103.0 Pct Chg Year Ago 1.5 1.4 1.4 1.5 1.4 1.3 1.0 0.8 0.9 0.9 1.0 1.0 Other Services 30.0 30.0 30.0 30.1 30.1 30.1 30.1 30.2 30.2 30.2 30.2 30.3 Pct Chg Year Ago 0.0 0.3 0.4 0.5 0.5 0.5 0.4 0.4 0.3 0.3 0.3 0.3 Federal Government 13.7 13.6 13.6 13.6 13.5 13.5 13.4 13.4 13.5 15.5 14.2 13.4 Pct Chg Year Ago -1.5 -1.5 -1.4 -1.3 -1.2 -1.2 -1.2 -1.1 0.1 14.9 6.0 0.2 State & Local Government 225.8 227.2 228.5 229.9 231.2 232.4 233.4 234.3 235.3 236.2 237.1 238.0 Pct Chg Year Ago 1.9 2.1 2.2 2.3 2.4 2.3 2.1 1.9 1.8 1.6 1.6 1.5 Other Economic Indicators Population (Ths) 2361.1 2369.9 2378.7 2387.6 2396.5 2405.4 2414.4 2423.3 2432.3 2441.3 2450.3 2459.4 Pct Chg Year Ago 1.4 1.5 1.5 1.5 1.5 1.5 1.5 1.5 1.5 1.5 1.5 1.5Labor Force (Ths) 1102.0 1106.4 1110.8 1115.5 1120.1 1124.7 1128.8 1133.1 1137.3 1141.3 1145.5 1149.2 Pct Chg Year Ago 1.7 1.7 1.6 1.7 1.6 1.6 1.6 1.6 1.5 1.5 1.5 1.4Unemployment Rate (%) 5.4 5.4 5.4 5.5 5.5 5.6 5.6 5.6 5.6 5.6 5.6 5.6Total Housing Starts (Annual Rate) 12485 12693 12813 12738 12852 13001 13282 13494 13632 13675 13720 13705 Single-Family 10258 10418 10430 10211 10192 10287 10487 10593 10690 10708 10695 10647 Multifamily 2226 2275 2383 2527 2661 2713 2796 2900 2941 2967 3025 3058
* Real personal income and real per capita income are adjusted for inflation and regional purchasing power parities. This facilitates interregional comparisons of income that control for the cost of living.
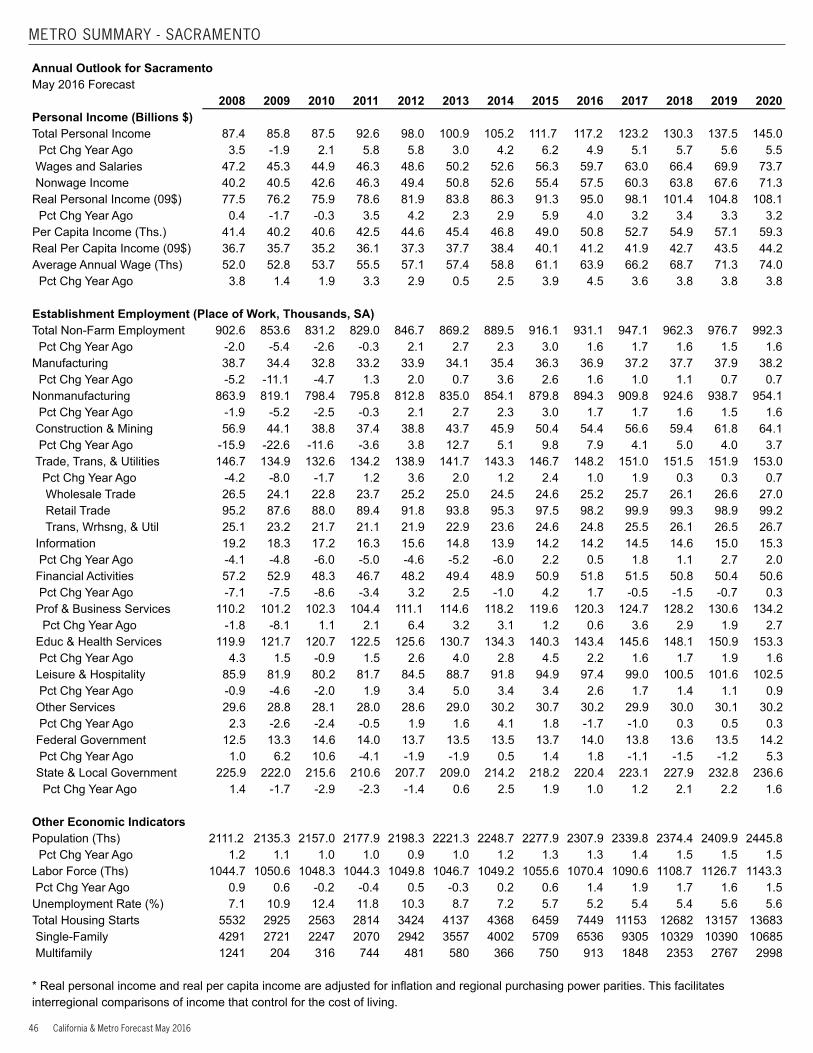
46 California & Metro Forecast May 2016
METRO SUMMARY - SACRAMENTO
Annual Outlook for SacramentoMay 2016 Forecast 2008 2009 2010 2011 2012 2013 2014 2015 2016 2017 2018 2019 2020Personal Income (Billions $) Total Personal Income 87.4 85.8 87.5 92.6 98.0 100.9 105.2 111.7 117.2 123.2 130.3 137.5 145.0 Pct Chg Year Ago 3.5 -1.9 2.1 5.8 5.8 3.0 4.2 6.2 4.9 5.1 5.7 5.6 5.5 Wages and Salaries 47.2 45.3 44.9 46.3 48.6 50.2 52.6 56.3 59.7 63.0 66.4 69.9 73.7 Nonwage Income 40.2 40.5 42.6 46.3 49.4 50.8 52.6 55.4 57.5 60.3 63.8 67.6 71.3Real Personal Income (09$) 77.5 76.2 75.9 78.6 81.9 83.8 86.3 91.3 95.0 98.1 101.4 104.8 108.1 Pct Chg Year Ago 0.4 -1.7 -0.3 3.5 4.2 2.3 2.9 5.9 4.0 3.2 3.4 3.3 3.2Per Capita Income (Ths.) 41.4 40.2 40.6 42.5 44.6 45.4 46.8 49.0 50.8 52.7 54.9 57.1 59.3Real Per Capita Income (09$) 36.7 35.7 35.2 36.1 37.3 37.7 38.4 40.1 41.2 41.9 42.7 43.5 44.2Average Annual Wage (Ths) 52.0 52.8 53.7 55.5 57.1 57.4 58.8 61.1 63.9 66.2 68.7 71.3 74.0 Pct Chg Year Ago 3.8 1.4 1.9 3.3 2.9 0.5 2.5 3.9 4.5 3.6 3.8 3.8 3.8 Establishment Employment (Place of Work, Thousands, SA)Total Non-Farm Employment 902.6 853.6 831.2 829.0 846.7 869.2 889.5 916.1 931.1 947.1 962.3 976.7 992.3 Pct Chg Year Ago -2.0 -5.4 -2.6 -0.3 2.1 2.7 2.3 3.0 1.6 1.7 1.6 1.5 1.6Manufacturing 38.7 34.4 32.8 33.2 33.9 34.1 35.4 36.3 36.9 37.2 37.7 37.9 38.2 Pct Chg Year Ago -5.2 -11.1 -4.7 1.3 2.0 0.7 3.6 2.6 1.6 1.0 1.1 0.7 0.7Nonmanufacturing 863.9 819.1 798.4 795.8 812.8 835.0 854.1 879.8 894.3 909.8 924.6 938.7 954.1 Pct Chg Year Ago -1.9 -5.2 -2.5 -0.3 2.1 2.7 2.3 3.0 1.7 1.7 1.6 1.5 1.6 Construction & Mining 56.9 44.1 38.8 37.4 38.8 43.7 45.9 50.4 54.4 56.6 59.4 61.8 64.1 Pct Chg Year Ago -15.9 -22.6 -11.6 -3.6 3.8 12.7 5.1 9.8 7.9 4.1 5.0 4.0 3.7 Trade, Trans, & Utilities 146.7 134.9 132.6 134.2 138.9 141.7 143.3 146.7 148.2 151.0 151.5 151.9 153.0 Pct Chg Year Ago -4.2 -8.0 -1.7 1.2 3.6 2.0 1.2 2.4 1.0 1.9 0.3 0.3 0.7 Wholesale Trade 26.5 24.1 22.8 23.7 25.2 25.0 24.5 24.6 25.2 25.7 26.1 26.6 27.0 Retail Trade 95.2 87.6 88.0 89.4 91.8 93.8 95.3 97.5 98.2 99.9 99.3 98.9 99.2 Trans, Wrhsng, & Util 25.1 23.2 21.7 21.1 21.9 22.9 23.6 24.6 24.8 25.5 26.1 26.5 26.7 Information 19.2 18.3 17.2 16.3 15.6 14.8 13.9 14.2 14.2 14.5 14.6 15.0 15.3 Pct Chg Year Ago -4.1 -4.8 -6.0 -5.0 -4.6 -5.2 -6.0 2.2 0.5 1.8 1.1 2.7 2.0 Financial Activities 57.2 52.9 48.3 46.7 48.2 49.4 48.9 50.9 51.8 51.5 50.8 50.4 50.6 Pct Chg Year Ago -7.1 -7.5 -8.6 -3.4 3.2 2.5 -1.0 4.2 1.7 -0.5 -1.5 -0.7 0.3 Prof & Business Services 110.2 101.2 102.3 104.4 111.1 114.6 118.2 119.6 120.3 124.7 128.2 130.6 134.2 Pct Chg Year Ago -1.8 -8.1 1.1 2.1 6.4 3.2 3.1 1.2 0.6 3.6 2.9 1.9 2.7 Educ & Health Services 119.9 121.7 120.7 122.5 125.6 130.7 134.3 140.3 143.4 145.6 148.1 150.9 153.3 Pct Chg Year Ago 4.3 1.5 -0.9 1.5 2.6 4.0 2.8 4.5 2.2 1.6 1.7 1.9 1.6 Leisure & Hospitality 85.9 81.9 80.2 81.7 84.5 88.7 91.8 94.9 97.4 99.0 100.5 101.6 102.5 Pct Chg Year Ago -0.9 -4.6 -2.0 1.9 3.4 5.0 3.4 3.4 2.6 1.7 1.4 1.1 0.9 Other Services 29.6 28.8 28.1 28.0 28.6 29.0 30.2 30.7 30.2 29.9 30.0 30.1 30.2 Pct Chg Year Ago 2.3 -2.6 -2.4 -0.5 1.9 1.6 4.1 1.8 -1.7 -1.0 0.3 0.5 0.3 Federal Government 12.5 13.3 14.6 14.0 13.7 13.5 13.5 13.7 14.0 13.8 13.6 13.5 14.2 Pct Chg Year Ago 1.0 6.2 10.6 -4.1 -1.9 -1.9 0.5 1.4 1.8 -1.1 -1.5 -1.2 5.3 State & Local Government 225.9 222.0 215.6 210.6 207.7 209.0 214.2 218.2 220.4 223.1 227.9 232.8 236.6 Pct Chg Year Ago 1.4 -1.7 -2.9 -2.3 -1.4 0.6 2.5 1.9 1.0 1.2 2.1 2.2 1.6 Other Economic Indicators Population (Ths) 2111.2 2135.3 2157.0 2177.9 2198.3 2221.3 2248.7 2277.9 2307.9 2339.8 2374.4 2409.9 2445.8 Pct Chg Year Ago 1.2 1.1 1.0 1.0 0.9 1.0 1.2 1.3 1.3 1.4 1.5 1.5 1.5Labor Force (Ths) 1044.7 1050.6 1048.3 1044.3 1049.8 1046.7 1049.2 1055.6 1070.4 1090.6 1108.7 1126.7 1143.3 Pct Chg Year Ago 0.9 0.6 -0.2 -0.4 0.5 -0.3 0.2 0.6 1.4 1.9 1.7 1.6 1.5Unemployment Rate (%) 7.1 10.9 12.4 11.8 10.3 8.7 7.2 5.7 5.2 5.4 5.4 5.6 5.6Total Housing Starts 5532 2925 2563 2814 3424 4137 4368 6459 7449 11153 12682 13157 13683 Single-Family 4291 2721 2247 2070 2942 3557 4002 5709 6536 9305 10329 10390 10685 Multifamily 1241 204 316 744 481 580 366 750 913 1848 2353 2767 2998
* Real personal income and real per capita income are adjusted for inflation and regional purchasing power parities. This facilitates interregional comparisons of income that control for the cost of living.
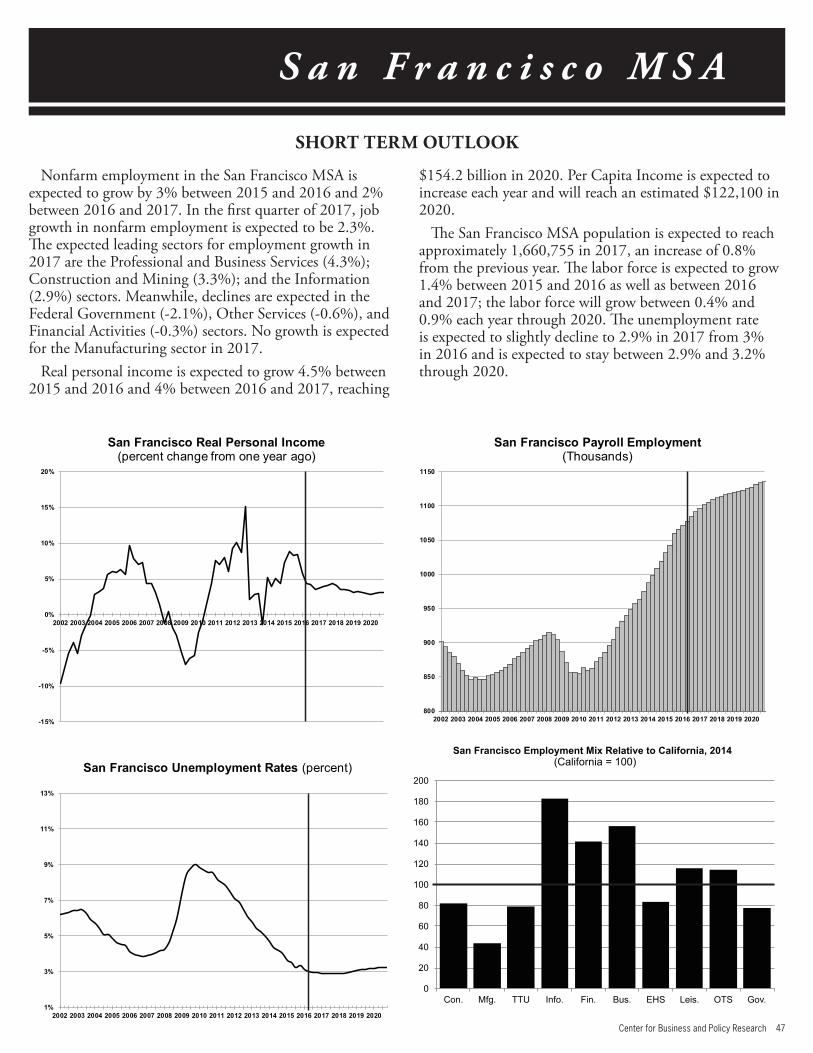
Center for Business and Policy Research 47
S a n F r a n c i s c o M S A
Nonfarm employment in the San Francisco MSA is expected to grow by 3% between 2015 and 2016 and 2% between 2016 and 2017. In the first quarter of 2017, job growth in nonfarm employment is expected to be 2.3%. The expected leading sectors for employment growth in 2017 are the Professional and Business Services (4.3%); Construction and Mining (3.3%); and the Information (2.9%) sectors. Meanwhile, declines are expected in the Federal Government (-2.1%), Other Services (-0.6%), and Financial Activities (-0.3%) sectors. No growth is expected for the Manufacturing sector in 2017.
Real personal income is expected to grow 4.5% between 2015 and 2016 and 4% between 2016 and 2017, reaching
$154.2 billion in 2020. Per Capita Income is expected to increase each year and will reach an estimated $122,100 in 2020.
The San Francisco MSA population is expected to reach approximately 1,660,755 in 2017, an increase of 0.8% from the previous year. The labor force is expected to grow 1.4% between 2015 and 2016 as well as between 2016 and 2017; the labor force will grow between 0.4% and 0.9% each year through 2020. The unemployment rate is expected to slightly decline to 2.9% in 2017 from 3% in 2016 and is expected to stay between 2.9% and 3.2% through 2020.
SHORT TERM OUTLOOK
0
20
40
60
80
100
120
140
160
180
200
Con. Mfg. TTU Info. Fin. Bus. EHS Leis. OTS Gov.
San Francisco Employment Mix Relative to California, 2014(California = 100)
-15%
-10%
-5%
0%
5%
10%
15%
20%
2002 2003 2004 2005 2006 2007 2008 2009 2010 2011 2012 2013 2014 2015 2016 2017 2018 2019 2020
San Francisco Real Personal Income (percent change from one year ago)
1%
3%
5%
7%
9%
11%
13%
2002 2003 2004 2005 2006 2007 2008 2009 2010 2011 2012 2013 2014 2015 2016 2017 2018 2019 2020
San Francisco Unemployment Rates (percent)
800
850
900
950
1000
1050
1100
1150
2002 2003 2004 2005 2006 2007 2008 2009 2010 2011 2012 2013 2014 2015 2016 2017 2018 2019 2020
San Francisco Payroll Employment (Thousands)
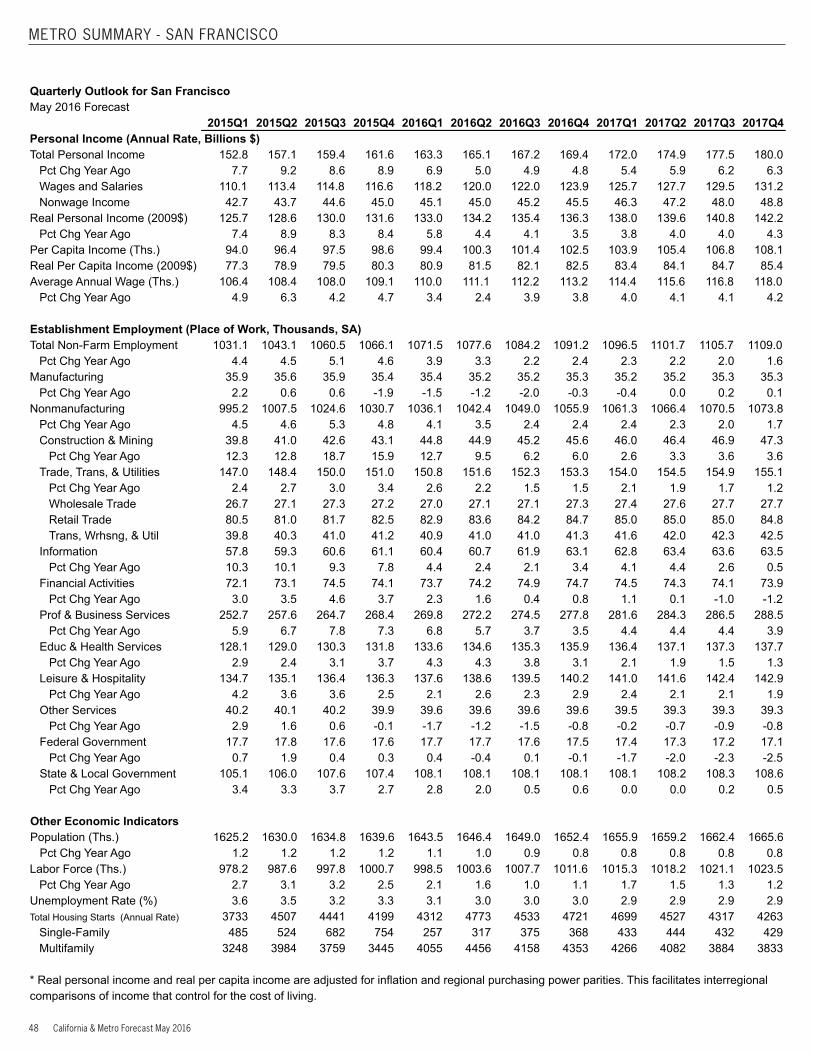
48 California & Metro Forecast May 2016
METRO SUMMARY - SAN FRANCISCO
Quarterly Outlook for San FranciscoMay 2016 Forecast 2015Q1 2015Q2 2015Q3 2015Q4 2016Q1 2016Q2 2016Q3 2016Q4 2017Q1 2017Q2 2017Q3 2017Q4Personal Income (Annual Rate, Billions $) Total Personal Income 152.8 157.1 159.4 161.6 163.3 165.1 167.2 169.4 172.0 174.9 177.5 180.0
Pct Chg Year Ago 7.7 9.2 8.6 8.9 6.9 5.0 4.9 4.8 5.4 5.9 6.2 6.3Wages and Salaries 110.1 113.4 114.8 116.6 118.2 120.0 122.0 123.9 125.7 127.7 129.5 131.2Nonwage Income 42.7 43.7 44.6 45.0 45.1 45.0 45.2 45.5 46.3 47.2 48.0 48.8
Real Personal Income (2009$) 125.7 128.6 130.0 131.6 133.0 134.2 135.4 136.3 138.0 139.6 140.8 142.2Pct Chg Year Ago 7.4 8.9 8.3 8.4 5.8 4.4 4.1 3.5 3.8 4.0 4.0 4.3
Per Capita Income (Ths.) 94.0 96.4 97.5 98.6 99.4 100.3 101.4 102.5 103.9 105.4 106.8 108.1Real Per Capita Income (2009$) 77.3 78.9 79.5 80.3 80.9 81.5 82.1 82.5 83.4 84.1 84.7 85.4Average Annual Wage (Ths.) 106.4 108.4 108.0 109.1 110.0 111.1 112.2 113.2 114.4 115.6 116.8 118.0
Pct Chg Year Ago 4.9 6.3 4.2 4.7 3.4 2.4 3.9 3.8 4.0 4.1 4.1 4.2 Establishment Employment (Place of Work, Thousands, SA)Total Non-Farm Employment 1031.1 1043.1 1060.5 1066.1 1071.5 1077.6 1084.2 1091.2 1096.5 1101.7 1105.7 1109.0
Pct Chg Year Ago 4.4 4.5 5.1 4.6 3.9 3.3 2.2 2.4 2.3 2.2 2.0 1.6Manufacturing 35.9 35.6 35.9 35.4 35.4 35.2 35.2 35.3 35.2 35.2 35.3 35.3
Pct Chg Year Ago 2.2 0.6 0.6 -1.9 -1.5 -1.2 -2.0 -0.3 -0.4 0.0 0.2 0.1Nonmanufacturing 995.2 1007.5 1024.6 1030.7 1036.1 1042.4 1049.0 1055.9 1061.3 1066.4 1070.5 1073.8
Pct Chg Year Ago 4.5 4.6 5.3 4.8 4.1 3.5 2.4 2.4 2.4 2.3 2.0 1.7Construction & Mining 39.8 41.0 42.6 43.1 44.8 44.9 45.2 45.6 46.0 46.4 46.9 47.3
Pct Chg Year Ago 12.3 12.8 18.7 15.9 12.7 9.5 6.2 6.0 2.6 3.3 3.6 3.6Trade, Trans, & Utilities 147.0 148.4 150.0 151.0 150.8 151.6 152.3 153.3 154.0 154.5 154.9 155.1
Pct Chg Year Ago 2.4 2.7 3.0 3.4 2.6 2.2 1.5 1.5 2.1 1.9 1.7 1.2Wholesale Trade 26.7 27.1 27.3 27.2 27.0 27.1 27.1 27.3 27.4 27.6 27.7 27.7Retail Trade 80.5 81.0 81.7 82.5 82.9 83.6 84.2 84.7 85.0 85.0 85.0 84.8Trans, Wrhsng, & Util 39.8 40.3 41.0 41.2 40.9 41.0 41.0 41.3 41.6 42.0 42.3 42.5
Information 57.8 59.3 60.6 61.1 60.4 60.7 61.9 63.1 62.8 63.4 63.6 63.5Pct Chg Year Ago 10.3 10.1 9.3 7.8 4.4 2.4 2.1 3.4 4.1 4.4 2.6 0.5
Financial Activities 72.1 73.1 74.5 74.1 73.7 74.2 74.9 74.7 74.5 74.3 74.1 73.9Pct Chg Year Ago 3.0 3.5 4.6 3.7 2.3 1.6 0.4 0.8 1.1 0.1 -1.0 -1.2
Prof & Business Services 252.7 257.6 264.7 268.4 269.8 272.2 274.5 277.8 281.6 284.3 286.5 288.5Pct Chg Year Ago 5.9 6.7 7.8 7.3 6.8 5.7 3.7 3.5 4.4 4.4 4.4 3.9
Educ & Health Services 128.1 129.0 130.3 131.8 133.6 134.6 135.3 135.9 136.4 137.1 137.3 137.7Pct Chg Year Ago 2.9 2.4 3.1 3.7 4.3 4.3 3.8 3.1 2.1 1.9 1.5 1.3
Leisure & Hospitality 134.7 135.1 136.4 136.3 137.6 138.6 139.5 140.2 141.0 141.6 142.4 142.9Pct Chg Year Ago 4.2 3.6 3.6 2.5 2.1 2.6 2.3 2.9 2.4 2.1 2.1 1.9
Other Services 40.2 40.1 40.2 39.9 39.6 39.6 39.6 39.6 39.5 39.3 39.3 39.3Pct Chg Year Ago 2.9 1.6 0.6 -0.1 -1.7 -1.2 -1.5 -0.8 -0.2 -0.7 -0.9 -0.8
Federal Government 17.7 17.8 17.6 17.6 17.7 17.7 17.6 17.5 17.4 17.3 17.2 17.1Pct Chg Year Ago 0.7 1.9 0.4 0.3 0.4 -0.4 0.1 -0.1 -1.7 -2.0 -2.3 -2.5
State & Local Government 105.1 106.0 107.6 107.4 108.1 108.1 108.1 108.1 108.1 108.2 108.3 108.6Pct Chg Year Ago 3.4 3.3 3.7 2.7 2.8 2.0 0.5 0.6 0.0 0.0 0.2 0.5
Other Economic Indicators Population (Ths.) 1625.2 1630.0 1634.8 1639.6 1643.5 1646.4 1649.0 1652.4 1655.9 1659.2 1662.4 1665.6
Pct Chg Year Ago 1.2 1.2 1.2 1.2 1.1 1.0 0.9 0.8 0.8 0.8 0.8 0.8Labor Force (Ths.) 978.2 987.6 997.8 1000.7 998.5 1003.6 1007.7 1011.6 1015.3 1018.2 1021.1 1023.5
Pct Chg Year Ago 2.7 3.1 3.2 2.5 2.1 1.6 1.0 1.1 1.7 1.5 1.3 1.2Unemployment Rate (%) 3.6 3.5 3.2 3.3 3.1 3.0 3.0 3.0 2.9 2.9 2.9 2.9Total Housing Starts (Annual Rate) 3733 4507 4441 4199 4312 4773 4533 4721 4699 4527 4317 4263
Single-Family 485 524 682 754 257 317 375 368 433 444 432 429Multifamily 3248 3984 3759 3445 4055 4456 4158 4353 4266 4082 3884 3833
* Real personal income and real per capita income are adjusted for inflation and regional purchasing power parities. This facilitates interregional comparisons of income that control for the cost of living.
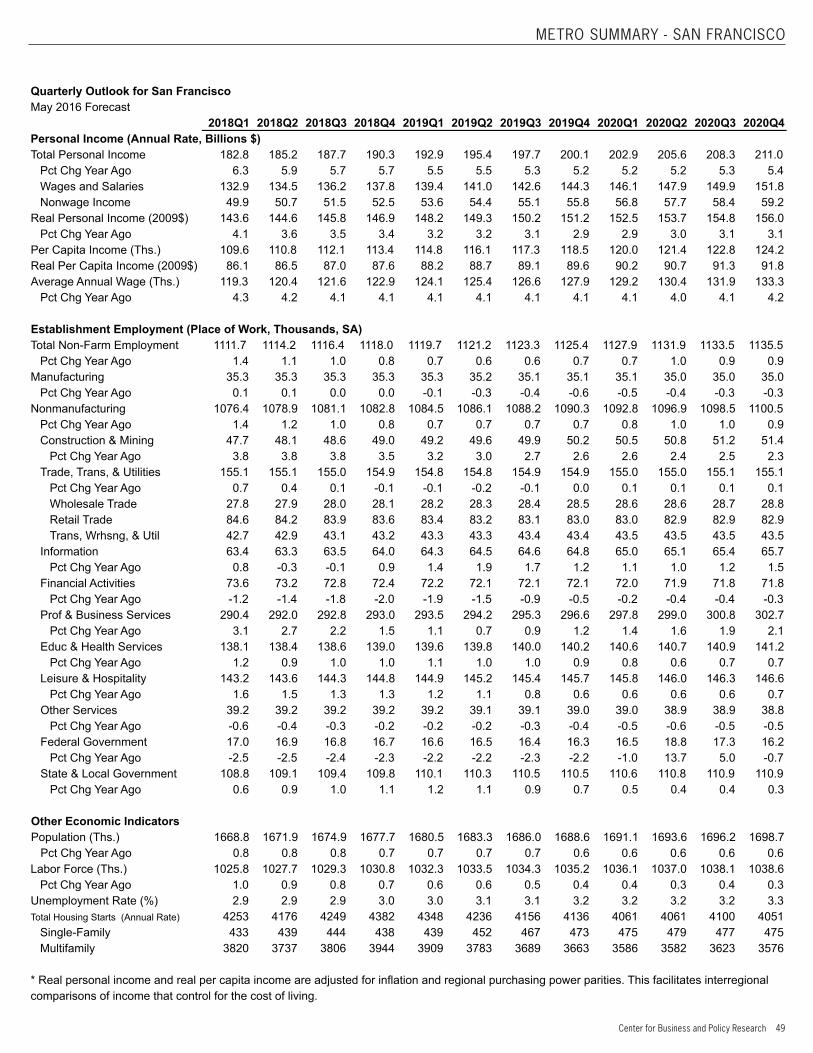
Center for Business and Policy Research 49
METRO SUMMARY - SAN FRANCISCO
Quarterly Outlook for San FranciscoMay 2016 Forecast 2018Q1 2018Q2 2018Q3 2018Q4 2019Q1 2019Q2 2019Q3 2019Q4 2020Q1 2020Q2 2020Q3 2020Q4Personal Income (Annual Rate, Billions $) Total Personal Income 182.8 185.2 187.7 190.3 192.9 195.4 197.7 200.1 202.9 205.6 208.3 211.0
Pct Chg Year Ago 6.3 5.9 5.7 5.7 5.5 5.5 5.3 5.2 5.2 5.2 5.3 5.4Wages and Salaries 132.9 134.5 136.2 137.8 139.4 141.0 142.6 144.3 146.1 147.9 149.9 151.8Nonwage Income 49.9 50.7 51.5 52.5 53.6 54.4 55.1 55.8 56.8 57.7 58.4 59.2
Real Personal Income (2009$) 143.6 144.6 145.8 146.9 148.2 149.3 150.2 151.2 152.5 153.7 154.8 156.0Pct Chg Year Ago 4.1 3.6 3.5 3.4 3.2 3.2 3.1 2.9 2.9 3.0 3.1 3.1
Per Capita Income (Ths.) 109.6 110.8 112.1 113.4 114.8 116.1 117.3 118.5 120.0 121.4 122.8 124.2Real Per Capita Income (2009$) 86.1 86.5 87.0 87.6 88.2 88.7 89.1 89.6 90.2 90.7 91.3 91.8Average Annual Wage (Ths.) 119.3 120.4 121.6 122.9 124.1 125.4 126.6 127.9 129.2 130.4 131.9 133.3
Pct Chg Year Ago 4.3 4.2 4.1 4.1 4.1 4.1 4.1 4.1 4.1 4.0 4.1 4.2 Establishment Employment (Place of Work, Thousands, SA)Total Non-Farm Employment 1111.7 1114.2 1116.4 1118.0 1119.7 1121.2 1123.3 1125.4 1127.9 1131.9 1133.5 1135.5
Pct Chg Year Ago 1.4 1.1 1.0 0.8 0.7 0.6 0.6 0.7 0.7 1.0 0.9 0.9Manufacturing 35.3 35.3 35.3 35.3 35.3 35.2 35.1 35.1 35.1 35.0 35.0 35.0
Pct Chg Year Ago 0.1 0.1 0.0 0.0 -0.1 -0.3 -0.4 -0.6 -0.5 -0.4 -0.3 -0.3Nonmanufacturing 1076.4 1078.9 1081.1 1082.8 1084.5 1086.1 1088.2 1090.3 1092.8 1096.9 1098.5 1100.5
Pct Chg Year Ago 1.4 1.2 1.0 0.8 0.7 0.7 0.7 0.7 0.8 1.0 1.0 0.9Construction & Mining 47.7 48.1 48.6 49.0 49.2 49.6 49.9 50.2 50.5 50.8 51.2 51.4
Pct Chg Year Ago 3.8 3.8 3.8 3.5 3.2 3.0 2.7 2.6 2.6 2.4 2.5 2.3Trade, Trans, & Utilities 155.1 155.1 155.0 154.9 154.8 154.8 154.9 154.9 155.0 155.0 155.1 155.1
Pct Chg Year Ago 0.7 0.4 0.1 -0.1 -0.1 -0.2 -0.1 0.0 0.1 0.1 0.1 0.1Wholesale Trade 27.8 27.9 28.0 28.1 28.2 28.3 28.4 28.5 28.6 28.6 28.7 28.8Retail Trade 84.6 84.2 83.9 83.6 83.4 83.2 83.1 83.0 83.0 82.9 82.9 82.9Trans, Wrhsng, & Util 42.7 42.9 43.1 43.2 43.3 43.3 43.4 43.4 43.5 43.5 43.5 43.5
Information 63.4 63.3 63.5 64.0 64.3 64.5 64.6 64.8 65.0 65.1 65.4 65.7Pct Chg Year Ago 0.8 -0.3 -0.1 0.9 1.4 1.9 1.7 1.2 1.1 1.0 1.2 1.5
Financial Activities 73.6 73.2 72.8 72.4 72.2 72.1 72.1 72.1 72.0 71.9 71.8 71.8Pct Chg Year Ago -1.2 -1.4 -1.8 -2.0 -1.9 -1.5 -0.9 -0.5 -0.2 -0.4 -0.4 -0.3
Prof & Business Services 290.4 292.0 292.8 293.0 293.5 294.2 295.3 296.6 297.8 299.0 300.8 302.7Pct Chg Year Ago 3.1 2.7 2.2 1.5 1.1 0.7 0.9 1.2 1.4 1.6 1.9 2.1
Educ & Health Services 138.1 138.4 138.6 139.0 139.6 139.8 140.0 140.2 140.6 140.7 140.9 141.2Pct Chg Year Ago 1.2 0.9 1.0 1.0 1.1 1.0 1.0 0.9 0.8 0.6 0.7 0.7
Leisure & Hospitality 143.2 143.6 144.3 144.8 144.9 145.2 145.4 145.7 145.8 146.0 146.3 146.6Pct Chg Year Ago 1.6 1.5 1.3 1.3 1.2 1.1 0.8 0.6 0.6 0.6 0.6 0.7
Other Services 39.2 39.2 39.2 39.2 39.2 39.1 39.1 39.0 39.0 38.9 38.9 38.8Pct Chg Year Ago -0.6 -0.4 -0.3 -0.2 -0.2 -0.2 -0.3 -0.4 -0.5 -0.6 -0.5 -0.5
Federal Government 17.0 16.9 16.8 16.7 16.6 16.5 16.4 16.3 16.5 18.8 17.3 16.2Pct Chg Year Ago -2.5 -2.5 -2.4 -2.3 -2.2 -2.2 -2.3 -2.2 -1.0 13.7 5.0 -0.7
State & Local Government 108.8 109.1 109.4 109.8 110.1 110.3 110.5 110.5 110.6 110.8 110.9 110.9Pct Chg Year Ago 0.6 0.9 1.0 1.1 1.2 1.1 0.9 0.7 0.5 0.4 0.4 0.3
Other Economic Indicators Population (Ths.) 1668.8 1671.9 1674.9 1677.7 1680.5 1683.3 1686.0 1688.6 1691.1 1693.6 1696.2 1698.7
Pct Chg Year Ago 0.8 0.8 0.8 0.7 0.7 0.7 0.7 0.6 0.6 0.6 0.6 0.6Labor Force (Ths.) 1025.8 1027.7 1029.3 1030.8 1032.3 1033.5 1034.3 1035.2 1036.1 1037.0 1038.1 1038.6
Pct Chg Year Ago 1.0 0.9 0.8 0.7 0.6 0.6 0.5 0.4 0.4 0.3 0.4 0.3Unemployment Rate (%) 2.9 2.9 2.9 3.0 3.0 3.1 3.1 3.2 3.2 3.2 3.2 3.3Total Housing Starts (Annual Rate) 4253 4176 4249 4382 4348 4236 4156 4136 4061 4061 4100 4051
Single-Family 433 439 444 438 439 452 467 473 475 479 477 475Multifamily 3820 3737 3806 3944 3909 3783 3689 3663 3586 3582 3623 3576
* Real personal income and real per capita income are adjusted for inflation and regional purchasing power parities. This facilitates interregional comparisons of income that control for the cost of living.
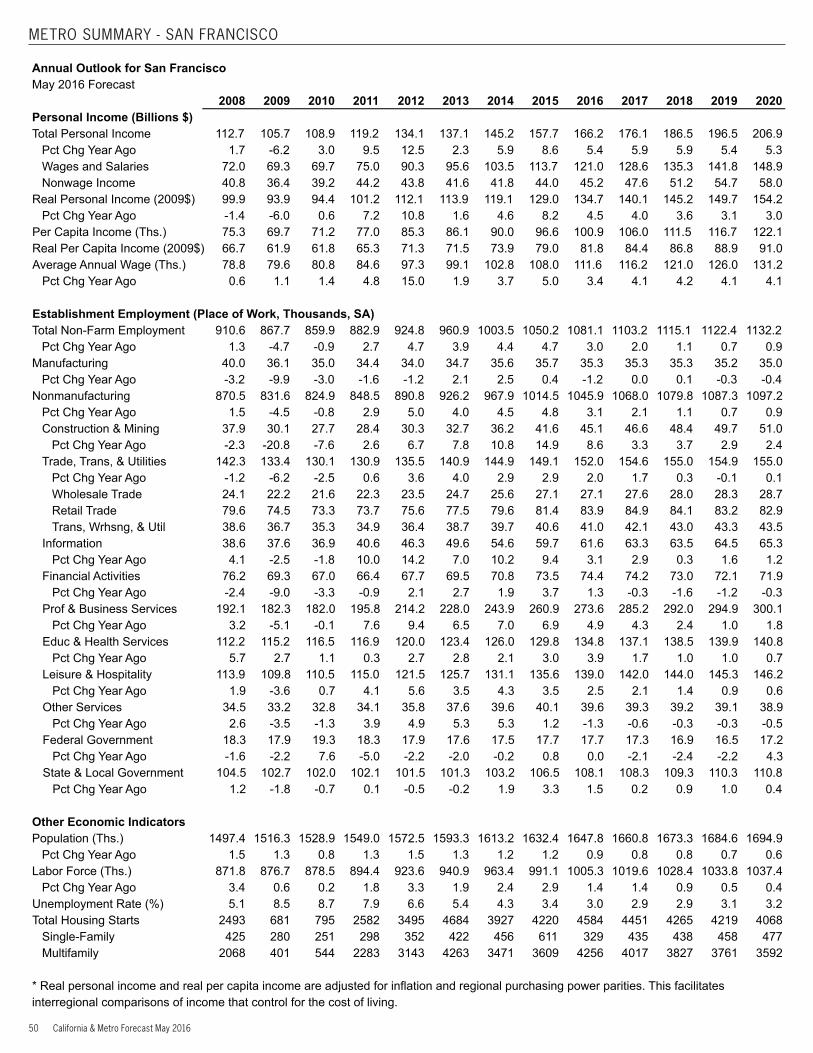
50 California & Metro Forecast May 2016
METRO SUMMARY - SAN FRANCISCO
Annual Outlook for San FranciscoMay 2016 Forecast 2008 2009 2010 2011 2012 2013 2014 2015 2016 2017 2018 2019 2020Personal Income (Billions $) Total Personal Income 112.7 105.7 108.9 119.2 134.1 137.1 145.2 157.7 166.2 176.1 186.5 196.5 206.9
Pct Chg Year Ago 1.7 -6.2 3.0 9.5 12.5 2.3 5.9 8.6 5.4 5.9 5.9 5.4 5.3Wages and Salaries 72.0 69.3 69.7 75.0 90.3 95.6 103.5 113.7 121.0 128.6 135.3 141.8 148.9Nonwage Income 40.8 36.4 39.2 44.2 43.8 41.6 41.8 44.0 45.2 47.6 51.2 54.7 58.0
Real Personal Income (2009$) 99.9 93.9 94.4 101.2 112.1 113.9 119.1 129.0 134.7 140.1 145.2 149.7 154.2Pct Chg Year Ago -1.4 -6.0 0.6 7.2 10.8 1.6 4.6 8.2 4.5 4.0 3.6 3.1 3.0
Per Capita Income (Ths.) 75.3 69.7 71.2 77.0 85.3 86.1 90.0 96.6 100.9 106.0 111.5 116.7 122.1Real Per Capita Income (2009$) 66.7 61.9 61.8 65.3 71.3 71.5 73.9 79.0 81.8 84.4 86.8 88.9 91.0Average Annual Wage (Ths.) 78.8 79.6 80.8 84.6 97.3 99.1 102.8 108.0 111.6 116.2 121.0 126.0 131.2
Pct Chg Year Ago 0.6 1.1 1.4 4.8 15.0 1.9 3.7 5.0 3.4 4.1 4.2 4.1 4.1 Establishment Employment (Place of Work, Thousands, SA)Total Non-Farm Employment 910.6 867.7 859.9 882.9 924.8 960.9 1003.5 1050.2 1081.1 1103.2 1115.1 1122.4 1132.2
Pct Chg Year Ago 1.3 -4.7 -0.9 2.7 4.7 3.9 4.4 4.7 3.0 2.0 1.1 0.7 0.9Manufacturing 40.0 36.1 35.0 34.4 34.0 34.7 35.6 35.7 35.3 35.3 35.3 35.2 35.0
Pct Chg Year Ago -3.2 -9.9 -3.0 -1.6 -1.2 2.1 2.5 0.4 -1.2 0.0 0.1 -0.3 -0.4Nonmanufacturing 870.5 831.6 824.9 848.5 890.8 926.2 967.9 1014.5 1045.9 1068.0 1079.8 1087.3 1097.2
Pct Chg Year Ago 1.5 -4.5 -0.8 2.9 5.0 4.0 4.5 4.8 3.1 2.1 1.1 0.7 0.9Construction & Mining 37.9 30.1 27.7 28.4 30.3 32.7 36.2 41.6 45.1 46.6 48.4 49.7 51.0
Pct Chg Year Ago -2.3 -20.8 -7.6 2.6 6.7 7.8 10.8 14.9 8.6 3.3 3.7 2.9 2.4Trade, Trans, & Utilities 142.3 133.4 130.1 130.9 135.5 140.9 144.9 149.1 152.0 154.6 155.0 154.9 155.0
Pct Chg Year Ago -1.2 -6.2 -2.5 0.6 3.6 4.0 2.9 2.9 2.0 1.7 0.3 -0.1 0.1Wholesale Trade 24.1 22.2 21.6 22.3 23.5 24.7 25.6 27.1 27.1 27.6 28.0 28.3 28.7Retail Trade 79.6 74.5 73.3 73.7 75.6 77.5 79.6 81.4 83.9 84.9 84.1 83.2 82.9Trans, Wrhsng, & Util 38.6 36.7 35.3 34.9 36.4 38.7 39.7 40.6 41.0 42.1 43.0 43.3 43.5
Information 38.6 37.6 36.9 40.6 46.3 49.6 54.6 59.7 61.6 63.3 63.5 64.5 65.3Pct Chg Year Ago 4.1 -2.5 -1.8 10.0 14.2 7.0 10.2 9.4 3.1 2.9 0.3 1.6 1.2
Financial Activities 76.2 69.3 67.0 66.4 67.7 69.5 70.8 73.5 74.4 74.2 73.0 72.1 71.9Pct Chg Year Ago -2.4 -9.0 -3.3 -0.9 2.1 2.7 1.9 3.7 1.3 -0.3 -1.6 -1.2 -0.3
Prof & Business Services 192.1 182.3 182.0 195.8 214.2 228.0 243.9 260.9 273.6 285.2 292.0 294.9 300.1Pct Chg Year Ago 3.2 -5.1 -0.1 7.6 9.4 6.5 7.0 6.9 4.9 4.3 2.4 1.0 1.8
Educ & Health Services 112.2 115.2 116.5 116.9 120.0 123.4 126.0 129.8 134.8 137.1 138.5 139.9 140.8Pct Chg Year Ago 5.7 2.7 1.1 0.3 2.7 2.8 2.1 3.0 3.9 1.7 1.0 1.0 0.7
Leisure & Hospitality 113.9 109.8 110.5 115.0 121.5 125.7 131.1 135.6 139.0 142.0 144.0 145.3 146.2Pct Chg Year Ago 1.9 -3.6 0.7 4.1 5.6 3.5 4.3 3.5 2.5 2.1 1.4 0.9 0.6
Other Services 34.5 33.2 32.8 34.1 35.8 37.6 39.6 40.1 39.6 39.3 39.2 39.1 38.9Pct Chg Year Ago 2.6 -3.5 -1.3 3.9 4.9 5.3 5.3 1.2 -1.3 -0.6 -0.3 -0.3 -0.5
Federal Government 18.3 17.9 19.3 18.3 17.9 17.6 17.5 17.7 17.7 17.3 16.9 16.5 17.2Pct Chg Year Ago -1.6 -2.2 7.6 -5.0 -2.2 -2.0 -0.2 0.8 0.0 -2.1 -2.4 -2.2 4.3
State & Local Government 104.5 102.7 102.0 102.1 101.5 101.3 103.2 106.5 108.1 108.3 109.3 110.3 110.8Pct Chg Year Ago 1.2 -1.8 -0.7 0.1 -0.5 -0.2 1.9 3.3 1.5 0.2 0.9 1.0 0.4
Other Economic Indicators Population (Ths.) 1497.4 1516.3 1528.9 1549.0 1572.5 1593.3 1613.2 1632.4 1647.8 1660.8 1673.3 1684.6 1694.9
Pct Chg Year Ago 1.5 1.3 0.8 1.3 1.5 1.3 1.2 1.2 0.9 0.8 0.8 0.7 0.6Labor Force (Ths.) 871.8 876.7 878.5 894.4 923.6 940.9 963.4 991.1 1005.3 1019.6 1028.4 1033.8 1037.4
Pct Chg Year Ago 3.4 0.6 0.2 1.8 3.3 1.9 2.4 2.9 1.4 1.4 0.9 0.5 0.4Unemployment Rate (%) 5.1 8.5 8.7 7.9 6.6 5.4 4.3 3.4 3.0 2.9 2.9 3.1 3.2Total Housing Starts 2493 681 795 2582 3495 4684 3927 4220 4584 4451 4265 4219 4068
Single-Family 425 280 251 298 352 422 456 611 329 435 438 458 477Multifamily 2068 401 544 2283 3143 4263 3471 3609 4256 4017 3827 3761 3592
* Real personal income and real per capita income are adjusted for inflation and regional purchasing power parities. This facilitates interregional comparisons of income that control for the cost of living.
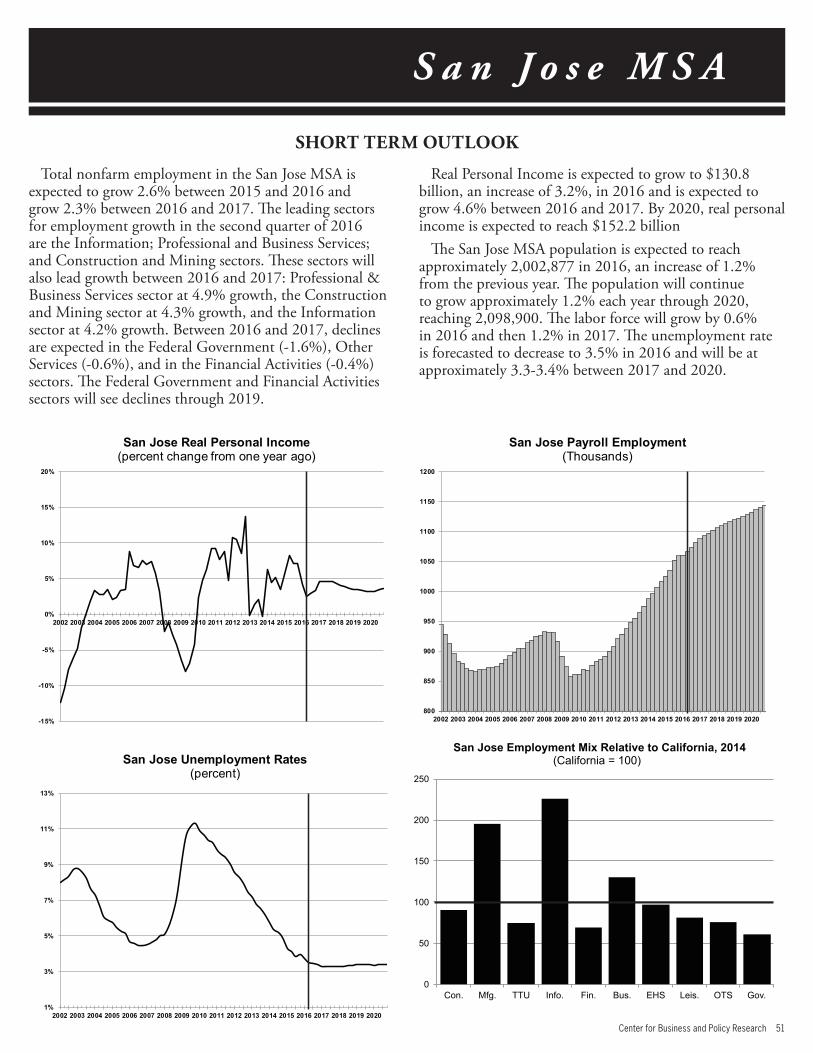
Center for Business and Policy Research 51
S a n J o s e M S A
Total nonfarm employment in the San Jose MSA is expected to grow 2.6% between 2015 and 2016 and grow 2.3% between 2016 and 2017. The leading sectors for employment growth in the second quarter of 2016 are the Information; Professional and Business Services; and Construction and Mining sectors. These sectors will also lead growth between 2016 and 2017: Professional & Business Services sector at 4.9% growth, the Construction and Mining sector at 4.3% growth, and the Information sector at 4.2% growth. Between 2016 and 2017, declines are expected in the Federal Government (-1.6%), Other Services (-0.6%), and in the Financial Activities (-0.4%) sectors. The Federal Government and Financial Activities sectors will see declines through 2019.
Real Personal Income is expected to grow to $130.8 billion, an increase of 3.2%, in 2016 and is expected to grow 4.6% between 2016 and 2017. By 2020, real personal income is expected to reach $152.2 billion
The San Jose MSA population is expected to reach approximately 2,002,877 in 2016, an increase of 1.2% from the previous year. The population will continue to grow approximately 1.2% each year through 2020, reaching 2,098,900. The labor force will grow by 0.6% in 2016 and then 1.2% in 2017. The unemployment rate is forecasted to decrease to 3.5% in 2016 and will be at approximately 3.3-3.4% between 2017 and 2020.
SHORT TERM OUTLOOK
0
50
100
150
200
250
Con. Mfg. TTU Info. Fin. Bus. EHS Leis. OTS Gov.
San Jose Employment Mix Relative to California, 2014(California = 100)
-15%
-10%
-5%
0%
5%
10%
15%
20%
2002 2003 2004 2005 2006 2007 2008 2009 2010 2011 2012 2013 2014 2015 2016 2017 2018 2019 2020
San Jose Real Personal Income (percent change from one year ago)
1%
3%
5%
7%
9%
11%
13%
2002 2003 2004 2005 2006 2007 2008 2009 2010 2011 2012 2013 2014 2015 2016 2017 2018 2019 2020
San Jose Unemployment Rates(percent)
800
850
900
950
1000
1050
1100
1150
1200
2002 2003 2004 2005 2006 2007 2008 2009 2010 2011 2012 2013 2014 2015 2016 2017 2018 2019 2020
San Jose Payroll Employment (Thousands)
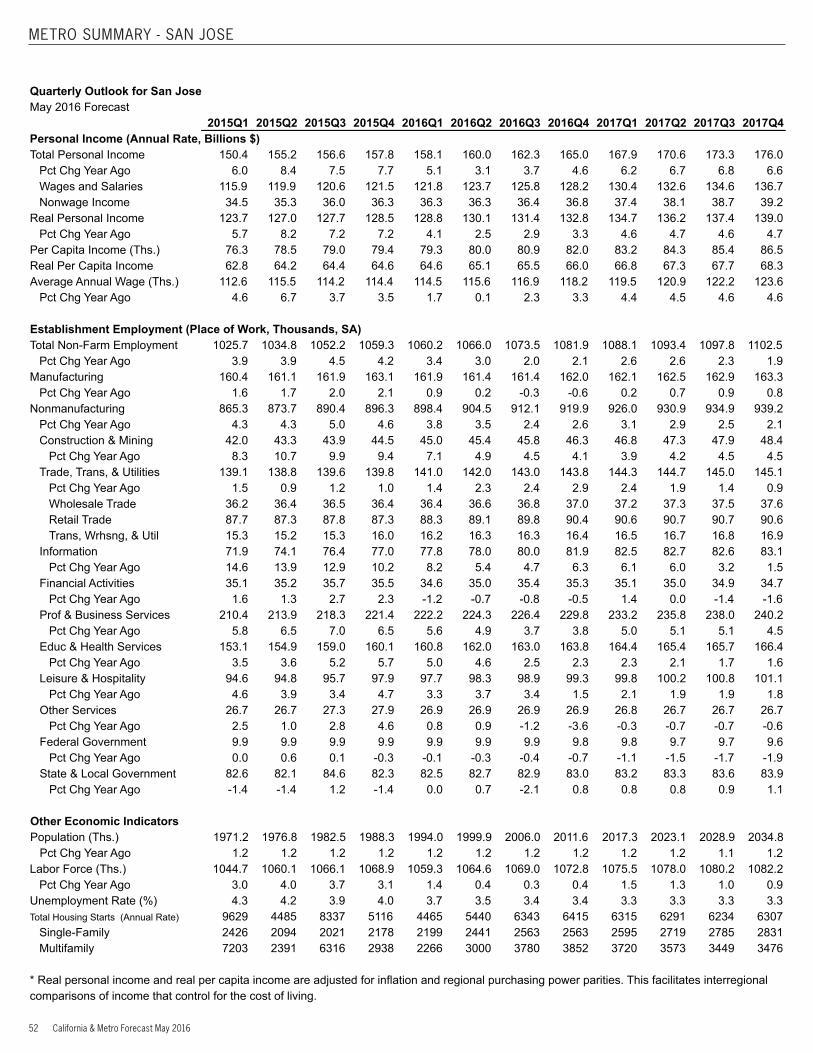
52 California & Metro Forecast May 2016
METRO SUMMARY - SAN JOSE
Quarterly Outlook for San JoseMay 2016 Forecast 2015Q1 2015Q2 2015Q3 2015Q4 2016Q1 2016Q2 2016Q3 2016Q4 2017Q1 2017Q2 2017Q3 2017Q4Personal Income (Annual Rate, Billions $) Total Personal Income 150.4 155.2 156.6 157.8 158.1 160.0 162.3 165.0 167.9 170.6 173.3 176.0
Pct Chg Year Ago 6.0 8.4 7.5 7.7 5.1 3.1 3.7 4.6 6.2 6.7 6.8 6.6Wages and Salaries 115.9 119.9 120.6 121.5 121.8 123.7 125.8 128.2 130.4 132.6 134.6 136.7Nonwage Income 34.5 35.3 36.0 36.3 36.3 36.3 36.4 36.8 37.4 38.1 38.7 39.2
Real Personal Income 123.7 127.0 127.7 128.5 128.8 130.1 131.4 132.8 134.7 136.2 137.4 139.0Pct Chg Year Ago 5.7 8.2 7.2 7.2 4.1 2.5 2.9 3.3 4.6 4.7 4.6 4.7
Per Capita Income (Ths.) 76.3 78.5 79.0 79.4 79.3 80.0 80.9 82.0 83.2 84.3 85.4 86.5Real Per Capita Income 62.8 64.2 64.4 64.6 64.6 65.1 65.5 66.0 66.8 67.3 67.7 68.3Average Annual Wage (Ths.) 112.6 115.5 114.2 114.4 114.5 115.6 116.9 118.2 119.5 120.9 122.2 123.6
Pct Chg Year Ago 4.6 6.7 3.7 3.5 1.7 0.1 2.3 3.3 4.4 4.5 4.6 4.6 Establishment Employment (Place of Work, Thousands, SA)Total Non-Farm Employment 1025.7 1034.8 1052.2 1059.3 1060.2 1066.0 1073.5 1081.9 1088.1 1093.4 1097.8 1102.5
Pct Chg Year Ago 3.9 3.9 4.5 4.2 3.4 3.0 2.0 2.1 2.6 2.6 2.3 1.9Manufacturing 160.4 161.1 161.9 163.1 161.9 161.4 161.4 162.0 162.1 162.5 162.9 163.3
Pct Chg Year Ago 1.6 1.7 2.0 2.1 0.9 0.2 -0.3 -0.6 0.2 0.7 0.9 0.8Nonmanufacturing 865.3 873.7 890.4 896.3 898.4 904.5 912.1 919.9 926.0 930.9 934.9 939.2
Pct Chg Year Ago 4.3 4.3 5.0 4.6 3.8 3.5 2.4 2.6 3.1 2.9 2.5 2.1Construction & Mining 42.0 43.3 43.9 44.5 45.0 45.4 45.8 46.3 46.8 47.3 47.9 48.4
Pct Chg Year Ago 8.3 10.7 9.9 9.4 7.1 4.9 4.5 4.1 3.9 4.2 4.5 4.5Trade, Trans, & Utilities 139.1 138.8 139.6 139.8 141.0 142.0 143.0 143.8 144.3 144.7 145.0 145.1
Pct Chg Year Ago 1.5 0.9 1.2 1.0 1.4 2.3 2.4 2.9 2.4 1.9 1.4 0.9Wholesale Trade 36.2 36.4 36.5 36.4 36.4 36.6 36.8 37.0 37.2 37.3 37.5 37.6Retail Trade 87.7 87.3 87.8 87.3 88.3 89.1 89.8 90.4 90.6 90.7 90.7 90.6Trans, Wrhsng, & Util 15.3 15.2 15.3 16.0 16.2 16.3 16.3 16.4 16.5 16.7 16.8 16.9
Information 71.9 74.1 76.4 77.0 77.8 78.0 80.0 81.9 82.5 82.7 82.6 83.1Pct Chg Year Ago 14.6 13.9 12.9 10.2 8.2 5.4 4.7 6.3 6.1 6.0 3.2 1.5
Financial Activities 35.1 35.2 35.7 35.5 34.6 35.0 35.4 35.3 35.1 35.0 34.9 34.7Pct Chg Year Ago 1.6 1.3 2.7 2.3 -1.2 -0.7 -0.8 -0.5 1.4 0.0 -1.4 -1.6
Prof & Business Services 210.4 213.9 218.3 221.4 222.2 224.3 226.4 229.8 233.2 235.8 238.0 240.2Pct Chg Year Ago 5.8 6.5 7.0 6.5 5.6 4.9 3.7 3.8 5.0 5.1 5.1 4.5
Educ & Health Services 153.1 154.9 159.0 160.1 160.8 162.0 163.0 163.8 164.4 165.4 165.7 166.4Pct Chg Year Ago 3.5 3.6 5.2 5.7 5.0 4.6 2.5 2.3 2.3 2.1 1.7 1.6
Leisure & Hospitality 94.6 94.8 95.7 97.9 97.7 98.3 98.9 99.3 99.8 100.2 100.8 101.1Pct Chg Year Ago 4.6 3.9 3.4 4.7 3.3 3.7 3.4 1.5 2.1 1.9 1.9 1.8
Other Services 26.7 26.7 27.3 27.9 26.9 26.9 26.9 26.9 26.8 26.7 26.7 26.7Pct Chg Year Ago 2.5 1.0 2.8 4.6 0.8 0.9 -1.2 -3.6 -0.3 -0.7 -0.7 -0.6
Federal Government 9.9 9.9 9.9 9.9 9.9 9.9 9.9 9.8 9.8 9.7 9.7 9.6Pct Chg Year Ago 0.0 0.6 0.1 -0.3 -0.1 -0.3 -0.4 -0.7 -1.1 -1.5 -1.7 -1.9
State & Local Government 82.6 82.1 84.6 82.3 82.5 82.7 82.9 83.0 83.2 83.3 83.6 83.9Pct Chg Year Ago -1.4 -1.4 1.2 -1.4 0.0 0.7 -2.1 0.8 0.8 0.8 0.9 1.1
Other Economic Indicators Population (Ths.) 1971.2 1976.8 1982.5 1988.3 1994.0 1999.9 2006.0 2011.6 2017.3 2023.1 2028.9 2034.8
Pct Chg Year Ago 1.2 1.2 1.2 1.2 1.2 1.2 1.2 1.2 1.2 1.2 1.1 1.2Labor Force (Ths.) 1044.7 1060.1 1066.1 1068.9 1059.3 1064.6 1069.0 1072.8 1075.5 1078.0 1080.2 1082.2
Pct Chg Year Ago 3.0 4.0 3.7 3.1 1.4 0.4 0.3 0.4 1.5 1.3 1.0 0.9Unemployment Rate (%) 4.3 4.2 3.9 4.0 3.7 3.5 3.4 3.4 3.3 3.3 3.3 3.3Total Housing Starts (Annual Rate) 9629 4485 8337 5116 4465 5440 6343 6415 6315 6291 6234 6307
Single-Family 2426 2094 2021 2178 2199 2441 2563 2563 2595 2719 2785 2831Multifamily 7203 2391 6316 2938 2266 3000 3780 3852 3720 3573 3449 3476
* Real personal income and real per capita income are adjusted for inflation and regional purchasing power parities. This facilitates interregional comparisons of income that control for the cost of living.
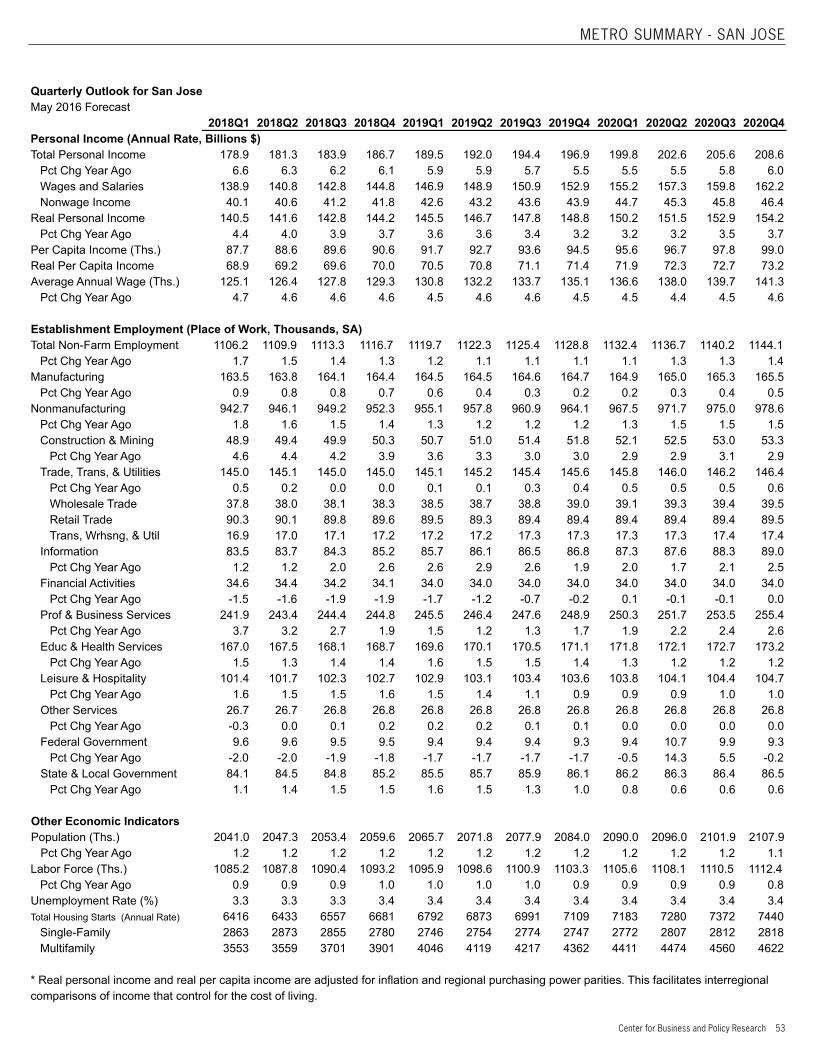
Center for Business and Policy Research 53
METRO SUMMARY - SAN JOSE
Quarterly Outlook for San JoseMay 2016 Forecast 2018Q1 2018Q2 2018Q3 2018Q4 2019Q1 2019Q2 2019Q3 2019Q4 2020Q1 2020Q2 2020Q3 2020Q4Personal Income (Annual Rate, Billions $) Total Personal Income 178.9 181.3 183.9 186.7 189.5 192.0 194.4 196.9 199.8 202.6 205.6 208.6
Pct Chg Year Ago 6.6 6.3 6.2 6.1 5.9 5.9 5.7 5.5 5.5 5.5 5.8 6.0Wages and Salaries 138.9 140.8 142.8 144.8 146.9 148.9 150.9 152.9 155.2 157.3 159.8 162.2Nonwage Income 40.1 40.6 41.2 41.8 42.6 43.2 43.6 43.9 44.7 45.3 45.8 46.4
Real Personal Income 140.5 141.6 142.8 144.2 145.5 146.7 147.8 148.8 150.2 151.5 152.9 154.2Pct Chg Year Ago 4.4 4.0 3.9 3.7 3.6 3.6 3.4 3.2 3.2 3.2 3.5 3.7
Per Capita Income (Ths.) 87.7 88.6 89.6 90.6 91.7 92.7 93.6 94.5 95.6 96.7 97.8 99.0Real Per Capita Income 68.9 69.2 69.6 70.0 70.5 70.8 71.1 71.4 71.9 72.3 72.7 73.2Average Annual Wage (Ths.) 125.1 126.4 127.8 129.3 130.8 132.2 133.7 135.1 136.6 138.0 139.7 141.3
Pct Chg Year Ago 4.7 4.6 4.6 4.6 4.5 4.6 4.6 4.5 4.5 4.4 4.5 4.6 Establishment Employment (Place of Work, Thousands, SA)Total Non-Farm Employment 1106.2 1109.9 1113.3 1116.7 1119.7 1122.3 1125.4 1128.8 1132.4 1136.7 1140.2 1144.1
Pct Chg Year Ago 1.7 1.5 1.4 1.3 1.2 1.1 1.1 1.1 1.1 1.3 1.3 1.4Manufacturing 163.5 163.8 164.1 164.4 164.5 164.5 164.6 164.7 164.9 165.0 165.3 165.5
Pct Chg Year Ago 0.9 0.8 0.8 0.7 0.6 0.4 0.3 0.2 0.2 0.3 0.4 0.5Nonmanufacturing 942.7 946.1 949.2 952.3 955.1 957.8 960.9 964.1 967.5 971.7 975.0 978.6
Pct Chg Year Ago 1.8 1.6 1.5 1.4 1.3 1.2 1.2 1.2 1.3 1.5 1.5 1.5Construction & Mining 48.9 49.4 49.9 50.3 50.7 51.0 51.4 51.8 52.1 52.5 53.0 53.3
Pct Chg Year Ago 4.6 4.4 4.2 3.9 3.6 3.3 3.0 3.0 2.9 2.9 3.1 2.9Trade, Trans, & Utilities 145.0 145.1 145.0 145.0 145.1 145.2 145.4 145.6 145.8 146.0 146.2 146.4
Pct Chg Year Ago 0.5 0.2 0.0 0.0 0.1 0.1 0.3 0.4 0.5 0.5 0.5 0.6Wholesale Trade 37.8 38.0 38.1 38.3 38.5 38.7 38.8 39.0 39.1 39.3 39.4 39.5Retail Trade 90.3 90.1 89.8 89.6 89.5 89.3 89.4 89.4 89.4 89.4 89.4 89.5Trans, Wrhsng, & Util 16.9 17.0 17.1 17.2 17.2 17.2 17.3 17.3 17.3 17.3 17.4 17.4
Information 83.5 83.7 84.3 85.2 85.7 86.1 86.5 86.8 87.3 87.6 88.3 89.0Pct Chg Year Ago 1.2 1.2 2.0 2.6 2.6 2.9 2.6 1.9 2.0 1.7 2.1 2.5
Financial Activities 34.6 34.4 34.2 34.1 34.0 34.0 34.0 34.0 34.0 34.0 34.0 34.0Pct Chg Year Ago -1.5 -1.6 -1.9 -1.9 -1.7 -1.2 -0.7 -0.2 0.1 -0.1 -0.1 0.0
Prof & Business Services 241.9 243.4 244.4 244.8 245.5 246.4 247.6 248.9 250.3 251.7 253.5 255.4Pct Chg Year Ago 3.7 3.2 2.7 1.9 1.5 1.2 1.3 1.7 1.9 2.2 2.4 2.6
Educ & Health Services 167.0 167.5 168.1 168.7 169.6 170.1 170.5 171.1 171.8 172.1 172.7 173.2Pct Chg Year Ago 1.5 1.3 1.4 1.4 1.6 1.5 1.5 1.4 1.3 1.2 1.2 1.2
Leisure & Hospitality 101.4 101.7 102.3 102.7 102.9 103.1 103.4 103.6 103.8 104.1 104.4 104.7Pct Chg Year Ago 1.6 1.5 1.5 1.6 1.5 1.4 1.1 0.9 0.9 0.9 1.0 1.0
Other Services 26.7 26.7 26.8 26.8 26.8 26.8 26.8 26.8 26.8 26.8 26.8 26.8Pct Chg Year Ago -0.3 0.0 0.1 0.2 0.2 0.2 0.1 0.1 0.0 0.0 0.0 0.0
Federal Government 9.6 9.6 9.5 9.5 9.4 9.4 9.4 9.3 9.4 10.7 9.9 9.3Pct Chg Year Ago -2.0 -2.0 -1.9 -1.8 -1.7 -1.7 -1.7 -1.7 -0.5 14.3 5.5 -0.2
State & Local Government 84.1 84.5 84.8 85.2 85.5 85.7 85.9 86.1 86.2 86.3 86.4 86.5Pct Chg Year Ago 1.1 1.4 1.5 1.5 1.6 1.5 1.3 1.0 0.8 0.6 0.6 0.6
Other Economic Indicators Population (Ths.) 2041.0 2047.3 2053.4 2059.6 2065.7 2071.8 2077.9 2084.0 2090.0 2096.0 2101.9 2107.9
Pct Chg Year Ago 1.2 1.2 1.2 1.2 1.2 1.2 1.2 1.2 1.2 1.2 1.2 1.1Labor Force (Ths.) 1085.2 1087.8 1090.4 1093.2 1095.9 1098.6 1100.9 1103.3 1105.6 1108.1 1110.5 1112.4
Pct Chg Year Ago 0.9 0.9 0.9 1.0 1.0 1.0 1.0 0.9 0.9 0.9 0.9 0.8Unemployment Rate (%) 3.3 3.3 3.3 3.4 3.4 3.4 3.4 3.4 3.4 3.4 3.4 3.4Total Housing Starts (Annual Rate) 6416 6433 6557 6681 6792 6873 6991 7109 7183 7280 7372 7440
Single-Family 2863 2873 2855 2780 2746 2754 2774 2747 2772 2807 2812 2818Multifamily 3553 3559 3701 3901 4046 4119 4217 4362 4411 4474 4560 4622
* Real personal income and real per capita income are adjusted for inflation and regional purchasing power parities. This facilitates interregional comparisons of income that control for the cost of living.
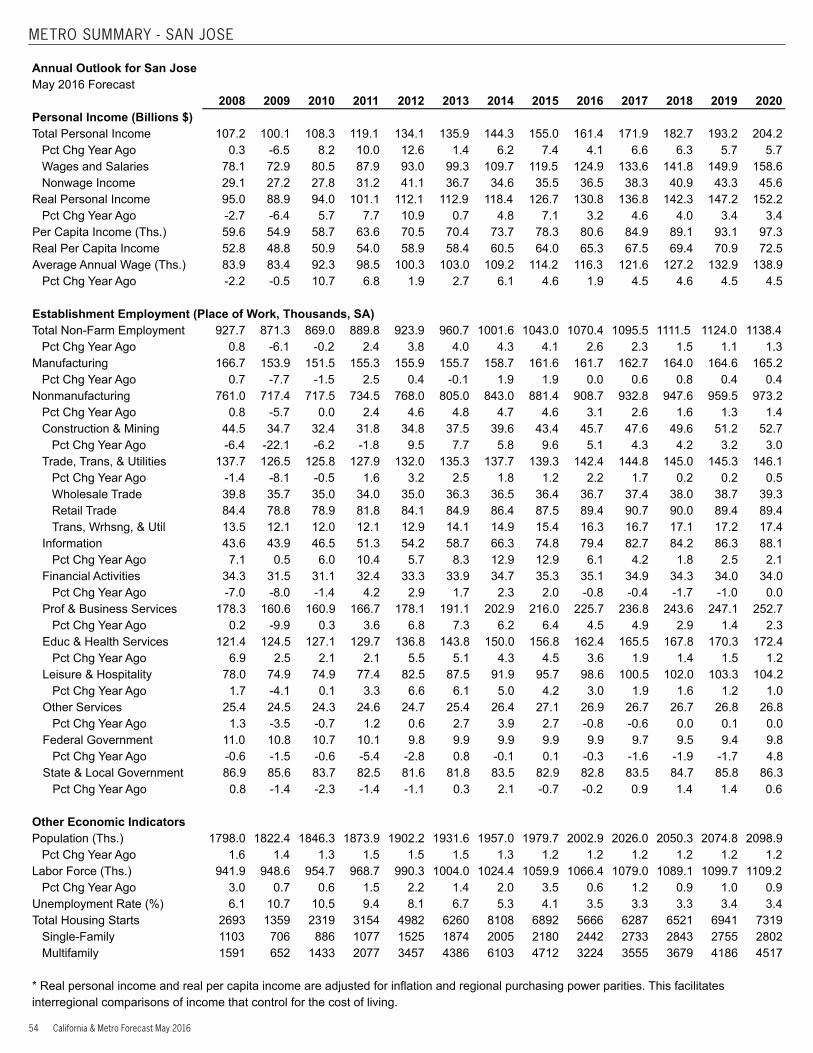
54 California & Metro Forecast May 2016
METRO SUMMARY - SAN JOSE
Annual Outlook for San JoseMay 2016 Forecast 2008 2009 2010 2011 2012 2013 2014 2015 2016 2017 2018 2019 2020Personal Income (Billions $) Total Personal Income 107.2 100.1 108.3 119.1 134.1 135.9 144.3 155.0 161.4 171.9 182.7 193.2 204.2
Pct Chg Year Ago 0.3 -6.5 8.2 10.0 12.6 1.4 6.2 7.4 4.1 6.6 6.3 5.7 5.7Wages and Salaries 78.1 72.9 80.5 87.9 93.0 99.3 109.7 119.5 124.9 133.6 141.8 149.9 158.6Nonwage Income 29.1 27.2 27.8 31.2 41.1 36.7 34.6 35.5 36.5 38.3 40.9 43.3 45.6
Real Personal Income 95.0 88.9 94.0 101.1 112.1 112.9 118.4 126.7 130.8 136.8 142.3 147.2 152.2Pct Chg Year Ago -2.7 -6.4 5.7 7.7 10.9 0.7 4.8 7.1 3.2 4.6 4.0 3.4 3.4
Per Capita Income (Ths.) 59.6 54.9 58.7 63.6 70.5 70.4 73.7 78.3 80.6 84.9 89.1 93.1 97.3Real Per Capita Income 52.8 48.8 50.9 54.0 58.9 58.4 60.5 64.0 65.3 67.5 69.4 70.9 72.5Average Annual Wage (Ths.) 83.9 83.4 92.3 98.5 100.3 103.0 109.2 114.2 116.3 121.6 127.2 132.9 138.9
Pct Chg Year Ago -2.2 -0.5 10.7 6.8 1.9 2.7 6.1 4.6 1.9 4.5 4.6 4.5 4.5 Establishment Employment (Place of Work, Thousands, SA)Total Non-Farm Employment 927.7 871.3 869.0 889.8 923.9 960.7 1001.6 1043.0 1070.4 1095.5 1111.5 1124.0 1138.4
Pct Chg Year Ago 0.8 -6.1 -0.2 2.4 3.8 4.0 4.3 4.1 2.6 2.3 1.5 1.1 1.3Manufacturing 166.7 153.9 151.5 155.3 155.9 155.7 158.7 161.6 161.7 162.7 164.0 164.6 165.2
Pct Chg Year Ago 0.7 -7.7 -1.5 2.5 0.4 -0.1 1.9 1.9 0.0 0.6 0.8 0.4 0.4Nonmanufacturing 761.0 717.4 717.5 734.5 768.0 805.0 843.0 881.4 908.7 932.8 947.6 959.5 973.2
Pct Chg Year Ago 0.8 -5.7 0.0 2.4 4.6 4.8 4.7 4.6 3.1 2.6 1.6 1.3 1.4Construction & Mining 44.5 34.7 32.4 31.8 34.8 37.5 39.6 43.4 45.7 47.6 49.6 51.2 52.7
Pct Chg Year Ago -6.4 -22.1 -6.2 -1.8 9.5 7.7 5.8 9.6 5.1 4.3 4.2 3.2 3.0Trade, Trans, & Utilities 137.7 126.5 125.8 127.9 132.0 135.3 137.7 139.3 142.4 144.8 145.0 145.3 146.1
Pct Chg Year Ago -1.4 -8.1 -0.5 1.6 3.2 2.5 1.8 1.2 2.2 1.7 0.2 0.2 0.5Wholesale Trade 39.8 35.7 35.0 34.0 35.0 36.3 36.5 36.4 36.7 37.4 38.0 38.7 39.3Retail Trade 84.4 78.8 78.9 81.8 84.1 84.9 86.4 87.5 89.4 90.7 90.0 89.4 89.4Trans, Wrhsng, & Util 13.5 12.1 12.0 12.1 12.9 14.1 14.9 15.4 16.3 16.7 17.1 17.2 17.4
Information 43.6 43.9 46.5 51.3 54.2 58.7 66.3 74.8 79.4 82.7 84.2 86.3 88.1Pct Chg Year Ago 7.1 0.5 6.0 10.4 5.7 8.3 12.9 12.9 6.1 4.2 1.8 2.5 2.1
Financial Activities 34.3 31.5 31.1 32.4 33.3 33.9 34.7 35.3 35.1 34.9 34.3 34.0 34.0Pct Chg Year Ago -7.0 -8.0 -1.4 4.2 2.9 1.7 2.3 2.0 -0.8 -0.4 -1.7 -1.0 0.0
Prof & Business Services 178.3 160.6 160.9 166.7 178.1 191.1 202.9 216.0 225.7 236.8 243.6 247.1 252.7Pct Chg Year Ago 0.2 -9.9 0.3 3.6 6.8 7.3 6.2 6.4 4.5 4.9 2.9 1.4 2.3
Educ & Health Services 121.4 124.5 127.1 129.7 136.8 143.8 150.0 156.8 162.4 165.5 167.8 170.3 172.4Pct Chg Year Ago 6.9 2.5 2.1 2.1 5.5 5.1 4.3 4.5 3.6 1.9 1.4 1.5 1.2
Leisure & Hospitality 78.0 74.9 74.9 77.4 82.5 87.5 91.9 95.7 98.6 100.5 102.0 103.3 104.2Pct Chg Year Ago 1.7 -4.1 0.1 3.3 6.6 6.1 5.0 4.2 3.0 1.9 1.6 1.2 1.0
Other Services 25.4 24.5 24.3 24.6 24.7 25.4 26.4 27.1 26.9 26.7 26.7 26.8 26.8Pct Chg Year Ago 1.3 -3.5 -0.7 1.2 0.6 2.7 3.9 2.7 -0.8 -0.6 0.0 0.1 0.0
Federal Government 11.0 10.8 10.7 10.1 9.8 9.9 9.9 9.9 9.9 9.7 9.5 9.4 9.8Pct Chg Year Ago -0.6 -1.5 -0.6 -5.4 -2.8 0.8 -0.1 0.1 -0.3 -1.6 -1.9 -1.7 4.8
State & Local Government 86.9 85.6 83.7 82.5 81.6 81.8 83.5 82.9 82.8 83.5 84.7 85.8 86.3Pct Chg Year Ago 0.8 -1.4 -2.3 -1.4 -1.1 0.3 2.1 -0.7 -0.2 0.9 1.4 1.4 0.6
Other Economic Indicators Population (Ths.) 1798.0 1822.4 1846.3 1873.9 1902.2 1931.6 1957.0 1979.7 2002.9 2026.0 2050.3 2074.8 2098.9
Pct Chg Year Ago 1.6 1.4 1.3 1.5 1.5 1.5 1.3 1.2 1.2 1.2 1.2 1.2 1.2Labor Force (Ths.) 941.9 948.6 954.7 968.7 990.3 1004.0 1024.4 1059.9 1066.4 1079.0 1089.1 1099.7 1109.2
Pct Chg Year Ago 3.0 0.7 0.6 1.5 2.2 1.4 2.0 3.5 0.6 1.2 0.9 1.0 0.9Unemployment Rate (%) 6.1 10.7 10.5 9.4 8.1 6.7 5.3 4.1 3.5 3.3 3.3 3.4 3.4Total Housing Starts 2693 1359 2319 3154 4982 6260 8108 6892 5666 6287 6521 6941 7319
Single-Family 1103 706 886 1077 1525 1874 2005 2180 2442 2733 2843 2755 2802Multifamily 1591 652 1433 2077 3457 4386 6103 4712 3224 3555 3679 4186 4517
* Real personal income and real per capita income are adjusted for inflation and regional purchasing power parities. This facilitates interregional comparisons of income that control for the cost of living.
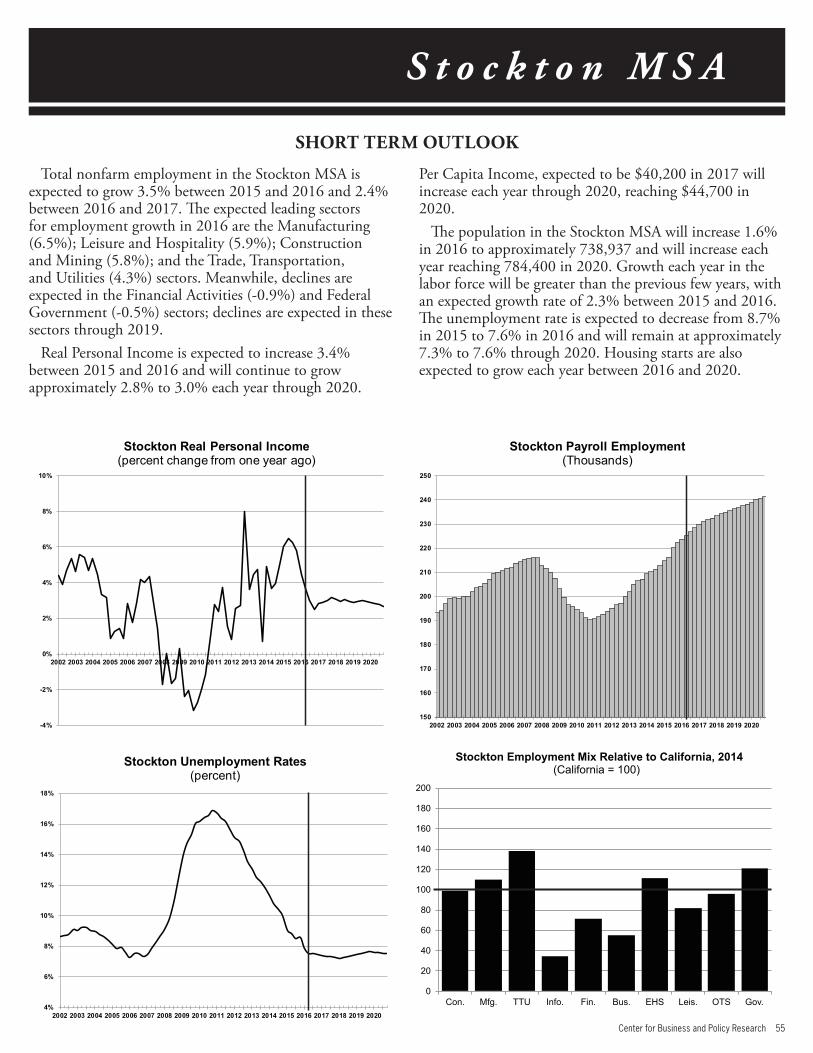
Center for Business and Policy Research 55
S t o c k t o n M S A
Total nonfarm employment in the Stockton MSA is expected to grow 3.5% between 2015 and 2016 and 2.4% between 2016 and 2017. The expected leading sectors for employment growth in 2016 are the Manufacturing (6.5%); Leisure and Hospitality (5.9%); Construction and Mining (5.8%); and the Trade, Transportation, and Utilities (4.3%) sectors. Meanwhile, declines are expected in the Financial Activities (-0.9%) and Federal Government (-0.5%) sectors; declines are expected in these sectors through 2019.
Real Personal Income is expected to increase 3.4% between 2015 and 2016 and will continue to grow approximately 2.8% to 3.0% each year through 2020.
Per Capita Income, expected to be $40,200 in 2017 will increase each year through 2020, reaching $44,700 in 2020.
The population in the Stockton MSA will increase 1.6% in 2016 to approximately 738,937 and will increase each year reaching 784,400 in 2020. Growth each year in the labor force will be greater than the previous few years, with an expected growth rate of 2.3% between 2015 and 2016. The unemployment rate is expected to decrease from 8.7% in 2015 to 7.6% in 2016 and will remain at approximately 7.3% to 7.6% through 2020. Housing starts are also expected to grow each year between 2016 and 2020.
SHORT TERM OUTLOOK
0
20
40
60
80
100
120
140
160
180
200
Con. Mfg. TTU Info. Fin. Bus. EHS Leis. OTS Gov.
Stockton Employment Mix Relative to California, 2014(California = 100)
-4%
-2%
0%
2%
4%
6%
8%
10%
2002 2003 2004 2005 2006 2007 2008 2009 2010 2011 2012 2013 2014 2015 2016 2017 2018 2019 2020
Stockton Real Personal Income (percent change from one year ago)
4%
6%
8%
10%
12%
14%
16%
18%
2002 2003 2004 2005 2006 2007 2008 2009 2010 2011 2012 2013 2014 2015 2016 2017 2018 2019 2020
Stockton Unemployment Rates(percent)
150
160
170
180
190
200
210
220
230
240
250
2002 2003 2004 2005 2006 2007 2008 2009 2010 2011 2012 2013 2014 2015 2016 2017 2018 2019 2020
Stockton Payroll Employment (Thousands)
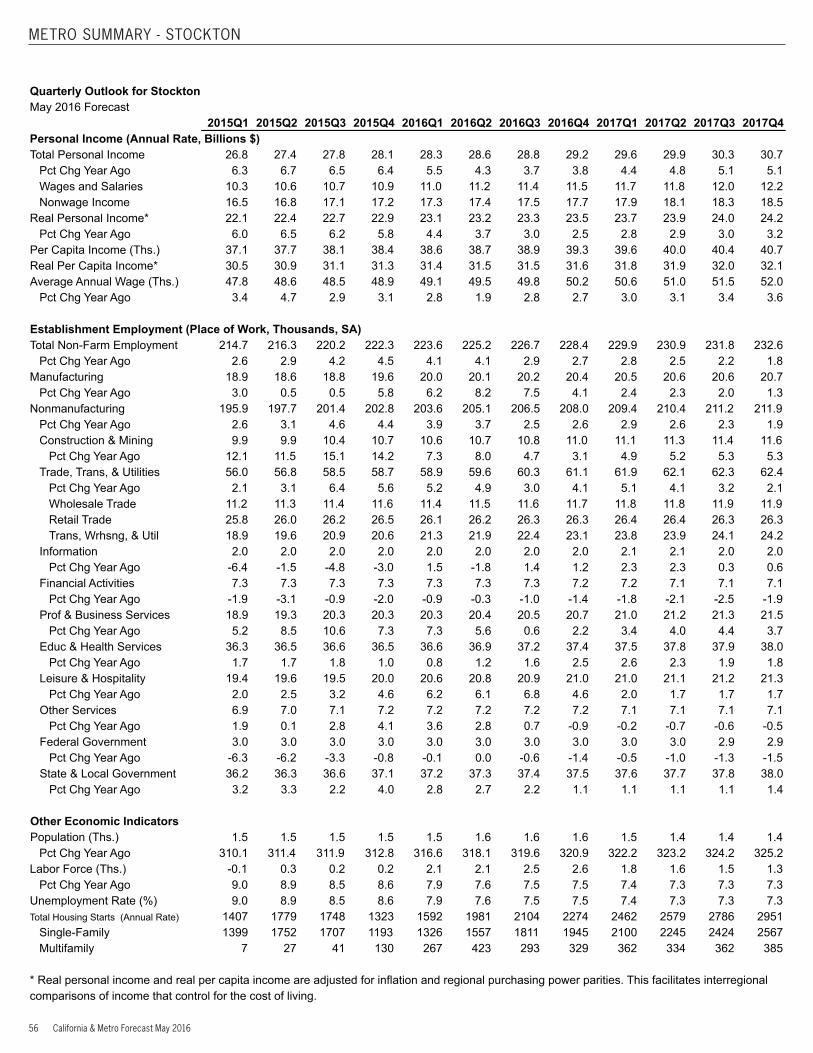
56 California & Metro Forecast May 2016
METRO SUMMARY - STOCKTON
Quarterly Outlook for StocktonMay 2016 Forecast 2015Q1 2015Q2 2015Q3 2015Q4 2016Q1 2016Q2 2016Q3 2016Q4 2017Q1 2017Q2 2017Q3 2017Q4Personal Income (Annual Rate, Billions $) Total Personal Income 26.8 27.4 27.8 28.1 28.3 28.6 28.8 29.2 29.6 29.9 30.3 30.7
Pct Chg Year Ago 6.3 6.7 6.5 6.4 5.5 4.3 3.7 3.8 4.4 4.8 5.1 5.1Wages and Salaries 10.3 10.6 10.7 10.9 11.0 11.2 11.4 11.5 11.7 11.8 12.0 12.2Nonwage Income 16.5 16.8 17.1 17.2 17.3 17.4 17.5 17.7 17.9 18.1 18.3 18.5
Real Personal Income* 22.1 22.4 22.7 22.9 23.1 23.2 23.3 23.5 23.7 23.9 24.0 24.2Pct Chg Year Ago 6.0 6.5 6.2 5.8 4.4 3.7 3.0 2.5 2.8 2.9 3.0 3.2
Per Capita Income (Ths.) 37.1 37.7 38.1 38.4 38.6 38.7 38.9 39.3 39.6 40.0 40.4 40.7Real Per Capita Income* 30.5 30.9 31.1 31.3 31.4 31.5 31.5 31.6 31.8 31.9 32.0 32.1Average Annual Wage (Ths.) 47.8 48.6 48.5 48.9 49.1 49.5 49.8 50.2 50.6 51.0 51.5 52.0
Pct Chg Year Ago 3.4 4.7 2.9 3.1 2.8 1.9 2.8 2.7 3.0 3.1 3.4 3.6 Establishment Employment (Place of Work, Thousands, SA)Total Non-Farm Employment 214.7 216.3 220.2 222.3 223.6 225.2 226.7 228.4 229.9 230.9 231.8 232.6
Pct Chg Year Ago 2.6 2.9 4.2 4.5 4.1 4.1 2.9 2.7 2.8 2.5 2.2 1.8Manufacturing 18.9 18.6 18.8 19.6 20.0 20.1 20.2 20.4 20.5 20.6 20.6 20.7
Pct Chg Year Ago 3.0 0.5 0.5 5.8 6.2 8.2 7.5 4.1 2.4 2.3 2.0 1.3Nonmanufacturing 195.9 197.7 201.4 202.8 203.6 205.1 206.5 208.0 209.4 210.4 211.2 211.9
Pct Chg Year Ago 2.6 3.1 4.6 4.4 3.9 3.7 2.5 2.6 2.9 2.6 2.3 1.9Construction & Mining 9.9 9.9 10.4 10.7 10.6 10.7 10.8 11.0 11.1 11.3 11.4 11.6
Pct Chg Year Ago 12.1 11.5 15.1 14.2 7.3 8.0 4.7 3.1 4.9 5.2 5.3 5.3Trade, Trans, & Utilities 56.0 56.8 58.5 58.7 58.9 59.6 60.3 61.1 61.9 62.1 62.3 62.4
Pct Chg Year Ago 2.1 3.1 6.4 5.6 5.2 4.9 3.0 4.1 5.1 4.1 3.2 2.1Wholesale Trade 11.2 11.3 11.4 11.6 11.4 11.5 11.6 11.7 11.8 11.8 11.9 11.9Retail Trade 25.8 26.0 26.2 26.5 26.1 26.2 26.3 26.3 26.4 26.4 26.3 26.3Trans, Wrhsng, & Util 18.9 19.6 20.9 20.6 21.3 21.9 22.4 23.1 23.8 23.9 24.1 24.2
Information 2.0 2.0 2.0 2.0 2.0 2.0 2.0 2.0 2.1 2.1 2.0 2.0Pct Chg Year Ago -6.4 -1.5 -4.8 -3.0 1.5 -1.8 1.4 1.2 2.3 2.3 0.3 0.6
Financial Activities 7.3 7.3 7.3 7.3 7.3 7.3 7.3 7.2 7.2 7.1 7.1 7.1Pct Chg Year Ago -1.9 -3.1 -0.9 -2.0 -0.9 -0.3 -1.0 -1.4 -1.8 -2.1 -2.5 -1.9
Prof & Business Services 18.9 19.3 20.3 20.3 20.3 20.4 20.5 20.7 21.0 21.2 21.3 21.5Pct Chg Year Ago 5.2 8.5 10.6 7.3 7.3 5.6 0.6 2.2 3.4 4.0 4.4 3.7
Educ & Health Services 36.3 36.5 36.6 36.5 36.6 36.9 37.2 37.4 37.5 37.8 37.9 38.0Pct Chg Year Ago 1.7 1.7 1.8 1.0 0.8 1.2 1.6 2.5 2.6 2.3 1.9 1.8
Leisure & Hospitality 19.4 19.6 19.5 20.0 20.6 20.8 20.9 21.0 21.0 21.1 21.2 21.3Pct Chg Year Ago 2.0 2.5 3.2 4.6 6.2 6.1 6.8 4.6 2.0 1.7 1.7 1.7
Other Services 6.9 7.0 7.1 7.2 7.2 7.2 7.2 7.2 7.1 7.1 7.1 7.1Pct Chg Year Ago 1.9 0.1 2.8 4.1 3.6 2.8 0.7 -0.9 -0.2 -0.7 -0.6 -0.5
Federal Government 3.0 3.0 3.0 3.0 3.0 3.0 3.0 3.0 3.0 3.0 2.9 2.9Pct Chg Year Ago -6.3 -6.2 -3.3 -0.8 -0.1 0.0 -0.6 -1.4 -0.5 -1.0 -1.3 -1.5
State & Local Government 36.2 36.3 36.6 37.1 37.2 37.3 37.4 37.5 37.6 37.7 37.8 38.0Pct Chg Year Ago 3.2 3.3 2.2 4.0 2.8 2.7 2.2 1.1 1.1 1.1 1.1 1.4
Other Economic Indicators Population (Ths.) 1.5 1.5 1.5 1.5 1.5 1.6 1.6 1.6 1.5 1.4 1.4 1.4
Pct Chg Year Ago 310.1 311.4 311.9 312.8 316.6 318.1 319.6 320.9 322.2 323.2 324.2 325.2Labor Force (Ths.) -0.1 0.3 0.2 0.2 2.1 2.1 2.5 2.6 1.8 1.6 1.5 1.3
Pct Chg Year Ago 9.0 8.9 8.5 8.6 7.9 7.6 7.5 7.5 7.4 7.3 7.3 7.3Unemployment Rate (%) 9.0 8.9 8.5 8.6 7.9 7.6 7.5 7.5 7.4 7.3 7.3 7.3Total Housing Starts (Annual Rate) 1407 1779 1748 1323 1592 1981 2104 2274 2462 2579 2786 2951
Single-Family 1399 1752 1707 1193 1326 1557 1811 1945 2100 2245 2424 2567Multifamily 7 27 41 130 267 423 293 329 362 334 362 385
* Real personal income and real per capita income are adjusted for inflation and regional purchasing power parities. This facilitates interregional comparisons of income that control for the cost of living.
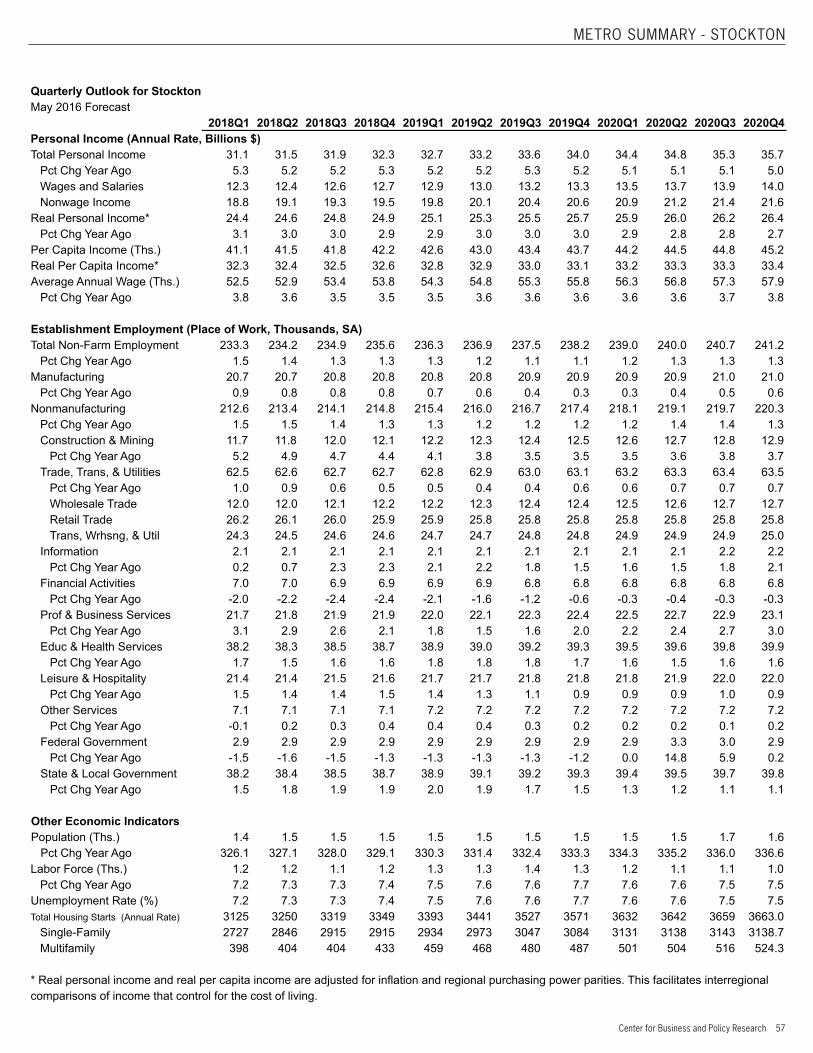
Center for Business and Policy Research 57
METRO SUMMARY - STOCKTON
Quarterly Outlook for StocktonMay 2016 Forecast 2018Q1 2018Q2 2018Q3 2018Q4 2019Q1 2019Q2 2019Q3 2019Q4 2020Q1 2020Q2 2020Q3 2020Q4Personal Income (Annual Rate, Billions $) Total Personal Income 31.1 31.5 31.9 32.3 32.7 33.2 33.6 34.0 34.4 34.8 35.3 35.7
Pct Chg Year Ago 5.3 5.2 5.2 5.3 5.2 5.2 5.3 5.2 5.1 5.1 5.1 5.0Wages and Salaries 12.3 12.4 12.6 12.7 12.9 13.0 13.2 13.3 13.5 13.7 13.9 14.0Nonwage Income 18.8 19.1 19.3 19.5 19.8 20.1 20.4 20.6 20.9 21.2 21.4 21.6
Real Personal Income* 24.4 24.6 24.8 24.9 25.1 25.3 25.5 25.7 25.9 26.0 26.2 26.4Pct Chg Year Ago 3.1 3.0 3.0 2.9 2.9 3.0 3.0 3.0 2.9 2.8 2.8 2.7
Per Capita Income (Ths.) 41.1 41.5 41.8 42.2 42.6 43.0 43.4 43.7 44.2 44.5 44.8 45.2Real Per Capita Income* 32.3 32.4 32.5 32.6 32.8 32.9 33.0 33.1 33.2 33.3 33.3 33.4Average Annual Wage (Ths.) 52.5 52.9 53.4 53.8 54.3 54.8 55.3 55.8 56.3 56.8 57.3 57.9
Pct Chg Year Ago 3.8 3.6 3.5 3.5 3.5 3.6 3.6 3.6 3.6 3.6 3.7 3.8 Establishment Employment (Place of Work, Thousands, SA)Total Non-Farm Employment 233.3 234.2 234.9 235.6 236.3 236.9 237.5 238.2 239.0 240.0 240.7 241.2
Pct Chg Year Ago 1.5 1.4 1.3 1.3 1.3 1.2 1.1 1.1 1.2 1.3 1.3 1.3Manufacturing 20.7 20.7 20.8 20.8 20.8 20.8 20.9 20.9 20.9 20.9 21.0 21.0
Pct Chg Year Ago 0.9 0.8 0.8 0.8 0.7 0.6 0.4 0.3 0.3 0.4 0.5 0.6Nonmanufacturing 212.6 213.4 214.1 214.8 215.4 216.0 216.7 217.4 218.1 219.1 219.7 220.3
Pct Chg Year Ago 1.5 1.5 1.4 1.3 1.3 1.2 1.2 1.2 1.2 1.4 1.4 1.3Construction & Mining 11.7 11.8 12.0 12.1 12.2 12.3 12.4 12.5 12.6 12.7 12.8 12.9
Pct Chg Year Ago 5.2 4.9 4.7 4.4 4.1 3.8 3.5 3.5 3.5 3.6 3.8 3.7Trade, Trans, & Utilities 62.5 62.6 62.7 62.7 62.8 62.9 63.0 63.1 63.2 63.3 63.4 63.5
Pct Chg Year Ago 1.0 0.9 0.6 0.5 0.5 0.4 0.4 0.6 0.6 0.7 0.7 0.7Wholesale Trade 12.0 12.0 12.1 12.2 12.2 12.3 12.4 12.4 12.5 12.6 12.7 12.7Retail Trade 26.2 26.1 26.0 25.9 25.9 25.8 25.8 25.8 25.8 25.8 25.8 25.8Trans, Wrhsng, & Util 24.3 24.5 24.6 24.6 24.7 24.7 24.8 24.8 24.9 24.9 24.9 25.0
Information 2.1 2.1 2.1 2.1 2.1 2.1 2.1 2.1 2.1 2.1 2.2 2.2Pct Chg Year Ago 0.2 0.7 2.3 2.3 2.1 2.2 1.8 1.5 1.6 1.5 1.8 2.1
Financial Activities 7.0 7.0 6.9 6.9 6.9 6.9 6.8 6.8 6.8 6.8 6.8 6.8Pct Chg Year Ago -2.0 -2.2 -2.4 -2.4 -2.1 -1.6 -1.2 -0.6 -0.3 -0.4 -0.3 -0.3
Prof & Business Services 21.7 21.8 21.9 21.9 22.0 22.1 22.3 22.4 22.5 22.7 22.9 23.1Pct Chg Year Ago 3.1 2.9 2.6 2.1 1.8 1.5 1.6 2.0 2.2 2.4 2.7 3.0
Educ & Health Services 38.2 38.3 38.5 38.7 38.9 39.0 39.2 39.3 39.5 39.6 39.8 39.9Pct Chg Year Ago 1.7 1.5 1.6 1.6 1.8 1.8 1.8 1.7 1.6 1.5 1.6 1.6
Leisure & Hospitality 21.4 21.4 21.5 21.6 21.7 21.7 21.8 21.8 21.8 21.9 22.0 22.0Pct Chg Year Ago 1.5 1.4 1.4 1.5 1.4 1.3 1.1 0.9 0.9 0.9 1.0 0.9
Other Services 7.1 7.1 7.1 7.1 7.2 7.2 7.2 7.2 7.2 7.2 7.2 7.2Pct Chg Year Ago -0.1 0.2 0.3 0.4 0.4 0.4 0.3 0.2 0.2 0.2 0.1 0.2
Federal Government 2.9 2.9 2.9 2.9 2.9 2.9 2.9 2.9 2.9 3.3 3.0 2.9Pct Chg Year Ago -1.5 -1.6 -1.5 -1.3 -1.3 -1.3 -1.3 -1.2 0.0 14.8 5.9 0.2
State & Local Government 38.2 38.4 38.5 38.7 38.9 39.1 39.2 39.3 39.4 39.5 39.7 39.8Pct Chg Year Ago 1.5 1.8 1.9 1.9 2.0 1.9 1.7 1.5 1.3 1.2 1.1 1.1
Other Economic Indicators Population (Ths.) 1.4 1.5 1.5 1.5 1.5 1.5 1.5 1.5 1.5 1.5 1.7 1.6
Pct Chg Year Ago 326.1 327.1 328.0 329.1 330.3 331.4 332.4 333.3 334.3 335.2 336.0 336.6Labor Force (Ths.) 1.2 1.2 1.1 1.2 1.3 1.3 1.4 1.3 1.2 1.1 1.1 1.0
Pct Chg Year Ago 7.2 7.3 7.3 7.4 7.5 7.6 7.6 7.7 7.6 7.6 7.5 7.5Unemployment Rate (%) 7.2 7.3 7.3 7.4 7.5 7.6 7.6 7.7 7.6 7.6 7.5 7.5Total Housing Starts (Annual Rate) 3125 3250 3319 3349 3393 3441 3527 3571 3632 3642 3659 3663.0
Single-Family 2727 2846 2915 2915 2934 2973 3047 3084 3131 3138 3143 3138.7Multifamily 398 404 404 433 459 468 480 487 501 504 516 524.3
* Real personal income and real per capita income are adjusted for inflation and regional purchasing power parities. This facilitates interregional comparisons of income that control for the cost of living.
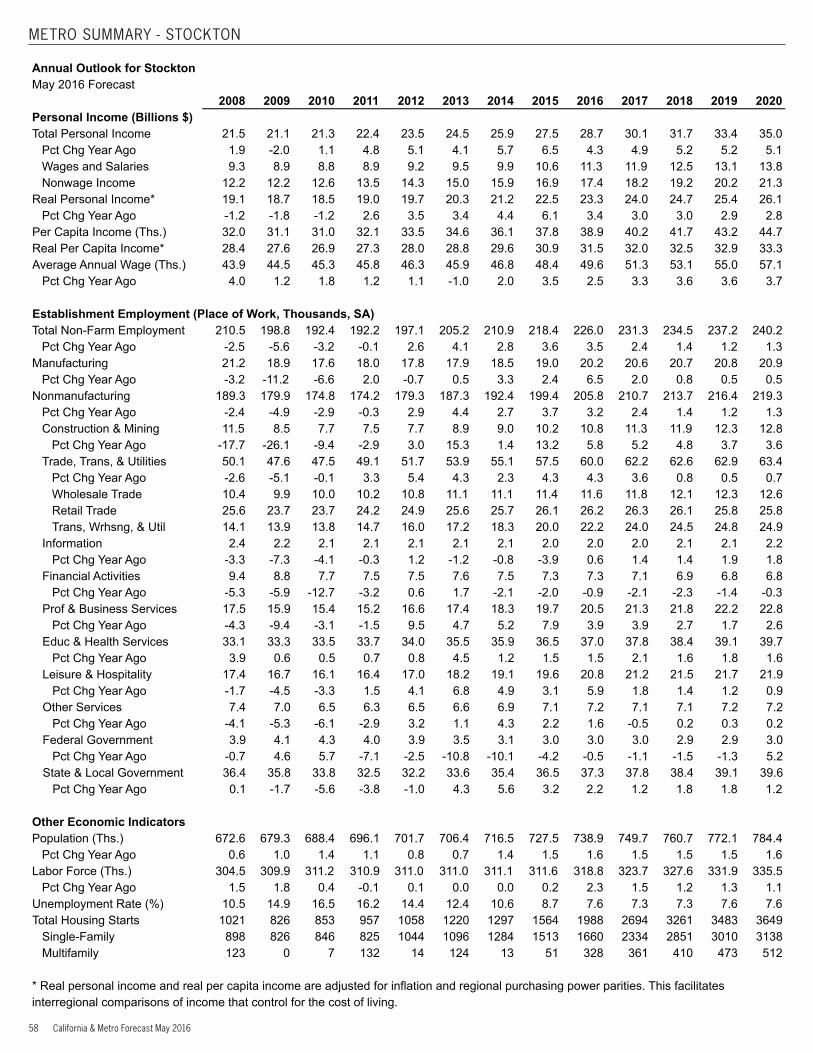
58 California & Metro Forecast May 2016
METRO SUMMARY - STOCKTON
Annual Outlook for StocktonMay 2016 Forecast 2008 2009 2010 2011 2012 2013 2014 2015 2016 2017 2018 2019 2020Personal Income (Billions $) Total Personal Income 21.5 21.1 21.3 22.4 23.5 24.5 25.9 27.5 28.7 30.1 31.7 33.4 35.0
Pct Chg Year Ago 1.9 -2.0 1.1 4.8 5.1 4.1 5.7 6.5 4.3 4.9 5.2 5.2 5.1Wages and Salaries 9.3 8.9 8.8 8.9 9.2 9.5 9.9 10.6 11.3 11.9 12.5 13.1 13.8Nonwage Income 12.2 12.2 12.6 13.5 14.3 15.0 15.9 16.9 17.4 18.2 19.2 20.2 21.3
Real Personal Income* 19.1 18.7 18.5 19.0 19.7 20.3 21.2 22.5 23.3 24.0 24.7 25.4 26.1Pct Chg Year Ago -1.2 -1.8 -1.2 2.6 3.5 3.4 4.4 6.1 3.4 3.0 3.0 2.9 2.8
Per Capita Income (Ths.) 32.0 31.1 31.0 32.1 33.5 34.6 36.1 37.8 38.9 40.2 41.7 43.2 44.7Real Per Capita Income* 28.4 27.6 26.9 27.3 28.0 28.8 29.6 30.9 31.5 32.0 32.5 32.9 33.3Average Annual Wage (Ths.) 43.9 44.5 45.3 45.8 46.3 45.9 46.8 48.4 49.6 51.3 53.1 55.0 57.1
Pct Chg Year Ago 4.0 1.2 1.8 1.2 1.1 -1.0 2.0 3.5 2.5 3.3 3.6 3.6 3.7 Establishment Employment (Place of Work, Thousands, SA)Total Non-Farm Employment 210.5 198.8 192.4 192.2 197.1 205.2 210.9 218.4 226.0 231.3 234.5 237.2 240.2
Pct Chg Year Ago -2.5 -5.6 -3.2 -0.1 2.6 4.1 2.8 3.6 3.5 2.4 1.4 1.2 1.3Manufacturing 21.2 18.9 17.6 18.0 17.8 17.9 18.5 19.0 20.2 20.6 20.7 20.8 20.9
Pct Chg Year Ago -3.2 -11.2 -6.6 2.0 -0.7 0.5 3.3 2.4 6.5 2.0 0.8 0.5 0.5Nonmanufacturing 189.3 179.9 174.8 174.2 179.3 187.3 192.4 199.4 205.8 210.7 213.7 216.4 219.3
Pct Chg Year Ago -2.4 -4.9 -2.9 -0.3 2.9 4.4 2.7 3.7 3.2 2.4 1.4 1.2 1.3Construction & Mining 11.5 8.5 7.7 7.5 7.7 8.9 9.0 10.2 10.8 11.3 11.9 12.3 12.8
Pct Chg Year Ago -17.7 -26.1 -9.4 -2.9 3.0 15.3 1.4 13.2 5.8 5.2 4.8 3.7 3.6Trade, Trans, & Utilities 50.1 47.6 47.5 49.1 51.7 53.9 55.1 57.5 60.0 62.2 62.6 62.9 63.4
Pct Chg Year Ago -2.6 -5.1 -0.1 3.3 5.4 4.3 2.3 4.3 4.3 3.6 0.8 0.5 0.7Wholesale Trade 10.4 9.9 10.0 10.2 10.8 11.1 11.1 11.4 11.6 11.8 12.1 12.3 12.6Retail Trade 25.6 23.7 23.7 24.2 24.9 25.6 25.7 26.1 26.2 26.3 26.1 25.8 25.8Trans, Wrhsng, & Util 14.1 13.9 13.8 14.7 16.0 17.2 18.3 20.0 22.2 24.0 24.5 24.8 24.9
Information 2.4 2.2 2.1 2.1 2.1 2.1 2.1 2.0 2.0 2.0 2.1 2.1 2.2Pct Chg Year Ago -3.3 -7.3 -4.1 -0.3 1.2 -1.2 -0.8 -3.9 0.6 1.4 1.4 1.9 1.8
Financial Activities 9.4 8.8 7.7 7.5 7.5 7.6 7.5 7.3 7.3 7.1 6.9 6.8 6.8Pct Chg Year Ago -5.3 -5.9 -12.7 -3.2 0.6 1.7 -2.1 -2.0 -0.9 -2.1 -2.3 -1.4 -0.3
Prof & Business Services 17.5 15.9 15.4 15.2 16.6 17.4 18.3 19.7 20.5 21.3 21.8 22.2 22.8Pct Chg Year Ago -4.3 -9.4 -3.1 -1.5 9.5 4.7 5.2 7.9 3.9 3.9 2.7 1.7 2.6
Educ & Health Services 33.1 33.3 33.5 33.7 34.0 35.5 35.9 36.5 37.0 37.8 38.4 39.1 39.7Pct Chg Year Ago 3.9 0.6 0.5 0.7 0.8 4.5 1.2 1.5 1.5 2.1 1.6 1.8 1.6
Leisure & Hospitality 17.4 16.7 16.1 16.4 17.0 18.2 19.1 19.6 20.8 21.2 21.5 21.7 21.9Pct Chg Year Ago -1.7 -4.5 -3.3 1.5 4.1 6.8 4.9 3.1 5.9 1.8 1.4 1.2 0.9
Other Services 7.4 7.0 6.5 6.3 6.5 6.6 6.9 7.1 7.2 7.1 7.1 7.2 7.2Pct Chg Year Ago -4.1 -5.3 -6.1 -2.9 3.2 1.1 4.3 2.2 1.6 -0.5 0.2 0.3 0.2
Federal Government 3.9 4.1 4.3 4.0 3.9 3.5 3.1 3.0 3.0 3.0 2.9 2.9 3.0Pct Chg Year Ago -0.7 4.6 5.7 -7.1 -2.5 -10.8 -10.1 -4.2 -0.5 -1.1 -1.5 -1.3 5.2
State & Local Government 36.4 35.8 33.8 32.5 32.2 33.6 35.4 36.5 37.3 37.8 38.4 39.1 39.6Pct Chg Year Ago 0.1 -1.7 -5.6 -3.8 -1.0 4.3 5.6 3.2 2.2 1.2 1.8 1.8 1.2
Other Economic Indicators Population (Ths.) 672.6 679.3 688.4 696.1 701.7 706.4 716.5 727.5 738.9 749.7 760.7 772.1 784.4
Pct Chg Year Ago 0.6 1.0 1.4 1.1 0.8 0.7 1.4 1.5 1.6 1.5 1.5 1.5 1.6Labor Force (Ths.) 304.5 309.9 311.2 310.9 311.0 311.0 311.1 311.6 318.8 323.7 327.6 331.9 335.5
Pct Chg Year Ago 1.5 1.8 0.4 -0.1 0.1 0.0 0.0 0.2 2.3 1.5 1.2 1.3 1.1Unemployment Rate (%) 10.5 14.9 16.5 16.2 14.4 12.4 10.6 8.7 7.6 7.3 7.3 7.6 7.6Total Housing Starts 1021 826 853 957 1058 1220 1297 1564 1988 2694 3261 3483 3649
Single-Family 898 826 846 825 1044 1096 1284 1513 1660 2334 2851 3010 3138Multifamily 123 0 7 132 14 124 13 51 328 361 410 473 512
* Real personal income and real per capita income are adjusted for inflation and regional purchasing power parities. This facilitates interregional comparisons of income that control for the cost of living.
University of the Pacific
A national doctoral university, University of the Pacific is recognized for an education combining exceptional professional preparation in a student-centered tradition of close interactions between students and professors. With a core liberal arts college and eight professional schools, more than any university enrolling fewer than 10,000 students, Pacific offers professional opportunities associated with far larger institutions in the environment of a small learning community. Pacific is California’s first chartered institution of higher learning, having received its articles of incorporation from the California Supreme Court on July 10, 1851. The University enrolls more than 5,600 students on three campuses situated in the Northern California cities of San Francisco, Stockton and Sacramento.
President Pamela A. Eibeck www.pacific.edu
Eberhardt School of Business
The Eberhardt School of Business offers a Masters in Business Administration (MBA), Master of Accounting (MAcc), Bachelor of Science in Business Administration, Bachelor of Science in Accounting, and Minors in Management, Business Administration, and Information Systems to nearly 700 students. With an emphasis on interactive classes and student-faculty engagement, the program is committed to developing successful future business leaders through a learning process that is personal, relevant, and professional. In addition to developing well-rounded and highly skilled graduates, the Eberhardt School of Business has demonstrated its commitment to community service and regional economic development through a variety of outreach programs and activities including the Center for Business and Policy Research, Career Management Center, Center for Entrepreneurship, Institute for Family Business, and Westgate Center for Management Development.
Dean Lewis R. Gale www.business.pacific.edu
Center for Business and Policy Research
The Center for Business and Policy Research, founded in 2004 and housed in the Eberhardt School of Business, produces quarterly economic forecasts of California and 8 metropolitan areas from Sacramento to Fresno to the San Francisco Bay Area. In addition to its forecasting program, the Center conducts policy and planning studies on topics such as water, transportation, housing, and economic development for public and private clients throughout Northern California.
Jeffrey A. Michael, Ph.D.
Director, Center for Business and Policy Research
Ph.D., North Carolina State University; M.S., University of Maine; B.A., Hamilton College (NY)
Dr. Jeffrey Michael is Director of the Center for Business and Policy Research and Associate Professor in the Eberhardt School of Business at the University of the Pacific.
Jeff’s areas of expertise include regional economic forecasting and environmental economics including work on the economic impacts of the Endangered Species Act, climate change, and regulation on land use, property values and employment growth.
His research has received numerous grants, been published in scholarly journals and received local and national press coverage including the Wall Street Journal, New York Times Magazine, San Francisco Chronicle, Washington Post, NPR, and PBS.
Prior to joining Pacific in 2008, Jeff was faculty at Towson University in Maryland where he served as Director of the Center for Applied Business and Economic Research, Associate Dean, and faculty. Jeff received his Ph.D. from North Carolina State University, M.S. from the University of Maine, and B.A. from Hamilton College (NY).
C E N T E R F O R B U S I N E S S A N D P O L I C Y R E S E A R C H
U N I V E R S I T Y O F T H E P A C I F I C E B E R H A R D T S C H O O L O F B U S I N E S S
Go.Pacific.edu/CBPR
Sacramento Office:3200 5th AvenueSacramento, CA 95817
Stockton Office:3601 Pacific AvenueStockton, CA 95211
University of the Pacific | Eberhardt School of Business