Embed Size (px)
DESCRIPTION
May 2013 Local Reports
Citation preview

2012 2013 + / – 2012 2013 + / –
New Listings 5 4 - 20.0% 18 21 + 16.7%
Closed Sales 2 0 - 100.0% 9 5 - 44.4%
Median Sales Price* $34,000 $0 - 100.0% $65,900 $72,500 + 10.0%
Percent of Original List Price Received* 97.7% 0.0% - 100.0% 90.2% 86.1% - 4.5%
Days on Market Until Sale 76 0 - 100.0% 240 100 - 58.3%
Inventory of Homes for Sale 36 24 - 33.3% -- -- --
2012 2013 + / – 2012 2013 + / –
New Listings 0 0 -- 0 0 --
Closed Sales 0 0 -- 0 2 --
Median Sales Price* $0 $0 -- $0 $200,000 --
Percent of Original List Price Received* 0.0% 0.0% -- 0.0% 84.2% --
Days on Market Until Sale 0 0 -- 0 177 --
Inventory of Homes for Sale 2 0 - 100.0% -- -- --
- 20.0% - 100.0% - 36.8%Change in
New ListingsAll Properties
Condo PropertiesMay Year to Date
A RESEARCH TOOL PROVIDED BY THE COASTAL CAROLINAS ASSOCIATION OF REALTORS®
Local Market Update – May 2013
Andrews Change inClosed SalesAll Properties
Change in Inventory of Homes
All Properties
May Year to DateSingle-Family Properties
y
AndrewsAll MLS
* Does not account for seller concessions. | Activity for one month can sometimes look extreme due to small sample size.
** Each dot represents the change in median sales price from the prior year using a 6-month weighted average. This means that each of the 6 months used in a dot are proportionedaccording to their share of sales during that period. | All data from the Coastal Carolinas Association of REALTORS®. | Sponsored by South Carolina REALTORS®.
Powered by 10K Research and Marketing. | Information deemed reliable but not guaranteed. Consult your agent for market specifics.
Change in Median Sales Price from Prior Year (6-Month Average)**
All MLSAndrews
- 60%
- 40%
- 20%
0%
+ 20%
+ 40%
+ 60%
+ 80%
1-2008 1-2009 1-2010 1-2011 1-2012 1-2013
Single-Family Properties
- 25%
- 20%
- 15%
- 10%
- 5%
0%
+ 5%
+ 10%
1-2008 1-2009 1-2010 1-2011 1-2012 1-2013
Condo Propertiesb
a

2012 2013 + / – 2012 2013 + / –
New Listings 10 8 - 20.0% 32 32 0.0%
Closed Sales 1 2 + 100.0% 6 13 + 116.7%
Median Sales Price* $130,000 $130,000 0.0% $125,000 $111,250 - 11.0%
Percent of Original List Price Received* 93.5% 100.8% + 7.7% 96.3% 93.7% - 2.7%
Days on Market Until Sale 173 160 - 7.5% 150 197 + 31.6%
Inventory of Homes for Sale 34 36 + 5.9% -- -- --
2012 2013 + / – 2012 2013 + / –
New Listings 0 0 -- 0 0 --
Closed Sales 0 0 -- 0 0 --
Median Sales Price* $0 $0 -- $0 $0 --
Percent of Original List Price Received* 0.0% 0.0% -- 0.0% 0.0% --
Days on Market Until Sale 0 0 -- 0 0 --
Inventory of Homes for Sale 0 0 -- -- -- --
- 20.0% + 100.0% + 5.9%Change in
New ListingsAll Properties
Condo PropertiesMay Year to Date
A RESEARCH TOOL PROVIDED BY THE COASTAL CAROLINAS ASSOCIATION OF REALTORS®
Local Market Update – May 2013
Aynor Change inClosed SalesAll Properties
Change in Inventory of Homes
All Properties
May Year to DateSingle-Family Properties
y
AynorAll MLS
* Does not account for seller concessions. | Activity for one month can sometimes look extreme due to small sample size.
** Each dot represents the change in median sales price from the prior year using a 6-month weighted average. This means that each of the 6 months used in a dot are proportionedaccording to their share of sales during that period. | All data from the Coastal Carolinas Association of REALTORS®. | Sponsored by South Carolina REALTORS®.
Powered by 10K Research and Marketing. | Information deemed reliable but not guaranteed. Consult your agent for market specifics.
Change in Median Sales Price from Prior Year (6-Month Average)**
All MLSAynor
- 40%
- 30%
- 20%
- 10%
0%
+ 10%
+ 20%
+ 30%
+ 40%
1-2008 1-2009 1-2010 1-2011 1-2012 1-2013
Single-Family Properties
- 25%
- 20%
- 15%
- 10%
- 5%
0%
+ 5%
+ 10%
1-2008 1-2009 1-2010 1-2011 1-2012 1-2013
Condo Propertiesb
a

2012 2013 + / – 2012 2013 + / –
New Listings 89 117 + 31.5% 411 487 + 18.5%
Closed Sales 49 65 + 32.7% 196 280 + 42.9%
Median Sales Price* $130,000 $172,770 + 32.9% $135,000 $159,900 + 18.4%
Percent of Original List Price Received* 97.6% 96.3% - 1.3% 97.2% 96.5% - 0.7%
Days on Market Until Sale 138 146 + 5.6% 156 149 - 4.3%
Inventory of Homes for Sale 387 346 - 10.6% -- -- --
2012 2013 + / – 2012 2013 + / –
New Listings 16 14 - 12.5% 124 107 - 13.7%
Closed Sales 17 13 - 23.5% 65 62 - 4.6%
Median Sales Price* $89,900 $85,500 - 4.9% $80,000 $84,500 + 5.6%
Percent of Original List Price Received* 94.3% 95.8% + 1.5% 95.0% 96.1% + 1.2%
Days on Market Until Sale 140 214 + 52.9% 149 180 + 20.6%
Inventory of Homes for Sale 135 119 - 11.9% -- -- --
+ 24.8% + 18.2% - 10.9%Change in
New ListingsAll Properties
Condo PropertiesMay Year to Date
A RESEARCH TOOL PROVIDED BY THE COASTAL CAROLINAS ASSOCIATION OF REALTORS®
Local Market Update – May 2013
Carolina Forest Change inClosed SalesAll Properties
Change in Inventory of Homes
All Properties
May Year to DateSingle-Family Properties
y
Carolina ForestAll MLS
* Does not account for seller concessions. | Activity for one month can sometimes look extreme due to small sample size.
** Each dot represents the change in median sales price from the prior year using a 6-month weighted average. This means that each of the 6 months used in a dot are proportionedaccording to their share of sales during that period. | All data from the Coastal Carolinas Association of REALTORS®. | Sponsored by South Carolina REALTORS®.
Powered by 10K Research and Marketing. | Information deemed reliable but not guaranteed. Consult your agent for market specifics.
Change in Median Sales Price from Prior Year (6-Month Average)**
All MLSCarolina Forest
- 25%
- 20%
- 15%
- 10%
- 5%
0%
+ 5%
+ 10%
+ 15%
+ 20%
+ 25%
1-2008 1-2009 1-2010 1-2011 1-2012 1-2013
Single-Family Properties
- 35%
- 30%
- 25%
- 20%
- 15%
- 10%
- 5%
0%
+ 5%
+ 10%
+ 15%
1-2008 1-2009 1-2010 1-2011 1-2012 1-2013
Condo Propertiesb
a

2012 2013 + / – 2012 2013 + / –
New Listings 114 140 + 22.8% 514 695 + 35.2%
Closed Sales 58 77 + 32.8% 248 312 + 25.8%
Median Sales Price* $120,000 $136,000 + 13.3% $120,000 $127,038 + 5.9%
Percent of Original List Price Received* 95.0% 96.2% + 1.3% 95.2% 96.2% + 1.1%
Days on Market Until Sale 219 162 - 26.0% 190 162 - 14.7%
Inventory of Homes for Sale 641 651 + 1.6% -- -- --
2012 2013 + / – 2012 2013 + / –
New Listings 5 4 - 20.0% 65 35 - 46.2%
Closed Sales 6 6 0.0% 31 16 - 48.4%
Median Sales Price* $39,900 $39,000 - 2.3% $59,000 $41,750 - 29.2%
Percent of Original List Price Received* 90.5% 85.4% - 5.7% 93.6% 89.4% - 4.4%
Days on Market Until Sale 109 78 - 28.3% 154 124 - 19.4%
Inventory of Homes for Sale 65 45 - 30.8% -- -- --
+ 21.0% + 29.7% - 1.4%Change in
New ListingsAll Properties
Condo PropertiesMay Year to Date
A RESEARCH TOOL PROVIDED BY THE COASTAL CAROLINAS ASSOCIATION OF REALTORS®
Local Market Update – May 2013
Conway Change inClosed SalesAll Properties
Change in Inventory of Homes
All Properties
May Year to DateSingle-Family Properties
y
ConwayAll MLS
* Does not account for seller concessions. | Activity for one month can sometimes look extreme due to small sample size.
** Each dot represents the change in median sales price from the prior year using a 6-month weighted average. This means that each of the 6 months used in a dot are proportionedaccording to their share of sales during that period. | All data from the Coastal Carolinas Association of REALTORS®. | Sponsored by South Carolina REALTORS®.
Powered by 10K Research and Marketing. | Information deemed reliable but not guaranteed. Consult your agent for market specifics.
Change in Median Sales Price from Prior Year (6-Month Average)**
All MLSConway
- 20%
- 15%
- 10%
- 5%
0%
+ 5%
+ 10%
1-2008 1-2009 1-2010 1-2011 1-2012 1-2013
Single-Family Properties
- 40%
- 30%
- 20%
- 10%
0%
+ 10%
+ 20%
+ 30%
+ 40%
1-2008 1-2009 1-2010 1-2011 1-2012 1-2013
Condo Propertiesb
a

2012 2013 + / – 2012 2013 + / –
New Listings 47 45 - 4.3% 214 248 + 15.9%
Closed Sales 26 28 + 7.7% 103 117 + 13.6%
Median Sales Price* $220,750 $242,720 + 10.0% $226,800 $238,000 + 4.9%
Percent of Original List Price Received* 96.4% 95.7% - 0.7% 94.2% 95.4% + 1.3%
Days on Market Until Sale 164 225 + 37.3% 168 189 + 12.4%
Inventory of Homes for Sale 252 230 - 8.7% -- -- --
2012 2013 + / – 2012 2013 + / –
New Listings 12 19 + 58.3% 79 95 + 20.3%
Closed Sales 7 7 0.0% 29 40 + 37.9%
Median Sales Price* $214,000 $184,500 - 13.8% $195,000 $167,167 - 14.3%
Percent of Original List Price Received* 92.8% 94.3% + 1.6% 93.4% 93.4% - 0.0%
Days on Market Until Sale 143 270 + 89.0% 196 209 + 6.7%
Inventory of Homes for Sale 114 120 + 5.3% -- -- --
+ 8.5% + 6.1% - 4.4%Change in
New ListingsAll Properties
Condo PropertiesMay Year to Date
A RESEARCH TOOL PROVIDED BY THE COASTAL CAROLINAS ASSOCIATION OF REALTORS®
Local Market Update – May 2013
Garden City / Murrells Inlet
Change inClosed SalesAll Properties
Change in Inventory of Homes
All Properties
May Year to DateSingle-Family Properties
y
Garden City / Murrells InletAll MLS
* Does not account for seller concessions. | Activity for one month can sometimes look extreme due to small sample size.
** Each dot represents the change in median sales price from the prior year using a 6-month weighted average. This means that each of the 6 months used in a dot are proportionedaccording to their share of sales during that period. | All data from the Coastal Carolinas Association of REALTORS®. | Sponsored by South Carolina REALTORS®.
Powered by 10K Research and Marketing. | Information deemed reliable but not guaranteed. Consult your agent for market specifics.
Change in Median Sales Price from Prior Year (6-Month Average)**
All MLSGarden City / Murrells Inlet
- 40%
- 20%
0%
+ 20%
+ 40%
+ 60%
+ 80%
+ 100%
1-2008 1-2009 1-2010 1-2011 1-2012 1-2013
Single-Family Properties
- 30%
- 20%
- 10%
0%
+ 10%
+ 20%
+ 30%
+ 40%
+ 50%
+ 60%
1-2008 1-2009 1-2010 1-2011 1-2012 1-2013
Condo Propertiesb
a
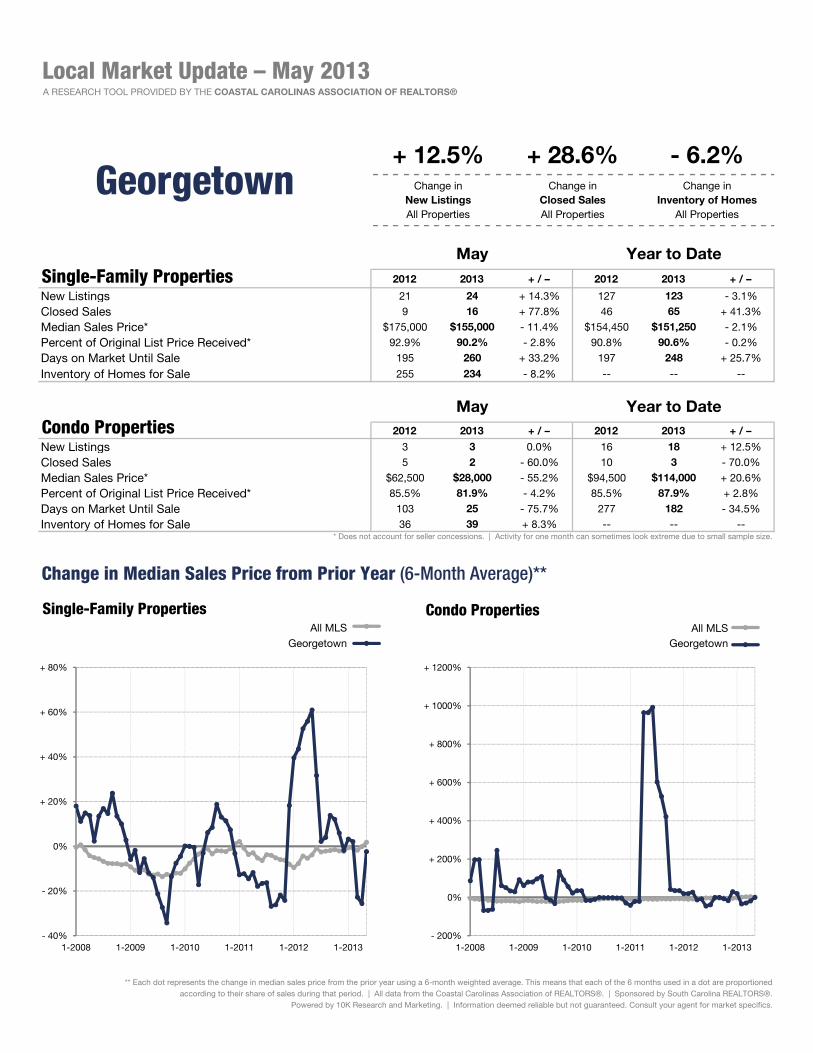
2012 2013 + / – 2012 2013 + / –
New Listings 21 24 + 14.3% 127 123 - 3.1%
Closed Sales 9 16 + 77.8% 46 65 + 41.3%
Median Sales Price* $175,000 $155,000 - 11.4% $154,450 $151,250 - 2.1%
Percent of Original List Price Received* 92.9% 90.2% - 2.8% 90.8% 90.6% - 0.2%
Days on Market Until Sale 195 260 + 33.2% 197 248 + 25.7%
Inventory of Homes for Sale 255 234 - 8.2% -- -- --
2012 2013 + / – 2012 2013 + / –
New Listings 3 3 0.0% 16 18 + 12.5%
Closed Sales 5 2 - 60.0% 10 3 - 70.0%
Median Sales Price* $62,500 $28,000 - 55.2% $94,500 $114,000 + 20.6%
Percent of Original List Price Received* 85.5% 81.9% - 4.2% 85.5% 87.9% + 2.8%
Days on Market Until Sale 103 25 - 75.7% 277 182 - 34.5%
Inventory of Homes for Sale 36 39 + 8.3% -- -- --
+ 12.5% + 28.6% - 6.2%Change in
New ListingsAll Properties
Condo PropertiesMay Year to Date
A RESEARCH TOOL PROVIDED BY THE COASTAL CAROLINAS ASSOCIATION OF REALTORS®
Local Market Update – May 2013
Georgetown Change inClosed SalesAll Properties
Change in Inventory of Homes
All Properties
May Year to DateSingle-Family Properties
y
GeorgetownAll MLS
* Does not account for seller concessions. | Activity for one month can sometimes look extreme due to small sample size.
** Each dot represents the change in median sales price from the prior year using a 6-month weighted average. This means that each of the 6 months used in a dot are proportionedaccording to their share of sales during that period. | All data from the Coastal Carolinas Association of REALTORS®. | Sponsored by South Carolina REALTORS®.
Powered by 10K Research and Marketing. | Information deemed reliable but not guaranteed. Consult your agent for market specifics.
Change in Median Sales Price from Prior Year (6-Month Average)**
All MLSGeorgetown
- 40%
- 20%
0%
+ 20%
+ 40%
+ 60%
+ 80%
1-2008 1-2009 1-2010 1-2011 1-2012 1-2013
Single-Family Properties
- 200%
0%
+ 200%
+ 400%
+ 600%
+ 800%
+ 1000%
+ 1200%
1-2008 1-2009 1-2010 1-2011 1-2012 1-2013
Condo Propertiesb
a

2012 2013 + / – 2012 2013 + / –
New Listings 88 106 + 20.5% 392 481 + 22.7%
Closed Sales 34 54 + 58.8% 156 205 + 31.4%
Median Sales Price* $199,750 $207,495 + 3.9% $174,995 $173,328 - 1.0%
Percent of Original List Price Received* 93.0% 94.4% + 1.5% 93.8% 94.8% + 1.1%
Days on Market Until Sale 189 196 + 3.7% 190 171 - 10.2%
Inventory of Homes for Sale 442 471 + 6.6% -- -- --
2012 2013 + / – 2012 2013 + / –
New Listings 83 84 + 1.2% 420 457 + 8.8%
Closed Sales 46 44 - 4.3% 184 197 + 7.1%
Median Sales Price* $99,900 $114,250 + 14.4% $108,950 $103,000 - 5.5%
Percent of Original List Price Received* 92.6% 94.3% + 1.8% 92.0% 93.3% + 1.4%
Days on Market Until Sale 164 126 - 23.2% 172 168 - 2.3%
Inventory of Homes for Sale 587 523 - 10.9% -- -- --
+ 11.1% + 22.5% - 3.4%Change in
New ListingsAll Properties
Condo PropertiesMay Year to Date
A RESEARCH TOOL PROVIDED BY THE COASTAL CAROLINAS ASSOCIATION OF REALTORS®
Local Market Update – May 2013
Little River Change inClosed SalesAll Properties
Change in Inventory of Homes
All Properties
May Year to DateSingle-Family Properties
y
Little RiverAll MLS
* Does not account for seller concessions. | Activity for one month can sometimes look extreme due to small sample size.
** Each dot represents the change in median sales price from the prior year using a 6-month weighted average. This means that each of the 6 months used in a dot are proportionedaccording to their share of sales during that period. | All data from the Coastal Carolinas Association of REALTORS®. | Sponsored by South Carolina REALTORS®.
Powered by 10K Research and Marketing. | Information deemed reliable but not guaranteed. Consult your agent for market specifics.
Change in Median Sales Price from Prior Year (6-Month Average)**
All MLSLittle River
- 20%
- 15%
- 10%
- 5%
0%
+ 5%
+ 10%
+ 15%
1-2008 1-2009 1-2010 1-2011 1-2012 1-2013
Single-Family Properties
- 25%
- 20%
- 15%
- 10%
- 5%
0%
+ 5%
+ 10%
+ 15%
1-2008 1-2009 1-2010 1-2011 1-2012 1-2013
Condo Propertiesb
a

2012 2013 + / – 2012 2013 + / –
New Listings 25 28 + 12.0% 133 148 + 11.3%
Closed Sales 10 12 + 20.0% 48 62 + 29.2%
Median Sales Price* $81,500 $106,750 + 31.0% $117,525 $92,500 - 21.3%
Percent of Original List Price Received* 93.2% 90.2% - 3.3% 93.3% 91.2% - 2.3%
Days on Market Until Sale 158 233 + 47.1% 189 186 - 1.7%
Inventory of Homes for Sale 161 170 + 5.6% -- -- --
2012 2013 + / – 2012 2013 + / –
New Listings 0 3 -- 1 20 + 1900.0%
Closed Sales 0 2 -- 0 5 --
Median Sales Price* $0 $143,500 -- $0 $78,999 --
Percent of Original List Price Received* 0.0% 93.4% -- 0.0% 92.3% --
Days on Market Until Sale 0 76 -- 0 121 --
Inventory of Homes for Sale 13 26 + 100.0% -- -- --
+ 24.0% + 40.0% + 12.6%Change in
New ListingsAll Properties
Condo PropertiesMay Year to Date
A RESEARCH TOOL PROVIDED BY THE COASTAL CAROLINAS ASSOCIATION OF REALTORS®
Local Market Update – May 2013
Loris Change inClosed SalesAll Properties
Change in Inventory of Homes
All Properties
May Year to DateSingle-Family Properties
y
LorisAll MLS
* Does not account for seller concessions. | Activity for one month can sometimes look extreme due to small sample size.
** Each dot represents the change in median sales price from the prior year using a 6-month weighted average. This means that each of the 6 months used in a dot are proportionedaccording to their share of sales during that period. | All data from the Coastal Carolinas Association of REALTORS®. | Sponsored by South Carolina REALTORS®.
Powered by 10K Research and Marketing. | Information deemed reliable but not guaranteed. Consult your agent for market specifics.
Change in Median Sales Price from Prior Year (6-Month Average)**
All MLSLoris
- 40%
- 30%
- 20%
- 10%
0%
+ 10%
+ 20%
+ 30%
+ 40%
1-2008 1-2009 1-2010 1-2011 1-2012 1-2013
Single-Family Properties
- 30%
- 20%
- 10%
0%
+ 10%
+ 20%
+ 30%
+ 40%
1-2008 1-2009 1-2010 1-2011 1-2012 1-2013
Condo Propertiesb
a

2012 2013 + / – 2012 2013 + / –
New Listings 80 82 + 2.5% 389 471 + 21.1%
Closed Sales 44 50 + 13.6% 173 222 + 28.3%
Median Sales Price* $222,750 $242,990 + 9.1% $226,850 $235,990 + 4.0%
Percent of Original List Price Received* 93.4% 95.1% + 1.8% 94.0% 95.4% + 1.5%
Days on Market Until Sale 215 155 - 28.1% 198 176 - 11.1%
Inventory of Homes for Sale 435 430 - 1.1% -- -- --
2012 2013 + / – 2012 2013 + / –
New Listings 244 264 + 8.2% 1,258 1,261 + 0.2%
Closed Sales 156 154 - 1.3% 631 711 + 12.7%
Median Sales Price* $99,000 $97,900 - 1.1% $93,950 $95,000 + 1.1%
Percent of Original List Price Received* 94.3% 94.4% + 0.1% 94.0% 94.1% + 0.0%
Days on Market Until Sale 182 161 - 11.4% 175 171 - 2.5%
Inventory of Homes for Sale 1,610 1,367 - 15.1% -- -- --
+ 6.8% + 2.0% - 12.1%Change in
New ListingsAll Properties
Condo PropertiesMay Year to Date
A RESEARCH TOOL PROVIDED BY THE COASTAL CAROLINAS ASSOCIATION OF REALTORS®
Local Market Update – May 2013
Myrtle Beach Change inClosed SalesAll Properties
Change in Inventory of Homes
All Properties
May Year to DateSingle-Family Properties
y
Myrtle BeachAll MLS
* Does not account for seller concessions. | Activity for one month can sometimes look extreme due to small sample size.
** Each dot represents the change in median sales price from the prior year using a 6-month weighted average. This means that each of the 6 months used in a dot are proportionedaccording to their share of sales during that period. | All data from the Coastal Carolinas Association of REALTORS®. | Sponsored by South Carolina REALTORS®.
Powered by 10K Research and Marketing. | Information deemed reliable but not guaranteed. Consult your agent for market specifics.
Change in Median Sales Price from Prior Year (6-Month Average)**
All MLSMyrtle Beach
- 40%
- 30%
- 20%
- 10%
0%
+ 10%
+ 20%
+ 30%
+ 40%
1-2008 1-2009 1-2010 1-2011 1-2012 1-2013
Single-Family Properties
- 50%
- 40%
- 30%
- 20%
- 10%
0%
+ 10%
+ 20%
+ 30%
1-2008 1-2009 1-2010 1-2011 1-2012 1-2013
Condo Propertiesb
a
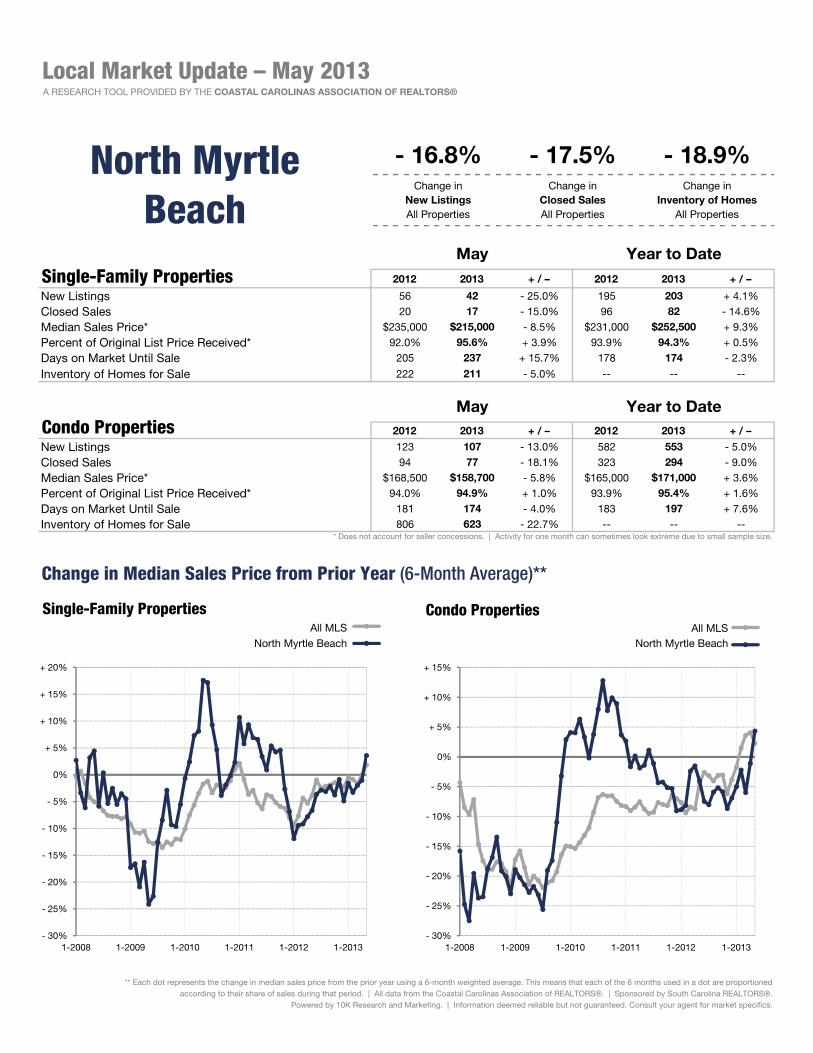
2012 2013 + / – 2012 2013 + / –
New Listings 56 42 - 25.0% 195 203 + 4.1%
Closed Sales 20 17 - 15.0% 96 82 - 14.6%
Median Sales Price* $235,000 $215,000 - 8.5% $231,000 $252,500 + 9.3%
Percent of Original List Price Received* 92.0% 95.6% + 3.9% 93.9% 94.3% + 0.5%
Days on Market Until Sale 205 237 + 15.7% 178 174 - 2.3%
Inventory of Homes for Sale 222 211 - 5.0% -- -- --
2012 2013 + / – 2012 2013 + / –
New Listings 123 107 - 13.0% 582 553 - 5.0%
Closed Sales 94 77 - 18.1% 323 294 - 9.0%
Median Sales Price* $168,500 $158,700 - 5.8% $165,000 $171,000 + 3.6%
Percent of Original List Price Received* 94.0% 94.9% + 1.0% 93.9% 95.4% + 1.6%
Days on Market Until Sale 181 174 - 4.0% 183 197 + 7.6%
Inventory of Homes for Sale 806 623 - 22.7% -- -- --
- 16.8% - 17.5% - 18.9%Change in
New ListingsAll Properties
Condo PropertiesMay Year to Date
A RESEARCH TOOL PROVIDED BY THE COASTAL CAROLINAS ASSOCIATION OF REALTORS®
Local Market Update – May 2013
North Myrtle Beach
Change inClosed SalesAll Properties
Change in Inventory of Homes
All Properties
May Year to DateSingle-Family Properties
y
North Myrtle BeachAll MLS
* Does not account for seller concessions. | Activity for one month can sometimes look extreme due to small sample size.
** Each dot represents the change in median sales price from the prior year using a 6-month weighted average. This means that each of the 6 months used in a dot are proportionedaccording to their share of sales during that period. | All data from the Coastal Carolinas Association of REALTORS®. | Sponsored by South Carolina REALTORS®.
Powered by 10K Research and Marketing. | Information deemed reliable but not guaranteed. Consult your agent for market specifics.
Change in Median Sales Price from Prior Year (6-Month Average)**
All MLSNorth Myrtle Beach
- 30%
- 25%
- 20%
- 15%
- 10%
- 5%
0%
+ 5%
+ 10%
+ 15%
+ 20%
1-2008 1-2009 1-2010 1-2011 1-2012 1-2013
Single-Family Properties
- 30%
- 25%
- 20%
- 15%
- 10%
- 5%
0%
+ 5%
+ 10%
+ 15%
1-2008 1-2009 1-2010 1-2011 1-2012 1-2013
Condo Propertiesb
a

2012 2013 + / – 2012 2013 + / –
New Listings 38 41 + 7.9% 239 253 + 5.9%
Closed Sales 21 24 + 14.3% 93 111 + 19.4%
Median Sales Price* $275,000 $391,000 + 42.2% $303,500 $339,000 + 11.7%
Percent of Original List Price Received* 92.7% 92.9% + 0.3% 92.3% 93.0% + 0.7%
Days on Market Until Sale 236 234 - 0.7% 214 222 + 3.9%
Inventory of Homes for Sale 439 425 - 3.2% -- -- --
2012 2013 + / – 2012 2013 + / –
New Listings 33 27 - 18.2% 166 173 + 4.2%
Closed Sales 19 17 - 10.5% 61 70 + 14.8%
Median Sales Price* $148,000 $178,000 + 20.3% $143,000 $130,000 - 9.1%
Percent of Original List Price Received* 92.1% 90.9% - 1.2% 91.9% 91.1% - 0.9%
Days on Market Until Sale 207 205 - 0.8% 205 191 - 6.9%
Inventory of Homes for Sale 344 329 - 4.4% -- -- --
- 4.2% + 2.5% - 3.7%Change in
New ListingsAll Properties
Condo PropertiesMay Year to Date
A RESEARCH TOOL PROVIDED BY THE COASTAL CAROLINAS ASSOCIATION OF REALTORS®
Local Market Update – May 2013
Pawleys Island / Litchfield
Change inClosed SalesAll Properties
Change in Inventory of Homes
All Properties
May Year to DateSingle-Family Properties
y
Pawleys Island / LitchfieldAll MLS
* Does not account for seller concessions. | Activity for one month can sometimes look extreme due to small sample size.
** Each dot represents the change in median sales price from the prior year using a 6-month weighted average. This means that each of the 6 months used in a dot are proportionedaccording to their share of sales during that period. | All data from the Coastal Carolinas Association of REALTORS®. | Sponsored by South Carolina REALTORS®.
Powered by 10K Research and Marketing. | Information deemed reliable but not guaranteed. Consult your agent for market specifics.
Change in Median Sales Price from Prior Year (6-Month Average)**
All MLSPawleys Island / Litchfield
- 50%
- 40%
- 30%
- 20%
- 10%
0%
+ 10%
+ 20%
+ 30%
+ 40%
+ 50%
1-2008 1-2009 1-2010 1-2011 1-2012 1-2013
Single-Family Properties
- 40%
- 30%
- 20%
- 10%
0%
+ 10%
+ 20%
+ 30%
+ 40%
+ 50%
+ 60%
1-2008 1-2009 1-2010 1-2011 1-2012 1-2013
Condo Propertiesb
a

2012 2013 + / – 2012 2013 + / –
New Listings 37 17 - 54.1% 164 153 - 6.7%
Closed Sales 28 18 - 35.7% 80 87 + 8.7%
Median Sales Price* $128,950 $134,000 + 3.9% $134,500 $139,950 + 4.1%
Percent of Original List Price Received* 96.9% 96.5% - 0.5% 97.2% 96.3% - 0.9%
Days on Market Until Sale 131 155 + 18.4% 139 172 + 23.7%
Inventory of Homes for Sale 173 129 - 25.4% -- -- --
2012 2013 + / – 2012 2013 + / –
New Listings 4 11 + 175.0% 65 56 - 13.8%
Closed Sales 4 10 + 150.0% 31 28 - 9.7%
Median Sales Price* $43,750 $39,000 - 10.9% $50,000 $33,000 - 34.0%
Percent of Original List Price Received* 88.0% 92.2% + 4.8% 92.4% 89.7% - 2.9%
Days on Market Until Sale 127 218 + 71.6% 125 148 + 17.9%
Inventory of Homes for Sale 71 42 - 40.8% -- -- --
- 31.7% - 12.5% - 29.9%Change in
New ListingsAll Properties
Condo PropertiesMay Year to Date
A RESEARCH TOOL PROVIDED BY THE COASTAL CAROLINAS ASSOCIATION OF REALTORS®
Local Market Update – May 2013
Socastee Change inClosed SalesAll Properties
Change in Inventory of Homes
All Properties
May Year to DateSingle-Family Properties
y
SocasteeAll MLS
* Does not account for seller concessions. | Activity for one month can sometimes look extreme due to small sample size.
** Each dot represents the change in median sales price from the prior year using a 6-month weighted average. This means that each of the 6 months used in a dot are proportionedaccording to their share of sales during that period. | All data from the Coastal Carolinas Association of REALTORS®. | Sponsored by South Carolina REALTORS®.
Powered by 10K Research and Marketing. | Information deemed reliable but not guaranteed. Consult your agent for market specifics.
Change in Median Sales Price from Prior Year (6-Month Average)**
All MLSSocastee
- 20%
- 15%
- 10%
- 5%
0%
+ 5%
+ 10%
+ 15%
+ 20%
+ 25%
+ 30%
1-2008 1-2009 1-2010 1-2011 1-2012 1-2013
Single-Family Properties
- 60%
- 40%
- 20%
0%
+ 20%
+ 40%
+ 60%
1-2008 1-2009 1-2010 1-2011 1-2012 1-2013
Condo Propertiesb
a

2012 2013 + / – 2012 2013 + / –
New Listings 49 61 + 24.5% 239 242 + 1.3%
Closed Sales 33 43 + 30.3% 138 140 + 1.4%
Median Sales Price* $205,500 $180,000 - 12.4% $202,705 $186,000 - 8.2%
Percent of Original List Price Received* 96.5% 96.3% - 0.2% 95.4% 95.2% - 0.2%
Days on Market Until Sale 155 163 + 5.4% 180 168 - 6.5%
Inventory of Homes for Sale 238 186 - 21.8% -- -- --
2012 2013 + / – 2012 2013 + / –
New Listings 30 35 + 16.7% 164 182 + 11.0%
Closed Sales 18 25 + 38.9% 84 99 + 17.9%
Median Sales Price* $67,000 $73,750 + 10.1% $66,000 $68,900 + 4.4%
Percent of Original List Price Received* 94.6% 94.5% - 0.0% 92.0% 93.4% + 1.6%
Days on Market Until Sale 158 162 + 2.8% 179 147 - 17.5%
Inventory of Homes for Sale 189 146 - 22.8% -- -- --
+ 21.5% + 33.3% - 22.2%Change in
New ListingsAll Properties
Condo PropertiesMay Year to Date
A RESEARCH TOOL PROVIDED BY THE COASTAL CAROLINAS ASSOCIATION OF REALTORS®
Local Market Update – May 2013
Surfside Beach Change inClosed SalesAll Properties
Change in Inventory of Homes
All Properties
May Year to DateSingle-Family Properties
y
Surfside BeachAll MLS
* Does not account for seller concessions. | Activity for one month can sometimes look extreme due to small sample size.
** Each dot represents the change in median sales price from the prior year using a 6-month weighted average. This means that each of the 6 months used in a dot are proportionedaccording to their share of sales during that period. | All data from the Coastal Carolinas Association of REALTORS®. | Sponsored by South Carolina REALTORS®.
Powered by 10K Research and Marketing. | Information deemed reliable but not guaranteed. Consult your agent for market specifics.
Change in Median Sales Price from Prior Year (6-Month Average)**
All MLSSurfside Beach
- 20%
- 15%
- 10%
- 5%
0%
+ 5%
+ 10%
+ 15%
+ 20%
1-2008 1-2009 1-2010 1-2011 1-2012 1-2013
Single-Family Properties
- 40%
- 30%
- 20%
- 10%
0%
+ 10%
+ 20%
+ 30%
1-2008 1-2009 1-2010 1-2011 1-2012 1-2013
Condo Propertiesb
a