Embed Size (px)
Citation preview

Vegetated Large-Scale Channel Erosion Testing
(ASTM D 6460) (Modified procedure used for vegetated channel tests)
of
North American Green’s
C350, Triple Net Coconut Mat,
over
Loam
May 2013
Submitted to:
AASHTO/NTPEP
444 North Capitol Street, NW, Suite 249
Washington, D.C. 20001
Attn: Evan Rothblatt, NTPEP
Submitted by:
TRI/Environmental, Inc.
9063 Bee Caves Road
Austin, TX 78733
C. Joel Sprague
Project Manager

May 3, 2013
Mr. Evan Rothblatt AASHTO/NTPEP
444 North Capitol Street, NW, Suite 249
Washington, D.C. 20001
E-mail: [email protected]
Subject: Channel Testing over Loam of North American Green C350, Triple Net Coconut Mat,
manufactured in Poseyville, IN.
Dear Mr. Rothblatt:
This letter report presents the results for large-scale channel erosion tests performed on C350,
Triple Net Coconut Mat, over Loam. Included are data developed for target hydraulic shears
ranging from 0.5 to 3+ psf (0.02 to 0.14+ kPa) for the unvegetated condition and from 1 to 13+
psf (0.04 to 0.62+ kPa) for the vegetated condition. All testing work was performed in general
accordance with the ASTM D 6460, Standard Test Method for Determination of Rolled Erosion
Control Product (RECP) Performance in Protecting Earthen Channels from Stormwater-
Induced Erosion. The procedure was modified to use only single replicates when testing
vegetated channels. Generated results were used to develop the following permissible or limiting
shear (τlimit) and limiting velocity (Vlimit) for the tested material:
C350, Triple Net Coconut Mat & 3.8 staples/sy
Product Unvegetated
Condition
6+ Week Vegetated
Condition
1+ Year Vegetated
Condition
Actual growth period, wks 0 6 56
τlimit 3.2 8.8* 11.3*
Vlimit 11.3 19.5* 23.4*
“*” = ASTM D 6460 requires that three test replicates be performed using identical procedures to obtain an
average threshold of performance. Thus, the results of vegetated testing, being single replicates of each condition,
cannot be considered as an average threshold of performance.
TRI is pleased to present this final report. Please feel free to call if we can answer any questions
or provide any additional information.
Sincerely,
C. Joel Sprague, P.E.
Senior Engineer
Geosynthetics Services Division
cc: Jarrett Nelson, Jay Sprague - TRI

C350, Triple Net Coconut Mat, over Loam
Channel Erosion Testing
May 3, 2013
Page 3
CHANNEL TESTING REPORT
C350, Triple Net Coconut Mat, over Loam TESTING EQUIPMENT AND PROCEDURES
Overview of Test and Apparatus
TRI/Environmental, Inc.'s (TRI's) large-scale channel erosion testing facility is located at the
Denver Downs Research Farm in Anderson, SC. Testing oversight is provided by C. Joel
Sprague, P.E. The large-scale testing is performed in a rectangular flume having a 10% slope
(unvegetated condition) or 20% slope (vegetated condition) using a loamy soil test section. The
concentrated flow is produced by raising gates to allow gravity flow from an adjacent pond. At
least four sequential, increasing flows are applied to each test section for 30 minutes
(unvegetated condition) or 1 hour (vegetated condition) each to achieve a range of hydraulic
shear stresses in order to define the permissible, or limiting, shear stress, τlimit, which is the shear
stress necessary to cause an average of 0.5 inch of soil loss over the entire channel bottom.
Testing is performed in accordance with ASTM D 6460, though the procedure was modified to
use only single replicates when testing vegetated channels. Tables and graphs of shear versus
soil loss are generated from the accumulated data.
Rolled Erosion Control Product (RECP)
The following information and index properties were determined from the supplied product.
Table 1. Tested Product Information & Index Properties
Product Information and Index Property / Test Units Values
Product Identification - C350
Manufacturer - North American Green
Manufacturing Plant Location - Poseyville, IN
Lot number of sample - -
Fiber - 100% Coconut
Netting Openings in 0. 5 x 0. 5 (approx)
Stitching Spacing in 1.5 (approx)
Tensile Strength MD x XD (ASTM D 6818)* lb/in 81.9 x 60.5
Tensile Elongation MD x XD (ASTM D 6818)* % 29.3 x 18.8
Thickness (ASTM D 6525)* mils 582
Light Penetration (ASTM D 6567)* % cover 93.8
Density – Net Only (ASTM D 792, Method A)* g/cm3 0.916
Mass / Unit Area (ASTM D 6475)* oz/sy 15.16 * Values from Independent Testing of Randomly Sampled Product

C350, Triple Net Coconut Mat, over Loam
Channel Erosion Testing
May 3, 2013
Page 4
Test Soil
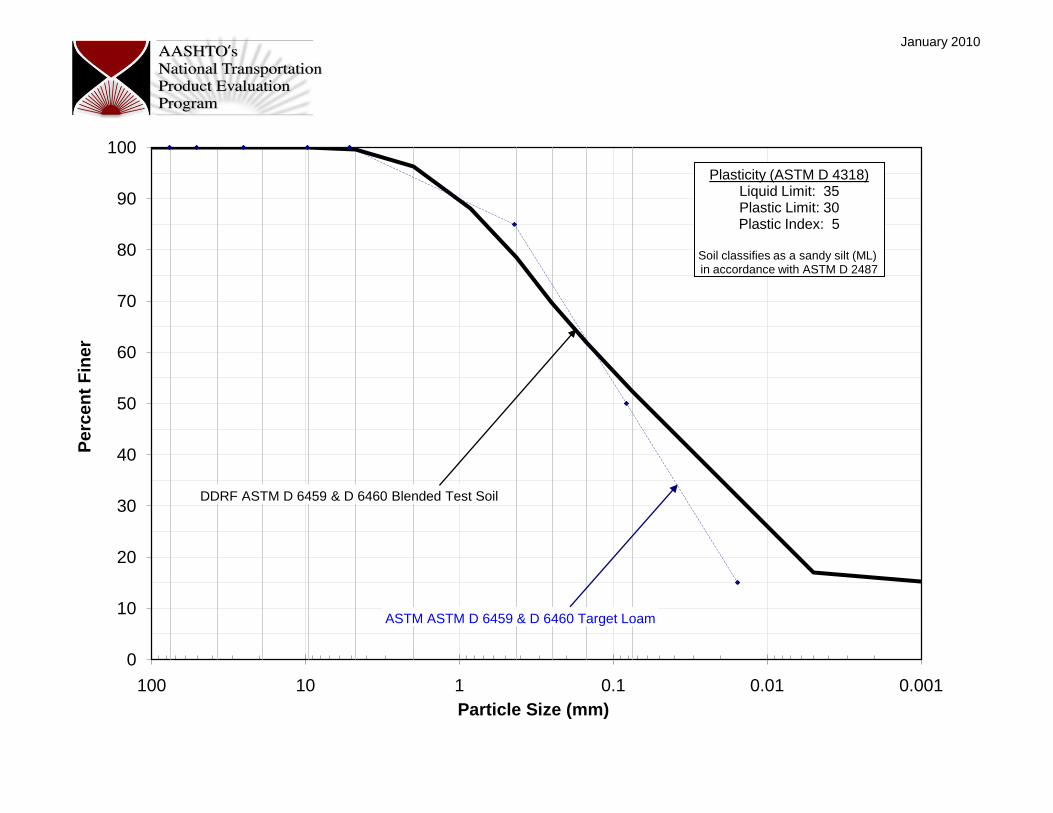
The test soil used in the test plots had the following characteristics.
Table 2. TRI-Loam Characteristics
Soil Characteristic Test Method Value
% Gravel
ASTM D 422
0
% Sand 45
% Silt 35
% Clay 20
Liquid Limit, % ASTM D 4318
41
Plasticity Index, % 8
Soil Classification USDA Loam
Soil Classification USCS Sandy silty clay (ML-CL)
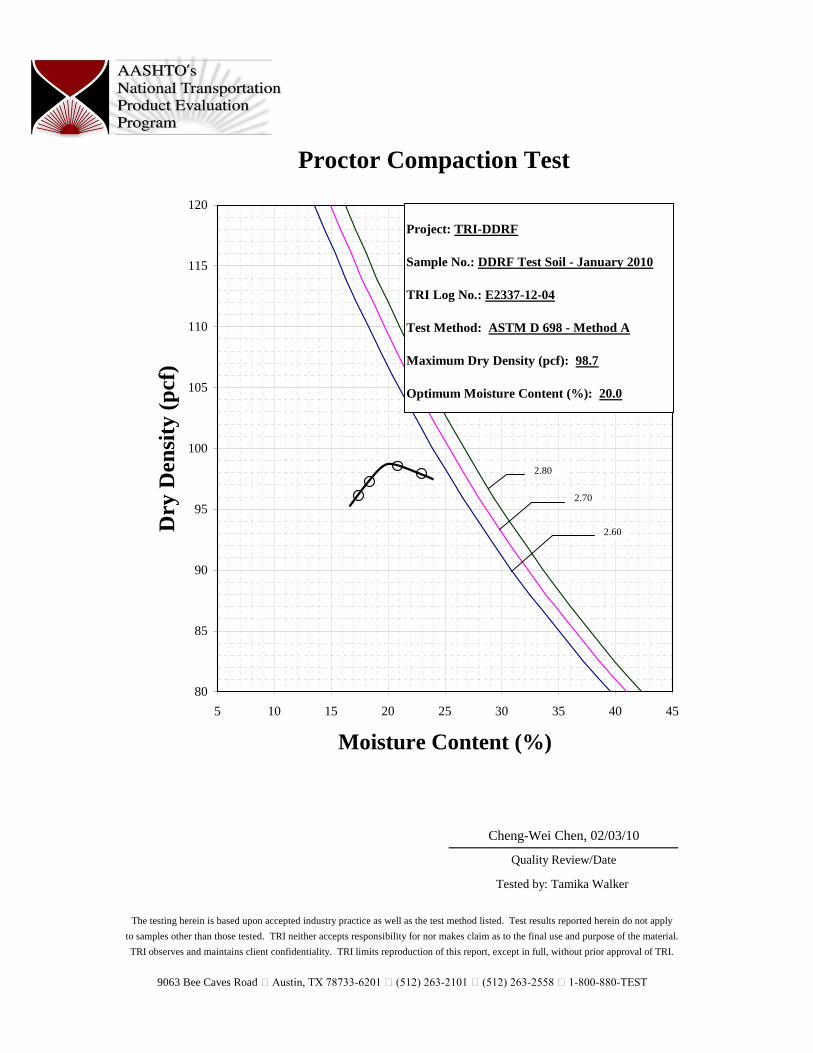
Preparation of the Test Channels
The initial channel soil veneer (12-inch thick minimum) is placed and compacted. Compaction is
verified to be 90% (± 3%) of Proctor Standard density using ASTM D 698 (sand cone method).
The test channels undergo a “standard” preparation procedure prior to each test. First, any rills
or depressions resulting from previous testing are filled in with test soil. The soil surface is
replaced to a depth of 1 inch and groomed to create a channel bottom that is level side-to-side
and at a smooth slope top-to-bottom. Finally, a vibrating plate compactor is run over the
renewed channel surface. If a vegetated condition is to be tested, grass seed (tall fescue) is
applied to the plot at the rate of 500 seeds per square foot. The submitted erosion control
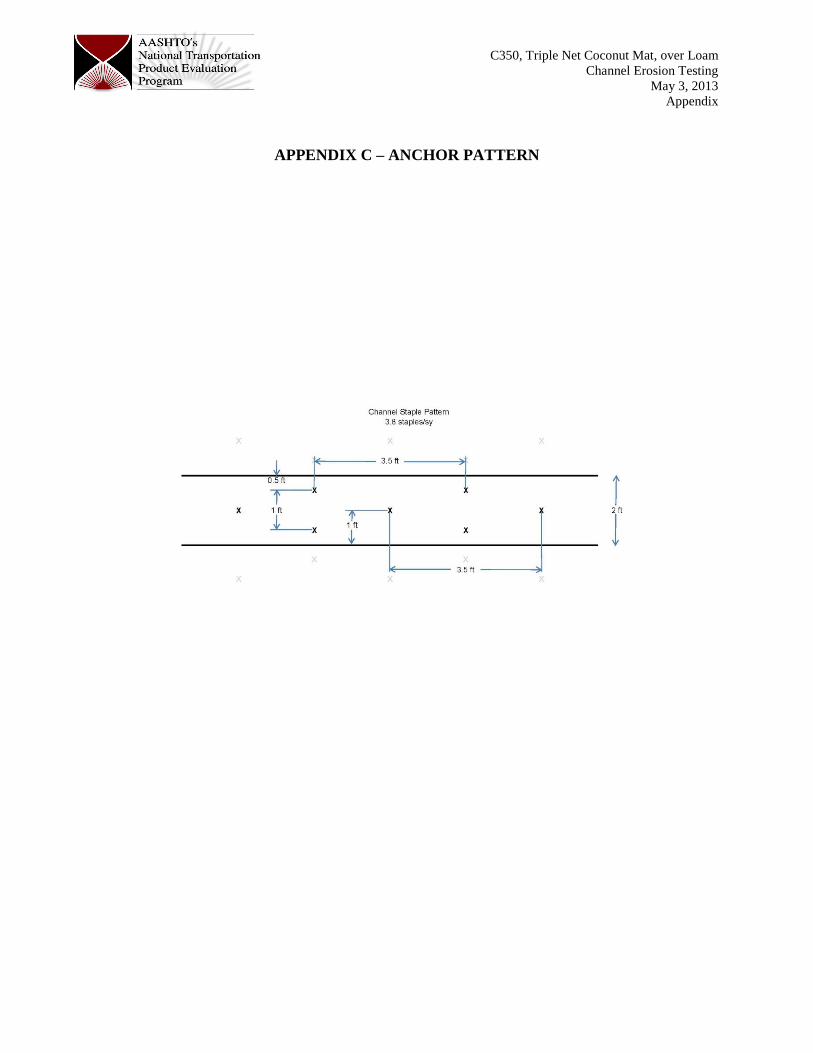
product is then installed using the anchors and anchorage pattern directed by the client.
Installation of Erosion Control Product in Test Channel
As noted, the submitted erosion control product is installed as directed by the client. For the
tests reported herein, the erosion control product was anchored using a “diamond” anchorage
patterns. The C350 anchorage consisted of 2”x 8” steel staples to create an anchorage density of
approximately 3.8 staples per square yard.
Specific Test Procedure
Immediately prior to testing, the initial soil surface elevation readings are made at predetermined
cross-sections. The channel is then exposed to sequential 30-minute (unvegetated condition) or
1-hour (vegetated condition) flows having target hydraulic shear stresses selected to create at
least three flow events below and one flow event above the shear stress level that results in a
cummulative average soil loss of ½-inch. During the testing, flow depth and corresponding flow
measurements are taken at the predetermined cross-section locations. Between flow events, the
flow is stopped and soil surface elevation measurements are made to facilitate calculation of soil
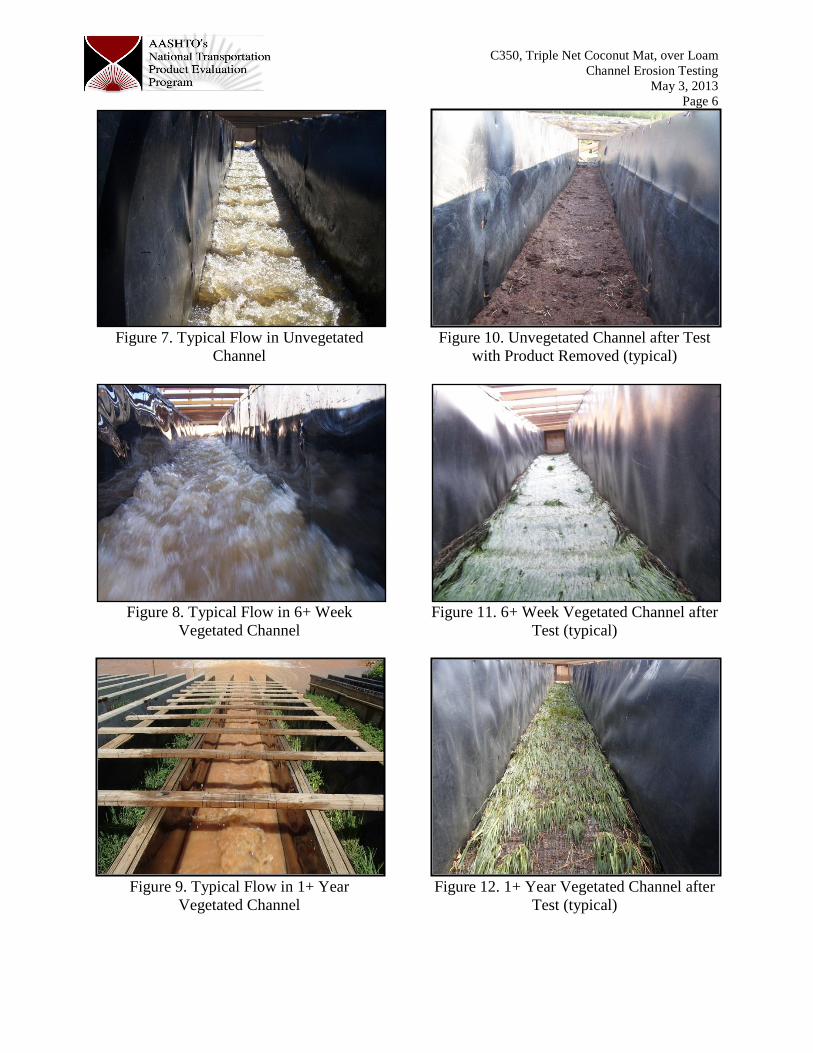
loss. The flow is then restarted at the next desired flow (shear) level. Pictures of typical
channel flows and resulting soil/vegetation loss are shown in Figures 7 thru 12.

C350, Triple Net Coconut Mat, over Loam
Channel Erosion Testing
May 3, 2013
Page 5
Figure 1. Typical 10% (Unvegetated Shear)
Flumes on Left; 20% Flumes on Right
Figure 2. 6+ Week Vegetated Shear in 20%
Flumes;
Figure 3. Typical 20% Temporary Flume
Set Up 1+ Year Vegetated Shear Plots
Figure 4. Unvegetated RECP
Figure 5. 6+ Week Vegetated RECP
Figure 6. 1+ Year Vegetated RECP
C350, Triple Net Coconut Mat, over Loam
Channel Erosion Testing
May 3, 2013
Page 6
Figure 7. Typical Flow in Unvegetated
Channel
Figure 8. Typical Flow in 6+ Week
Vegetated Channel
Figure 9. Typical Flow in 1+ Year
Vegetated Channel
Figure 10. Unvegetated Channel after Test
with Product Removed (typical)
Figure 11. 6+ Week Vegetated Channel after
Test (typical)
Figure 12. 1+ Year Vegetated Channel after
Test (typical)

C350, Triple Net Coconut Mat, over Loam
Channel Erosion Testing
May 3, 2013
Page 7
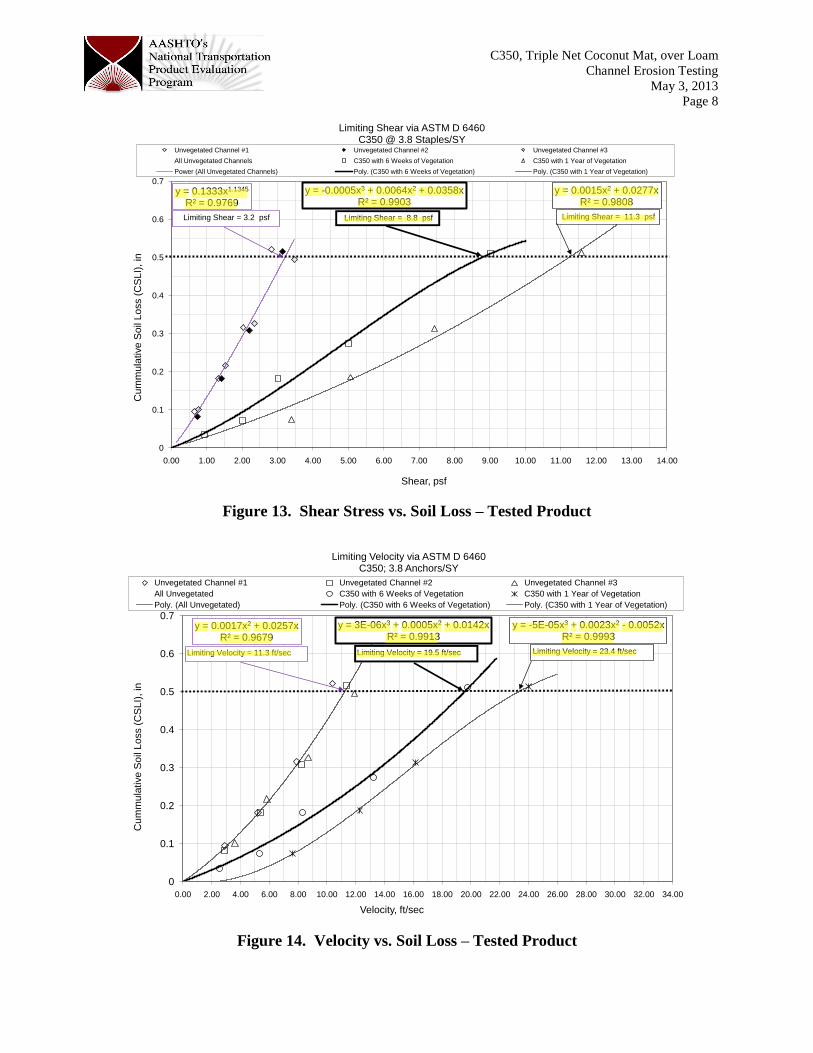
TEST RESULTS Average soil loss and the associated hydraulic shear calculated from flow and depth
measurements made during the testing are the principle data used to determine the performance
of the product tested. This data is entered into a spreadsheet that transforms the flow depth and
velocity into an hydraulic shear stress and the soil loss measurements into an average Clopper
Soil Loss Index (CSLI). Measured and calculated data is summarized in Table 3. A graph of
shear versus soil loss for the protected condition is shown in Figure 13. The associated velocities
and time of vegetation growth are plotted in Figures 14 and 15, respectively. The graphs include
the best regression line fit to the test data to facilitate a determination of the limiting shear stress,
τlimit,, and limiting velocity, Vlimit,. The 0.5-inch intercept values are provided in Table 4.
Table 3. Summary Data Table – Protected Test Reach
Test #
(Channel # - Shear
Level)
Actual
Growth
Period
(wks)
Flow
depth
(in)
Flow
velocity
(fps)
Flow
(cfs)
Manning’s
roughness, n
Max Bed
Shear
Stress (psf)
Cumm.
CSLI (in)
C1-S1, Unvegetated
0
1.24 2.92 0.60 0.036 0.64 0.09
C1-S2, Unvegetated 2.58 5.19 2.23 0.033 1.34 0.18
C1-S3, Unvegetated 3.90 7.91 5.14 0.028 2.03 0.31
C1-S5, Unvegetated 5.47 10.37 9.46 0.027 2.84 0.52
C2-S1, Unvegetated
0
1.42 3.15 0.74 0.036 0.74 0.08
C2-S2, Unvegetated 2.74 5.36 2.44 0.033 1.42 0.18
C2-S3, Unvegetated 4.23 8.21 5.78 0.029 2.20 0.31
C2-S4, Unvegetated 6.06 11.35 11.45 0.026 3.15 0.52
C3-S1, Unvegetated
0
1.47 3.59 0.88 0.032 0.76 0.10
C3-S2, Unvegetated 2.93 5.82 2.84 0.032 1.52 0.22
C3-S3, Unvegetated 4.52 8.70 6.55 0.028 2.35 0.33
C3-S4, Unvegetated 6.69 11.91 13.27 0.027 3.47 0.50
S1, 6+ Wk Vegetated
6
0.92 2.54 0.38 0.048 0.95 0.03
S2, 6+ Wk Vegetated 1.94 5.31 1.71 0.038 2.01 0.07
S3, 6+ Wk Vegetated 2.92 8.27 4.01 0.031 3.01 0.18
S4, 6+ Wk Vegetated 4.84 13.21 10.64 0.028 5.00 0.27
S5, 6+ Wk Vegetated 8.72 19.78 28.72 0.027 9.01 0.51
S1, 1+ Yr Vegetated
56
3.29 7.58 4.09 0.038 3.39 0.08
S2, 1+ Yr Vegetated 4.90 12.29 9.98 0.030 5.06 0.19
S3, 1+ Yr Vegetated 7.18 16.16 19.19 0.030 7.42 0.31
S4, 1+ Yr Vegetated 11.21 24.00 44.32 0.027 11.58 0.51
Table 4. C350, Triple Net Coconut Mat & 3.8 staples/sy
Product Unvegetated
Condition
6+ Week Vegetated
Condition
1+ Year Vegetated
Condition
Actual growth period, wks 0 6 56
τlimit 3.2 8.8* 11.3*
Vlimit 11.3 19.5* 23.4*
“*” = ASTM D 6460 requires that three test replicates be performed using identical procedures to obtain an
average threshold of performance. Thus, the results of vegetated testing, being single replicates of each condition,
cannot be considered as an average threshold of performance.
C350, Triple Net Coconut Mat, over Loam
Channel Erosion Testing
May 3, 2013
Page 8
y = 0.1333x1.1345
R² = 0.9769
y = -0.0005x3 + 0.0064x2 + 0.0358xR² = 0.9903
y = 0.0015x2 + 0.0277xR² = 0.9808
0
0.1
0.2
0.3
0.4
0.5
0.6
0.7
0.00 1.00 2.00 3.00 4.00 5.00 6.00 7.00 8.00 9.00 10.00 11.00 12.00 13.00 14.00
Cu
mm
ula
tive
So
il L
oss (
CS
LI)
, in
Shear, psf
Limiting Shear via ASTM D 6460C350 @ 3.8 Staples/SY
Unvegetated Channel #1 Unvegetated Channel #2 Unvegetated Channel #3
All Unvegetated Channels C350 with 6 Weeks of Vegetation C350 with 1 Year of Vegetation
Power (All Unvegetated Channels) Poly. (C350 with 6 Weeks of Vegetation) Poly. (C350 with 1 Year of Vegetation)
Limiting Shear = 3.2 psf Limiting Shear = 8.8 psf Limiting Shear = 11.3 psf
Figure 13. Shear Stress vs. Soil Loss – Tested Product
y = 0.0017x2 + 0.0257xR² = 0.9679
y = 3E-06x3 + 0.0005x2 + 0.0142xR² = 0.9913
y = -5E-05x3 + 0.0023x2 - 0.0052xR² = 0.9993
0
0.1
0.2
0.3
0.4
0.5
0.6
0.7
0.00 2.00 4.00 6.00 8.00 10.00 12.00 14.00 16.00 18.00 20.00 22.00 24.00 26.00 28.00 30.00 32.00 34.00
Cu
mm
ula
tive
So
il L
oss (
CS
LI)
, in
Velocity, ft/sec
Limiting Velocity via ASTM D 6460C350; 3.8 Anchors/SY
Unvegetated Channel #1 Unvegetated Channel #2 Unvegetated Channel #3
All Unvegetated C350 with 6 Weeks of Vegetation C350 with 1 Year of Vegetation
Poly. (All Unvegetated) Poly. (C350 with 6 Weeks of Vegetation) Poly. (C350 with 1 Year of Vegetation)
Limiting Velocity = 11.3 ft/sec Limiting Velocity = 19.5 ft/sec Limiting Velocity = 23.4 ft/sec
Figure 14. Velocity vs. Soil Loss – Tested Product
C350, Triple Net Coconut Mat, over Loam
Channel Erosion Testing
May 3, 2013
Page 9
0
1
2
3
4
5
6
7
8
9
10
11
12
13
14
15
16
17
18
0 2 4 6 8 10 12 14 16 18 20 22 24 26 28 30 32 34 36 38 40 42 44 46 48 50 52 54 56 58 60 62 64 66
Pe
rmis
sib
le S
he
ar,
psf
Time of Vegetation Growth, weeks
Vegetation Loss vs Time of Vegetation Growth via ASTM D 6460C350 @ 3.8 Staples/SY
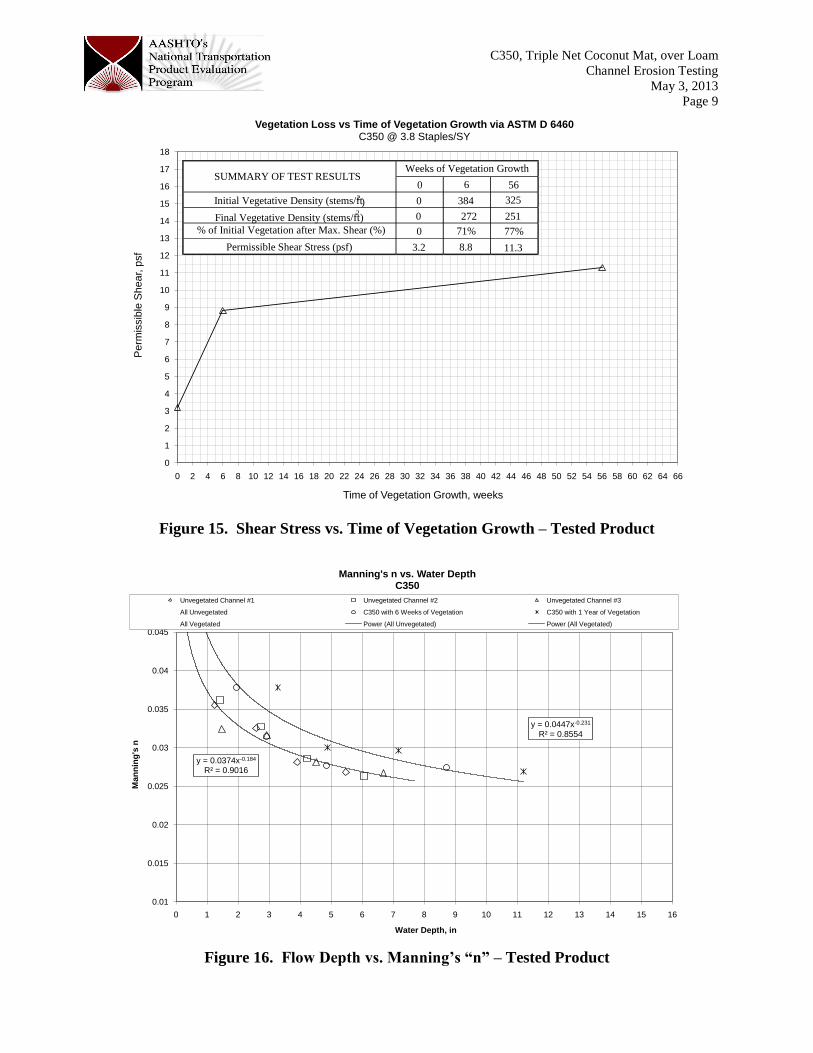
0 6 56
Initial Vegetative Density (stems/ft2) 0 384 325
Final Vegetative Density (stems/ft2) 0 272 251
% of Initial Vegetation after Max. Shear (%) 0 71% 77%
Permissible Shear Stress (psf) 3.2 8.8 11.3
SUMMARY OF TEST RESULTSWeeks of Vegetation Growth
Figure 15. Shear Stress vs. Time of Vegetation Growth – Tested Product
y = 0.0374x-0.184
R² = 0.9016
y = 0.0447x-0.231
R² = 0.8554
0.01
0.015
0.02
0.025
0.03
0.035
0.04
0.045
0 1 2 3 4 5 6 7 8 9 10 11 12 13 14 15 16
Man
nin
g's
n
Water Depth, in
Manning's n vs. Water DepthC350
Unvegetated Channel #1 Unvegetated Channel #2 Unvegetated Channel #3
All Unvegetated C350 with 6 Weeks of Vegetation C350 with 1 Year of Vegetation
All Vegetated Power (All Unvegetated) Power (All Vegetated)
Figure 16. Flow Depth vs. Manning’s “n” – Tested Product

C350, Triple Net Coconut Mat, over Loam
Channel Erosion Testing
May 3, 2013
Page 10
y = -0.0905x + 197.1 y = -0.0889x + 197.12 y = -0.0882x + 196.93
y = -0.0883x + 197.47 y = -0.0883x + 197.52 y = -0.0856x + 197.33
y = -0.0866x + 198.1 y = -0.0819x + 198.16 y = -0.0843x + 198.09
y = -0.0837x + 198.89 y = -0.0705x + 199.14 y = -0.0739x + 199.18
191
192
193
194
195
196
197
198
199
200
0 2 4 6 8 10 12 14 16 18 20
Ele
va
tio
n R
ela
tive
to
Be
nc
hm
ark
, ft
X-Section (ft along test reach)
Energy Grade Lines - All Shear LevelsC350
Shear Level 4
Shear Level 3
Shear Level 2
Shear Level 1
Channel 1 Channel 2 Channel 3
Figure 17a. Energy Grade Lines – All Channels, Unvegetated Shears – Tested Product
y = -0.21x + 199.95 y = -0.2372x + 201.49y = -0.1995x + 200.27 y = -0.2122x + 202.83y = -0.1936x + 200.92 y = -0.1469x + 204.1
y = -0.1468x + 202.27 y = 0.0213x + 207.7
y = -0.0507x + 205.03
190.00
191.00
192.00
193.00
194.00
195.00
196.00
197.00
198.00
199.00
200.00
201.00
202.00
203.00
204.00
205.00
206.00
207.00
208.00
209.00
210.00
211.00
212.00
213.00
214.00
0 2 4 6 8 10 12 14 16 18 20
Ele
va
tio
n R
ela
tiv
e t
o B
en
ch
ma
rk,
ft
X-Section (ft along test reach)
Energy Grade Lines - All Shear LevelsC350
Shear Level 4
Shear Level 3
Shear Level 2
Shear Level 1
6-wk Veg. Channel
Shear Level 5
1-yr Veg. Channel
Figure 17b. Energy Grade Lines – All Channels, Vegetated Shears – Tested Product

C350, Triple Net Coconut Mat, over Loam
Channel Erosion Testing
May 3, 2013
Page 11
y = 0.0008x3 - 0.0101x2 - 0.0096x + 1R² = 0.9996
y = 0.0003x3 - 0.0058x2 + 0.0086x + 1R² = 0.9856
0.0%
10.0%
20.0%
30.0%
40.0%
50.0%
60.0%
70.0%
80.0%
90.0%
100.0%
0.00 2.00 4.00 6.00 8.00 10.00 12.00 14.00 16.00 18.00 20.00
Pe
rcen
t o
f In
itia
l V
ege
tatio
n a
fte
r S
he
ar
Str
ess, %
Shear, psf
Vegetation Loss vs Shear via ASTM D 6460C350 @ 3.8 Staples/SY
C350 with 6 Weeks of Vegetation C350 with 1 Year of Vegetation Poly. (C350 with 6 Weeks of Vegetation) Poly. (C350 with 1 Year of Vegetation)
Initial 6-Week Vegetative Stand = 384 stems/ft2
Initial 1-Year Vegetative Stand = 325 stems/ft2
Figure 18. Vegetation vs. Shear Stress – Tested Product
y = -7.4065x3 + 22.361x2 + 4.1214xR² = 0.9998
y = -0.4876x2 + 1.3639xR² = 0.9242
y = 0.0005x3 + 0.0014x2 + 0.0185xR² = 0.9996
0.00
0.10
0.20
0.30
0.40
0.50
0.60
0.70
0.80
0.90
1.00
0.00 1.00 2.00 3.00 4.00 5.00 6.00 7.00 8.00 9.00 10.00
Cu
mm
ula
tive
So
il L
oss (
CS
LI)
, in
Shear, psf
Limiting Shear via ASTM D 6460Control Runs
Unvegetated With 6 Weeks of Vegetation With 61 Weeks of Vegetation
Poly. (Unvegetated) Poly. (With 6 Weeks of Vegetation) Poly. (With 61 Weeks of Vegetation)
Limiting Shear = 0.075 Limiting Shear = 8.0 psfLimiting Shear = 0.5 psf
Figure 19. Shear Stress vs. Soil Loss – Controls (Vegetation Only / No RECP)
C350, Triple Net Coconut Mat, over Loam
Channel Erosion Testing
May 3, 2013
Page 12
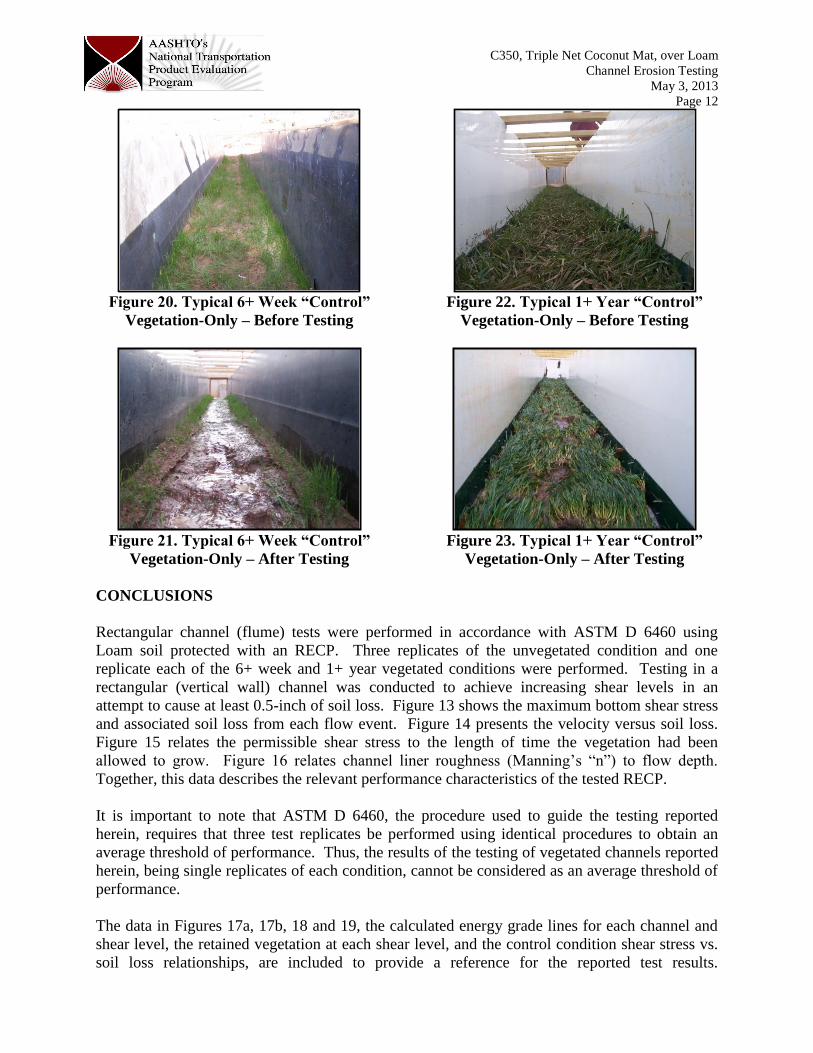
Figure 20. Typical 6+ Week “Control”
Vegetation-Only – Before Testing
Figure 21. Typical 6+ Week “Control”
Vegetation-Only – After Testing
Figure 22. Typical 1+ Year “Control”
Vegetation-Only – Before Testing
Figure 23. Typical 1+ Year “Control”
Vegetation-Only – After Testing
CONCLUSIONS
Rectangular channel (flume) tests were performed in accordance with ASTM D 6460 using
Loam soil protected with an RECP. Three replicates of the unvegetated condition and one
replicate each of the 6+ week and 1+ year vegetated conditions were performed. Testing in a
rectangular (vertical wall) channel was conducted to achieve increasing shear levels in an
attempt to cause at least 0.5-inch of soil loss. Figure 13 shows the maximum bottom shear stress
and associated soil loss from each flow event. Figure 14 presents the velocity versus soil loss.
Figure 15 relates the permissible shear stress to the length of time the vegetation had been
allowed to grow. Figure 16 relates channel liner roughness (Manning’s “n”) to flow depth.
Together, this data describes the relevant performance characteristics of the tested RECP.
It is important to note that ASTM D 6460, the procedure used to guide the testing reported
herein, requires that three test replicates be performed using identical procedures to obtain an
average threshold of performance. Thus, the results of the testing of vegetated channels reported
herein, being single replicates of each condition, cannot be considered as an average threshold of
performance.
The data in Figures 17a, 17b, 18 and 19, the calculated energy grade lines for each channel and
shear level, the retained vegetation at each shear level, and the control condition shear stress vs.
soil loss relationships, are included to provide a reference for the reported test results.

C350, Triple Net Coconut Mat, over Loam
Channel Erosion Testing
May 3, 2013
Appendix
APPENDIX A – RECORDED DATA
Test Record Sheets
(Note: Unvegetated Test Record Sheets are in a Separate Report)

2 - 1
Date: 10/25/11 Start Time: 11:30 AM End Time: 12:30 PM
Soil: Loam Target Shear (psf): 1.00 Slope: 20%
40 ft long flume 20 ft test section RECP: Anchorage:
rpms 2 ft wide flume
1 3 Outlet Weir Weir Channel Targets
Water Depth, in 5.5 1.00
Weir width (ft) = 2 Water Velocity, ft/s 0.7 3.58
0 ft A B C Flow Rate, cfs 0.0 0.6 0.0 0.60
Cross-section 1 A B C V @ 0.2d V @ 0.6d V @ 0.8d To Water Surf, cm
To original Surface Elev, cm 55.9 56.5 56.0 2.1 53.1
To eroded Surface Elev, cm 56.0 56.5 56.1 Vavg (fps) = 2.1
Soil Loss / Gain, cm -0.1 0.0 -0.1 navg = 0.069
Clopper Soil Loss, cm -0.1 0.0 -0.1 Flow (cfs) = 0.4 1.3 1.2
2 ft Avg Bottom Loss/Gain, in 0.0 Avg Clopper Soil Loss, in 0.0
Cross-section 2 A B C V @ 0.2d V @ 0.6d V @ 0.8d To Water Surf, cm
To original Surface Elev, cm 55.5 56.0 56.0 2.1 53.6
To eroded Surface Elev, cm 55.5 56.2 56.0 Vavg (fps) = 2.1
Soil Loss / Gain, cm 0.0 -0.2 0.0 navg = 0.057
Clopper Soil Loss, cm 0.0 -0.2 0.0 Flow (cfs) = 0.3 0.9 0.9
4 ft Avg Bottom Loss/Gain, in 0.0 Avg Clopper Soil Loss, in 0.0
Cross-section 3 A B C V @ 0.2d V @ 0.6d V @ 0.8d To Water Surf, cm
To original Surface Elev, cm 57.0 57.5 57.0 2.2 55.0
To eroded Surface Elev, cm 57.0 57.7 57.0 Vavg (fps) = 2.2
Soil Loss / Gain, cm 0.0 -0.2 0.0 navg = 0.053
Clopper Soil Loss, cm 0.0 -0.2 0.0 Flow (cfs) = 0.3 0.9 0.9
6 ft 25.5Avg Bottom Loss/Gain, in 0.0 Avg Clopper Soil Loss, in 0.0
Cross-section 4 A B C V @ 0.2d V @ 0.6d V @ 0.8d To Water Surf, cm
To original Surface Elev, cm 57.0 57.0 57.0 2.3 54.6
To eroded Surface Elev, cm 57.0 57.1 57.0 Vavg (fps) = 2.3
Soil Loss / Gain, cm 0.0 -0.1 0.0 navg = 0.054
Clopper Soil Loss, cm 0.0 -0.1 0.0 Flow (cfs) = 0.4 1.0 1.0
8 ft Avg Bottom Loss/Gain, in 0.0 Avg Clopper Soil Loss, in 0.0
Cross-section 5 A B C V @ 0.2d V @ 0.6d V @ 0.8d To Water Surf, cm
To original Surface Elev, cm 58.2 58.5 58.2 2.5 55.7
To eroded Surface Elev, cm 58.2 58.6 58.2 Vavg (fps) = 2.5
Soil Loss / Gain, cm 0.0 -0.1 0.0 navg = 0.052
Clopper Soil Loss, cm 0.0 -0.1 0.0 Flow (cfs) = 0.4 1.1 1.0
10 ft Avg Bottom Loss/Gain, in 0.0 Avg Clopper Soil Loss, in 0.0
Cross-section 6 A B C V @ 0.2d V @ 0.6d V @ 0.8d To Water Surf, cm
To original Surface Elev, cm 58.9 60.0 58.9 2.6 57.0
To eroded Surface Elev, cm 59.0 60.1 59.0 Vavg (fps) = 2.6
Soil Loss / Gain, cm -0.1 -0.1 -0.1 navg = 0.047
Clopper Soil Loss, cm -0.1 -0.1 -0.1 Flow (cfs) = 0.4 1.0 0.9
12 ft Avg Bottom Loss/Gain, in 0.0 Avg Clopper Soil Loss, in 0.0
Cross-section 7 A B C V @ 0.2d V @ 0.6d V @ 0.8d To Water Surf, cm
To original Surface Elev, cm 58.5 59.0 58.5 2.6 56.5
To eroded Surface Elev, cm 58.5 59.0 58.7 Vavg (fps) = 2.6
Soil Loss / Gain, cm 0.0 0.0 -0.2 navg = 0.045
Clopper Soil Loss, cm 0.0 0.0 -0.2 Flow (cfs) = 0.4 0.9 0.9
14 ft Avg Bottom Loss/Gain, in 0.0 Avg Clopper Soil Loss, in 0.0
Cross-section 8 A B C V @ 0.2d V @ 0.6d V @ 0.8d To Water Surf, cm
To original Surface Elev, cm 61.5 62.0 61.5 2.7 59.7
To eroded Surface Elev, cm 61.5 62.2 61.8 Vavg (fps) = 2.7
Soil Loss / Gain, cm 0.0 -0.2 -0.3 navg = 0.042
Clopper Soil Loss, cm 0.0 -0.2 -0.3 Flow (cfs) = 0.4 0.9 0.8
16 ft Avg Bottom Loss/Gain, in -0.1 Avg Clopper Soil Loss, in -0.1
Cross-section 9 A B C V @ 0.2d V @ 0.6d V @ 0.8d To Water Surf, cm
To original Surface Elev, cm 65.0 65.4 65.5 2.8 63.2
To eroded Surface Elev, cm 65.2 65.5 65.5 Vavg (fps) = 2.8
Soil Loss / Gain, cm -0.2 -0.1 0.0 navg = 0.041
Clopper Soil Loss, cm -0.2 -0.1 0.0 Flow (cfs) = 0.4 0.9 0.9
18 ft Avg Bottom Loss/Gain, in 0.0 Avg Clopper Soil Loss, in 0.0
Cross-section 10 A B C V @ 0.2d V @ 0.6d V @ 0.8d To Water Surf, cm
To original Surface Elev, cm 63.5 64.1 64.1 3.0 62.0
To eroded Surface Elev, cm 63.5 64.5 64.5 Vavg (fps) = 3.0
Soil Loss / Gain, cm 0.0 -0.4 -0.4 navg = 0.038
Clopper Soil Loss, cm 0.0 -0.4 -0.4 Flow (cfs) = 0.4 0.9 0.9
20 ft Avg Bottom Loss/Gain, in -0.1 Avg Clopper Soil Loss, in -0.1
Cross-section 11 A B C V @ 0.2d V @ 0.6d V @ 0.8d To Water Surf, cm
To original Surface Elev, cm 62.0 63.0 63.0 3.0 60.9
To eroded Surface Elev, cm 62.0 63.0 63.0 Vavg (fps) = 3.0
Soil Loss / Gain, cm 0.0 0.0 0.0 navg = 0.033
Clopper Soil Loss, cm 0.0 0.0 0.0 Flow (cfs) = 0.3 0.7 0.7
Avg Bottom Loss/Gain, in 0.0 Avg Clopper Soil Loss, in 0.0
Soil Loss / Gain, in 0.0 -0.1 0.0 Avg Bottom Loss/Gain per Cross-Section = 0.0
Clopper Soil Loss, in 0.0 -0.1 0.0 Avg Clopper Soil Loss per Cross-Section = 0.0
Bed Max Shear
Stress (psf) Water Depth (in)
CHANNEL 2 - SHEAR STRESS 1
TEST DATA
FLOW
2
C350 3.8 pins / sy
Bed Max Shear
Stress (psf) Water Depth (in)
Bed Max Shear
Stress (psf)
Water Depth (in)
Bed Max Shear
Stress (psf) Water Depth (in)
Bed Max Shear
Stress (psf)
Bed Max Shear
Stress (psf) Water Depth (in)
Bed Max Shear
Stress (psf)
Bed Max Shear
Stress (psf) Water Depth (in)
Water Depth (in)
Water Depth (in)
Bed Max Shear
Stress (psf) Water Depth (in)
Bed Max Shear
Stress (psf) Water Depth (in)
Bed Max Shear
Stress (psf) Water Depth (in)
2 - 2
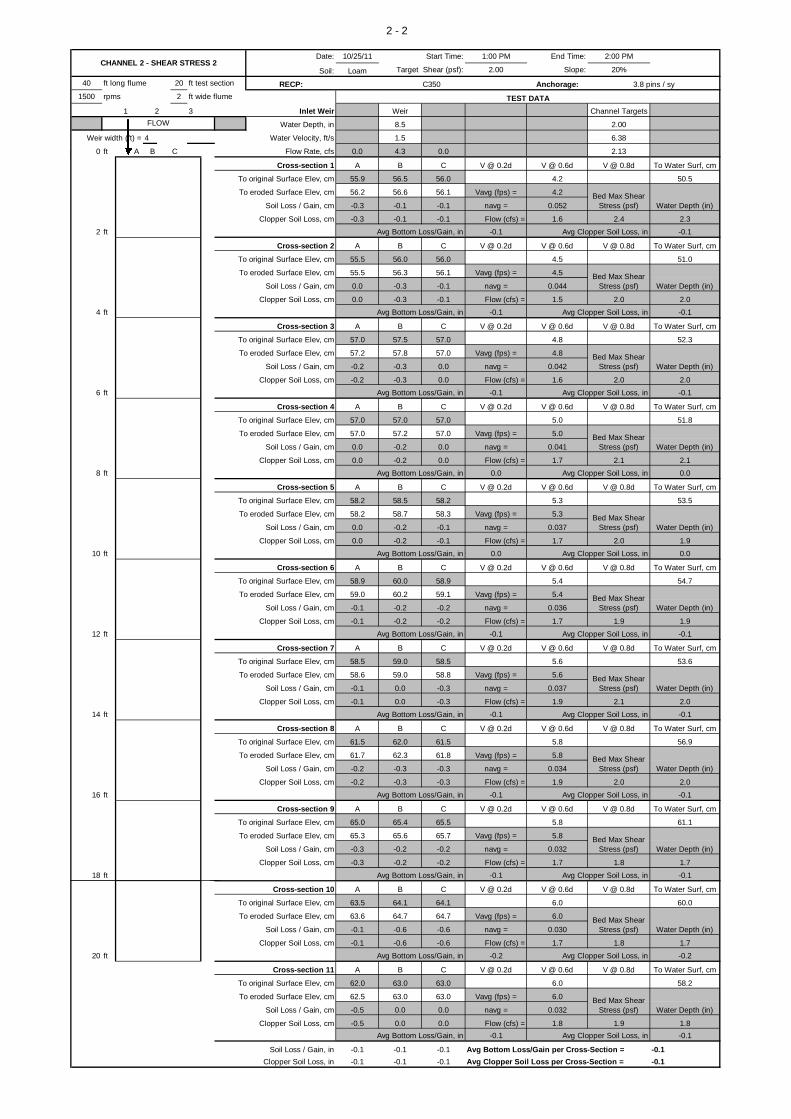
Date: 10/25/11 Start Time: 1:00 PM End Time: 2:00 PM
Soil: Loam Target Shear (psf): 2.00 Slope: 20%
40 ft long flume 20 ft test section RECP: Anchorage:
1500 rpms 2 ft wide flume
1 3 Inlet Weir Weir Channel Targets
Water Depth, in 8.5 2.00
Weir width (ft) = 4 Water Velocity, ft/s 1.5 6.38
0 ft A B C Flow Rate, cfs 0.0 4.3 0.0 2.13
Cross-section 1 A B C V @ 0.2d V @ 0.6d V @ 0.8d To Water Surf, cm
To original Surface Elev, cm 55.9 56.5 56.0 4.2 50.5
To eroded Surface Elev, cm 56.2 56.6 56.1 Vavg (fps) = 4.2
Soil Loss / Gain, cm -0.3 -0.1 -0.1 navg = 0.052
Clopper Soil Loss, cm -0.3 -0.1 -0.1 Flow (cfs) = 1.6 2.4 2.3
2 ft Avg Bottom Loss/Gain, in -0.1 Avg Clopper Soil Loss, in -0.1
Cross-section 2 A B C V @ 0.2d V @ 0.6d V @ 0.8d To Water Surf, cm
To original Surface Elev, cm 55.5 56.0 56.0 4.5 51.0
To eroded Surface Elev, cm 55.5 56.3 56.1 Vavg (fps) = 4.5
Soil Loss / Gain, cm 0.0 -0.3 -0.1 navg = 0.044
Clopper Soil Loss, cm 0.0 -0.3 -0.1 Flow (cfs) = 1.5 2.0 2.0
4 ft Avg Bottom Loss/Gain, in -0.1 Avg Clopper Soil Loss, in -0.1
Cross-section 3 A B C V @ 0.2d V @ 0.6d V @ 0.8d To Water Surf, cm
To original Surface Elev, cm 57.0 57.5 57.0 4.8 52.3
To eroded Surface Elev, cm 57.2 57.8 57.0 Vavg (fps) = 4.8
Soil Loss / Gain, cm -0.2 -0.3 0.0 navg = 0.042
Clopper Soil Loss, cm -0.2 -0.3 0.0 Flow (cfs) = 1.6 2.0 2.0
6 ft Avg Bottom Loss/Gain, in -0.1 Avg Clopper Soil Loss, in -0.1
Cross-section 4 A B C V @ 0.2d V @ 0.6d V @ 0.8d To Water Surf, cm
To original Surface Elev, cm 57.0 57.0 57.0 5.0 51.8
To eroded Surface Elev, cm 57.0 57.2 57.0 Vavg (fps) = 5.0
Soil Loss / Gain, cm 0.0 -0.2 0.0 navg = 0.041
Clopper Soil Loss, cm 0.0 -0.2 0.0 Flow (cfs) = 1.7 2.1 2.1
8 ft Avg Bottom Loss/Gain, in 0.0 Avg Clopper Soil Loss, in 0.0
Cross-section 5 A B C V @ 0.2d V @ 0.6d V @ 0.8d To Water Surf, cm
To original Surface Elev, cm 58.2 58.5 58.2 5.3 53.5
To eroded Surface Elev, cm 58.2 58.7 58.3 Vavg (fps) = 5.3
Soil Loss / Gain, cm 0.0 -0.2 -0.1 navg = 0.037
Clopper Soil Loss, cm 0.0 -0.2 -0.1 Flow (cfs) = 1.7 2.0 1.9
10 ft Avg Bottom Loss/Gain, in 0.0 Avg Clopper Soil Loss, in 0.0
Cross-section 6 A B C V @ 0.2d V @ 0.6d V @ 0.8d To Water Surf, cm
To original Surface Elev, cm 58.9 60.0 58.9 5.4 54.7
To eroded Surface Elev, cm 59.0 60.2 59.1 Vavg (fps) = 5.4
Soil Loss / Gain, cm -0.1 -0.2 -0.2 navg = 0.036
Clopper Soil Loss, cm -0.1 -0.2 -0.2 Flow (cfs) = 1.7 1.9 1.9
12 ft Avg Bottom Loss/Gain, in -0.1 Avg Clopper Soil Loss, in -0.1
Cross-section 7 A B C V @ 0.2d V @ 0.6d V @ 0.8d To Water Surf, cm
To original Surface Elev, cm 58.5 59.0 58.5 5.6 53.6
To eroded Surface Elev, cm 58.6 59.0 58.8 Vavg (fps) = 5.6
Soil Loss / Gain, cm -0.1 0.0 -0.3 navg = 0.037
Clopper Soil Loss, cm -0.1 0.0 -0.3 Flow (cfs) = 1.9 2.1 2.0
14 ft Avg Bottom Loss/Gain, in -0.1 Avg Clopper Soil Loss, in -0.1
Cross-section 8 A B C V @ 0.2d V @ 0.6d V @ 0.8d To Water Surf, cm
To original Surface Elev, cm 61.5 62.0 61.5 5.8 56.9
To eroded Surface Elev, cm 61.7 62.3 61.8 Vavg (fps) = 5.8
Soil Loss / Gain, cm -0.2 -0.3 -0.3 navg = 0.034
Clopper Soil Loss, cm -0.2 -0.3 -0.3 Flow (cfs) = 1.9 2.0 2.0
16 ft Avg Bottom Loss/Gain, in -0.1 Avg Clopper Soil Loss, in -0.1
Cross-section 9 A B C V @ 0.2d V @ 0.6d V @ 0.8d To Water Surf, cm
To original Surface Elev, cm 65.0 65.4 65.5 5.8 61.1
To eroded Surface Elev, cm 65.3 65.6 65.7 Vavg (fps) = 5.8
Soil Loss / Gain, cm -0.3 -0.2 -0.2 navg = 0.032
Clopper Soil Loss, cm -0.3 -0.2 -0.2 Flow (cfs) = 1.7 1.8 1.7
18 ft Avg Bottom Loss/Gain, in -0.1 Avg Clopper Soil Loss, in -0.1
Cross-section 10 A B C V @ 0.2d V @ 0.6d V @ 0.8d To Water Surf, cm
To original Surface Elev, cm 63.5 64.1 64.1 6.0 60.0
To eroded Surface Elev, cm 63.6 64.7 64.7 Vavg (fps) = 6.0
Soil Loss / Gain, cm -0.1 -0.6 -0.6 navg = 0.030
Clopper Soil Loss, cm -0.1 -0.6 -0.6 Flow (cfs) = 1.7 1.8 1.7
20 ft Avg Bottom Loss/Gain, in -0.2 Avg Clopper Soil Loss, in -0.2
Cross-section 11 A B C V @ 0.2d V @ 0.6d V @ 0.8d To Water Surf, cm
To original Surface Elev, cm 62.0 63.0 63.0 6.0 58.2
To eroded Surface Elev, cm 62.5 63.0 63.0 Vavg (fps) = 6.0
Soil Loss / Gain, cm -0.5 0.0 0.0 navg = 0.032
Clopper Soil Loss, cm -0.5 0.0 0.0 Flow (cfs) = 1.8 1.9 1.8
Avg Bottom Loss/Gain, in -0.1 Avg Clopper Soil Loss, in -0.1
Soil Loss / Gain, in -0.1 -0.1 -0.1 Avg Bottom Loss/Gain per Cross-Section = -0.1
Clopper Soil Loss, in -0.1 -0.1 -0.1 Avg Clopper Soil Loss per Cross-Section = -0.1
Water Depth (in)
Bed Max Shear
Stress (psf) Water Depth (in)
Bed Max Shear
Stress (psf) Water Depth (in)
Bed Max Shear
Stress (psf)
Water Depth (in)
Water Depth (in)
Bed Max Shear
Stress (psf) Water Depth (in)
Bed Max Shear
Stress (psf)
Bed Max Shear
Stress (psf)
Water Depth (in)
Bed Max Shear
Stress (psf) Water Depth (in)
Bed Max Shear
Stress (psf)
CHANNEL 2 - SHEAR STRESS 2
TEST DATA
C350 3.8 pins / sy
FLOW
2
Bed Max Shear
Stress (psf) Water Depth (in)
Bed Max Shear
Stress (psf) Water Depth (in)
Bed Max Shear
Stress (psf) Water Depth (in)

2 - 3
Date: 10/25/11 Start Time: 3:00 PM End Time: 4:00 PM
Soil: Loam Target Shear (psf): 3.00 Slope: 20%
40 ft long flume 20 ft test section RECP: Anchorage:
rpms 2 ft wide flume
1 3 Inlet Weir Weir Channel Targets
Water Depth, in 12.5 3.00
Weir width (ft) = 2 Water Velocity, ft/s 2.3 9.38
0 ft A B C Flow Rate, cfs 0.0 4.7 0.0 4.69
Cross-section 1 A B C V @ 0.2d V @ 0.6d To Water Surf, cm
To original Surface Elev, cm 55.9 56.5 56.0 7.5 47.9
To eroded Surface Elev, cm 56.5 56.7 56.5 Vavg (fps) = 7.5
Soil Loss / Gain, cm -0.6 -0.2 -0.5 navg = 0.038
Clopper Soil Loss, cm -0.6 -0.2 -0.5 Flow (cfs) = 4.3 3.5 3.4
2 ft Avg Bottom Loss/Gain, in -0.2 Avg Clopper Soil Loss, in -0.2
Cross-section 2 A B C V @ 0.2d V @ 0.6d V @ 0.8d To Water Surf, cm
To original Surface Elev, cm 55.5 56.0 56.0 7.6 48.6
To eroded Surface Elev, cm 55.6 56.5 56.5 Vavg (fps) = 7.6
Soil Loss / Gain, cm -0.1 -0.5 -0.5 navg = 0.035
Clopper Soil Loss, cm -0.1 -0.5 -0.5 Flow (cfs) = 3.8 3.1 3.0
4 ft Avg Bottom Loss/Gain, in -0.1 Avg Clopper Soil Loss, in -0.1
Cross-section 3 A B C V @ 0.2d V @ 0.6d V @ 0.8d To Water Surf, cm
To original Surface Elev, cm 57.0 57.5 57.0 7.8 50.3
To eroded Surface Elev, cm 57.4 58.0 57.5 Vavg (fps) = 7.8
Soil Loss / Gain, cm -0.4 -0.5 -0.5 navg = 0.033
Clopper Soil Loss, cm -0.4 -0.5 -0.5 Flow (cfs) = 3.8 3.0 2.9
6 ft Avg Bottom Loss/Gain, in -0.2 Avg Clopper Soil Loss, in -0.2
Cross-section 4 A B C V @ 0.2d V @ 0.6d V @ 0.8d To Water Surf, cm
To original Surface Elev, cm 57.0 57.0 57.0 8.0 50.2
To eroded Surface Elev, cm 57.2 57.7 57.3 Vavg (fps) = 8.0
Soil Loss / Gain, cm -0.2 -0.7 -0.3 navg = 0.032
Clopper Soil Loss, cm -0.2 -0.7 -0.3 Flow (cfs) = 3.8 2.9 2.8
8 ft Avg Bottom Loss/Gain, in -0.2 Avg Clopper Soil Loss, in -0.2
Cross-section 5 A B C V @ 0.2d V @ 0.6d V @ 0.8d To Water Surf, cm
To original Surface Elev, cm 58.2 58.5 58.2 8.0 51.4
To eroded Surface Elev, cm 58.5 59.2 58.5 Vavg (fps) = 8.0
Soil Loss / Gain, cm -0.3 -0.7 -0.3 navg = 0.032
Clopper Soil Loss, cm -0.3 -0.7 -0.3 Flow (cfs) = 3.8 3.0 2.9
10 ft Avg Bottom Loss/Gain, in -0.2 Avg Clopper Soil Loss, in -0.2
Cross-section 6 A B C V @ 0.2d V @ 0.6d V @ 0.8d To Water Surf, cm
To original Surface Elev, cm 58.9 60.0 58.9 8.3 52.1
To eroded Surface Elev, cm 59.2 60.5 59.1 Vavg (fps) = 8.3
Soil Loss / Gain, cm -0.3 -0.5 -0.2 navg = 0.031
Clopper Soil Loss, cm -0.3 -0.5 -0.2 Flow (cfs) = 4.1 3.1 3.0
12 ft Avg Bottom Loss/Gain, in -0.1 Avg Clopper Soil Loss, in -0.1
Cross-section 7 A B C V @ 0.2d V @ 0.6d V @ 0.8d To Water Surf, cm
To original Surface Elev, cm 58.5 59.0 58.5 8.4 52.2
To eroded Surface Elev, cm 59.1 59.3 59.3 Vavg (fps) = 8.4
Soil Loss / Gain, cm -0.6 -0.3 -0.8 navg = 0.0
Clopper Soil Loss, cm -0.6 -0.3 -0.8 Flow (cfs) = 3.9 2.9 2.8
14 ft Avg Bottom Loss/Gain, in -0.2 Avg Clopper Soil Loss, in -0.2
Cross-section 8 A B C V @ 0.2d V @ 0.6d V @ 0.8d To Water Surf, cm
To original Surface Elev, cm 61.5 62.0 61.5 8.6 54.8
To eroded Surface Elev, cm 62.0 62.5 62.0 Vavg (fps) = 8.6
Soil Loss / Gain, cm -0.5 -0.5 -0.5 navg = 0.030
Clopper Soil Loss, cm -0.5 -0.5 -0.5 Flow (cfs) = 4.2 3.0 2.9
16 ft Avg Bottom Loss/Gain, in -0.2 Avg Clopper Soil Loss, in -0.2
Cross-section 9 A B C V @ 0.2d V @ 0.6d V @ 0.8d To Water Surf, cm
To original Surface Elev, cm 65.0 65.4 65.5 8.8 58.2
To eroded Surface Elev, cm 65.5 66.0 66.0 Vavg (fps) = 8.8
Soil Loss / Gain, cm -0.5 -0.6 -0.5 navg = 0.030
Clopper Soil Loss, cm -0.5 -0.6 -0.5 Flow (cfs) = 4.4 3.1 3.0
18 ft Avg Bottom Loss/Gain, in -0.2 Avg Clopper Soil Loss, in -0.2
Cross-section 10 A B C V @ 0.2d V @ 0.6d V @ 0.8d To Water Surf, cm
To original Surface Elev, cm 63.5 64.1 64.1 9.0 57.3
To eroded Surface Elev, cm 63.8 65.0 65.0 Vavg (fps) = 9.0
Soil Loss / Gain, cm -0.3 -0.9 -0.9 navg = 0.028
Clopper Soil Loss, cm -0.3 -0.9 -0.9 Flow (cfs) = 4.3 3.0 2.9
20 ft Avg Bottom Loss/Gain, in -0.3 Avg Clopper Soil Loss, in -0.3
Cross-section 11 A B C V @ 0.2d V @ 0.6d V @ 0.8d To Water Surf, cm
To original Surface Elev, cm 62.0 63.0 63.0 9.0 56.5
To eroded Surface Elev, cm 62.6 63.4 63.1 Vavg (fps) = 9.0
Soil Loss / Gain, cm -0.6 -0.4 -0.1 navg = 0.026
Clopper Soil Loss, cm -0.6 -0.4 -0.1 Flow (cfs) = 3.9 2.7 2.6
Avg Bottom Loss/Gain, in -0.1 Avg Clopper Soil Loss, in -0.1
Soil Loss / Gain, in -0.2 -0.2 -0.2 Avg Bottom Loss/Gain per Cross-Section = -0.2
Clopper Soil Loss, in -0.2 -0.2 -0.2 Avg Clopper Soil Loss per Cross-Section = -0.2
Bed Max Shear
Stress (psf)
Bed Max Shear
Stress (psf)
Bed Max Shear
Stress (psf)
Water Depth (in)
Water Depth (in)
Water Depth (in)
Bed Max Shear
Stress (psf) Water Depth (in)
CHANNEL 2 - SHEAR STRESS 3
TEST DATA
FLOW
2
C350 3.8 pins / sy
Bed Max Shear
Stress (psf) Water Depth (in)
Bed Max Shear
Stress (psf) Water Depth (in)
Bed Max Shear
Stress (psf) Water Depth (in)
Bed Max Shear
Stress (psf) Water Depth (in)
Bed Max Shear
Stress (psf) Water Depth (in)
Bed Max Shear
Stress (psf) Water Depth (in)
Bed Max Shear
Stress (psf) Water Depth (in)

2 - 4
Date: 10/26/11 Start Time: 9:00 AM End Time: 10:00 AM
Soil: Loam Target Shear (psf): 5.00 Slope: 20%
40 ft long flume 20 ft test section RECP: Anchorage:
rpms 2 ft wide flume
1 3 Inlet Weir Weir Channel Targets
Water Depth, in 0.0 5.00
Weir width (ft) = 2 C = Water Velocity, ft/s 0.0 0.00
0 ft A B C Flow Rate, cfs 0.0 0.0 0.0 0.00
Cross-section 1 A B C V @ 0.2d V @ 0.6d V @ 0.8d To Water Surf, cm
To original Surface Elev, cm 55.9 56.5 56.0 11.3 43.0
To eroded Surface Elev, cm 56.6 56.7 56.6 Vavg (fps) = 11.3
Soil Loss / Gain, cm -0.7 -0.2 -0.6 navg = 0.034
Clopper Soil Loss, cm -0.7 -0.2 -0.6 Flow (cfs) = 10.1 5.5 5.4
2 ft Avg Bottom Loss/Gain, in -0.2 Avg Clopper Soil Loss, in -0.2
Cross-section 2 A B C V @ 0.2d V @ 0.6d V @ 0.8d To Water Surf, cm
To original Surface Elev, cm 55.5 56.0 56.0 11.8 44.6
To eroded Surface Elev, cm 55.6 56.8 56.8 Vavg (fps) = 11.8
Soil Loss / Gain, cm -0.1 -0.8 -0.8 navg = 0.030
Clopper Soil Loss, cm -0.1 -0.8 -0.8 Flow (cfs) = 9.1 4.8 4.6
4 ft Avg Bottom Loss/Gain, in -0.2 Avg Clopper Soil Loss, in -0.2
Cross-section 3 A B C V @ 0.2d V @ 0.6d V @ 0.8d To Water Surf, cm
To original Surface Elev, cm 57.0 57.5 57.0 12.2 45.3
To eroded Surface Elev, cm 56.9 58.3 58.4 Vavg (fps) = 12.2
Soil Loss / Gain, cm 0.1 -0.8 -1.4 navg = 0.030
Clopper Soil Loss, cm 0.0 -0.8 -1.4 Flow (cfs) = 10.1 5.1 4.9
6 ft Avg Bottom Loss/Gain, in -0.3 Avg Clopper Soil Loss, in -0.3
Cross-section 4 A B C V @ 0.2d V @ 0.6d V @ 0.8d To Water Surf, cm
To original Surface Elev, cm 57.0 57.0 57.0 12.6 45.5
To eroded Surface Elev, cm 57.5 58.0 57.7 Vavg (fps) = 12.6
Soil Loss / Gain, cm -0.5 -1.0 -0.7 navg = 0.029
Clopper Soil Loss, cm -0.5 -1.0 -0.7 Flow (cfs) = 10.1 5.0 4.8
8 ft Avg Bottom Loss/Gain, in -0.3 Avg Clopper Soil Loss, in -0.3
Cross-section 5 A B C V @ 0.2d V @ 0.6d V @ 0.8d To Water Surf, cm
To original Surface Elev, cm 58.2 58.5 58.2 13.0 46.4
To eroded Surface Elev, cm 58.8 59.2 58.8 Vavg (fps) = 13.0
Soil Loss / Gain, cm -0.6 -0.7 -0.6 navg = 0.028
Clopper Soil Loss, cm -0.6 -0.7 -0.6 Flow (cfs) = 10.7 5.1 4.9
10 ft Avg Bottom Loss/Gain, in -0.2 Avg Clopper Soil Loss, in -0.2
Cross-section 6 A B C V @ 0.2d V @ 0.6d V @ 0.8d To Water Surf, cm
To original Surface Elev, cm 58.9 60.0 58.9 13.4 47.9
To eroded Surface Elev, cm 59.2 61.0 59.5 Vavg (fps) = 13.4
Soil Loss / Gain, cm -0.3 -1.0 -0.6 navg = 0.027
Clopper Soil Loss, cm -0.3 -1.0 -0.6 Flow (cfs) = 10.6 4.9 4.7
12 ft Avg Bottom Loss/Gain, in -0.2 Avg Clopper Soil Loss, in -0.2
Cross-section 7 A B C V @ 0.2d V @ 0.6d V @ 0.8d To Water Surf, cm
To original Surface Elev, cm 58.5 59.0 58.5 13.8 47.5
To eroded Surface Elev, cm 59.2 60.0 59.5 Vavg (fps) = 13.8
Soil Loss / Gain, cm -0.7 -1.0 -1.0 navg = 0.026
Clopper Soil Loss, cm -0.7 -1.0 -1.0 Flow (cfs) = 10.9 4.9 4.8
14 ft Avg Bottom Loss/Gain, in -0.4 Avg Clopper Soil Loss, in -0.4
Cross-section 8 A B C V @ 0.2d V @ 0.6d V @ 0.8d To Water Surf, cm
To original Surface Elev, cm 61.5 62.0 61.5 14.0 50.2
To eroded Surface Elev, cm 62.0 62.8 62.5 Vavg (fps) = 14.0
Soil Loss / Gain, cm -0.5 -0.8 -1.0 navg = 0.026
Clopper Soil Loss, cm -0.5 -0.8 -1.0 Flow (cfs) = 11.2 5.0 4.8
16 ft Avg Bottom Loss/Gain, in -0.3 Avg Clopper Soil Loss, in -0.3
Cross-section 9 A B C V @ 0.2d V @ 0.6d V @ 0.8d To Water Surf, cm
To original Surface Elev, cm 65.0 65.4 65.5 14.2 54.0
To eroded Surface Elev, cm 65.8 66.3 66.4 Vavg (fps) = 14.2
Soil Loss / Gain, cm -0.8 -0.9 -0.9 navg = 0.025
Clopper Soil Loss, cm -0.8 -0.9 -0.9 Flow (cfs) = 11.3 4.9 4.8
18 ft Avg Bottom Loss/Gain, in -0.3 Avg Clopper Soil Loss, in -0.3
Cross-section 10 A B C V @ 0.2d V @ 0.6d V @ 0.8d To Water Surf, cm
To original Surface Elev, cm 63.5 64.1 64.1 14.5 52.4
To eroded Surface Elev, cm 64.0 65.3 64.9 Vavg (fps) = 14.5
Soil Loss / Gain, cm -0.5 -1.2 -0.8 navg = 0.025
Clopper Soil Loss, cm -0.5 -1.2 -0.8 Flow (cfs) = 11.7 5.0 4.9
20 ft Avg Bottom Loss/Gain, in -0.3 Avg Clopper Soil Loss, in -0.3
Cross-section 11 A B C V @ 0.2d V @ 0.6d V @ 0.8d To Water Surf, cm
To original Surface Elev, cm 62.0 63.0 63.0 14.5 51.4
To eroded Surface Elev, cm 62.7 63.5 63.2 Vavg (fps) = 14.5
Soil Loss / Gain, cm -0.7 -0.5 -0.2 navg = 0.024
Clopper Soil Loss, cm -0.7 -0.5 -0.2 Flow (cfs) = 11.2 4.8 4.6
Avg Bottom Loss/Gain, in -0.2 Avg Clopper Soil Loss, in -0.2
Soil Loss / Gain, in -0.2 -0.3 -0.3 Avg Bottom Loss/Gain per Cross-Section = -0.3
Clopper Soil Loss, in -0.2 -0.3 -0.3 Avg Clopper Soil Loss per Cross-Section = -0.3
Water Depth (in)
Bed Max Shear
Stress (psf) Water Depth (in)
Bed Max Shear
Stress (psf) Water Depth (in)
Bed Max Shear
Stress (psf)
Water Depth (in)
Water Depth (in)
Bed Max Shear
Stress (psf) Water Depth (in)
Bed Max Shear
Stress (psf)
Bed Max Shear
Stress (psf)
Water Depth (in)
Bed Max Shear
Stress (psf) Water Depth (in)
Bed Max Shear
Stress (psf)
CHANNEL 2 - SHEAR STRESS 4
TEST DATA
0.00
C350 3.8 pins / sy
FLOW
2
Bed Max Shear
Stress (psf) Water Depth (in)
Bed Max Shear
Stress (psf) Water Depth (in)
Bed Max Shear
Stress (psf) Water Depth (in)

2 - 5
Date: 10/26/11 Start Time: 9:00 AM End Time: 10:00 AM
Soil: Loam Target Shear (psf): 10.00 Slope: 20%
40 ft long flume 20 ft test section RECP: Anchorage:
rpms 2 ft wide flume
1 3 Inlet Weir Weir Channel Targets
Water Depth, in 0.00 10.00
Weir width (ft) = 2 C = Water Velocity, ft/s 0.00 0.00
0 ft A B C Flow Rate, cfs 0.00 0.00 0.00 0.00
Cross-section 1 A B C V @ 0.2d V @ 0.6d V @ 0.8d To Water Surf, cm
To original Surface Elev, cm 55.9 56.5 56 17 33.5
To eroded Surface Elev, cm 56.7 56.9 56.6 Vavg (fps) = 17.00
Soil Loss / Gain, cm -0.8 -0.4 -0.6 navg = 0.033
Clopper Soil Loss, cm -0.8 -0.4 -0.6 Flow (cfs) = 25.92 9.45 9.15
2 ft Avg Bottom Loss/Gain, in -0.24 Avg Clopper Soil Loss, in -0.24
Cross-section 2 A B C V @ 0.2d V @ 0.6d V @ 0.8d To Water Surf, cm
To original Surface Elev, cm 55.5 56 56 17.5 35.1
To eroded Surface Elev, cm 56.6 57.6 57.7 Vavg (fps) = 17.50
Soil Loss / Gain, cm -1.1 -1.6 -1.7 navg = 0.031
Clopper Soil Loss, cm -1.1 -1.6 -1.7 Flow (cfs) = 25.49 9.03 8.74
4 ft Avg Bottom Loss/Gain, in -0.58 Avg Clopper Soil Loss, in -0.58
Cross-section 3 A B C V @ 0.2d V @ 0.6d V @ 0.8d To Water Surf, cm
To original Surface Elev, cm 57 57.5 57 18 35.6
To eroded Surface Elev, cm 57.2 58.6 60 Vavg (fps) = 18.00
Soil Loss / Gain, cm -0.2 -1.1 -3 navg = 0.031
Clopper Soil Loss, cm -0.2 -1.1 -3 Flow (cfs) = 27.17 9.35 9.06
6 ft Avg Bottom Loss/Gain, in -0.56 Avg Clopper Soil Loss, in -0.56
Cross-section 4 A B C V @ 0.2d V @ 0.6d V @ 0.8d To Water Surf, cm
To original Surface Elev, cm 57 57 57 18.6 36.1
To eroded Surface Elev, cm 58.1 58.2 58.5 Vavg (fps) = 18.60
Soil Loss / Gain, cm -1.1 -1.2 -1.5 navg = 0.029
Clopper Soil Loss, cm -1.1 -1.2 -1.5 Flow (cfs) = 27.05 9.02 8.73
8 ft Avg Bottom Loss/Gain, in -0.50 Avg Clopper Soil Loss, in -0.50
Cross-section 5 A B C V @ 0.2d V @ 0.6d V @ 0.8d To Water Surf, cm
To original Surface Elev, cm 58.2 58.5 58.2 19.3 37.1
To eroded Surface Elev, cm 59.4 59.8 59.4 Vavg (fps) = 19.30
Soil Loss / Gain, cm -1.2 -1.3 -1.2 navg = 0.028
Clopper Soil Loss, cm -1.2 -1.3 -1.2 Flow (cfs) = 28.41 9.12 8.83
10 ft Avg Bottom Loss/Gain, in -0.49 Avg Clopper Soil Loss, in -0.49
Cross-section 6 A B C V @ 0.2d V @ 0.6d V @ 0.8d To Water Surf, cm
To original Surface Elev, cm 58.9 60 58.9 20 38.9
To eroded Surface Elev, cm 59.5 61.5 61 Vavg (fps) = 20.00
Soil Loss / Gain, cm -0.6 -1.5 -2.1 navg = 0.027
Clopper Soil Loss, cm -0.6 -1.5 -2.1 Flow (cfs) = 28.57 8.85 8.57
12 ft Avg Bottom Loss/Gain, in -0.55 Avg Clopper Soil Loss, in -0.55
Cross-section 7 A B C V @ 0.2d V @ 0.6d V @ 0.8d To Water Surf, cm
To original Surface Elev, cm 58.5 59 58.5 20.8 38.0
To eroded Surface Elev, cm 59.6 60.5 60 Vavg (fps) = 20.80
Soil Loss / Gain, cm -1.1 -1.5 -1.5 navg = 0.026
Clopper Soil Loss, cm -1.1 -1.5 -1.5 Flow (cfs) = 30.07 8.96 8.67
14 ft Avg Bottom Loss/Gain, in -0.54 Avg Clopper Soil Loss, in -0.54
Cross-section 8 A B C V @ 0.2d V @ 0.6d V @ 0.8d To Water Surf, cm
To original Surface Elev, cm 61.5 62 61.5 21.1 41.6
To eroded Surface Elev, cm 62.6 63.5 63.2 Vavg (fps) = 21.10
Soil Loss / Gain, cm -1.1 -1.5 -1.7 navg = 0.025
Clopper Soil Loss, cm -1.1 -1.5 -1.7 Flow (cfs) = 29.77 8.74 8.46
16 ft Avg Bottom Loss/Gain, in -0.56 Avg Clopper Soil Loss, in -0.56
Cross-section 9 A B C V @ 0.2d V @ 0.6d V @ 0.8d To Water Surf, cm
To original Surface Elev, cm 65 65.4 65.5 21.5 44.6
To eroded Surface Elev, cm 66.3 67.1 66.9 Vavg (fps) = 21.50
Soil Loss / Gain, cm -1.3 -1.7 -1.4 navg = 0.025
Clopper Soil Loss, cm -1.3 -1.7 -1.4 Flow (cfs) = 31.27 9.02 8.73
18 ft Avg Bottom Loss/Gain, in -0.58 Avg Clopper Soil Loss, in -0.58
Cross-section 10 A B C V @ 0.2d V @ 0.6d V @ 0.8d To Water Surf, cm
To original Surface Elev, cm 63.5 64.1 64.1 21.8 43.9
To eroded Surface Elev, cm 64.5 66.7 65.6 Vavg (fps) = 21.80
Soil Loss / Gain, cm -1 -2.6 -1.5 navg = 0.024
Clopper Soil Loss, cm -1 -2.6 -1.5 Flow (cfs) = 31.04 8.83 8.54
20 ft Avg Bottom Loss/Gain, in -0.67 Avg Clopper Soil Loss, in -0.67
Cross-section 11 A B C V @ 0.2d V @ 0.6d V @ 0.8d To Water Surf, cm
To original Surface Elev, cm 62 63 63 22 42.0
To eroded Surface Elev, cm 63.2 63.8 63.7 Vavg (fps) = 22.00
Soil Loss / Gain, cm -1.2 -0.8 -0.7 navg = 0.024
Clopper Soil Loss, cm -1.2 -0.8 -0.7 Flow (cfs) = 31.13 8.77 8.49
Avg Bottom Loss/Gain, in -0.35 Avg Clopper Soil Loss, in -0.35
Soil Loss / Gain, in -0.38 -0.54 -0.60 Avg Bottom Loss/Gain per Cross-Section = -0.51
Clopper Soil Loss, in -0.38 -0.54 -0.60 Avg Clopper Soil Loss per Cross-Section = -0.51
2
FLOW
CHANNEL 2 - SHEAR STRESS 5
C350 3.8 pins / sy
TEST DATA
Bed Max Shear Stress
(psf) Water Depth (in)
Bed Max Shear Stress
(psf) Water Depth (in)
Bed Max Shear Stress
(psf) Water Depth (in)
Bed Max Shear Stress
(psf) Water Depth (in)
Bed Max Shear Stress
(psf) Water Depth (in)
Bed Max Shear Stress
(psf) Water Depth (in)
0.00
Bed Max Shear Stress
(psf)
Bed Max Shear Stress
(psf) Water Depth (in)
Water Depth (in)
Bed Max Shear Stress
(psf) Water Depth (in)
Bed Max Shear Stress
(psf) Water Depth (in)
Bed Max Shear Stress
(psf) Water Depth (in)

3 - 1
Date: 4/16/13 Start Time: 9:07 AM End Time: 10:07 AM
Soil: Loam Target Shear (psf): 2.00 Slope: 20%
40 ft long flume 20 ft test section RECP: Anchorage:
rpms 2 ft wide flume
1 3 Outlet Weir Weir Channel Targets
Water Depth, in 0.00 0.00
Weir width (ft) = 2 Water Velocity, ft/s 0.00 0.00
0 ft A B C Flow Rate, cfs 0.00 0.00 0.00 4.09
Cross-section 1 A B C V @ 0.2d V @ 0.6d V @ 0.8d To Water Surf, cm
To original Surface Elev, cm 68.4 68.6 68.7 9.35 62.0
To eroded Surface Elev, cm 68.5 68.8 68.7 Vavg (fps) = 9.35
Soil Loss / Gain, cm -0.1 -0.2 0 navg = 0.026
Clopper Soil Loss, cm -0.1 -0.2 0 Flow (cfs) = 4.09 2.71 2.62
2 ft Avg Bottom Loss/Gain, in -0.04 Avg Clopper Soil Loss, in -0.04
Cross-section 2 A B C V @ 0.2d V @ 0.6d V @ 0.8d To Water Surf, cm
To original Surface Elev, cm 68.2 68.4 67.7 7.48 60.0
To eroded Surface Elev, cm 68.7 68.6 67.7 Vavg (fps) = 7.48
Soil Loss / Gain, cm -0.5 -0.2 0 navg = 0.037
Clopper Soil Loss, cm -0.5 -0.2 0 Flow (cfs) = 4.09 3.39 3.28
4 ft Avg Bottom Loss/Gain, in -0.09 Avg Clopper Soil Loss, in -0.09
Cross-section 3 A B C V @ 0.2d V @ 0.6d V @ 0.8d To Water Surf, cm
To original Surface Elev, cm 67.3 67.2 66.9 6.85 58.2
To eroded Surface Elev, cm 67.5 67.4 67 Vavg (fps) = 6.85
Soil Loss / Gain, cm -0.2 -0.2 -0.1 navg = 0.043
Clopper Soil Loss, cm -0.2 -0.2 -0.1 Flow (cfs) = 4.09 3.70 3.58
6 ft 25.5Avg Bottom Loss/Gain, in -0.07 Avg Clopper Soil Loss, in -0.07
Cross-section 4 A B C V @ 0.2d V @ 0.6d V @ 0.8d To Water Surf, cm
To original Surface Elev, cm 67.2 67 67.2 7.05 58.5
To eroded Surface Elev, cm 67.5 67.2 67.3 Vavg (fps) = 7.05
Soil Loss / Gain, cm -0.3 -0.2 -0.1 navg = 0.041
Clopper Soil Loss, cm -0.3 -0.2 -0.1 Flow (cfs) = 4.09 3.59 3.48
8 ft Avg Bottom Loss/Gain, in -0.08 Avg Clopper Soil Loss, in -0.08
Cross-section 5 A B C V @ 0.2d V @ 0.6d V @ 0.8d To Water Surf, cm
To original Surface Elev, cm 66.5 66.7 67.3 7.00 58.1
To eroded Surface Elev, cm 66.6 66.8 67.6 Vavg (fps) = 7.00
Soil Loss / Gain, cm -0.1 -0.1 -0.3 navg = 0.042
Clopper Soil Loss, cm -0.1 -0.1 -0.3 Flow (cfs) = 4.09 3.62 3.50
10 ft Avg Bottom Loss/Gain, in -0.07 Avg Clopper Soil Loss, in -0.07
Cross-section 6 A B C V @ 0.2d V @ 0.6d V @ 0.8d To Water Surf, cm
To original Surface Elev, cm 65.6 65.9 65.9 6.25 56.0
To eroded Surface Elev, cm 65.8 66.1 66 Vavg (fps) = 6.25
Soil Loss / Gain, cm -0.2 -0.2 -0.1 navg = 0.050
Clopper Soil Loss, cm -0.2 -0.2 -0.1 Flow (cfs) = 4.09 4.05 3.92
12 ft Avg Bottom Loss/Gain, in -0.07 Avg Clopper Soil Loss, in -0.07
Cross-section 7 A B C V @ 0.2d V @ 0.6d V @ 0.8d To Water Surf, cm
To original Surface Elev, cm 64.5 64.7 64.8 7.89 57.0
To eroded Surface Elev, cm 64.7 65 65 Vavg (fps) = 7.89
Soil Loss / Gain, cm -0.2 -0.3 -0.2 navg = 0.034
Clopper Soil Loss, cm -0.2 -0.3 -0.2 Flow (cfs) = 4.09 3.21 3.11
14 ft Avg Bottom Loss/Gain, in -0.09 Avg Clopper Soil Loss, in -0.09
Cross-section 8 A B C V @ 0.2d V @ 0.6d V @ 0.8d To Water Surf, cm
To original Surface Elev, cm 64.7 64.6 64.5 8.86 57.7
To eroded Surface Elev, cm 64.8 64.7 64.7 Vavg (fps) = 8.86
Soil Loss / Gain, cm -0.1 -0.1 -0.2 navg = 0.028
Clopper Soil Loss, cm -0.1 -0.1 -0.2 Flow (cfs) = 4.09 2.86 2.77
16 ft Avg Bottom Loss/Gain, in -0.05 Avg Clopper Soil Loss, in -0.05
Cross-section 9 A B C V @ 0.2d V @ 0.6d V @ 0.8d To Water Surf, cm
To original Surface Elev, cm 64 64.2 64.8 8.69 57.4
To eroded Surface Elev, cm 64.2 64.5 65 Vavg (fps) = 8.69
Soil Loss / Gain, cm -0.2 -0.3 -0.2 navg = 0.029
Clopper Soil Loss, cm -0.2 -0.3 -0.2 Flow (cfs) = 4.09 2.91 2.82
18 ft Avg Bottom Loss/Gain, in -0.09 Avg Clopper Soil Loss, in -0.09
Cross-section 10 A B C V @ 0.2d V @ 0.6d V @ 0.8d To Water Surf, cm
To original Surface Elev, cm 63.6 63.9 64 6.72 54.8
To eroded Surface Elev, cm 63.8 64.2 64.2 Vavg (fps) = 6.72
Soil Loss / Gain, cm -0.2 -0.3 -0.2 navg = 0.045
Clopper Soil Loss, cm -0.2 -0.3 -0.2 Flow (cfs) = 4.09 3.77 3.65
20 ft Avg Bottom Loss/Gain, in -0.09 Avg Clopper Soil Loss, in -0.09
Cross-section 11 A B C V @ 0.2d V @ 0.6d V @ 0.8d To Water Surf, cm
To original Surface Elev, cm 62.8 63 63.2 7.22 54.6
To eroded Surface Elev, cm 63.1 63.1 63.5 Vavg (fps) = 7.22
Soil Loss / Gain, cm -0.3 -0.1 -0.3 navg = 0.040
Clopper Soil Loss, cm -0.3 -0.1 -0.3 Flow (cfs) = 4.09 3.51 3.40
Avg Bottom Loss/Gain, in -0.09 Avg Clopper Soil Loss, in -0.09
Soil Loss / Gain, in -0.09 -0.08 -0.06 Avg Bottom Loss/Gain per Cross-Section = -0.08
Clopper Soil Loss, in -0.09 -0.08 -0.06 Avg Clopper Soil Loss per Cross-Section = -0.08
Bed Max Shear
Stress (psf) Water Depth (in)
CHANNEL 3 - SHEAR STRESS 1
TEST DATA
FLOW
2
C350 3.8 pins / sy
Bed Max Shear
Stress (psf) Water Depth (in)
Water Depth (in)
Bed Max Shear
Stress (psf) Water Depth (in)
Water Depth (in)
Bed Max Shear
Stress (psf)
Bed Max Shear
Stress (psf) Water Depth (in)
Bed Max Shear
Stress (psf) Water Depth (in)
Bed Max Shear
Stress (psf) Water Depth (in)
Bed Max Shear
Stress (psf) Water Depth (in)
Bed Max Shear
Stress (psf)
Bed Max Shear
Stress (psf) Water Depth (in)
Water Depth (in)
Bed Max Shear
Stress (psf)
3 - 2
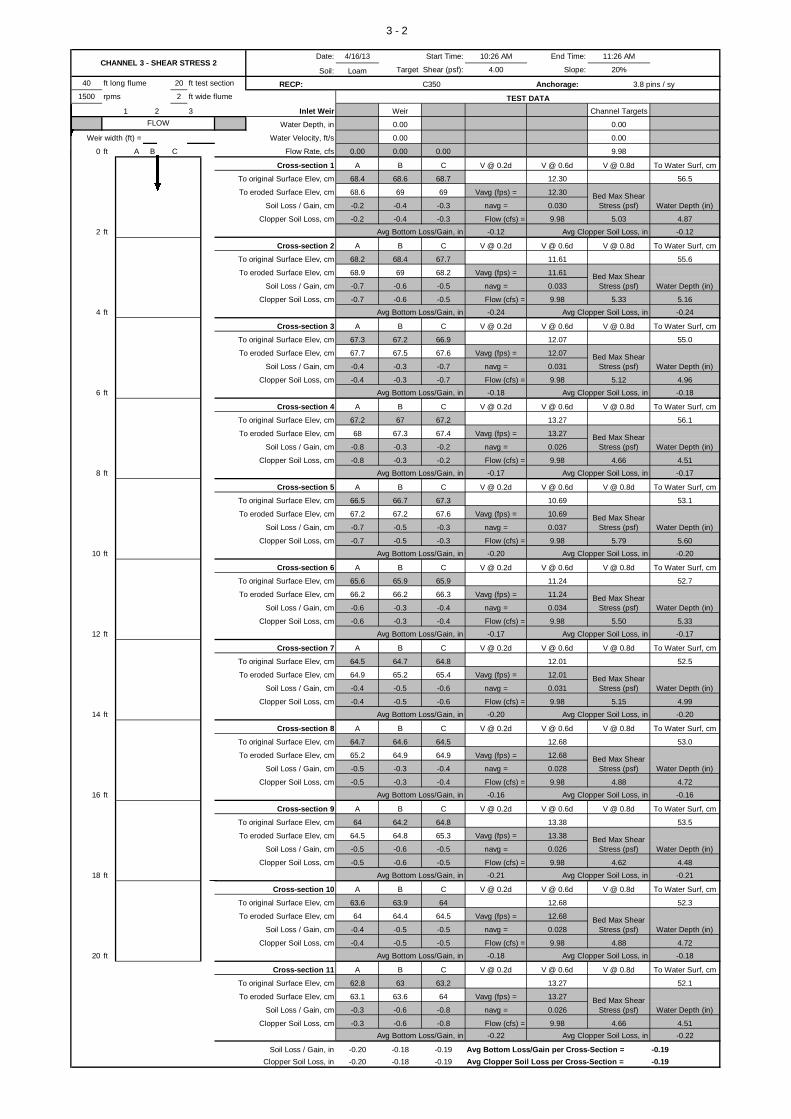
Date: 4/16/13 Start Time: 10:26 AM End Time: 11:26 AM
Soil: Loam Target Shear (psf): 4.00 Slope: 20%
40 ft long flume 20 ft test section RECP: Anchorage:
1500 rpms 2 ft wide flume
1 3 Inlet Weir Weir Channel Targets
Water Depth, in 0.00 0.00
Weir width (ft) = Water Velocity, ft/s 0.00 0.00
0 ft A B C Flow Rate, cfs 0.00 0.00 0.00 9.98
Cross-section 1 A B C V @ 0.2d V @ 0.6d V @ 0.8d To Water Surf, cm
To original Surface Elev, cm 68.4 68.6 68.7 12.30 56.5
To eroded Surface Elev, cm 68.6 69 69 Vavg (fps) = 12.30
Soil Loss / Gain, cm -0.2 -0.4 -0.3 navg = 0.030
Clopper Soil Loss, cm -0.2 -0.4 -0.3 Flow (cfs) = 9.98 5.03 4.87
2 ft Avg Bottom Loss/Gain, in -0.12 Avg Clopper Soil Loss, in -0.12
Cross-section 2 A B C V @ 0.2d V @ 0.6d V @ 0.8d To Water Surf, cm
To original Surface Elev, cm 68.2 68.4 67.7 11.61 55.6
To eroded Surface Elev, cm 68.9 69 68.2 Vavg (fps) = 11.61
Soil Loss / Gain, cm -0.7 -0.6 -0.5 navg = 0.033
Clopper Soil Loss, cm -0.7 -0.6 -0.5 Flow (cfs) = 9.98 5.33 5.16
4 ft Avg Bottom Loss/Gain, in -0.24 Avg Clopper Soil Loss, in -0.24
Cross-section 3 A B C V @ 0.2d V @ 0.6d V @ 0.8d To Water Surf, cm
To original Surface Elev, cm 67.3 67.2 66.9 12.07 55.0
To eroded Surface Elev, cm 67.7 67.5 67.6 Vavg (fps) = 12.07
Soil Loss / Gain, cm -0.4 -0.3 -0.7 navg = 0.031
Clopper Soil Loss, cm -0.4 -0.3 -0.7 Flow (cfs) = 9.98 5.12 4.96
6 ft Avg Bottom Loss/Gain, in -0.18 Avg Clopper Soil Loss, in -0.18
Cross-section 4 A B C V @ 0.2d V @ 0.6d V @ 0.8d To Water Surf, cm
To original Surface Elev, cm 67.2 67 67.2 13.27 56.1
To eroded Surface Elev, cm 68 67.3 67.4 Vavg (fps) = 13.27
Soil Loss / Gain, cm -0.8 -0.3 -0.2 navg = 0.026
Clopper Soil Loss, cm -0.8 -0.3 -0.2 Flow (cfs) = 9.98 4.66 4.51
8 ft Avg Bottom Loss/Gain, in -0.17 Avg Clopper Soil Loss, in -0.17
Cross-section 5 A B C V @ 0.2d V @ 0.6d V @ 0.8d To Water Surf, cm
To original Surface Elev, cm 66.5 66.7 67.3 10.69 53.1
To eroded Surface Elev, cm 67.2 67.2 67.6 Vavg (fps) = 10.69
Soil Loss / Gain, cm -0.7 -0.5 -0.3 navg = 0.037
Clopper Soil Loss, cm -0.7 -0.5 -0.3 Flow (cfs) = 9.98 5.79 5.60
10 ft Avg Bottom Loss/Gain, in -0.20 Avg Clopper Soil Loss, in -0.20
Cross-section 6 A B C V @ 0.2d V @ 0.6d V @ 0.8d To Water Surf, cm
To original Surface Elev, cm 65.6 65.9 65.9 11.24 52.7
To eroded Surface Elev, cm 66.2 66.2 66.3 Vavg (fps) = 11.24
Soil Loss / Gain, cm -0.6 -0.3 -0.4 navg = 0.034
Clopper Soil Loss, cm -0.6 -0.3 -0.4 Flow (cfs) = 9.98 5.50 5.33
12 ft Avg Bottom Loss/Gain, in -0.17 Avg Clopper Soil Loss, in -0.17
Cross-section 7 A B C V @ 0.2d V @ 0.6d V @ 0.8d To Water Surf, cm
To original Surface Elev, cm 64.5 64.7 64.8 12.01 52.5
To eroded Surface Elev, cm 64.9 65.2 65.4 Vavg (fps) = 12.01
Soil Loss / Gain, cm -0.4 -0.5 -0.6 navg = 0.031
Clopper Soil Loss, cm -0.4 -0.5 -0.6 Flow (cfs) = 9.98 5.15 4.99
14 ft Avg Bottom Loss/Gain, in -0.20 Avg Clopper Soil Loss, in -0.20
Cross-section 8 A B C V @ 0.2d V @ 0.6d V @ 0.8d To Water Surf, cm
To original Surface Elev, cm 64.7 64.6 64.5 12.68 53.0
To eroded Surface Elev, cm 65.2 64.9 64.9 Vavg (fps) = 12.68
Soil Loss / Gain, cm -0.5 -0.3 -0.4 navg = 0.028
Clopper Soil Loss, cm -0.5 -0.3 -0.4 Flow (cfs) = 9.98 4.88 4.72
16 ft Avg Bottom Loss/Gain, in -0.16 Avg Clopper Soil Loss, in -0.16
Cross-section 9 A B C V @ 0.2d V @ 0.6d V @ 0.8d To Water Surf, cm
To original Surface Elev, cm 64 64.2 64.8 13.38 53.5
To eroded Surface Elev, cm 64.5 64.8 65.3 Vavg (fps) = 13.38
Soil Loss / Gain, cm -0.5 -0.6 -0.5 navg = 0.026
Clopper Soil Loss, cm -0.5 -0.6 -0.5 Flow (cfs) = 9.98 4.62 4.48
18 ft Avg Bottom Loss/Gain, in -0.21 Avg Clopper Soil Loss, in -0.21
Cross-section 10 A B C V @ 0.2d V @ 0.6d V @ 0.8d To Water Surf, cm
To original Surface Elev, cm 63.6 63.9 64 12.68 52.3
To eroded Surface Elev, cm 64 64.4 64.5 Vavg (fps) = 12.68
Soil Loss / Gain, cm -0.4 -0.5 -0.5 navg = 0.028
Clopper Soil Loss, cm -0.4 -0.5 -0.5 Flow (cfs) = 9.98 4.88 4.72
20 ft Avg Bottom Loss/Gain, in -0.18 Avg Clopper Soil Loss, in -0.18
Cross-section 11 A B C V @ 0.2d V @ 0.6d V @ 0.8d To Water Surf, cm
To original Surface Elev, cm 62.8 63 63.2 13.27 52.1
To eroded Surface Elev, cm 63.1 63.6 64 Vavg (fps) = 13.27
Soil Loss / Gain, cm -0.3 -0.6 -0.8 navg = 0.026
Clopper Soil Loss, cm -0.3 -0.6 -0.8 Flow (cfs) = 9.98 4.66 4.51
Avg Bottom Loss/Gain, in -0.22 Avg Clopper Soil Loss, in -0.22
Soil Loss / Gain, in -0.20 -0.18 -0.19 Avg Bottom Loss/Gain per Cross-Section = -0.19
Clopper Soil Loss, in -0.20 -0.18 -0.19 Avg Clopper Soil Loss per Cross-Section = -0.19
Water Depth (in)
Bed Max Shear
Stress (psf) Water Depth (in)
Bed Max Shear
Stress (psf) Water Depth (in)
Bed Max Shear
Stress (psf)
Water Depth (in)
Water Depth (in)
Bed Max Shear
Stress (psf) Water Depth (in)
Bed Max Shear
Stress (psf)
Bed Max Shear
Stress (psf)
Water Depth (in)
Bed Max Shear
Stress (psf) Water Depth (in)
Bed Max Shear
Stress (psf)
CHANNEL 3 - SHEAR STRESS 2
TEST DATA
C350 3.8 pins / sy
FLOW
2
Bed Max Shear
Stress (psf) Water Depth (in)
Bed Max Shear
Stress (psf) Water Depth (in)
Bed Max Shear
Stress (psf) Water Depth (in)

3 - 3
Date: 4/16/13 Start Time: 11:44 AM End Time: 12:44 PM
Soil: Loam Target Shear (psf): 8.00 Slope: 20%
40 ft long flume 20 ft test section RECP: Anchorage:
rpms 2 ft wide flume
1 3 Inlet Weir Weir Channel Targets
Water Depth, in 0.00 0.00
Weir width (ft) = 4 Water Velocity, ft/s 0.00 0.00
ft A B C Flow Rate, cfs 0.00 0.00 0.00 19.19
Cross-section 1 A B C V @ 0.2d V @ 0.6d V @ 0.8d To Water Surf, cm
To original Surface Elev, cm 68.4 68.6 68.7 12.92 46.5
To eroded Surface Elev, cm 69 69.3 69.1 Vavg (fps) = 12.92
Soil Loss / Gain, cm -0.6 -0.7 -0.4 navg = 0.042
Clopper Soil Loss, cm -0.6 -0.7 -0.4 Flow (cfs) = 19.19 9.21 8.91
2 ft Avg Bottom Loss/Gain, in -0.22 Avg Clopper Soil Loss, in -0.22
Cross-section 2 A B C V @ 0.2d V @ 0.6d V @ 0.8d To Water Surf, cm
To original Surface Elev, cm 68.2 68.4 67.7 15.78 50.5
To eroded Surface Elev, cm 69.3 69.5 68.3 Vavg (fps) = 15.78
Soil Loss / Gain, cm -1.1 -1.1 -0.6 navg = 0.030
Clopper Soil Loss, cm -1.1 -1.1 -0.6 Flow (cfs) = 19.19 7.54 7.30
4 ft Avg Bottom Loss/Gain, in -0.37 Avg Clopper Soil Loss, in -0.37
Cross-section 3 A B C V @ 0.2d V @ 0.6d V @ 0.8d To Water Surf, cm
To original Surface Elev, cm 67.3 67.2 66.9 16.34 50.0
To eroded Surface Elev, cm 68 67.8 67.9 Vavg (fps) = 16.34
Soil Loss / Gain, cm -0.7 -0.6 -1 navg = 0.029
Clopper Soil Loss, cm -0.7 -0.6 -1 Flow (cfs) = 19.19 7.28 7.05
6 ft Avg Bottom Loss/Gain, in -0.30 Avg Clopper Soil Loss, in -0.30
Cross-section 4 A B C V @ 0.2d V @ 0.6d V @ 0.8d To Water Surf, cm
To original Surface Elev, cm 67.2 67 67.2 15.70 49.3
To eroded Surface Elev, cm 68.4 67.6 67.8 Vavg (fps) = 15.70
Soil Loss / Gain, cm -1.2 -0.6 -0.6 navg = 0.030
Clopper Soil Loss, cm -1.2 -0.6 -0.6 Flow (cfs) = 19.19 7.58 7.34
8 ft Avg Bottom Loss/Gain, in -0.31 Avg Clopper Soil Loss, in -0.31
Cross-section 5 A B C V @ 0.2d V @ 0.6d V @ 0.8d To Water Surf, cm
To original Surface Elev, cm 66.5 66.7 67.3 15.02 48.2
To eroded Surface Elev, cm 67.5 67.6 67.9 Vavg (fps) = 15.02
Soil Loss / Gain, cm -1 -0.9 -0.6 navg = 0.033
Clopper Soil Loss, cm -1 -0.9 -0.6 Flow (cfs) = 19.19 7.92 7.66
10 ft Avg Bottom Loss/Gain, in -0.33 Avg Clopper Soil Loss, in -0.33
Cross-section 6 A B C V @ 0.2d V @ 0.6d V @ 0.8d To Water Surf, cm
To original Surface Elev, cm 65.6 65.9 65.9 15.15 47.3
To eroded Surface Elev, cm 66.5 66.5 66.8 Vavg (fps) = 15.15
Soil Loss / Gain, cm -0.9 -0.6 -0.9 navg = 0.032
Clopper Soil Loss, cm -0.9 -0.6 -0.9 Flow (cfs) = 19.19 7.85 7.60
12 ft Avg Bottom Loss/Gain, in -0.31 Avg Clopper Soil Loss, in -0.31
Cross-section 7 A B C V @ 0.2d V @ 0.6d V @ 0.8d To Water Surf, cm
To original Surface Elev, cm 64.5 64.7 64.8 16.74 48.0
To eroded Surface Elev, cm 65.2 65.6 65.6 Vavg (fps) = 16.74
Soil Loss / Gain, cm -0.7 -0.9 -0.8 navg = 0.027
Clopper Soil Loss, cm -0.7 -0.9 -0.8 Flow (cfs) = 19.19 7.10 6.88
14 ft Avg Bottom Loss/Gain, in -0.31 Avg Clopper Soil Loss, in -0.31
Cross-section 8 A B C V @ 0.2d V @ 0.6d V @ 0.8d To Water Surf, cm
To original Surface Elev, cm 64.7 64.6 64.5 16.87 48.0
To eroded Surface Elev, cm 65.4 65.3 65.3 Vavg (fps) = 16.87
Soil Loss / Gain, cm -0.7 -0.7 -0.8 navg = 0.027
Clopper Soil Loss, cm -0.7 -0.7 -0.8 Flow (cfs) = 19.19 7.05 6.82
16 ft Avg Bottom Loss/Gain, in -0.29 Avg Clopper Soil Loss, in -0.29
Cross-section 9 A B C V @ 0.2d V @ 0.6d V @ 0.8d To Water Surf, cm
To original Surface Elev, cm 64 64.2 64.8 17.24 48.2
To eroded Surface Elev, cm 64.8 65.1 65.6 Vavg (fps) = 17.24
Soil Loss / Gain, cm -0.8 -0.9 -0.8 navg = 0.026
Clopper Soil Loss, cm -0.8 -0.9 -0.8 Flow (cfs) = 19.19 6.90 6.68
18 ft Avg Bottom Loss/Gain, in -0.33 Avg Clopper Soil Loss, in -0.33
Cross-section 10 A B C V @ 0.2d V @ 0.6d V @ 0.8d To Water Surf, cm
To original Surface Elev, cm 63.6 63.9 64 17.58 48.0
To eroded Surface Elev, cm 64.4 64.7 64.8 Vavg (fps) = 17.58
Soil Loss / Gain, cm -0.8 -0.8 -0.8 navg = 0.025
Clopper Soil Loss, cm -0.8 -0.8 -0.8 Flow (cfs) = 19.19 6.77 6.55
20 ft Avg Bottom Loss/Gain, in -0.31 Avg Clopper Soil Loss, in -0.31
Cross-section 11 A B C V @ 0.2d V @ 0.6d V @ 0.8d To Water Surf, cm
To original Surface Elev, cm 62.8 63 63.2 18.43 48.0
To eroded Surface Elev, cm 63.6 63.8 64.2 Vavg (fps) = 18.43
Soil Loss / Gain, cm -0.8 -0.8 -1 navg = 0.023
Clopper Soil Loss, cm -0.8 -0.8 -1 Flow (cfs) = 19.19 6.45 6.25
Avg Bottom Loss/Gain, in -0.34 Avg Clopper Soil Loss, in -0.34
Soil Loss / Gain, in -0.33 -0.31 -0.30 Avg Bottom Loss/Gain per Cross-Section = -0.31
Clopper Soil Loss, in -0.33 -0.31 -0.30 Avg Clopper Soil Loss per Cross-Section = -0.31
CHANNEL 3 - SHEAR STRESS 3
TEST DATA
FLOW
2
C350 3.8 pins / sy
Bed Max Shear
Stress (psf)
Bed Max Shear
Stress (psf) Water Depth (in)
Bed Max Shear
Stress (psf) Water Depth (in)
Bed Max Shear
Stress (psf) Water Depth (in)
Water Depth (in)
Bed Max Shear
Stress (psf) Water Depth (in)
Water Depth (in)
Bed Max Shear
Stress (psf) Water Depth (in)
Bed Max Shear
Stress (psf) Water Depth (in)
Bed Max Shear
Stress (psf)
Bed Max Shear
Stress (psf) Water Depth (in)
Bed Max Shear
Stress (psf) Water Depth (in)
Bed Max Shear
Stress (psf) Water Depth (in)

3 - 4
Date: 4/16/13 Start Time: 2:17 PM End Time:
Soil: Loam Target Shear (psf): 12.00 Slope: 20%
40 ft long flume 20 ft test section RECP: Anchorage:
rpms 2 ft wide flume
1 3 Inlet Weir Weir Channel Targets
Water Depth, in 0.00 0.00
Weir width (ft) = 2.00 C = Water Velocity, ft/s 0.00 0.00
0 ft A B C Flow Rate, cfs 0.00 0.00 0.00 44.32
Cross-section 1 A B C V @ 0.2d V @ 0.6d V @ 0.8d To Water Surf, cm
To original Surface Elev, cm 68.4 68.6 68.7 20.46972058 36.4
To eroded Surface Elev, cm 69.3 69.4 69.5 Vavg (fps) = 20.47
Soil Loss / Gain, cm -0.9 -0.8 -0.8 navg = 0.034
Clopper Soil Loss, cm -0.9 -0.8 -0.8 Flow (cfs) = 44.32 13.42 12.99
2 ft Avg Bottom Loss/Gain, in -0.33 Avg Clopper Soil Loss, in -0.33
Cross-section 2 A B C V @ 0.2d V @ 0.6d V @ 0.8d To Water Surf, cm
To original Surface Elev, cm 68.2 68.4 67.7 20.89177668 37.6
To eroded Surface Elev, cm 70.2 70.4 69.2 Vavg (fps) = 20.89
Soil Loss / Gain, cm -2 -2 -1.5 navg = 0.033
Clopper Soil Loss, cm -2 -2 -1.5 Flow (cfs) = 44.32 13.15 12.73
4 ft Avg Bottom Loss/Gain, in -0.72 Avg Clopper Soil Loss, in -0.72
Cross-section 3 A B C V @ 0.2d V @ 0.6d V @ 0.8d To Water Surf, cm
To original Surface Elev, cm 67.3 67.2 66.9 23.37372938 39.6
To eroded Surface Elev, cm 68.6 68.8 68.1 Vavg (fps) = 23.37
Soil Loss / Gain, cm -1.3 -1.6 -1.2 navg = 0.027
Clopper Soil Loss, cm -1.3 -1.6 -1.2 Flow (cfs) = 44.32 11.75 11.38
6 ft Avg Bottom Loss/Gain, in -0.54 Avg Clopper Soil Loss, in -0.54
Cross-section 4 A B C V @ 0.2d V @ 0.6d V @ 0.8d To Water Surf, cm
To original Surface Elev, cm 67.2 67 67.2 24.18260546 40.5
To eroded Surface Elev, cm 68.7 68.2 68.4 Vavg (fps) = 24.18
Soil Loss / Gain, cm -1.5 -1.2 -1.2 navg = 0.026
Clopper Soil Loss, cm -1.5 -1.2 -1.2 Flow (cfs) = 44.32 11.36 11.00
8 ft Avg Bottom Loss/Gain, in -0.51 Avg Clopper Soil Loss, in -0.51
Cross-section 5 A B C V @ 0.2d V @ 0.6d V @ 0.8d To Water Surf, cm
To original Surface Elev, cm 66.5 66.7 67.3 21.97941798 37.5
To eroded Surface Elev, cm 68 68.3 68.4 Vavg (fps) = 21.98
Soil Loss / Gain, cm -1.5 -1.6 -1.1 navg = 0.030
Clopper Soil Loss, cm -1.5 -1.6 -1.1 Flow (cfs) = 44.32 12.50 12.10
10 ft Avg Bottom Loss/Gain, in -0.55 Avg Clopper Soil Loss, in -0.55
Cross-section 6 A B C V @ 0.2d V @ 0.6d V @ 0.8d To Water Surf, cm
To original Surface Elev, cm 65.6 65.9 65.9 21.44446918 35.6
To eroded Surface Elev, cm 67.1 66.9 67.3 Vavg (fps) = 21.44
Soil Loss / Gain, cm -1.5 -1 -1.4 navg = 0.032
Clopper Soil Loss, cm -1.5 -1 -1.4 Flow (cfs) = 44.32 12.81 12.40
12 ft Avg Bottom Loss/Gain, in -0.51 Avg Clopper Soil Loss, in -0.51
Cross-section 7 A B C V @ 0.2d V @ 0.6d V @ 0.8d To Water Surf, cm
To original Surface Elev, cm 64.5 64.7 64.8 23.72953557 37.4
To eroded Surface Elev, cm 65.6 66 66 Vavg (fps) = 23.73
Soil Loss / Gain, cm -1.1 -1.3 -1.2 navg = 0.027
Clopper Soil Loss, cm -1.1 -1.3 -1.2 Flow (cfs) = 44.32 11.58 11.21
14 ft Avg Bottom Loss/Gain, in -0.47 Avg Clopper Soil Loss, in -0.47
Cross-section 8 A B C V @ 0.2d V @ 0.6d V @ 0.8d To Water Surf, cm
To original Surface Elev, cm 64.7 64.6 64.5 25.8153164 39.6
To eroded Surface Elev, cm 65.7 65.8 65.8 Vavg (fps) = 25.82
Soil Loss / Gain, cm -1 -1.2 -1.3 navg = 0.023
Clopper Soil Loss, cm -1 -1.2 -1.3 Flow (cfs) = 44.32 10.64 10.30
16 ft Avg Bottom Loss/Gain, in -0.46 Avg Clopper Soil Loss, in -0.46
Cross-section 9 A B C V @ 0.2d V @ 0.6d V @ 0.8d To Water Surf, cm
To original Surface Elev, cm 64 64.2 64.8 26.80558648 40.5
To eroded Surface Elev, cm 65.4 65.7 66 Vavg (fps) = 26.81
Soil Loss / Gain, cm -1.4 -1.5 -1.2 navg = 0.022
Clopper Soil Loss, cm -1.4 -1.5 -1.2 Flow (cfs) = 44.32 10.25 9.92
18 ft Avg Bottom Loss/Gain, in -0.54 Avg Clopper Soil Loss, in -0.54
Cross-section 10 A B C V @ 0.2d V @ 0.6d V @ 0.8d To Water Surf, cm
To original Surface Elev, cm 63.6 63.9 64 27.45938127 40.5
To eroded Surface Elev, cm 64.5 65.2 65.6 Vavg (fps) = 27.46
Soil Loss / Gain, cm -0.9 -1.3 -1.6 navg = 0.021
Clopper Soil Loss, cm -0.9 -1.3 -1.6 Flow (cfs) = 44.32 10.01 9.69
20 ft Avg Bottom Loss/Gain, in -0.50 Avg Clopper Soil Loss, in -0.50
Cross-section 11 A B C V @ 0.2d V @ 0.6d V @ 0.8d To Water Surf, cm
To original Surface Elev, cm 62.8 63 63.2 27.79838597 40.0
To eroded Surface Elev, cm 64 64.2 64.7 Vavg (fps) = 27.80
Soil Loss / Gain, cm -1.2 -1.2 -1.5 navg = 0.021
Clopper Soil Loss, cm -1.2 -1.2 -1.5 Flow (cfs) = 44.32 9.88 9.57
Avg Bottom Loss/Gain, in -0.51 Avg Clopper Soil Loss, in -0.51
Soil Loss / Gain, in -0.51 -0.53 -0.50 Avg Bottom Loss/Gain per Cross-Section = -0.51
Clopper Soil Loss, in -0.51 -0.53 -0.50 Avg Clopper Soil Loss per Cross-Section = -0.51
Water Depth (in)
Bed Max Shear
Stress (psf) Water Depth (in)
Bed Max Shear
Stress (psf) Water Depth (in)
Bed Max Shear
Stress (psf)
Water Depth (in)
Water Depth (in)
Bed Max Shear
Stress (psf) Water Depth (in)
Bed Max Shear
Stress (psf)
Bed Max Shear
Stress (psf)
Water Depth (in)
Bed Max Shear
Stress (psf) Water Depth (in)
Bed Max Shear
Stress (psf)
CHANNEL 3 - SHEAR STRESS 4
TEST DATA
0.00
C350 3.8 pins / sy
FLOW
2
Bed Max Shear
Stress (psf) Water Depth (in)
Bed Max Shear
Stress (psf) Water Depth (in)
Bed Max Shear
Stress (psf) Water Depth (in)

C350, Triple Net Coconut Mat, over Loam
Channel Erosion Testing
May 3, 2013
Appendix
APPENDIX B – TEST SOIL
Test Soil Grain Size Distribution Curve
Compaction Curves
Veneer Soil Compaction Verification
January 2010
0
10
20
30
40
50
60
70
80
90
100
0.0010.010.1110100
Pe
rce
nt
Fin
er
Particle Size (mm)
DDRF ASTM D 6459 & D 6460 Blended Test Soil
ASTM ASTM D 6459 & D 6460 Target Loam
Plasticity (ASTM D 4318)Liquid Limit: 35Plastic Limit: 30Plastic Index: 5
Soil classifies as a sandy silt (ML) in accordance with ASTM D 2487
Tested by: Tamika Walker
TRI observes and maintains client confidentiality. TRI limits reproduction of this report, except in full, without prior approval of TRI.
9063 Bee Caves Road Austin, TX 78733-6201 (512) 263-2101 (512) 263-2558 1-800-880-TEST
Cheng-Wei Chen, 02/03/10
Quality Review/Date
The testing herein is based upon accepted industry practice as well as the test method listed. Test results reported herein do not apply
to samples other than those tested. TRI neither accepts responsibility for nor makes claim as to the final use and purpose of the material.
Proctor Compaction Test
80
85
90
95
100
105
110
115
120
5 10 15 20 25 30 35 40 45
Moisture Content (%)
Dry
Den
sity
(pcf
)
2.80
2.60
2.70
Project: TRI-DDRF
Sample No.: DDRF Test Soil - January 2010
TRI Log No.: E2337-12-04
Test Method: ASTM D 698 - Method A
Maximum Dry Density (pcf): 98.7
Optimum Moisture Content (%): 20.0

Calibration Date: 8/16/2009
Sand Used: Pool Filter Sand
Volume Measure: Liquid Volume, Vm (cm3): 425
Wt. of Sand to Fill Known Volume:
Total Wt (g) Pan Wt (g) Net Wt (g)
Trial #1 (g) 663.3 11.5 651.8
Trial #2 (g) 661.3 11.5 649.8
Trial #3 (g) 657.3 11.5 645.8
Wa (g) 649.1
Density of Sand, ɣsand (g/cm3) = Wa / Vm = 1.53
Wt. of Sand to Fill Cone:
Total Wt (g) Cone Wt (g) Net Wt (g)
Trial #1 (g) 7046.0 5152.9 1893.1
Trial #2 (g) 7045.3 5152.9 1892.4
Trial #3 (g) 7046.9 5152.9 1894.0
Wt. of Sand in Cone (g): 1893.2
Field Data Date: 2/10/2010
Wt. of Wet Soil + Pan (g) 934.6
Wt. of Dry Soil + Pan (g) 792.4
Wt. of Pan (g) 14.5
Wt. of Wet Soil, W' (g) 920.1
Wt. of Dry Soil (g) 777.9
Wt. of Water (g) 142.2
Water Content, w (%) 18.3%
Sand Used: Pool Filter Sand
Unit Wt. of Sand, ɣsand (g/cm3) = 1.53
Wt. of Jug & Cone Before (g) = 7050.10
Wt. of Jug & Cone After (g) = 4348.33
Wt. of Sand Used (g) = 2701.77
Wt. of Sand in Cone (g) = 1893.17
Wt. of Sand in Hole, W (g) = 808.60
Volume of hole, Vh (cm3) = W / ɣsand = 529.41
Wet density, ɣwet = W' / Vh (kN/m3) = 1.74
Wet density, ɣwet = W' / Vh (lb/ft3) = 108.40
Dry density, ɣdry = ɣwet / [1 + w] (kN/m3) = 1.47
Wet density, ɣwet = W' / Vh (lb/ft3) = 91.65
Max Std. Proctor Dry density (kN/m3) = 98.70
Opt. Moisture via Std. Proctor density (%) = 20.00
Compaction as % of Std. Proctor = 92.9%
Density Calculation:
Compaction Worksheet
ASTM D 1556
Volume Data:
Soil Data:
C350, Triple Net Coconut Mat, over Loam
Channel Erosion Testing
May 3, 2013
Appendix
APPENDIX C – ANCHOR PATTERN

APPENDIX D
REPORT REVISION The reported performance values of Permissible Shear and/or Limiting Velocity have been revised to exclude areas exhibiting nonlinear or turbulent flow.
NTPEP ASTM D 6460 Permissible Shear and Velocity Revision to Data Explanation
Testing of Rolled Erosion Control Products (RECPs) is conducted by a number of methods. NTPEP selected ASTM D 6460-07 as a large scale method to determine the performance of these materials with respect to soil loss under concentrated (channel) flow. Upon review, one primary issue was noted in the determination of the permissible shear stress.
Permissible Shear Background The ASTM D 6460-12 standard provides guidelines for evaluating the performance of rolled erosion control products from stormwater-induced erosion, particularly with respect to maximum boundary shear stress. The standard recognizes that the test data typically exhibit non-uniform flow, and calculation of the shear stress must account for non-uniform flow conditions. The standard also recognizes that variability in the raw data can yield inconsistent or inaccurate results due to nonlinear data.
Oversimplified Calculations The ASTM D 6460-12 test method reporting requirements include using a control volume with a minimum length of 20 feet if the water surface and energy grade line exhibit linear behavior over the reach of the control volume. If excess turbulence causes nonlinearity within the raw data yielding inconsistent or inaccurate results, the standard allows alternative methods to quantify shear stress and velocity to be used. Previous reporting of data by the NTPEP lab has taken each channel cross-section as an independent control volume in order to negate the effects of any non-uniform flow conditions and to simplify the calculation of shear stress. Independent consultant review has viewed this as an oversimplification, especially with highly turbulent flows.
Revised Calculations To maintain compliance with the ASTM standard, the full non-uniform flow calculation or an alternative method for data that exhibit nonlinear behavior should be used. To this end, and with the help of the independent consultant and in compliance with the current standard, an alternative calculation method for data that exhibit nonlinear behavior has been developed. The alternative calculation uses linear regression techniques over a representative control volume that is the least turbulent and exhibits linear behavior.
Tests that exhibited turbulent flows required eliminating those nonlinear areas from the calculation. If the remaining linear areas experienced a lower average soil loss than that of the entire test channel, this resulted in a higher permissible shear when recalculated. Alternately, if the remaining linear areas experienced a higher average soil loss than that of the entire test channel, this resulted in a lower permissible shear when recalculated. Flows that were more turbulent, especially the 1-year vegetated tests, resulted in larger differences between the original calculation and the revised calculation. Additionally, NTPEP policy does not allow for extrapolation, so the maximum shear achieved is recorded, even if ½-inch soil loss is not reached. All NTPEP ASTM D 6460 test reports that do not reflect this revised reporting of permissible shear and velocity must be amended.
Impact on End Users For end users of the NTPEP test reports, it is expected that the product approval processes or specification requirements may need to be updated to reflect the updated reporting of permissible shear and/or velocity.

y = 0.0158x2 + 0.0845xR² = 0.9897
y = -0.0002x3 + 0.0028x2 + 0.0345xR² = 0.977
y = -0.0002x3 + 0.0052x2 + 0.0096xR² = 0.9831
0.00
0.10
0.20
0.30
0.40
0.50
0.60
0.70
0.80
0 1 2 3 4 5 6 7 8 9 10 11 12 13 14 15 16
Cum
mu
lative
So
il L
oss (
CS
LI)
, in
Shear, psf
Limiting Shear via ASTM D 6460 C350; 3.8 Anchors/SY
Unvegetated 6-Wk Vegetated Original 6-Wk Results 56-Wk Vegetated
Original 56-Wk Results Poly. (Unvegetated) Poly. (6-Wk Vegetated) Poly. (56-Wk Vegetated)
Orig. Limiting Shear = 11.3 psf
Limiting Shear = 12.7 psf
Orig. Limiting Shear = 8.8 psf
Limiting Shear = 8.2 psfLimiting Shear = 3.2 psf
Orig. Limiting Shear = 3.2 psf

y = 0.0123x1.4459 R² = 0.9802
y = 0.0097x1.1947 R² = 0.981
y = 0.0016x1.8301 R² = 0.9994
0.00
0.10
0.20
0.30
0.40
0.50
0.60
0.70
0.80
0 2 4 6 8 10 12 14 16 18 20 22 24 26 28 30
Cum
mu
lative
So
il L
oss (
CS
LI)
, in
Velocity, ft/sec
Limiting Velocity via ASTM D 6460 C350; 3.8 Anchors/SY
Unvegetated 6-Wk Vegetated Original 6-Wk Results 56-Wk Vegetated
Original 56-Wk Results Power (Unvegetated) Power (6-Wk Vegetated) Power (56-Wk Vegetated)
Orig. Limiting Velocity = 23.4 ft/sec
Limiting Velocity= 22.2+ ft/sec
Orig. Limiting Velocity = 19.5 ft/sec
Limiting Velocity= 20+ ft/sec
Orig. Limiting Velocity 11.3 ft/sec
Limiting Velocity= 12+ ft/sec

![[XLS] · Web viewNuA - NUNN CLAY LOAM, 0 TO 2 PERCENT SLOPES NuB - NUNN CLAY LOAM, 2 TO 6 PERCENT SLOPES NuC - NUNN CLAY LOAM, 6 TO 9 PERCENT SLOPES Hw - HOVEN SILT LOAM, PONDED,](https://img.pdfslide.us/doc/110x75/5c04438409d3f2183a8b6d2b/xls-web-viewnua-nunn-clay-loam-0-to-2-percent-slopes-nub-nunn-clay-loam.jpg)