Embed Size (px)
Citation preview
1
MaxQuant – Information and Tutorial
by Tjorven Hinzke
The tutorial is based on the 2016 MaxQuant Summer School presentations (MaxQuant version 1.5.5.1) – the credit
goes to the developers of MaxQuant and Perseus and the speakers of the 2016 MaxQuant Summer School.
This is the documentation paper: Tyanova et al. 2016, The MaxQuant computational platform for mass-
spectrometry-based shotgun proteomics, Nature Protocols 11, 2301-2319;
http://www.nature.com/nprot/journal/v11/n12/pdf/nprot.2016.136.pdf.
Additionally, the “Max Quant” youtube channel provides videos of MaxQuant Summer School talks, which are a
great source for further information.
Table of contents
1. MaxQuant background ........................................................................................................................................... 2 1.1 General ........................................................................................................................................................... 2 1.2 Download and Installation............................................................................................................................ 2 1.3 How does it work? ......................................................................................................................................... 2
1.3.1 Protein groups and razor peptides ...................................................................................................... 3 1.4 Label-free quantification in MaxQuant ........................................................................................................ 3
1.4.1 Quantification possibilities in general ................................................................................................. 3 1.4.2 label-free quantification ....................................................................................................................... 3 1.4.3 Posterior Error Probability (PEP) ....................................................................................................... 4 1.4.4 Match between runs ............................................................................................................................. 5 1.4.5 Normalization....................................................................................................................................... 5
1.5 Dependent peptide search ............................................................................................................................ 6 1.6 Output tables ................................................................................................................................................. 6
1.6.1 General ................................................................................................................................................. 6 1.6.2 Scans ..................................................................................................................................................... 7 1.6.3 Identification ........................................................................................................................................ 7 1.6.4 Features ................................................................................................................................................ 8 1.6.5 Metadata ............................................................................................................................................... 8
2. MaxQuant Tutorial ................................................................................................................................................. 9 2.1 generally......................................................................................................................................................... 9 2.2 Configuration of the Andromeda search engine .......................................................................................... 9
2.2.1 New modifications (e.g. from unimod) ............................................................................................... 9 2.2.2 Add a new label (for experiments working with labelled proteins) ................................................. 10 2.2.3 Configurate a protease ....................................................................................................................... 10 2.2.4 Add a protein database ...................................................................................................................... 10
2.3 Raw files ........................................................................................................................................................ 11 2.4 MaxQuant Viewer ........................................................................................................................................ 13 2.5 Group-specific parameters .......................................................................................................................... 13
2.5.1 Type .................................................................................................................................................... 13 2.5.2 Digestion ............................................................................................................................................. 14 2.5.3 Modifications ...................................................................................................................................... 14 2.5.4 Label-free quantification ................................................................................................................... 14 2.5.5 Instrument .......................................................................................................................................... 15 2.5.6 First search ......................................................................................................................................... 15 2.5.7 Miscellaneous ..................................................................................................................................... 15
2.6 Global parameters ....................................................................................................................................... 15 2.6.1 Sequences ........................................................................................................................................... 15 2.6.2 Identification ...................................................................................................................................... 16 2.6.3 Advanced identification ..................................................................................................................... 16 2.6.4 Protein quantification ........................................................................................................................ 17 2.6.5 Label-free quantification ................................................................................................................... 17 2.6.6 Tables .................................................................................................................................................. 18 2.6.7 Folder locations .................................................................................................................................. 18 2.6.8 MS/MS – FTMS, ITMS, TOF, Unknown .......................................................................................... 18 2.6.9 Advanced ............................................................................................................................................ 18
2.7 Performance ................................................................................................................................................ 18

2
1. MaxQuant background
1.1 General
http://www.coxdocs.org/doku.php?id=maxquant:start
integrated proteomics software suite for quantitative proteomics – software package for
analyzing shotgun proteomics data
integrated search engine Andromeda
label-free, label-based quantitation possible
uses area under the curve (extracted ion currents - XIC) for quantification (no spectral
counting)
efficient also for large search spaces (huge datasets, unspecific searches)
1.2 Download and Installation
http://www.coxdocs.org/doku.php?id=maxquant:common:download_and_installation
register with MaxQuant and ThermoFisher (TF: for MSFileReader – needed for MS files
from TF instruments)
.NET Framewortk 4.5 or higher has to be installed (refer to the MaxQuant download and
installation guide)
“Regional and Language Options” have to be set in English
MSFileReader has to be installed (see the MaxQuant download and installation page)
MaxQuant: no installation necessary, just run the downloaded MaxQuant.exe
(Andromeda is already included in the MaxQuant download; downloading Andromeda
itself is therefore only necessary if you want to use it as a standalone search engine)
1.3 How does it work?
software for analyzing proteomics raw data – peptide and protein identification and
quantification
Andromeda: fully integrated search engine, probability-based (works in the background)
posterior error probabilities, FDRs are calculated in MaxQuant
steps in MQ: feature detection initial Andromeda search recalibration main
Andromeda search posterior error probability calculation
main currency: 3D features (MS1) – 2D peaks are detected and assembled into 3D peaks
(two 2D peaks in adjacent scans are connected when Δm< 7 ppm; also next to nearest
scan is checked to account for low-quality/ missing data)
3D features are derived from multiple mass measurements for each peak, standard
deviation of the mass measurement can be calculated to obtain a separate mass tolerance
window for each peptide for database search
isotope pattern assembly – 3 main criteria for assembly: mass difference is ~1/z, average
isotope pattern (model how isotope pattern would look like for an average peptide,
correlate this to the observed isotope patterns), elution profile (isotopic peaks have to co-
elute perfectly)
MS1 label pair detection (for SILAC experiments – assemble the label pairs) – 3 main
criteria: mass differences between monoisotopic masses, correlation of isotope patterns,
close in retention time, including little shifts, e.g. for deuterium (for label triplets: same
concept, just run 3 times)

3
eliminating systematic error via recalibration: initial Andromeda search + calculation of
mass errors, calculation of correction factors for data
recalibration results in high mass accuracy (also good for database search)
1.3.1 Protein groups and razor peptides
proteins, which cannot be unambiguously identified by unique peptides (but have only
shared peptides) are grouped in one protein group and quantified together
e.g. if all detected peptides of protein A can also belong to protein B, A and B form one
protein group (even if unique peptides were detected for B, as it is still unclear whether A
is in the sample or not) in the output, there will be e.g. in the peptide count and in the
sequence length two numbers, but only one common quantification will be calculated
razor peptides are peptides which are shared between protein groups (e.g. protein X and
protein Y are unambiguously identified via unique peptides, but nevertheless share a
common peptide)
1.4 Label-free quantification in MaxQuant
1.4.1 Quantification possibilities in general
relative quantification: quantitative ratio or relative change of one protein between
samples
absolute quantification: copy numbers or concentration of protein within a sample
(challenge: different peptide species with various ionization efficiencies have to be
quantitatively compared within the same sample)
both: label-based (relative: e.g. SILAC, ICAT, TMT; absolute: e.g. AQUA) or label-free
possible
1.4.2 label-free quantification
comparing abundances at data level very robust workflow important, as variations can
be introduced at all steps of the workflow
ion intensities: more accurate than spectral counts (spectral counts: higher stochasticity)
dynamic range with spectral counting: 3 orders of magnitude
dynamic range for intensities: 6 orders of magnitude
spectral counting: quantification based on spectral counting and concomitant
identification (MS/MS)
extracted ion chromatogram (XIC): quantification based on peptide-ion intensity (MS)
and subsequent identification (MS/MS)
relative label free quantification
comparing abundance of the same peptide species/protein across runs
absolute label-free quantification
compare amounts of different proteins in one and the same sample

4
properties of peptides are important (2 peptides with same abundance: different MS
responses possible – different quantification results)
measured via (e.g.) Proteomic Ruler, spectral counting (emPAI, APEX), ion intensities
(MaxLFQ, Top3, (r)iBAQ, TPA)
- PAI = #observed peptides/ #theoretical peptides (linear relationship with the
logarithm of protein concentration in LC-MS/MS experiments)
- emPAI (exponentially modified PAI) = 10PAI-1
- protein content (weight%) = emPAI x Mr/ Σ(emPAI x Mr)*100
- APEX = spectral counts/ #expected peptides
- TOP3: (Σ intensity) of the 3 highest intense peptides (based on 3 best flyers) –
problematic, as often less than 3 peptides are observed
- iBAQ: Σ intensity/#theoretical peptides
- TPA: Σ intensity/molecular mass
- absolute scaling: either spike-in or label-free
- spike-in: spike in a reference of known amount, extrapolate to all other proteins
- label-free: scale according to the total protein amount (per cell)
- MS: not inherently quantitative (peptides have vastly different flyabilities)
- but: MS intensity strongly correlated with input amount (protein mass):
protein mass/ total protein mass is approx. equal to protein MS signal/
total MS signal one “just” needs to correct for protein size and add an
absolute scale
- proteomic ruler (plugin in Perseus)
- fraction of one protein in relation to total signal (e.g. ppm)
- total signal: e.g. total protein mass injected, or: absolute amount
known for a fraction of proteins – rest can be calculated
- e.g. for eukaryotes: histones are among the most abundant proteins,
mass ratio DNA:histones is approx. 1:1, so if ploidy of cells is known,
this provides an absolute scale – DNA provides constant baseline
- ignores the problem of different ionization and digestion efficiency
(should average itself out)
1.4.3 Posterior Error Probability (PEP)
= probability of a peptide being wrongly identified
target-decoy-based
calculated depending on several peptide properties: p(X=false|score, peptide length,
#modifications, #missed cleavages, charge) (score: probability-based score from
Andromeda)
data harmonization: calculated separately for different types of experiments (e.g. SILAC,
label-free, TMT, HCD, ECD, …)
PSMs (peptide spectrum matches) from heterogenous datasets become comparable
2-level FDR control: peptide level, protein group level (standard: 1 %):
- PSM-FDR:
- posterior error probability calculation based on target-decoy search
- integration of database search score and peptide properties (length, missed
cleavages, #modifications)
5
- protein group FDR
- based on target-decoy search
- razor peptide assignment
- protein FDR
- protein score = product of peptide PEPs (one for each sequence)
- after application of PEP cutoff
- razor protein FDR
- alternatives: best peptide, iProphet
1.4.4 Match between runs
peptides, which are present in several samples, but not identified via MS/MS in all of
them: can still be identified via matching between runs boosts number of
identifications
matching takes place at the fraction level: e.g. fraction 1 will be matched with all fractions
1 and 2, fraction 2 will be matched against all fractions 1, 2 and 3, fraction 3 will be
matched against all fractions 3 or 2 if only the fractions of one sample are to be
matched against each other, but not to the fractions of the other sample: label e.g.
fractions of one sample as 1, 2, 3 and the fractions of the other sample as 11, 12, 13 (this
labelling takes place in the actual setup of the search, see below)
samples that are reasonably similar to each other (e.g. treated vs. untreated): retention
times are highly correlated, narrow range of retention time shifts – use retention time
(so that you know where to look) and mass to match the identifications from one run to
another
important that samples were analyzed with the same chromatographic method
1.4.5 Normalization
normalization is used in the MaxQuant LFQ algorithm for label-free quantification (see
Cox et al. 2014, Accurate proteome-wide label-free quantification by delayed
normalization and maximal peptide ratio extraction, termed MaxLFQ, Molecular &
Cellular Proteomics 13, 2513-2526)
pre-fractionation: introduces biases
normalization of contribution of individual fractions calculation of normalization
factors (to correct e.g. for somewhat different injection volumina)
assumes that samples are “relatively” similar: background of similar proteins should be
present (largest part of proteins not influenced, smaller part influenced) as long as the
same core set of proteins is present (even if this has quantitative changes), the
normalization still works
works e.g. with time series from one step to the next, if there is still overlap (even if the
first and last step are completely different)
does not work if very different protein sets are present in different samples – if it does
not work: (very) large error message appears [“System.Exception: There are problems
with normalizing file…”])
and here a somewhat more detailed explanation (freely paraphrased and shortened from
Cox et al. 2014): For correction against biases due to sample fractionation, each fraction
6
has to be normalized separately. To do this, the total peptide ion signals are needed. But
the signals belonging to one peptide are often spread over several fractions of one
sample. Therefore, to retrieve the total peptide ion signal, one has to know the
normalization factors for the fractions. This poses a hen-egg-problem, which has been
solved in MaxQuant in the following way: Firstly, the intensities for a peptide are
summed up over the factions of one sample with introducing the normalization factors as
unknown variables. These normalization factors are then calculated by an optimization
approach, where the overall proteome change should be kept minimal. This is based on
the assumption that most proteins do not or only minimally change between conditions,
to have a constant baseline (the algorithm still works with (quantitative) changes in
about 1/3 of all proteins, as stated in Cox et al. 2014). As the calculation effort growths
quadratically with the number of samples, it is not feasible for many samples to compare
every sample to every other. Therefore, in “FastLFQ”, for more than 10 samples (whole
samples, not fractions) a sample is compared with a certain number of other,
neighboring samples, where the minimum and average number of samples to be
compared with can be specified. “Neighboring” in this case refers to the samples which
are the most similar to the sample in question, i.e. which show the most peptide overlap.
1.5 Dependent peptide search
dependent peptides:
- unknown modifications
- additional protease cleavage
- amino acid substitution
dependent peptides show mass shifts in comparison to the unmodified ones (number
of modifications is not limited)
dependent peptides: can only be found if there is also the unmodified one (instead of
theoretical spectra from a database, the observed identified spectra are used for
identifying observed, unidentified spectra)
dependent peptide search only finds highly abundant peptides
time consuming search, but a lot more identifications are possible
global parameters advanced identification dependent peptides (on top of other
searches – can also be done after a search without dependent peptides is finished by re-
using the results from the first search)
results can be found in: allPeptides.txt
1.6 Output tables
1.6.1 General
output tables can be found in the folder: combined txt
tables.pdf (also in combined txt): describes the other tables
second way to find the output tables: MaxQuant Viewer – tabs in the right sub-window
7
1.6.2 Scans
msms.txt: identified MS/MS events
msmsScans.txt: all acquired MS/MS events (identified and unidentified)
- precursor apex fraction: distance to apex at MS/MS event (if always very low:
increase MS instrument threshold)
- base peak fraction: relative abundance in comparison to base peak (base peak=most
intense peak in the spectrum) (gives idea about dynamic range covered)
- precursor ion fraction: important for TMT quantification
- examples for assessing spectral quality:
- filtered peaks – top N peaks per 100 Da (peaks which are to be used for
database search after processing the raw MS/MS spectrum, sensitive parameter
for accessing the instrument performance, identified spectra: have much more
filtered peaks than unidentified spectra, reason for that not completely clear)
- intensity ratios between fragmented and precursor ions (ideally, all precursors
would be fragmented – sum of the intensities of fragment ions should be
identical to precursor ion intensities– if large shifts of the ratio between the sum
of the fragment to the total precursor intensities from 1: low transmission –
clean instrument)
msScans.txt: all MS scans (scan number, retention time, ion injection time, ion current,
acquisition cycle)
1.6.3 Identification
ProteinGroups.txt: identified protein groups, including quantification, protein
properties, sequence coverage, peptide counts (all, razor, unique), who was protein
identified (MS/MS or only match between runs), Q values and Andromeda scores (e.g.
for filtering)
- “+” in “Only identified by side” column: proteins which where only identified by
PTMs, should not be counted when reporting the number of identified protein groups
- “Majority protein IDs”: contains proteins which have been filtered, so that they
contain at least half of the peptides belonging to the respective protein group
(whereas “Protein IDs” contains all proteins that have passed the identification
criteria for subsequent analyses (e.g. functional analysis), the “Majority protein
IDs” should be used)
PTMsites.txt: identified site modifications (for PTM-related experiments)
Peptides.txt: identified peptide sequences (e.g. possible to check protease activity by
peptide length and miscleavage rate), protein-specific information (to which protein
belongs a peptide, position of peptide in the protein sequence), peptide intensities, for
fractionation experiments: in which fraction did peptide appear (check fractionation
effiency)
evidence.txt: all identified LC-MS-features, identified by MS/MS or by matching between
runs, MS/MS events per identified feature, scores, mass deviation, feature information,
useful table also for troubleshooting (e.g. if very weird identifications – check for
example reproducibility of retention times, check uncalibrated mass error against
retention time, plot retention length, high re-sequencing rates: could be due to improper
dynamic exclusion)

8
1.6.4 Features
allPeptides.txt: all detected LC-MS features (feature characteristics; can be e.g. used to
plot all features against the ones targeted for MS/MS and identified ones)
1.6.5 Metadata
Summary.txt: overview of run – quick data quality control (e.g. which search parameters
where used, number of identified peptides, re-sequencing rate, average absolute mass
deviation)
parameters.txt: Overview over search parameters used for the MaxQuant search and
quantification
9
2. MaxQuant Tutorial
2.1 generally
start MaxQuant by just double-clicking MaxQuant.exe in the MaxQuant folder
hovering with the cursor over elements in MaxQuant will often produce an info text
always provide enough space on your hard drive, as a lot of files will be produced (if
MaxQuant runs out of space, it will crash)
if you do not know what a parameter is or does: do not change it
if something does not work/ MaxQuant crashes: you can ask the google group (see
http://www.coxdocs.org/doku.php?id=maxquant:common:google_groups) or report a
bug (see http://www.coxdocs.org/doku.php?id=maxquant:common:bug_reporting)
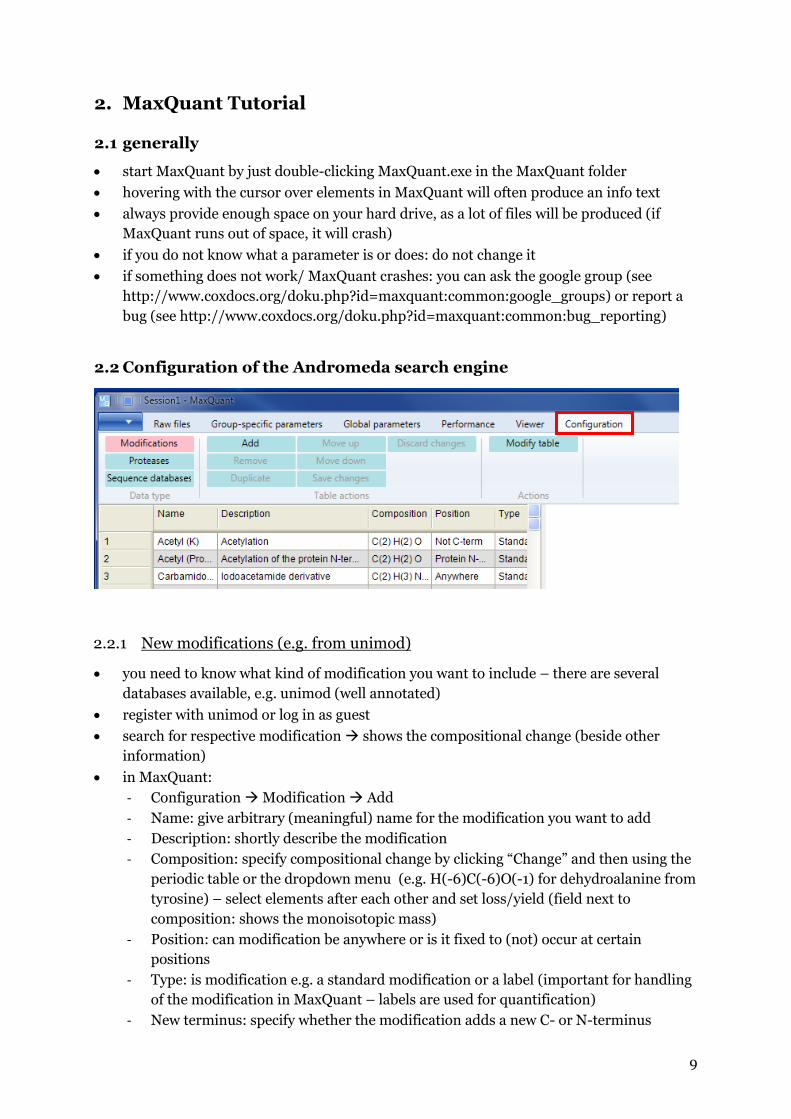
2.2 Configuration of the Andromeda search engine
2.2.1 New modifications (e.g. from unimod)
you need to know what kind of modification you want to include – there are several
databases available, e.g. unimod (well annotated)
register with unimod or log in as guest
search for respective modification shows the compositional change (beside other
information)
in MaxQuant:
- Configuration Modification Add
- Name: give arbitrary (meaningful) name for the modification you want to add
- Description: shortly describe the modification
- Composition: specify compositional change by clicking “Change” and then using the
periodic table or the dropdown menu (e.g. H(-6)C(-6)O(-1) for dehydroalanine from
tyrosine) – select elements after each other and set loss/yield (field next to
composition: shows the monoisotopic mass)
- Position: can modification be anywhere or is it fixed to (not) occur at certain
positions
- Type: is modification e.g. a standard modification or a label (important for handling
of the modification in MaxQuant – labels are used for quantification)
- New terminus: specify whether the modification adds a new C- or N-terminus

10
- Specificities: specify amino acids which are modified, neutral losses (can e.g. happen
for phosphorylation)
- %, TMT like – TMT and iTRAQ experiments have contaminations in channels, check
vendor for what is to be taken into account (TMTs and iTRAQ specify the correction
factors slightly different, check “TMT like” for TMT correction factors)
- modification will be saved in MaxQuant and always be available
close and re-open MaxQuant for the changes to take effect
2.2.2 Add a new label (for experiments working with labelled proteins)
configuration modifications add
element + x in the dropdown menu: stable isotopes of the respective element
add mass for labelled isotopes, substract from non-labelled counterparts (e.g.
Cx(+5)C(-5)Nx(+3)N(-3) for heavy vs. light histidine)
Type: Label
change amino acid etc. (analogous to new modification)
click “Modify table” – new modification appears in the table on the left
click “Save changes”
close and re-open MaxQuant for the changes to take effect
2.2.3 Configurate a protease
configuration Proteases add
name protease
describe protease
specify cleavage pattern in matrix (e.g. in front of alanine: click A+ in column headers
(click A- to remove this cleavage), but does not cleave in front of alanine, if there is a
proline in front of alanine: uncheck the box in the proline row)
modify table
save changes
close and re-open MaxQuant for the changes to take effect
2.2.4 Add a protein database
automatic generation of reverse database (do not use databases which already contain
reverse sequences!)
common contaminants list provided (attach list in MaxQuant do not use database
which already contains contaminants!)
databases can be downloaded from uniprot/ ensemble (if available there) – download
protein *.fasta file
add new *.fasta file reference: Configuration sequence database add select (on
the very right)
the name of the *.fasta file should not be changed (so that MaxQuant knows that the
respective *.fasta file is already configurated)

11
parse rules: use regular expressions (some are already provided by MaxQuant, for
further information see e.g. https://msdn.microsoft.com/en-us/library/az24scfc.aspx,
http://www.mikesdotnetting.com/article/46/c-regular-expressions-cheat-sheet)
add the taxonomic name of your organism (or the taxonomy number, if known), click the
left-pointing (right-pointing, respectively) arrow to let MaxQuant complete this part of
the form
add the parse rules according to your *.fasta-file header (for *.fasta-files with different
species: species info should be in *.fasta and in MaxQuant, to be able to distinguish
between species)
click the “Modify table”-button (changes made on the right will be transferred to the
table on the left)
click “Save changes”
close and re-open MaxQuant for the changes to take effect
2.3 Raw files
load raw files (also, whole folders can be loaded, or you can just drag-and-drop your
files)
for comparisons: best to search all samples which are to be compared together to get the
same protein groups for all samples
assign parameter group, experiment number, fractions
parameter group: e.g. SILAC- vs label-free samples, different proteases; different group-
specific parameters can then be set
experiment: everything that has the same name in the experiment column will be
combined in the output – e.g. all slices of one gel lane belong to one experiment
1
2
3
4
5
6

12
(everything that has the same identifier in experiment column will be summarized at the
end), technical replicates belong to different experiments (otherwise, the intensities
would be combined)
fractions: e.g. slices of a gel lane (fraction numbering is important for matching between
runs, see above)
2 possibilities for assigning these numbers:
1. write template:
- load files
- click “write template”
- generates a subfolder “combined” with the “experimentalDesignTemplate.txt” file in
the folder which contains the *.raw files open “experimentalDesignTemplate.txt”
in excel fill in your experimental design (numbers for fractions, names or
numbers for experiment) save as *.txt
- in MaxQuant: read from file choose appropriate *.txt
- highly recommended especially for larger experiments (but: parameter groups still
have to be assigned directly in MaxQuant)
2. directly in MaxQuant:
- mark appropriate files (several files can be marked at once) set experiment
assign number ok
- same for fractions (a range can be set, e.g. 1-10 for gel slice 1-10 of one lane)

13
2.4 MaxQuant Viewer
can be used for unprocessed and processed data (loaded files)
has an abundance of visualization functions, including relating identified features to MS
spectra
left window: click in corners – different control panels appear
more information: Tyanova et al. 2015, Proteomics 15, 1453-1456
2.5 Group-specific parameters
if different parameter groups have been specified (e.g. for different proteases): these
options have to be set for each group separately
2.5.1 Type
if labelled peptides are used: set labels (for label-free quantification, SILAC: leave Type
as “Standard” as default – quantification will be done on the MS1 level)
multiplicity: 1 for label-free (as there are no labels – quantification will only be done if
using LFQ, see below), 2 or 3 for SILAC (i.e. there are heavy, light (and intermediate)
peptides)
select labels for labelled peptides (e.g. Arg10, Lys8 in the heavy channel, nothing in the
light channel)

14
2.5.2 Digestion
specify digestion mode, enzyme, number of missed cleavages
unspecific: without specified peptidase
semispecific: for peptide mixtures which might show partial degradation (and have been
cleaved)
no digestion: if *.fasta file specifies the peptides directly
regarding trypsin/P: the corresponding MaxQuant web page
(http://www.coxdocs.org/doku.php?id=maxquant:andromeda:configuration:enzymes)
states: "[...] the commonly used definition is “Trypsin/P”, which also cleaves at carboxyl
side of the amino acids lysine or arginine, also if a proline follows […]"
2.5.3 Modifications
set modifications (oxidation, N-terminal acetylation are set by default, as it is extremely
likely that these will occur)
2.5.4 Label-free quantification
set LFQ (if you did not use labelled proteins and want to your proteins to be quantified)
after searching+quantification: 0 in LFQ table does not mean that the protein is absent,
but that there was not enough information
LFQ min ratio count = 1 (means that 1 peptide ratio is sufficient to report a protein ratio,
preferable most of the time)
FastLFQ (number of comparisons between samples increases exponentially with number
of samples, if each sample is compared with each other): switched on by default, but only
active for >10 samples (then, number of comparisons only increases linearly with
number of samples to speed the process up)
- minimum number of neighbors: with how many other neighboring samples (i.e.
whole samples (not single fractions) which show the highest similarity to the file in
question) will file at least be compared (for correction of bias introduced by pre-
fractionation)
- average number of neighbors: with how many other files will file be compared on
average
15
skip normalization: LFQ algorithm consists of normalization and quantification step, if
normalization fails, it has to be skipped (but: LFQ should probably not be used then,
anyway) – normally, this has to be left unchecked
2.5.5 Instrument
normally, nothing has to be (or should be) changed (necessary information is contained
in the *.raw files)
2.5.6 First search
first search: is used for normalization
if sample has probably many modifications: first search without/ with less modifications,
is then taken for normalization – speeds search up
separate enzyme can be used for first search (e.g. if you cleave a degraded peptide
mixture with trypsin, some peptides will be full-length tryptic peptides, these shall be
used for normalization)
2.5.7 Miscellaneous
for SILAC: turn re-quantify on (not necessary for label-free experiments) – if only one
partner of a label pair is detected: re-quantifies against the noise (thereby, more data is
generated)
match type: for match between runs, transfer of peptide identifications across runs –
options here: transfer of identifications in (match from and to) and between parameter
groups (e.g. group 0: deep library from HeLa cells, group 1: single-shot experiment: in
Group 0 match from, in Group 1 match to identifications from the library are matched
to the single-shot files); if you do not have different parameter groups: just leave it as
match from and to
no matching: match between runs is completely deactivated
2.6 Global parameters
2.6.1 Sequences
add file load configurated *.fasta-file (possible to load several ones)

16
Include contaminants tick (unless you want to have your own contaminants, then load
a *.fasta file which also contains contaminants or a separate one for only contaminants)
fixed modifications include (more) fixed modifications, if necessary
minimum peptide length: should not be too short, otherwise peptides will match to too
many different proteins
unspecific search (protease not specified): higher confidence necessary
2.6.2 Identification
set peptide and protein FDRs (default: 1 %)
site decoy fraction: FDR for specifying whether peptide has that specific modification or
not
razor protein FDR: by default Occams razor is used (a peptide which could belong to
different proteins is assigned to the protein that has the highest likelihood to be actually
present in the sample, so the shared peptide can only contribute to the identification
score of the protein group which has the highest probability of being in the sample
anyway) – one spectrum can only be used to calculate the identification score for one
protein group
2.6.3 Advanced identification
second peptides: on by default – if co-eluting peptides are also co-fragmented: with the
second peptide algorithm, both peptides can potentially be identified from one MS/MS
spectrum
Match between runs has to be switched on here, too, if wanted to be performed (the
specifications can normally be left at the default values)
dependent peptides: switch on if you want dependent peptides to be identified

17
2.6.4 Protein quantification
minimum ratio count: only relevant for SILAC; can then be set to 1
peptides for quantification: either all peptides are used (“all”), or only unique peptides
(“unique”), or unique and razor (“unique + razor”, then the razor peptides are used for
the protein group which has the most peptides assigned)
advanced ratio estimation (for light and heavy isotopes): if option is checked: either the
median of peptide feature ratios or the result of a regression analysis will be reported,
automatically based on which of both will fit the data better (the regression will
determine if there is an intensity dependency of the ratios for a given protein group – if
yes, using the median would result in underestimating the features)
the rest can normally be left at the default values
2.6.5 Label-free quantification
different parameter groups assigned: LFQs can be separated in parameter groups
(otherwise, they will contribute to the normalization of each other – separation could e.g.
be useful if there are many very different protein abundances in both groups)
stabilize large ratios: for ratios, on by default, helps to get reliable ratios if the ratios are
very large (e.g. if only one peptide can be directly compared between samples, but there
are more peptides belonging to the same protein present in at least one sample, basing
the quantification on this one peptide would cause the data to be very noisy and would
mean to throw information away if there is a large discrepancy in how many peptides
are there and how many peptides overlap between samples, the ratio of the sum of all
peptides is calculated)
tick “iBAQ” for calculation of iBAQ-values (intensity-based absolute quantification of
proteins)
LFQ: rel. quantification – for same protein across different samples
iBAQ: orthogonal comparison – for different proteins in the same sample
iBAQ values can be normalized by dividing them by the sum of iBAQs in the sample to
obtain relative iBAQs (riBAQs) (Shin et al. 2013, Nature Neuroscience 16, 365-374)
18
2.6.6 Tables
choose which tables you want to have/need (some of these are quite large and therefore
need a long time to be written – unchecking some of them can fasten the search)
2.6.7 Folder locations
e.g. temporary folder: place on SSD (if possible) for faster search
combined folder: here the actual output will be saved
Andromeda index: by default, the index files in the Andromeda search are in the “search”
folder, which itself is located in the “combined” folder; generated index files can be
shared between projects to save space on hard drive (Andromeda index file ~ 1 Gb)
2.6.8 MS/MS – FTMS, ITMS, TOF, Unknown
can normally be left at default settings
2.6.9 Advanced
can normally be left at default settings
Disable MD5 sum: skips calculation of MD5 sums on *.fasta files (MD5 sum calculation
is used to determine whether the *.fasta files were changed since generating the indices
for the Andromeda search; can be switched of for large *.fasta files to save time)
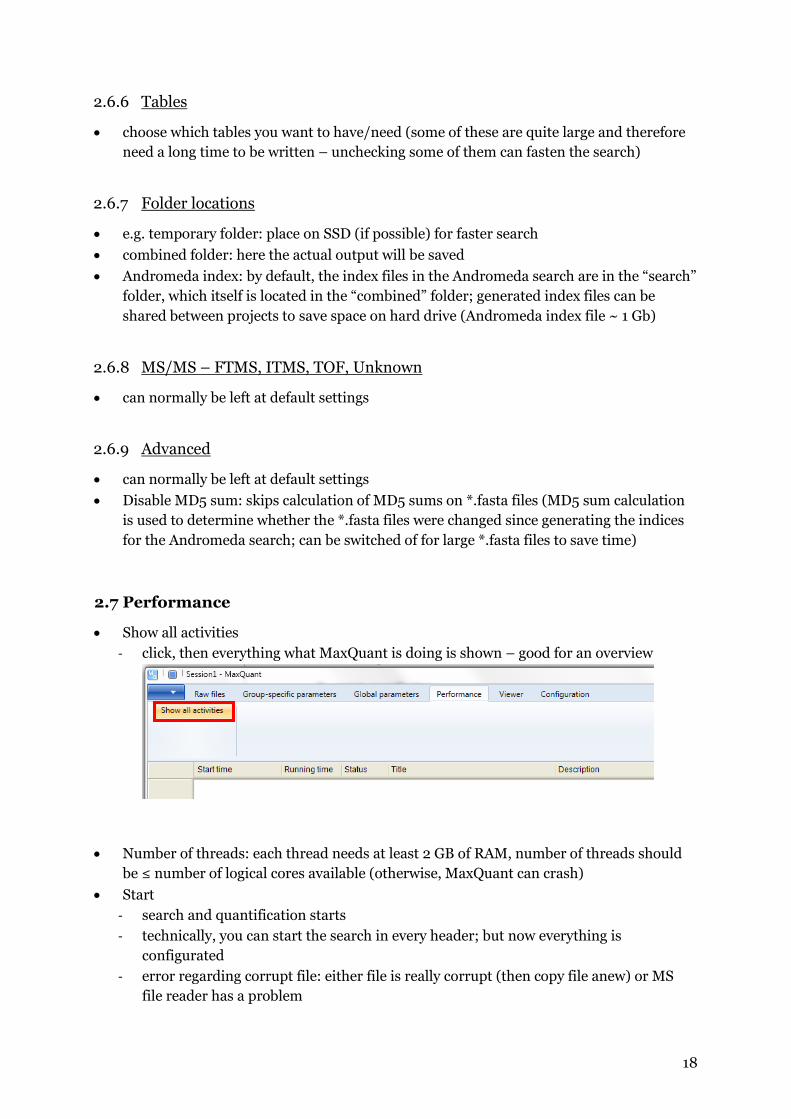
2.7 Performance
Show all activities
- click, then everything what MaxQuant is doing is shown – good for an overview
Number of threads: each thread needs at least 2 GB of RAM, number of threads should
be ≤ number of logical cores available (otherwise, MaxQuant can crash)
Start
- search and quantification starts
- technically, you can start the search in every header; but now everything is
configurated
- error regarding corrupt file: either file is really corrupt (then copy file anew) or MS
file reader has a problem

19
partial processing:
- if MaxQuant has crashed, the searched might be resumed from different fallback
positions (only possible if not failed during use of search engine itself – otherwise
everything has to be restarted; then the mqpar.xml-file written upon starting can be
used to reload the parameters – use the button on the very right, next to the “Raw
files”, to load the mqpar.xml)
- or: compare e.g. runs of SILAC *.raw files with and without re-quantification
References
Cox et al. 2014, Accurate proteome-wide label-free quantification by delayed
normalization and maximal peptide ratio extraction, termed MaxLFQ, Molecular &
Cellular Proteomics 13, 2513-2526
Tyanova et al. 2016, The MaxQuant computational platform for mass-spectrometry-
based shotgun proteomics, Nature Protocols 11, 2301-2319
www.coxdocs.org
msdn.microsoft.com/en-us/library/az24scfc.aspx
www.mikesdotnetting.com/article/46/c-regular-expressions-cheat-sheet
“Max Quant” youtube channel
![Background Methods Results & ConclusionsMethods Design [quant → QUAL] Quant Data Collection. Phase 1: Quant. Phase 2: QUAL . Quant Data Analysis. QUAL Data Analysis . Integration](https://img.pdfslide.us/doc/110x75/6000faa49b2cd844807c19b1/background-methods-results-conclusions-methods-design-quant-a-qual-quant.jpg)

![arXiv:1410.7188v3 [quant-ph] 28 Apr 2015arXiv:1410.7188v3 [quant-ph] 28 Apr 2015 The Functional Analysis of Quantum Information Theory — a collection of notes based on lectures by](https://img.pdfslide.us/doc/110x75/5f4586b390d8e77734697a1b/arxiv14107188v3-quant-ph-28-apr-2015-arxiv14107188v3-quant-ph-28-apr-2015.jpg)