Embed Size (px)
Citation preview
©20
16N
atu
re A
mer
ica,
Inc.
All
rig
hts
res
erve
d.
protocol Update
natUre protocols | VOL.11 NO.12 | 2016 | 2301
IntrodUctIonData analysis is one of the major challenges of modern MS-based shotgun proteomics experiments1,2. The raw data throughput is similar to that involved in genome sciences, for example, in RNA-seq experiments. The MaxQuant software has helped many proteomics laboratories to overcome this computational hurdle since its initial publication in 2008 (ref. 3). MaxQuant has undergone continual development since then and has matured into a comprehensive proteomics platform supporting the analysis of MS data gener-ated by MS systems from most vendors, including Thermo Fisher Scientific, Bruker Daltonics, AB Sciex and Agilent Technologies. It integrates a multitude of algorithms, enabling complete analysis of MS data starting from raw liquid chromatography (LC)–MS runs and offers additional modules for visualization of spectra and 3D LC–MS data4,5 (Fig. 1). One of the major strengths of MaxQuant is that, by the application of advanced algorithms, it substantially improves mass precision6 as well as mass accuracy7.
The most notable change to MaxQuant since the initial pro-tocol8 is that it now has its own peptide database search engine, called Andromeda9. It has been keeping up with recent advances in high-resolution instrumentation and with the development of fragmentation techniques. Tandem spectra generated with colli-sion-induced dissociation (CID), higher-energy collisional dis-sociation10,11 (HCD) and electron transfer dissociation12 (ETD) can readily be analyzed with MaxQuant. For each of them, a customized multilevel scoring scheme is applied to optimize the identification of peptides for each specific fragmentation technique. Hybrid techniques such as electron-transfer/higher-energy collision dissociation (EThCD)13 are also supported in the Andromeda’s scoring function. Furthermore, MaxQuant can identify more than one peptide from each MS/MS spectrum, as it performs a ‘second peptide’ search specifically looking for signals resulting from co-fragmentation of additional precursors9.
MaxQuant employs the target-decoy search strategy14 (Box 1) in order to estimate and control the extent of false-positive identifications. As shotgun proteomics analysis is based on
peptides, which then have to be assembled into proteins, false positives need to be controlled at different levels of complexity. Therefore, we provide a complete workflow supporting reliable identification of peptides, proteins and PTM sites. Within the target-decoy strategy we use the concept of posterior error probability (PEP) to integrate multiple peptide properties, such as length, charge and number of modifications, together with the Andromeda score into a single quantity reflecting the quality of a peptide spectrum match (PSM). This serves purposes similar to alternative machine learning–based approaches15. Whereas the PEP provides statistical evidence for individual PSMs, further workflows control global FDRs at several tiers, including PSM, protein group (Box 2) and PTM site levels.
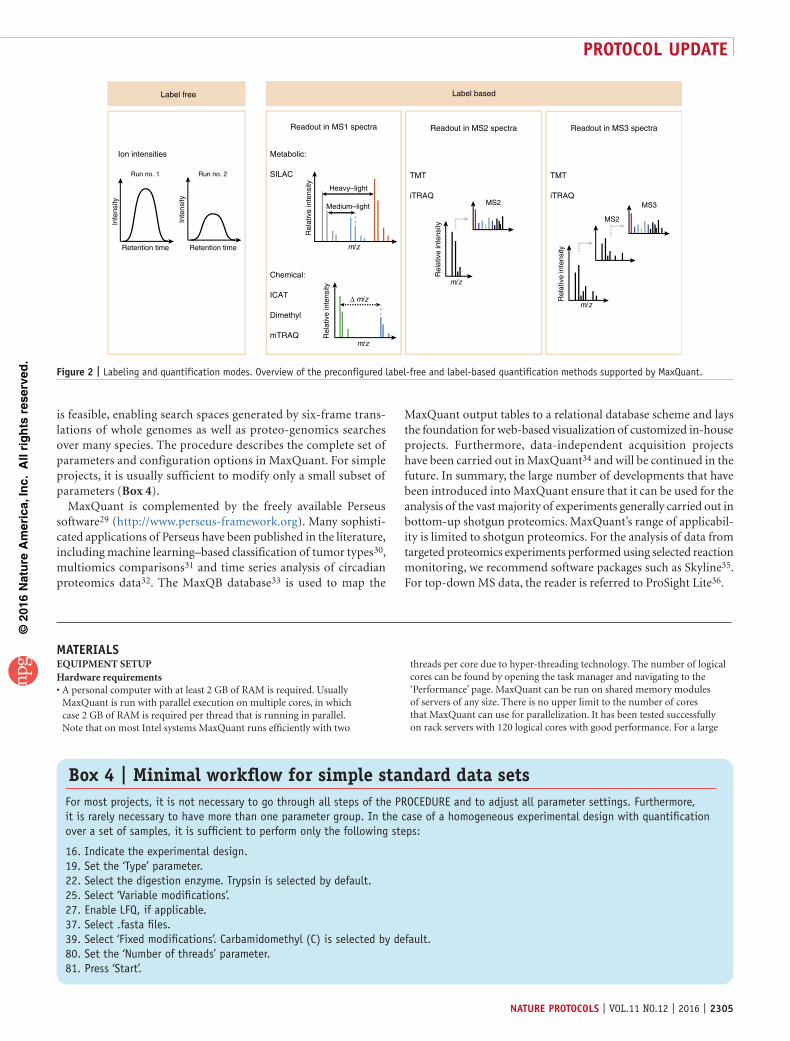
MaxQuant can be used for analyzing data derived from all major relative quantification techniques. Commonly used techniques include label-free quantification (LFQ), MS1-level labeling and isobaric MS2-level labeling readouts (Box 3; Fig. 2). The MaxLFQ16 workflow is an integral part of MaxQuant that enables accurate proteome-wide quantification without labeling, even for samples with peptide or protein pre-fractionation before mass spectrometric analysis. Metabolic or chemical labeling (e.g., Stable isotope labeling with amino acids in cell culture (SILAC)17 and di-methyl18 labeling, respectively) methods are supported at the survey scan level; MaxQuant has the ability to configure these types of labels. Furthermore, we provide quantification algo-rithms for all common forms of tandem mass tags (TMT)19 and isobaric tags for relative and absolute quantitation (iTRAQ)20 labeling, including higher-plex TMT with more than one reporter per nominal mass21 and multinotch MS3 quantification22.
PTMs are identified using a site-level FDR (see ‘Site decoy fraction’ in Box 1) and quantified for label-free and all labeling workflows. In the scoring of PTM-containing peptides, modi-fication-specific neutral losses and diagnostic peaks are taken into account. Modified peptides, such as phosphopeptides, are often enriched prior to MS analysis23, for instance, by using
The MaxQuant computational platform for mass spectrometry–based shotgun proteomicsStefka Tyanova1,2, Tikira Temu1,2 & Juergen Cox1
1Computational Systems Biochemistry, Max-Planck Institute for Biochemistry, Martinsried, Germany. 2These authors contributed equally to this work. Correspondence should be addressed to J.C. ([email protected]).
Published online 27 October 2016; doi:10.1038/nprot.2016.136
MaxQuant is one of the most frequently used platforms for mass-spectrometry (Ms)-based proteomics data analysis. since its first release in 2008, it has grown substantially in functionality and can be used in conjunction with more Ms platforms. Here we present an updated protocol covering the most important basic computational workflows, including those designed for quantitative label-free proteomics, Ms1-level labeling and isobaric labeling techniques. this protocol presents a complete description of the parameters used in MaxQuant, as well as of the configuration options of its integrated search engine, andromeda. this protocol update describes an adaptation of an existing protocol that substantially modifies the technique. Important concepts of shotgun proteomics and their implementation in MaxQuant are briefly reviewed, including different quantification strategies and the control of false-discovery rates (Fdrs), as well as the analysis of post-translational modifications (ptMs). the MaxQuant output tables, which contain information about quantification of proteins and ptMs, are explained in detail. Furthermore, we provide a short version of the workflow that is applicable to data sets with simple and standard experimental designs. the MaxQuant algorithms are efficiently parallelized on multiple processors and scale well from desktop computers to servers with many cores. the software is written in c# and is freely available at http://www.maxquant.org.
©20
16N
atu
re A
mer
ica,
Inc.
All
rig
hts
res
erve
d.
protocol Update
2302 | VOL.11 NO.12 | 2016 | natUre protocols
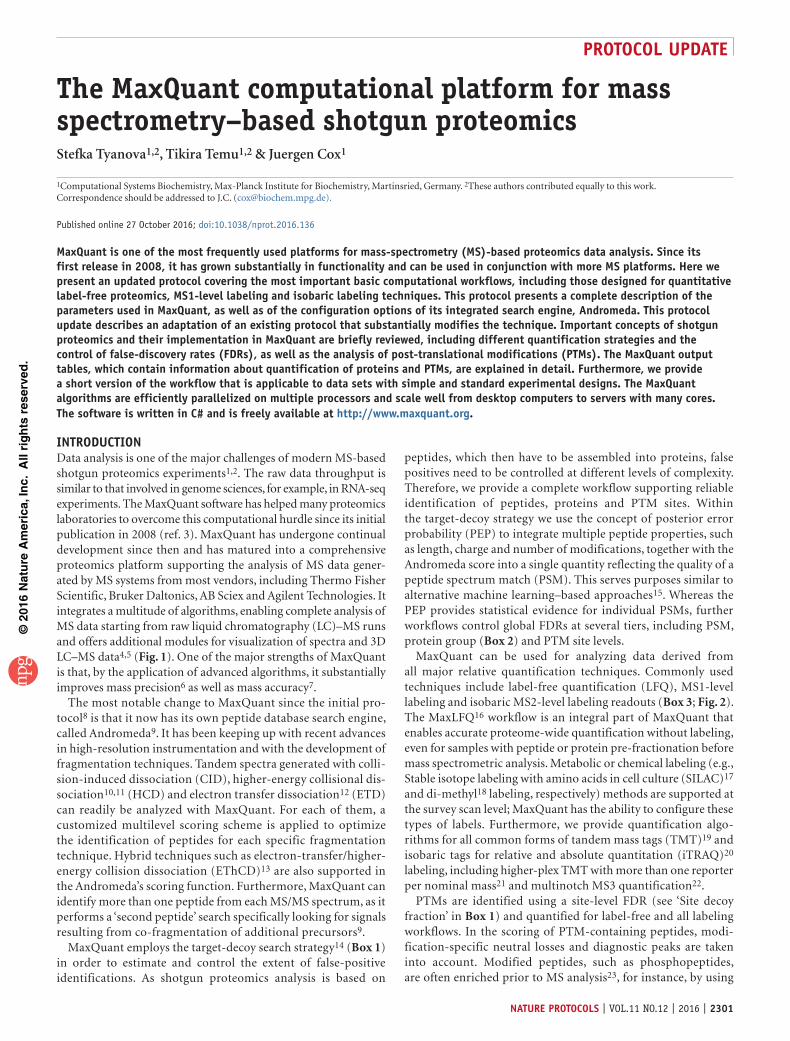
Figure 1 | Overview of the computational workflow. MaxQuant supports the processing of raw data derived from Thermo Fisher Scientific, Bruker Daltonics, AB Sciex and Agilent Technologies mass spectrometry systems. After specifying the minimum set of required (Box 3) and optional parameters, the workflow passes through 12 main steps, including feature detection, first and main search, and peptide/ protein identification and quantification. The results can be visualized in the MaxQuant Viewer module5 or be further analyzed using the Bioinformatics platform Perseus to gain biologically meaningful insights. *Requires the installation of vendor-specific software to read the measured raw data. To read files derived from Thermo Fisher Scientific mass spectrometry systems, installation of the MSFileReader is required; it is downloadable from https://thermo.flexnetoperations.com/control/thmo/RegisterMemberToAccount. **Optional step of the workflow. It depends on the parameter settings of the MaxQuant analysis.
Inte
nsity
m/z
MS/MS
Reporterion–basedTMT, iTRAQ
m/z
Inte
nsity
Run no. 1
Run no. 2
Stable isotope-basedSILAC, dimethyl Label free
FASTA>>>>>>>
FASTA>>>>>>>
New protease
Protein
Inte
nsity
m/z
Component 1 DifferenceCom
pone
nt 2
Sig
nific
ance
Replica 1
Rep
lica
2
R = 0.95
Applying FDR
FASTA>>>>>>>
Group A Group B
Optional as .txt file
Mass
420
–2Mas
s er
ror
(p.p
.m.)
m/z (Th)300 500 700 900 1,100
m/z (Th)300 500 700 900 1,100
420
–2Mas
s er
ror
(p.p
.m.)
m/z m/z
Inte
nsity
y1
y2
y3
y4
y5 y6
b1 b4
b5 b6
b2
b3
Ret
entio
n tim
e Map view
P E P T I D E
b1
y6
b2
y5
b3
y4
b4
y3
b5
y2
b6
y1
Protein A Protein B
Uniquepeptides
Non-uniquepeptides
Protein group assembly
Protein quantification
Protein group 1
Viewer tab of MaxQuant.exe
Result inspection
Perseus.exe
Downstream bioinformatics
View measured spectraViewer tab of MaxQuant.exe
Andromeda configuration tab of MaxQuant.exe
First search Main search
Optional Settings
Definition of new modifications, labels,proteases and search databases
Different search databasefor first and main searches
Search databaseFile in .fasta format
Experimentaldesign
Required Settings
MaxQuant.exe
Feature detection
Raw file upload
First search
Recalibration
Main search
Mass precalculation
Applying FDR
Second peptide (SP) search
Applying FDR (SP)
Protein quantification
Matching between runs**
Protein assembly
Writing tables
.baf.wiff.raw* .dat
Thermo Fisher Scientific Orbitrap Bruker Q-TOF AB Sciex Q-TOF Agilent Q-TOF
Pool of identifiedpeptides
recalibration
Retention
time
MS/MS view
MQ
MQ
©20
16N
atu
re A
mer
ica,
Inc.
All
rig
hts
res
erve
d.
protocol Update
natUre protocols | VOL.11 NO.12 | 2016 | 2303
TiO2 beads24. Site occupancies can then be calculated when, in addition to the PTM-enriched samples, the full proteomes have been measured as well25.
MaxQuant offers an additional workflow for the unbiased search for protein modifications in non-PTM-enriched samples
with rigorous FDR control. This algorithm has not yet been published, but is based on the ‘ModifiComb’ and ‘mass-tolerant search’ ideas described in Savitski et al.26 and Chick et al.27. Here, the set of all MS/MS spectra that were not identified in the Andromeda search is submitted to another search level against
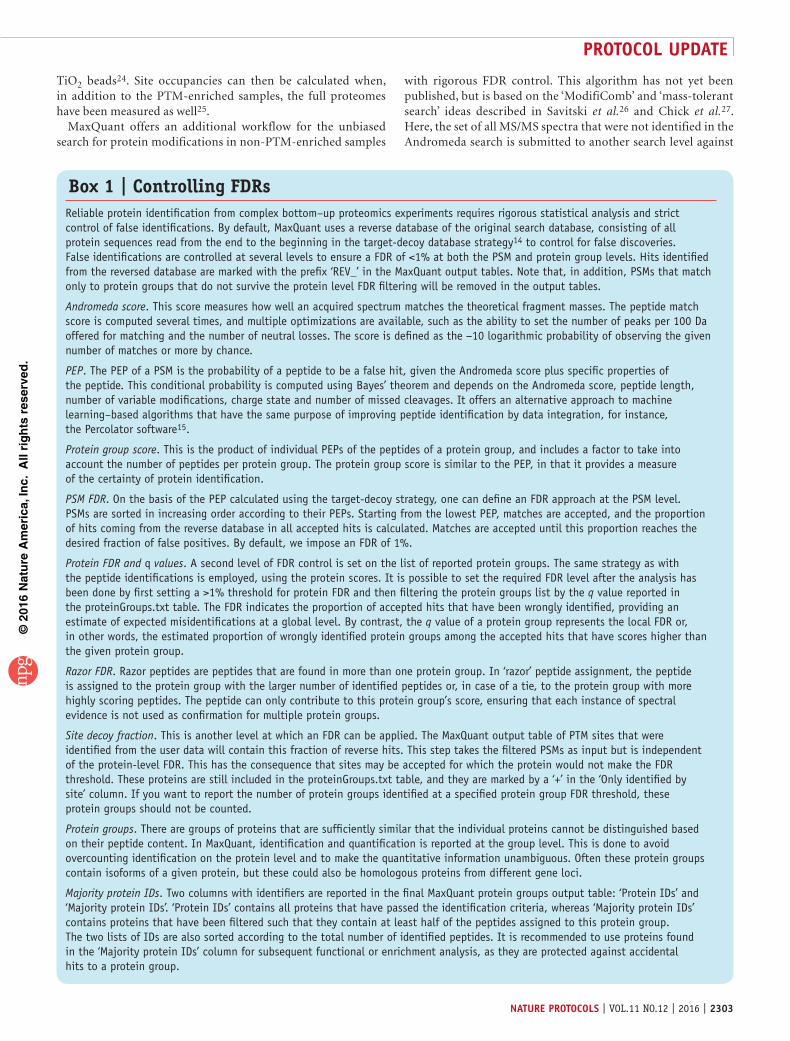
Box 1 | Controlling FDRsReliable protein identification from complex bottom–up proteomics experiments requires rigorous statistical analysis and strict control of false identifications. By default, MaxQuant uses a reverse database of the original search database, consisting of all protein sequences read from the end to the beginning in the target-decoy database strategy14 to control for false discoveries. False identifications are controlled at several levels to ensure a FDR of <1% at both the PSM and protein group levels. Hits identified from the reversed database are marked with the prefix ‘REV_’ in the MaxQuant output tables. Note that, in addition, PSMs that match only to protein groups that do not survive the protein level FDR filtering will be removed in the output tables.
Andromeda score. This score measures how well an acquired spectrum matches the theoretical fragment masses. The peptide match score is computed several times, and multiple optimizations are available, such as the ability to set the number of peaks per 100 Da offered for matching and the number of neutral losses. The score is defined as the −10 logarithmic probability of observing the given number of matches or more by chance.
PEP. The PEP of a PSM is the probability of a peptide to be a false hit, given the Andromeda score plus specific properties of the peptide. This conditional probability is computed using Bayes’ theorem and depends on the Andromeda score, peptide length, number of variable modifications, charge state and number of missed cleavages. It offers an alternative approach to machine learning–based algorithms that have the same purpose of improving peptide identification by data integration, for instance, the Percolator software15.
Protein group score. This is the product of individual PEPs of the peptides of a protein group, and includes a factor to take into account the number of peptides per protein group. The protein group score is similar to the PEP, in that it provides a measure of the certainty of protein identification.
PSM FDR. On the basis of the PEP calculated using the target-decoy strategy, one can define an FDR approach at the PSM level. PSMs are sorted in increasing order according to their PEPs. Starting from the lowest PEP, matches are accepted, and the proportion of hits coming from the reverse database in all accepted hits is calculated. Matches are accepted until this proportion reaches the desired fraction of false positives. By default, we impose an FDR of 1%.
Protein FDR and q values. A second level of FDR control is set on the list of reported protein groups. The same strategy as with the peptide identifications is employed, using the protein scores. It is possible to set the required FDR level after the analysis has been done by first setting a >1% threshold for protein FDR and then filtering the protein groups list by the q value reported in the proteinGroups.txt table. The FDR indicates the proportion of accepted hits that have been wrongly identified, providing an estimate of expected misidentifications at a global level. By contrast, the q value of a protein group represents the local FDR or, in other words, the estimated proportion of wrongly identified protein groups among the accepted hits that have scores higher than the given protein group.
Razor FDR. Razor peptides are peptides that are found in more than one protein group. In ‘razor’ peptide assignment, the peptide is assigned to the protein group with the larger number of identified peptides or, in case of a tie, to the protein group with more highly scoring peptides. The peptide can only contribute to this protein group’s score, ensuring that each instance of spectral evidence is not used as confirmation for multiple protein groups.
Site decoy fraction. This is another level at which an FDR can be applied. The MaxQuant output table of PTM sites that were identified from the user data will contain this fraction of reverse hits. This step takes the filtered PSMs as input but is independent of the protein-level FDR. This has the consequence that sites may be accepted for which the protein would not make the FDR threshold. These proteins are still included in the proteinGroups.txt table, and they are marked by a ‘+’ in the ‘Only identified by site’ column. If you want to report the number of protein groups identified at a specified protein group FDR threshold, these protein groups should not be counted.
Protein groups. There are groups of proteins that are sufficiently similar that the individual proteins cannot be distinguished based on their peptide content. In MaxQuant, identification and quantification is reported at the group level. This is done to avoid overcounting identification on the protein level and to make the quantitative information unambiguous. Often these protein groups contain isoforms of a given protein, but these could also be homologous proteins from different gene loci.
Majority protein IDs. Two columns with identifiers are reported in the final MaxQuant protein groups output table: ‘Protein IDs’ and ‘Majority protein IDs’. ‘Protein IDs’ contains all proteins that have passed the identification criteria, whereas ‘Majority protein IDs’ contains proteins that have been filtered such that they contain at least half of the peptides assigned to this protein group. The two lists of IDs are also sorted according to the total number of identified peptides. It is recommended to use proteins found in the ‘Majority protein IDs’ column for subsequent functional or enrichment analysis, as they are protected against accidental hits to a protein group.

©20
16N
atu
re A
mer
ica,
Inc.
All
rig
hts
res
erve
d.
protocol Update
2304 | VOL.11 NO.12 | 2016 | natUre protocols
the already identified MS/MS spectra as database. For that pur-pose, an especially designed match score has been developed that, on the basis of the precursor mass difference between identified and unidentified MS/MS spectra, tries to position a hypothetical modification on each residue. The algorithm then checks whether the unidentified MS/MS spectrum can be explained as a modified form of an already-identified spectrum.
In this way, the modifications are not restricted to a few pre-determined masses but instead a modification of any mass or composition can, in principle, be detected in an unbiased way.
Most of the processes in MaxQuant are efficiently parallelized to run on multicore systems scaling from common desktop com-puters to large server modules with more than a hundred logical cores28. Also the processing of large protein sequence .fasta files
Box 2 | Protein groupsThe proteome is characterized by a relatively high sequence redundancy. This results from different evolutionary processes and the presence of isoforms. In bottom-up proteomics, this situation leads to the problem that often a peptide cannot be uniquely associated with one protein of origin, which makes it impossible to unambiguously claim the presence of one protein over another. MaxQuant resolves this issue by collapsing all proteins that cannot be distinguished based on the identified peptides into protein groups. The rule is that if all peptides of a given protein are a subset of the peptides used for identification of another protein, these proteins will be merged in a protein group. A more complex situation arises when two protein groups are identified with distinct peptides, except for one that is shared between the two. In this case, the two groups cannot be combined, as they contain group-unique peptides and will thus be reported separately in the MaxQuant output table. Depending on the user-defined setting, the shared peptide will not be used for quantification (unique peptides only), or it will be used for the quantification of the protein group with a larger number of associated peptides (unique + razor peptides).
Box 3 | Quantification strategies Protein intensity. For protein groups, this is the sum of all identified peptide intensities for the group. Peptide-feature intensities are taken at the peak maximum over the elution profile and include all isotopic peaks.
Protein ratio. In the case of MS1-level labeling, this is the median of all peptide-feature ratios for the protein of interest. The ratio of a peptide feature (labeling doublet) is calculated from the ratios between pairs of corresponding centroids in the two 3D isotope patterns by a robust linear fit.
Normalized protein ratio. This is similar to protein ratio but with a normalization step applied at the level of peptide-feature ratios. The logarithmic ratios are shifted to zero median. This is done separately for different labeled amino acids and in an intensity- dependent way. Normalization by median subtraction is based on the assumption that the large population of proteins and their respective peptides do not exhibit substantial changes between any two conditions. Normalized ratios are preferable when the distribution of all logarithmic protein ratios is ‘well behaved’—i.e., unimodal or nearly normal. If the distribution is bimodal or more complex, normalization by median shift will not work, and it is preferable to use non-normalized ratios.
LFQ intensity. This is the relative protein quantification across all samples, and is represented by a normalized intensity profile that is generated according to the algorithms described in Cox et al.16. The LFQ intensities will form a matrix with the number of samples and number of protein groups as dimensions.
iBAQ protein intensity. Intensity-based absolute quantification44 is an approximation of protein copy numbers based on the sum of peptide-feature intensities of all peptides matching to a protein divided by the number of theoretically observable peptides (e.g., all fully tryptic peptides with a length cutoff for a tryptic digest). Using a spiked-in standard of proteins of known absolute molar amounts, it is possible to adjust the iBAQ intensities to represent even more accurately the absolute protein amounts. An alternative way of calculating copy numbers is described in Wisniewski et al.45.
Reporter intensity. These are the intensities multiplied by injection time (to obtain the total signal) for each isobaric labeling channel summed over all MS/MS spectra matching to the protein group. In addition, here one can use razor plus unique (which is the default) or only unique peptides. Reporter intensities come in two forms: the original ones and the ones for which the correction factors are applied. The columns referring to the letter one are indicated by the prefix ‘Corrected’.
Razor peptides. By default, peptides shared between different protein groups contribute only to the quantification of the group with the larger number of identifications or, in the case of a tie, to the protein group with peptides with higher scores. Alternatively, one could choose an approach in which only peptides that are unique to a protein group are used for quantification.
Requantify. In MS1-level labeling, some peptides have only a single isotope pattern (i.e., either the light or the heavy counterpart of the labeling pair is missing). MaxQuant can then try to find the missing peak by translating the peak shapes from the MS/MS spectrum of the present single peptide feature to the place in the LC–MS plane where the missing partner is expected. This process is called requantification. It tends to underestimate large ratios, so it should be applied only in cases in which the exact value of a ratio does not matter much, but one wants to get values for high ratios that would otherwise be outside of the dynamic range. In particular, ratios that are infinite in reality, e.g., due to a gene knockout, can be represented by finite ratios due to quantification against the noise level.
©20
16N
atu
re A
mer
ica,
Inc.
All
rig
hts
res
erve
d.
protocol Update
natUre protocols | VOL.11 NO.12 | 2016 | 2305
is feasible, enabling search spaces generated by six-frame trans-lations of whole genomes as well as proteo-genomics searches over many species. The procedure describes the complete set of parameters and configuration options in MaxQuant. For simple projects, it is usually sufficient to modify only a small subset of parameters (Box 4).
MaxQuant is complemented by the freely available Perseus software29 (http://www.perseus-framework.org). Many sophisti-cated applications of Perseus have been published in the literature, including machine learning–based classification of tumor types30, multiomics comparisons31 and time series analysis of circadian proteomics data32. The MaxQB database33 is used to map the
MaxQuant output tables to a relational database scheme and lays the foundation for web-based visualization of customized in-house projects. Furthermore, data-independent acquisition projects have been carried out in MaxQuant34 and will be continued in the future. In summary, the large number of developments that have been introduced into MaxQuant ensure that it can be used for the analysis of the vast majority of experiments generally carried out in bottom-up shotgun proteomics. MaxQuant’s range of applicabil-ity is limited to shotgun proteomics. For the analysis of data from targeted proteomics experiments performed using selected reaction monitoring, we recommend software packages such as Skyline35. For top-down MS data, the reader is referred to ProSight Lite36.
Label free
Retention time
Inte
nsity
Run no. 1
Retention time
Inte
nsity
Run no. 2
m/z
Rel
ativ
e in
tens
ity
∆ m/z
Label based
m/z
Rel
ativ
e in
tens
ity
MS2
m/z
Rel
ativ
e in
tens
ity
MS3
MS2
m/z
Rel
ativ
e in
tens
ity Heavy–light
Medium–light
Ion intensities
Readout in MS2 spectra
TMT
iTRAQ
Readout in MS1 spectra
Metabolic:
SILAC
Chemical:
ICAT
Dimethyl
mTRAQ
Readout in MS3 spectra
TMT
iTRAQ
Figure 2 | Labeling and quantification modes. Overview of the preconfigured label-free and label-based quantification methods supported by MaxQuant.
MaterIalsEQUIPMENT SETUPHardware requirements
A personal computer with at least 2 GB of RAM is required. Usually MaxQuant is run with parallel execution on multiple cores, in which case 2 GB of RAM is required per thread that is running in parallel. Note that on most Intel systems MaxQuant runs efficiently with two
•
threads per core due to hyper-threading technology. The number of logical cores can be found by opening the task manager and navigating to the ‘Performance’ page. MaxQuant can be run on shared memory modules of servers of any size. There is no upper limit to the number of cores that MaxQuant can use for parallelization. It has been tested successfully on rack servers with 120 logical cores with good performance. For a large
Box 4 | Minimal workflow for simple standard data sets For most projects, it is not necessary to go through all steps of the PROCEDURE and to adjust all parameter settings. Furthermore, it is rarely necessary to have more than one parameter group. In the case of a homogeneous experimental design with quantification over a set of samples, it is sufficient to perform only the following steps:
16. Indicate the experimental design.19. Set the ‘Type’ parameter.22. Select the digestion enzyme. Trypsin is selected by default.25. Select ‘Variable modifications’.27. Enable LFQ, if applicable.37. Select .fasta files.39. Select ‘Fixed modifications’. Carbamidomethyl (C) is selected by default.80. Set the ‘Number of threads’ parameter.81. Press ‘Start’.
©20
16N
atu
re A
mer
ica,
Inc.
All
rig
hts
res
erve
d.
protocol Update
2306 | VOL.11 NO.12 | 2016 | natUre protocols
Box 5 | Identification and quantification of PTMs PTM peptide ratios and intensities. Peptide-level quantification of all peptides that carry a modification (e.g., phosphorylation) can be found in the output file modificationSpecificPeptides.txt.
PTM-site ratios and intensities. For site-level quantification of modification, (e.g., phosphorylation sites), all ratios and intensities come in three versions, which are distinguished by the suffixes ‘_1’, ‘_2’ and ‘_3’, meaning that only peptides with single modifications, only peptides with double modifications and only peptides with triple (or more) modifications, respectively, are used for each quantification. The maximum number (here ‘_3’) can be changed by the user (Step 79).
Site occupancy. The proportion of proteins that are modified at this site in a given sample is calculated based on three ratios: the ratio of the amounts of modified peptide in two samples, the unmodified counterpart ratio and the protein ratio. The proteome should be measured at a suitable depth to ensure that the non-modified counterpart is also detected, and thus quantification of occupancies is possible. In SILAC experiments the ratio of two labeled states is used46, whereas in label-free experiments the ratio of two conditions is calculated25. Quantification is, in general, less accurate in label-free experiments in comparison with label-based methods. This accuracy improves with increased numbers of samples at different conditions, as there are more samples that can be used as references for each other. For calculating occupancy, it is necessary that the relationship between the sample and its reference be appropriate: to obtain accurate values, they cannot be too different or too similar. For this reason, time series data can be very useful for label-free occupancy quantifications.
Occupancy ratio. The occupancy ratio is similar to the site occupancy, with the difference that the ratio of occupied to unoccupied proteins is taken.
Occupancy error estimation. An error estimate is computed and reported for each occupancy estimate25. This is the structural error originating from properties of the occupancy formula, independent of the data and based on error propagation, assuming that individual ratio errors are the same and independent. Reliable occupancy estimations are characterized by errors much <1. Problematic cases include situations in which no large changes between the different states used for comparison exist, which then results in large errors.
Score. This is the best Andromeda score for a modified PSM, which takes into account neutral losses and diagnostic peaks in case of CID and HCD fragmentation. This score can be used as an additional filter on the quality of PSMs for a site. CID, HCD, ETD and EThcD are supported as fragmentation methods.
Delta score for modified peptides. The difference between scores of the best hit and the next best matching peptide with a different sequence is the delta score; it can also be used to filter for more reliable identification.
Localization probability. All possibilities of distributing the determined number of phosphorylated residues in a peptide (i.e., across all S, T and Y residues) are considered, and the respective Andromeda scores are computed. The localization probability for a site is then computed as the normalized combination of all probabilities for which this site was assigned to be modified.
Score difference. This quantity is defined for a site as the difference between scores of the best hit and the next best matching peptide with the same sequence but a different positioning of PTMs where this site is absent is the score difference; it can also be used to filter for more reliable localization.
number of cores, you must ensure that the input/output capacity can keep up by using solid-state disks or a suitable RAID (redundant array of inde-pendent disks) configuration. The disk should be large enough to hold all the raw data plus about half of their total size for intermediate and final out-put files. (See the crItIcal note in the Equipment setup and Steps 68–70 of the PROCEDURE, which describe strategies dealing with storage space.)
Software requirementsMaxQuant runs on 64-bit versions of Windows Vista SP2, Windows 7, Windows 8, Windows 10, Windows Server 2008 and Windows Server 2012 operating systems. As MaxQuant is a Windows-based application, users who rely on Mac computers need to use Windows emulation software such as Boot Camp and, optionally, Parallels Desktop in addition. ‘Regional and Language Options’ needs to be set to English. If not already existing,.NET Framework 4.5 or higher needs to be installed. Handling of Thermo Fisher Scientific, raw files requires a version of the Thermo Fisher Scientific MSFileReader software that is compatible with your, raw files. For downstream statistical and functional analysis we recommend our in-house-developed software, Perseus, which is freely available for download at http://www.perseus-framework.org.
Software installation Go to http://www.maxquant.org and navigate to the ‘Download and installation’ section. First-time users will be prompted to register and accept the software license agreement. Upon successful registration, a code is issued, which can then be used to download the latest version of MaxQuant. Unzip the downloaded file and store the
•
resulting MaxQuant folder anywhere on the computer that will be used for the MS data processing. No installation is required, and the software can be started by double-clicking the MaxQuant.exe file. Parameters such as labels, modifications, digestion enzymes and search databases can be configured directly in MaxQuant. (See PROCEDURE Steps 2–13). This protocol describes the features of MaxQuant version 1.5.6.0, which is permanently available at http://www.protocols.maxquant.org.
crItIcal Make sure that sufficient storage space is available on the hard disk containing the raw data. In addition to the raw files themselves, at least half of this space should be dedicated to temporary files generated by MaxQuant during the calculations. Alternatively, it is possible to specify a dedicated folder to store the output files, as well as to store the raw data on a separate storage medium (Steps 68–70).Example data sets We processed subsets of publicly available raw data from three publications with MaxQuant in order to provide examples of the expected output for major types of quantitative proteomics data. These are a HeLa label-free data set including phosphoproteome measurement25 (http://proteomecentral.proteomexchange.org, identifier: PXD000612), a mouse SILAC proteome data set37 (http://www.protocols.maxquant.org, SILAC_RawFiles folder) and a 10plex TMT data set38 (http://massive. ucsd.edu, identifier: MSV000079033). See the ANTICIPATED RESULTS section for further information.
©20
16N
atu
re A
mer
ica,
Inc.
All
rig
hts
res
erve
d.
protocol Update
natUre protocols | VOL.11 NO.12 | 2016 | 2307
procedUre crItIcal Here we describe the complete set of parameters and configuration options in MaxQuant. For simple projects it is usually sufficient to modify only a small subset of parameters (Box 4).andromeda search engine configuration1| Start MaxQuant by double-clicking the MaxQuant.exe file.
2| Go to the ‘Configuration’ tab.
3| Modify existing and/or add new modifications (Steps 3–10). On the ‘Modifications’ page, modify existing modifications or add new ones. To define a new modification, click on the ‘Add’ button in the top command ribbon. A new modification with default parameters will appear in the modifications table.
4| Set all properties of the new modification in the window that appears on the right-hand side. To define the composition of the modification, click the ‘Change’ button and select the elements and the corresponding numbers with which they appear. crItIcal step Make sure the ‘Type’ of modification is set correctly, as MaxQuant offers modifications as options in a context-specific way depending on the type.
5| If your method uses heavy isotopes such as 13C, 2H and 15N, specify these by selecting ‘Cx’, ‘Hx’ and/or ‘Nx’ in the drop-down menu, respectively.
6| If you want to look for terminus-specific reactions, use the New terminus parameter to specify whether the modification adds an additional C- or N-terminus-like group to the peptide that can take part in terminus-specific reactions. An example of this is the Gly-Gly ubiquitination residue at lysine, which adds an N terminus. Press the ‘+’ button and select an amino acid from the drop-down menu to define the modification specificity.
7| Define neutral losses and diagnostic peaks by using the ‘+’ button to add a new entry and the ‘N’, ‘S’ and ‘C’ buttons to set the corresponding parameters (‘name’, ‘short name’ and ‘composition’, respectively).
8| Provide a ‘Short Name’ for each modification. This defines how the label is denoted in the graphical user interface (Viewer) of MaxQuant5 (http://www.coxdocs.org/doku.php?id=maxquant:viewer:start). All information about properties of modifications, in particular, modification-specific neutral losses and diagnostic peaks, is stored locally in the file modifications.xml file, which is located in the ‘conf’ folder of MaxQuant.
9| If your experiment involves isobaric labeling, such as iTRAQ and TMT, correction factors to account for mixing between channels can be specified. These are defined as a percentage of the total amount or as a percentage of the main isotope for iTRAQ and TMT labeling, respectively. The specific values for these correction factors may vary from batch to batch and are provided by the vendors of the labeling reagents.
10| After setting all parameters, click on the ‘Modify table’ button to introduce the changes in the table. Click on the ‘Save changes’ button and restart MaxQuant to be able to see all changes in the MaxQuant parameter interface .
11| On the ‘Proteases’ page, examine the list of predefined digestion enzymes and their specificities. To add a new protease, click on the ‘Add’ button. Fill in the ‘Name’ and ‘Description’ fields. To modify the specificity matrix, use the buttons with ‘+’ and ‘−’ signs. For example, to define an enzyme that cleaves C-terminal to Lys but not if the residue is followed by Pro, click on the ‘K+’ row button and then deselect the ‘KP’ specificity by clicking on the ‘P−’ column button. Click on the ‘Modify table’ button, save the changes using the ‘Save changes’ button and restart MaxQuant to have all changes available in the interface.
12| On the ‘Sequence databases’ page, examine the list of databases. To configure a new search database, click on the ‘Add’ button. Use the ‘Search’ button in the form on the right to navigate to the desired .fasta file. Set the ‘database source’ (e.g., UniProt) and ‘taxonomy’ (the id is automatically filled in when an organism name is supplied and vice versa).
13| As .fasta headers can contain multiple types of information, it is possible to define multiple parse rules in Andromeda to extract those. Currently, the following options are supported: identifier—the protein name to be reported in the MaxQuant output table; description—any additional information; and taxonomy. Define a parse rule using regular
©20
16N
atu
re A
mer
ica,
Inc.
All
rig
hts
res
erve
d.
protocol Update
2308 | VOL.11 NO.12 | 2016 | natUre protocols
expressions (http://msdn.microsoft.com/en-us/library/az24scfc.aspx). To test the parse rules, click on the ‘Test rules’ button. Once all parameters have been set, press the ‘Modify table’ button, save the changes using the ‘Save changes’ button, and restart MaxQuant.
data upload14| Go to the ‘Raw files’ tab.
15| Load raw files by clicking on the ‘Load’ button to manually select files or by clicking on the ‘Load folder’ button to import an entire folder. crItIcal step Alternatively, for all raw files, the corresponding experimental design and all parameter values can be set by loading a previously created mqpar.xml file. To do this, go to the drop-down menu in the upper left corner of the MaxQuant main window, marked by the white arrow, and select ‘Load parameters’. Note that, if the location of raw files has changed since the previous processing, during which the mqpar.xml file has been generated, these files will be marked as ‘false’ in the ‘Exists’ column. To resolve the problem, select the table rows of the raw files with the wrong location, click on ‘Change folder’ and navigate to the correct folder location. The mqpar.xml files are available at http://www.protocols.maxquant.org.
16| The raw files are listed in a table with columns that can be filled in to specify the ‘Parameter group’, ‘Experiment’ and ‘Fraction’ for each LC–MS run. The ‘Parameter group’ enables the user to have different sets of ‘Group-specific parameters’ to be used for subsets of LC–MS runs. In this case, different search and/or quantification criteria will be used in subsets (e.g., the proteome and the corresponding phosphoproteome should be marked with different parameter groups, as the latter will be searched with other variable modifications). The ‘Experiment’ parameter indicates which LC–MS runs belong to which sample (e.g., if a sample is fractionated, all fractions should be marked with the same experiment name so that the quantification results can be merged into one entry in the output table). If pre-fractionation was applied, the corresponding fractions should be properly indicated as integer numbers. This is of particular importance for the ‘Matching between runs’ feature, which will only match features in the same or adjacent fractions. Fill in this table to specify the experimental design. To fill the table in manually, use the ‘Set experiment’, ‘Set fractions’ or ‘Set parameter group’ buttons to specify the parameters for each raw file. It is also possible to populate this table from a tab-separated text file. Either create the file yourself using the column headings shown on the screen or click on the ‘Write template’ button, which will generate a tab-separated text file that is best edited in Excel. If you are creating the file yourself, obviously take care to make sure that the ‘path’ to each raw file is accurate. Once you have created the file, click on the ‘Read from file’ button to populate the table in MaxQuant. crItIcal step Specifying the fractionation is important for a series of computational steps such as ‘Match between runs’ and the LFQ algorithm. In case each LC–MS run is a different sample (i.e., no pre-fractionation has been done), using the ‘No fractions’ button conveniently fills up the Experiment column with raw file name-derived values.
Group-specific parameters17| Navigate to the ‘Group-specific parameters’ tab.
18| Select the desired parameter group by clicking on it in the ‘Parameter group’ field. The selected group will be marked in red.
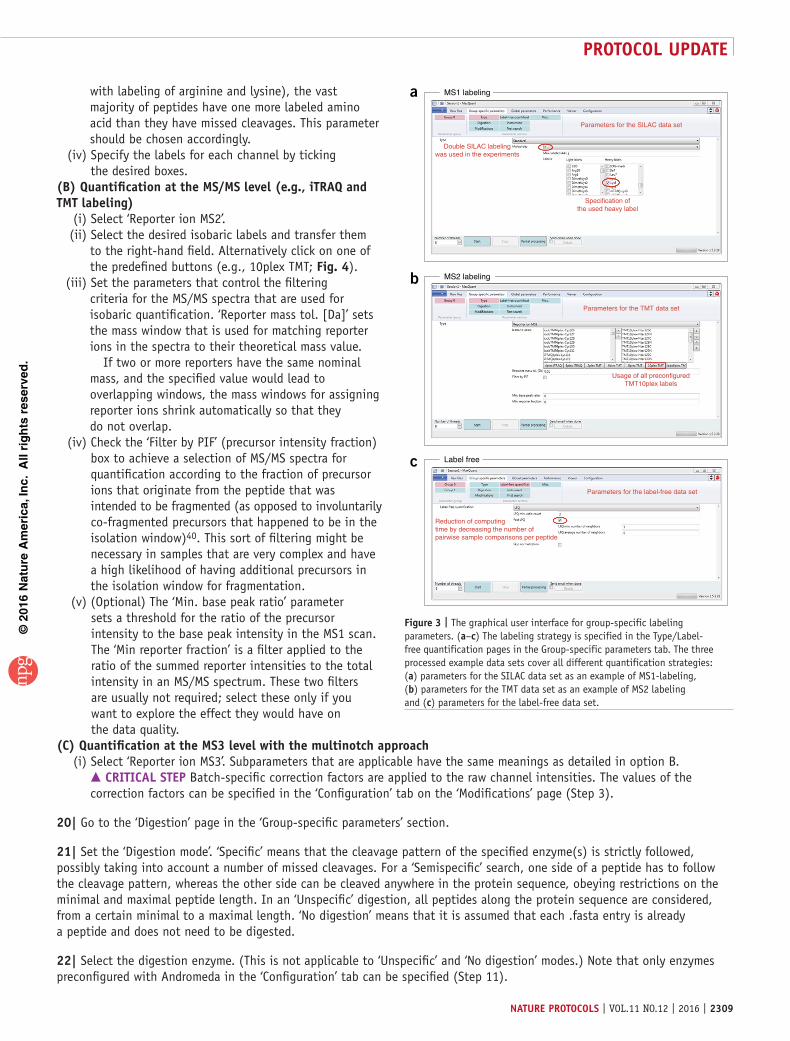
19| Set the type of analysis according to the quantification strategy in the ‘Type’ page (Fig. 3). The three main options distinguish between the MS level at which the quantification signals are generated, which can be in the MS1 spectra, as, for instance, with label-free or SILAC-based quantification; in the MS/MS spectra, as with conventional TMT labeling; or in the MS3 spectra, as with the multinotch approach22. The fourth case is a specialized option used only for quantifying labeled cross-linked peptides as described in Chen et al.39.(a) Quantification at the Ms level (e.g., label-free, sIlac or di-methyl labeling) (i) Select ‘Standard’. (ii) Set the ‘Multiplicity’ according to the number of labels: ‘1’, if no labeling was used. In this case, quantification will be
provided only if the LFQ algorithm is used (Step 27); ‘2’or ‘3’, in case of double or triple SILAC labeling, respectively. (iii) If you have selected ‘Multiplicity’ >1, set the maximum number of allowed labeled amino acids per peptide. As an
example in standard SILAC labeling, for which the protease matches the labeled amino acids (e.g., trypsin combined
©20
16N
atu
re A
mer
ica,
Inc.
All
rig
hts
res
erve
d.
protocol Update
natUre protocols | VOL.11 NO.12 | 2016 | 2309
with labeling of arginine and lysine), the vast majority of peptides have one more labeled amino acid than they have missed cleavages. This parameter should be chosen accordingly.
(iv) Specify the labels for each channel by ticking the desired boxes.
(B) Quantification at the Ms/Ms level (e.g., itraQ and tMt labeling) (i) Select ‘Reporter ion MS2’. (ii) Select the desired isobaric labels and transfer them
to the right-hand field. Alternatively click on one of the predefined buttons (e.g., 10plex TMT; Fig. 4).
(iii) Set the parameters that control the filtering criteria for the MS/MS spectra that are used for isobaric quantification. ‘Reporter mass tol. [Da]’ sets the mass window that is used for matching reporter ions in the spectra to their theoretical mass value. If two or more reporters have the same nominal mass, and the specified value would lead to overlapping windows, the mass windows for assigning reporter ions shrink automatically so that they do not overlap.
(iv) Check the ‘Filter by PIF’ (precursor intensity fraction) box to achieve a selection of MS/MS spectra for quantification according to the fraction of precursor ions that originate from the peptide that was intended to be fragmented (as opposed to involuntarily co-fragmented precursors that happened to be in the isolation window)40. This sort of filtering might be necessary in samples that are very complex and have a high likelihood of having additional precursors in the isolation window for fragmentation.
(v) (Optional) The ‘Min. base peak ratio’ parameter sets a threshold for the ratio of the precursor intensity to the base peak intensity in the MS1 scan. The ‘Min reporter fraction’ is a filter applied to the ratio of the summed reporter intensities to the total intensity in an MS/MS spectrum. These two filters are usually not required; select these only if you want to explore the effect they would have on the data quality.
(c) Quantification at the Ms3 level with the multinotch approach (i) Select ‘Reporter ion MS3’. Subparameters that are applicable have the same meanings as detailed in option B.
crItIcal step Batch-specific correction factors are applied to the raw channel intensities. The values of the correction factors can be specified in the ‘Configuration’ tab on the ‘Modifications’ page (Step 3).
20| Go to the ‘Digestion’ page in the ‘Group-specific parameters’ section.
21| Set the ‘Digestion mode’. ‘Specific’ means that the cleavage pattern of the specified enzyme(s) is strictly followed, possibly taking into account a number of missed cleavages. For a ‘Semispecific’ search, one side of a peptide has to follow the cleavage pattern, whereas the other side can be cleaved anywhere in the protein sequence, obeying restrictions on the minimal and maximal peptide length. In an ‘Unspecific’ digestion, all peptides along the protein sequence are considered, from a certain minimal to a maximal length. ‘No digestion’ means that it is assumed that each .fasta entry is already a peptide and does not need to be digested.
22| Select the digestion enzyme. (This is not applicable to ‘Unspecific’ and ‘No digestion’ modes.) Note that only enzymes preconfigured with Andromeda in the ‘Configuration’ tab can be specified (Step 11).
Label free
MS2 labeling
MS1 labeling
Parameters for the SILAC data set
Parameters for the TMT data set
Parameters for the label-free data set
Usage of all preconfiguredTMT10plex labels
Double SILAC labelingwas used in the experiments
Specification ofthe used heavy label
Reduction of computingtime by decreasing the number of pairwise sample comparisons per peptide
a
b
c
Figure 3 | The graphical user interface for group-specific labeling parameters. (a–c) The labeling strategy is specified in the Type/Label-free quantification pages in the Group-specific parameters tab. The three processed example data sets cover all different quantification strategies: (a) parameters for the SILAC data set as an example of MS1-labeling, (b) parameters for the TMT data set as an example of MS2 labeling and (c) parameters for the label-free data set.
©20
16N
atu
re A
mer
ica,
Inc.
All
rig
hts
res
erve
d.
protocol Update
2310 | VOL.11 NO.12 | 2016 | natUre protocols
23| Specify the maximum number of missed cleavages to be used in the peptide identification step. In case of incomplete digestion, longer peptides that contain missed cleavages may exist in the sample. This situation requires an appropriate database containing longer theoretical peptides, in addition to the expected complete digests. Therefore, if a larger number of potential missed cleavages is indicated, the search space would be largely increased, leading to longer processing times—and thus should be done only if necessary.
24| Navigate to the ‘Modifications’ page in the ‘Group-specific parameters’ section. See Box 5 for general explanations of the quantitative output and meaning of parameters for the analysis of PTMs.
25| Select ‘Variable modifications’ (i.e., modifications that may or may not be present on a peptide) to be used in the search and transfer them to the right-hand side of the field. Modifications that are preconfigured with Andromeda are available here. For example, PTMs such as phosphorylation of serine, threonine and tyrosine (S, T and Y) have to be set here.
26| Set the maximum number of modifications allowed per peptide. Note that specifying a large number of modifications is not advisable. Allowing a large number of modifications increases the number of possible combinations of those modifications on the peptide sequence. This leads to a combinatorics explosion, causing the search to become very time-consuming. The fraction of false-positive identifications is not affected, as FDR control is applied.
27| To enable LFQ go to the ‘Label free quantification’ page and select the ‘LFQ’ option.
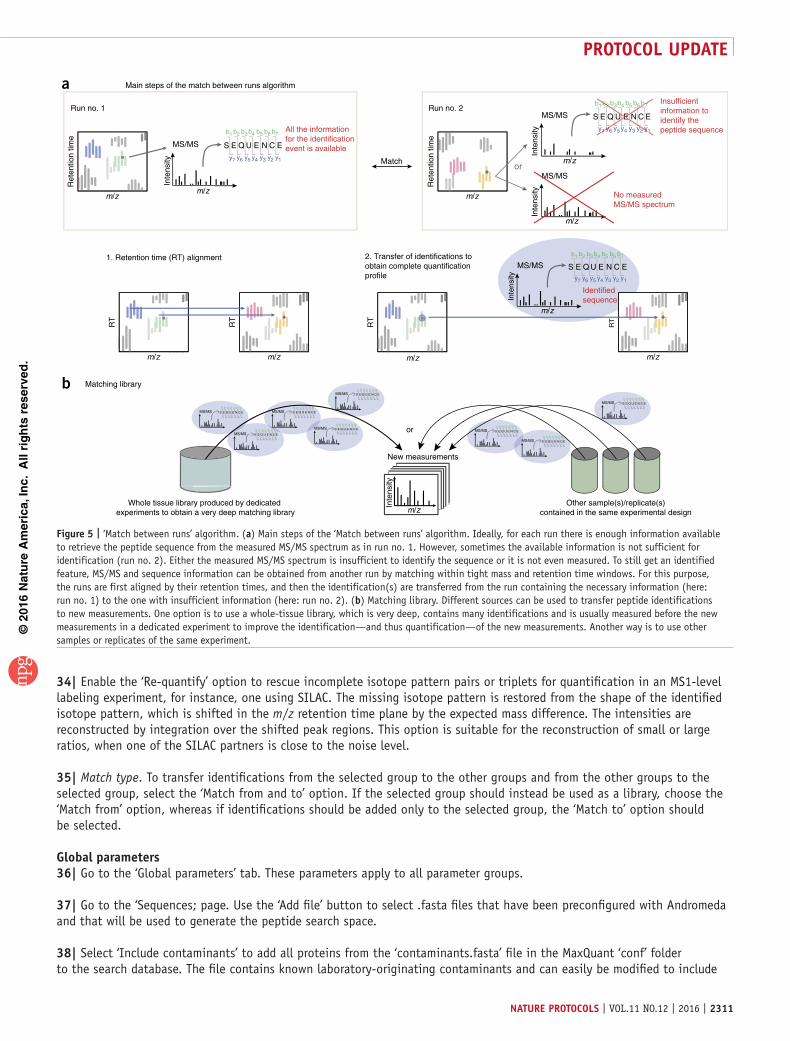
28| Set the minimum ratio count that is required for a peptide feature to be used in the quantification of a protein (Box 3). ‘Peptide feature’ refers here to a 3D isotope pattern in the MS1 data that has been assigned to a peptide either by identification through an associated MS/MS spectrum or by ‘Match between runs’ (Fig. 5).
29| In the case of large experiments (hundreds of raw files), the ‘Fast LFQ’ option assures reasonable computation times by reducing the number of pairwise sample comparisons. Set minimum and average numbers of neighbors, which then define the number of sample-to-sample comparisons to be used for computing the normalization factors.
30| (Optional) Tick the ‘Skip normalization’ option, if the normalization step should not be performed.! caUtIon This is usually not recommended. The option is available to allow for exploratory data analysis and to quantify the effect that the normalization has on the data.
31| Go to the ‘Instrument’ page. Set the ‘Instrument type’. A large number of vendors are supported. The subparameters mostly determine details of the peak detection and search. The default values are empirically determined and rarely require changes.
32| Go to the ‘First search’ page. In case of a large search space (for example, due to unspecific enzyme search, six-frame translations or a large number of modifications) the computation time can be largely improved by decreasing the database size for the first round of peptide identification searches, which is performed only to determine mass- and time-recalibration curves. As the identifications from the first search are otherwise not used in the actual results contained in the MaxQuant output tables, one can potentially use a smaller list of variable modifications or other settings for the in silico digestion of proteins into peptides when performing the first search. These parameters, which are applied only to the first search, can be specified on this page. For standard searches with a species-specific protein .fasta file and no unspecific cleavage, it is not recommended to make use of differing first search parameters, as the gain in speed would only be marginal.
33| Go to the ‘Misc.’ page.
Obs
erve
d T
MT
rat
io (
log2
)
Spike-in ratio
Medianobserved ratio
2:1 20:1 5:1 10:1 10:1 5:1 3.3:1 2:1 20:1
4.262.90 2.411.74 4.113.10 4.13 1.844.41
2
4
6
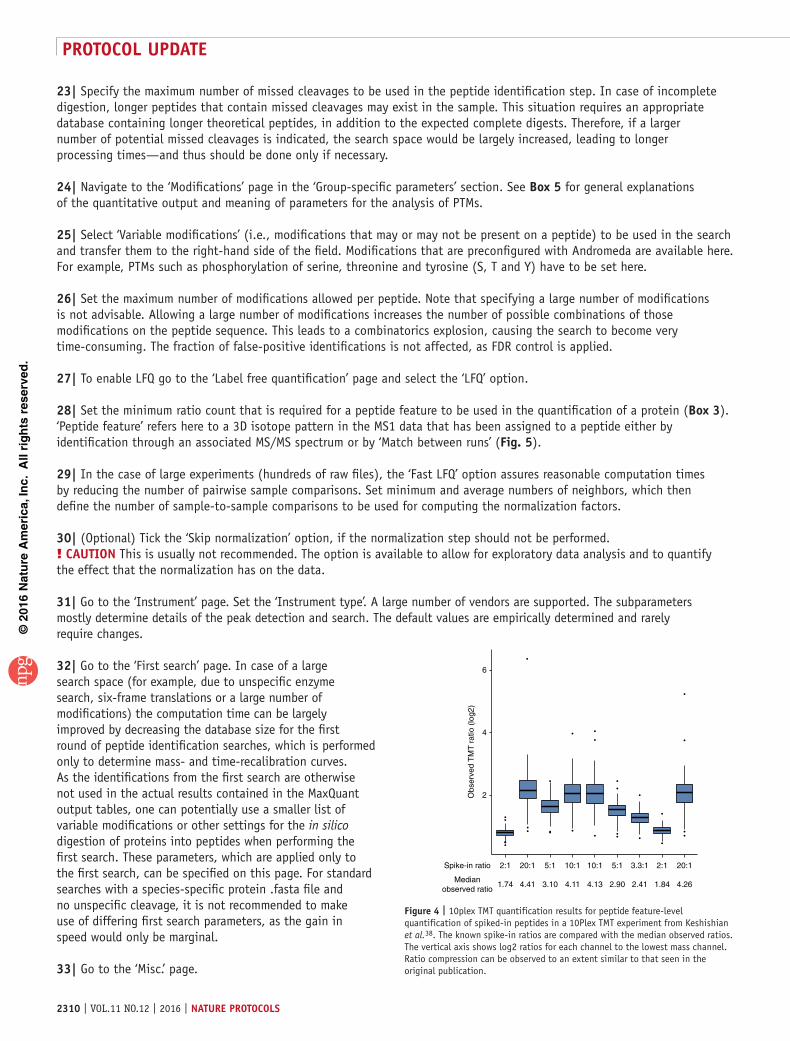
Figure 4 | 10plex TMT quantification results for peptide feature-level quantification of spiked-in peptides in a 10Plex TMT experiment from Keshishian et al.38. The known spike-in ratios are compared with the median observed ratios. The vertical axis shows log2 ratios for each channel to the lowest mass channel. Ratio compression can be observed to an extent similar to that seen in the original publication.
©20
16N
atu
re A
mer
ica,
Inc.
All
rig
hts
res
erve
d.
protocol Update
natUre protocols | VOL.11 NO.12 | 2016 | 2311
34| Enable the ‘Re-quantify’ option to rescue incomplete isotope pattern pairs or triplets for quantification in an MS1-level labeling experiment, for instance, one using SILAC. The missing isotope pattern is restored from the shape of the identified isotope pattern, which is shifted in the m/z retention time plane by the expected mass difference. The intensities are reconstructed by integration over the shifted peak regions. This option is suitable for the reconstruction of small or large ratios, when one of the SILAC partners is close to the noise level.
35| Match type. To transfer identifications from the selected group to the other groups and from the other groups to the selected group, select the ‘Match from and to’ option. If the selected group should instead be used as a library, choose the ‘Match from’ option, whereas if identifications should be added only to the selected group, the ‘Match to’ option should be selected.
Global parameters36| Go to the ‘Global parameters’ tab. These parameters apply to all parameter groups.
37| Go to the ‘Sequences; page. Use the ‘Add file’ button to select .fasta files that have been preconfigured with Andromeda and that will be used to generate the peptide search space.
38| Select ‘Include contaminants’ to add all proteins from the ‘contaminants.fasta’ file in the MaxQuant ‘conf’ folder to the search database. The file contains known laboratory-originating contaminants and can easily be modified to include
Matching library
Whole tissue library produced by dedicated experiments to obtain a very deep matching library
New measurements
m/z
Inte
nsity
MS/MS S E Q U E N C E
b1
y7
b2
y6
b3
y5
b4
y4
b5
y3
b6
y2
b7
y1
MS/MSb1
y7
b2
y6
b3
y5
b4
y4
b5
y3
b6
y2
b7
y1
b6 b7
MS/MSb1
y7
b2
y6
b3
y5
b4
y4
b5
y3
b6
y2
b7
y1
MS/MSb1
y7
b2
y6
b3
y5
b4
y4
b5
y3
b6
y2
b7
y1
MS/MSb1
y7
b2
y6
b3
y5
b4
y4
b5
y3
b6
y2
b7
y1
Other sample(s)/replicate(s)contained in the same experimental design
MS/MSb1
y7
b2
y6
b3
y5
b4
y4
b5
y3
b6
y2
b7
y1
MS/MSb1
y7
b2
y6
b3
y5
b4
y4
b5
y3
b6
y2
b7
y1
MS/MSb1
y7
b2
y6
b3
y5
b4
y4
b5
y3
b6
y2
b7
y1
or
Run no. 1 Run no. 2
2. Transfer of identifications toobtain complete quantificationprofile
1. Retention time (RT) alignment
Main steps of the match between runs algorithm
m/z
MS/MS
b1
y7
b2
y6
b3
y5
b4
y4
b5
y3
b6
y2
b7
y1
b1
y7
b2
y6
b3
y5
b4
y4
b5
y3
b6
y2
b7
y1b1
y7
b2
y6
b3
y5
b4
y4
b5
y3
b6
y2
b7
y1
m/z
Inte
nsity
RT
m/z
RT
m/z
RT
m/z
RT
MS/MS S E Q U E N C E
S E Q U E N C E
S E Q U E N C E
m/z
Inte
nsity y2 y1
EE
b2
Uy7 y
U EE
6 b7
E
Insufficientinformation toidentify thepeptide sequence
MS/MS
m/z
Inte
nsity No measured
MS/MS spectrum
Identifiedsequence
m/z
Ret
entio
n tim
e
orMatch
Inte
nsity
MS/MS
All the informationfor the identificationevent is available
m/zm/z
Ret
entio
n tim
e
S E Q U E N C E
S E Q U E N C E
S E Q U E N C E
S E Q U E N C E
S E Q U E N C E
S E Q U E N C E
S E Q U E N C E
a
b
Figure 5 | ‘Match between runs’ algorithm. (a) Main steps of the ‘Match between runs’ algorithm. Ideally, for each run there is enough information available to retrieve the peptide sequence from the measured MS/MS spectrum as in run no. 1. However, sometimes the available information is not sufficient for identification (run no. 2). Either the measured MS/MS spectrum is insufficient to identify the sequence or it is not even measured. To still get an identified feature, MS/MS and sequence information can be obtained from another run by matching within tight mass and retention time windows. For this purpose, the runs are first aligned by their retention times, and then the identification(s) are transferred from the run containing the necessary information (here: run no. 1) to the one with insufficient information (here: run no. 2). (b) Matching library. Different sources can be used to transfer peptide identifications to new measurements. One option is to use a whole-tissue library, which is very deep, contains many identifications and is usually measured before the new measurements in a dedicated experiment to improve the identification—and thus quantification—of the new measurements. Another way is to use other samples or replicates of the same experiment.
©20
16N
atu
re A
mer
ica,
Inc.
All
rig
hts
res
erve
d.
protocol Update
2312 | VOL.11 NO.12 | 2016 | natUre protocols
more or fewer entries. If any of the contaminants is found, it will be marked with the prefix ‘CON_’ in the MaxQuant output tables. Contaminant proteins are only marked for inspection by the user and they are not subject to any automatic filtering or differential treatment in algorithms.
39| Select ‘Fixed modifications’ by moving entries from the box on the left to the box on the right. These are usually sample preparation-specific modifications, which are applied to each occurrence of the specified residue or terminus during database search (e.g., carbamidomethyl (C)).
40| Set the minimum length for a peptide to be considered for identification, as well as the maximum peptide mass.
41| Set the minimum and the maximum peptide lengths in case of unspecific search (i.e., without digestion enzyme) if applicable.
42| Go to the ‘Identification’ page.
43| Set the minimum FDR at which a PSM to the search database should be accepted (Box 1).
44| Set the minimum FDR at which a protein group should be accepted. Setting this parameter to 1 would result in accepting all identifications with no control over the protein FDR. In that case, the q value reported in the proteinGroups.txt output table can be used to filter the data at a later stage.
45| The ‘Site decoy fraction’ is the fraction of reverse to forward entries. The parameter plays the same role as the FDR in the site table and is used to filter the reported list of site identifications.
46| Specify the minimum number of peptides that are required for a protein to be considered for identification. This can also be set for the required number of razor + unique or unique peptides (Box 1).
47| Set the minimum score and delta score thresholds for unmodified and modified peptides. The delta score is the score difference between the best-scoring peptide and the next best hit with a different sequence (Box 5). Filtering by scores is applied in addition to the filtering imposed by the FDRs, and hence it is not necessary for controlling the rate of false positives. For modified peptides, it is advisable to have additional nonstringent filtering at the level of the Andromeda score to ensure a minimal spectral quality.
48| Set the maximum number of combinations of modifications to be tested during the main search. If there are many ways to distribute the number of modifications on a peptide onto the amino acids, which potentially can be modified in this way, this number cuts off the number of positional scorings on one peptide. Note that increasing this number may lead to longer computation time.
49| Tick the ‘Base FDR calculations on delta score’ check box, if the delta score should be used instead of the primary score in the estimation of posterior error probabilities and FDRs. The delta score option for FDR calculations is provided only for exploratory data analysis purposes and its use is not generally recommended.
50| Tick the ‘Razor protein FDR’, if an additional level of FDR controlling for shared peptides should be applied (Box 1).
51| Go to the ‘Adv. Identification’ page.
52| MaxQuant can identify multiple peptides from one MS/MS spectrum if more than one peptide species has been co-fragmented. Tick the ‘Second peptides’ box to enable identification and quantification of a second co-eluting and co-fragmented peptide in each MS/MS spectrum. Features that were identified by the second peptide method are indicated in the ‘evidence.txt’ file by the entry ‘MULTI-SECPEP’.
53| In data-dependent acquisition mode, usually a top N approach is used to select peptides for second-level MS scans that subsequently lead to peptide identification. Due to the partially stochastic nature of this approach, the peptide species selected for fragmentation are not always exactly the same between different raw files. The ‘Match between runs’ option makes use of this property, and, using a sophisticated algorithm that employs retention time alignment, allows for transferring of peptide identifications from one file to another (Fig. 5). It is an especially useful option for low-abundant peptides. Select the
©20
16N
atu
re A
mer
ica,
Inc.
All
rig
hts
res
erve
d.
protocol Update
natUre protocols | VOL.11 NO.12 | 2016 | 2313
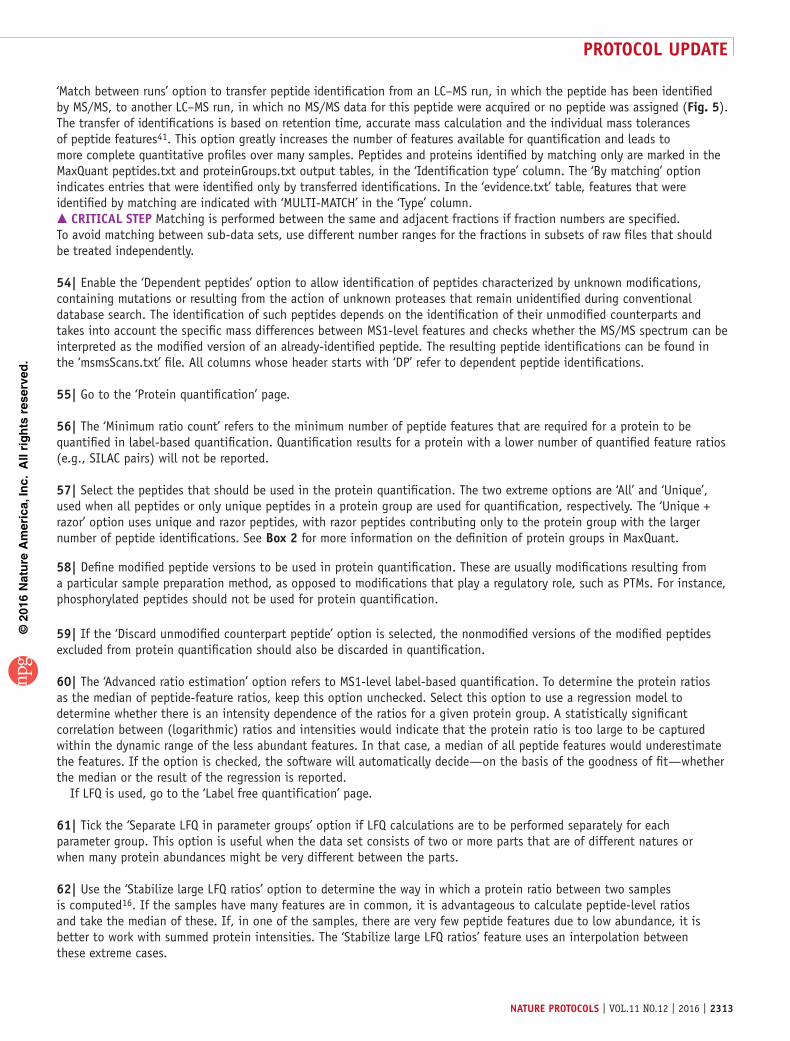
‘Match between runs’ option to transfer peptide identification from an LC–MS run, in which the peptide has been identified by MS/MS, to another LC–MS run, in which no MS/MS data for this peptide were acquired or no peptide was assigned (Fig. 5). The transfer of identifications is based on retention time, accurate mass calculation and the individual mass tolerances of peptide features41. This option greatly increases the number of features available for quantification and leads to more complete quantitative profiles over many samples. Peptides and proteins identified by matching only are marked in the MaxQuant peptides.txt and proteinGroups.txt output tables, in the ‘Identification type’ column. The ‘By matching’ option indicates entries that were identified only by transferred identifications. In the ‘evidence.txt’ table, features that were identified by matching are indicated with ‘MULTI-MATCH’ in the ‘Type’ column. crItIcal step Matching is performed between the same and adjacent fractions if fraction numbers are specified. To avoid matching between sub-data sets, use different number ranges for the fractions in subsets of raw files that should be treated independently.
54| Enable the ‘Dependent peptides’ option to allow identification of peptides characterized by unknown modifications, containing mutations or resulting from the action of unknown proteases that remain unidentified during conventional database search. The identification of such peptides depends on the identification of their unmodified counterparts and takes into account the specific mass differences between MS1-level features and checks whether the MS/MS spectrum can be interpreted as the modified version of an already-identified peptide. The resulting peptide identifications can be found in the ‘msmsScans.txt’ file. All columns whose header starts with ‘DP’ refer to dependent peptide identifications.
55| Go to the ‘Protein quantification’ page.
56| The ‘Minimum ratio count’ refers to the minimum number of peptide features that are required for a protein to be quantified in label-based quantification. Quantification results for a protein with a lower number of quantified feature ratios (e.g., SILAC pairs) will not be reported.
57| Select the peptides that should be used in the protein quantification. The two extreme options are ‘All’ and ‘Unique’, used when all peptides or only unique peptides in a protein group are used for quantification, respectively. The ‘Unique + razor’ option uses unique and razor peptides, with razor peptides contributing only to the protein group with the larger number of peptide identifications. See Box 2 for more information on the definition of protein groups in MaxQuant.
58| Define modified peptide versions to be used in protein quantification. These are usually modifications resulting from a particular sample preparation method, as opposed to modifications that play a regulatory role, such as PTMs. For instance, phosphorylated peptides should not be used for protein quantification.
59| If the ‘Discard unmodified counterpart peptide’ option is selected, the nonmodified versions of the modified peptides excluded from protein quantification should also be discarded in quantification.
60| The ‘Advanced ratio estimation’ option refers to MS1-level label-based quantification. To determine the protein ratios as the median of peptide-feature ratios, keep this option unchecked. Select this option to use a regression model to determine whether there is an intensity dependence of the ratios for a given protein group. A statistically significant correlation between (logarithmic) ratios and intensities would indicate that the protein ratio is too large to be captured within the dynamic range of the less abundant features. In that case, a median of all peptide features would underestimate the features. If the option is checked, the software will automatically decide—on the basis of the goodness of fit—whether the median or the result of the regression is reported. If LFQ is used, go to the ‘Label free quantification’ page.
61| Tick the ‘Separate LFQ in parameter groups’ option if LFQ calculations are to be performed separately for each parameter group. This option is useful when the data set consists of two or more parts that are of different natures or when many protein abundances might be very different between the parts.
62| Use the ‘Stabilize large LFQ ratios’ option to determine the way in which a protein ratio between two samples is computed16. If the samples have many features are in common, it is advantageous to calculate peptide-level ratios and take the median of these. If, in one of the samples, there are very few peptide features due to low abundance, it is better to work with summed protein intensities. The ‘Stabilize large LFQ ratios’ feature uses an interpolation between these extreme cases.
©20
16N
atu
re A
mer
ica,
Inc.
All
rig
hts
res
erve
d.
protocol Update
2314 | VOL.11 NO.12 | 2016 | natUre protocols
63| Tick ‘Require MS/MS for LFQ comparisons’ to use only those feature ratios in pairwise sample comparisons for which there is identification by MS/MS in at least one of the samples, as opposed to both features being identified by matching between runs only.
64| Tick the ‘iBAQ’ check box to report iBAQ values in the proteinGroups.txt output table (Box 2).
65| The ‘Advanced site intensities’ option applies to the LFQ of modification sites. To sum all peptide-feature intensities for a site, switch off this option. Check this option if only one representative peptide type with specific sequence and charge should be used in each sample, to obtain a more consistent quantification profile. If the user has selected this option, MaxQuant uses the combination of peptide sequence and charge that appears in the greatest number of samples. This strategy ensures that same feature types are used for quantification across all samples, leading to more consistent and precise relative quantification.
66| Go to the ‘Tables’ page. Deselect any tables that do not need to be written out by MaxQuant. If any tables are omitted, this will result in decreased computation time. This option is relevant only for very large data sets.
67| Go to the ‘Folder locations’ page.
68| The ‘Temporary folder’ stores temporary files generated by MaxQuant, some of which also require frequent access. (Optional) To decrease computation time, place this folder on a fast disk (e.g., solid-state drive). This makes it possible to have the raw files of a very large project residing on relatively slow storage media and still have good performance.
69| Set the location of the ‘Combined folder’, which will store all MaxQuant output files. The default location of this folder is in the folder where the raw files are stored. It will contain a folder named ‘txt’, in which all tab-separated output tables can be found, including all identification results on the protein group, peptide and site levels.
70| The ‘Fixed andromeda index’ folder will be used by the Andromeda search engine to store index files. In case no folder is specified, MaxQuant will generate a ‘search’ folder inside the ‘combined’ folder for this purpose. Consider creating a dedicated folder so that the index files can be re-used between projects that use the same search engine parameters. This can save a lot of computational resources—in particular, for large peptide search spaces, for which the index generation can be time-consuming.
71| To modify parameters regarding MS/MS acquisition, go to the respective page. For example, for MS/MS spectra measured in Fourier transform–based mass spectrometers (including the Orbitrap), go to the ‘MS/MS-FTMS’ page. Default settings are empirically determined and require no changes for standard experimental setups.
72| Go to the ‘Advanced’ page.
73| Check the ‘Calculate peak properties’ box to calculate and report advanced properties for 3D peaks and isotope patterns. These include the PIF, indicating the percentage of MS1-level intensity that originates from the precursor intended for fragmentation in an MS/MS spectrum.
74| Set ‘Decoy mode’ to define how the decoy database should be generated. The default setting ‘Revert’ generates reversed sequences, whereas for ‘Randomize’, the amino acids in a protein sequence are scrambled before digestion. Generally, ‘Revert’ is recommended, as randomization has the disadvantage that local correlation between amino acid usages is completely scrambled, which would imply that decoy and original sequences are distinguishable.
75| Choose whether ‘Normalized’ or ‘Non-normalized’ ratios should be used in the calculation of occupancies. The default setting (‘Normalized’) can be changed if large changes in the overall phosphorylation state between the different conditions that are used in the experiment are expected.
76| The ‘Top x mass window [Da]’ option sets the size of the window that is used with MS/MS spectra to determine which are the most locally abundant peaks; these are then used for intensity-based peak filtering. The default value is 100 and usually does not need to be adjusted.

©20
16N
atu
re A
mer
ica,
Inc.
All
rig
hts
res
erve
d.
protocol Update
natUre protocols | VOL.11 NO.12 | 2016 | 2315
77| Indicate whether a separate smaller .fasta file should be used in the first database search to save computing time.
78| Choose the parameter ‘Disable MD5 sums’ to skip the calculation of MD5 sums on .fasta files. The calculation ‘MD5 sums’ is done to find out whether the .fasta files were edited since the indices for the Andromeda search were generated. For very large .fasta files, the calculation of the checksum can take a long time. Hence it is advisable to disable the MD5 calculation for large (e.g., multispecies, proteogenomic) .fasta files.
79| Use the ‘Max mods in site table’ parameter to specify the maximal number of modifications for which a separate ratio or intensity column is created in the site tables. (See Box 5, PTM-site ratios and intensities.)
80| Use the ‘Number of threads’ parameter to set the number of threads to be used by MaxQuant. Make sure that there is at least 2GB of RAM available per thread. The number of threads used by MaxQuant should not exceed the number of logical cores available on the computer. Violation of this recommendation might cause the software to run out of memory, leading to total failure of the MaxQuant run.
81| Press the ‘Start’ button to begin calculations. The ‘Partial processing’ option allows the user to restart the MaxQuant analysis from an intermediate step and therefore to save a large amount of time. During each analysis, MaxQuant generates an index file and a peak list folder for each raw file. These data can then be reused by MaxQuant for subsequent reanalysis of the data, as long as these files are kept in the same directory as the raw files. It is necessary to reanalyze the data if there is a change of parameters. In that case the feature detection step can be omitted, as all necessary files were previously generated; change the desired parameter (e.g., add a modification) and start in the ‘Partial processing’ window, start from ‘Preparing searches’. You would also reanalyze the data if you wanted to test different identification criteria (e.g., FDR cutoffs); in this case, change the parameter and start from ‘Applying FDR’. Another circumstance in which you would reanalyze the data is if you wanted to enable the ‘Re-quantify’ option to com-pare with the results when no requantification was used; to do this, tick the parameter and start from ‘Re-quantification’.
82| Navigate to the ‘Performance’ tab to monitor the progress of the analysis. Information such as the current analysis step, previous steps and computation time can be seen here.
? troUBlesHootInGTroubleshooting advice can be obtained from the MaxQuant help forum, which can be found at http://groups.google.com/forum/#!forum/maxquant-list. In case you encounter a reproducible software bug, please file a report in the MaxQuant bug tracking system at http://maxquant.myjetbrains.com/youtrack. Some frequently occurring problems and their solutions are summarized in table 1.
taBle 1 | Troubleshooting table.
problem possible reason solution
All samples were grouped together in the MaxQuant output table
Incorrect experimental design Distinct experiments have to be specified with different experiment names
The changes made to the Andromeda configuration are not visible within MaxQuant (Steps 3–13)
Andromeda was not configured correctly Make sure to always first click ‘Modify table’ and to then save the changes; in some cases it may be necessary to restart MaxQuant
MaxQuant is very slow A single thread is used. The location of the temporary folder is not optimal
Increase the number of threads or specify a location for the temporary folder on a fast (e.g., solid-state) disk
No occupancies are reported in the phospho(STY) table
Incorrect experimental design Make sure that the corresponding proteome and phos-phoproteome files have the same experiment name, but different parameter groups: without and with phospho(STY) variable modifications, respectively
Wrong protein group identifier appears in the MaxQuant output tables
The parse rule is incorrect Use the ‘Test rules’ option in MaxQuant to ensure the correct extraction
©20
16N
atu
re A
mer
ica,
Inc.
All
rig
hts
res
erve
d.
protocol Update
2316 | VOL.11 NO.12 | 2016 | natUre protocols
Other things to consider are:Thing to consider. The files generated with MaxQuant may exceed the number of columns or the number of characters per
entry supported by software tools such as Microsoft Excel. This is a common problem associated with very large data sets. This may result in incomplete file loading or file corruption.
Recommendation. We therefore strongly recommend that the user either use our in-house software platform, Perseus, for downstream analysis or ensure that the requirements and limitations of third-party software are met—for instance, by removing columns that are not needed for the analysis before loading the file into another software.
Thing to consider. The user may notice that MaxQuant results vary depending on whether raw files are searched in one joined-program run or the same raw files are searched separately. There are multiple factors responsible for this effect. The main contribution to this difference lies in the application of a protein FDR, which is done by default in MaxQuant. This is a very crucial step, because if search results for separate raw files are collected into one larger data set without any further higher-level FDR control, false-positive protein identifications will aggregate42,43. Additionally contributing to this effect is the fact that analyzing all files in a single run results in a larger number of features that can be used by MaxQuant in the statistical procedures, thus increasing the accuracy and reliability of the results.
Recommendation. As the computational performance of MaxQuant scales very well with the number of raw files, we recommend always analyzing together in a single MaxQuant run raw files that will later be used in a comparative manner. This has the additional advantage that the protein groups are defined in common for the whole data set, which simplifies quantitative comparative analysis of protein ratios and intensities.
Thing to consider. For the case in which PTM site occupancies are calculated, the user may find that the percentage of missing values is higher among the occupancies than among the intensities or ratios. Most often the reason for this is insufficient depth of the proteome accompanying the modified (e.g., phospho) proteome.
Recommendation. To achieve a high likelihood that most unmodified counterpart peptides of the measured modified peptides are detected, the proteome needs to be measured in great depth, possibly with extensive pre-fractionation. As an example, see Sharma et al.25.
● tIMInGThe computing time depends on sample complexity, richness of spectra and LC gradient length, among other things. All data sets described in the Equipment setup section were processed using eight threads and resulted in a computing time varying from ~10 to 67 h. Much shorter computing times can be achieved by using more cores in parallel. MaxQuant has been tested and found to perform well on modules with up to 120 logical cores.
antIcIpated resUltsMaxQuant creates several tab-delimited .txt output files that contain information about identified and quantified peptides and proteins, and their modified forms. See table 2 for the descriptions of the different output tables and go to the ftp server for the resulting files for each data set (http://protocols.maxquant.org). In case full search results are needed, they can be found in the ‘combined\andromeda’ folder. Peak list files end with ‘.apl’, whereas search result files end with ‘.res’. table 3 gives an overview of the numbers of identified and quantified proteins, peptides and phospho peptides for the three example data sets. It also shows identification rates for MS/MS spectra, isotope patterns and SILAC pairs. table 4 contains details on the compu-tational performance of the MaxQuant sub-workflows.
(continued)
taBle 2 | List of output tables.
table name description
proteinGroups.txt Detailed information about identified protein groups. The file contains a list of all protein groups identified at the specified FDR cutoff and their quantification. Normalized ratios, LFQ intensities and Reporter intensities are given for SILAC, label-free and TMT/iTRAQ experiments, respectively. Protein groups matching to the reverse database and potential contaminants are marked. The list can be additionally filtered on the q value to specify a more/less stringent FDR cutoffAdditional information such as score of identification (the product of all peptide PEPs used for identification), number of peptides, sequence coverage and best MS/MS is provided for each proteinEach protein group is assigned a unique identifier (id) and can be used to match the protein groups file to other MaxQuant output files. In addition, each protein group is linked to the peptides, modification-specific peptides, msms and evidence tables through the respective ids (e.g., PeptideIDs correspond to the ‘id’ column in the peptides.txt table). Matching can be conveniently performed in the Perseus software
©20
16N
atu
re A
mer
ica,
Inc.
All
rig
hts
res
erve
d.
protocol Update
natUre protocols | VOL.11 NO.12 | 2016 | 2317
taBle 2 | List of output tables (continued).
table name description
peptides.txt Detailed information about identified peptides. The peptides table contains a nonredundant list of identified peptides meeting the required FDR criteria, and information about their quantification. The Andromeda score and the corresponding PEP are given for each peptideThe file includes information about peptide sequence, mass and length, charge state, detected modifications, number of missed cleavages and number of MS/MS spectra used for identificationEach peptide is assigned a unique id that can be used for matching to the other MaxQuant output tables (to their PeptideIDs column). In addition, ProteingroupIDs are provided that define the connection between a given peptide and the protein groups in which it was found
evidence.txt Table with identified peptide features. The evidence file contains the combined information about all identified peptide features. Identification information includes peptide sequence and modified sequence, length and modification state. Score, PEP, mass deviation, number of MS/MS matches, uncalibrated and calibrated m/z and mass error, and recalibrated retention time can be used to inspect the quality of identificationAnalogously to all other tables, each entry is assigned a unique id that can be used for matching to other tables
…Sites.txt Details of all PTM sites of a certain type. The table contains information about all modification sites detected that meet the given FDR and score and delta score criteria. For instance, in a phospho experiment, all phospho events will be reported as separate entriesQuantitative information, such as (reporter/LFQ) intensity and normalized ratios and occupancy (when enabled), is provided for each event. Qualitative information, including score, PEP, localization probability and occupancy error, can be used to filter the table. For example, to limit the downstream analysis to class I sites, a localization probability filter of >0.75 can be appliedAdditional information about the proteins in which the modification is found, their position within the sequence, and the sequence window surrounding the site is provided in this table
modificationSpe-cificPeptides.txt
List of identified peptide sequences with specific modification content. The modificationSpecificPeptides table covers a nonredundant list of peptides, distinguishing them also by their modification content. Peptide sequence, mass, MS/MS count, score, delta score and PEP are provided, in addition to quantitative information. The type of modification and number of modifications are shown for each peptide. Each peptide form is assigned a unique id that can be used for matching to other tables containing Mod.peptide IDs
allPeptides.txt List of all peptide features. List of all features (isotope patterns or labeling pairs, depending on the parameter settings) that were detected by MaxQuant regardless of if they were sequenced or identified. Additional information includes intensity, score, charge state, calibrated and un-calibrated m/z, mass precision, retention time, whether the peptide is picked up for sequencing or not and so on
parameters.txt Summary of all used parameters. The parameters file has information about all used parameters, including version number of the software, threshold values for identification and quantification, which fasta file was used as search database and so on
summary.txt Summary of the whole MaxQuant analysis This contains the main summary information for all raw files and can thus be used to gather a quick overview of the data quality
msms.txt List of all identified MS/MS spectra. The msms table contains information such as sequence, missed cleavages, modifications, charge state mass error and retention time for all identified MS/MS spectra
msmsScans.txt List of all MS/MS spectra. The msmsScans table contains technical details about the scan for all MS/MS spectra
msScans.txt List of all MS1 spectra The msScans table contains technical details about the scan for all MS1 spectra
mzRange.txt Table needed to display density information as a function of m/z. The mzRange table holds information about the density of detected and identified peaks, isotope patterns and MS/MS for all analyzed raw files as a function of m/z
Short descriptions are provided for all MaxQuant output tables.
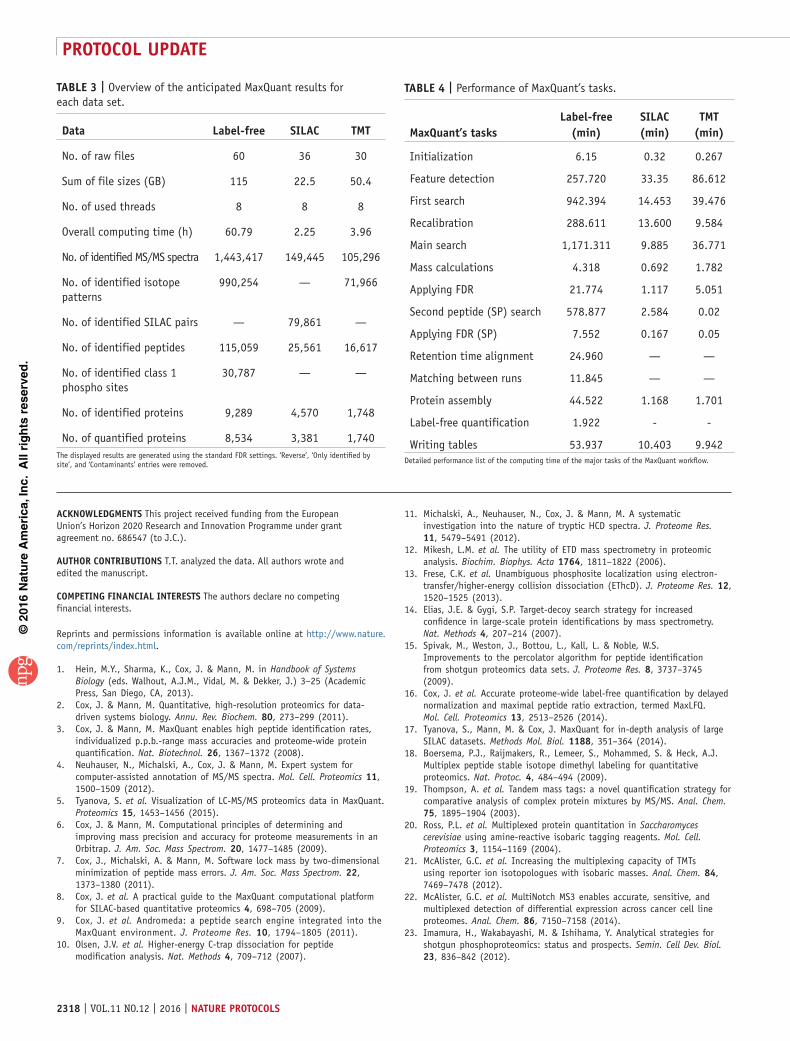
©20
16N
atu
re A
mer
ica,
Inc.
All
rig
hts
res
erve
d.
protocol Update
2318 | VOL.11 NO.12 | 2016 | natUre protocols
taBle 3 | Overview of the anticipated MaxQuant results for each data set.
data label-free sIlac tMt
No. of raw files 60 36 30
Sum of file sizes (GB) 115 22.5 50.4
No. of used threads 8 8 8
Overall computing time (h) 60.79 2.25 3.96
No. of identified MS/MS spectra 1,443,417 149,445 105,296
No. of identified isotope patterns
990,254 — 71,966
No. of identified SILAC pairs — 79,861 —
No. of identified peptides 115,059 25,561 16,617
No. of identified class 1 phospho sites
30,787 — —
No. of identified proteins 9,289 4,570 1,748
No. of quantified proteins 8,534 3,381 1,740The displayed results are generated using the standard FDR settings. ‘Reverse’, ‘Only identified by site’, and ‘Contaminants’ entries were removed.
taBle 4 | Performance of MaxQuant’s tasks.
MaxQuant’s taskslabel-free
(min)sIlac (min)
tMt (min)
Initialization 6.15 0.32 0.267
Feature detection 257.720 33.35 86.612
First search 942.394 14.453 39.476
Recalibration 288.611 13.600 9.584
Main search 1,171.311 9.885 36.771
Mass calculations 4.318 0.692 1.782
Applying FDR 21.774 1.117 5.051
Second peptide (SP) search 578.877 2.584 0.02
Applying FDR (SP) 7.552 0.167 0.05
Retention time alignment 24.960 — —
Matching between runs 11.845 — —
Protein assembly 44.522 1.168 1.701
Label-free quantification 1.922 - -
Writing tables 53.937 10.403 9.942Detailed performance list of the computing time of the major tasks of the MaxQuant workflow.
acknowledGMents This project received funding from the European Union’s Horizon 2020 Research and Innovation Programme under grant agreement no. 686547 (to J.C.).
aUtHor contrIBUtIons T.T. analyzed the data. All authors wrote and edited the manuscript.
coMpetInG FInancIal Interests The authors declare no competing financial interests.
Reprints and permissions information is available online at http://www.nature.com/reprints/index.html.
1. Hein, M.Y., Sharma, K., Cox, J. & Mann, M. in Handbook of Systems Biology (eds. Walhout, A.J.M., Vidal, M. & Dekker, J.) 3–25 (Academic Press, San Diego, CA, 2013).
2. Cox, J. & Mann, M. Quantitative, high-resolution proteomics for data-driven systems biology. Annu. Rev. Biochem. 80, 273–299 (2011).
3. Cox, J. & Mann, M. MaxQuant enables high peptide identification rates, individualized p.p.b.-range mass accuracies and proteome-wide protein quantification. Nat. Biotechnol. 26, 1367–1372 (2008).
4. Neuhauser, N., Michalski, A., Cox, J. & Mann, M. Expert system for computer-assisted annotation of MS/MS spectra. Mol. Cell. Proteomics 11, 1500–1509 (2012).
5. Tyanova, S. et al. Visualization of LC-MS/MS proteomics data in MaxQuant. Proteomics 15, 1453–1456 (2015).
6. Cox, J. & Mann, M. Computational principles of determining and improving mass precision and accuracy for proteome measurements in an Orbitrap. J. Am. Soc. Mass Spectrom. 20, 1477–1485 (2009).
7. Cox, J., Michalski, A. & Mann, M. Software lock mass by two-dimensional minimization of peptide mass errors. J. Am. Soc. Mass Spectrom. 22, 1373–1380 (2011).
8. Cox, J. et al. A practical guide to the MaxQuant computational platform for SILAC-based quantitative proteomics 4, 698–705 (2009).
9. Cox, J. et al. Andromeda: a peptide search engine integrated into the MaxQuant environment. J. Proteome Res. 10, 1794–1805 (2011).
10. Olsen, J.V. et al. Higher-energy C-trap dissociation for peptide modification analysis. Nat. Methods 4, 709–712 (2007).
11. Michalski, A., Neuhauser, N., Cox, J. & Mann, M. A systematic investigation into the nature of tryptic HCD spectra. J. Proteome Res. 11, 5479–5491 (2012).
12. Mikesh, L.M. et al. The utility of ETD mass spectrometry in proteomic analysis. Biochim. Biophys. Acta 1764, 1811–1822 (2006).
13. Frese, C.K. et al. Unambiguous phosphosite localization using electron-transfer/higher-energy collision dissociation (EThcD). J. Proteome Res. 12, 1520–1525 (2013).
14. Elias, J.E. & Gygi, S.P. Target-decoy search strategy for increased confidence in large-scale protein identifications by mass spectrometry. Nat. Methods 4, 207–214 (2007).
15. Spivak, M., Weston, J., Bottou, L., Kall, L. & Noble, W.S. Improvements to the percolator algorithm for peptide identification from shotgun proteomics data sets. J. Proteome Res. 8, 3737–3745 (2009).
16. Cox, J. et al. Accurate proteome-wide label-free quantification by delayed normalization and maximal peptide ratio extraction, termed MaxLFQ. Mol. Cell. Proteomics 13, 2513–2526 (2014).
17. Tyanova, S., Mann, M. & Cox, J. MaxQuant for in-depth analysis of large SILAC datasets. Methods Mol. Biol. 1188, 351–364 (2014).
18. Boersema, P.J., Raijmakers, R., Lemeer, S., Mohammed, S. & Heck, A.J. Multiplex peptide stable isotope dimethyl labeling for quantitative proteomics. Nat. Protoc. 4, 484–494 (2009).
19. Thompson, A. et al. Tandem mass tags: a novel quantification strategy for comparative analysis of complex protein mixtures by MS/MS. Anal. Chem. 75, 1895–1904 (2003).
20. Ross, P.L. et al. Multiplexed protein quantitation in Saccharomyces cerevisiae using amine-reactive isobaric tagging reagents. Mol. Cell. Proteomics 3, 1154–1169 (2004).
21. McAlister, G.C. et al. Increasing the multiplexing capacity of TMTs using reporter ion isotopologues with isobaric masses. Anal. Chem. 84, 7469–7478 (2012).
22. McAlister, G.C. et al. MultiNotch MS3 enables accurate, sensitive, and multiplexed detection of differential expression across cancer cell line proteomes. Anal. Chem. 86, 7150–7158 (2014).
23. Imamura, H., Wakabayashi, M. & Ishihama, Y. Analytical strategies for shotgun phosphoproteomics: status and prospects. Semin. Cell Dev. Biol. 23, 836–842 (2012).
©20
16N
atu
re A
mer
ica,
Inc.
All
rig
hts
res
erve
d.
protocol Update
natUre protocols | VOL.11 NO.12 | 2016 | 2319
24. Zhou, H. et al. Enhancing the identification of phosphopeptides from putative basophilic kinase substrates using Ti (IV) based IMAC enrichment. Mol. Cell. Proteomics 10, M110 006452 (2011).
25. Sharma, K. et al. Ultradeep human phosphoproteome reveals a distinct regulatory nature of tyr and ser/thr-based signaling. Cell Rep. 8, 1583–1594 (2014).
26. Savitski, M.M., Nielsen, M.L. & Zubarev, R.A. ModifiComb, a new proteomic tool for mapping substoichiometric post-translational modifications, finding novel types of modifications, and fingerprinting complex protein mixtures. Mol. Cell. Proteomics 5, 935–948 (2006).
27. Chick, J.M. et al. A mass-tolerant database search identifies a large proportion of unassigned spectra in shotgun proteomics as modified peptides. Nat. Biotechnol. 33, 743–749 (2015).
28. Neuhauser, N. et al. High performance computational analysis of large-scale proteome data sets to assess incremental contribution to coverage of the human genome. J. Proteome Res. 12, 2858–2868 (2013).
29. Tyanova, S. et al. The Perseus computational platform for comprehensive analysis of (prote)omics data. Nat. Methods 9, 731–740 (2016).
30. Deeb, S.J. et al. Machine learning based classification of diffuse large B-cell lymphoma patients by their protein expression profiles. Mol. Cell. Proteomics 14, 2947–2960 (2015).
31. Cox, J. & Mann, M. 1D and 2D annotation enrichment: a statistical method integrating quantitative proteomics with complementary high-throughput data. BMC Bioinformatics 13 (Suppl. 16), S12 (2012).
32. Robles, M.S., Cox, J. & Mann, M. In-vivo quantitative proteomics reveals a key contribution of post-transcriptional mechanisms to the circadian regulation of liver metabolism. PLoS Genet. 10, e1004047 (2014).
33. Schaab, C., Geiger, T., Stoehr, G., Cox, J. & Mann, M. Analysis of high accuracy, quantitative proteomics data in the MaxQB database. Mol. Cell. Proteomics 11, M111 014068 (2012).
34. Geiger, T., Cox, J. & Mann, M. Proteomics on an Orbitrap benchtop mass spectrometer using all-ion fragmentation. Mol. Cell. Proteomics 9, 2252–2261 (2010).
35. MacLean, B. et al. Skyline: an open source document editor for creating and analyzing targeted proteomics experiments. Bioinformatics 26, 966–968 (2010).
36. Fellers, R.T. et al. ProSight Lite: graphical software to analyze top-down mass spectrometry data. Proteomics 15, 1235–1238 (2015).
37. Geiger, T. et al. Initial quantitative proteomic map of 28 mouse tissues using the SILAC mouse. Mol. Cell. Proteomics 12, 1709–1722 (2013).
38. Keshishian, H. et al. Multiplexed, quantitative workflow for sensitive biomarker discovery in plasma yields novel candidates for early myocardial injury. Mol. Cell. Proteomics 14, 2375–2393 (2015).
39. Chen, Z.A., Fischer, L., Cox, J. & Rappsilber, J. Quantitative cross-linking/mass spectrometry using isotope-labeled cross-linkers and MaxQuant. Mol. Cell. Proteomics (2016).
40. Michalski, A., Cox, J. & Mann, M. More than 100,000 detectable peptide species elute in single shotgun proteomics runs but the majority is inaccessible to data-dependent LC-MS/MS. J. Proteome Res. 10, 1785–1793 (2011).
41. Geiger, T., Wehner, A., Schaab, C., Cox, J. & Mann, M. Comparative proteomic analysis of eleven common cell lines reveals ubiquitous but varying expression of most proteins. Mol. Cell. Proteomics 11, M111 014050 (2012).
42. Nesvizhskii, A.I., Keller, A., Kolker, E. & Aebersold, R. A statistical model for identifying proteins by tandem mass spectrometry. Anal. Chem. 75, 4646–4658 (2003).
43. Reiter, L. et al. Protein identification false discovery rates for very large proteomics data sets generated by tandem mass spectrometry. Mol. Cell. Proteomics 8, 2405–2417 (2009).
44. Schwanhäusser, B. et al. Global quantification of mammalian gene expression control. Nature 473, 337–342 (2011).
45. Wisniewski, J.R., Hein, M.Y., Cox, J. & Mann, M. A ‘proteomic ruler’ for protein copy number and concentration estimation without spike-in standards. Mol. Cell. Proteomics 13, 3497–3506 (2014).
46. Olsen, J.V. et al. Quantitative phosphoproteomics reveals widespread full phosphorylation site occupancy during mitosis. Sci. Signal. 3, ra3 (2010).