Embed Size (px)
Citation preview
1
Winchester Bay Coastal User Survey1,2: A look at the intersection of recreational use
and renewable energy project siting on the Oregon coast
Marissa Matsler Yale School of Forestry and Environmental Studies
195 Prospect Street New Haven, CT 06511
Submitted December 1st, 2009
1 This is one of several studies that was requested by the Federal Energy Regulatory Commission (FERC) on September 29, 2008 in response to Douglas County’s Pre-Application Document (PAD) for the Douglas County Wave & Tidal Energy Project [4,12]. Results of the study may be considered by both Douglas County and FERC in the planning and permitting process for Project No. 12743-001 that proposes installation of an Oscillating Water Column (OWC) generator and turbine directly into the structure of the south jetty of Winchester Bay. 2 The author is grateful to Douglas County, Oregon Wave Energy Trust, the Surfrider Foundation, and Yale School of Forestry and Environmental Studies for their financial support of this study. She thanks Linwood Pendleton for his time advising the development of the study and for his engaged review of methods and findings. A special thanks to Gus Gates for his consistent project coordination efforts and feedback, as well as Peter Stauffer for his help lining this project up. The comments of reviewers Tim Gregoire, Flaxen Conway, and Ron Yockim also guided the creation of this report and were greatly appreciated. The author would finally like to give a heartfelt thank you to all of the South Jetty users she encountered over the summer of 2009 for their time and patience filling paperwork out on the beach.

Executive Summary
“To make informed decisions, coastal professionals require complete information about the users and constituents that will be affected by coastal policies and activities, especially those that involve development...” [6]
This report focuses on a specific wave energy project proposed by Douglas County for instillation on, or adjacent to, the South Jetty of Winchester Bay, Oregon. Utilizing technology that has previously not been employed in the United States, Douglas County submitted a pre-‐application document (PAD) to the Federal Energy Regulation Commission (FERC) proposing a near-‐shore Oscillating Water Column (OWC) generator and turbine [12]. A project such as this has implications for the recreational community enjoying the current services of the South Jetty due to the project’s modification of specific environmental factors on site. This is evident in reading comments submitted to FERC by the non-‐profit Surfrider Foundation and many individuals following the county’s PAD submission, as well as multiple coastal development research projects worldwide [2,11]. To inform the decision-‐making process and gain a more comprehensive understanding of the use of the South Jetty, this study examines current recreational use at the site, as well as estimates of the effect that potential environmental changes due to wave energy project development might have on recreational use. Surfers are a focus of this study due to their known sensitivity to environmental changes resulting from development and their relatively unstudied habits and demographics [6,2,11]. Fishermen and beach goers are also of interest as contrasting recreational user groups with different environmental needs. Estimating Recreational Use A survey instrument was deployed at the South Jetty of Winchester Bay from June 19th to August 24th, 2009. A written questionnaire3 was handed out in person to all users that approached the study site during pre-‐determined surveying hours. Recreational users were questioned about:
• visitation rate • expenditures in the local area • recreational activity they would engage in at the site • and other visitation parameters
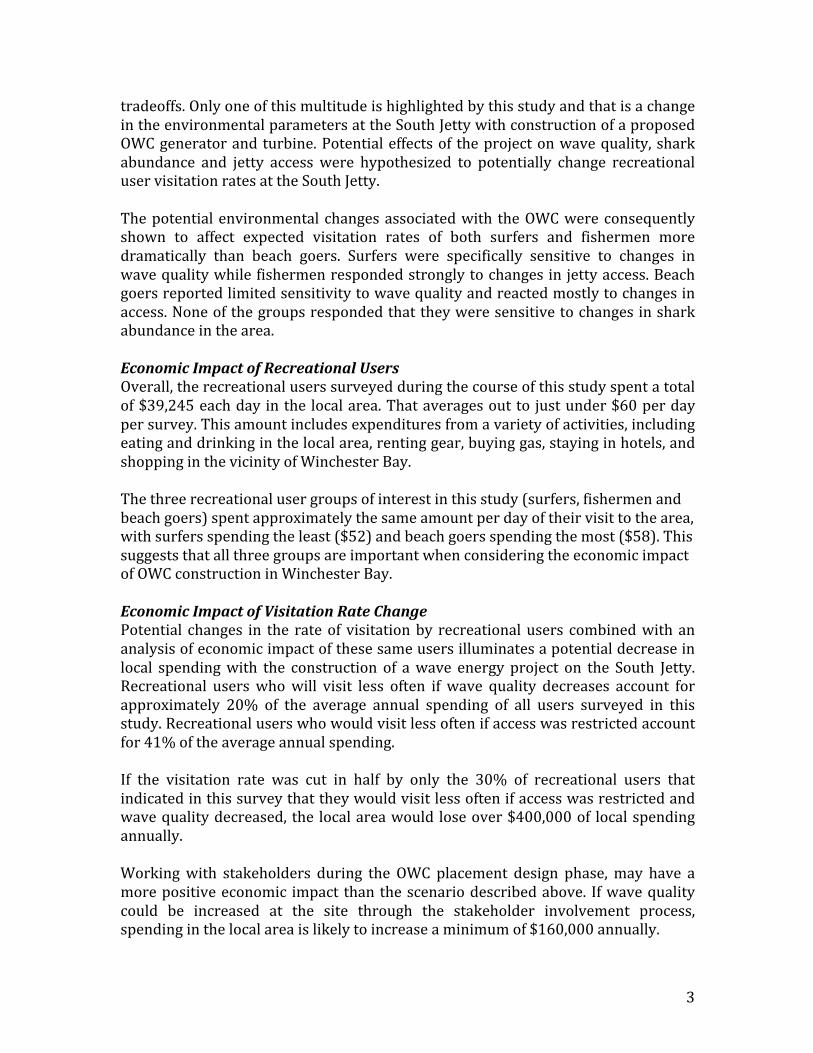
Impact of Environmental Conditions on Recreational Users As introduced above, tradeoffs are involved in the construction of renewable energy technologies. Decision makers must weigh the consequences of many complicated 3 Refer Appendix A for complete survey.
3
tradeoffs. Only one of this multitude is highlighted by this study and that is a change in the environmental parameters at the South Jetty with construction of a proposed OWC generator and turbine. Potential effects of the project on wave quality, shark abundance and jetty access were hypothesized to potentially change recreational user visitation rates at the South Jetty. The potential environmental changes associated with the OWC were consequently shown to affect expected visitation rates of both surfers and fishermen more dramatically than beach goers. Surfers were specifically sensitive to changes in wave quality while fishermen responded strongly to changes in jetty access. Beach goers reported limited sensitivity to wave quality and reacted mostly to changes in access. None of the groups responded that they were sensitive to changes in shark abundance in the area. Economic Impact of Recreational Users Overall, the recreational users surveyed during the course of this study spent a total of $39,245 each day in the local area. That averages out to just under $60 per day per survey. This amount includes expenditures from a variety of activities, including eating and drinking in the local area, renting gear, buying gas, staying in hotels, and shopping in the vicinity of Winchester Bay. The three recreational user groups of interest in this study (surfers, fishermen and beach goers) spent approximately the same amount per day of their visit to the area, with surfers spending the least ($52) and beach goers spending the most ($58). This suggests that all three groups are important when considering the economic impact of OWC construction in Winchester Bay. Economic Impact of Visitation Rate Change Potential changes in the rate of visitation by recreational users combined with an analysis of economic impact of these same users illuminates a potential decrease in local spending with the construction of a wave energy project on the South Jetty. Recreational users who will visit less often if wave quality decreases account for approximately 20% of the average annual spending of all users surveyed in this study. Recreational users who would visit less often if access was restricted account for 41% of the average annual spending. If the visitation rate was cut in half by only the 30% of recreational users that indicated in this survey that they would visit less often if access was restricted and wave quality decreased, the local area would lose over $400,000 of local spending annually. Working with stakeholders during the OWC placement design phase, may have a more positive economic impact than the scenario described above. If wave quality could be increased at the site through the stakeholder involvement process, spending in the local area is likely to increase a minimum of $160,000 annually.

Table of Contents Introduction (page 5)
1. Development, the Renewable Energy Portfolio, and Recreational Use 2. Winchester Bay study site
a. The wave energy project b. Existing recreational uses
Methods (page 6) 3. Study Site Delineation 4. Survey Instrument 5. Sampling Schedule
Results (page 8) 6. General Results 7. Description of Appendices
Discussion (page 8) 8. Summary of Recreational Uses at the South Jetty (page 8)
a. Functionality of the Main Site vs. Triangle Site 9. Detailed Profile of South Jetty Surfers (page 11)
b. Visitation details i. Summer 2009 wave quality issues
c. Surfing details d. Surfer Demographics
10. Visitation by users (Fall 2008 through Summer 2009) (page 14) a. Surfers, Fishermen & Beach Goers
11. Local Economic Impact of South Jetty Recreational Users (page 15) a. Surfers, Fishermen & Beach Goers
12. Impact of Environmental Change on Coastal Recreation (page 16) a. Changes in wave quality
i. Impact on Surfers, Fishermen & Beach Goers b. Changes in shark abundance
i. Impact on Surfers, Fishermen & Beach Goers c. Changes in access to the rock jetty
i. Impact on Surfers, Fishermen & Beach Goers 13. Economic impact of visitation rate change (page 17)
Conclusion (page 19) 1. Development, the Renewable Energy Portfolio, and Recreational Use
References (page 20) Appendices (page 21)
2. Appendix A: Complete Questionnaire 3. Appendix B: Tabulated Questionnaire Response Results

5
Introduction Development, the Renewable Energy Portfolio, and Recreational Use Recent interest in renewable energy development in the United States has manifested in many different types of projects across the country (e.g. wind, solar, geo-‐thermal, etc). However, as with all infrastructure development, these technologies require space and fundamentally change the environment in which they are built. Wave energy is no exception. Coastal managers need information about all marine area users and potential impacts of wave energy project development on coastal ecosystems, coastal economies, and coastal societies to make just policy decisions. Recreational users are an important constituency in coastal zones. Many recreational activities depend on specific environmental conditions and cannot be performed if these conditions change. Surfing is one of these recreational activities [6]. This study examines the surfing community’s current behavior and potential responses to specific potential environmental changes due to near shore wave energy project development. For perspective and context, all users of the proposed site of development were surveyed. After sampling occurred, fishermen and beach goers were identified as common site users that could lend context to the surfing community’s perspective on the proposed project’s development. Winchester Bay Study Site In 2006, a near-‐shore wave energy project was proposed for the Oregon coast. The proposed site of this project is just south of Reedsport in Winchester Bay. Due to the nature of near-‐shore technologies, rocky structure is needed to stabilize the OWC device. The jetty built at the mouth of the Umpqua River in Winchester Bay provides this structure. The proposal was submitted by Douglas County and was reviewed by FERC [4,12]. The South Jetty of Winchester Bay is located approximately two miles off of Highway 101 at the mouth of the Umpqua River. It is less than 2000 feet from the entrance of the Oregon Dunes National Recreation Area. The Umpqua River Lighthouse is located a half mile inland from the jetty on the site of a Coast Guard station. Salmon Harbor marina also sits just inland on the Umpqua River and is homeport to many commercial and recreational fishing vessels. This proximity to the Oregon Dunes, the Umpqua River lighthouse, and Salmon Harbor marina attract many tourists to Winchester Bay and specifically to the South Jetty. The mouth of the Umpqua River attracts many locals seeking the specific water and wave conditions the river and jetty provide. Surfers and fishermen, both local and visiting, find excellent conditions for fishing a variety of species and for surfing a premier quality right-‐handed surf break.

6
Methods4 Study Site delineation The study area (the South Jetty of Winchester Bay) has two primary access points5. They are referred to in this study as the Main Site and the Triangle Site. People were surveyed at these two locations throughout the summer. The location of these sites in relation to the jetty is shown in Figure 1 below.
Figure 1: Study Sites in Relation to the South and North Jetty of Winchester Bay (map obtained from Google Earth)
Both sites provide free parking to residents and tourists, while the Oregon Dunes National Park lot (3 miles further from Highway 101 along Salmon Harbor Drive) charges per car to park. Access to the Main Site is paved and connects directly to Salmon Harbor Drive with signage indicating beach access. The Main Site consists of a paved parking lot that can accommodate over 50 vehicles. The Triangle Site, on the other hand, is not signed and users must drive along a gravel road off of Salmon Harbor Drive to find the access road. The last portion of the road is mostly sand and requires all terrain vehicles. The Triangle Site does not provide paved parking spaces and is located at the base of a coast guard tower that prohibits parking directly in front of its gates.
4 All methods were based on methodology employed in a 2008 study of the coastal uses of Elkhorn Slough in Central California [8]. The sampling schedule has been altered slightly in the Winchester Bay study to account for different activities of the Oregon coast. Verbal filter questions were also added to the original methodology. 5 Study sites were determined through observation and local knowledge of employees of the Surfrider Foundation.
SITE 2: Triangle Parking Area
SITE 1: Main Parking Lot
North Jetty
South Jetty
7
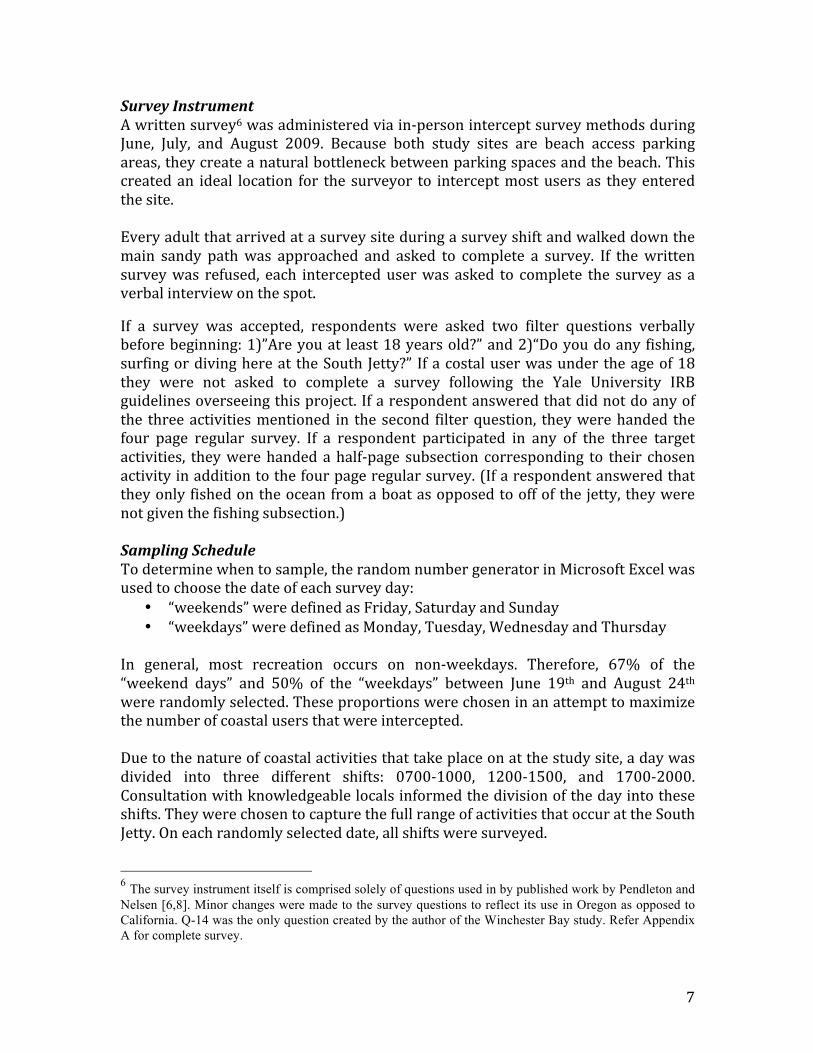
Survey Instrument A written survey6 was administered via in-‐person intercept survey methods during June, July, and August 2009. Because both study sites are beach access parking areas, they create a natural bottleneck between parking spaces and the beach. This created an ideal location for the surveyor to intercept most users as they entered the site. Every adult that arrived at a survey site during a survey shift and walked down the main sandy path was approached and asked to complete a survey. If the written survey was refused, each intercepted user was asked to complete the survey as a verbal interview on the spot. If a survey was accepted, respondents were asked two filter questions verbally before beginning: 1)”Are you at least 18 years old?” and 2)“Do you do any fishing, surfing or diving here at the South Jetty?” If a costal user was under the age of 18 they were not asked to complete a survey following the Yale University IRB guidelines overseeing this project. If a respondent answered that did not do any of the three activities mentioned in the second filter question, they were handed the four page regular survey. If a respondent participated in any of the three target activities, they were handed a half-‐page subsection corresponding to their chosen activity in addition to the four page regular survey. (If a respondent answered that they only fished on the ocean from a boat as opposed to off of the jetty, they were not given the fishing subsection.) Sampling Schedule To determine when to sample, the random number generator in Microsoft Excel was used to choose the date of each survey day:
• “weekends” were defined as Friday, Saturday and Sunday • “weekdays” were defined as Monday, Tuesday, Wednesday and Thursday
In general, most recreation occurs on non-‐weekdays. Therefore, 67% of the “weekend days” and 50% of the “weekdays” between June 19th and August 24th were randomly selected. These proportions were chosen in an attempt to maximize the number of coastal users that were intercepted. Due to the nature of coastal activities that take place on at the study site, a day was divided into three different shifts: 0700-‐1000, 1200-‐1500, and 1700-‐2000. Consultation with knowledgeable locals informed the division of the day into these shifts. They were chosen to capture the full range of activities that occur at the South Jetty. On each randomly selected date, all shifts were surveyed.
6 The survey instrument itself is comprised solely of questions used in by published work by Pendleton and Nelsen [6,8]. Minor changes were made to the survey questions to reflect its use in Oregon as opposed to California. Q-14 was the only question created by the author of the Winchester Bay study. Refer Appendix A for complete survey.

8
The site at which each shift took place was also randomly selected. Data was collected 67% of the time at the Main Site and 33% of the time at the Triangle Site. This proportion was determined by initial pre-‐summer observation at both sites again to maximize the number of coastal users (specifically surfers) that were intercepted. Results During sampling from June 19th through August 24th, a total of 668 groups of users, representing 1,206 adult visitors, agreed to respond and properly completed a survey.
There were approximately the same number of surfers and fishermen surveyed over the course of the study, each making up nearly 9% of respondents. Beach goers were the largest group surveyed representing over 60% of total population surveyed. A total of 648 people refused to take the survey when approached. This indicates a 65% response rate (1,206 people who accepted out of 1,854 total people approached). Questionnaire Responses The response rate of each question in the survey was calculated within Microsoft Excel. The proportion of total users answering with a specific answer was then calculated for each question, as well as those who did not answer properly. Please see Appendix B for a tabulated summary of responses to each question of the survey instrument. Discussion Summary of Recreational Uses at the South Jetty All respondents were asked to indicate which recreational activities they would be partaking in during their visit to the jetty. A selection of activities was supplied with the question to narrow the scope of answers to activities that were most interesting to this study, namely surfing, fishing, diving and wildlife viewing. Beach Going emerged overall as the most popular activity undertaken at the South Jetty during the study period. Hiking/Walking was indicated as a South Jetty activity by about half as many people as indicated Beach Going. The third and fourth most

9
popular activities were Wildlife Watching and Dog Walking. See Figure 2 below for a breakdown of all activities7.
Figure 2: Number of responses to the question: “Today, which activities did/will you undertake at the South Jetty?” at both the Main Site and the Triangle Site combined
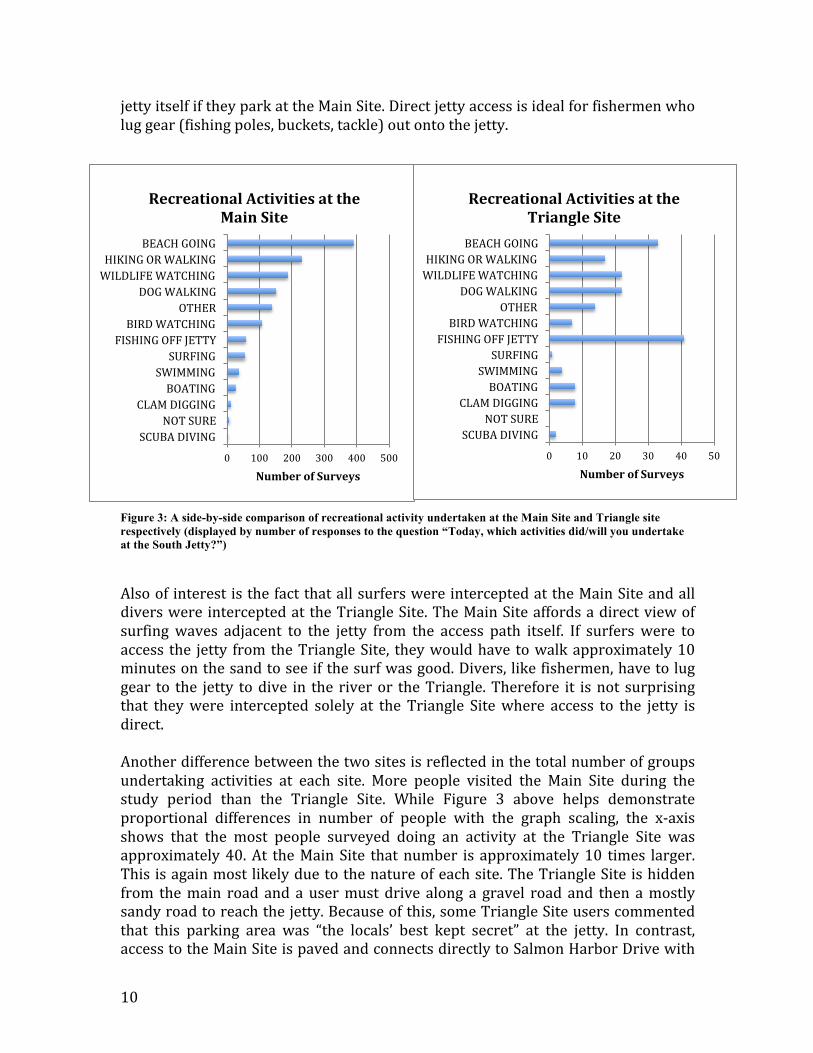
From this graph it is also apparent that consumptive recreational uses, namely Fishing off Jetty and Clam Digging, are undertaken by less of the total user population than more generic non-‐consumptive uses such as Beach Going or Wildlife Watching. Likewise, activities that take place within the water itself, namely Surfing and Swimming, were indicated by only an eighth as many respondents as the sand-‐based and most popular activity of Beach Going. Functionality of the Main Site vs. the Triangle Site When the two survey sites are disaggregated, a different recreational use pattern appears. In Figure 3 below, the same activity choices are displayed for the surveys collected at the Main Site and Triangle Site separately. (Please refer to Figure 1 for mapped location of each site). The graph of the Main Site follows a similar pattern of recreational activity popularity as the previous analysis of combined sites. However, at the Triangle Site, Fishing off Jetty becomes the most prominent activity in front of Beach Going. Figure 3 below suggests that there is a functional difference between the two sites sampled. One explanation for this functional difference is the distance of each access point from the rock jetty itself. The Triangle Site gives a user direct access to the jetty, whereas a user must walk 5-‐7 minutes through the sand to reach the rock
7 Because respondents were able to circle multiple activities in this question, the total number of people represented in Figure 2 is much greater than the total number of surveys collected.
0 50 100 150 200 250 300 350 400 450
SCUBA DIVING NOT SURE
CLAM DIGGING BOATING
SWIMMING SURFING
FISHING OFF JETTY BIRD WATCHING
OTHER DOG WALKING
WILDLIFE WATCHING HIKING OR WALKING
BEACH GOING
Number of Surveys
Breakdown of Recreation by Activity (both sites combined)
10
jetty itself if they park at the Main Site. Direct jetty access is ideal for fishermen who lug gear (fishing poles, buckets, tackle) out onto the jetty.
Figure 3: A side-by-side comparison of recreational activity undertaken at the Main Site and Triangle site respectively (displayed by number of responses to the question “Today, which activities did/will you undertake at the South Jetty?”)
Also of interest is the fact that all surfers were intercepted at the Main Site and all divers were intercepted at the Triangle Site. The Main Site affords a direct view of surfing waves adjacent to the jetty from the access path itself. If surfers were to access the jetty from the Triangle Site, they would have to walk approximately 10 minutes on the sand to see if the surf was good. Divers, like fishermen, have to lug gear to the jetty to dive in the river or the Triangle. Therefore it is not surprising that they were intercepted solely at the Triangle Site where access to the jetty is direct. Another difference between the two sites is reflected in the total number of groups undertaking activities at each site. More people visited the Main Site during the study period than the Triangle Site. While Figure 3 above helps demonstrate proportional differences in number of people with the graph scaling, the x-‐axis shows that the most people surveyed doing an activity at the Triangle Site was approximately 40. At the Main Site that number is approximately 10 times larger. This is again most likely due to the nature of each site. The Triangle Site is hidden from the main road and a user must drive along a gravel road and then a mostly sandy road to reach the jetty. Because of this, some Triangle Site users commented that this parking area was “the locals’ best kept secret” at the jetty. In contrast, access to the Main Site is paved and connects directly to Salmon Harbor Drive with
0 100 200 300 400 500
SCUBA DIVING NOT SURE
CLAM DIGGING BOATING
SWIMMING SURFING
FISHING OFF JETTY BIRD WATCHING
OTHER DOG WALKING
WILDLIFE WATCHING HIKING OR WALKING
BEACH GOING
Number of Surveys
Recreational Activities at the Main Site
0 10 20 30 40 50
SCUBA DIVING NOT SURE
CLAM DIGGING BOATING
SWIMMING SURFING
FISHING OFF JETTY BIRD WATCHING
OTHER DOG WALKING
WILDLIFE WATCHING HIKING OR WALKING
BEACH GOING
Number of Surveys
Recreational Activities at the Triangle Site
11
signage indicating beach access. Also, approximately ten times as many vehicles can be parked in the Main Site lot as opposed to the Triangle Site parking area allowing more users to access the site at one time. Surfing Profile Surfers were a specific focus of this study. While all recreational users were asked to fill out a survey, surfers were targeted with word of mouth campaigns and a survey instrument subsection. Overall, 72 surfers were surveyed. They were all intercepted at the Main Site. No one was observed surfing at the Triangle Site during the course of the study. Surfing Visitation Details Surfers’ visitation rates are described briefly below in the Visitation by All Users subsection. However, there are more specific aspects of surfer visitation patterns analyzed in this section. Residence A majority of surfers (66%) live nearby the South Jetty. Of the 94% of surfers who responded appropriately to the question about local residency, 20% responded that they were residents of either Winchester Bay or Reedsport. Another 46% of surfers responded that they were not making an overnight trip and staying only one day in the area. This suggests that they most likely lived no further than a two to three hour drive from the South Jetty. Years Visiting the Jetty Surfers surveyed over the summer were familiar with surfing at the South Jetty site. A majority of surfers (80%) responded that they had been to the jetty before. The average number of years that surfers had been surfing at the South Jetty among those sampled was nearly 10 years. Approximately 5% indicated that they had been surfing at the jetty for 45 years and 10% had been visiting the site to surf between 20 and 30 years. 2009 Wave Quality Issues Poor wave quality at the South Jetty over the course of the study (June-‐August 2009) was reported by all surfers who had previously visited the site. Many surfers had come to check the surf but did not surf at the study site the day they were surveyed due to poor wave quality. This lack of quality surf during the study period may have led this surfing profile analysis to underestimate surfing demand in the area. Surveyed surfers reported that spreading news of the continued poor surf conditions at the South Jetty was leading to fewer visits by some regular South Jetty surfers. These surfers were most likely not captured during the study period.
12
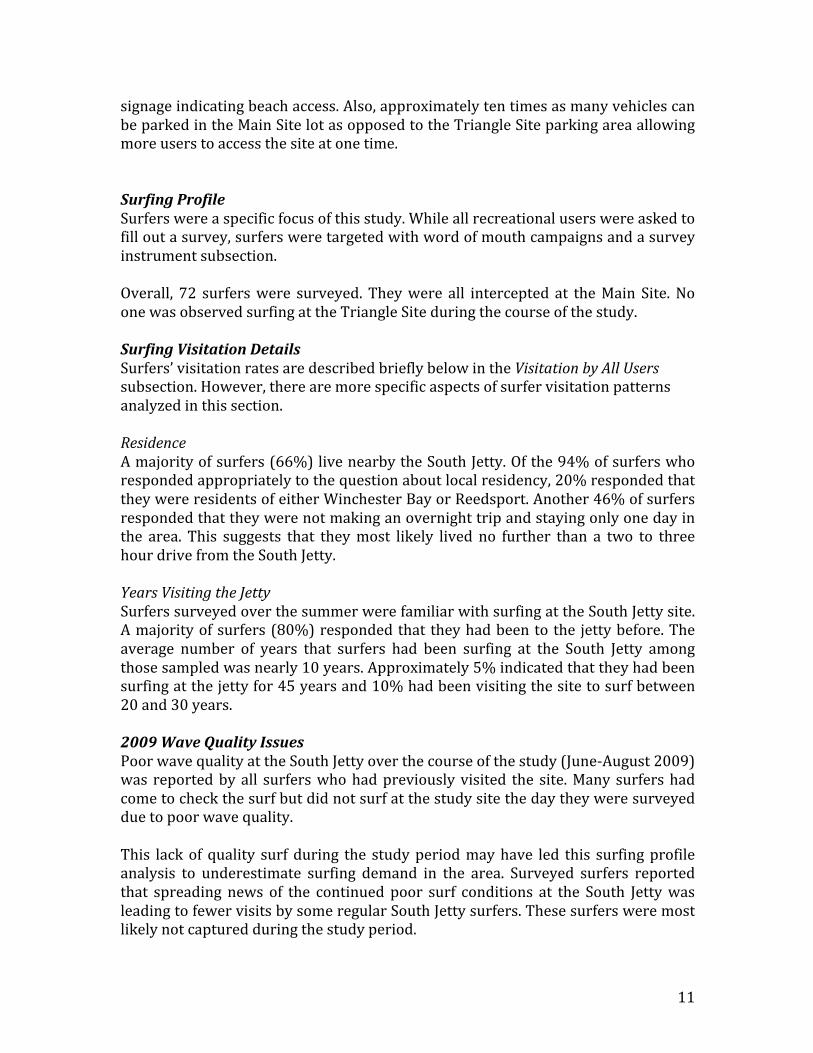
Surfing details To gain a better understanding of surfers’ behavioral patterns and demographics, surfers were asked a number of specific questions in a separate subsection of the survey instrument. These included their experience level as a surfer, the type of surfing they undertook at the South Jetty and whether or not they surfed on both the North and South Jetties of Winchester Bay. Experience Level It is not surprising after reviewing the visitation section above that the surfers sampled at the South Jetty were also experienced surfers. A majority (76%) responded that they were competent in most wave conditions and surfed regularly. 18% indicated that they were of Intermediate skill level and only 4% responded that they were Beginners. Surfing Type The most popular type of surfing at the South Jetty was Short Board surfing with 86% of the surfers sampled responding that they undertook Short Board surfing at the South Jetty. Long Board surfing is also worth mentioning as 58% of the surfers sampled indicated that they also participated in Long Board surfing at the site. Figure 4 shows the number of surfers that indicated participating in each of the eight types of surfing listed8.
Figure 4: Number of surfers who participate in each type of surfing at the South Jetty
South Jetty vs. North Jetty Surfers’ preference for the North or South Jetty of Winchester Bay was also questioned. A majority of the surfing population that was intercepted at the South
8 Again, surfers were able to circle all types of surfing that they participated in at the South Jetty. Many circled more than one type resulting in a number of surfers well over the total 72 surveyed.
0 10 20 30 40 50 60 70
Body Surking Short Board Surking Long Board Surking
Kayak Surking Body Boarding Kite Boarding Wind Surking
Paddle Boarding Not Sure
Number of Surfers
Types of SurMing at the South Jetty
13
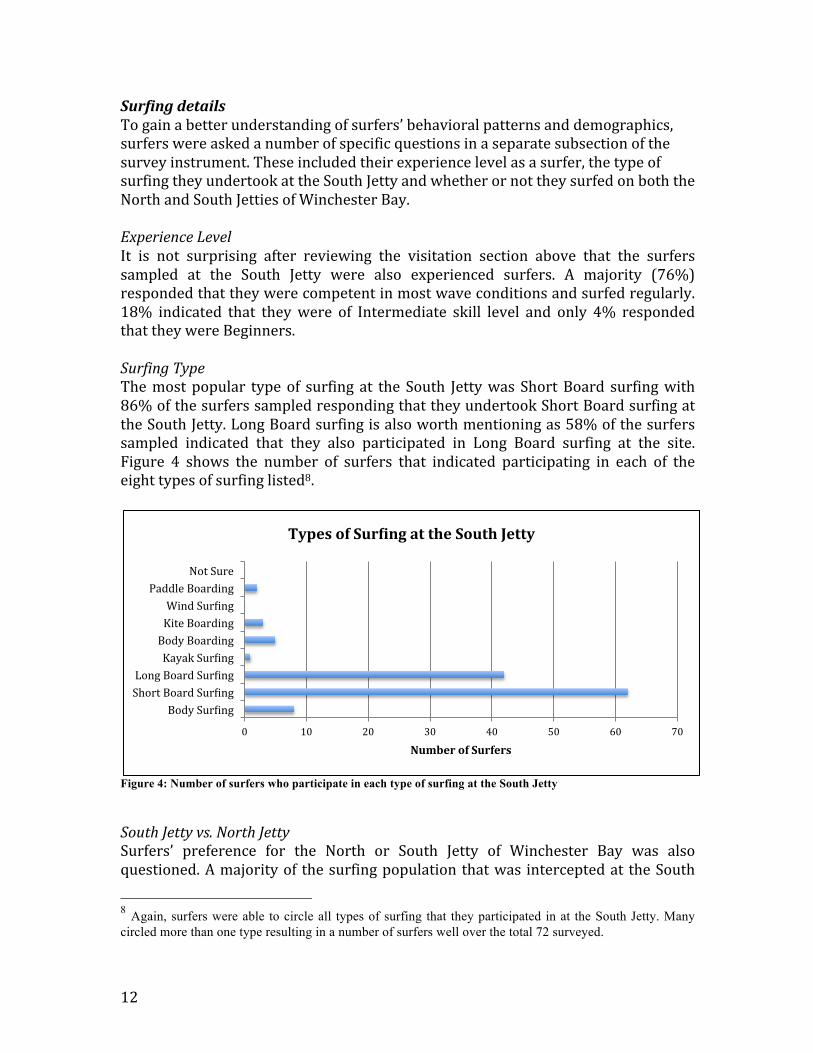
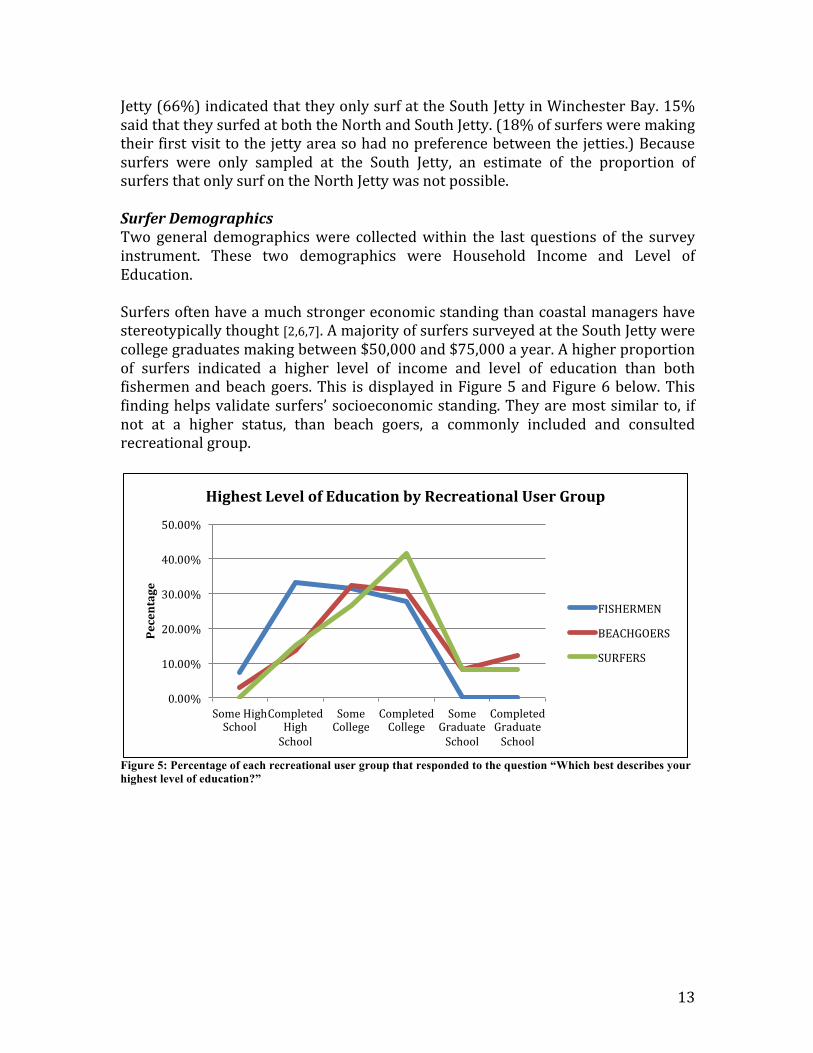
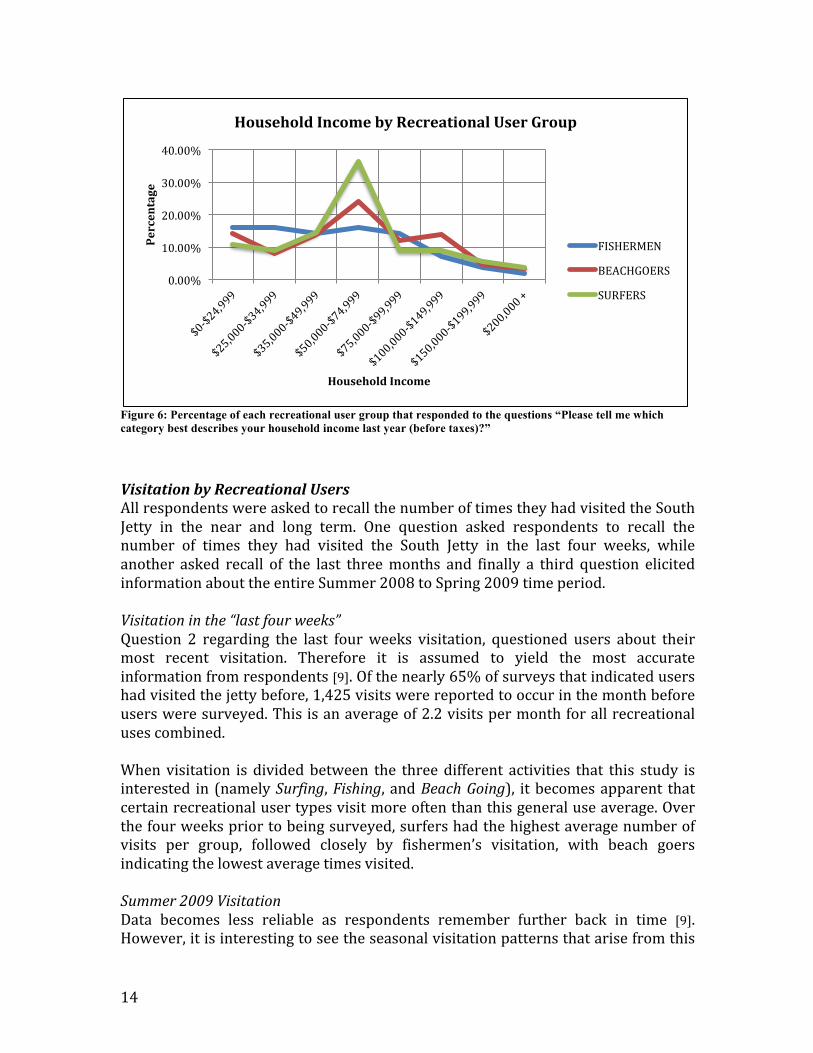
Jetty (66%) indicated that they only surf at the South Jetty in Winchester Bay. 15% said that they surfed at both the North and South Jetty. (18% of surfers were making their first visit to the jetty area so had no preference between the jetties.) Because surfers were only sampled at the South Jetty, an estimate of the proportion of surfers that only surf on the North Jetty was not possible. Surfer Demographics Two general demographics were collected within the last questions of the survey instrument. These two demographics were Household Income and Level of Education. Surfers often have a much stronger economic standing than coastal managers have stereotypically thought [2,6,7]. A majority of surfers surveyed at the South Jetty were college graduates making between $50,000 and $75,000 a year. A higher proportion of surfers indicated a higher level of income and level of education than both fishermen and beach goers. This is displayed in Figure 5 and Figure 6 below. This finding helps validate surfers’ socioeconomic standing. They are most similar to, if not at a higher status, than beach goers, a commonly included and consulted recreational group.
Figure 5: Percentage of each recreational user group that responded to the question “Which best describes your highest level of education?”
0.00%
10.00%
20.00%
30.00%
40.00%
50.00%
Some High School
Completed High School
Some College
Completed College
Some Graduate School
Completed Graduate School
Pecentage
Highest Level of Education by Recreational User Group
FISHERMEN
BEACHGOERS
SURFERS
14
Figure 6: Percentage of each recreational user group that responded to the questions “Please tell me which category best describes your household income last year (before taxes)?”
Visitation by Recreational Users All respondents were asked to recall the number of times they had visited the South Jetty in the near and long term. One question asked respondents to recall the number of times they had visited the South Jetty in the last four weeks, while another asked recall of the last three months and finally a third question elicited information about the entire Summer 2008 to Spring 2009 time period. Visitation in the “last four weeks” Question 2 regarding the last four weeks visitation, questioned users about their most recent visitation. Therefore it is assumed to yield the most accurate information from respondents [9]. Of the nearly 65% of surveys that indicated users had visited the jetty before, 1,425 visits were reported to occur in the month before users were surveyed. This is an average of 2.2 visits per month for all recreational uses combined. When visitation is divided between the three different activities that this study is interested in (namely Surfing, Fishing, and Beach Going), it becomes apparent that certain recreational user types visit more often than this general use average. Over the four weeks prior to being surveyed, surfers had the highest average number of visits per group, followed closely by fishermen’s visitation, with beach goers indicating the lowest average times visited. Summer 2009 Visitation Data becomes less reliable as respondents remember further back in time [9]. However, it is interesting to see the seasonal visitation patterns that arise from this
0.00%
10.00%
20.00%
30.00%
40.00% Percentage
Household Income
Household Income by Recreational User Group
FISHERMEN
BEACHGOERS
SURFERS

15
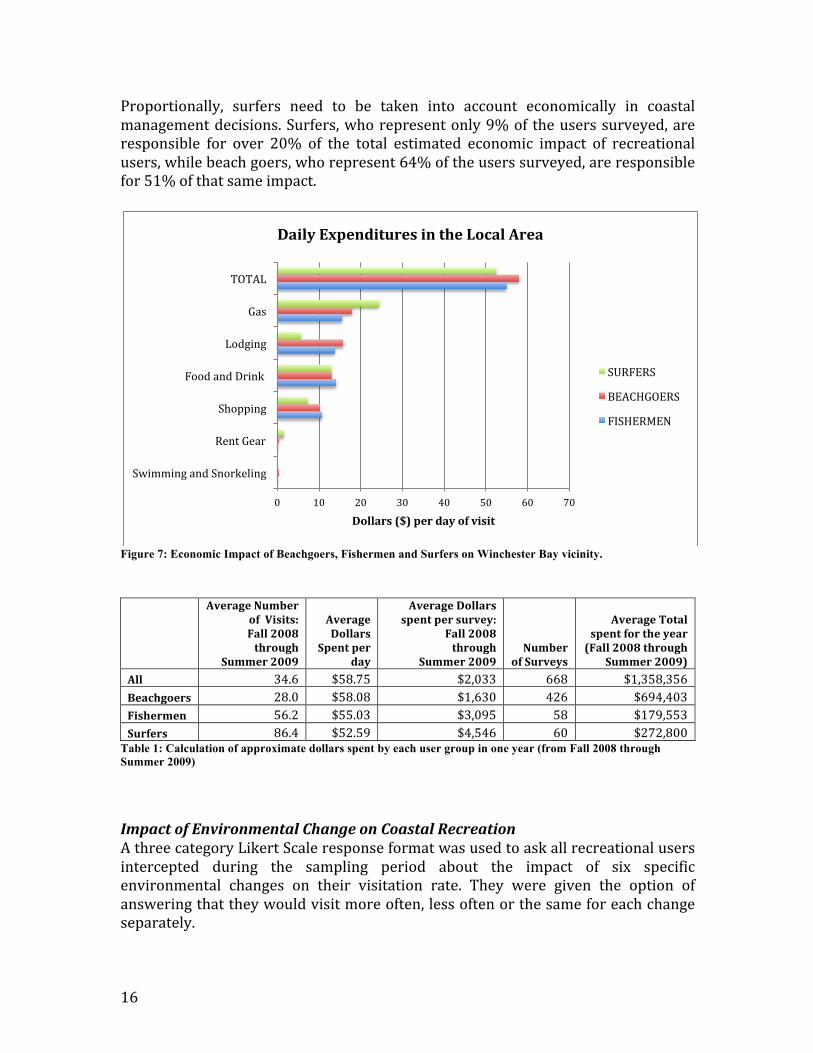
data. When questioned about visitation over the past three months, surfers indicated that they visited the site more times on average than both fishermen and beach goers. The average number of visits per surfer survey was 16.9 during Summer 2009. Fishermen visited an average of 11.3 times over the same time period. Beach goers had the lowest visitation rate during Summer 2009 with an average of 5.6 visits. Summer 2008 – Spring 2009 Visitation The Summer 2009 pattern of visitation is seen throughout the year in the data collected about visitation rates from Summer 2008 through Spring 2009. Surfers indicate the highest average number of visits during all seasons, with the highest visitation rates in Fall 2008 (25.2 visits per surfer survey). Winter 2008 had the lowest surfer visitation rate of 18 visits. Fishermen visit slightly less overall with the highest visitation rate (17 visits per fisherman survey) in Summer 2008 instead of the Fall. Lowest visitation was also in Winter 2008 (8.2 visits). Beach goers did not indicate as dramatic a seasonality of visitation, reporting that they visited most in Summer 2008 (an average of 7.9 times) and the least in Winter 2008 (an average of 5.5 times). Local Economic Impact of South Jetty Recreational Users All respondents were asked about their spending in the local area during their visit. They were asked to report the amount of money they spent on various local accommodations including food, lodging, shopping and gear rentals9. These expenditures are summarized in Figure 7 below. When all expenditures are summed, Figure 7 shows that beach goers spend the most per day of their visit ($58) and surfers spend the least ($52). However, surfers visit nearly three times as often as beach goers. This means that each surfer spent nearly three times as much as each beachgoer over the 12 months of visitation between the beginning of Fall 2008 and the end of Summer 2009. A caveat needs to be taken into consideration, however, when looking at surfers’ overall contribution to the economic impact of recreational use. Surfers represent only 9% of the population of recreational users surveyed. Beachgoers were 64% of users surveyed. When multiplied across the number of visits of each user group surveyed, beachgoers account for $694,000 over the course of a year and surfers account for only $273,000. This finding is summarized in Table 1 below.
9 Gear purchases were removed from this analysis as many users reported total lifetime gear expenditure as opposed to expenditure on the day surveyed. This would have lead to an overestimate of the economic impact of surfers and fishermen. The category “Other” was also removed from the analysis as many users reported expenditures in other parts of the state (often inland) that do not apply to this study.
16
Proportionally, surfers need to be taken into account economically in coastal management decisions. Surfers, who represent only 9% of the users surveyed, are responsible for over 20% of the total estimated economic impact of recreational users, while beach goers, who represent 64% of the users surveyed, are responsible for 51% of that same impact.
Figure 7: Economic Impact of Beachgoers, Fishermen and Surfers on Winchester Bay vicinity.
Average Number of Visits: Fall 2008 through
Summer 2009
Average Dollars
Spent per day
Average Dollars spent per survey:
Fall 2008 through
Summer 2009 Number
of Surveys
Average Total spent for the year (Fall 2008 through
Summer 2009) All 34.6 $58.75 $2,033 668 $1,358,356 Beachgoers 28.0 $58.08 $1,630 426 $694,403 Fishermen 56.2 $55.03 $3,095 58 $179,553 Surfers 86.4 $52.59 $4,546 60 $272,800
Table 1: Calculation of approximate dollars spent by each user group in one year (from Fall 2008 through Summer 2009)
Impact of Environmental Change on Coastal Recreation A three category Likert Scale response format was used to ask all recreational users intercepted during the sampling period about the impact of six specific environmental changes on their visitation rate. They were given the option of answering that they would visit more often, less often or the same for each change separately.
0 10 20 30 40 50 60 70
Swimming and Snorkeling
Rent Gear
Shopping
Food and Drink
Lodging
Gas
TOTAL
Dollars ($) per day of visit
Daily Expenditures in the Local Area
SURFERS
BEACHGOERS
FISHERMEN

17
Wave Quality The quality of the waves at the South Jetty may change dramatically with the construction of an OWC generator and turbine. Nuances in bathymetry and sand deposition create different qualities of surf [2,10,11]. The location of the project close to shore is likely to affect sand transport and bathymetry at the jetty therefore increasing or decreasing the wave quality of the site. When questioned about a change in wave quality, surfers indicated the largest change in visitation. If wave quality increased, 86% of surfers reported that they would visit more often and conversely 86% of surfers would visit less often if wave quality decreased. The majority of beachgoers and fishermen indicated that they would visit at the same rate if wave quality regardless of the change. Shark Abundance The emission of an electromagnetic field (EMF) from the OWC may have an impact on shark abundance in the local area. While conclusive results about whether EMF will impact marine organisms positively or negatively remain elusive [5], sharks’ extreme sensitivity to EMF has been shown [1,5]. Further study will hopefully illuminate the consequences of wave energy project EMF on shark populations. The majority of recreational users at the site were not sensitive to either an increase or a decrease in shark abundance. Surfers were expected to be more potentially affected by shark abundance than other user groups due to their close proximity to near shore aggressive species. Nearly the same number of surfers responded that they would either visit less often (49%) or the same amount (46%) if there was an increase in shark abundance. In contrast, when questioned about a decrease in shark abundance 40% indicated that they would visit more often. But the majority (57%) still reported that they would visit the same. Restricted Access Proximity of the OWC to the jetty may necessitate partial or complete closure of the rock jetty itself for safety reasons [3]. Fishermen were the most sensitive to potential changes in jetty access, with 59% of fishermen responding that they would visit less often if half the jetty was closed and over 72% indicating that they would visit less often if the entire jetty was closed. Beach goers were the second most sensitive to jetty closure indicating that entire jetty closure would also cause more users to visit less often (43%) than with only half the jetty closed (40%). Jetty closure had the least effect on surfers with 69% reporting that they would visit the same if half the jetty was closed, and 59% responding that they would visit the same if the entire jetty were closed. Economic Impact of Visitation Rate Change Because each recreational user group has particular visitation patterns, specific expenditures and varying environmental change sensitivity, beach goers, fishermen
18
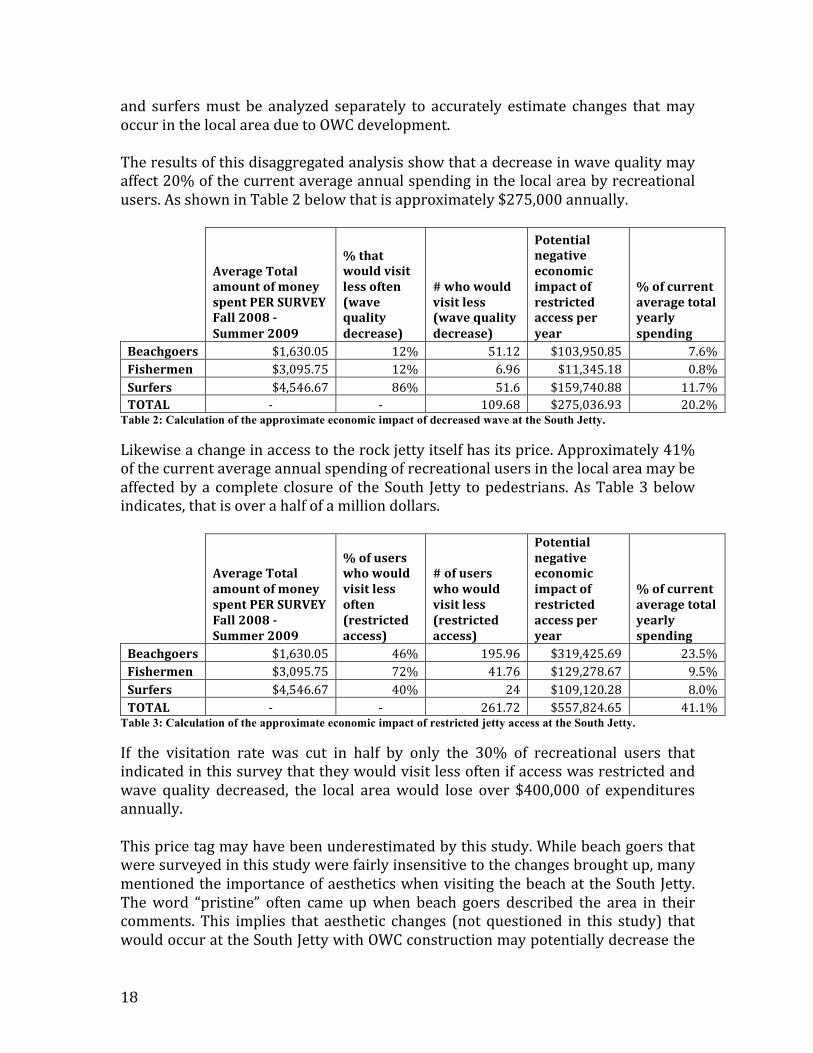
and surfers must be analyzed separately to accurately estimate changes that may occur in the local area due to OWC development. The results of this disaggregated analysis show that a decrease in wave quality may affect 20% of the current average annual spending in the local area by recreational users. As shown in Table 2 below that is approximately $275,000 annually.
Average Total amount of money spent PER SURVEY Fall 2008 -‐ Summer 2009
% that would visit less often (wave quality decrease)
# who would visit less (wave quality decrease)
Potential negative economic impact of restricted access per year
% of current average total yearly spending
Beachgoers $1,630.05 12% 51.12 $103,950.85 7.6% Fishermen $3,095.75 12% 6.96 $11,345.18 0.8% Surfers $4,546.67 86% 51.6 $159,740.88 11.7% TOTAL -‐ -‐ 109.68 $275,036.93 20.2%
Table 2: Calculation of the approximate economic impact of decreased wave at the South Jetty.
Likewise a change in access to the rock jetty itself has its price. Approximately 41% of the current average annual spending of recreational users in the local area may be affected by a complete closure of the South Jetty to pedestrians. As Table 3 below indicates, that is over a half of a million dollars.
Average Total amount of money spent PER SURVEY Fall 2008 -‐ Summer 2009
% of users who would visit less often (restricted access)
# of users who would visit less (restricted access)
Potential negative economic impact of restricted access per year
% of current average total yearly spending
Beachgoers $1,630.05 46% 195.96 $319,425.69 23.5% Fishermen $3,095.75 72% 41.76 $129,278.67 9.5% Surfers $4,546.67 40% 24 $109,120.28 8.0% TOTAL -‐ -‐ 261.72 $557,824.65 41.1%
Table 3: Calculation of the approximate economic impact of restricted jetty access at the South Jetty.
If the visitation rate was cut in half by only the 30% of recreational users that indicated in this survey that they would visit less often if access was restricted and wave quality decreased, the local area would lose over $400,000 of expenditures annually. This price tag may have been underestimated by this study. While beach goers that were surveyed in this study were fairly insensitive to the changes brought up, many mentioned the importance of aesthetics when visiting the beach at the South Jetty. The word “pristine” often came up when beach goers described the area in their comments. This implies that aesthetic changes (not questioned in this study) that would occur at the South Jetty with OWC construction may potentially decrease the

19
over $25,000 per day that beach goers spend in the local area. Further studies of the beach going population are needed to verify this implication. It should also be mentioned that the recreational use price tag of this project could also be improved if recreational stakeholders are brought into the design process. This is due to the fact that coastal development projects have the possibility of increasing wave quality at a site, not just decreasing it. The jetty itself is a development project that created excellent surfing conditions. However, because coastal development actions rarely consider the impacts of development on the surfing community, most projects negatively impact surf quality [2,11]. Corne 2009 explains that,
“If a structure is placed in the wave breaking zone and blocks or interferes with the passage of the waves to the focus of the wave, whether that is a sandbar or reef, there may be a reduction of the wave quality. If a structure acts to trap sand to form sandbars or becomes the focus point for the waves to break, it may improve wave quality.”
Therefore, if design of the OWC promotes a quality surf break at the South Jetty, a majority of regular surfers may visit the South Jetty more often. The 86% of surfers who responded that they would visit more often if wave quality increased spend $160,000 annually in the local area. Popularity of the area may also grow via word of mouth if conditions improve. Each new surfer in the area is worth approximately $4,500 a year. Conclusion The relationship between environmental conditions and recreation is multifaceted and difficult to tease apart [2,3,6,7,8,10,11]. Part of the challenge of managing coastal energy projects, and their environmental implications, has been shown in this study: responses to changes in environmental conditions caused by energy development differed among recreational users depending on the type of recreational activity pursed. This is only one of the complicated tradeoffs associated with renewable energy development and is addressed only in part by this study. Surfers, the focus of this study, are most sensitive to even small changes in the water’s environmental condition. Wave quality was their primary concern when responding to site changes, followed by a slight interest in shark abundance. While surfers are a still a somewhat elusive group to survey, techniques in this study worked relatively well combined with word of mouth efforts by local organizations. However, poor surf conditions during the study period may have lead
20
to an underestimation of use of the South Jetty for surfing. Internet-‐based survey techniques would help capture the complete Winchester Bay surfing population. This study reaffirms the Nelson et al 2007 study showing that surfers are a valid user group for coastal managers to consider in decision-‐making. This is especially shown in the possible negative economic impact to the local area of decreased recreational use visits. Working with surfers to design a project that improves wave quality as opposed to degrading it [9], has the potential to increase annual spending in the local area up to $160,000 a year from current South Jetty surfers, perhaps much more as new surfers are introduced to the area. Fishermen’s condition parameters are very different from surfers’ but are likewise as sensitive. Jetty access is key to fishermen visiting the jetty. Beach goers appear to be ambivalent to environmental changes at the site. However, aesthetic changes were not part of the questionnaire employed in this study. Many beach goers commented about the pristine aesthetic of the site and questioned whether or not that was expected to change with OWC development. Wave energy project development’s affects on site aesthetics need to be examined to fully describe this recreational user group’s response to environmental changes. References
1. Bastian, J. (1994). Electrosensory organisms. Physics Today, 47(2): 30-‐37. 2. Corne, N. (2009). The Implications of Coastal Protection and Development on Surfing.
Journal of Coastal Research, 25(2): 427-‐434. 3. FERC public hearing. Hosted by Douglas County: July 28th, 2008. 4. FERC Study Request for the Douglas County Wave & Tidal Energy Project. Submitted to
Douglas County: September 29th, 2008. 5. Gill, A.B. et al (2005). The potential effects of electromagnetic fields generated by sub-‐sea
power cables associated with offshore wind farm developments on electrically and magnetically sensitive marine organisms – a review. COWIRE commissioned study. Retrieved November 2009 from http://www.offshorewindfarms.co.uk/Assets/1351_emf_phase_one_half_report.pdf.
6. Nelsen, et al (2007). A socioeconomic study of surfers at Trestles Beach. Shore & Beach, 75(4), 32-‐37.
7. Pendleton, L. (ed). (2007). The Economic and Market Value of America’s Coasts and Estuaries: What’s at Stake?. Restore America’s Estuaries: Washington, DC.
8. Pendleton, L. (2008). Elkhorn Slough Coastal User Survey working document. 2008. 9. Rea, L. and R. Parker (1997). Designing and Conducting Survey Research: A Comprehensive
Guide. Wiley, John and Sons. 10. Scarfe, B. et al (2003). The Science of Surfing Waves and Surfing Breaks -‐ A Review. UC San
Diego: Scripps Institution of Oceanography. Retrieved from: http://escholarship.org/uc/item/6h72j1fz.
11. Scarfe, B. et al (2009). Sustainable Management of Surfing Breaks: Case Studies and Recommendations. Journal of Coastal Research, 25(3): 684-‐703.
12. Yockim, R. Douglas County Wave and Tidal Energy Power Project – Preliminary Application Document. Submitted to FERC: Nov 16th, 2006.
21
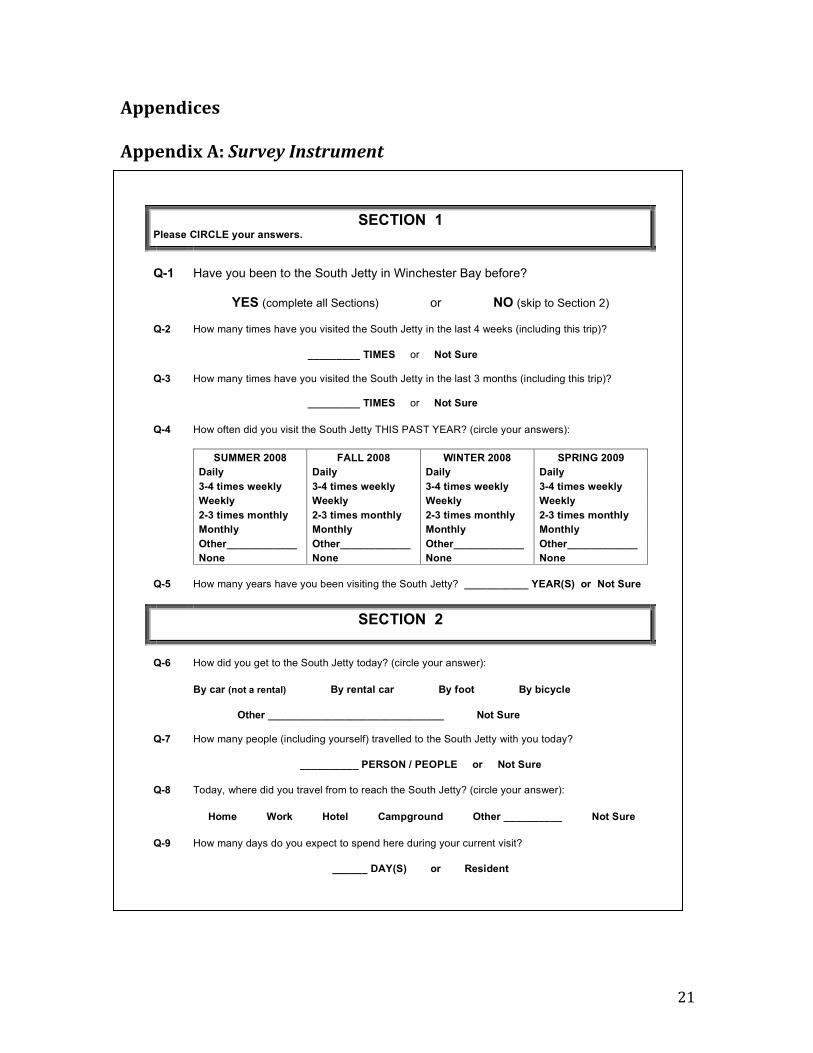
Appendices Appendix A: Survey Instrument
SECTION 1 Please CIRCLE your answers.
Q-1 Have you been to the South Jetty in Winchester Bay before?
YES (complete all Sections) or NO (skip to Section 2)
Q-2 How many times have you visited the South Jetty in the last 4 weeks (including this trip)?
_________ TIMES or Not Sure
Q-3 How many times have you visited the South Jetty in the last 3 months (including this trip)?
_________ TIMES or Not Sure
Q-4 How often did you visit the South Jetty THIS PAST YEAR? (circle your answers):
SUMMER 2008 FALL 2008 WINTER 2008 SPRING 2009
Daily Daily Daily Daily
3-4 times weekly 3-4 times weekly 3-4 times weekly 3-4 times weekly
Weekly Weekly Weekly Weekly
2-3 times monthly 2-3 times monthly 2-3 times monthly 2-3 times monthly
Monthly Monthly Monthly Monthly
Other____________ Other____________ Other____________ Other____________
None None None None
Q-5 How many years have you been visiting the South Jetty? ___________ YEAR(S) or Not Sure
SECTION 2
Q-6 How did you get to the South Jetty today? (circle your answer):
By car (not a rental) By rental car By foot By bicycle
Other ______________________________ Not Sure
Q-7 How many people (including yourself) travelled to the South Jetty with you today?
__________ PERSON / PEOPLE or Not Sure
Q-8 Today, where did you travel from to reach the South Jetty? (circle your answer):
Home Work Hotel Campground Other __________ Not Sure
Q-9 How many days do you expect to spend here during your current visit?
______ DAY(S) or Resident
22
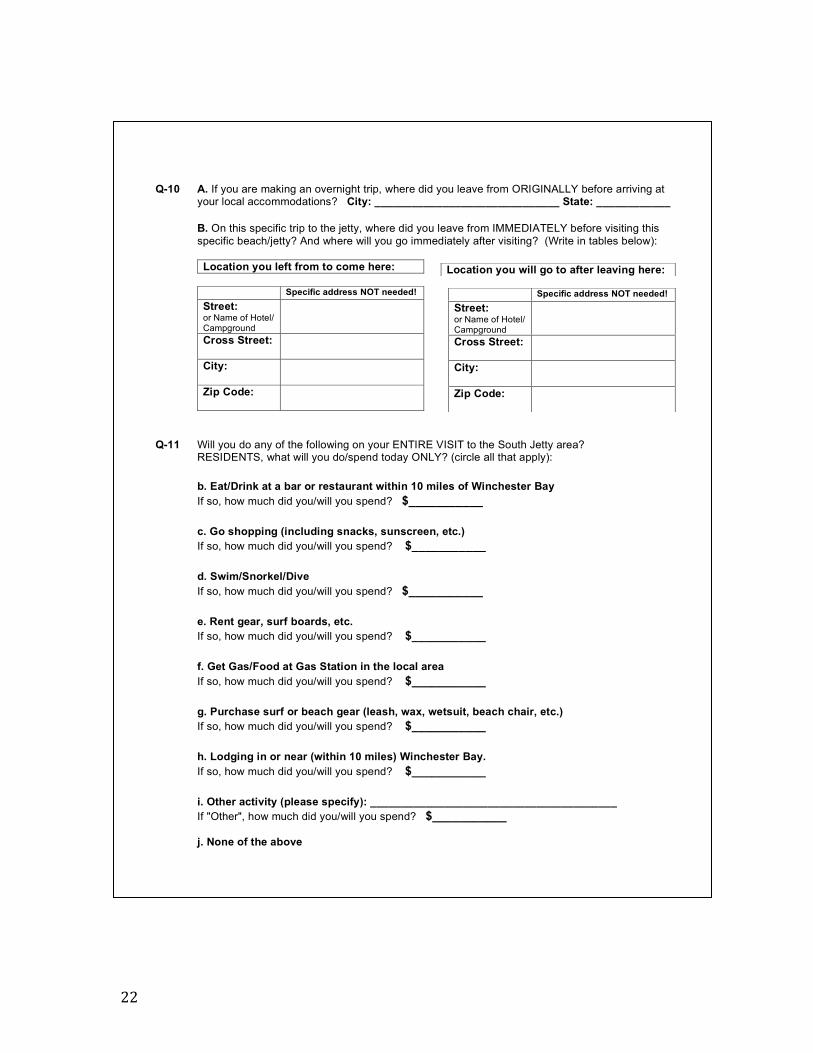
Q-10 A. If you are making an overnight trip, where did you leave from ORIGINALLY before arriving at your local accommodations? City: ______________________________ State: ____________
B. On this specific trip to the jetty, where did you leave from IMMEDIATELY before visiting this
specific beach/jetty? And where will you go immediately after visiting? (Write in tables below):
Location you left from to come here:
Specific address NOT needed!
Street: or Name of Hotel/ Campground
Cross Street:
City:
Zip Code:
Specific address NOT needed!
Street: or Name of Hotel/ Campground
Cross Street:
City:
Zip Code:
Location you will go to after leaving here:
Q-11
Will you do any of the following on your ENTIRE VISIT to the South Jetty area? RESIDENTS, what will you do/spend today ONLY? (circle all that apply):
b. Eat/Drink at a bar or restaurant within 10 miles of Winchester Bay
If so, how much did you/will you spend? $___________
c. Go shopping (including snacks, sunscreen, etc.)
If so, how much did you/will you spend? $___________
d. Swim/Snorkel/Dive
If so, how much did you/will you spend? $___________
e. Rent gear, surf boards, etc.
If so, how much did you/will you spend? $___________
f. Get Gas/Food at Gas Station in the local area
If so, how much did you/will you spend? $___________
g. Purchase surf or beach gear (leash, wax, wetsuit, beach chair, etc.)
If so, how much did you/will you spend? $___________
h. Lodging in or near (within 10 miles) Winchester Bay.
If so, how much did you/will you spend? $___________
i. Other activity (please specify): ________________________________________
If "Other", how much did you/will you spend? $___________
j. None of the above
23
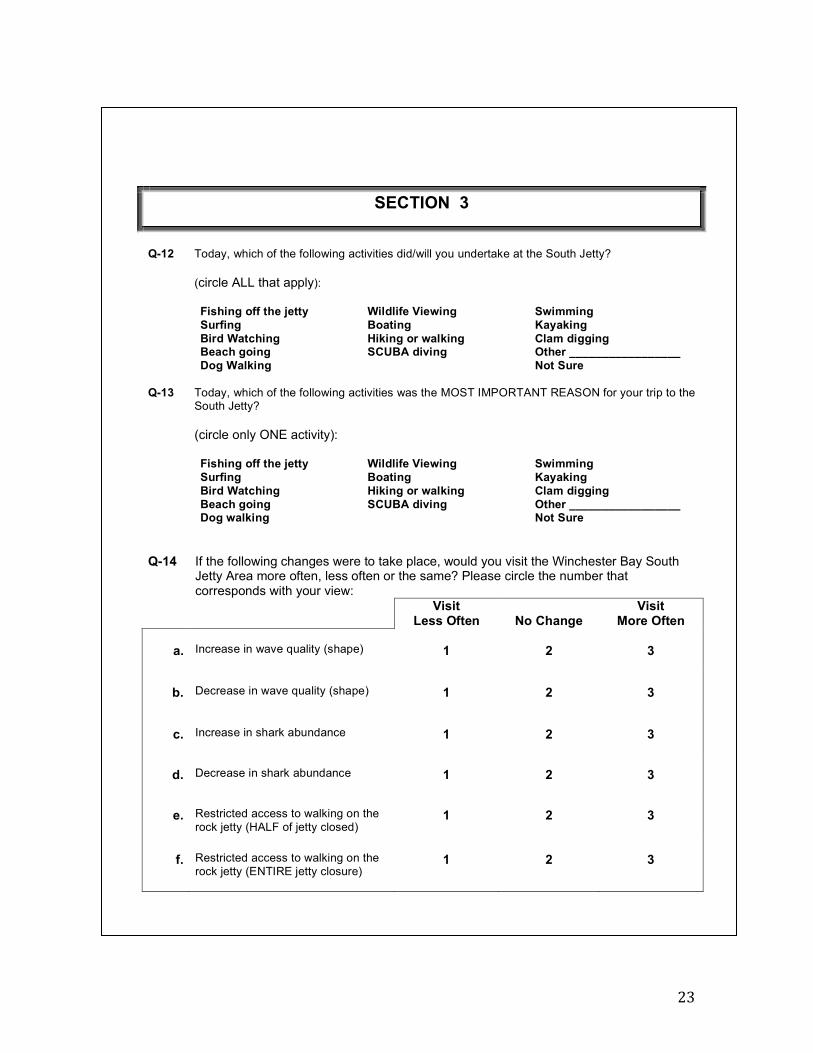
SECTION 3
Q-12 Today, which of the following activities did/will you undertake at the South Jetty?
(circle ALL that apply):
Fishing off the jetty Wildlife Viewing Swimming
Surfing Boating Kayaking
Bird Watching Hiking or walking Clam digging Beach going SCUBA diving Other _________________
Dog Walking Not Sure
Q-13 Today, which of the following activities was the MOST IMPORTANT REASON for your trip to the South Jetty?
(circle only ONE activity):
Fishing off the jetty Wildlife Viewing Swimming
Surfing Boating Kayaking
Bird Watching Hiking or walking Clam digging
Beach going SCUBA diving Other _________________ Dog walking Not Sure
Q-14 If the following changes were to take place, would you visit the Winchester Bay South Jetty Area more often, less often or the same? Please circle the number that corresponds with your view:
Visit Less Often
No Change
Visit More Often
a.
Increase in wave quality (shape)
1
2
3
b.
Decrease in wave quality (shape)
1
2
3
c.
Increase in shark abundance
1
2
3
d.
Decrease in shark abundance
1
2
3
e.
Restricted access to walking on the
rock jetty (HALF of jetty closed)
1
2
3
f.
Restricted access to walking on the
rock jetty (ENTIRE jetty closure)
1
2
3
24
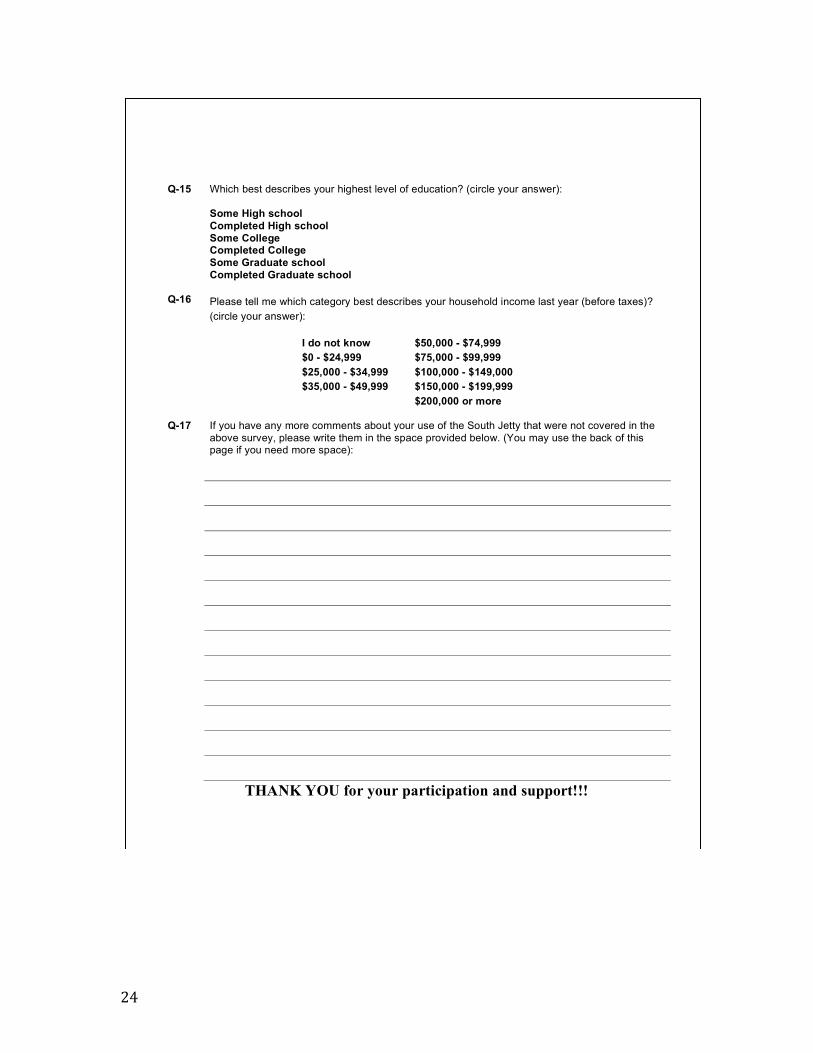
Q-15 Which best describes your highest level of education? (circle your answer):
Some High school Completed High school Some College Completed College Some Graduate school Completed Graduate school
Q-16 Please tell me which category best describes your household income last year (before taxes)?
(circle your answer):
I do not know $50,000 - $74,999
$0 - $24,999 $75,000 - $99,999
$25,000 - $34,999 $100,000 - $149,000
$35,000 - $49,999 $150,000 - $199,999
$200,000 or more
Q-17 If you have any more comments about your use of the South Jetty that were not covered in the
above survey, please write them in the space provided below. (You may use the back of this page if you need more space):
THANK YOU for your participation and support!!!