Embed Size (px)
Citation preview
Discipline: Advanced Mathematics for
Economics
*
UNIVERSITY OF ST. THOMAS OF
MOZAMBIQUE
BUSINESS SCHOOL
7/30/2015Carlos da Maia, PhD 2
*
*Within the last 50 years maths has emerged as
the “language of economics”
*There is a close relationship between
economics and maths
*It is an invaluable tool at all levels of study
• Statistical expression of real world trends
• It aids in the development of economic systems
7/30/2015Carlos da Maia, PhD 3
*
* Maths provides the foundations for empirical propositions about economic variables
E.g. “a 10 percent increase in the price of gasoline causes a 5 percent drop in thedemand for gasoline”
i. What is the mathematical expression of this relationship?
ii. How can we summarize the above observation?
iii. What is the price elasticity of demand for gasoline?
E.g. 2 “a 100 percent increase in monthly disposable income causes 30 percent increasein food consumption expenditures”
i. What is the mathematical expression of this relationship?
ii. What does the Engel curve states?
iii. How can we summarize the above observation?
iv. What is the income elasticity of demand for food?
E.g. 3 “a 100 percent increase in the price of butter causes 90 percent increase in thedemand for margarine”
i. What is the mathematical expression of this relationship?
ii. What kind of goods are these?
iii. How can we summarize the above observation?
iv. What is the cross price elasticity between butter and margarine?
7/30/2015Carlos da Maia, PhD 4
*
*We learn about the above empirical
relationships by using techniques of statistics
*Statistics branch of mathematics
*Statistics permits transforming raw data from
the real world into numerical generalizations
(such as the ones above)
oExample of real world raw data: SACMEQ III Data
for Mozambique
7/30/2015Carlos da Maia, PhD 5
*
*The role of mathemathics in economics extends farbeyond statistics
Mathematical representations of markets andcommunities to understand better how they work
*The finished model provides a structured basis forfurther study
*Mathematical models reduce the complexity of thereal world to manageable proportions
It is never possible to comprehend all the social,cultural, and economic dimensions of a real worldsituation at any one time
7/30/2015Carlos da Maia, PhD 6
*
*Mathematical models force the economist to
state the underlying assumptions clearly before
embarking on a complex train of thought
*The assumptions become clear to the reader
right from the start of the model
*These theoretical models may be translated
into statistical formulae, so that their validity
can be tested with data from the real world
7/30/2015Carlos da Maia, PhD 7
*
* Maths is also used to actively generate and explore new theoreticalideas
Logical deduction to derive theorems which apply to a wide variety ofeconomic situations, instead of just to a specific local or nationalcommunity
• E.g. “competitive market allocations of resources are Pareto Optimal”
• What is the meaning of this?
• This theorem asserts that in a competitive market system, whenmarkets clear so that supply balances demand, any feasible change inconsumption or production that improves the lot of some people willmake some others worse off
• This is a universal principle logically derived from an idealizedmathematical description of various markets (it does not originate indirect observation of day-to-day world nor is expressed statistically)
It is impossible to empirically test the theorem’s ultimate truth orfalsity b’cause there is no direct observation
7/30/2015Carlos da Maia, PhD 8
*
1. Volume, price, and value
2. Real and nominal values
3. Percentages
4. Percentages and percentage points
5. Levels and rates of change
6. Stocks, flows, and ratios
7. Averages
i. Simple
ii. Weighted
iii. Moving
8. Median
7/30/2015Carlos da Maia, PhD 9
*
1. Volume, price, and value
*Value (PQ) = price (P) x volume or quantity (Q)
*Volume (Q) = PQ / P
*E.g. John buys a bottle of water every day. Each bottle costs 15MT. (a) How many bottles does he buy after one year? How much does he spend on water (value) after one year? (note: use the common year)
7/30/2015Carlos da Maia, PhD 10
*
2. Real and Nominal values
*Indicators are often expressed at constant
prices or real terms to eliminate the effect of
price changes
7/30/2015Carlos da Maia, PhD 11
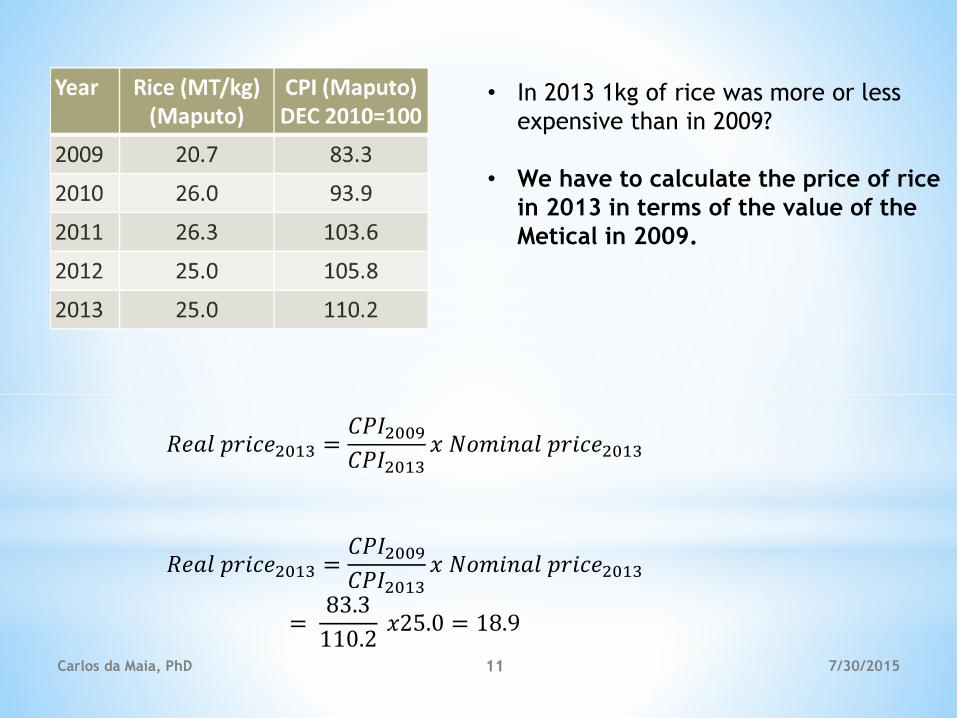
• In 2013 1kg of rice was more or less
expensive than in 2009?
• We have to calculate the price of rice
in 2013 in terms of the value of the
Metical in 2009.
𝑅𝑒𝑎𝑙 𝑝𝑟𝑖𝑐𝑒2013 =𝐶𝑃𝐼2009𝐶𝑃𝐼2013
𝑥 𝑁𝑜𝑚𝑖𝑛𝑎𝑙 𝑝𝑟𝑖𝑐𝑒2013
𝑅𝑒𝑎𝑙 𝑝𝑟𝑖𝑐𝑒2013 =𝐶𝑃𝐼2009𝐶𝑃𝐼2013
𝑥 𝑁𝑜𝑚𝑖𝑛𝑎𝑙 𝑝𝑟𝑖𝑐𝑒2013
=83.3
110.2𝑥25.0 = 18.9

7/30/2015Carlos da Maia, PhD 12
1. From 2010 to 2013, the minimumwage in the three sectors
has improved. True or false? Motivate.
2. What sector had the best performance in terms of evolution
of purchasing power?
3. What sector had the worst performance?