Embed Size (px)
Citation preview
1 | P a g e
MATHEMATICS
Grade 6: Unit 4
Variability, Distributions, and Relationships Between Quantities
2 | P a g e
Course Philosophy/Description
In mathematics, students will learn to address a range of tasks focusing on the application of concepts, skills and understandings. Students will be
asked to solve problems involving the key knowledge and skills for their grade level as identified by the NJSLS; express mathematical reasoning and
construct a mathematical argument and apply concepts to solve model real world problems. The conceptual-based model will be used as the basis for
all mathematics instruction.
Sixth Grade Mathematics consists of the following domains: Ratios and Proportional Relationships (RP), The Number System (NS), Expressions
and Equations (EE), Geometry (G), and Statistics and Probability (SP). In sixth grade, instructional time should focus on four critical areas: (1)
connecting ratio and rate to whole number multiplication and division and using concepts of ratio and rate to solve problems; (2) completing
understanding of division of fractions and extending the notion of number to the system of rational numbers, which includes negative numbers; (3)
writing, interpreting, and using expressions and equations; and (4) developing understanding of statistical thinking.
1) Students use reasoning about multiplication and division to solve ratio and rate problems about quantities. By viewing equivalent ratios and
rates as deriving from, and extending, pairs of rows (or columns) in the multiplication table, and by analyzing simple drawings that indicate
the relative size of quantities, students connect their understanding of multiplication and division with ratios and rates. Thus students expand
the scope of problems for which they can use multiplication and division to solve problems, and they connect ratios and fractions. Students
solve a wide variety of problems involving ratios and rates.
2) Students use the meaning of fractions, the meanings of multiplication and division, and the relationship between multiplication and division to
understand and explain why the procedures for dividing fractions make sense. Students use these operations to solve problems. Students
extend their previous understandings of number and the ordering of numbers to the full system of rational numbers, which includes negative
rational numbers, and in particular negative integers. They reason about the order and absolute value of rational numbers and about the
location of points in all four quadrants of the coordinate plane.
3) Students understand the use of variables in mathematical expressions. They write expressions and equations that correspond to given
situations, evaluate expressions, and use expressions and formulas to solve problems. Students understand that expressions in different forms
can be equivalent, and they use the properties of operations to rewrite expressions in equivalent forms. Students know that the solutions of an
equation are the values of the variables that make the equation true. Students use properties of operations and the idea of maintaining the
equality of both sides of an equation to solve simple one-step equations. Students construct and analyze tables, such as tables of quantities that
are in equivalent ratios, and they use equations (such as 3x = y) to describe relationships between quantities.
4) Building on and reinforcing their understanding of number, students begin to develop their ability to think statistically. Students recognize
that a data distribution may not have a definite center and that different ways to measure center yield different values. The median measures
center in the sense that it is roughly the middle value. The mean measures center in the sense that it is the value that each data point would
take on if the total of the data values were redistributed equally, and also in the sense that it is a balance point. Students recognize that a
3 | P a g e
measure of variability (interquartile range or mean absolute deviation) can also be useful for summarizing data because two very different sets
of data can have the same mean and median yet be distinguished by their variability.
Students learn to describe and summarize numerical data sets, identifying clusters, peaks, gaps, and symmetry, considering the context in which the
data were collected. Students in Grade 6 also build on their work with area in elementary school by reasoning about relationships among shapes to
determine area, surface area, and volume. They find areas of right triangles, other triangles, and special quadrilaterals by decomposing these shapes,
rearranging or removing pieces, and relating the shapes to rectangles. Using these methods, students discuss, develop, and justify formulas for areas
of triangles and parallelograms. Students find areas of polygons and surface areas of prisms and pyramids by decomposing them into pieces whose
area they can determine. They reason about right rectangular prisms with fractional side lengths to extend formulas for the volume of a right
rectangular prism to fractional side lengths. They prepare for work on scale drawings and constructions in Grade 7 by drawing polygons in the
coordinate plane.
4 | P a g e
ESL Framework
This ESL framework was designed to be used by bilingual, dual language, ESL and general education teachers. Bilingual and dual language
programs use the home language and a second language for instruction. ESL teachers and general education or bilingual teachers may use this
document to collaborate on unit and lesson planning to decide who will address certain components of the SLO and language objective. ESL teachers
may use the appropriate leveled language objective to build lessons for ELLs which reflects what is covered in the general education program. In this
way, whether it is a pull-out or push-in model, all teachers are working on the same Student Learning Objective connected to the New Jersey Student
Learning Standards. The design of language objectives are based on the alignment of the World-Class Instructional Design Assessment (WIDA)
Consortium’s English Language Development (ELD) standards with the New Jersey Student Learning Standards (NJSLS). WIDA’s ELD standards
advance academic language development across content areas ultimately leading to academic achievement for English learners. As English learners
are progressing through the six developmental linguistic stages, this framework will assist all teachers who work with English learners to
appropriately identify the language needed to meet the requirements of the content standard. At the same time, the language objectives recognize the
cognitive demand required to complete educational tasks. Even though listening and reading (receptive) skills differ from speaking and writing
(expressive) skills across proficiency levels the cognitive function should not be diminished. For example, an Entering Level One student only has
the linguistic ability to respond in single words in English with significant support from their home language. However, they could complete a Venn
diagram with single words which demonstrates that they understand how the elements compare and contrast with each other or they could respond
with the support of their home language (L1) with assistance from a teacher, para-professional, peer or a technology program.
http://www.state.nj.us/education/modelcurriculum/ela/ELLOverview.pdf
5 | P a g e
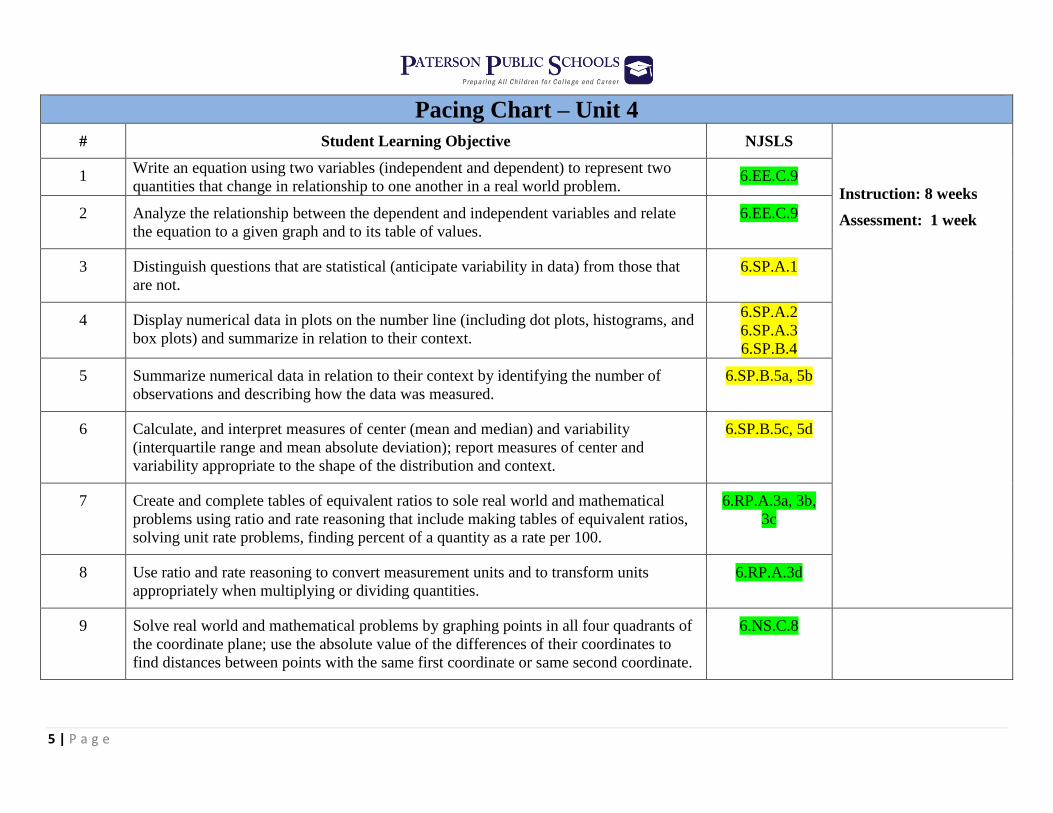
Pacing Chart – Unit 4
# Student Learning Objective NJSLS
Instruction: 8 weeks
Assessment: 1 week
1 Write an equation using two variables (independent and dependent) to represent two
quantities that change in relationship to one another in a real world problem. 6.EE.C.9
2 Analyze the relationship between the dependent and independent variables and relate
the equation to a given graph and to its table of values.
6.EE.C.9
3 Distinguish questions that are statistical (anticipate variability in data) from those that
are not.
6.SP.A.1
4 Display numerical data in plots on the number line (including dot plots, histograms, and
box plots) and summarize in relation to their context.
6.SP.A.2
6.SP.A.3
6.SP.B.4
5 Summarize numerical data in relation to their context by identifying the number of
observations and describing how the data was measured.
6.SP.B.5a, 5b
6 Calculate, and interpret measures of center (mean and median) and variability
(interquartile range and mean absolute deviation); report measures of center and
variability appropriate to the shape of the distribution and context.
6.SP.B.5c, 5d
7 Create and complete tables of equivalent ratios to sole real world and mathematical
problems using ratio and rate reasoning that include making tables of equivalent ratios,
solving unit rate problems, finding percent of a quantity as a rate per 100.
6.RP.A.3a, 3b,
3c
8 Use ratio and rate reasoning to convert measurement units and to transform units
appropriately when multiplying or dividing quantities.
6.RP.A.3d
9 Solve real world and mathematical problems by graphing points in all four quadrants of
the coordinate plane; use the absolute value of the differences of their coordinates to
find distances between points with the same first coordinate or same second coordinate.
6.NS.C.8
6 | P a g e
Research about Teaching and Learning Mathematics Structure teaching of mathematical concepts and skills around problems to be solved (Checkly, 1997; Wood & Sellars, 1996; Wood & Sellars, 1997)
Encourage students to work cooperatively with others (Johnson & Johnson, 1975; Davidson, 1990)
Use group problem-solving to stimulate students to apply their mathematical thinking skills (Artzt & Armour-Thomas, 1992)
Students interact in ways that support and challenge one another’s strategic thinking (Artzt, Armour-Thomas, & Curcio, 2008)
Activities structured in ways allowing students to explore, explain, extend, and evaluate their progress (National Research Council, 1999)
There are three critical components to effective mathematics instruction (Shellard & Moyer, 2002):
Teaching for conceptual understanding
Developing children’s procedural literacy
Promoting strategic competence through meaningful problem-solving investigations
Teachers should be:
Demonstrating acceptance and recognition of students’ divergent ideas.
Challenging students to think deeply about the problems they are solving, extending thinking beyond the solutions and algorithms
required to solve the problem
Influencing learning by asking challenging and interesting questions to accelerate students’ innate inquisitiveness and foster them to
examine concepts further.
Projecting a positive attitude about mathematics and about students’ ability to “do” mathematics
Students should be:
Actively engaging in “doing” mathematics
Solving challenging problems
Investigating meaningful real-world problems
Making interdisciplinary connections
Developing an understanding of mathematical knowledge required to “do” mathematics and connect the language of mathematical
ideas with numerical representations
Sharing mathematical ideas, discussing mathematics with one another, refining and critiquing each other’s ideas and understandings
Communicating in pairs, small group, or whole group presentations
Using multiple representations to communicate mathematical ideas
Using connections between pictures, oral language, written symbols, manipulative models, and real-world situations
Using technological resources and other 21st century skills to support and enhance mathematical understanding
7 | P a g e
Mathematics is not a stagnate field of textbook problems; rather, it is a dynamic way of constructing meaning about the world around
us, generating knowledge and understanding about the real world every day. Students should be metaphorically rolling up their
sleeves and “doing mathematics” themselves, not watching others do mathematics for them or in front of them. (Protheroe, 2007)
Conceptual-Based Model
The purpose of the Conceptual-Based Model is to allow students the time to explore mathematical concepts to promote academic rigor and high level
of student discourse to concurrently develop conceptual understanding, procedural fluency, and problem-solving skills. During the 90 minute block
of mathematics instruction, teachers will select and set up a mathematical task that targets the mathematical goal(s) for the lesson. The teacher sets
the stage for learning by ensuring the objective/rationale of the lesson is well-defined and connected to the task. The task should build on student’s
prior knowledge, life experiences, and culture allowing students to share their prior knowledge and life/cultural experiences as it relates to the task to
ensure that students understand the context of the problem. The instructional goal is to introduce the activity/task to the students allowing them to
have access to learning while maintaining the cognitive demands of the task. Teachers will then support the students’ exploration of the task; this can
be done independently, in pairs or in small groups or a combination of all. It is highly recommended that students be given the opportunity to
privately work on a task to generate solutions on their own. Students are encouraged to share their findings with their peers in small group to
compare their solutions. As students are actively engaged in constructing meaning of the mathematical concept(s) being taught and communicating
their understanding of the concept(s) with their peers, the teacher monitors the development of student understanding by observing student thinking
and using questions to stimulate thinking to drive students toward the aimed mathematical goal(s). The teacher assesses students’ understanding of
key mathematical ideas, problem-solving strategies, and the use of and connection between models and representations to determine what the student
knows. The teacher advances the students’ understanding to move the student beyond their present thinking and expand what they know to an
additional situation. Teachers have been trained to strategically select groups of students who have different solution paths to the same task, different
representations and errors/misconceptions to share, discuss, and analyze as a whole group. By providing these instructional opportunities, the teacher
will then be able to orchestrate the class discussion by providing students with the opportunities to make their learning public as students share,
discuss, analyze, clarify, extend, connect, strengthen, and record their thinking strategies. After students discuss, justify, and challenge the various
solution paths that were shared, a summary of the learning is articulated and connected to the objective of the lesson. Students should be given an
opportunity to close the lesson with a reflection on their learning.
8 | P a g e
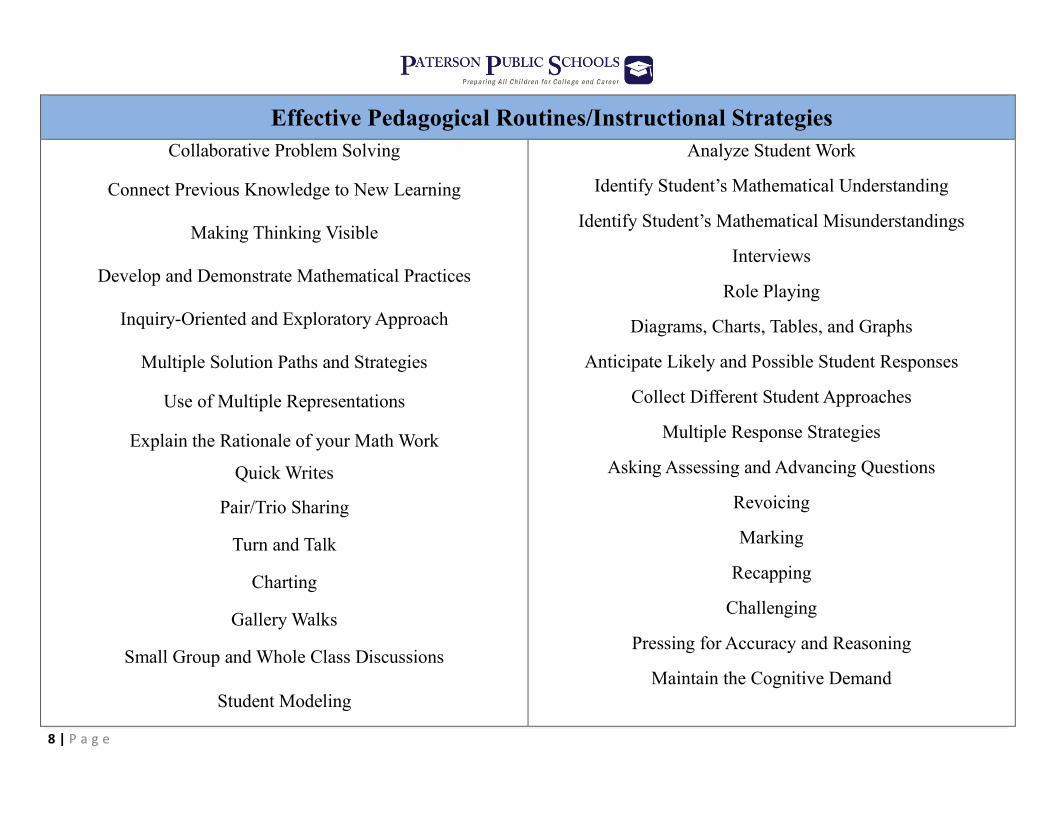
Effective Pedagogical Routines/Instructional Strategies
Collaborative Problem Solving
Connect Previous Knowledge to New Learning
Making Thinking Visible
Develop and Demonstrate Mathematical Practices
Inquiry-Oriented and Exploratory Approach
Multiple Solution Paths and Strategies
Use of Multiple Representations
Explain the Rationale of your Math Work
Quick Writes
Pair/Trio Sharing
Turn and Talk
Charting
Gallery Walks
Small Group and Whole Class Discussions
Student Modeling
Analyze Student Work
Identify Student’s Mathematical Understanding
Identify Student’s Mathematical Misunderstandings
Interviews
Role Playing
Diagrams, Charts, Tables, and Graphs
Anticipate Likely and Possible Student Responses
Collect Different Student Approaches
Multiple Response Strategies
Asking Assessing and Advancing Questions
Revoicing
Marking
Recapping
Challenging
Pressing for Accuracy and Reasoning
Maintain the Cognitive Demand
9 | P a g e
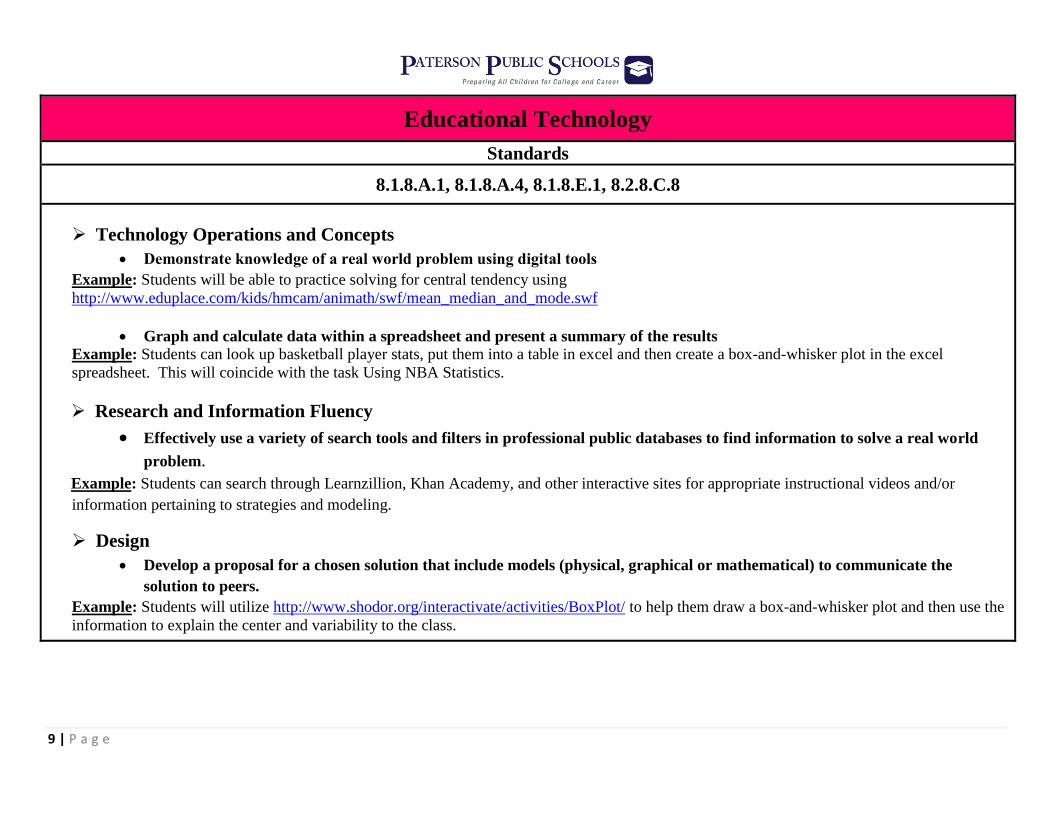
Educational Technology
Standards
8.1.8.A.1, 8.1.8.A.4, 8.1.8.E.1, 8.2.8.C.8
Technology Operations and Concepts
Demonstrate knowledge of a real world problem using digital tools
Example: Students will be able to practice solving for central tendency using
http://www.eduplace.com/kids/hmcam/animath/swf/mean_median_and_mode.swf
Graph and calculate data within a spreadsheet and present a summary of the results
Example: Students can look up basketball player stats, put them into a table in excel and then create a box-and-whisker plot in the excel
spreadsheet. This will coincide with the task Using NBA Statistics.
Research and Information Fluency
Effectively use a variety of search tools and filters in professional public databases to find information to solve a real world
problem.
Example: Students can search through Learnzillion, Khan Academy, and other interactive sites for appropriate instructional videos and/or
information pertaining to strategies and modeling.
Design
Develop a proposal for a chosen solution that include models (physical, graphical or mathematical) to communicate the
solution to peers.
Example: Students will utilize http://www.shodor.org/interactivate/activities/BoxPlot/ to help them draw a box-and-whisker plot and then use the
information to explain the center and variability to the class.
10 | P a g e
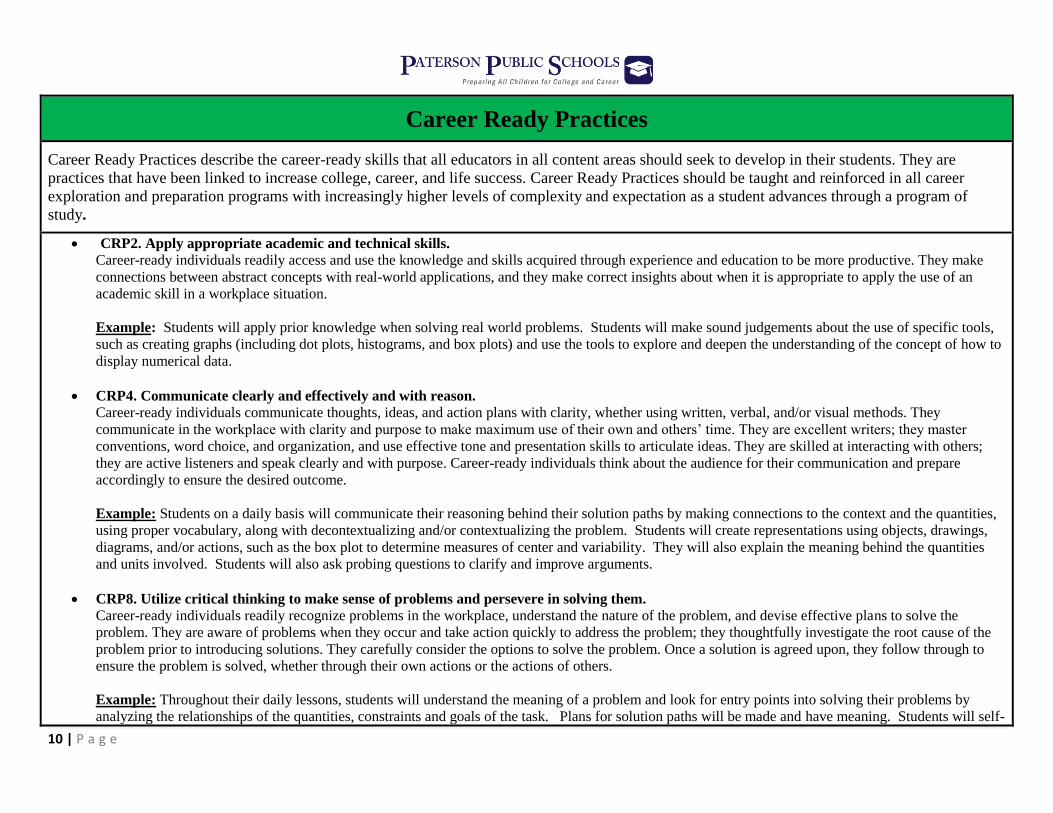
Career Ready Practices
Career Ready Practices describe the career-ready skills that all educators in all content areas should seek to develop in their students. They are
practices that have been linked to increase college, career, and life success. Career Ready Practices should be taught and reinforced in all career
exploration and preparation programs with increasingly higher levels of complexity and expectation as a student advances through a program of
study.
CRP2. Apply appropriate academic and technical skills.
Career-ready individuals readily access and use the knowledge and skills acquired through experience and education to be more productive. They make
connections between abstract concepts with real-world applications, and they make correct insights about when it is appropriate to apply the use of an
academic skill in a workplace situation.
Example: Students will apply prior knowledge when solving real world problems. Students will make sound judgements about the use of specific tools,
such as creating graphs (including dot plots, histograms, and box plots) and use the tools to explore and deepen the understanding of the concept of how to
display numerical data.
CRP4. Communicate clearly and effectively and with reason.
Career-ready individuals communicate thoughts, ideas, and action plans with clarity, whether using written, verbal, and/or visual methods. They
communicate in the workplace with clarity and purpose to make maximum use of their own and others’ time. They are excellent writers; they master
conventions, word choice, and organization, and use effective tone and presentation skills to articulate ideas. They are skilled at interacting with others;
they are active listeners and speak clearly and with purpose. Career-ready individuals think about the audience for their communication and prepare
accordingly to ensure the desired outcome.
Example: Students on a daily basis will communicate their reasoning behind their solution paths by making connections to the context and the quantities,
using proper vocabulary, along with decontextualizing and/or contextualizing the problem. Students will create representations using objects, drawings,
diagrams, and/or actions, such as the box plot to determine measures of center and variability. They will also explain the meaning behind the quantities
and units involved. Students will also ask probing questions to clarify and improve arguments.
CRP8. Utilize critical thinking to make sense of problems and persevere in solving them.
Career-ready individuals readily recognize problems in the workplace, understand the nature of the problem, and devise effective plans to solve the
problem. They are aware of problems when they occur and take action quickly to address the problem; they thoughtfully investigate the root cause of the
problem prior to introducing solutions. They carefully consider the options to solve the problem. Once a solution is agreed upon, they follow through to
ensure the problem is solved, whether through their own actions or the actions of others.
Example: Throughout their daily lessons, students will understand the meaning of a problem and look for entry points into solving their problems by
analyzing the relationships of the quantities, constraints and goals of the task. Plans for solution paths will be made and have meaning. Students will self-
11 | P a g e
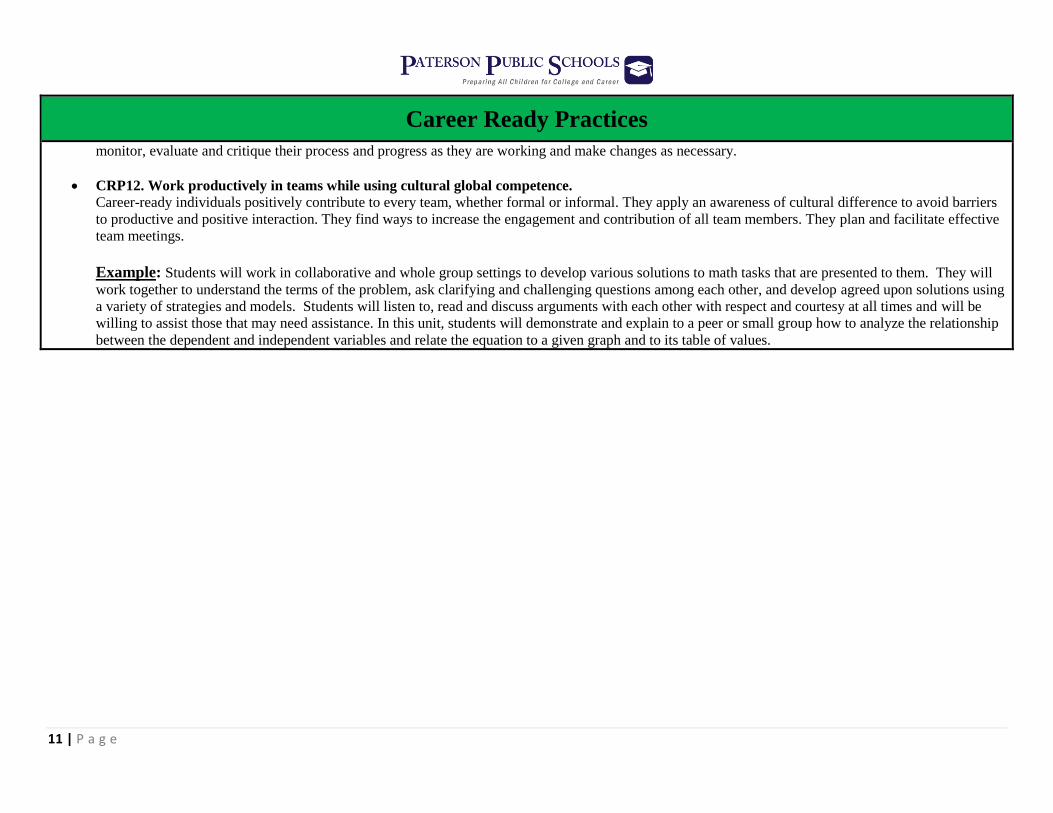
Career Ready Practices
monitor, evaluate and critique their process and progress as they are working and make changes as necessary.
CRP12. Work productively in teams while using cultural global competence.
Career-ready individuals positively contribute to every team, whether formal or informal. They apply an awareness of cultural difference to avoid barriers
to productive and positive interaction. They find ways to increase the engagement and contribution of all team members. They plan and facilitate effective
team meetings.
Example: Students will work in collaborative and whole group settings to develop various solutions to math tasks that are presented to them. They will
work together to understand the terms of the problem, ask clarifying and challenging questions among each other, and develop agreed upon solutions using
a variety of strategies and models. Students will listen to, read and discuss arguments with each other with respect and courtesy at all times and will be
willing to assist those that may need assistance. In this unit, students will demonstrate and explain to a peer or small group how to analyze the relationship
between the dependent and independent variables and relate the equation to a given graph and to its table of values.
12 | P a g e
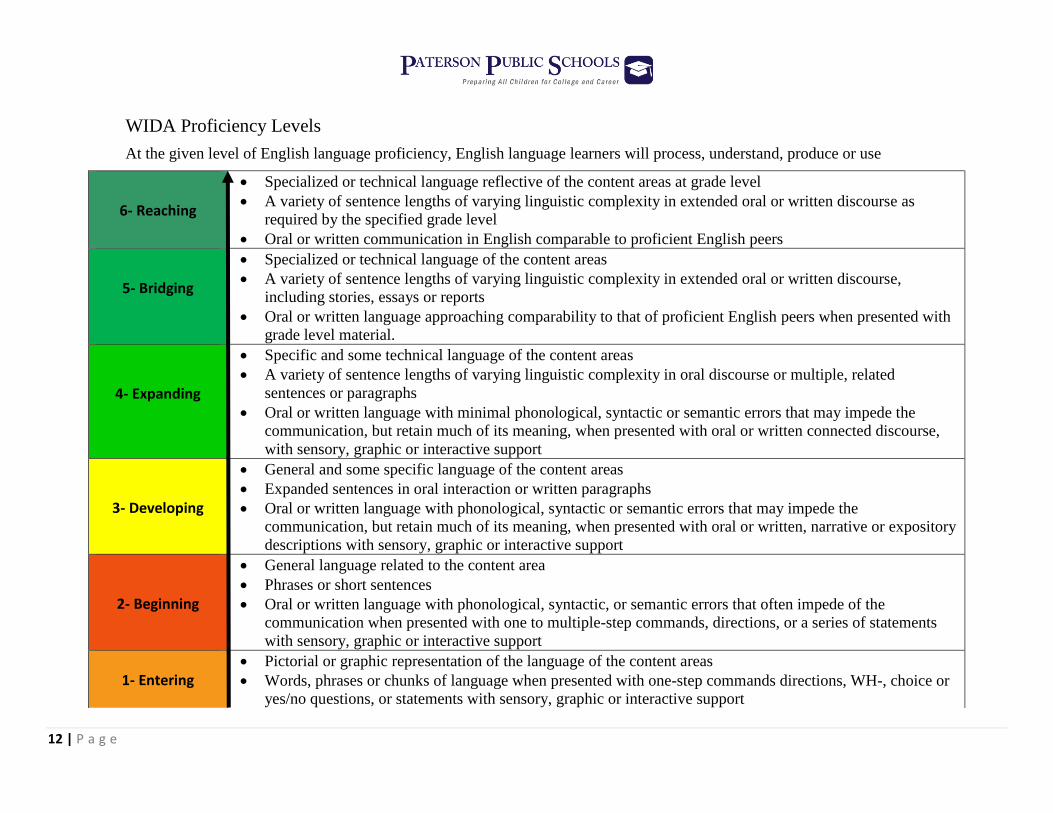
WIDA Proficiency Levels
At the given level of English language proficiency, English language learners will process, understand, produce or use
6- Reaching
Specialized or technical language reflective of the content areas at grade level
A variety of sentence lengths of varying linguistic complexity in extended oral or written discourse as
required by the specified grade level
Oral or written communication in English comparable to proficient English peers
5- Bridging
Specialized or technical language of the content areas
A variety of sentence lengths of varying linguistic complexity in extended oral or written discourse,
including stories, essays or reports
Oral or written language approaching comparability to that of proficient English peers when presented with
grade level material.
4- Expanding
Specific and some technical language of the content areas
A variety of sentence lengths of varying linguistic complexity in oral discourse or multiple, related
sentences or paragraphs
Oral or written language with minimal phonological, syntactic or semantic errors that may impede the
communication, but retain much of its meaning, when presented with oral or written connected discourse,
with sensory, graphic or interactive support
3- Developing
General and some specific language of the content areas
Expanded sentences in oral interaction or written paragraphs
Oral or written language with phonological, syntactic or semantic errors that may impede the
communication, but retain much of its meaning, when presented with oral or written, narrative or expository
descriptions with sensory, graphic or interactive support
2- Beginning
General language related to the content area
Phrases or short sentences
Oral or written language with phonological, syntactic, or semantic errors that often impede of the
communication when presented with one to multiple-step commands, directions, or a series of statements
with sensory, graphic or interactive support
1- Entering
Pictorial or graphic representation of the language of the content areas
Words, phrases or chunks of language when presented with one-step commands directions, WH-, choice or
yes/no questions, or statements with sensory, graphic or interactive support

13 | P a g e
Differentiated Instruction
Accommodate Based on Students Individual Needs: Strategies
Time/General
Extra time for assigned tasks
Adjust length of assignment
Timeline with due dates for
reports and projects
Communication system
between home and school
Provide lecture notes/outline
Processing
Extra Response time
Have students verbalize steps
Repeat, clarify or reword
directions
Mini-breaks between tasks
Provide a warning for
transitions
Partnering
Comprehension
Precise processes for
conceptual model
Short manageable tasks
Brief and concrete directions
Provide immediate feedback
Small group instruction
Emphasize multi-sensory
learning
Recall
Teacher-made checklist
Use visual graphic organizers
Reference resources to
promote independence
Visual and verbal reminders
Graphic organizers
Assistive Technology
Computer/whiteboard
Tape recorder
Video Tape
Tests/Quizzes/Grading
Extended time
Study guides
Shortened tests
Read directions aloud
Behavior/Attention
Consistent daily structured
routine
Simple and clear classroom
rules
Frequent feedback
Organization
Individual daily planner
Display a written agenda
Note-taking assistance
Color code materials
14 | P a g e
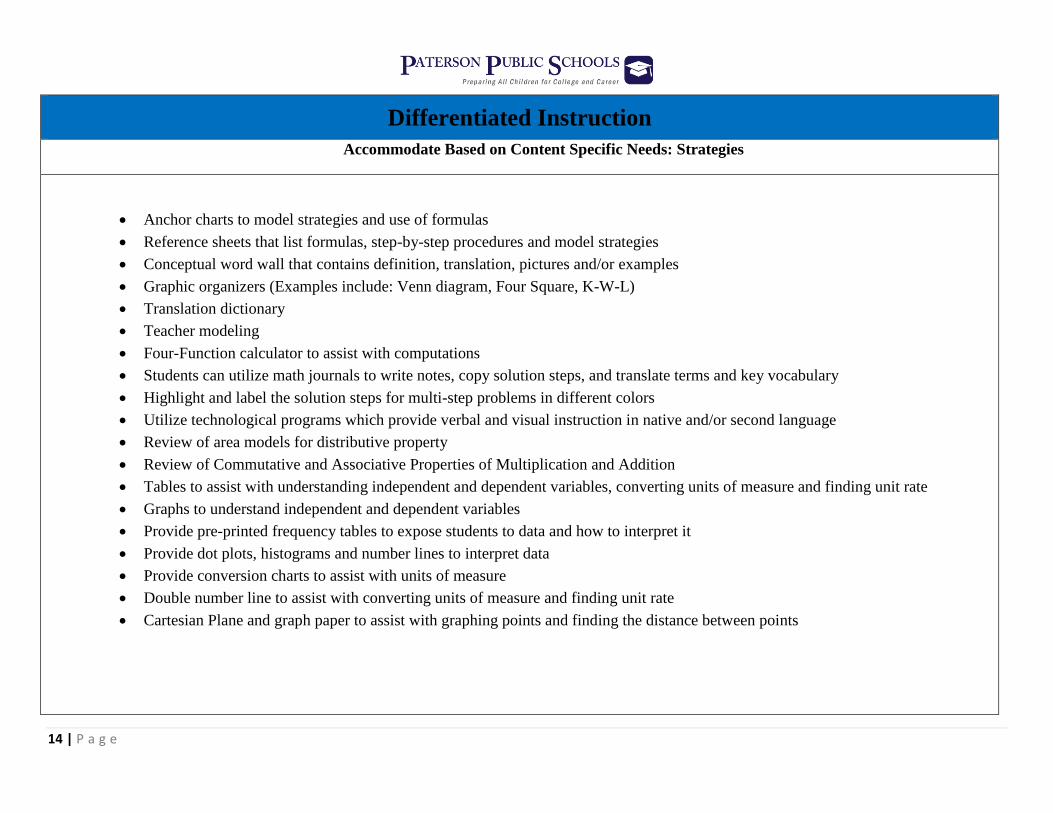
Differentiated Instruction
Accommodate Based on Content Specific Needs: Strategies
Anchor charts to model strategies and use of formulas
Reference sheets that list formulas, step-by-step procedures and model strategies
Conceptual word wall that contains definition, translation, pictures and/or examples
Graphic organizers (Examples include: Venn diagram, Four Square, K-W-L)
Translation dictionary
Teacher modeling
Four-Function calculator to assist with computations
Students can utilize math journals to write notes, copy solution steps, and translate terms and key vocabulary
Highlight and label the solution steps for multi-step problems in different colors
Utilize technological programs which provide verbal and visual instruction in native and/or second language
Review of area models for distributive property
Review of Commutative and Associative Properties of Multiplication and Addition
Tables to assist with understanding independent and dependent variables, converting units of measure and finding unit rate
Graphs to understand independent and dependent variables
Provide pre-printed frequency tables to expose students to data and how to interpret it
Provide dot plots, histograms and number lines to interpret data
Provide conversion charts to assist with units of measure
Double number line to assist with converting units of measure and finding unit rate
Cartesian Plane and graph paper to assist with graphing points and finding the distance between points
15 | P a g e
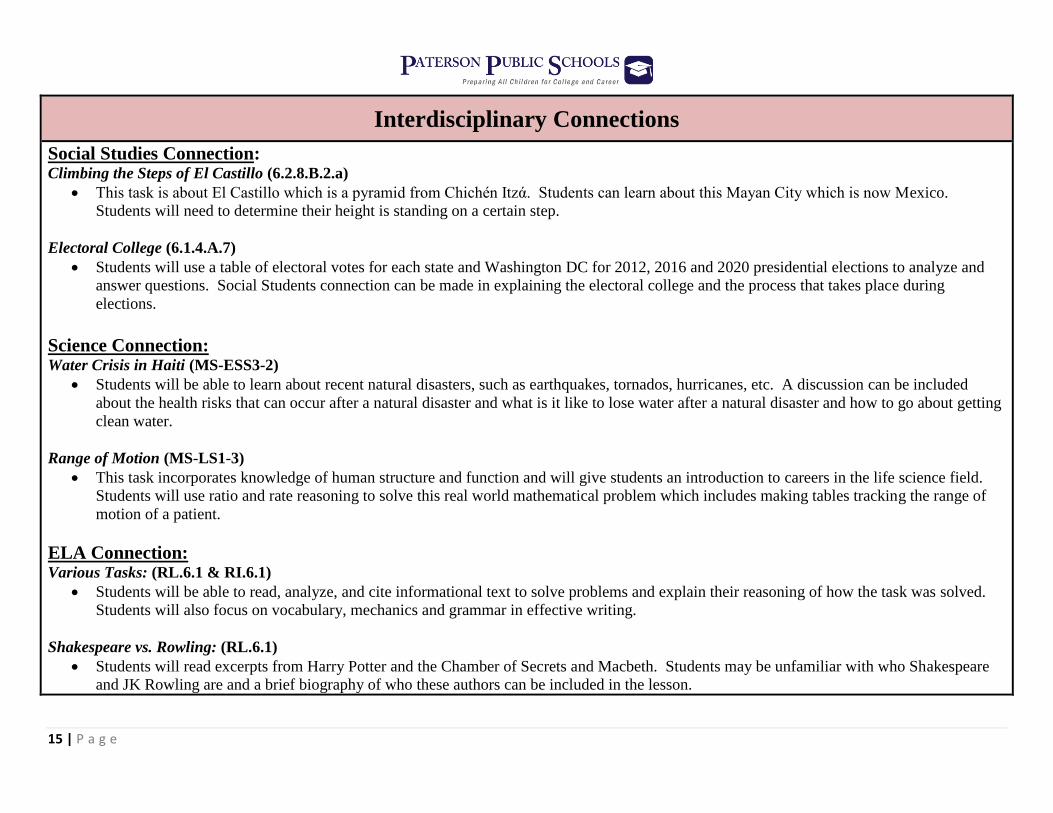
Interdisciplinary Connections
Social Studies Connection: Climbing the Steps of El Castillo (6.2.8.B.2.a)
This task is about El Castillo which is a pyramid from Chichén Itzά. Students can learn about this Mayan City which is now Mexico.
Students will need to determine their height is standing on a certain step.
Electoral College (6.1.4.A.7)
Students will use a table of electoral votes for each state and Washington DC for 2012, 2016 and 2020 presidential elections to analyze and
answer questions. Social Students connection can be made in explaining the electoral college and the process that takes place during
elections.
Science Connection: Water Crisis in Haiti (MS-ESS3-2)
Students will be able to learn about recent natural disasters, such as earthquakes, tornados, hurricanes, etc. A discussion can be included
about the health risks that can occur after a natural disaster and what is it like to lose water after a natural disaster and how to go about getting
clean water.
Range of Motion (MS-LS1-3)
This task incorporates knowledge of human structure and function and will give students an introduction to careers in the life science field.
Students will use ratio and rate reasoning to solve this real world mathematical problem which includes making tables tracking the range of
motion of a patient.
ELA Connection: Various Tasks: (RL.6.1 & RI.6.1)
Students will be able to read, analyze, and cite informational text to solve problems and explain their reasoning of how the task was solved.
Students will also focus on vocabulary, mechanics and grammar in effective writing.
Shakespeare vs. Rowling: (RL.6.1)
Students will read excerpts from Harry Potter and the Chamber of Secrets and Macbeth. Students may be unfamiliar with who Shakespeare
and JK Rowling are and a brief biography of who these authors can be included in the lesson.
16 | P a g e
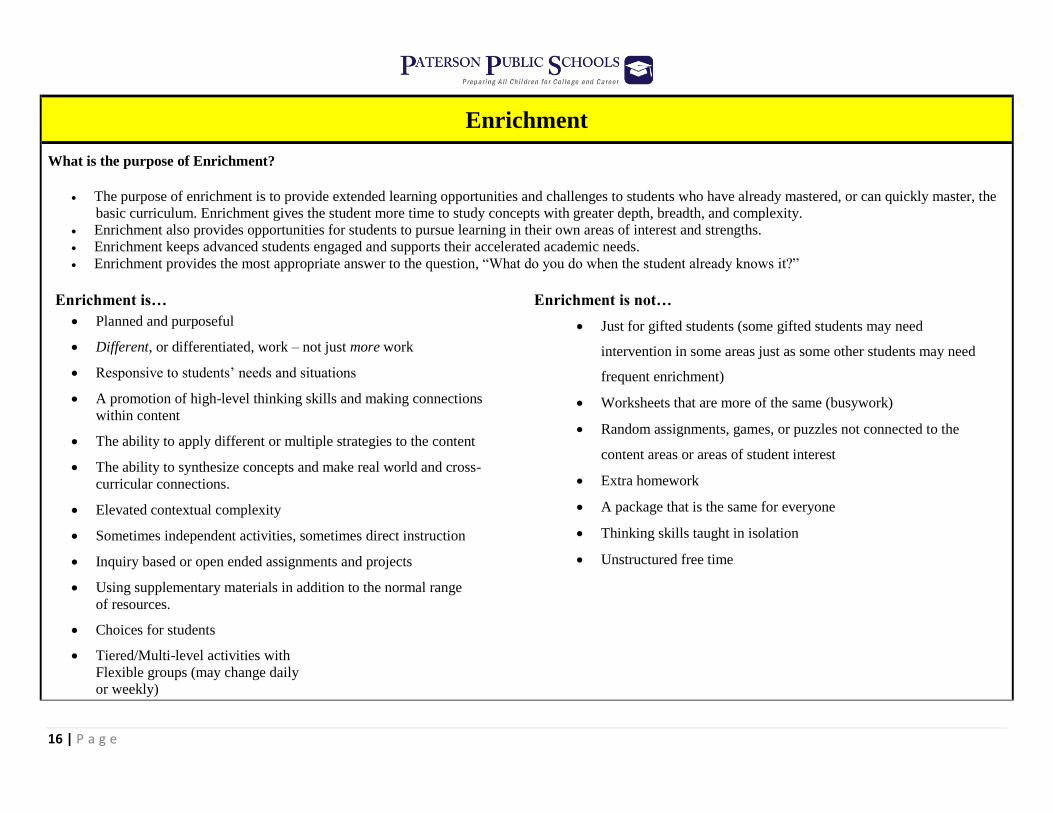
Enrichment
What is the purpose of Enrichment?
The purpose of enrichment is to provide extended learning opportunities and challenges to students who have already mastered, or can quickly master, the
basic curriculum. Enrichment gives the student more time to study concepts with greater depth, breadth, and complexity.
Enrichment also provides opportunities for students to pursue learning in their own areas of interest and strengths.
Enrichment keeps advanced students engaged and supports their accelerated academic needs.
Enrichment provides the most appropriate answer to the question, “What do you do when the student already knows it?”
Enrichment is…
Planned and purposeful
Different, or differentiated, work – not just more work
Responsive to students’ needs and situations
A promotion of high-level thinking skills and making connections
within content
The ability to apply different or multiple strategies to the content
The ability to synthesize concepts and make real world and cross-
curricular connections.
Elevated contextual complexity
Sometimes independent activities, sometimes direct instruction
Inquiry based or open ended assignments and projects
Using supplementary materials in addition to the normal range
of resources.
Choices for students
Tiered/Multi-level activities with
Flexible groups (may change daily
or weekly)
Enrichment is not…
Just for gifted students (some gifted students may need
intervention in some areas just as some other students may need
frequent enrichment)
Worksheets that are more of the same (busywork)
Random assignments, games, or puzzles not connected to the
content areas or areas of student interest
Extra homework
A package that is the same for everyone
Thinking skills taught in isolation
Unstructured free time
17 | P a g e
Assessments
Required District/State Assessments Unit # 4 Assessment
PARCC
Suggested Formative/Summative Classroom Assessments Describe Learning Vertically
Identify Key Building Blocks
Make Connections (between and among key building blocks)
Short/Extended Constructed Response Items
Multiple-Choice Items (where multiple answer choices may be correct)
Drag and Drop Items
Use of Equation Editor
Quizzes
Journal Entries/Reflections/Quick-Writes
Accountable talk
Projects
Portfolio
Observation
Graphic Organizers/ Concept Mapping
Presentations
Role Playing
Teacher-Student and Student-Student Conferencing
Homework
18 | P a g e
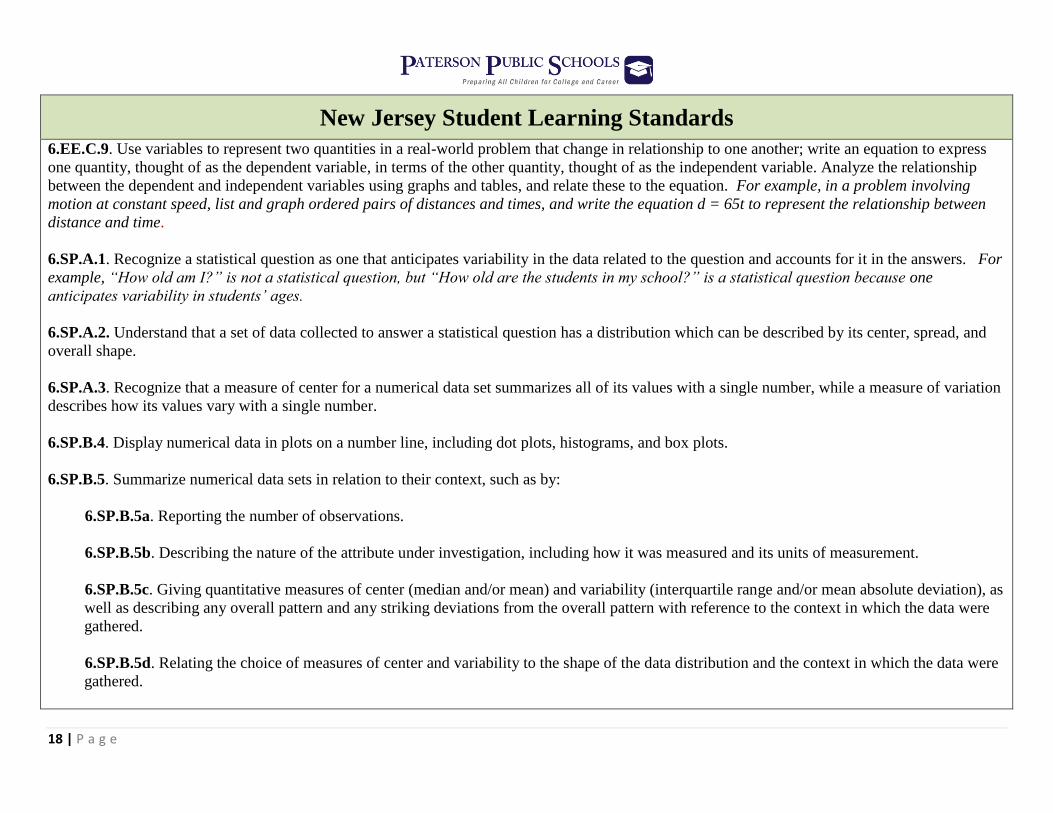
New Jersey Student Learning Standards
6.EE.C.9. Use variables to represent two quantities in a real-world problem that change in relationship to one another; write an equation to express
one quantity, thought of as the dependent variable, in terms of the other quantity, thought of as the independent variable. Analyze the relationship
between the dependent and independent variables using graphs and tables, and relate these to the equation. For example, in a problem involving
motion at constant speed, list and graph ordered pairs of distances and times, and write the equation d = 65t to represent the relationship between
distance and time.
6.SP.A.1. Recognize a statistical question as one that anticipates variability in the data related to the question and accounts for it in the answers. For
example, “How old am I?” is not a statistical question, but “How old are the students in my school?” is a statistical question because one
anticipates variability in students’ ages.
6.SP.A.2. Understand that a set of data collected to answer a statistical question has a distribution which can be described by its center, spread, and
overall shape.
6.SP.A.3. Recognize that a measure of center for a numerical data set summarizes all of its values with a single number, while a measure of variation
describes how its values vary with a single number.
6.SP.B.4. Display numerical data in plots on a number line, including dot plots, histograms, and box plots.
6.SP.B.5. Summarize numerical data sets in relation to their context, such as by:
6.SP.B.5a. Reporting the number of observations.
6.SP.B.5b. Describing the nature of the attribute under investigation, including how it was measured and its units of measurement.
6.SP.B.5c. Giving quantitative measures of center (median and/or mean) and variability (interquartile range and/or mean absolute deviation), as
well as describing any overall pattern and any striking deviations from the overall pattern with reference to the context in which the data were
gathered.
6.SP.B.5d. Relating the choice of measures of center and variability to the shape of the data distribution and the context in which the data were
gathered.
19 | P a g e
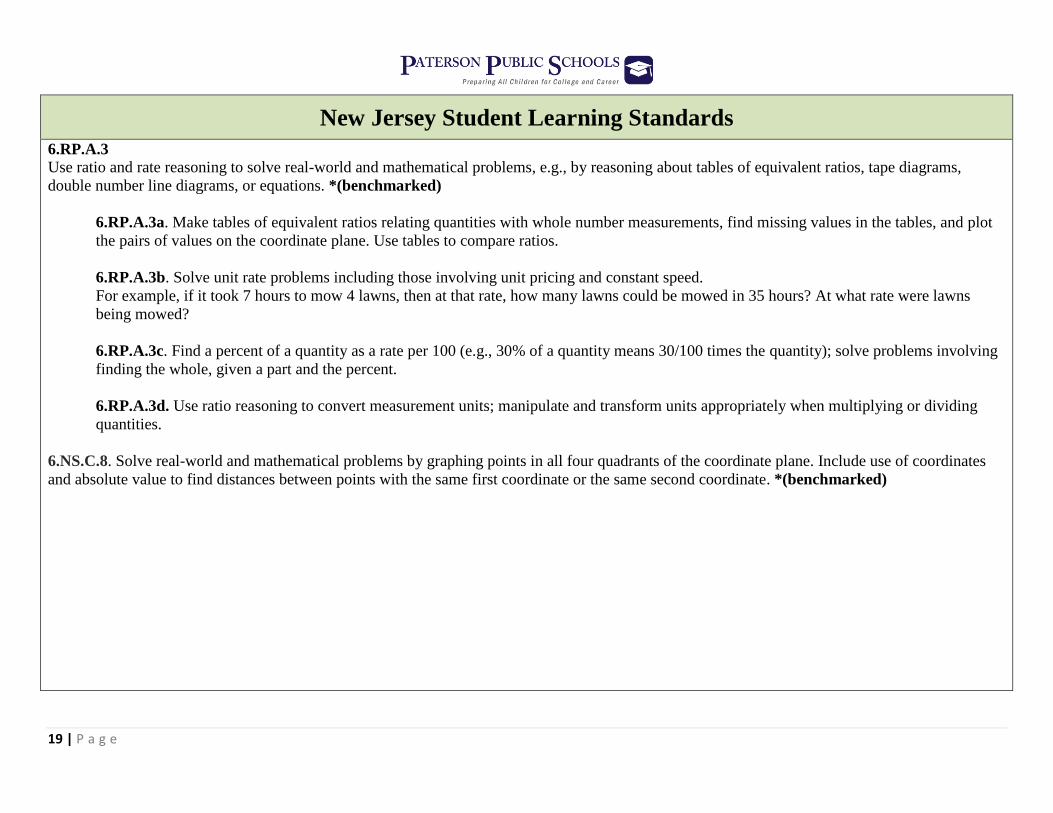
New Jersey Student Learning Standards
6.RP.A.3
Use ratio and rate reasoning to solve real-world and mathematical problems, e.g., by reasoning about tables of equivalent ratios, tape diagrams,
double number line diagrams, or equations. *(benchmarked)
6.RP.A.3a. Make tables of equivalent ratios relating quantities with whole number measurements, find missing values in the tables, and plot
the pairs of values on the coordinate plane. Use tables to compare ratios.
6.RP.A.3b. Solve unit rate problems including those involving unit pricing and constant speed.
For example, if it took 7 hours to mow 4 lawns, then at that rate, how many lawns could be mowed in 35 hours? At what rate were lawns
being mowed?
6.RP.A.3c. Find a percent of a quantity as a rate per 100 (e.g., 30% of a quantity means 30/100 times the quantity); solve problems involving
finding the whole, given a part and the percent.
6.RP.A.3d. Use ratio reasoning to convert measurement units; manipulate and transform units appropriately when multiplying or dividing
quantities.
6.NS.C.8. Solve real-world and mathematical problems by graphing points in all four quadrants of the coordinate plane. Include use of coordinates
and absolute value to find distances between points with the same first coordinate or the same second coordinate. *(benchmarked)
20 | P a g e
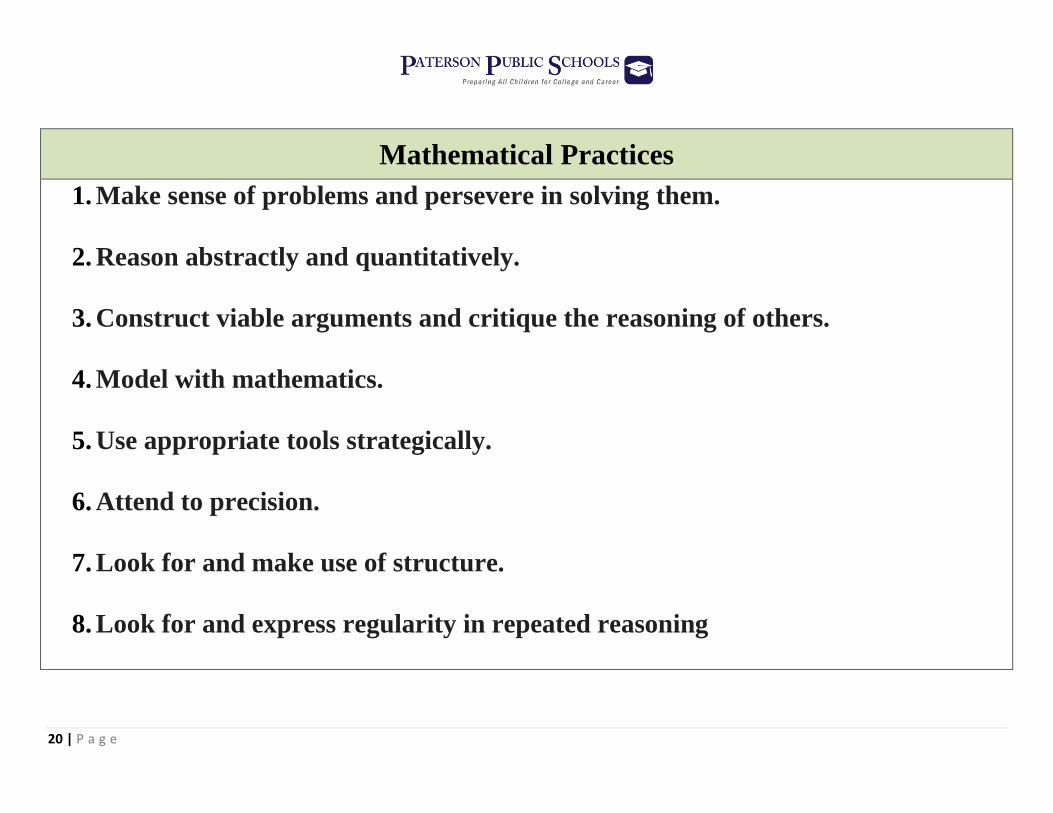
Mathematical Practices
1. Make sense of problems and persevere in solving them.
2. Reason abstractly and quantitatively.
3. Construct viable arguments and critique the reasoning of others.
4. Model with mathematics.
5. Use appropriate tools strategically.
6. Attend to precision.
7. Look for and make use of structure.
8. Look for and express regularity in repeated reasoning
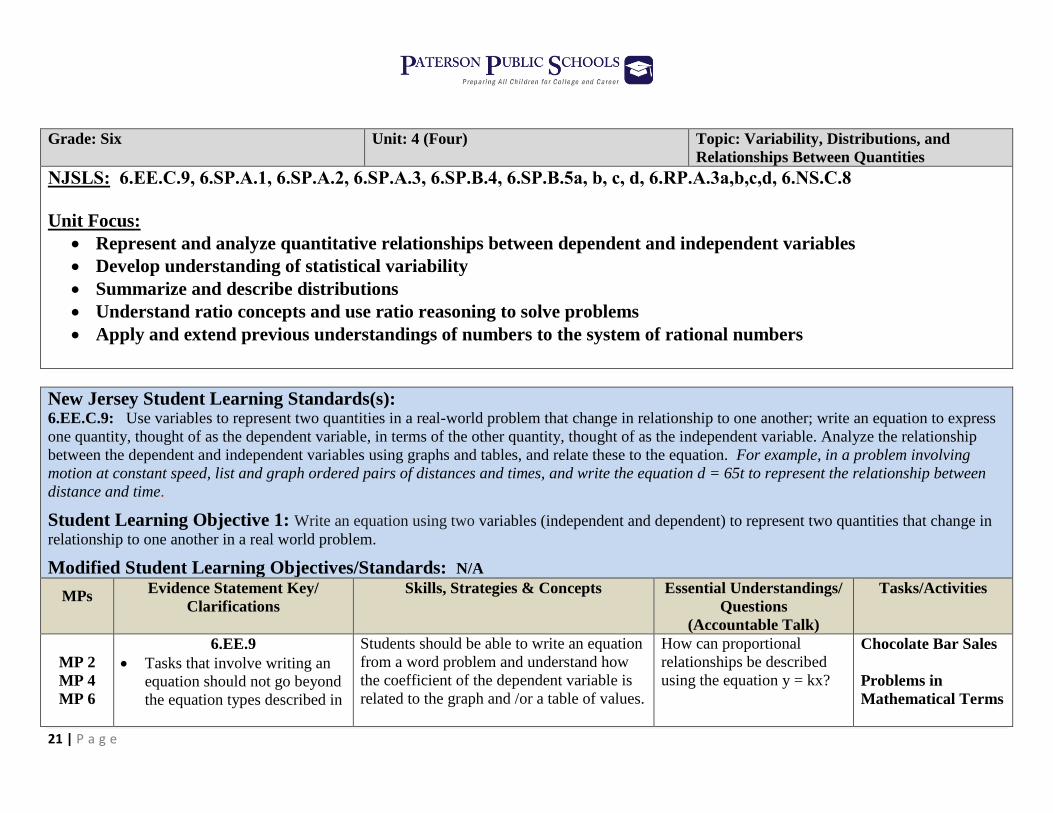
21 | P a g e
Grade: Six
Unit: 4 (Four) Topic: Variability, Distributions, and
Relationships Between Quantities
NJSLS: 6.EE.C.9, 6.SP.A.1, 6.SP.A.2, 6.SP.A.3, 6.SP.B.4, 6.SP.B.5a, b, c, d, 6.RP.A.3a,b,c,d, 6.NS.C.8
Unit Focus:
Represent and analyze quantitative relationships between dependent and independent variables
Develop understanding of statistical variability
Summarize and describe distributions
Understand ratio concepts and use ratio reasoning to solve problems
Apply and extend previous understandings of numbers to the system of rational numbers
New Jersey Student Learning Standards(s): 6.EE.C.9: Use variables to represent two quantities in a real-world problem that change in relationship to one another; write an equation to express
one quantity, thought of as the dependent variable, in terms of the other quantity, thought of as the independent variable. Analyze the relationship
between the dependent and independent variables using graphs and tables, and relate these to the equation. For example, in a problem involving
motion at constant speed, list and graph ordered pairs of distances and times, and write the equation d = 65t to represent the relationship between
distance and time.
Student Learning Objective 1: Write an equation using two variables (independent and dependent) to represent two quantities that change in
relationship to one another in a real world problem.
Modified Student Learning Objectives/Standards: N/A
MPs Evidence Statement Key/
Clarifications
Skills, Strategies & Concepts Essential Understandings/
Questions
(Accountable Talk)
Tasks/Activities
MP 2
MP 4
MP 6
6.EE.9
Tasks that involve writing an
equation should not go beyond
the equation types described in
Students should be able to write an equation
from a word problem and understand how
the coefficient of the dependent variable is
related to the graph and /or a table of values.
How can proportional
relationships be described
using the equation y = kx?
Chocolate Bar Sales
Problems in
Mathematical Terms
22 | P a g e
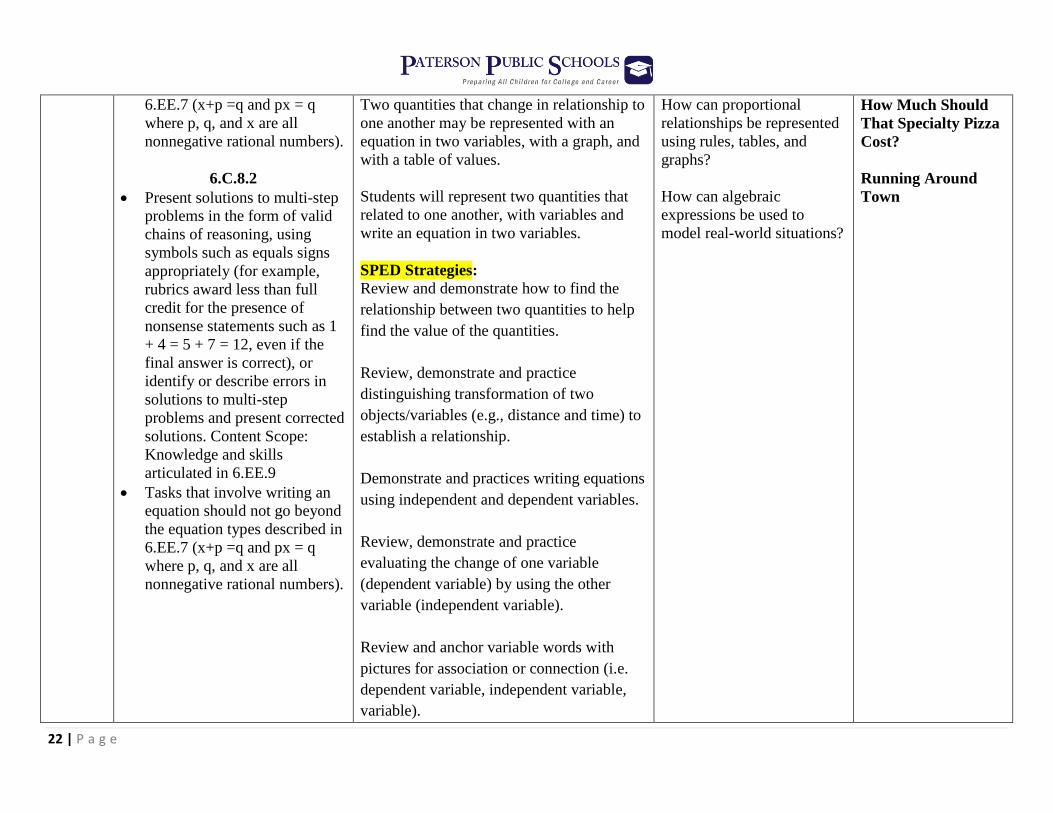
6.EE.7 (x+p =q and px = q
where p, q, and x are all
nonnegative rational numbers).
6.C.8.2
Present solutions to multi-step
problems in the form of valid
chains of reasoning, using
symbols such as equals signs
appropriately (for example,
rubrics award less than full
credit for the presence of
nonsense statements such as 1
+ 4 = 5 + 7 = 12, even if the
final answer is correct), or
identify or describe errors in
solutions to multi-step
problems and present corrected
solutions. Content Scope:
Knowledge and skills
articulated in 6.EE.9
Tasks that involve writing an
equation should not go beyond
the equation types described in
6.EE.7 (x+p =q and px = q
where p, q, and x are all
nonnegative rational numbers).
Two quantities that change in relationship to
one another may be represented with an
equation in two variables, with a graph, and
with a table of values.
Students will represent two quantities that
related to one another, with variables and
write an equation in two variables.
SPED Strategies:
Review and demonstrate how to find the
relationship between two quantities to help
find the value of the quantities.
Review, demonstrate and practice
distinguishing transformation of two
objects/variables (e.g., distance and time) to
establish a relationship.
Demonstrate and practices writing equations
using independent and dependent variables.
Review, demonstrate and practice
evaluating the change of one variable
(dependent variable) by using the other
variable (independent variable).
Review and anchor variable words with
pictures for association or connection (i.e.
dependent variable, independent variable,
variable).
How can proportional
relationships be represented
using rules, tables, and
graphs?
How can algebraic
expressions be used to
model real-world situations?
How Much Should
That Specialty Pizza
Cost?
Running Around
Town

23 | P a g e
Provide opportunities for students to
understand the relationship between two
variables, which begins with the distinction
between dependent and independent
variables. The independent variable is the
variable that can be changed; the dependent
variable is the variable that is affected by the
change in the independent variable.
Students recognize that the independent
variable is graphed on the x-axis; the
dependent variable is graphed on the y-axis.
Give students practice with using many
forms to represent relationships between
quantities. Multiple representations include
describing the relationship using language, a
table, an equation, or a graph. Translating
between multiple representations helps
students understand that each form
represents the same relationship and
provides a different perspective
Resources ( UDL - Visual and Auditory
Learner(s): [6.EE.9-1.0] Multiple Variables - Common
Core Standard
https://youtu.be/Kpb_FrHYokE
6.ee.9 dependent/independent variables
https://youtu.be/vKT1PS6r1-E

24 | P a g e
ELL Strategies:
Use an adapted text with a lower readability
level, a teacher-modified text (with
highlighted words, explanations, and context
clues), or a simplified teacher- generated
text illustrating various expressions and
equations.
Provide word walls with translations side by
side.
Utilize a KWL-chart graphic organizer, have
the parts listed in both their L1 and L2
language to clarify understanding.
Provide a Math word bank that is translated
and copied for students.
Provide Math reference sheets.
Picture cards with formulas and real world
examples of each should be provided.
Provide audio lessons which explain how to
solve equations in both languages.
Website:
LearnZillion
Recognize how an equation relates
independent and dependent variables
https://learnzillion.com/lesson_plans/681
25 | P a g e
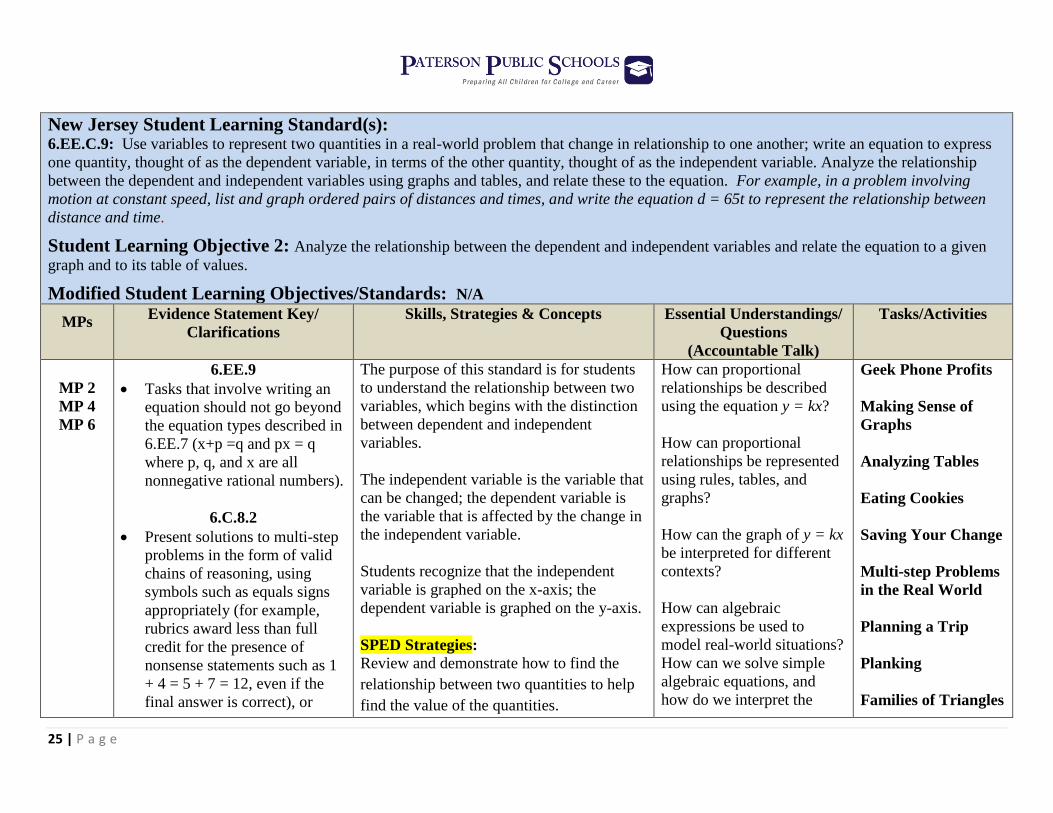
New Jersey Student Learning Standard(s): 6.EE.C.9: Use variables to represent two quantities in a real-world problem that change in relationship to one another; write an equation to express
one quantity, thought of as the dependent variable, in terms of the other quantity, thought of as the independent variable. Analyze the relationship
between the dependent and independent variables using graphs and tables, and relate these to the equation. For example, in a problem involving
motion at constant speed, list and graph ordered pairs of distances and times, and write the equation d = 65t to represent the relationship between
distance and time.
Student Learning Objective 2: Analyze the relationship between the dependent and independent variables and relate the equation to a given
graph and to its table of values.
Modified Student Learning Objectives/Standards: N/A
MPs Evidence Statement Key/
Clarifications
Skills, Strategies & Concepts Essential Understandings/
Questions
(Accountable Talk)
Tasks/Activities
MP 2
MP 4
MP 6
6.EE.9
Tasks that involve writing an
equation should not go beyond
the equation types described in
6.EE.7 (x+p =q and px = q
where p, q, and x are all
nonnegative rational numbers).
6.C.8.2
Present solutions to multi-step
problems in the form of valid
chains of reasoning, using
symbols such as equals signs
appropriately (for example,
rubrics award less than full
credit for the presence of
nonsense statements such as 1
+ 4 = 5 + 7 = 12, even if the
final answer is correct), or
The purpose of this standard is for students
to understand the relationship between two
variables, which begins with the distinction
between dependent and independent
variables.
The independent variable is the variable that
can be changed; the dependent variable is
the variable that is affected by the change in
the independent variable.
Students recognize that the independent
variable is graphed on the x-axis; the
dependent variable is graphed on the y-axis.
SPED Strategies:
Review and demonstrate how to find the
relationship between two quantities to help
find the value of the quantities.
How can proportional
relationships be described
using the equation y = kx?
How can proportional
relationships be represented
using rules, tables, and
graphs?
How can the graph of y = kx
be interpreted for different
contexts?
How can algebraic
expressions be used to
model real-world situations?
How can we solve simple
algebraic equations, and
how do we interpret the
Geek Phone Profits
Making Sense of
Graphs
Analyzing Tables
Eating Cookies
Saving Your Change
Multi-step Problems
in the Real World
Planning a Trip
Planking
Families of Triangles
26 | P a g e
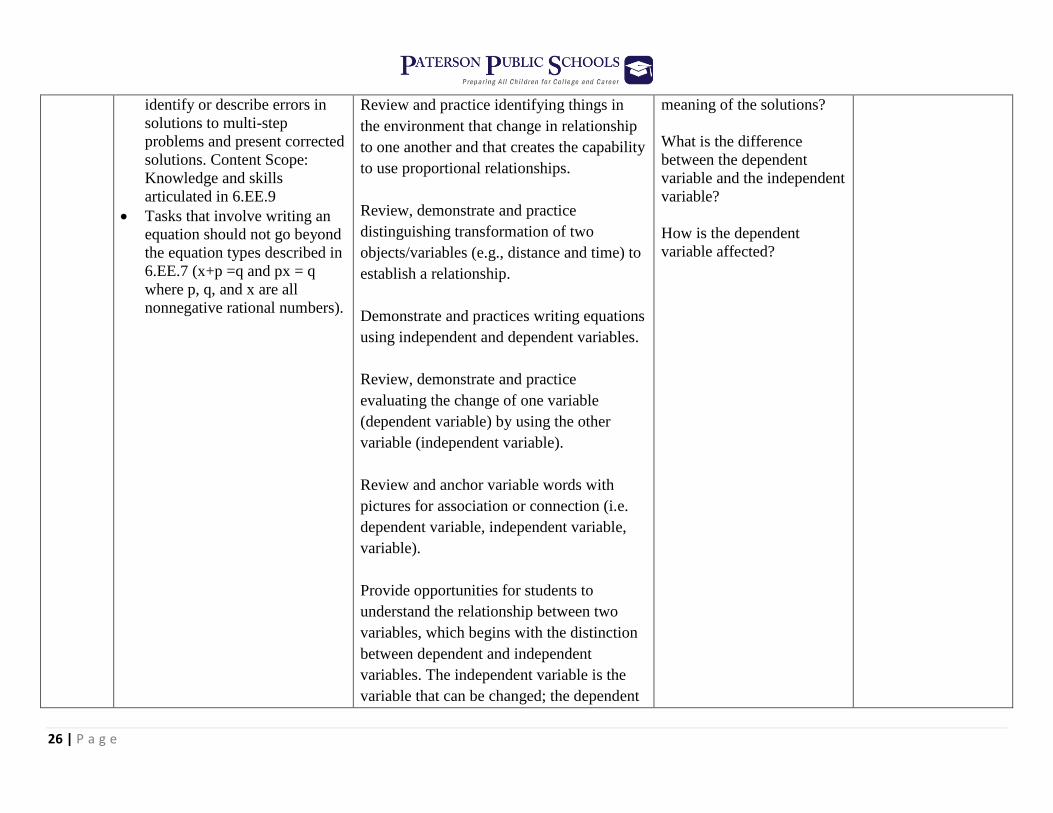
identify or describe errors in
solutions to multi-step
problems and present corrected
solutions. Content Scope:
Knowledge and skills
articulated in 6.EE.9
Tasks that involve writing an
equation should not go beyond
the equation types described in
6.EE.7 (x+p =q and px = q
where p, q, and x are all
nonnegative rational numbers).
Review and practice identifying things in
the environment that change in relationship
to one another and that creates the capability
to use proportional relationships.
Review, demonstrate and practice
distinguishing transformation of two
objects/variables (e.g., distance and time) to
establish a relationship.
Demonstrate and practices writing equations
using independent and dependent variables.
Review, demonstrate and practice
evaluating the change of one variable
(dependent variable) by using the other
variable (independent variable).
Review and anchor variable words with
pictures for association or connection (i.e.
dependent variable, independent variable,
variable).
Provide opportunities for students to
understand the relationship between two
variables, which begins with the distinction
between dependent and independent
variables. The independent variable is the
variable that can be changed; the dependent
meaning of the solutions?
What is the difference
between the dependent
variable and the independent
variable?
How is the dependent
variable affected?
27 | P a g e
variable is the variable that is affected by the
change in the independent variable. Students
recognize that the independent variable is
graphed on the x-axis; the dependent
variable is graphed on the y-axis.
Give students practice with using many
forms to represent relationships between
quantities. Multiple representations include
describing the relationship using language, a
table, an equation, or a graph. Translating
between multiple representations helps
students understand that each form
represents the same relationship and
provides a different perspective
Resources ( UDL - Visual and Auditory
Learner(s): [6.EE.9-1.0] Multiple Variables - Common
Core Standard
https://youtu.be/Kpb_FrHYokE
6.ee.9 dependent/independent variables
https://youtu.be/vKT1PS6r1-E
ELL Strategies:
Use an adapted text with a lower readability
level, a teacher-modified text (with
highlighted words, explanations, and context
clues), or a simplified teacher- generated
text illustrating various expressions and
28 | P a g e
equations.
Provide word walls with translations side by
side.
Utilize a KWL-chart graphic organizer, have
the parts listed in both their L1 and L2
language to clarify understanding.
Provide a Math word bank that is translated
and copied for students.
Provide Math reference sheets.
Picture cards with formulas and real world
examples of each should be provided.
Provide audio lessons which explain how to
solve equations in both languages.
Website:
LearnZillion
Recognize how an equation relates
independent and dependent variables
https://learnzillion.com/lesson_plans/681
29 | P a g e
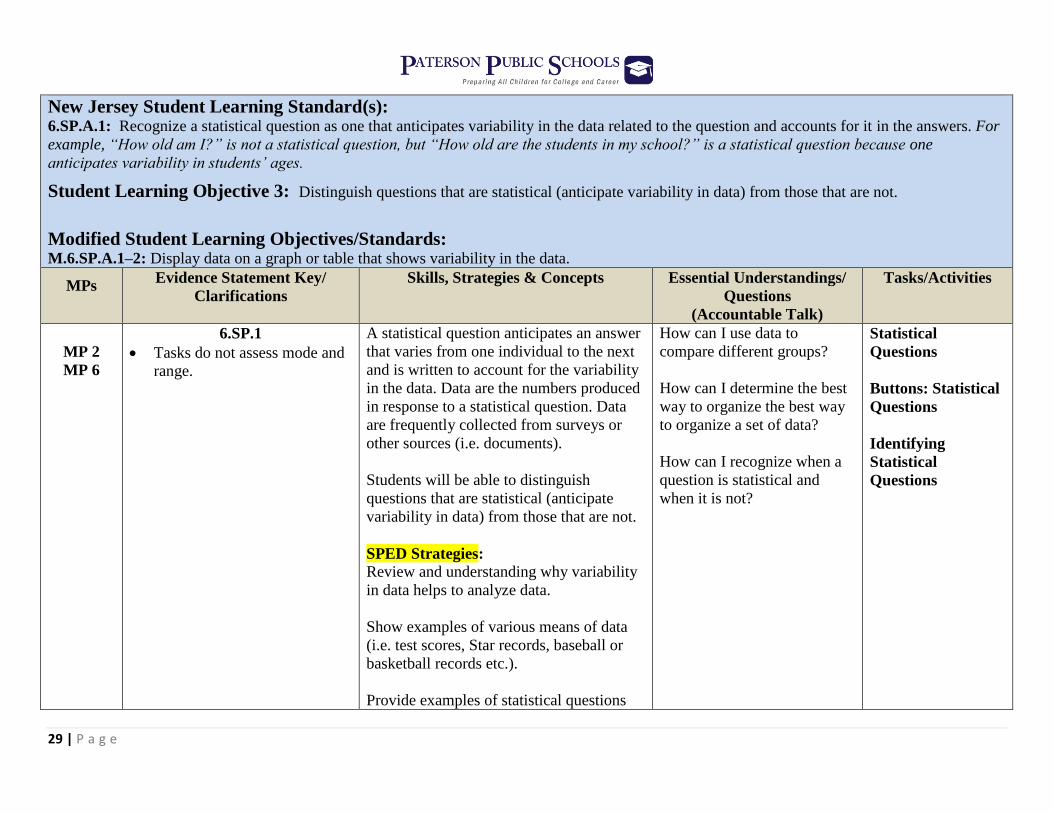
New Jersey Student Learning Standard(s): 6.SP.A.1: Recognize a statistical question as one that anticipates variability in the data related to the question and accounts for it in the answers. For
example, “How old am I?” is not a statistical question, but “How old are the students in my school?” is a statistical question because one
anticipates variability in students’ ages.
Student Learning Objective 3: Distinguish questions that are statistical (anticipate variability in data) from those that are not.
Modified Student Learning Objectives/Standards: M.6.SP.A.1–2: Display data on a graph or table that shows variability in the data.
MPs Evidence Statement Key/
Clarifications
Skills, Strategies & Concepts Essential Understandings/
Questions
(Accountable Talk)
Tasks/Activities
MP 2
MP 6
6.SP.1
Tasks do not assess mode and
range.
A statistical question anticipates an answer
that varies from one individual to the next
and is written to account for the variability
in the data. Data are the numbers produced
in response to a statistical question. Data
are frequently collected from surveys or
other sources (i.e. documents).
Students will be able to distinguish
questions that are statistical (anticipate
variability in data) from those that are not.
SPED Strategies:
Review and understanding why variability
in data helps to analyze data.
Show examples of various means of data
(i.e. test scores, Star records, baseball or
basketball records etc.).
Provide examples of statistical questions
How can I use data to
compare different groups?
How can I determine the best
way to organize the best way
to organize a set of data?
How can I recognize when a
question is statistical and
when it is not?
Statistical
Questions
Buttons: Statistical
Questions
Identifying
Statistical
Questions
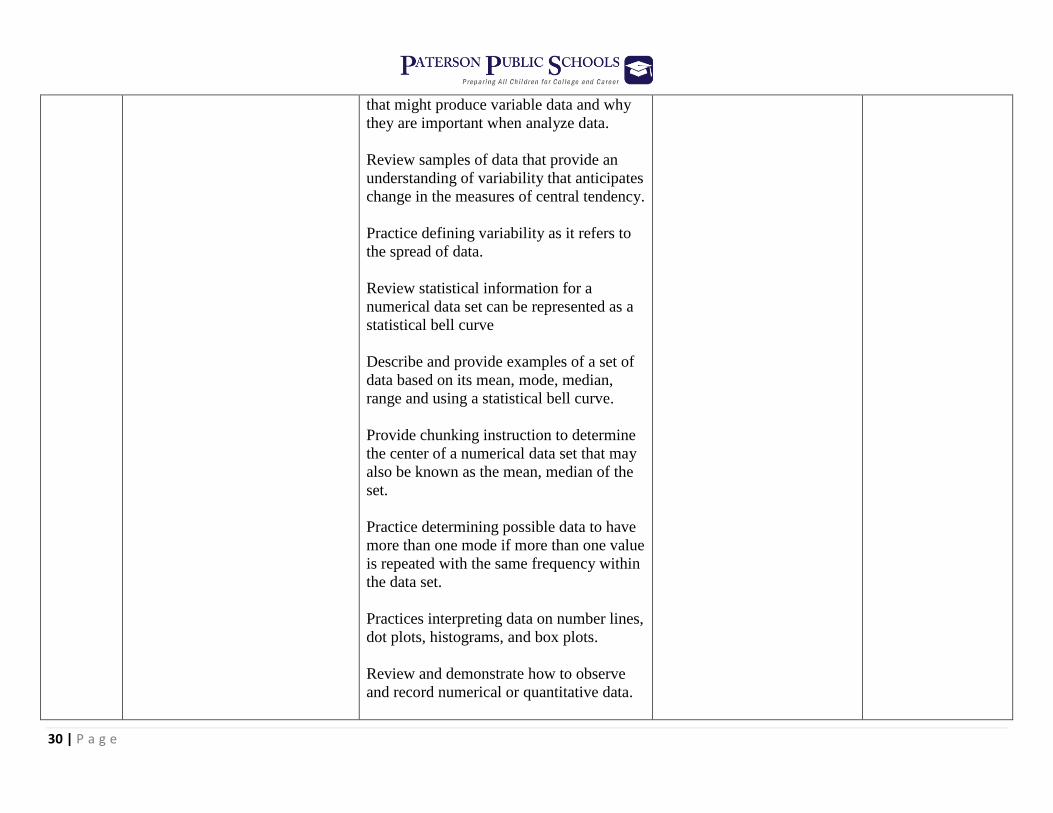
30 | P a g e
that might produce variable data and why
they are important when analyze data.
Review samples of data that provide an
understanding of variability that anticipates
change in the measures of central tendency.
Practice defining variability as it refers to
the spread of data.
Review statistical information for a
numerical data set can be represented as a
statistical bell curve
Describe and provide examples of a set of
data based on its mean, mode, median,
range and using a statistical bell curve.
Provide chunking instruction to determine
the center of a numerical data set that may
also be known as the mean, median of the
set.
Practice determining possible data to have
more than one mode if more than one value
is repeated with the same frequency within
the data set.
Practices interpreting data on number lines,
dot plots, histograms, and box plots.
Review and demonstrate how to observe
and record numerical or quantitative data.
31 | P a g e
Determine if the collection was random,
representative, or biased.
Review vocabulary words with pictures for
association or connection (i.e. frequency
table, numerical data, observations,
quantitative data, attribute, biased,
investigation, random, representation,
central tendency, mean, median data, data
sets, distribution, measures of center,
variability).
Review and practice the choice of
measures of center and variability to the
context in which the data were collected.
Explain which measure of center is best to
interpret the numerical data in the context
of its collection.
Math Graphic Organizer(s):
http://www.dgelman.com/graphicorganizer
s/
ELL Strategies:
Utilize body cues and hand gestures to
assist with expression identification.
Create charts with mathematical concepts.
Clarify, compare, and make connections to
math words in discussion, particularly
during and after practice.
32 | P a g e
Provide translations of all content and
general vocabulary words.
Connect language (such as ‘mean and
median’) with concrete and pictorial
experiences (visuals of graphs and data-
sets).
Know, use, and make the most of student
cultural and home experiences.
Build on the student’s background
knowledge.
Point to visuals of data-sets, while
speaking, using your hands to clearly
indicate the image that corresponds to your
words.
Provide a variety of ways to respond: oral,
choral, student boards, concrete models,
pictorial models, pair share, small group
share.
Embed visual, non-linguistic supports for
vocabulary clarification.
Website: Teachers First
Adapt a Strategy. Adjusting Lessons for
ESL/ELL students
http://www.teachersfirst.com/content/esl/a
daptstrat.cfm
33 | P a g e
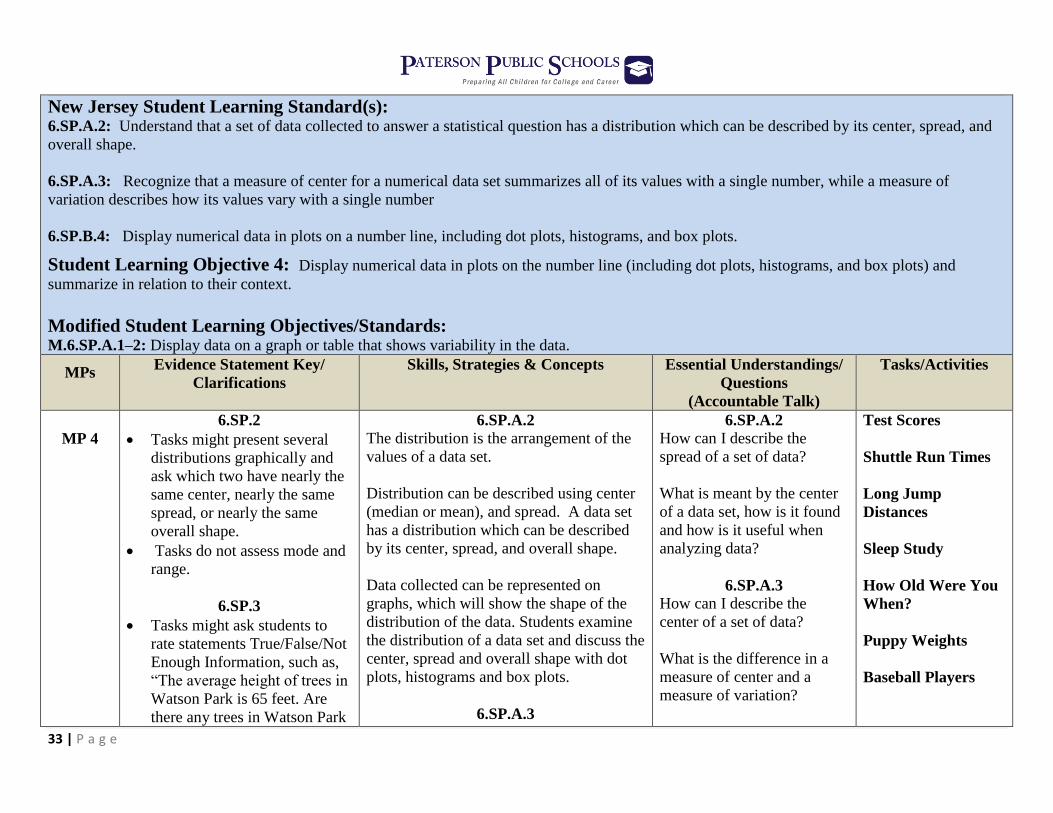
New Jersey Student Learning Standard(s): 6.SP.A.2: Understand that a set of data collected to answer a statistical question has a distribution which can be described by its center, spread, and
overall shape.
6.SP.A.3: Recognize that a measure of center for a numerical data set summarizes all of its values with a single number, while a measure of
variation describes how its values vary with a single number
6.SP.B.4: Display numerical data in plots on a number line, including dot plots, histograms, and box plots.
Student Learning Objective 4: Display numerical data in plots on the number line (including dot plots, histograms, and box plots) and
summarize in relation to their context.
Modified Student Learning Objectives/Standards: M.6.SP.A.1–2: Display data on a graph or table that shows variability in the data.
MPs Evidence Statement Key/
Clarifications
Skills, Strategies & Concepts Essential Understandings/
Questions
(Accountable Talk)
Tasks/Activities
MP 4
6.SP.2
Tasks might present several
distributions graphically and
ask which two have nearly the
same center, nearly the same
spread, or nearly the same
overall shape.
Tasks do not assess mode and
range.
6.SP.3
Tasks might ask students to
rate statements True/False/Not
Enough Information, such as,
“The average height of trees in
Watson Park is 65 feet. Are
there any trees in Watson Park
6.SP.A.2
The distribution is the arrangement of the
values of a data set.
Distribution can be described using center
(median or mean), and spread. A data set
has a distribution which can be described
by its center, spread, and overall shape.
Data collected can be represented on
graphs, which will show the shape of the
distribution of the data. Students examine
the distribution of a data set and discuss the
center, spread and overall shape with dot
plots, histograms and box plots.
6.SP.A.3
6.SP.A.2
How can I describe the
spread of a set of data?
What is meant by the center
of a data set, how is it found
and how is it useful when
analyzing data?
6.SP.A.3
How can I describe the
center of a set of data?
What is the difference in a
measure of center and a
measure of variation?
Test Scores
Shuttle Run Times
Long Jump
Distances
Sleep Study
How Old Were You
When?
Puppy Weights
Baseball Players
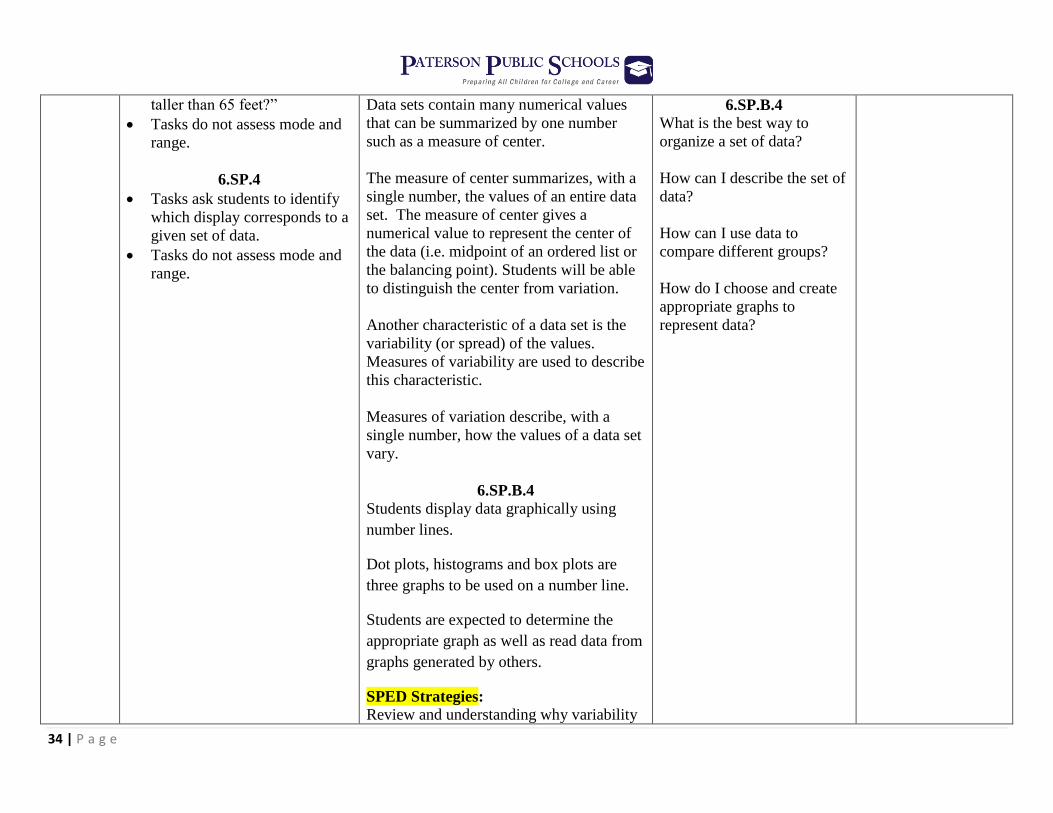
34 | P a g e
taller than 65 feet?”
Tasks do not assess mode and
range.
6.SP.4
Tasks ask students to identify
which display corresponds to a
given set of data.
Tasks do not assess mode and
range.
Data sets contain many numerical values
that can be summarized by one number
such as a measure of center.
The measure of center summarizes, with a
single number, the values of an entire data
set. The measure of center gives a
numerical value to represent the center of
the data (i.e. midpoint of an ordered list or
the balancing point). Students will be able
to distinguish the center from variation.
Another characteristic of a data set is the
variability (or spread) of the values.
Measures of variability are used to describe
this characteristic.
Measures of variation describe, with a
single number, how the values of a data set
vary.
6.SP.B.4
Students display data graphically using
number lines.
Dot plots, histograms and box plots are
three graphs to be used on a number line.
Students are expected to determine the
appropriate graph as well as read data from
graphs generated by others.
SPED Strategies:
Review and understanding why variability
6.SP.B.4
What is the best way to
organize a set of data?
How can I describe the set of
data?
How can I use data to
compare different groups?
How do I choose and create
appropriate graphs to
represent data?

35 | P a g e
in data helps to analyze data.
Show examples of various means of data
(i.e. test scores, Star records, baseball or
basketball records etc.).
Provide examples of statistical questions
that might produce variable data and why
they are important when analyzing data.
Review samples of data that provide
understanding of variability that anticipates
change in the measures of central tendency.
Provide teacher generated notes that will
anticipate variability in data generated by
statistical questions (Higher Order
Thinking Questions).
Review and anchor vocabulary words with
pictures for association or connection (i.e.
spread of data, variability bell curve, data,
mean, median, mode, range, set).
Review statistical outliers in a data set that
will show results which may not be true
values.
Describe and provide examples of a set of
data based on its mean, mode, median,
range and using a statistical bell curve.
Provide chunking instruction to determine
the center of a numerical data set may also
be known as the mean, median of the set.
36 | P a g e
Review and demonstrate that the mean of
the data set represents the average of all of
the values in the data set.
Practice determining possible data to have
more than one mode if more than one value
is repeated with the same frequency within
the data set.
Practice interpreting data on number lines,
dot plots, histograms, and box plots.
Choose the appropriate data display to
represent numerical data and provide
teacher generated notes to students as step-
by-step instruction.
Review and anchor vocabulary words with
pictures for association or connection (i.e.
bar, box plot, box-and-whisker plot, dot
plot, double bar graph, histogram, numeric
data, and quantitative data).
Review and demonstrate how to observe
and record numerical or quantitative data.
Practice how to read and interpret
numerical data in tables, frequency tables,
line plots, and lists.
Practice how to determine values between
specified intervals using a histogram.
Describe how data can be collected for an
37 | P a g e
investigation.
Describe the purpose for the investigation.
Determine if the collection was random,
representative, or biased.
Review and anchor vocabulary words with
pictures for association or connection (i.e.
frequency table, numerical data,
observations, quantitative data, attribute,
biased, investigation, random,
representation, central tendency, mean,
median data, data sets, distribution,
measures of center, variability).
Review and practice the choice of
measures of center and variability to the
context in which the data were collected.
Explain which measure of center is best to
interpret the numerical data in the context
of its collection.
Resources ( UDL - Visual and Auditory
Learner(s): Recognizing and using measures of center
and measures of variation to describe data-
-1 of 2 (6.SP.3)
https://youtu.be/--CXywpkUBs
Understanding and describing the
distribution of a set of data--Lesson 1 of 4
(Common Core 6.SP.2)
https://youtu.be/tPmJzrzIEHw
38 | P a g e
6.SP.4 - Represent Data on a Box Plot
(Box-and-Whisker Plot) / 5 Number
Summary
https://youtu.be/0CjaU4Dm-CE
ELL Strategies:
Utilize body cues and hand gestures to
assist with expression identification.
Create charts with mathematical concepts.
Clarify, compare, and make connections to
math words in discussion, particularly
during and after practice.
Provide translations of all content and
general vocabulary words.
Connect language (such as ‘mean and
median’) with concrete and pictorial
experiences (visuals of graphs and data-
sets).
Know, use, and make the most of student
cultural and home experiences.
Build on the student’s background
knowledge.
Point to visuals of data-sets, while
speaking, using your hands to clearly
indicate the image that corresponds to your
39 | P a g e
words.
Provide a variety of ways to respond: oral,
choral, student boards, concrete models,
pictorial models, pair share, and small
group share.
Support oral or written response with
sentence frames, such as “______ is ___
hundreds,__ tens, and ___ . “
Embed visual, non-linguistic supports for
vocabulary clarification
Website:
Teachers First Adapt a Strategy. Adjusting
Lessons for ESL/ELL students
http://www.teachersfirst.com/content/esl/a
daptstrat.cfm
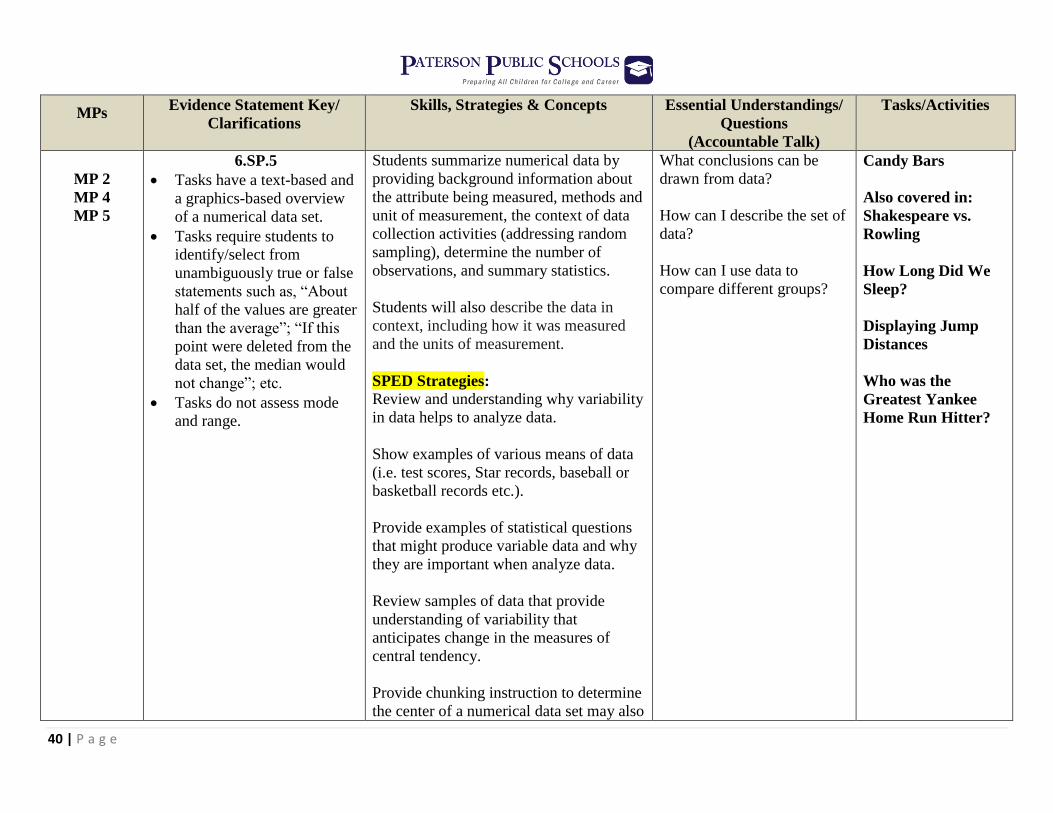
New Jersey Student Learning Standard(s): 6.SP.B.5: Summarize numerical data sets in relation to their context, such as by:
6.SP.B.5a: Reporting the number of observations.
6.SP.B.5b: Describing the nature of the attribute under investigation, including how it was measured and its units of measurement.
Student Learning Objective 5: Summarize numerical data in relation to their context by identifying the number of observations and describing
how the data was measured.
Modified Student Learning Objectives/Standards: M.EE.6.SP.B.5: Summarize data distributions shown in graphs or tables.
40 | P a g e
MPs Evidence Statement Key/
Clarifications
Skills, Strategies & Concepts Essential Understandings/
Questions
(Accountable Talk)
Tasks/Activities
MP 2
MP 4
MP 5
6.SP.5
Tasks have a text-based and
a graphics-based overview
of a numerical data set.
Tasks require students to
identify/select from
unambiguously true or false
statements such as, “About
half of the values are greater
than the average”; “If this
point were deleted from the
data set, the median would
not change”; etc.
Tasks do not assess mode
and range.
Students summarize numerical data by
providing background information about
the attribute being measured, methods and
unit of measurement, the context of data
collection activities (addressing random
sampling), determine the number of
observations, and summary statistics.
Students will also describe the data in
context, including how it was measured
and the units of measurement.
SPED Strategies:
Review and understanding why variability
in data helps to analyze data.
Show examples of various means of data
(i.e. test scores, Star records, baseball or
basketball records etc.).
Provide examples of statistical questions
that might produce variable data and why
they are important when analyze data.
Review samples of data that provide
understanding of variability that
anticipates change in the measures of
central tendency.
Provide chunking instruction to determine
the center of a numerical data set may also
What conclusions can be
drawn from data?
How can I describe the set of
data?
How can I use data to
compare different groups?
Candy Bars
Also covered in:
Shakespeare vs.
Rowling
How Long Did We
Sleep?
Displaying Jump
Distances
Who was the
Greatest Yankee
Home Run Hitter?
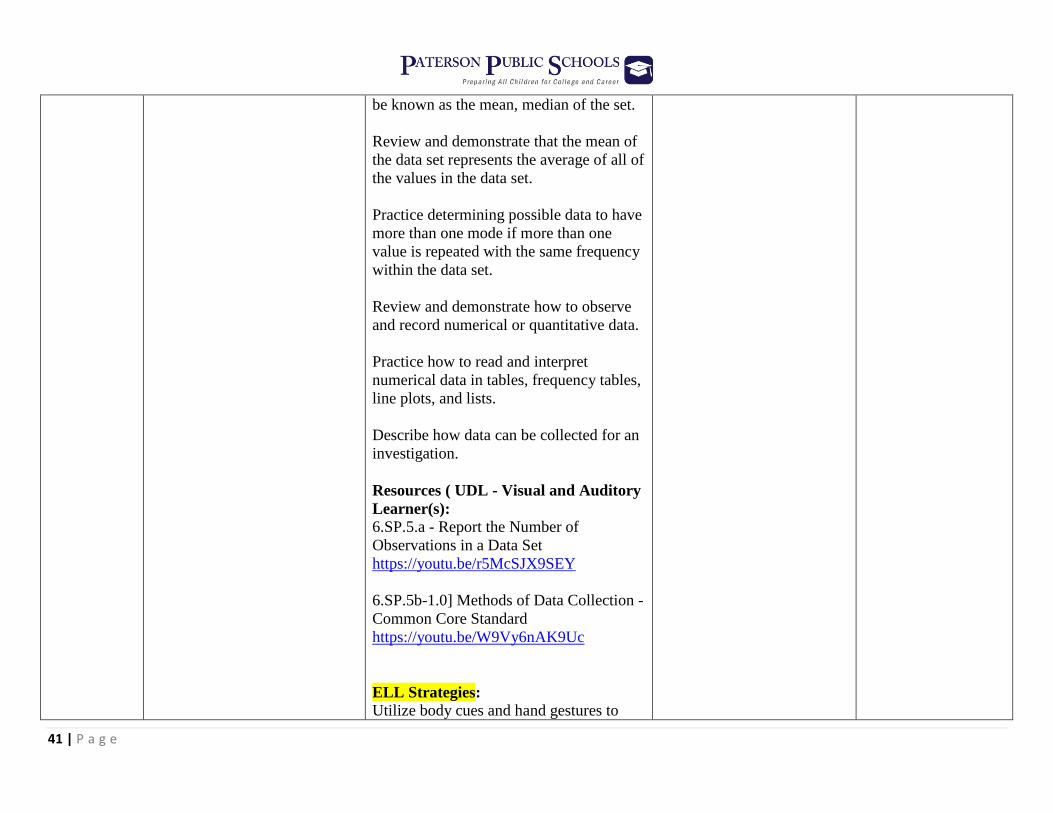
41 | P a g e
be known as the mean, median of the set.
Review and demonstrate that the mean of
the data set represents the average of all of
the values in the data set.
Practice determining possible data to have
more than one mode if more than one
value is repeated with the same frequency
within the data set.
Review and demonstrate how to observe
and record numerical or quantitative data.
Practice how to read and interpret
numerical data in tables, frequency tables,
line plots, and lists.
Describe how data can be collected for an
investigation.
Resources ( UDL - Visual and Auditory
Learner(s): 6.SP.5.a - Report the Number of
Observations in a Data Set
https://youtu.be/r5McSJX9SEY
6.SP.5b-1.0] Methods of Data Collection -
Common Core Standard
https://youtu.be/W9Vy6nAK9Uc
ELL Strategies:
Utilize body cues and hand gestures to
42 | P a g e
assist with expression identification.
Create charts with mathematical concepts.
Clarify, compare, and make connections
to math words in discussion, particularly
during and after practice.
Provide translations of all content and
general vocabulary words.
Connect language (such as mean and
median) with concrete and pictorial
experiences (visuals of graphs and data-
sets).
Know, use, and make the most of student
cultural and home experiences.
Build on the student’s background
knowledge.
Point to visuals of data-sets, while
speaking, using your hands to clearly
indicate the image that corresponds to
your words.
Provide a variety of ways to respond: oral,
choral, student boards, concrete models,
pictorial models, pair share, and small
group share.
Support oral or written response with
sentence frames, such as “______ is ___
hundreds,__ tens, and ___ . “
43 | P a g e
Embed visual, non-linguistic supports for
vocabulary clarification.
Website:
Teachers First
Adapt a Strategy. Adjusting Lessons for
ESL/ELL students
http://www.teachersfirst.com/content/esl/a
daptstrat.cfm
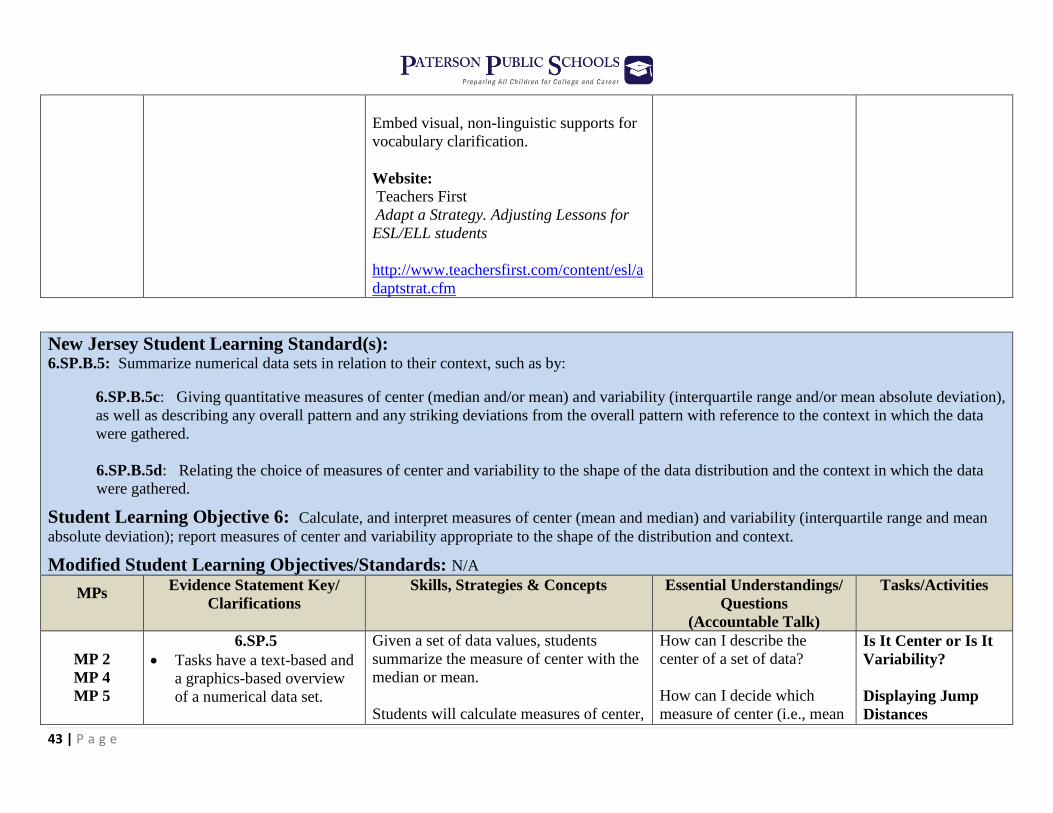
New Jersey Student Learning Standard(s): 6.SP.B.5: Summarize numerical data sets in relation to their context, such as by:
6.SP.B.5c: Giving quantitative measures of center (median and/or mean) and variability (interquartile range and/or mean absolute deviation),
as well as describing any overall pattern and any striking deviations from the overall pattern with reference to the context in which the data
were gathered.
6.SP.B.5d: Relating the choice of measures of center and variability to the shape of the data distribution and the context in which the data
were gathered.
Student Learning Objective 6: Calculate, and interpret measures of center (mean and median) and variability (interquartile range and mean
absolute deviation); report measures of center and variability appropriate to the shape of the distribution and context.
Modified Student Learning Objectives/Standards: N/A
MPs Evidence Statement Key/
Clarifications
Skills, Strategies & Concepts Essential Understandings/
Questions
(Accountable Talk)
Tasks/Activities
MP 2
MP 4
MP 5
6.SP.5
Tasks have a text-based and
a graphics-based overview
of a numerical data set.
Given a set of data values, students
summarize the measure of center with the
median or mean.
Students will calculate measures of center,
How can I describe the
center of a set of data?
How can I decide which
measure of center (i.e., mean
Is It Center or Is It
Variability?
Displaying Jump
Distances
44 | P a g e
Tasks require students to
identify/select from
unambiguously true or false
statements such as, “About
half of the values are greater
than the average”; “If this
point were deleted from the
data set, the median would
not change”; etc.
Tasks do not assess mode
and range.
mean, median, measures of spread,
interquartile range and mean absolute
deviation. They will describe the overall
shape of a distribution (skewed left,
skewed right, etc) and identify striking
deviations (outliers).
Students will choose measures of center
and variability appropriate to the shape of
the distribution and context.
SPED Strategies:
Show examples of various means of data
(i.e. test scores, Star records, baseball or
basketball records etc.).
Provide examples of statistical questions
that might produce variable data and why
they are important when analyze data.
Review samples of data that provide
understanding of variability that
anticipates change in the measures of
central tendency.
Practice defining variability as it refers to
the spread of data.
Provide teacher generated notes that will
anticipate variability in data generated by
statistical questions (Higher Order
Thinking Questions).
Review and anchor vocabulary words
or median) best describes the
data?
How can I describe the
spread of a set of data?
What is the Mean Absolute
Deviation?
Why do we need to find the
Mean Absolute Deviation?
How is the Mean different
from the Mean Absolute
Deviation?
How Long Did We
Sleep?
Mean or Median
Mean Absolute
Deviation
How MAD Are
You?
Shakespeare vs.
Rowling
Using NBA Statistics
Who was the
Greatest Yankee
Home Run Hitter?
45 | P a g e
with pictures for association or connection
(i.e. spread of data, variability bell curve,
data, mean, median, mode, range, set).
Review and demonstrate possible mode
within the data set, more than one number
is repeated with the same frequency as
another.
Review statistical outlier in a data set that
will show results which may not be true
values.
Provide chunking instruction to determine
the center of a numerical data set may also
be known as the mean, median of the set.
Review and demonstrate the mean of the
data set represents the average of all of the
values in the data set.
Review and demonstrate the mode
represents the value which appears most
frequently in a set of data.
Review the values that have the same
frequency, when there is no mode.
Practice determining possible data to have
more than one mode if more than one
value is repeated with the same frequency
within the data set.
Review and demonstrate how to observe
46 | P a g e
and record numerical or quantitative data.
Practice how to read and interpret
numerical data in tables, frequency tables,
line plots, and lists.
Describe how data can be collected for an
investigation.
Describe the purpose for the investigation.
Determine if the collection was random,
representative, or biased.
Review and anchor vocabulary words
with pictures for association or connection
(i.e. frequency table, numerical data,
observations, quantitative data, attribute,
biased, investigation, random,
representation, central tendency, mean,
median data, data sets, distribution,
measures of center, variability) ..
Explain which measure of center is best to
interpret the numerical data in the context
of its collection.
Resources ( UDL - Visual and Auditory
Learner(s): [6.SP.5c-2.0] Center and Variability of
Data Sets - Common Core Standard
https://youtu.be/qQoxeF2Re5k
[6.SP.5d-1.0] Best Measure of Center and
47 | P a g e
Variability - Common Core Standard
https://youtu.be/kgEaBYKti8E
ELL Strategies:
Utilize body cues and hand gestures to
assist with expression identification.
Create charts with mathematical concepts.
Clarify, compare, and make connections
to math words in discussion, particularly
during and after practice.
Provide translations of all content and
general vocabulary words.
Connect language (such as ‘mean and
median’) with concrete and pictorial
experiences (visuals of graphs and data-
sets).
Know, use, and make the most of student
cultural and home experiences.
Build on the student’s background
knowledge.
Point to visuals of data-sets, while
speaking, using your hands to clearly
indicate the image that corresponds to
your words.
Provide a variety of ways to respond: oral,
choral, student boards, concrete models,
48 | P a g e
pictorial models, pair share, and small
group share.
Support oral or written response with
sentence frames, such as “______ is ___
hundreds,__ tens, and ___ . “
Embed visual, non-linguistic supports for
vocabulary clarification.
Website:
Teachers First
Adapt a Strategy. Adjusting Lessons for
ESL/ELL students
http://www.teachersfirst.com/content/esl/a
daptstrat.cfm
New Jersey Student Learning Standard(s): 6.RP.A.3: Use ratio and rate reasoning to solve real-world and mathematical problems, e.g., by reasoning about tables of equivalent ratios, tape
diagrams, double number line diagrams, or equations. *(benchmarked)
6.RP.A.3a: Make tables of equivalent ratios relating quantities with whole number measurements, find missing values in the tables, and plot
the pairs of values on the coordinate plane. Use tables to compare ratios.
6.RP.A.3b: Solve unit rate problems including those involving unit pricing and constant speed. For example, if it took 7 hours to mow 4
lawns, then at that rate, how many lawns could be mowed in 35 hours? At what rate were lawns being mowed?
6.RP.A.3c: Find a percent of a quantity as a rate per 100 (e.g., 30% of a quantity means 30/100 times the quantity); solve problems involving
finding the whole, given a part and the percent.
Student Learning Objective 7: Create and complete tables of equivalent ratios to sole real world and mathematical problems using ratio and
rate reasoning that include making tables of equivalent ratios, solving unit rate problems, finding percent of a quantity as a rate per 100.
49 | P a g e
Modified Student Learning Objectives/Standards: N/A
MPs Evidence Statement Key/
Clarifications
Skills, Strategies & Concepts Essential Understandings/
Questions
(Accountable Talk)
Tasks/Activities
MP 2
MP 4
MP 5
MP 6
MP 7
MP 8
6.RP.3a
Expectations for ratios in
this grade are limited to
ratios of non-complex
fractions. The initial
numerator and denominator
should be whole numbers
6.RP.3b
Expectations for unit rates
in this grade are limited to
non-complex fractions. The
initial numerator and
denominator should be
whole numbers.
6.RP.3c-1
Tasks may or may not
contain context.
Expectations for ratios in
this grade are limited to
ratios of non-complex
fractions. The initial
numerator and denominator
should be whole numbers.
6.RP.3c-2
Expectations for ratios in
this grade are limited to
Students will use ratio and rate reasoning
to create tables of equivalent ratios
relating quantities with whole number
measurements, find missing values in
tables and plot pairs of values.
Previously, students have used additive
reasoning in tables to solve problems. To
begin the shift to proportional reasoning,
students need to begin using
multiplicative reasoning. To aid in the
development of proportional reasoning
the cross-product algorithm is not
expected at this level. When working
with ratio tables and graphs, whole
number measurements are the
expectation for this standard.
This will allow students to understand
how to compare ratios using tables of
equivalent ratios.
Solve real world and mathematical
problems involving unit rate including
unit price and constant speed.
Calculate a percent of a quantity and
solve problems by finding the whole
when given the part and the percent.
What information do I get
when I compare two
numbers using a ratio?
What kinds of problems can
I solve by using ratios?
Why are tables important in
solving real world
mathematical problems?
What are equivalent ratios?
What are percentages?
Climbing the Steps of
El Castillo
Hunger Games vs.
Divergent
Fuel Usage
Walking Around the
School
Attributes of a Stink
Bug
50 | P a g e
ratios of non-complex
fractions. The initial
numerator and denominator
should be whole numbers.
SPED Strategies:
Create note cards for short bursts of
information.
Present information through different
modalities.
Adjust color of text, graphs and visual
content.
Create tables of equivalent ratios relating
quantities with whole-number
measurements.
Create visual, verbal or tactile cues or
reminders.
Link new learning to prior learning.
Connect to real-life experiences.
Pre-teach prerequisite skills and
concepts.
Embed links to websites for additional
knowledge.
Design web quests to search for
background information.
Teach and model fundamental skills and
procedures explicitly until they become
automatic.
51 | P a g e
Vary means to assess mastery of
materials taught.
Instructional Resources ( UDL - Visual
and Auditory Learner(s):
Rate and Proportion with Student
Bob, CCSS 6.RP.A.3 and 7.RP.A.1.
https://youtu.be/pIMNpu7mGY8
6.RP.2/3 Unit Rates Tape
Diagram/Bar Model MaTh LAB 2.1
https://youtu.be/2y2w3WFxH3w
ELL Strategies:
Provide manipulatives that show
measurement rates and conversions.
Group high-level and low-level ELL
students in small groups/ triads.
Use of word/picture wall.
Use of L1 text and/or support.
Provide illustrations/diagrams/ drawings.
Provide white boards for students to
practice problem solving.
Use of cloze sentences with relevant
terms included in text.
Use of translation dictionary or software.
52 | P a g e
Model by playing role of student and
gradually fade to level of student
working independently.
Website:
KHAN ACADEMY:
Ratios and Proportions
https://www.khanacademy.org/commonc
ore/grade-6-RP
New Jersey Student Learning Standard(s): 6.RP.A.3d: Use ratio reasoning to convert measurement units; manipulate and transform units appropriately when multiplying or dividing quantities.
Student Learning Objective 8: Use ratio and rate reasoning to convert measurement units and to transform units appropriately when
multiplying or dividing quantities.
Modified Student Learning Objectives/Standards: N/A
MPs Evidence Statement Key/
Clarifications
Skills, Strategies & Concepts Essential
Understandings/
Questions
(Accountable Talk)
Tasks/Activities
MP 2
MP 4
MP 5
MP 6
MP 7
MP 8
6.RP.3d
Tasks may or may not
contain context.
Tasks require students to
multiply and/or divide
dimensioned quantities.
Half of the tasks require
students to correctly express
the units of the result.
Expectations for ratios in
this grade are limited to
A ratio can be used to compare measures
of two different types, such as inches per
foot, milliliters per liter and centimeters
per inch.
Students convert measurement units using
ratio reasoning and transform units
appropriately when multiplying and
dividing quantities.
Students recognize that a conversion
factor is a fraction equal to 1 since the
How can ratios be used to
convert measurement
units?
What information do I
need to convert
measurement units?
Baking Sale Brownies
Paper Clip
Comparisons
53 | P a g e
ratios of non-complex
fractions. The initial
numerator and denominator
should be whole numbers.
numerator and denominator describe the
same quantity. For example, 12 inches/1
foot is a conversion factor since the
numerator and denominator equals the
same amount. Since the ratio is equivalent
to 1, the identity property of
multiplication allows an amount to be
multiplied by the ratio. Also, the value of
the ratio can also be expressed as 1
foot/12 inches allowing for the conversion
ratios to be expressed in a format so that
units will “cancel”.
Students use ratios as conversion factors
and the identity property for
multiplication to convert ratio units.
SPED Strategies:
Create note cards for short bursts of
information.
Present information through different
modalities.
Adjust color of text, graphs and visual
content.
Create tables of equivalent ratios relating
quantities with whole-number
measurements.
Create visual, verbal or tactile cues or
reminders.
54 | P a g e
Link new learning to prior learning.
Connect to real-life experiences.
Pre-teach prerequisite skills and concepts.
Embed links to websites for additional
knowledge.
Design web quests to search for
background information.
Teach and model fundamental skills and
procedures explicitly until they become
automatic.
Vary means to assess mastery of materials
taught.
Include written descriptions for graphics,
images and videos.
Instructional Resources ( UDL - Visual
and Auditory Learner(s):
Rate and Proportion with Student Bob,
CCSS 6.RP.A.3 and 7.RP.A.1.
https://youtu.be/pIMNpu7mGY8
6.RP.2/3 Unit Rates Tape Diagram/Bar
Model MaTh LAB 2.1
https://youtu.be/2y2w3WFxH3w
ELL Strategies:
Provide manipulatives that show
55 | P a g e
measurement rates and conversions.
Group high-level and low-level ELL
students in small groups/ triads.
Use of word/picture wall.
Use of L1 text and/or support.
Provide illustrations/diagrams/ drawings.
Provide white boards for students to
practice problem solving.
Use of cloze sentences with relevant terms
included in text.
Use of translation dictionary or software.
Model by playing role of student and
gradually fade to level of student working
independently.
Website:
KHAN ACADEMY:
Ratios and Proportions
https://www.khanacademy.org/commonco
re/grade-6-RP
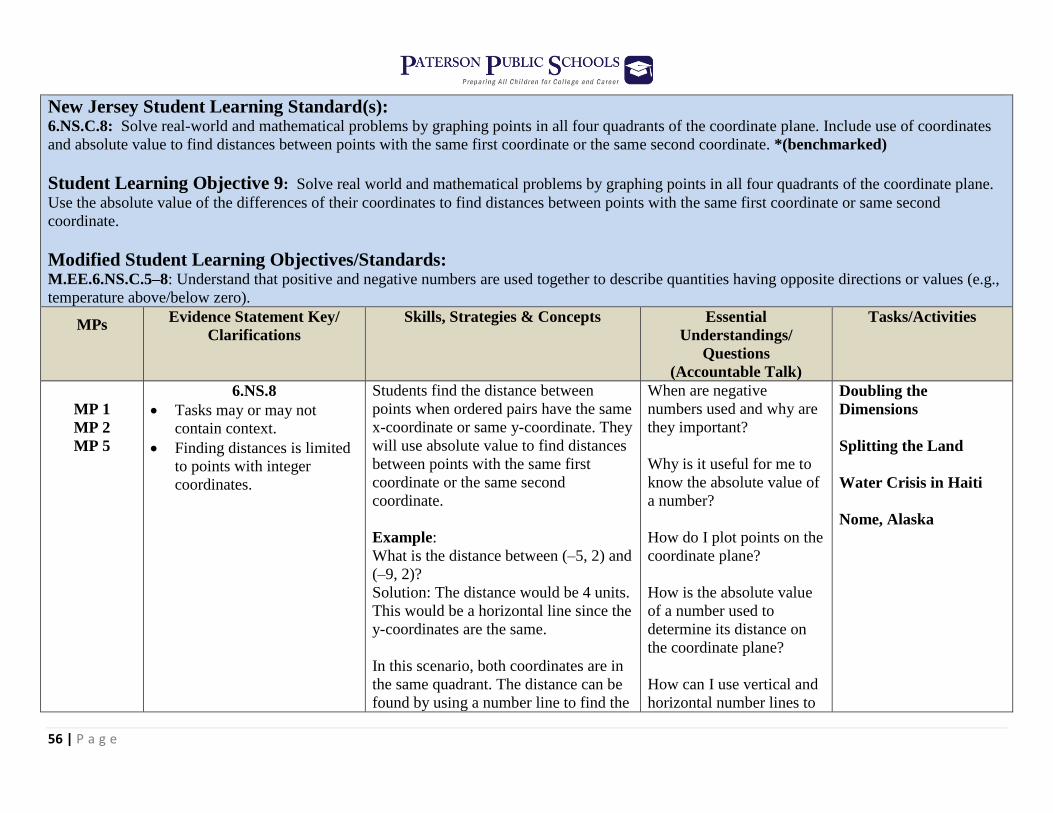
56 | P a g e
New Jersey Student Learning Standard(s): 6.NS.C.8: Solve real-world and mathematical problems by graphing points in all four quadrants of the coordinate plane. Include use of coordinates
and absolute value to find distances between points with the same first coordinate or the same second coordinate. *(benchmarked)
Student Learning Objective 9: Solve real world and mathematical problems by graphing points in all four quadrants of the coordinate plane.
Use the absolute value of the differences of their coordinates to find distances between points with the same first coordinate or same second
coordinate.
Modified Student Learning Objectives/Standards: M.EE.6.NS.C.5–8: Understand that positive and negative numbers are used together to describe quantities having opposite directions or values (e.g.,
temperature above/below zero).
MPs Evidence Statement Key/
Clarifications
Skills, Strategies & Concepts Essential
Understandings/
Questions
(Accountable Talk)
Tasks/Activities
MP 1
MP 2
MP 5
6.NS.8
Tasks may or may not
contain context.
Finding distances is limited
to points with integer
coordinates.
Students find the distance between
points when ordered pairs have the same
x-coordinate or same y-coordinate. They
will use absolute value to find distances
between points with the same first
coordinate or the same second
coordinate.
Example:
What is the distance between (–5, 2) and
(–9, 2)?
Solution: The distance would be 4 units.
This would be a horizontal line since the
y-coordinates are the same.
In this scenario, both coordinates are in
the same quadrant. The distance can be
found by using a number line to find the
When are negative
numbers used and why are
they important?
Why is it useful for me to
know the absolute value of
a number?
How do I plot points on the
coordinate plane?
How is the absolute value
of a number used to
determine its distance on
the coordinate plane?
How can I use vertical and
horizontal number lines to
Doubling the
Dimensions
Splitting the Land
Water Crisis in Haiti
Nome, Alaska
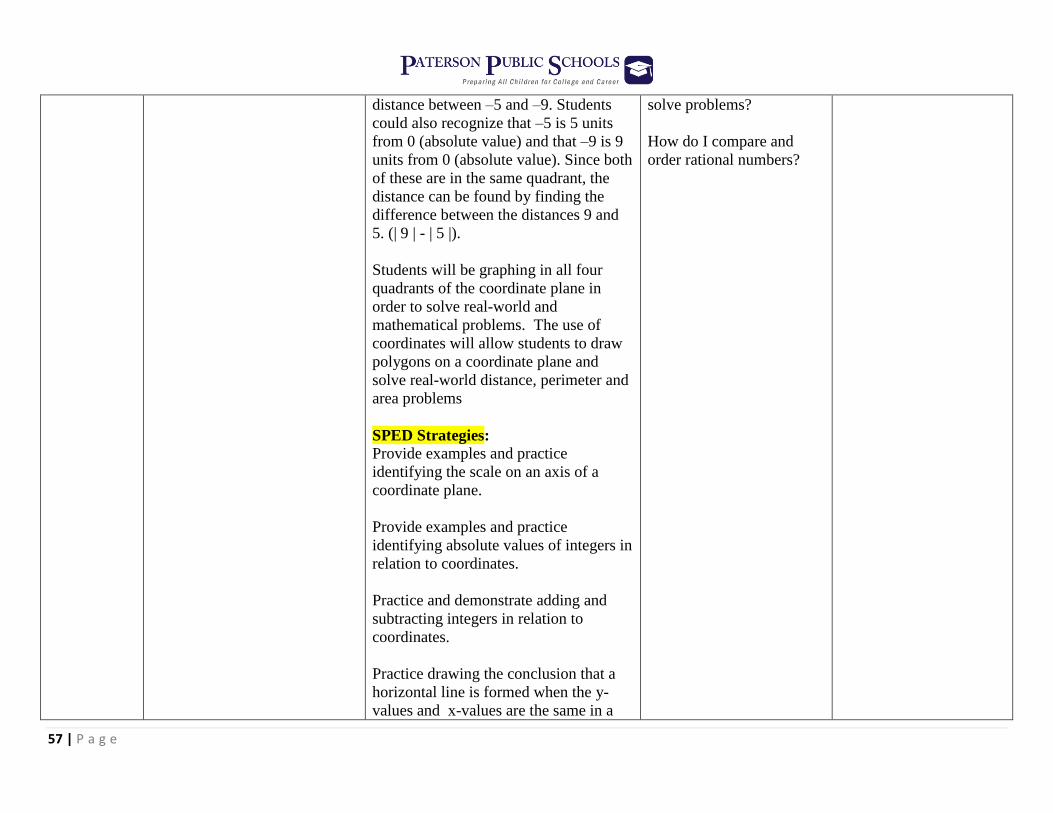
57 | P a g e
distance between –5 and –9. Students
could also recognize that –5 is 5 units
from 0 (absolute value) and that –9 is 9
units from 0 (absolute value). Since both
of these are in the same quadrant, the
distance can be found by finding the
difference between the distances 9 and
5. (| 9 | - | 5 |).
Students will be graphing in all four
quadrants of the coordinate plane in
order to solve real-world and
mathematical problems. The use of
coordinates will allow students to draw
polygons on a coordinate plane and
solve real-world distance, perimeter and
area problems
SPED Strategies:
Provide examples and practice
identifying the scale on an axis of a
coordinate plane.
Provide examples and practice
identifying absolute values of integers in
relation to coordinates.
Practice and demonstrate adding and
subtracting integers in relation to
coordinates.
Practice drawing the conclusion that a
horizontal line is formed when the y-
values and x-values are the same in a
solve problems?
How do I compare and
order rational numbers?
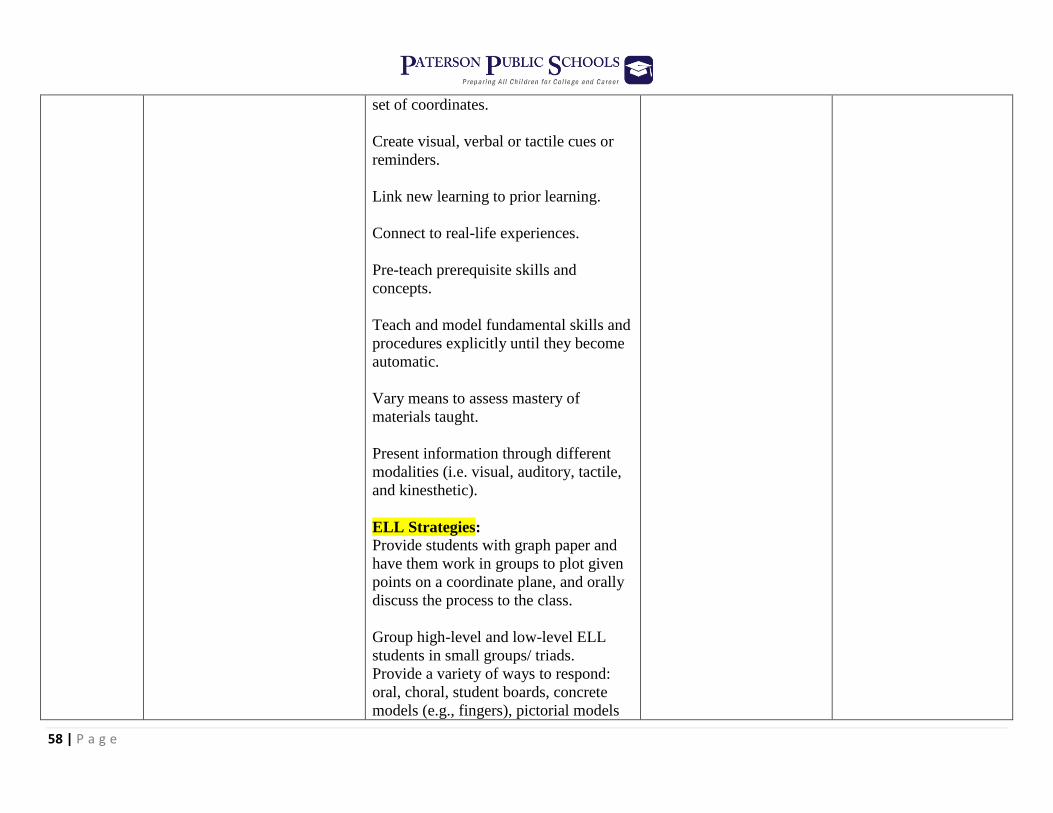
58 | P a g e
set of coordinates.
Create visual, verbal or tactile cues or
reminders.
Link new learning to prior learning.
Connect to real-life experiences.
Pre-teach prerequisite skills and
concepts.
Teach and model fundamental skills and
procedures explicitly until they become
automatic.
Vary means to assess mastery of
materials taught.
Present information through different
modalities (i.e. visual, auditory, tactile,
and kinesthetic).
ELL Strategies:
Provide students with graph paper and
have them work in groups to plot given
points on a coordinate plane, and orally
discuss the process to the class.
Group high-level and low-level ELL
students in small groups/ triads.
Provide a variety of ways to respond:
oral, choral, student boards, concrete
models (e.g., fingers), pictorial models
59 | P a g e
(e.g., ten-frame), pair share, and small
group share.
Create a large picture wall with different
shapes, and formulas, with translated
names of figures and properties.
Provide students with reference sheets
with L1 text materials.
Utilize white boards where students can
draw mathematical representations of
coordinate planes, formulas for figures
and illustrate problem solving skills.
Use of Math journals for students to
practice writing skills with math
terminology.
Use of translation dictionary or software
with the emphasis on surface area and
relevant formulas.
Teach students how to ask questions
(such as, “Do you agree?” and “Why do
you think so?”) to extend “think-pair-
share” conversations. Model and post
conversation “starters” such as: “I agree
because….” “Can you explain how you
solved it?” “I noticed that…” “Your
solution is different from/ the same as
mine because…” “My mistake was
to…”
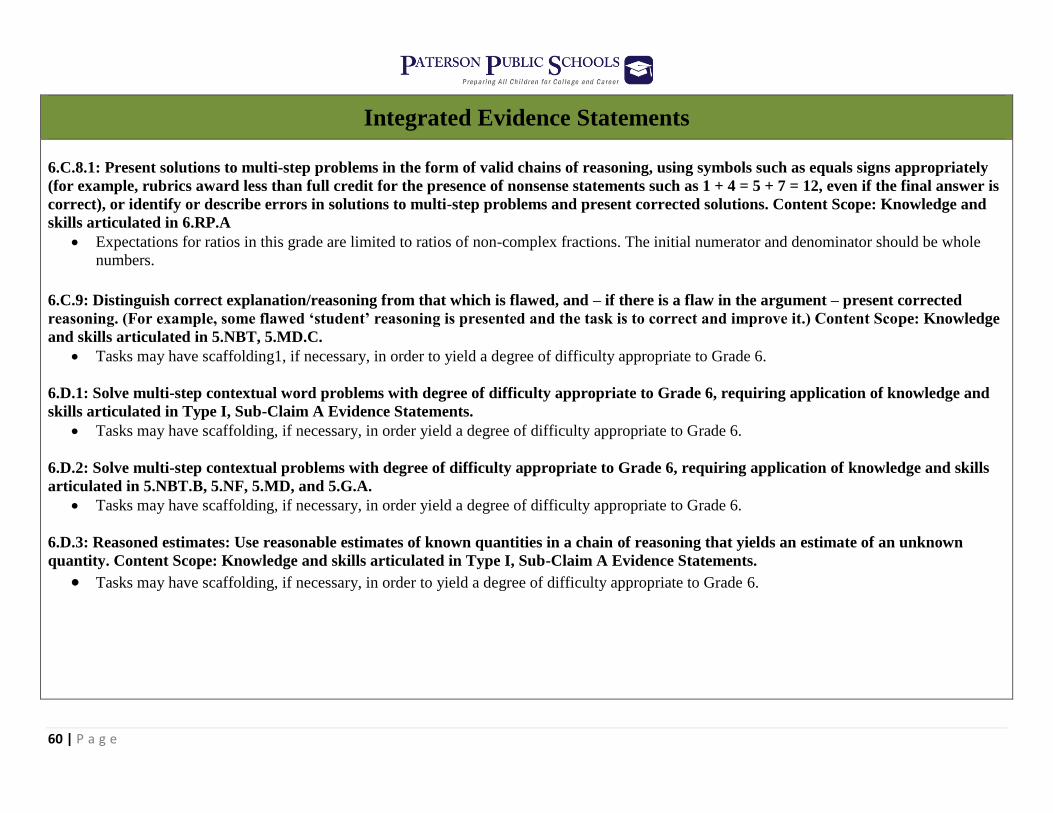
60 | P a g e
Integrated Evidence Statements
6.C.8.1: Present solutions to multi-step problems in the form of valid chains of reasoning, using symbols such as equals signs appropriately
(for example, rubrics award less than full credit for the presence of nonsense statements such as 1 + 4 = 5 + 7 = 12, even if the final answer is
correct), or identify or describe errors in solutions to multi-step problems and present corrected solutions. Content Scope: Knowledge and
skills articulated in 6.RP.A
Expectations for ratios in this grade are limited to ratios of non-complex fractions. The initial numerator and denominator should be whole
numbers.
6.C.9: Distinguish correct explanation/reasoning from that which is flawed, and – if there is a flaw in the argument – present corrected
reasoning. (For example, some flawed ‘student’ reasoning is presented and the task is to correct and improve it.) Content Scope: Knowledge
and skills articulated in 5.NBT, 5.MD.C.
Tasks may have scaffolding1, if necessary, in order to yield a degree of difficulty appropriate to Grade 6.
6.D.1: Solve multi-step contextual word problems with degree of difficulty appropriate to Grade 6, requiring application of knowledge and
skills articulated in Type I, Sub-Claim A Evidence Statements.
Tasks may have scaffolding, if necessary, in order yield a degree of difficulty appropriate to Grade 6.
6.D.2: Solve multi-step contextual problems with degree of difficulty appropriate to Grade 6, requiring application of knowledge and skills
articulated in 5.NBT.B, 5.NF, 5.MD, and 5.G.A.
Tasks may have scaffolding, if necessary, in order yield a degree of difficulty appropriate to Grade 6.
6.D.3: Reasoned estimates: Use reasonable estimates of known quantities in a chain of reasoning that yields an estimate of an unknown
quantity. Content Scope: Knowledge and skills articulated in Type I, Sub-Claim A Evidence Statements.
Tasks may have scaffolding, if necessary, in order to yield a degree of difficulty appropriate to Grade 6.
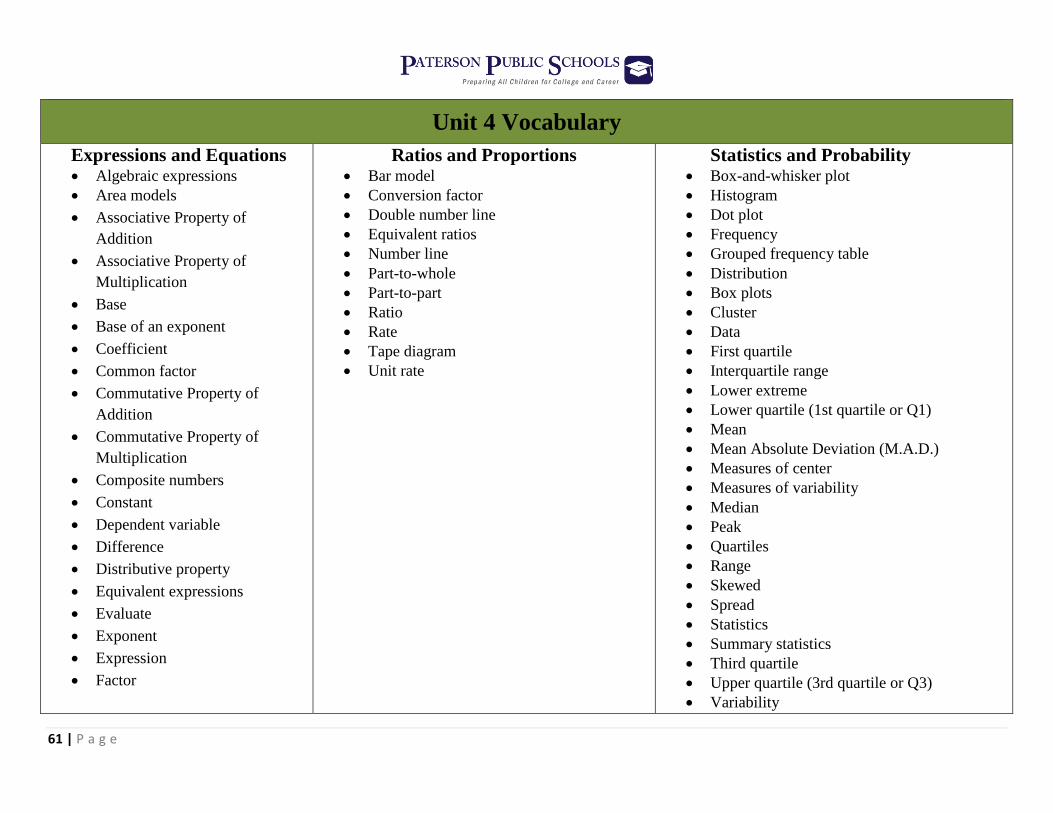
61 | P a g e
Unit 4 Vocabulary
Expressions and Equations Algebraic expressions
Area models
Associative Property of
Addition
Associative Property of
Multiplication
Base
Base of an exponent
Coefficient
Common factor
Commutative Property of
Addition
Commutative Property of
Multiplication
Composite numbers
Constant
Dependent variable
Difference
Distributive property
Equivalent expressions
Evaluate
Exponent
Expression
Factor
Ratios and Proportions Bar model
Conversion factor
Double number line
Equivalent ratios
Number line
Part-to-whole
Part-to-part
Ratio
Rate
Tape diagram
Unit rate
Statistics and Probability Box-and-whisker plot
Histogram
Dot plot
Frequency
Grouped frequency table
Distribution
Box plots
Cluster
Data
First quartile
Interquartile range
Lower extreme
Lower quartile (1st quartile or Q1)
Mean
Mean Absolute Deviation (M.A.D.)
Measures of center
Measures of variability
Median
Peak
Quartiles
Range
Skewed
Spread
Statistics
Summary statistics
Third quartile
Upper quartile (3rd quartile or Q3)
Variability
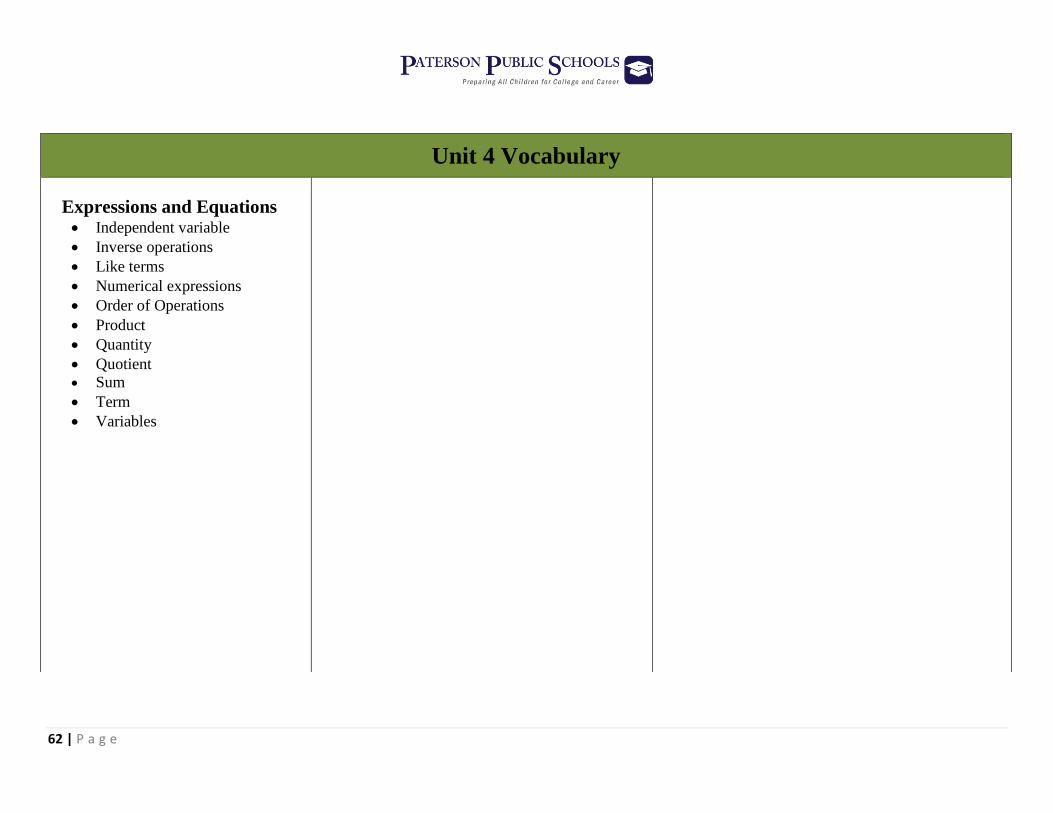
62 | P a g e
Unit 4 Vocabulary
Expressions and Equations Independent variable
Inverse operations
Like terms
Numerical expressions
Order of Operations
Product
Quantity
Quotient
Sum
Term
Variables
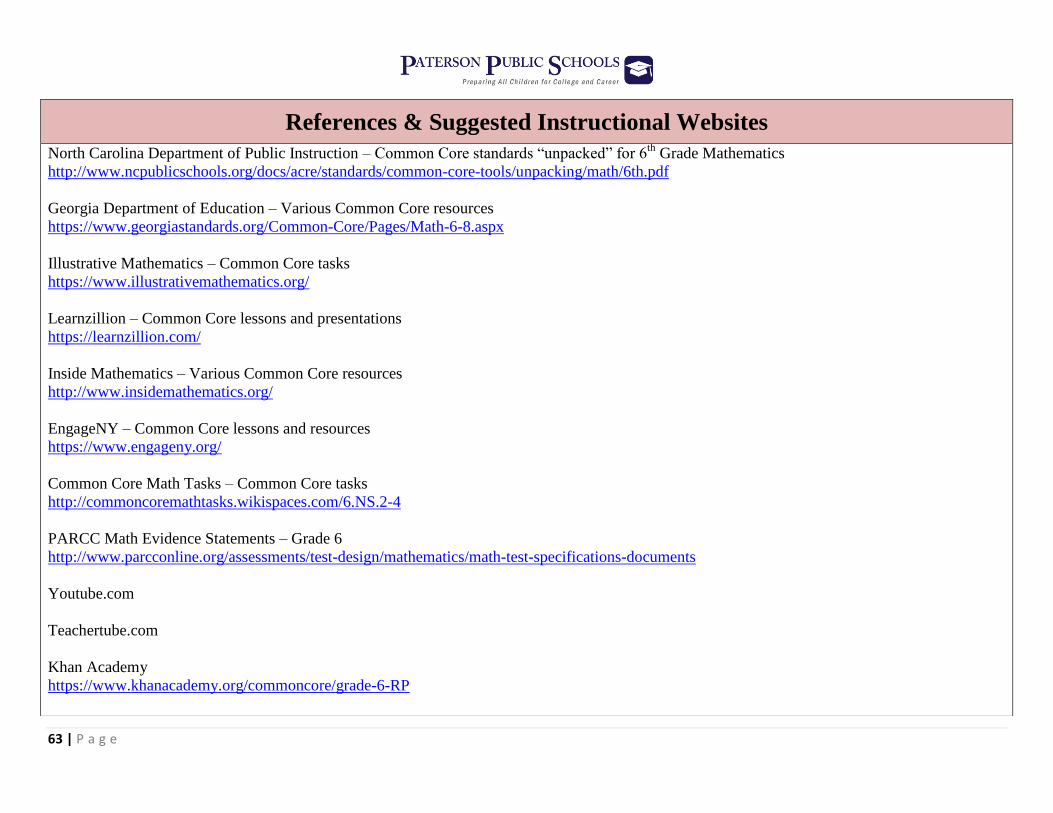
63 | P a g e
References & Suggested Instructional Websites
North Carolina Department of Public Instruction – Common Core standards “unpacked” for 6th
Grade Mathematics
http://www.ncpublicschools.org/docs/acre/standards/common-core-tools/unpacking/math/6th.pdf
Georgia Department of Education – Various Common Core resources
https://www.georgiastandards.org/Common-Core/Pages/Math-6-8.aspx
Illustrative Mathematics – Common Core tasks
https://www.illustrativemathematics.org/
Learnzillion – Common Core lessons and presentations
https://learnzillion.com/
Inside Mathematics – Various Common Core resources
http://www.insidemathematics.org/
EngageNY – Common Core lessons and resources
https://www.engageny.org/
Common Core Math Tasks – Common Core tasks
http://commoncoremathtasks.wikispaces.com/6.NS.2-4
PARCC Math Evidence Statements – Grade 6
http://www.parcconline.org/assessments/test-design/mathematics/math-test-specifications-documents
Youtube.com
Teachertube.com
Khan Academy
https://www.khanacademy.org/commoncore/grade-6-RP
64 | P a g e
Field Trip Ideas
THE BOUNCE FACTORY (Warren, NJ) - STEM- Inspired FUN Field Trips The Bounce Factory, Bricks 4 Kidz of Hunterdon Somerset and
Team Makers of North Jersey have combined to create a unique and exciting Field Trip for students in grades 1st – 8th. It integrates STEM
learning with fun, hands on activities that will focus on Science, Engineering and Math concepts. The students will build motorized models with
LEGO® bricks and discuss engineering and physics principals; enter the Bounce rooms for activities that will set in motion discussions of how
physics impacts their play; learn about Math and Science concepts while playing integrative teambuilding activities that build their skills and
promote working together; learn strategy and the power of collaboration while playing laser tag in a state of the art facility
http://www.bouncefactorynj.com/
LIBERTY SCIENCE CENTER (Jersey City, NJ) - An interactive science museum and learning center with math connections. There is a math
guidebook for teachers to make connections with math: http://lsc.org/wp-content/uploads/2012/04/MATH-CONNECTIONS-Final.pdf
http://lsc.org/plan-your-visit/
NATIONAL MUSEUM OF MATHEMATICS (New York, NY) - Mathematics illuminates the patterns and structures all around us. Our
dynamic exhibits, gallery, and programs will stimulate inquiry, spark curiosity, and reveal the wonders of mathematics. MoMath has innovative
exhibits that will engage folks from 105 to 5 years old (and sometimes younger), but with a special emphasis on activities for 4th through 8th
graders. **Requires approval from Unit Superintendent**
http://momath.org/
MUSEUM OF AMERICAN FIANANCE (New York, NY) – For more than 20 years, educators from around the country have been bringing
students to the Museum to help them understand how finance impacts their daily lives. The Museum offers discounted admission for pre-booked
groups of eight or more, as well as a variety of classes for students in middle school through college.
http://www.moaf.org/index
NEW JERSEY JACKALS (Little Falls, NJ) – Students will be able to watch a live minor league baseball game while figuring out the players
batting averages, the earned run average, determine the win to loss ratio for the season, the pitch count, and other player statistics.
http://www.canamleague.com/teams/newjersey.php
65 | P a g e
Field Trip Ideas
LEGOLAND DISCOVERY CENTER (Yonkers, NY) – Merry-Go-Round Workshop (Engineering Design, Mathematics, Listening and
Speaking) This workshop provides a fun, hand-on way to get students excited about engineering, design, and mathematics. Students build a
LEGO merry-go-round to explore gear ratios then experiment with gear trains to see which combination enables their ride to spin the fastest. .
**Requires approval from Unit Superintendent**
https://www.legolanddiscoverycenter.com/westchester/education/elementary-school.aspx
BUEHLER’S CHALLENGER & SCIENCE CENTER (Paramus, NJ) - Fly a space mission beyond your wildest dreams in the challenger
simulator! Students will work on teams to complete their mission, while conducting experiments, monitoring life support, and implementing
navigation orders. In this dynamic environment, students use principles of science, mathematics, and technology to complete their tasks. There are
3 missions to choose from: “Rendezvous with Comet Halley”, “Return to the Moon”, “Voyage to Mars”.
**Requires approval from Unit Superintendent**
http://www.bcsc.org/5-9th-grade/
BRANCH BROOK PARK SKATING RINK (Newark, NJ) - A unique educational experience that gets students excited about learning!
Students will learn how the concepts of Science, Technology, Engineering and Math can be found in everyday experiences, even FUN experiences
like roller skating! Our professional STEM Educators teach visiting students about how STEM principles exist in just about every part of life. The
lessons focus on hands on activities that are both educational and fun! Lessons are customized based on teachers needs to directly relate back to
classroom learning making this program completely unique! Following the completion of the 1hour STEM Lesson, the students roller skate for
physical fitness. While Roller Skating the concepts students learned are continually reinforced. Our lessons are designed not only to help students
overcome their fear of learning STEM concepts but to show how STEM is both FUN & EXCITING!
http://www.unitedskates.com/public/newark/parties-groups/school/field-trips/index.cfm


![STAGNATE TO STUNNING: HOW WE ADOPTED INBOUND & REINVENTED OUR AGENCY [INBOUND 2014]](https://img.pdfslide.us/doc/110x75/557e09b9d8b42ae6458b4d03/stagnate-to-stunning-how-we-adopted-inbound-reinvented-our-agency-inbound-2014.jpg)