Embed Size (px)
Citation preview
7/27/2019 Mathematical Modeling of Transport and Reaction in Cellular and T
http://slidepdf.com/reader/full/mathematical-modeling-of-transport-and-reaction-in-cellular-and-t 1/270
Te Florida State University
DigiNole Commons
Electronic eses, Treatises and Dissertations e Graduate School
6-28-2005
Mathematical Modeling of Transport and Reactionin Cellular and Tissue Engineering
Pragyansri PathiFlorida State University
Follow this and additional works at: hp://diginole.lib.fsu.edu/etd
is Dissertation - O pen Access is brought to you for free and open access by the e Graduate School at DigiNole Commons. It has been accepted for
inclusion in Electronic eses, Treatises and Dissertations by an authorized administrator of DigiNole Commons. For more information, please contact
Recommended CitationPathi, Pragyansri, "Mathematical Modeling of Transport and Reaction in Cellular and Tissue Engineering" (2005). Electronic eses,
Treatises and Dissertations. Paper 2137.

7/27/2019 Mathematical Modeling of Transport and Reaction in Cellular and T
http://slidepdf.com/reader/full/mathematical-modeling-of-transport-and-reaction-in-cellular-and-t 2/270
THE FLORIDA STATE UNIVERSITY
FAMU-FSU COLLEGE OF ENGINEERING
MATHEMATICAL MODELING OF TRANSPORT AND
REACTION IN CELLULAR AND TISSUE ENGINEERING
By
Pragyansri Pathi
A Dissertation submitted to the
Department of Chemical and Biomedical Engineering
in partial fulfillment of the
requirements for the degree of
Doctor of Philosophy
Degree Awarded:
Summer Semester, 2005
Copyright © 2005
Pragyansri Pathi
All Rights Reserved
7/27/2019 Mathematical Modeling of Transport and Reaction in Cellular and T
http://slidepdf.com/reader/full/mathematical-modeling-of-transport-and-reaction-in-cellular-and-t 3/270
ii
The members of the Committee approve the dissertation of Pragyansri Pathi defended on 06-28-
2005.
Bruce R. Locke
Professor Directing Dissertation
Timothy S. Moerland
Outside Committee Member
Teng Ma
Committee Member
Kevin Chen
Committee Member
Approved:
Bruce R. Locke, Chairperson, Department of Chemical and Biomedical Engineering
Ching-Jen Chen, Dean, College of Engineering
The Office of Graduate Studies has verified and approved the above named committee members.

7/27/2019 Mathematical Modeling of Transport and Reaction in Cellular and T
http://slidepdf.com/reader/full/mathematical-modeling-of-transport-and-reaction-in-cellular-and-t 4/270
iii
To
Nana & Mama
7/27/2019 Mathematical Modeling of Transport and Reaction in Cellular and T
http://slidepdf.com/reader/full/mathematical-modeling-of-transport-and-reaction-in-cellular-and-t 5/270
iv
ACKNOWLEDGEMENT
First and foremost, I would like to thank my advisor, Dr Bruce R Locke for giving me this
exciting and challenging opportunity. Throughout the last four years, he has been a constant
source of guidance, support, insight and inspiration, and has often had more faith in me than I
myself! I thank him for his generous time and commitment. Words are not enough to express
my deepest sense of gratitude and respect I feel for him.
I appreciate the opportunity for having an exceptional doctoral committee and wish to thank
them for their valuable suggestions, and support: Dr Timothy S. Moerland, for sharing his
biological expertise on muscle project; Dr Teng Ma, for discussions and experimental support on
tissue engineering projects; and, Dr Kevin Chen, for his support and encouragement. Each of
them, in their own way, helped make this a valuable learning experience.
This work would not have been complete without the enthusiastic support of my collaborators. I
am greatly indebted to Dr Stephen Kinsey and his students at the University of North Carolina,
Wilmington. Their experimental results and countless discussions have made the crustacean
muscle metabolic modeling part of my research successful. I thank Dr Feng Zhao for all the
experimental support and helpful discussions on the tissue engineering model development. I am
also thankful to Dr Craig J Galban and Dr Richard Spencer of National Institute of Health for
their suggestions on cartilage tissue modeling section in my work. I have to also thank
COMSOL Support group for their prompt responses concerning the use of FEMLAB.
7/27/2019 Mathematical Modeling of Transport and Reaction in Cellular and T
http://slidepdf.com/reader/full/mathematical-modeling-of-transport-and-reaction-in-cellular-and-t 6/270

7/27/2019 Mathematical Modeling of Transport and Reaction in Cellular and T
http://slidepdf.com/reader/full/mathematical-modeling-of-transport-and-reaction-in-cellular-and-t 7/270
vi
TABLE OF CONTENTS
LIST OF TABLES………………………………………………………………………... x
LIST OF FIGURES……………………………………………………………………….. xi
ABSTRACT……………………………………………………………………………….xviii
Page
1 Introduction 1
PART I : MATHEMATICAL MODELING OF TISSUE GROWTH IN
REACTOR STYSTEMS9
PART I (A) Role of Nutrient Supply and Product Formation on Cell
Growth in Bioreactor Design for Tissue Engineering of Hematopoietic Cells9
2 Background and Literature Review 9
2.1 Introduction 9
2.2 Process of Hematopoiesis 10
2.3 Bone Marrow Microenvironment 112.4 HSC Culture 11
2.4.1 Need for culture and potential applications 112.4.2 Culture conditions that affect cell expansion 122.4.3 System for expansion of hematopoietic cells 17
2.5 Mathematical Modeling 232.5.1 Motivation 23
2.5.2 Need for modeling hematopoietic system 24
2.5.3 Available mathematical Models 242.5.3.1 Krogh’s model 25

7/27/2019 Mathematical Modeling of Transport and Reaction in Cellular and T
http://slidepdf.com/reader/full/mathematical-modeling-of-transport-and-reaction-in-cellular-and-t 8/270
vii
2.5.3.2 Palsson’s perfusion bioreactor model 29
2.5.3.3 Grooved perfusion bioreactor model 332.5.3.4 Population balance model 37
2.6 Introduction to Method of Volume Averaging 41
3 Analysis of oxygen supply on granulocyte progenitor cell growth in3-dimensional perfusion bioreactor
45
3.1 Problem Statement 45
3.2 Model Formulation 463.2.1 Reactor design 46
3.2.2 Mathematical model 46
3.2.2.1 Model equations 47
3.2.2.2 Solution procedure 573.2.2.3 Macroscopic area averaging 57
3.2.2.4 Fixed oxygen concentration model 58
3.2.2.5 Well-Mixed bioreactor model 59
3.3 Results and Discussion 603.4 Conclusions 83
4 Analysis of glucose and oxygen supply and by-product (lactate)
concentration on progenitor and mature cells in 3-dimensional well-
mixed reactor
85
4.1 Introduction 85
4.2 Literature Review 87
4.2.1 Model factors 87
4.2.1.1 Effect of glucose supply on cell growth in the 3-dimesional perfusion bioreactor
87
4.2.1.2 Effect of lactate production on cell growth in the 3-dimensional perfusion bioreactor 89
4.2.1.3 Multiple cell population 93
4.2.1.4 Geometry of cell layer in the bioreactor 94
4.2.1.5 Local 3-dimensional cell geometry 94
4.2.2 Model equations 96
4.2.3 Parameter estimation 101
4.2.4 Preliminary results on Well-Mixed Bioreactor Model 109
4.3 Conclusions 1114.4 Recommendations for Future Work 112
PART I (B) Effects of Oxygen Transport on 3-dimensional Human
Mesenchymal Stem Cell Tissue Development in Perfusion and Static
Cultures
114
5 5.1 Problem Statement 114
5.2 Reactor Designs 115
5.3 Experimental Data 116

7/27/2019 Mathematical Modeling of Transport and Reaction in Cellular and T
http://slidepdf.com/reader/full/mathematical-modeling-of-transport-and-reaction-in-cellular-and-t 9/270
viii
5.4 Mathematical Model Development 116
5.4.1 Model equations perfusion reactor (Unit 1) 118
5.4.2 Model equations static culture (Unit 2) 119
5.4.3 Parameter estimation 121
5.4.4 Solution procedure 123
5.5 Results and Discussion 124 5.6 Conclusions 129
PART I (C) Analysis of Cartilage Tissue Growth and Extracellular Matrix
Formation Ex Vivo in Hollow Fiber Bioreactor130
6 6.1 Introduction 130
6.2 Methodology 134
6.2.1 Experimental Data 1346.2.2 Model Formulation 134
6.2.2.1 Outline 1346.2.2.2 Model equations 137
6.2.3 Note on parameters 1566.2.4 Sensitivity analysis formulation 157
6.2.5 Solution procedure 157
6.3 Results and Discussion 1586.4 Conclusions 178
PART II METABOLIC MODELING OF MUSCLE METABOLISM 179
7 7.1 Introduction 179
7.2 Current Modeling Objectives 181
7.3 Model Formulation 1857.3.1 Model schematic 185
7.3.2 Model reactions 187
7.3.3 Model equations 192
7.3.4 Parameter estimation 1957.3.5 Solution procedure 197
7.4 Results 197
7.5 Discussion 2047.6 Future Recommendation 210
8 Summary 213
Appendix A: List of Parameters Used in Chapter 3 219
Appendix B: List of Parameters Used in Chapter 4 221
7/27/2019 Mathematical Modeling of Transport and Reaction in Cellular and T
http://slidepdf.com/reader/full/mathematical-modeling-of-transport-and-reaction-in-cellular-and-t 10/270
ix
Appendix C: List of Parameters Used in Chapter 5 225
Appendix D: Experimental Data (Potter et al., 1998) Used for Model
Validation in Chapter 6227
Appendix E: List of parameters Used for Model Development in Chapter 6 228
Appendix F: Computation of Average Radii of Free Space for Water
Diffusion in ex vivo Cartilage Culture in HFBR 231
Appendix G: List of Parameters Used in Chapter 7 233
Appendix H: Permission from John Wiley & Sons, Inc. 235
References 236
Bibliographical Sketch 250

7/27/2019 Mathematical Modeling of Transport and Reaction in Cellular and T
http://slidepdf.com/reader/full/mathematical-modeling-of-transport-and-reaction-in-cellular-and-t 11/270
x
LIST OF TABLES
Table Description Page
2. 1 Bioreactors most frequently used for the culture of hematopoietic stemcells (HSCs) (Cabrita et al ., 2003) 23
4. 1 Experimental results of cell numbers from Yan et al ., 2001 102
4. 2 Experimental result of lactate concentration from Yan et al ., 2001 103

7/27/2019 Mathematical Modeling of Transport and Reaction in Cellular and T
http://slidepdf.com/reader/full/mathematical-modeling-of-transport-and-reaction-in-cellular-and-t 12/270
xi
LIST OF FIGURES
Figure Description Page
2. 1 Structure of the Hematopoietic system. All cell types above the dottedline are found in the BM and all the cells below (the mature blood cells)
are found in the circulating PB
12
2. 2
Bioreactors more frequently used for the culture of hematopoietic stem
cells: (a) perfusion chamber; (b) grooved surface of perfused chamber; (c)
stirred tank; (d) air-lift fixed bed; and (e) fixed bed or fluidized bed bioreactor (Cabrita et al ., 2003)
22
2.3 Graphical representation of the Kroghian model (Chow et al., 2001 a) 26
2. 4 Two-dimensional schematic diagram of a radial flow perfusion bioreactor 30
2. 5
Model of a flat bed perfusion bioreactor system with a series of grooves to
retain cells in the presence of constant perfusion. This is a closed system
with no headspace. Medium flows in the z direction across the chamber.
y’ and z’ represent the local co-ordinate system in a cavity (Horner et al.,1998)
34
2. 6 Three models of specialization (Nielsen et al ., 1998) 39
2. 7Graphical representation of heterogeneous tissue slice (method of volume
averaging)42
3. 1 Schematic of perfusion bioreactor model (Florida State University) 47
3. 2 Non-dimensional oxygen concentration (in color) varying in space atnearly 15 days (13*10
5s) in the perfusion bioreactor. Parameters: T =0.6
cm; l =0.06cm; res_time=1hr; F =4.17*10-3 cm3/s; vavg =2.8*10-3
cm/s
62
3. 3
Macroscopically averaged oxygen consumption by metabolism (<mm>)
and for cell growth (< growth_o> at various times. Parameters: T =0.6 cm;l =0.06cm; res_time = 1hr; F =4.17*10-3 cm3/s; vavg =2.8*10
-3cm/s
63

7/27/2019 Mathematical Modeling of Transport and Reaction in Cellular and T
http://slidepdf.com/reader/full/mathematical-modeling-of-transport-and-reaction-in-cellular-and-t 13/270
xii
3.4 aSpatial variation in non-dimensional oxygen concentration in the celllayer at nearly 15 days (13*10
5s)
64
3. 4 b Simulated growth in the cell layer at nearly 15 days (13*105
s) 64
3. 5
Macroscopically averaged flux of oxygen through the FEP membrane and
through flow variation with time. Parameters T =0.6 cm; l =0.06cm;res_time=1hr; F =4.17*10-3 cm3/s; vavg =2.8*10
-3cm/s
65
3.6 a
Simulated macroscopically averaged oxygen concentrations in the celllayer (matrix) and the liquid layer for varying liquid layer heights (T) at
different times. Parameters T =0.6 –0.3 cm; l =0.06cm; res_time = 1hr;
F =2.08 *10-3
cm3/s- 4.17*10
-3cm
3/s; vavg = 2.8*10
-3cm/s
67
3.6 bSpatially averaged cell growth for various liquid layer heights at differenttime. Parameters T =0.6 –0.3 cm; l =0.06cm; res_time = 1hr; F =2.08 *10
-
3cm
3/s- 4.17*10
-3cm
3/s; vavg = 2.8*10
-3cm/s
68
3. 6 c Simulated fluxes through the membrane with time. Parameters: T =0.6 – 0.3 cm; l =0.06cm; res_time=1hr; F =2.08 *10-3
cm3/s- 4.17*10
-3cm
3/s; vavg
= 2.8*10-3
cm/s69
3.7 a
Simulated average oxygen concentration and averaged cell volume
fraction in the cell layer of the bioreactor with time. Parameters T =0.6cm; l =0.06cm; res_time = 0hr-2hr; F =0 cm
3/s- 8.33*10
-3cm
3/s; vavg =
2.8*10-3
cm/s
70
3. 7 bSpatial variation in cell volume fraction in the cell layer at nearly 15 days(13*10
5s) for different residence times and correspondingly different
flow rates ( F )
71
3.8 a
The effect of different modes of oxygen supply on the averaged oxygenconcentration in the cell layer and the cell volume fraction. Parameters:
T =0.3 cm; l =0.06cm; res_time=1hr; c gas chamber =1; cin_flow=1; F = 2.083*10-3
cm3/s; vavg = 2.8*10
-3cm/s
72
3.8 b
The effect of different modes of oxygen supply on the averaged oxygenconcentration in the cell layer and the cell volume fraction. Parameters:
T =0.4 cm; l =0.06cm; res_time=1hr; c gas chamber =1; cin_flow=1; F = 2.8*10-3
cm3/s; vavg = 2.8*10
-3cm/s
73
3. 8 c
The effect of different modes of oxygen supply on the averaged oxygenconcentration in the cell layer and the cell volume fraction. Parameters:
T =0.6 cm; l =0.06cm; res_time=1hr; c gas chamber =1; cin_flow=1; F = 4.17*10-3
cm3/s; vavg = 2.8*10-3
cm/s
74
3.9 a
Oxygen concentration variation with time in a mixed bioreactor under
different oxygen supply conditions with different membrane permeability,km and medium flow rates ( Perm=1.343*10
-4cm/s known value of
permeability of the FEP membrane, F =4.17*10-3
cm3/s)
78
7/27/2019 Mathematical Modeling of Transport and Reaction in Cellular and T
http://slidepdf.com/reader/full/mathematical-modeling-of-transport-and-reaction-in-cellular-and-t 14/270
xiii
3. 9 bCell volume fraction variation with time in a mixed bioreactor under different oxygen supply conditions with different membrane permeability,
km and medium flow rates ( Perm=1.343*10-4
cm/s, F=4.17*10-3
cm3/s)
79
3.10 aSimulation of average oxygen concentration in the cell layer for variousmodes of oxygen supply with time. Parameters: T =0.6 cm; l =0.06cm;
res_time = 1hr; F = 4.17*10-3 cm3/s; vavg = 2.8*10-3 cm/s
80
3. 10 b
Effect of mode of oxygen supply on cell volume fraction of granulocyte
progenitors at different times. Parameters: T =0.6 cm; l =0.06cm; res_time = 1hr; F = 4.17*10
-3cm
3/s; vavg = 2.8*10
-3cm/s
81
4. 1Schematic of a proposed grooved matrix (cell layer) of the bioreactor (Florida State University)
94
4. 2 Schematic of cell proliferation and differentiation process 97
4.3 Bioreactor schematic showing continuous flow of oxygen 97
4.4 a
Increase in progenitor cells (group 1) and post-progenitor cells (group 2)over culture time in 3-dimensional batch culture. Modeling results (solidline) compared to available experimental data (dots) from Yan et al ., 2001
shown in Table 4.1
104
4.4 b Lactate concentration in 3-dimensional batch culture 105
4.4 c
Fold increase in Lactate concentration in 3-dimensional batch culture.
Modeling results (solid line) compared to available experimental data
(dots) from Yan et al ., 2001 shown in Table 4.2
105
4.4 d Glucose concentration in 3-dimensional batch culture 106
4. 4 e Oxygen in 3-dimensional batch culture 106
4.5 a
Increase in progenitor cells (group 1) and post-progenitor cells (group 2)
over culture time in 3-dimensional batch culture using new kinetic
expression for anaerobic metabolism shown in equation 4.15. Modelingresults (solid line) compared to available experimental data (dots) from
Yan et al ., 2001 shown in Table 4.1.
108
4. 5 b
Fold increase in lactate concentration in 3-dimensional batch culture using
new kinetic expression for anaerobic metabolism shown in equation 4.15.
Modeling results (solid line) compared to available experimental data
(dots) from Yan et al ., 2001 shown in Table 4.2
108
4.6 a
Increase in progenitor cells (group 1) and post-progenitor cells (group 2)
over culture time in 3-dimensional well-mixed perfusion bioreactor
system. Model parameters used are discussed in Appendix B.
109
4.6 bLactate concentrations in 3-dimensional well-mixed perfusion bioreactor
system. Model parameters used are discussed in Appendix B.110

7/27/2019 Mathematical Modeling of Transport and Reaction in Cellular and T
http://slidepdf.com/reader/full/mathematical-modeling-of-transport-and-reaction-in-cellular-and-t 15/270
xiv
4.6 cGlucose concentrations in 3-dimensional well-mixed perfusion bioreactor system. Model parameters used are discussed in Appendix B.
110
4. 6 d
Oxygen concentrations in 3-dimensional well-mixed perfusion bioreactor
system. Model parameters used are discussed in Appendix B. Oxygenconcentration increases to a non-dimensional value of one and reaches a
steady state.
111
5. 1Schematic of the Culture units (a) Perfusion Reactor (Unit 1) (b) Static
Culture (Unit 2)117
5. 2Growth kinetics of hMSCs under (a) static and (b) perfusion conditions.
Cell density is expressed in cells/ml.122
5. 3Experimental results of the specific oxygen consumption rate (opendiamond) throughout the culture period and polynomial fit for model
development (solid line)
123
5.4 a Mathematical simulation of the spatio-temporal variation of oxygenconcentration in the cell layer of the perfusion bioreactor Unit 1 125
5.4 bMathematical simulation of the spatio-temporal variation of oxygen
concentration in the bulk liquid layer of the perfusion reactor Unit 1126
5. 4 cMathematical simulation of the spatio-temporal variation of oxygen
concentration in the cell layer and bulk liquid layer in static culture Unit 2127
5. 5Average non-dimensional oxygen concentration variations in cell layer
with time for static and perfusion culture units127
6. 1Schematic of the reactor showing the idealized single hollow fiber with
cells growing radially from the outer walls of the hollow fiber 136
6. 2Schematic of the averaging volume showing the cell phase and details of
the extracellular matrix.138
6. 3Model-data comparison for the growth of cells (ε c=V c /V ) with time(Experimental error bars obtained using error percentage of 5%)
160
6. 4Model-data comparison for total Collagen mass (g) in the reactor with
time (Experimental error bars obtained using error percentage of 5%)160
6. 5Model-data comparison for total GAG mass (g) in the reactor variationwith time (Experimental error bars obtained using error percentage of 5%)
161
6. 6
Model-data comparison for total number of cells in the reactor (around all
6 fibers), [nc] with time (Experimental error bars obtained using error
percentage of 5%)
161
6. 7 Non-dimensional nutrient concentration (µ) variation with time 162
6.8 a Effective diffusion coefficient of oxygen ( Deff ) in the reactor 165
7/27/2019 Mathematical Modeling of Transport and Reaction in Cellular and T
http://slidepdf.com/reader/full/mathematical-modeling-of-transport-and-reaction-in-cellular-and-t 16/270
xv
6. 8 b Effective diffusion coefficient of water ( Deff w) in the reactor 166
6. 9
Model-data comparison for normalized diffusion coefficient of water in
cartilage construct in HFBR (appDeff = Deff w /Dl ) where Deff
wis the
effective diffusion coefficient of water in cartilage tissue, Dl is thediffusion coefficient of water in cartilage free constructs (Experimental
error bars obtained using error percentage of 5%)
166
6. 10Model-data comparison for effective relaxation constant [T1eff ] variation
with time (Experimental error bars obtained using error percentage of 5%)167
6.11 a Validity test for the quasi-steady state assumption (Equation 6.14 a) 167
6. 11 bValidity test of Equation 6.14 b showing that the nutrient consumption
rate is small relative to diffusion during the 4 weeks of culture168
6.12 a
Normalized Sensitivity of Collagen volume fraction with varying model
parameters as a function of time; sensitivity highest to collagen
production parameters
170
6.12 b Normalized Sensitivity of GAG volume fraction with varying model parameters as a function of time; sensitivity highest to GAG production
parameter
170
6.12 c
Normalized Sensitivity of cell number with varying model parameters as a
function of time; sensitivity highest to cell proliferation and cell growth
parameters
171
6.12 d Normalized Sensitivity of cell volume fraction with varying model parameters as a function of time; sensitivity highest to cell growth and
proliferation parameters
171
6.12 e
Normalized Sensitivity of nutrient concentration with varying model
parameters as a function of time; sensitivity highest to cell proliferation,first order oxygen consumption rate and oxygen binding parameters
172
6.12 f
Normalized Sensitivity of effective oxygen diffusion coefficient in the
reactor with varying model parameters as a function of time; sensitivityhighest to oxygen GAG binding coefficient and the GAG production rate
172
6.12 g
Normalized Sensitivity of water diffusion coefficient in the reactor with
varying model parameters as a function of time; sensitivity highest towater GAG binding coefficient and GAG production rate coefficient
173
6. 12 h
Normalized Sensitivity of NMR effective relaxation coefficient in the
reactor with varying model parameters as a function of time; sensitivityhighest to water GAG binding coefficient, GAG production rate
coefficient, cell growth and proliferation parameters
173
6.13 a
Cartilage tissue growth over time obtained by the use of modified Contois
function with respect to nutrient concentration and no dependence on cellnumber (as shown by the equation in case 1). Model results are shown
174

7/27/2019 Mathematical Modeling of Transport and Reaction in Cellular and T
http://slidepdf.com/reader/full/mathematical-modeling-of-transport-and-reaction-in-cellular-and-t 17/270
xvi
by solid line and experimental results in dots.
6.13 b
Cartilage tissue growth over time obtained by the use of modified Contois
function with respect to nutrient concentration and 1st
order dependence
on cell number (as shown by the equation in case 2).
174
6.13 cCartilage tissue growth over time obtained by the use of modified Contoisfunction with respect to nutrient concentration and 3
rdorder dependence
on cell number (as shown by the equation in case 3).
175
6.13 d
Cartilage tissue growth over time obtained by the use of modified Contois
function with respect to nutrient concentration and 1st
order inverse
(inhibitory) dependence on cell number (as shown by the equation in case4).
175
6.13 e
Cartilage tissue growth over time obtained by the use of modified Contois
function with respect to nutrient concentration and no dependence on cell
number (as shown by the equation in case 5).
176
6.13 f Cartilage tissue growth over time obtained by the use of modified Contoisfunction with respect to nutrient concentration and 1
storder dependence
on cell number (as shown by the equation in case 6).
176
6. 13 gCartilage tissue growth over time obtained by the use of modified Contoisfunction with respect to nutrient concentration and 2
ndorder dependence
on cell number (as shown by the equation in case 7).
177
7. 1
(A) Cross-sectional view of a muscle fiber cell. Packs of myofibrils,mitochondria, Sarcoplasmic Reticulum and the cell membrane or
Sarcolemma also shown. (B) One-dimensional schematic of the intra-
mitochondrial spacing as used for model development.
186
7. 2
One-dimensional schematic of the intra-mitochondrial spacing as used for
model development showing the various reactions occurring in the
myofibrilar region (bulk) and in the mitochondria (surface). Arginine
Kinase (AK) mediates ATP-equivalent flux in Crustacean muscle. (A)Reactions and diffusion distance in small white fibers of juvenile crabs
(B) Reaction and diffusion distances over hundreds of microns in large
white fibers of adult crab. Anaerobic glycogenolysis is believed to occur following contraction in large fibers, presumably to speed up phases of
the recovery process. [Johnson et al ., 2004]
190
7. 3Relative changes in AP and Pi concentrations in small (filled symbols)and large (open symbols) light levator fibers during a contraction-
recovery cycle. [ N ≥ 5 for every point]. (Experimental results from Dr
Kinsey’s Laboratory, University of North Carolina, Wilmington)
199
7. 4
Model output for small light levator fibers using parameters in Appendix
G assuming a uniform distribution of mitochondria. The temporally- andspatially-resolved concentrations of AP, Pi, ATP and ADP during a
200

7/27/2019 Mathematical Modeling of Transport and Reaction in Cellular and T
http://slidepdf.com/reader/full/mathematical-modeling-of-transport-and-reaction-in-cellular-and-t 18/270
xvii
contraction-recovery cycle are shown (Arg is not shown, but itsconcentration changes in reciprocal fashion to that of AP). [V mmtio = 1.9e-
17 mmoles/micron2.s: 5 Hz frequency with 50% duty, 7s Stimulation,
Mesh points: 120 pts, Time Step: 0:0.1:7, 8:1:99, 100:100:8000s]
7. 5
Model output for large light levator fibers using parameters in Appendix
G assuming only subsarcolemmal mitochondria. The temporally- andspatially-resolved concentrations of AP, Pi, ATP and ADP during a
contraction-recovery cycle are shown (Arg is not shown, but itsconcentration changes in reciprocal fashion to that of AP). Arrows
indicate the mild spatial gradients seen in the concentration 3-dimensional
profiles. [V mmtio = 1.67*10-15
mmoles/micron2.s: 5 Hz frequency with50% duty, 7s Stimulation, Mesh points: 120 pts, Time Step – 0:0.1:7,
8:1:99, 100:100:8000s]
201
7. 6
Measured AP recovery (symbols) compared to the volume averaged
model of AP recovery (solid line) in small (top) and large (bottom) fibers.
The measured AP data has been normalized to a resting concentration of 34.3 mM to coincide with that of the model. In the model, the myosin
ATPase was activated long enough to cause a decrease in AP that was
comparable to the measured data. The dotted line indicates the resting
concentration.
202
7. 7
The effect of increasing the rate of mitochondrial ATP production in large
fibers on the temporal and spatial profiles of AP (left panels) and ATP
(right panels) concentration. All parameters are the same as in Figure 7.5,
except that the V mmito has been increased over the value used in Figure 7.5 by 2-fold (A), 10-fold and (B), and 100-fold (C).
[V mmtio = 1.67*10-15
mmoles/micron2.s: 5 Hz frequency with 50% duty, 7s
Stimulation, Mesh points: 120 pts, Time Step – 0:0.1:7, 8:1:99,100:100:8000s]
205
7. 8
Model output for dark levator fibers using parameters in Appendix G.
The temporally- and spatially-resolved concentrations of AP, Pi, ATP and
ADP during a contraction-recovery cycle are shown (Arg is not shown, but its concentration changes in reciprocal fashion to that of AP). Mild
spatial gradients are seen in the concentration 3-dimensional profiles.
[V mmtio = 1.67*10-15
mmoles/micron2.s: 1 Hz frequency with 50% duty,30s Stimulation, Mesh points: 120 pts, Time Step - 0:0.01:30, 31:1:99,
100:50:600s]
206

7/27/2019 Mathematical Modeling of Transport and Reaction in Cellular and T
http://slidepdf.com/reader/full/mathematical-modeling-of-transport-and-reaction-in-cellular-and-t 19/270
xviii
ABSTRACT
Tissue engineering is a rapidly developing field seeking to solve biomedical problems which
have a wide-range of clinical applications. Bioreactor cultures have been shown to be essential
for improving the functional properties of the tissue engineered constructs. However, the major obstacle to-date for the generation of functional tissues in these reactors for wide-spread clinical
use is the limited understanding of the regulatory role of specific physicochemical culture
parameters on tissue development. Not only is the cellular environment within and around the
constructs ill defined, but the complex cellular responses to this environment are also not fully
understood. In this context, computational methods can serve as a valuable tool to facilitate
better understanding of the underlying mechanisms governing physical, chemical, and biological
processes in a 3-dimensional culture environment. These methods can also be used to correlate
the cell and tissue behavior to changes in global biochemical bioreactor inputs.
These concepts are illustrated in the present work by three distinct tissue engineering
applications – hematopoietic cell expansion in a perfusion bioreactor, human mesenchymal stem
cell expansion in perfusion and static culture units, and cartilage tissue formation in hollow fiber
bioreactors. Material balances with mass transport and chemical reaction of nutrient
consumption and product formation are coupled with cell growth, differentiation and
extracellular matrix formation in 3-dimensional constructs to determine the effects of transport
limitations on cell behavior. The method of volume averaging is used for the determination of
the effective diffusion and reaction terms in the species continuity equations in terms of local
geometry and spatial restrictions in these multiphase systems. The volume averaged equations

7/27/2019 Mathematical Modeling of Transport and Reaction in Cellular and T
http://slidepdf.com/reader/full/mathematical-modeling-of-transport-and-reaction-in-cellular-and-t 20/270
xix
are thereafter solved over the macroscopic dimensions of the reactor to assess system
performance. This study has the potential to improve tissue engineered functional constructs.
These tissue engineering model development applications considered the cellular processes in
terms of net kinetic expressions linked to changes in macroscopic environmental parameters. In
order to understand and incorporate a complete model framework an understanding of processes
at the cellular level is also essential. To do so, in the second major part of this project, the
muscle cell was chosen for study of metabolic processes in terms of production, transport,
conversion and utilization of metabolite species. It is known that in a muscle cell many cellular
compartments, chemical species, enzymes, biochemical reactions, metabolic pathways, and
control mechanisms interact with each other simultaneously to maintain homeostasis of the most
important energy delivering metabolite, ATP. A reaction-diffusion model of phosphorous
metabolites involved in various metabolic pathways in the muscle was shown to provide a
suitable framework for the study of diffusion, reaction, and metabolic organization. This
metabolic study is intended to understand the interactions between metabolism and cell structure.
The current study is a first step towards an overall goal of setting up a rationale for cellular
design for attaining a desired cell function.
7/27/2019 Mathematical Modeling of Transport and Reaction in Cellular and T
http://slidepdf.com/reader/full/mathematical-modeling-of-transport-and-reaction-in-cellular-and-t 21/270
1
CHAPTER 1
INTRODUCTION
“From an engineering perspective the human body is one of the most interesting and challenging
“systems” to study and describe.”- David Hawkins, PhD
“Biomechanics of musculoskeletal tissues”, University of California
Biological systems are inherently complex due to the presence of many reacting chemical
species in multiphase environments. The art of mathematical modeling is to unravel this
complexity by identifying the key features of a given system. This is done by deriving equations
based on the fundamental principles of conservation of mass, energy, and momentum, which
govern system behavior. Using various mathematical techniques and computer simulations,
these equations can be solved over a wide range of physiological parameter values, thereby
generating predictions that can be tested in the laboratory (Wastney, 1998; Green, 2003). The
focus of the present research is to develop these types of theoretical models which, when
integrated with experimental results in a mutually iterative framework, can quantitatively explain
the underlying mechanisms governing physical, chemical, and biological processes. These
models would help to estimate parameters and variables that cannot be measured directly by
experiments, to test proposed hypotheses and previously observed relationships, to address the
experimental design issues, and to develop increasing insight and understanding of the system
itself, thereby opening up new avenues for research.

7/27/2019 Mathematical Modeling of Transport and Reaction in Cellular and T
http://slidepdf.com/reader/full/mathematical-modeling-of-transport-and-reaction-in-cellular-and-t 22/270
2
Tissue engineering is an exciting new field that uses an engineering approach to solve biological
problems with clinical significance. In the past decade, tissue engineering has emerged as a
viable alternative to solve the problem of organ and tissue shortage. Tissue engineering aims to
develop biological substitutes that can restore, maintain, or improve tissue function (Skalak and
Fox, 1991). The engineered tissue, or construct, usually consists of 3-dimensional polymer
scaffolds containing living cells in an environment with desired structure and functionality. The
constructs are cultured in bioreactors designed for specific purposes that provide the chemical
and mechanical environments well suited for cell proliferation and differentiation.
‘Tissue engineering: mathematical models are helping to take tissue engineering from concept to
reality’ (McArthur et al., 2005). The focus of my work is to develop mathematical models for
cell growth and overall tissue formation in cell culture reactors in order to build a quantitative
platform to analyze and integrate the information on events occurring at the cellular level to their
macroscopic environment. In general, this work attempts to develop predictive tools, which
would link the cell population response to the external environment using the fundamental
principles of transport phenomena and cell biology. These concepts are illustrated in the present
work by three distinct tissue engineering applications – hematopoietic cell expansion in
perfusion bioreactor, human mesenchymal stem cell expansion in different kinds of culture units,
and cartilage tissue formation in hollow fiber bioreactors; and also in the cellular metabolic
modeling of the muscle metabolism intended to understand the interactions between metabolism
and cell structure.
The first three chapters (Chapter 2, 3, 4) of the thesis focus on my work on large scale ex vivo
expansion of lymphohematopoietic cells in bioreactors. Hematopoiesis is the process of
formation and development of blood cells. In the body these hematopoietic cells (HCs) grow
and differentiate in the 3-dimensional bone marrow (BM) microenvironment made up of various
stromal cells, extracellular matrix (ECM) proteins, and an array of soluble and ECM-bound
growth factors (Mantalaris et al ., 1998; Li et al ., 2001). Ex vivo expansion of these cells in order
to reconstitute a functioning bone marrow is a rapidly developing area and has broad range of
biomedical applications (Cabrita et al., 2003; Palsson et al., 1993).
7/27/2019 Mathematical Modeling of Transport and Reaction in Cellular and T
http://slidepdf.com/reader/full/mathematical-modeling-of-transport-and-reaction-in-cellular-and-t 23/270
3
Traditional static culture systems such as T-flasks and gas permeable bags (Damas et al ., 1999)
have been widely used for expanding HCs since the pioneering work of Dexter (Cabrita et al .,
2003). However, these culture systems are inherently 2-dimensional and therefore are unable to
replicate the in-vivo BM microenvironment. The 2-dimensional culture does not promote proper
cell-cell interactions and cell-ECM interactions, thus leading to lower cell growth (Nielsen et al.,
1988; Li et al ., 2001; Wang and Wu, 1992). For long term production of these cells, 3-
dimensional culture systems incorporated within various bioreactors have been studied (Horner
et al ., 1998; Cabrita et al ., 2003; Koller et al ., 1993 a; Hevehan et al., 2000; Collins et al., 1998;
Mantalaris et al., 1998; Wang and Wu, 1992). For example, static culture systems have been
replaced extensively with spinner flask bioreactor or perfusion systems to provide for better
control of the culture environment. These topics are discussed in detail in Chapter 2.
The most important factors necessary for control of cell growth in bioreactor systems include
pH, nutrient (dissolved oxygen, glucose) concentrations, and metabolic byproduct (lactate)
concentration (Koller et al., 1993(a, b, c); Oh et al ., 1994; Schwartz et al., 1991; Koller et al.,
1992). The effects of dissolved oxygen tension, lactate production, and pH have been
extensively studied for these cell types. However, there are very few studies that report on the
effect of glucose concentration on HC growth. In addition hematopoietic cultures, unlike any
other cell culture system, are very complex, due to the presence of multiple cell types co-existing
in culture, each with different rates of proliferation and differentiation and metabolic
requirements. Therefore, macroscopic changes observed in culture systems experimentally are
cumulative responses for all hematopoietic cell types existing in the culture. These different
cell types and the other important factors affecting the expansion of the former are carefully
outlined in Chapter 2 of the thesis.
The present work also deals with a novel 3-dimensional perfusion bench top bioreactor system
developed in Dr Teng Ma’s lab at Florida State University (Zhao et al ., 2005). The bioreactor
system is being used for lymphohematopoietic cell ex vivo expansion. One of the objectives of
the work reported in the present dissertation is to develop mathematical models to quantify the
immune lineage cell growth characteristics and macroscopic parameter changes over an extended
period of time in and around the 3-dimensional matrix of the bioreactor. The model is also
7/27/2019 Mathematical Modeling of Transport and Reaction in Cellular and T
http://slidepdf.com/reader/full/mathematical-modeling-of-transport-and-reaction-in-cellular-and-t 24/270
4
intended to provide a proper understanding of the physical parameters that govern cell growth
leading to the production of specific cell types in the reactor, which in turn, will help in
achieving the long term goal of scaling up the bench-top bioreactor system for clinical
applications.
Although there are a number of parameters as discussed that affect HC growth and the co-
existence of multiple cell types in reactor systems, as a first approach, the model discussed in
Chapter 3 of this dissertation deals with the growth of a single cell type, the granulocyte
progenitor cell, and one nutrient, oxygen, in this 3-dimensional perfusion bioreactor unit (Pathi et
al ., 2005). These cells were chosen because they occupy the major fraction of the BM
compartment (Chow et al ., 2001) and are the fastest growing HCs. They have the highest
metabolic rate of oxygen consumption in the BM, and thus they provide a limiting case to assess
the depletion of oxygen by cell growth and metabolism. This study can also be used to
determine an upper limit to oxygen limitations in these culture systems. Moreover, these cells
mature into neutrophils, which have a limited life span of only 48 hours, thereby forming the first
line of defense against microbial invasion (Hevehan et al ., 2000), and hence ex vivo large scale
production of this cell type is required.
Various mathematical models have been developed using the population balance approach to
account for HC self-renewal, cellular differentiation into mature cells, and cell death (Nielsen et
al ., 1988; Silva et al ., 2003; Hevehan et al ., 2000; Abkowitz et al ., 2000; Peng et al ., 1996).
Models of spatial distribution of HCs in the bone marrow hematopoietic compartment have also
been developed (Chow et al ., 2001). However, these developed models are discrete, and they do
not account for cell growth dependence on culture parameters such as oxygen tension. The
dynamic model proposed in Chapter 3 is intended to provide quantitative estimates of the oxygen
consumption for granulocyte progenitor cell growth and metabolism thus relating macroscopic
changes to cellular events using basic physiological principles. Molar balances describing
oxygen consumption and cell growth are solved using the volume averaging approach (Whitaker,
1999). The method of volume averaging has been extensively used to study transport and
reaction in multiphase systems for various chemical engineering problems (Carbonell and
Whitaker, 1984). This method allows for the determination of the effective diffusion and

7/27/2019 Mathematical Modeling of Transport and Reaction in Cellular and T
http://slidepdf.com/reader/full/mathematical-modeling-of-transport-and-reaction-in-cellular-and-t 25/270
5
reaction terms in the molar balances in terms of local geometry and spatial restrictions. This
model is extended in Chapter 4 by the addition of material balances accounting for the effects of
other nutrients such as glucose and by-product formation such as lactate on multiple cell types
coexisting in cultures. These computed macroscopic parameters and cell densities in the
bioreactor are used to assess the key bioreactor design parameters and to optimize the overall
reactor performance.
The second major application of mathematical model in tissue engineering is demonstrated in the
expansion of human mesenchymal stem cells (hMSCs) in various culture units. Experimental
data on hMSC growth-kinetics and spatial growth patterns, metabolism, and oxygen
consumption in various culture devices - static and perfusion units have been studied (Grayson et
al ., 2004; Zhao et al ., 2005 (a), (b)) to elucidate the effects of perfusion culture on cell growth
and tissue development. Convective oxygen transport was found to be important for enabling
and sustaining high cell growth rates, high cell density, and uniform growth pattern. In order to
reemphasize the significance of flow quantitatively in terms of oxygen delivery on hMSC
development, a dynamic mathematical model describing oxygen distribution in the static and
perfusion culture units is developed in the present dissertation. The model is based on the
principles of mass transport and reaction and provides estimates of the spatio-temporal oxygen
concentration profiles in the two units, which is difficult to measure experimentally. The
objective of this part of the work, however, is not to develop an a priori predictive model but to
use the developed model results on spatial oxygen concentrations along with the available
experimental data to help understand the role of oxygen transport on cell behavior (growth and
metabolism) in different culture units. The model and the results are given in detail in Chapter 5
of this dissertation.
The third major application of mathematical modeling in tissue engineering demonstrated in this
dissertation is in the area of the engineering of functional cartilage tissue substitutes. In vivo, in
mammals, cartilage is primarily found in the skeleton. It is present in small amounts in certain
viscera, e.g. in parts of the respiratory tract. Much of the skeletal cartilage is replaced by bone in
adults but some persists throughout life as articular, costal and nasal cartilage, for example. The
focus of the present study is articular cartilage - a thin layer of connective tissue located within

7/27/2019 Mathematical Modeling of Transport and Reaction in Cellular and T
http://slidepdf.com/reader/full/mathematical-modeling-of-transport-and-reaction-in-cellular-and-t 26/270
6
joints at the end of bones (Buckwalter et al ., 1997). This tissue is made up of relatively few
cartilage cells called chondrocytes, present in an extensively hydrated extracellular matrix
(ECM) made up of collagens and proteoglycans. Degeneration of this articular cartilage in the
body is seen to occur during osteoarthritis and joint injury. The limited capacity of the cartilage
tissue to respond to mechanical injury with a reparative process has motivated the incorporation
of cell-based repair approaches after articular cartilage lesions (Raimondi et al ., 2002). Tissue
engineering approaches can be thus used to design an in vitro cartilage tissue system to resemble
the in vivo system structurally and functionally. These in vitro systems can be used as functional
substitutes and also be used for systematic study of the process of chondrogenesis.
Cartilage tissue have been grown successfully in tissue culture bioreactors starting from
chondrocyte cells, either attached to biodegradable polymeric scaffolds in mixed flasks and
rotating wall bioreactors (Freed and Vunja-Novakovic, 2000b; Vunjak-Novakovic et al ., 1999)
or in the absence of scaffolds in hollow fiber bioreactors (Petersen et al ., 1997; Potter et al .,
1998; Ellis et al ., 2001). The morphology, composition and mechanical properties of these
constructs are strongly influenced by the microenvironment of the cell. Experimental studies
have shown mass transfer limited nutrients and/or oxygen supply in these cartilage culture
systems which are believed to govern the cell metabolic rates and tissue growth characteristics
(Vunjak-Novakovi et al ., 1996; Obradovic et al ., 1999). Thus, there have been several studies
dealing with development of functional cartilage constructs from chondrocyte cells seeded in 2-
dimensional T-flasks to 3-dimensional bioreactors in order to understand and optimize cartilage
tissue characteristics in vitro. To understand, and compile the large amounts of experimental
data and to further use this data for the rational design of tissue constructs a mechanistic
approach needs to be developed.
Additionally, to reach a stage of clinical applicability a definite need arises for improved control
over the functional properties and composition of the developed cartilage tissue engineered
constructs in culture units. Mathematical models can help to provide a better understanding of
the complex interplay among the array of factors that control the functional tissue development
(Sengers et al ., 2004). Models can be used to predict the spatio-temporal variations of the
concentration of many components involved affect construct composition, formation of new
7/27/2019 Mathematical Modeling of Transport and Reaction in Cellular and T
http://slidepdf.com/reader/full/mathematical-modeling-of-transport-and-reaction-in-cellular-and-t 27/270
7
tissue mass (cell and ECM) and the microenvironment around the cartilage cell. The model
developed in the present dissertation relates the kinetics of in vitro tissue formation to events
occurring at the cellular and molecular levels, and may potentially allow for enhanced design
through development of control strategies and may assist in engineered tissue optimization
(Williams et al ., 2002).
Spencer and coworkers (Petersen et al ., 1997; Potter et al ., 1998, 2000; Ellis et al , 2001) have
developed an in vitro 3-dimensional cartilage tissue model in a hollow fiber bioreactor (HFBR)
which permits a wide range of interventions and in which both biochemical and noninvasive
nuclear magnetic resonance spectroscopy and imaging studies (MRI, EPR Oxygen Mapping)
were performed (Potter et al ., 2000). HFBRs provide a more realistic diffusion barrier between
cells and nutrient supply and permit interaction between chondrocytes and their secreted ECM.
Like other 3-dimensional culture systems they support the chondrocyte phenotype and prevent its
dedifferentiation into fibroblasts (Ellis et al ., 2001).
The present study develops a mathematical model to study the cartilage tissue formation in this
hollow fiber bioreactor unit (Potter et al ., 1998). In this unit, cells are not grown in constructs
(compared to the study by Langer’s group). The cells are injected into the extracapillary space
of the reactor. They attach themselves onto the outer surface of the hollow fiber tubes or
capillaries. These cells then proliferate radially outwards in the space available. The moving
boundary approach (Galban and Locke, 1997) coupled with the method of volume averaging
(Whitaker, 1999) is utilized in the present work to simulate the experimental cell growth
patterns, as well as to account for transport and reaction in the reactor by determination of
effective diffusion and reaction terms for tissue formation in terms of local geometry and spatial
restrictions. The model was used to determine the tissue parameters and NMR measurable
parameters for comparison with available experimental results. The detailed modeling approach
is outlined in Chapter 6 of the dissertation. This study would advance our understanding of the
factors that affect cell growth and ECM production in vitro in bioreactors. The model will help
in the development of optimal operational strategies for growing engineered cartilage in these
bioreactors. Further, the model would enable understanding and rationalization of vast amount
of available experimental results on this system, and provide suggestions for improved

7/27/2019 Mathematical Modeling of Transport and Reaction in Cellular and T
http://slidepdf.com/reader/full/mathematical-modeling-of-transport-and-reaction-in-cellular-and-t 28/270
8
experimental design by identifying the key parameter measurements that need to be made. This
work indirectly would help in monitoring and controlling the development of the tissue
engineered construct in the bioreactor.
The above models provide quantitative understanding of the effects of macroscopic changes on
cellular characteristics, such as growth, metabolism and ECM production. As mentioned, this is
accomplished by proposing kinetic functions relating the cellular changes to changes in the
microenvironment around the cell. However, understanding at the cellular level is incomplete.
As a next step towards the development of structured models, the understanding of metabolism
at the cellular level is studied in the work reported in Chapter 7 of this dissertation. This is
important from the perspective of cellular engineering to enhance our understanding of the role
of metabolism on cellular design. The cell type used for this study is a muscle cell or a
myofiber. This cell type was chosen because of its definite structure and the large range of
metabolic rates observed due to change in physiological state of the animal (rest to exercise and
vice versa). Moreover, these cells have conserved cell structure from organism to organism. In
addition, extensive available literature on energy metabolism in muscle is an excellent
opportunity to develop quantitative, predictive, and testable model of cellular function across a
wide range of spatial and temporal boundaries.
Developing a quantitative understanding of cellular metabolism by studying the production,
transport, conversion and utilization of energy carriers, facilitated via metabolic pathways is
performed using reaction-diffusion models. The transport and reaction dynamics of phosphorous
metabolites involved in various metabolic pathways in the muscle are modeled using species
continuity equations. This understanding of muscle energetics is used to study supply verses
demand of metabolites in various muscle fiber types. Further this understanding of the
interactions between metabolism and cell structure is used in setting up a rationale for cellular
design for attaining the desired functions.

7/27/2019 Mathematical Modeling of Transport and Reaction in Cellular and T
http://slidepdf.com/reader/full/mathematical-modeling-of-transport-and-reaction-in-cellular-and-t 29/270
9
CHAPTER 2
ROLE OF NUTRIENT SUPPLY AND PRODUCT FORMATION
ON CELL GROWTH IN BIOREACTOR DESIGN FOR TISSUE
ENGINEERING OF HEMATOPOIETIC CELLS
Background and Literature Review
2.1. Introduction
Every day the human body produces billions of red blood cells, white blood cells, and platelets to
replace the blood cells lost due to normal turnover processes such as death, or due to illness or
trauma. A variety of homeostatic mechanisms allow blood cell production to respond quickly to
stresses such as bleeding or to infection and allow return to normalcy when the stresses are
resolved. This highly orchestrated process is called hematopoiesis (Smith, 2003). Thus
hematopoiesis refers to the process of formation and development of blood cells to maintain
homeostasis (Wang et al ., 1995).
Hematopoiesis in vivo takes place primarily in the bone marrow. The bone marrow is made up
of a vascular and an extra-vascular compartment. The vascular compartment as the name
indicates is supplied by a nutrient artery, which branches into central longitudinal arteries, which
in turn send out radial branches that eventually open into the sinuses. These sinuses converge
into a central vein which carries the blood out of the bone marrow into the general circulation.

7/27/2019 Mathematical Modeling of Transport and Reaction in Cellular and T
http://slidepdf.com/reader/full/mathematical-modeling-of-transport-and-reaction-in-cellular-and-t 30/270
10
Hematopoiesis takes place in the extra-vascular compartment called the hematopoietic
compartment. The extra-vascular compartment consists of stroma made up of reticular
connective tissue and a parenchyma of developing blood cells, plasma cell, macrophages and fat
cells. Hematopoiesis also occurs in spleen and liver during early stages of development of
embryo.
2.2. Process of Hematopoiesis
The commonly accepted theory on the process of hematopoiesis is called the monophyletic
theory. This theory states that there exists a single type of stem cell which gives rise to all the
different mature blood cells in the body. This stem cell is called the pluripotential (pluripotent)
stem cell or also called as hematopoietic stem cell (HSC). Most of these types of cells are found
within the bone marrow (BM) at typically very low percentages (typically 0.01-0.05%). They
are also found in the circulating peripheral blood (PB), the umbilical cord blood (UCB) and the
fetal liver at even lower percentages (typically 0.001%) (Cabrita et al., 2003).
All the HSCs are not identical. Experimental studies reveal that these HSC can be divided into
three types: long-term self-renewing HSCs (LT-HSCs), short-term self-renewing HSCs (ST-
HSCs) and not self-renewing multipotent progenitors (MPPs) (Cabrita et al ., 2003). It is thought
that the LT-HSCs self-renew throughout the lifespan of the organism. They maintain
hematopoiesis by differentiating into ST-HSCs and then to MPPs. The self renewal capabilities
of ST-HSCs and MPPs are only for short duration. These MPPs differentiate again into lineage-
committed progenitor cells, which as their name suggests give rise to blood cells of specific
lineages. These two specific hematopoietic lineages are called lymphoid lineage and myeloid
lineage. The lymphoid lineages consist of T-cell and B-cell lineages. The myeloid lineages
include the erythroid (production of erythrocytes or red blood cells), granulocytic (production of
neutrophils, infection fighting cells), macrophagic (production of macrophages, cells with
general regulatory and immune functions), and megakaryocytic (production of platelets, blood
clotting component) lineages. The schematic of this process is shown in Figure 2.1.
7/27/2019 Mathematical Modeling of Transport and Reaction in Cellular and T
http://slidepdf.com/reader/full/mathematical-modeling-of-transport-and-reaction-in-cellular-and-t 31/270
11
2.3. Bone Marrow Microenvironment
The regulation of HSC self-renewal/multilineage differentiation is dependent upon the intimate
contact with the bone marrow microenvironment. As discussed already the hematopoieticcompartment, which makes up the microenvironment for these cell types, consists of the so-
called stromal cells (macrophages, adipocytes, endothelial cells and fibroblasts) and components
of the extracellular matrix (ECM). The proliferation and maturation of highly primitive HSC
and also the mature lineage committed progenitor cells are influenced by the myriad of growth
factors expressed on the surface of and/or secreted by the stromal cells. It is presumed that these
growth factors are able to create a suitable microenvironment that plays an important role by
binding to specific receptors on the cell membrane of target cells and activating the current
messenger pathways.
2.4. HSC Culture
2.4.1. Need for Culture and potential applications
Large-scale hematopoietic cultures could provide several types of important mature blood cellslike the granulocytes, platelets, and red blood cells. About 12 million units of RBCs are
transfused in the United States every year, the majority of them during elective surgery, and the
rest in acute situations. About 4 million units of platelets are transfused every year into patients
who have difficulty exhibiting normal blood clotting. Mature granulocytes are transfused to
patients with weaker immune system, such as during chemotherapy and during the healing of the
burn wounds. The availability of donors is a traditional problem, and coupled with that the short
life of blood cells, blood-type incompatibility and some contamination of blood makes the
current supply of blood unstable and is not able to meet the major changes in demand by patients
(Koller et al., 1993).

7/27/2019 Mathematical Modeling of Transport and Reaction in Cellular and T
http://slidepdf.com/reader/full/mathematical-modeling-of-transport-and-reaction-in-cellular-and-t 32/270
12
Figure 2. 1 Stucture of the Hematopoietic system. All cell types above the dotted line are found in the BM
and all the cells below (the mature blood cells) are found in the circulating PB (Cabritaet al., 2003; Web
design by Stephen Traub, American Society of Health-System Pharmacists, Inc.)
Hence over the past few years, there has been an increased interest in the development of
clinical-scale culture systems for ex vivo expansion of hematopoietic cells. These ex vivo
expanded hematopoietic cells can be used for transplantations following chemotherapy, tumor
purging, and gene therapy.
2.4.2. Culture conditions that affect expansion
Choosing optimal culture parameters for the ex vivo expansion of hematopoietic cells is a major
challenge. This is because of complex kinetics of various cell types in different stages of
lineage, their transient nature, and complex dependence upon the culture parameters. The
various culture parameters which have been reviewed in the literature for this system include
Stem Cells
Progenitor
Cells
Differentiating
Cells in BM
Mature Cellsin blood
LT-HSC
ST-HSC
MPP
Myeloid Lymphoid
Proerythroblast Promyeloblast
MonoblastErythroblast
Erythrocyte
Myeloblast
Granulocyte Monocyte
Macrophage
Eosinophils
Mast Neutrophils
Basophils
Osteoclast
Promegakaryoblast
Megakaryoblast
Megakaryocyte
Blood Platelets
Prolymphoblast
Lymphoid Stem Cell
B
Lymphocyte
T
Lymphocyte
Plasma Cell Activated
T cell
Natural
Killer Cells
Stem Cells
Progenitor
Cells
Differentiating
Cells in BM
Mature Cellsin blood
LT-HSC
ST-HSC
MPP
Myeloid Lymphoid
Proerythroblast Promyeloblast
MonoblastErythroblast
Erythrocyte
Myeloblast
Granulocyte Monocyte
Macrophage
Eosinophils
Mast Neutrophils
Baso phils
Osteoclast
Promegakaryoblast
Megakaryoblast
Megakaryocyte
Blood Platelets
Prolymphoblast
Lymphoid Stem Cell
B
Lymphocyte
T
Lymphocyte
Plasma Cell Activated
T cell
Natural
Killer Cells
LT-HSC
ST-HSC
MPP
Myeloid Lymphoid
Proerythroblast Promyeloblast
MonoblastErythroblast
Erythrocyte
Myeloblast
Granulocyte Monocyte
Macrophage
Eosinophils
Mast Neutrophils
Baso phils
Osteoclast
Promegakaryoblast
Megakaryoblast
Megakaryocyte
Blood Platelets
Prolymphoblast
Lymphoid Stem Cell
B
Lymphocyte
T
Lymphocyte
Plasma Cell Activated
T cell
LT-HSCLT-HSC
ST-HSCST-HSC
MPPMPP
MyeloidMyeloid LymphoidLymphoid
ProerythroblastProerythroblast PromyeloblastPromyeloblast
MonoblastMonoblastErythroblastErythroblast
ErythrocyteErythrocyte
MyeloblastMyeloblast
GranulocyteGranulocyte MonocyteMonocyte
MacrophageMacrophage
Eosinophils
Mast Neutrophils Neutrophils
Baso philsBaso phils
OsteoclastOsteoclast
PromegakaryoblastPromegakaryoblast
MegakaryoblastMegakaryoblast
MegakaryocyteMegakaryocyte
Blood PlateletsBlood Platelets
ProlymphoblastProlymphoblast
Lymphoid Stem CellLymphoid Stem Cell
B
Lymphocyte
B
Lymphocyte
T
Lymphocyte
T
Lymphocyte
Plasma CellPlasma Cell Activated
T cell
Activated
T cell
Natural
Killer Cells
Natural
Killer Cells

7/27/2019 Mathematical Modeling of Transport and Reaction in Cellular and T
http://slidepdf.com/reader/full/mathematical-modeling-of-transport-and-reaction-in-cellular-and-t 33/270
13
growth factors, stroma, perfusion or static conditions, serum, dissolved oxygen concentration,
pH, inoculum density and the engineered surfaces for cell growth.
Stroma
Stromal cells consist of the adventitial reticular cells, endothelial cells, adipocytes, and,
macrophages. These cells support hematopoiesis by synthesizing the ECM and by the
production of growth factors. It has been reported that cultures containing a stromal layer or
stroma-derived factors have greater longevity and progenitor cell expansion in comparison to
cultures without stroma. However, there are a number of complications involved in using a
stromal layer. The quantification of the composition of this stromal layer is very complex and so
will be the quantification of its effects on various cell processes. Additionally, harvest of thestroma containing cultures is labor-intensive and requires enzymatic treatment. The benefits of
stromal cells can always be replaced by defined factors, by frequent medium exchanges, and by
the addition of a sufficient amount of growth factors.
Serum/Serum free medium
The first hematopoietic cultures were performed using serum-containing media. This media
provides nutrition, protects the cells from shear stresses within the reactor, and also is believed to
influence the transduction of mechanical forces that affect surface receptors. However, the
addition of serum to a culture medium leads to an undefined composition and brings
uncontrolled variability, complicating the use of cells for clinical purposes. Hence, in order to
avoid complications of in vitro cultures, serum free medium is preferred. It has been shown that
by addition of multiple cytokines excellent expansion of highly purified HSCs can be obtained
(Cabrita et al ., 2003).
pH
HSC cultures might experience a pH variation of up to 0.5 pH units unless pH is controlled. This
pH variation is largely due to cellular metabolism which leads to the production of by product
lactate (Nielsen, et al ., 1999). Many studies have shown that medium acidification causes

7/27/2019 Mathematical Modeling of Transport and Reaction in Cellular and T
http://slidepdf.com/reader/full/mathematical-modeling-of-transport-and-reaction-in-cellular-and-t 34/270
14
growth inhibition (McAdams, et al ., 1996). The pH range of 7.2-7.4 supports the survival and
differentiation of granulocyte-macrophage. Outside of this range, the differentiation is
eliminated, especially at acidic pH.
In an erythroid lineage it is observed that the rate and extent of differentiation increases between
pH of 7.1 to 7.6 (McAdams, et al ., 1996). At pH less than 7.1, erythroid progenitors are still
present and viable, but their differentiation is inhibited. Similarly, the pH range 7.35 - 7.40
promotes differentiation and maturation of Mk cells whereas a lower pH (~ 7.1) extends the
expansion of primitive Mk progenitor cells (Cabrita et al ., 2003). Therefore, pH is shown to be
an important factor for hematopoietic cultures and needs to be suitably controlled to facilitate
cell expansion, differentiation, maturation and apoptosis.
Oxygen Tension
Oxygen tension is an important determinant of proliferation and differentiation of hematopoietic
cells. Reduced Oxygen tension (pO2 = 38 mm Hg, 5% O2) enhances the production of erythroid,
megakaryocytic, and granulocytic-monocytic progenitors in vitro (Laluppa, 1998, Chow et al .,
2001). However, the formation of mature erythrocytes, mature granulocytes and
megakaryocytes (Mks) is extensive under a pO2 value close to 152 mm Hg (20% O2). Thus, the
progenitor cells of most lineages proliferate more rapidly under reduced oxygen tension, which is
in regions that are farthest from the supply sources in the BM (the sinus). In contrast, the mature
cells of these lineages appear extensively under the higher oxygen tension that occurs in regions
close to the sinus or oxygen supply source.
The improved growth of progenitor cells under reduced oxygen tension is in part due to the
increased responsiveness of hematopoietic cells to various growth factors. For example, under
low oxygen levels CFU-E and BFU-E exhibit increased sensitivity to EPO (Erythropoietin), and
macrophage progenitors show increased sensitivity to M-CSF (Macrophage colony stimulating
factor). Accessory cells also show different responses to varying oxygen tensions in their
production of growth factors. Moreover, oxygen toxicity also plays an important role in the
decreased colony formation at high oxygen concentration. Studies performed have shown that in

7/27/2019 Mathematical Modeling of Transport and Reaction in Cellular and T
http://slidepdf.com/reader/full/mathematical-modeling-of-transport-and-reaction-in-cellular-and-t 35/270
15
the presence of lineage specific factors, different oxygen tensions preferentially enhance
expansion of one hematopoietic cell lineage (Laluppa, 1998, Chow et al ., 2001). Hence the
choice of oxygen tension will help to determine the linage and maturity of cells present in
culture.
BM oxygen tensions between 10 and 50 mmHg (indicating that saturation in ex vivo conditions
by gases containing approximately 5% oxygen) is sufficient to provide an environment similar to
the in vivo BM microenvironment. Studies have shown that formation of hematopoietic cell
colonies in colony assay cultures is enhanced under reduced oxygen conditions resulting in both
larger and more numerous colonies. Further studies have extended these findings to long-term
hematopoietic cultures (LTHC), both with and without the addition of exogenous cytokines
(Koller et al., 1993).
The role of oxygen is very complicated because the oxygen availability in a culture depends on
cell density, culture configuration and gas-phase oxygen tension in high cell density bioreactors.
A lower oxygen tension may benefit progenitors in the early stage of culture. However, as the
cell number increases the oxygen demand will increase and cultures may become oxygen
limited. Hence, it is important to replenish the oxygen by either increasing the gas-phase oxygen
tensions, the agitation rate, or the perfusion rates, depending upon the culture device (McAdams,
et al ., 1996). There is also evidence to suggest that stem cells can survive under hypoxic
conditions better than more mature progenitor cells. Therefore, the choice of oxygen tension
significantly influences the type of cells produced in culture and, together with the choice of
cytokine combinations, provides a significant means by which the lineage of the cells produced
in the culture can be controlled (McAdams, et al ., 1996).
Cell seeding density
Cell inoculum density affects the total cell and progenitor expansion as well as the percentage of
progenitor cells in the culture. In general, experiments have shown, lower cell seeding densities
lead to greater total cell expansion and greater depletion of colony forming cells. High density
cultures have greater total cell and CFC numbers but lower total cell expansion ratios in
7/27/2019 Mathematical Modeling of Transport and Reaction in Cellular and T
http://slidepdf.com/reader/full/mathematical-modeling-of-transport-and-reaction-in-cellular-and-t 36/270
16
comparison to low density cultures. The positive impact of increasing the rate of medium
exchange has been shown to be larger in high density cultures. A greater maintenance of CFCs
at high densities has also been seen in bioreactor cultures (McAdams, et al ., 1996).
The cell seeding density has been found to affect culture performance for BM MNC, and PB
MNC as well as for CD34+
cell culture systems. Lower density cultures expand total cells
preferentially over CFC. In contrast, higher density cultures expand CFC considerably but
without larger expansion of the total cells. Thus, it can be understood that a high density culture
maintains progenitors and long-term culture-initiating cells (LTC-IC) better than a low inoculum
density culture that induces differentiation. Culture systems that can maintain higher number of
progenitor cells are desirable. Hence a perfusion system (discussed in the next section) that can
maintain pH and oxygen tension in desirable levels in high density cultures is what is necessary
(Laluppa, 1998, Chow et al ., 2001).
Feeding/Perfusion
Perfusion and the rate of medium exchange are important culture variables. Hematopoiesis in
BM takes place under homeostatic conditions, which in vitro can be achieved under frequent or
continuous (perfusion) feeding. The in vivo perfusion rate of plasma through the BM is
approximately 0.1 ml/cc of marrow per minute (Laluppa, 1998, Chow et al ., 2001). High-
density bioreactor systems with higher cell densities may require correspondingly higher
perfusion rates. In contrast, the standard feeding protocol for hematopoietic LTHC cells is a
weakly exchange of 50%-100% of the medium rather than the daily rate (Koller et al., 1993).
Hematopoietic growth factors
Colony-stimulating factors (CSF) and interleukins (IL) are the primary regulators of the growthand differentiation of hematopoietic cells. The exact combination of the two growth factors for
optimal expansion of hematopoietic stem cells, progenitor cells and mature cells are still
unknown. Cytokines such as erythropoietin (EPO), thrombopoietin (TPO), and granulocyte-
colony stimulating factor (G-CSF) are ‘lineage specific’ and support proliferation and maturation
of committed progenitors. IL-3, granulocyte macrophage-CSF (GM-CSF) are intermediate

7/27/2019 Mathematical Modeling of Transport and Reaction in Cellular and T
http://slidepdf.com/reader/full/mathematical-modeling-of-transport-and-reaction-in-cellular-and-t 37/270
17
acting ‘lineage non-specific’ factors and support proliferation of multipotential progenitors.
Other factors such as IL-6, G-CSF, IL-11, and stem cell factor (SCF), when associated with IL-3
bring primitive, quiescent progenitors into the cell cycle and increase proliferation. Growth
factors like EPO, IL-3, GM-CSF, G-CSF, and SCF are considered to be survival factors because
they suppress apoptosis in cells at various stages in the hematopoietic lineage.
These regulators are added depending on the kind of cells being cultured and the desired lineage.
For example a combination of IL-6, G-CSF, GM-CSF are used for the expansion of more mature
cells and progenitors of the neutrophil lineage (Laluppa, 1998). The proliferation and maturation
of Mks requires the addition of TPO. However, the growth factor combination for maintenance
and expansion of primitive progenitors (LTC-IC) is still not well defined. A combination of
growth factors that would bring about proliferation of progenitor cells, prevent their
differentiation and apoptosis are desired (Laluppa, 1998, Chow et al ., 2001).
Local geometry
Local geometry can influence the function of cells in culture. A 2-dimensional flat surface
provided by standard tissue culture plastic is non-physiological, and is probably undesirable for
retaining normal physiological function over extended periods of time (Koller et al., 1993). A 3-
dimensional tissue culture might provide a similar microenvironment to the in vivo environment
and result in long-term multilineage production of hematopoietic cells. This topic will be further
discussed in the section dealing with culture devices.
2.4.3 System for expansion of hematopoietic cells
BM cells have traditionally been cultured on flat, two-dimensional surface of tissue culture
dishes. Dexter et. al., 1977 were the first to develop a long term murine hematopoietic (bone
marrow) culture system, which primarily produced granulocytes. The key features of this system
were the establishment of the stromal layer during the first few weeks of the culture followed by
progenitor cells expanding into colonies in the next few weeks. Since then investigators began
using static culture systems such as well plates, T-flasks and gas permeable blood bags for
7/27/2019 Mathematical Modeling of Transport and Reaction in Cellular and T
http://slidepdf.com/reader/full/mathematical-modeling-of-transport-and-reaction-in-cellular-and-t 38/270
18
expanding hematopoietic cells. These systems, however, suffer, severe limitations including the
following:
(a) lack of mixing resulting in critical gradients for dissolved oxygen (low solubility) and
nutrients (such as cytokines and metabolites); hence heterogeneity,
(b) lack of control options for dissolved oxygen concentration and pH,
(c) lack of support for frequent feeding,
(d) productivity limited by the number of cells that can be supported by a given surface area,
(e) cumbersome for large scale applications, because of the need for more flasks, bags or
dishes,
(f) low process reproducibility, and
(g) increased risk of contamination due to repeated handling required to feed cultures or to
obtain data on culture performance.
These limitations restrict the usefulness of static systems to relatively low density cultures with
low total cell requirements.
The use of bioreactor systems is an alternative approach to standard flask culture systems in
vitro. Advanced bioreactors are necessary when a large number of cells are required, accessory
cells are used and high cell density is desired. These systems may also have the potential to
become automated. They are closed systems which thereby decrease the space and labor
requirements, reduce contamination, and facilitate continuous automated medium exchange.
They can be well monitored and optimally controlled, and thus can be used to develop an
understanding of the influence of various input parameters in the culture system on the
hematopoietic cell expansion and commitment. The most important bioreactors used so far for
the expansion of hematopoietic cells include: perfusion chambers, stirred reactors, fluidized bed
reactors, fixed (packed bed) reactors, airlift reactors and hollow fiber reactors.
Perfusion chambers
Palsson and collaborators (Schwartz et al., 1991; Palsson et al., 1993) have developed a
perfusion culture system based on flat small-scale cell culture chambers with an attached stromal
layer to retain inoculated cells. The design of such a reactor is driven by the fact that more
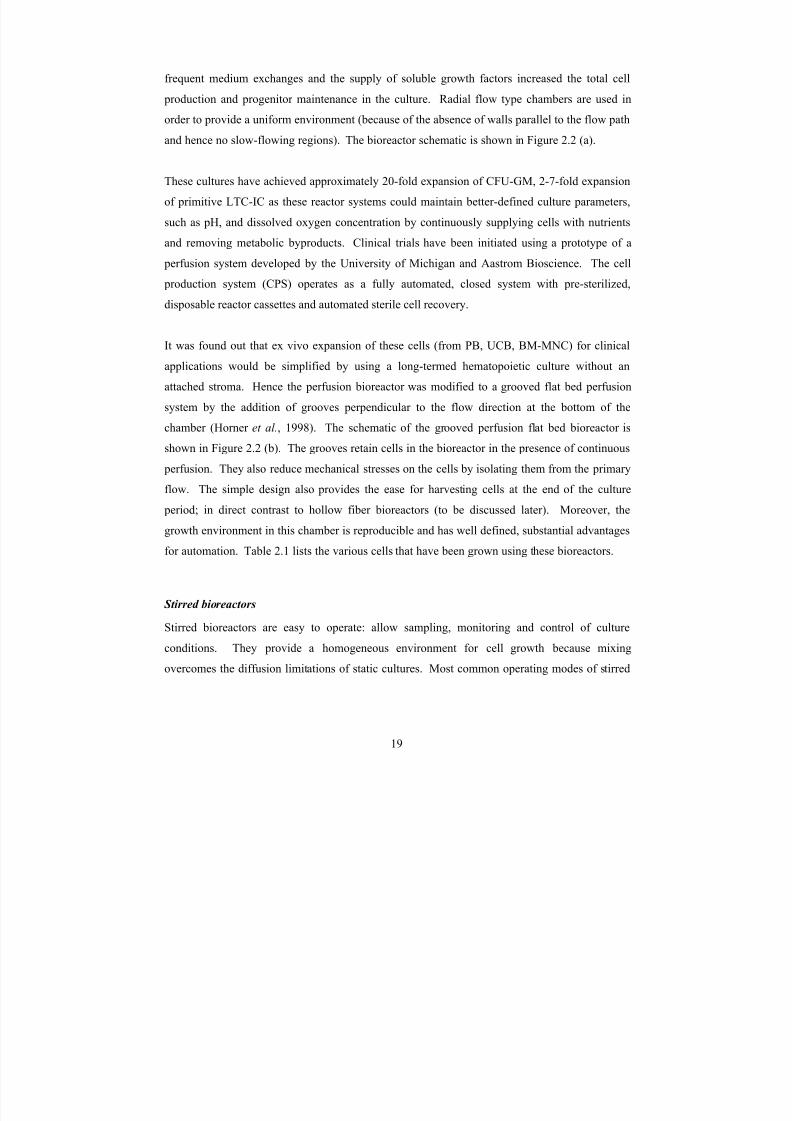
7/27/2019 Mathematical Modeling of Transport and Reaction in Cellular and T
http://slidepdf.com/reader/full/mathematical-modeling-of-transport-and-reaction-in-cellular-and-t 39/270
19
frequent medium exchanges and the supply of soluble growth factors increased the total cell
production and progenitor maintenance in the culture. Radial flow type chambers are used in
order to provide a uniform environment (because of the absence of walls parallel to the flow path
and hence no slow-flowing regions). The bioreactor schematic is shown in Figure 2.2 (a).
These cultures have achieved approximately 20-fold expansion of CFU-GM, 2-7-fold expansion
of primitive LTC-IC as these reactor systems could maintain better-defined culture parameters,
such as pH, and dissolved oxygen concentration by continuously supplying cells with nutrients
and removing metabolic byproducts. Clinical trials have been initiated using a prototype of a
perfusion system developed by the University of Michigan and Aastrom Bioscience. The cell
production system (CPS) operates as a fully automated, closed system with pre-sterilized,
disposable reactor cassettes and automated sterile cell recovery.
It was found out that ex vivo expansion of these cells (from PB, UCB, BM-MNC) for clinical
applications would be simplified by using a long-termed hematopoietic culture without an
attached stroma. Hence the perfusion bioreactor was modified to a grooved flat bed perfusion
system by the addition of grooves perpendicular to the flow direction at the bottom of the
chamber (Horner et al., 1998). The schematic of the grooved perfusion flat bed bioreactor is
shown in Figure 2.2 (b). The grooves retain cells in the bioreactor in the presence of continuous
perfusion. They also reduce mechanical stresses on the cells by isolating them from the primary
flow. The simple design also provides the ease for harvesting cells at the end of the culture
period; in direct contrast to hollow fiber bioreactors (to be discussed later). Moreover, the
growth environment in this chamber is reproducible and has well defined, substantial advantages
for automation. Table 2.1 lists the various cells that have been grown using these bioreactors.
Stirred bioreactors
Stirred bioreactors are easy to operate: allow sampling, monitoring and control of culture
conditions. They provide a homogeneous environment for cell growth because mixing
overcomes the diffusion limitations of static cultures. Most common operating modes of stirred
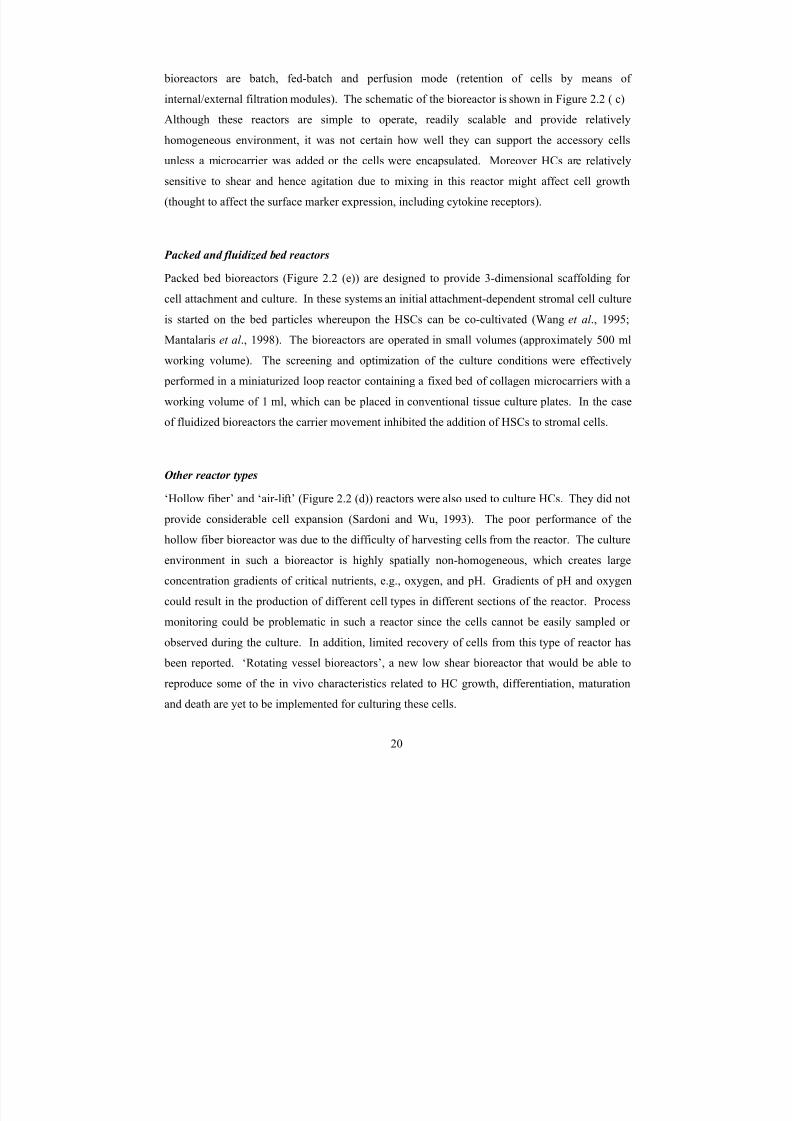
7/27/2019 Mathematical Modeling of Transport and Reaction in Cellular and T
http://slidepdf.com/reader/full/mathematical-modeling-of-transport-and-reaction-in-cellular-and-t 40/270
20
bioreactors are batch, fed-batch and perfusion mode (retention of cells by means of
internal/external filtration modules). The schematic of the bioreactor is shown in Figure 2.2 ( c)
Although these reactors are simple to operate, readily scalable and provide relatively
homogeneous environment, it was not certain how well they can support the accessory cells
unless a microcarrier was added or the cells were encapsulated. Moreover HCs are relatively
sensitive to shear and hence agitation due to mixing in this reactor might affect cell growth
(thought to affect the surface marker expression, including cytokine receptors).
Packed and fluidized bed reactors
Packed bed bioreactors (Figure 2.2 (e)) are designed to provide 3-dimensional scaffolding for
cell attachment and culture. In these systems an initial attachment-dependent stromal cell cultureis started on the bed particles whereupon the HSCs can be co-cultivated (Wang et al ., 1995;
Mantalaris et al ., 1998). The bioreactors are operated in small volumes (approximately 500 ml
working volume). The screening and optimization of the culture conditions were effectively
performed in a miniaturized loop reactor containing a fixed bed of collagen microcarriers with a
working volume of 1 ml, which can be placed in conventional tissue culture plates. In the case
of fluidized bioreactors the carrier movement inhibited the addition of HSCs to stromal cells.
Other reactor types
‘Hollow fiber’ and ‘air-lift’ (Figure 2.2 (d)) reactors were also used to culture HCs. They did not
provide considerable cell expansion (Sardoni and Wu, 1993). The poor performance of the
hollow fiber bioreactor was due to the difficulty of harvesting cells from the reactor. The culture
environment in such a bioreactor is highly spatially non-homogeneous, which creates large
concentration gradients of critical nutrients, e.g., oxygen, and pH. Gradients of pH and oxygen
could result in the production of different cell types in different sections of the reactor. Processmonitoring could be problematic in such a reactor since the cells cannot be easily sampled or
observed during the culture. In addition, limited recovery of cells from this type of reactor has
been reported. ‘Rotating vessel bioreactors’, a new low shear bioreactor that would be able to
reproduce some of the in vivo characteristics related to HC growth, differentiation, maturation
and death are yet to be implemented for culturing these cells.
7/27/2019 Mathematical Modeling of Transport and Reaction in Cellular and T
http://slidepdf.com/reader/full/mathematical-modeling-of-transport-and-reaction-in-cellular-and-t 41/270
21
Bioreactor systems are advantageous because they have the potential to become automated.
They are closed systems thereby decreasing space and labor requirements and contamination and
also facilitating compliance with regulatory requirements. A uniform culture environment and a
simple design are the primary advantages of stirred systems. However, hematopoietic cells
being shear sensitive posses a major disadvantage in using stirred systems. Flat bed perfusion
systems would provide a low shear environment, a proper supply of nutrients maintaining the
various culture conditions and culture cells more effectively over all the bioreactor system.
However, being 2-dimensional they still do not provide proper cell-cell and cell-matrix
interactions for optimal cell growth. Hence, it is critical to design a similar system but with 3-
dimensional microstructure.
Further studies need to be conducted in order to determine the sensitivity of a particular
hematopoietic lineage to various culture parameters discussed above. This includes analysis of
the effects of such factors as oxygen and lactate concentrations, pH, shear forces, and other
conditions to determine how closely they should be controlled in the bioreactor system in order
to replicate the in vivo bone marrow microenvironment.
The field of hematopoietic stem and progenitor cell expansion has progressed rapidly since the
first Dexter cultures were performed in the mid-1970s. Within these few years progress has been
especially rapid in the identification of suitable microenvironment for large scale cell expansion.
This includes the utilization of 3-dimensional matrices and novel bioreactor systems that help in
maintaining high levels of nutrient concentration and facilitating byproduct removal. The
potential for ex vivo expansion is manifest, as clinicians have already begun to utilize ex vivo
expanded hematopoietic cells for transplantation and gene therapy. Clinically the potential for
ex vivo expansion are promising, however, still many factors need to be considered before the
process can be a clinical routine. My research deals with the development of mathematical
models for these novel 3-dimensional culture systems for optimally desired ex vivo expansion of
these cells. This will advance research on mathematical modeling for this system.
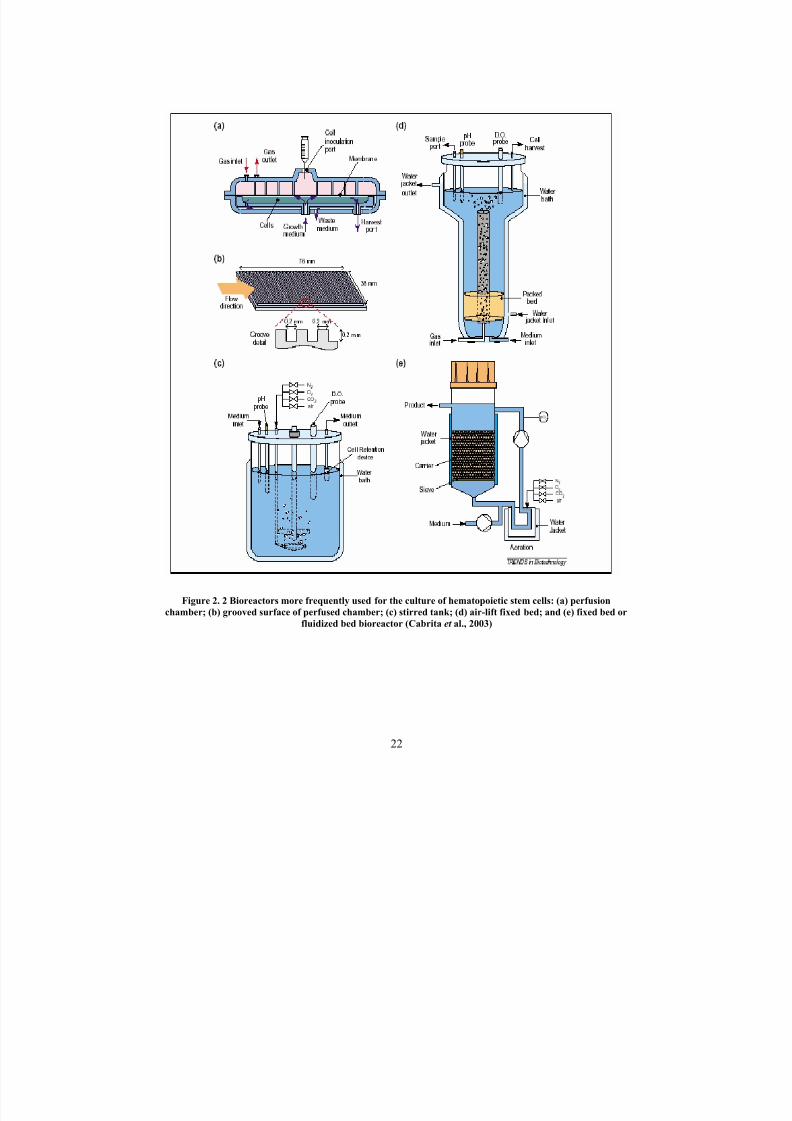
7/27/2019 Mathematical Modeling of Transport and Reaction in Cellular and T
http://slidepdf.com/reader/full/mathematical-modeling-of-transport-and-reaction-in-cellular-and-t 42/270
22
Figure 2. 2 Bioreactors more frequently used for the culture of hematopoietic stem cells: (a) perfusion
chamber; (b) grooved surface of perfused chamber; (c) stirred tank; (d) air-lift fixed bed; and (e) fixed bed or
fluidized bed bioreactor (Cabrita et al., 2003)

7/27/2019 Mathematical Modeling of Transport and Reaction in Cellular and T
http://slidepdf.com/reader/full/mathematical-modeling-of-transport-and-reaction-in-cellular-and-t 43/270
23
Table 2. 1 Bioreactors most frequently used for the culture of hematopoietic stem cells (HSCs)
(Cabrita et al., 2003)
2.5 Mathematical Modeling
2.5.1 Motivation
Implementing a successful 3-dimensional bioreactor system for either clinical study or basic-
study requires a reliable transport-reaction model. Such a model would allow for the estimation
of operational limits of a given bioreactor design for a particular cell culture application by
ensuring that the cells are grown under non-limiting culture conditions. The model would also
allow for the selection of suitable design characteristics and/or operational variables to achieve a
desirable level of one or more culture parameters, such as dissolved oxygen, pH, and nutrient or
byproduct concentrations. This would directly affect the growth of that cell in that culture

7/27/2019 Mathematical Modeling of Transport and Reaction in Cellular and T
http://slidepdf.com/reader/full/mathematical-modeling-of-transport-and-reaction-in-cellular-and-t 44/270
24
system. Hence, the growth of the cell in the bioreactor system may be effectively manipulated
by the use of mathematical models (Horner et al., 1998).
2.5.2 Need for modeling of hematopoietic system
As discussed in the introduction in vivo hematopoiesis process occurs in the bone marrow (BM).
Compared with all other tissues in the body the bone marrow has been extensively studied. Bone
marrow cultures have significant applications to clinical practice and to basic scientific studies of
tissue structure-function relationships (Koller and Palsson, 1993). Therefore, hematopoiesis is a
logical candidate system for the initial development of mathematical models of ex vivo function.
Section 2.4.3 described the importance of 3-dimensional bioreactor systems for ex vivo
expansion of hematopoiesis in order to reconstitute a functioning BM. Evaluating the kinetics in
these hematopoietic culture systems is complicated by the distribution of cells of multiple
lineages over different stages of differentiation. Thus, an observed response (experimentally) is
an integral response from several cell populations of cells. Models are developed to predict the
different kinetic parameters of various HC types that are experimentally difficult to determine.
For example, the developed models can be used to obtain the cell growth of early progenitors
(present in low frequencies in culture), as their content and distribution cannot be identified even by flow cytometry (Yang et al ., 2000). The concentration of various nutrients and products in
the matrix that are important in determining and manipulating cell growth can be studied. This
information obtained from the model can be further used in the optimization of ex vivo cultures.
2.5.3 Available Mathematical Models
Various mathematical models have been reported in literature describing the hematopoiesis
process in vivo in the BM and ex vivo in the culture systems. A few of the most important
models are briefly reviewed below.

7/27/2019 Mathematical Modeling of Transport and Reaction in Cellular and T
http://slidepdf.com/reader/full/mathematical-modeling-of-transport-and-reaction-in-cellular-and-t 45/270
25
2.5.3.1 Krogh’s Model
Krogh’s model (Krogh, 1918) approximates a tissue as a cylinder and has been extensively used
in the modeling of oxygen transfer through different types of tissues, including the skeletal
muscle, myocardium, brain, lung, and the skin.
Chow and coworkers (Chow et al ., 2001 a) have used this Krogh’s modeling approach to
estimate the oxygen partial pressure (pO2) (or concentration distribution) in the bone marrow
hematopoietic compartment (BMHC). The model simulates the cellular arrangement of various
cell types depending on the oxygen consumption. A tissue cylinder consisting of various cell
types with the bone marrow sinus at the center is constructed. The following assumptions are
made to simplify the mathematical formulation:1. steady state oxygen transfer,
2. oxygen molecules are assumed not to bind to any carriers or preferentially adsorb on
certain parts of the cells,
3. sinuses are assumed to be straight and parallel for a length sufficient to establish
equilibrium between the sinus and hematopoietic tissue,
4. oxygen consumption and resistance to oxygen diffusion of the sinusoidal wall are
insignificant, and
5. extra-vascular tissue in BMHC is composed of only one cell type (i.e., a homogeneous
Kroghian model).
The oxygen transport and utilization can be mathematically described as:
( ) P Q P K =∇ 2
(2.1)
where K is the effective oxygen permeability (mol/cm/s/mm Hg), P is the oxygen partial
pressure pO2 (mm Hg), and Q(P) is the volumetric oxygen consumption rate (mol/cm3/s). The
effective oxygen permeability is the product of the oxygen diffusivity ( D, cm2/s) and the oxygen

7/27/2019 Mathematical Modeling of Transport and Reaction in Cellular and T
http://slidepdf.com/reader/full/mathematical-modeling-of-transport-and-reaction-in-cellular-and-t 46/270
26
solubility coefficient (α , mol/cm3/mm Hg). Q is the ratio of the specific oxygen uptake rate (qO2,
mol/cell/h) and the specific cell volume (V , cm3/cell).
Figure 2. 3 Graphical representation of the Kroghian model (Chow et al ., 2001 a)
Assuming P in the extra-vascular tissue depends only on the radial position (R) relative to sinus,
equation 2.1 describing the oxygen continuity reduces to,
K
P Q
dr
dP r
dr
d
r
)(1=⎥
⎦⎤
⎢⎣⎡ ⎟
⎠ ⎞⎜
⎝ ⎛
(2.2)
The P at the sinus wall (R 1) in Figure 2.3 equals the saturation oxygen tension ( P S ) and the
oxygen flux is zero at the boundary wall of the cylinder at R 2 (symmetry boundary condition).
1 Rr when P P s == (at the sinus wall)
20 Rr whendr
dP == (at the outer boundary of the tissue cylinder)
(2.3)
7/27/2019 Mathematical Modeling of Transport and Reaction in Cellular and T
http://slidepdf.com/reader/full/mathematical-modeling-of-transport-and-reaction-in-cellular-and-t 47/270
27
Dimensionless forms of the oxygen continuity equation 2.2 and the boundary conditions
(equation 2.3) are given as,
S P
R
K
P Q
dr
dP r dr
d
r
2
2
*
**
**
)(1
=⎟⎟ ⎠
⎞⎜⎜⎝
⎛
(2.4)
β == **1 r when P (at the sinus wall)
10 *
*
*
== r whendr
dP (at the boundary of the tissue cylinder)
(2.5)
where r *= r/R2 , P
*= P/P s and β = r/R2 = R1 /R2.
The volumetric oxygen consumption rate Q(P) is written either as a zero order kinetics, a first
order oxygen uptake kinetics, or as a saturation-type (Michaelis-Menten) kinetics,
Zero order: max)( Q P Q = , where Qmax is the maximal oxygen uptake rate
First order: P Qk P Q ⋅⋅= max)( , where k is first-order rate constant
Michaelis-Menten: P K
P Q P Q
M += max)( , where K M is the oxygen affinity constant
(2.6)
The expression for the non-dimensional oxygen partial pressure is calculated using the zero order
kinetics as,
⎥⎦
⎤⎢⎣
⎡⎟ ⎠
⎞⎜⎝
⎛ +−
+=*
22*2* ln
2
1
41
r
r P
β β φ
(2.7)
7/27/2019 Mathematical Modeling of Transport and Reaction in Cellular and T
http://slidepdf.com/reader/full/mathematical-modeling-of-transport-and-reaction-in-cellular-and-t 48/270
28
Equation 2.7 was solved for different cell types (assuming one cell type in the extra-vascular
space at a time) and oxygen partial pressures were obtained along the tissue (BMHC). The
model is more effectively used to determine the radius at which each type of cell is located. The
model showed that progenitor cells are found to be located farther away from the sinus whereas
the mature cells are located closer to the sinus.
Chow et al ., 2001 (Part II) modified their homogeneous Kroghian model in order to incorporate
the presence of multiple cell types in the BMHC. The three different approaches used are
described below.
1. In order to evaluate the effects of heterogeneity in cellular properties on the pO 2
distribution in BMHC the extra vascular tissue was divided into multiple cell layers with
different metabolic and transport characteristics (multi-layer model) surrounding a sinus
(oxygen source) called the ‘Multi-layer Kroghian model’. Different layers were made up
of different cells – from early progenitors to the mature cells – of the same lineage or
different lineages. The simulated results of the typical pO2 distribution of a composite
tissue (multi-layer model) shows that the metabolically active cells should be located
further away from the sinus, as that would cause a lower pO2 levels in their proximity.
2. The homogeneous Krogh model was modified to a 2-dimensional model by adding
another spatial dimension to describe the complicated cellular architecture in which cells
are arranged in clusters. Large hematopoietic cell types (Megakaryocytes or Adipocytes)
closely resemble cells in cluster. These cells are considered as the secondary cell type.
The granulocytes occupy most of the BMHC and are defined as the primary cell type.
The primary cell type is assumed to occupy the extra vascular tissue space as shown in
Figure 2.3. The secondary cell types are chosen to be located either close to the sinus or
further away from the sinus. The pO2 profiles in this model are asymmetric because of
localized variations in cell types.
3. Further on, in order to simulate the pO2 distributions in colony type cellular
arrangements, such as in erythroblastic islets, granulocytic loci, and lymphocytic nodules,
the multi-layer model is modified by placing the sinus outside the colonies. The results
show that the macrophage at the center of the islet is a metabolically active cell and

7/27/2019 Mathematical Modeling of Transport and Reaction in Cellular and T
http://slidepdf.com/reader/full/mathematical-modeling-of-transport-and-reaction-in-cellular-and-t 49/270
29
experiences the lowest pO2 values, while the mature erythrocytes (with low metabolic
activity) are located at the outer periphery and against the sinus wall, which is region of
highest pO2 value (close to supply).
The above three models provided us with a simplified picture of the pO 2 distribution in a
heterogeneous cell-type situation. The simulation results can be used to eliminate the cellular
architectures that are physiologically unrealistic. The 2-dimensional model can be used to
account for the asymmetry in cellular arrangements that might not be arranged as in the multi-
layer model. Finally, the modified cylinder model in which the sinus is located in the outer
periphery is used to describe cells that grow in colony like structures such as the erythroblastic
islets, granulocytic loci, to name a few.
In these Krogh’s models (Part I and Part II) the importance of the oxygen partial pressures on the
growth of specific cell types was determined. The models were used to determine the oxygen
partial pressure distribution in vivo, in the bone marrow, and in systems with cell distributions
similar to that in the bone marrow tissue. These models were used to obtain the metabolic
functions and parameters describing the oxygen consumption in vivo of different cell types for
analysis in the ex vivo bioreactor model. The model results showed the growth of mature cells at
regions of higher oxygen tension and early progenitors at regions of lower oxygen tension in
BMHC. These results indicate a similar spatial distribution in the bioreactor ex vivo. Moreover,
the dimensions of different cell types in the BM and diffusivity of oxygen in cellular media is
also obtained from the information provided in this study.
2.5.3.2 Palsson’s Perfusion Bioreactor Model
Palsson and collaborators were the first group to develop perfusion bioreactors to grow HCs
(discussed in section 2.4.3). In hematopoietic bioreactors, as discussed, oxygen plays an
important role in a variety of physiological processes such as cell attachment, spreading, cell
growth and differentiation. HCs experience growth inhibition and even toxicity at high oxygen
concentrations, and anoxia at low oxygen concentrations. Hence, maintaining an optimal oxygen
concentration range near the cell surface is important in attaining a successful culture. However,

7/27/2019 Mathematical Modeling of Transport and Reaction in Cellular and T
http://slidepdf.com/reader/full/mathematical-modeling-of-transport-and-reaction-in-cellular-and-t 50/270
30
measurement of the local oxygen concentration near the cells is difficult; hence a mathematical
analysis is needed to estimate the local oxygen concentration.
Peng and Palsson (1996) have developed a mathematical model of oxygen delivery to the cells in
a perfusion bioreactor. The schematic of the bioreactor is shown in Figure 2.4. The growth
medium with oxygen (concentration, C in) is pumped with a peristaltic pump and flows parallel to
the lower plate (i.e., the bottom of the bioreactor) with a fully developed laminar velocity profile
u(x). Oxygen in the gas phase permeates through the membrane into the liquid layer and diffuses
across into the cell bed. The oxygen concentration at the liquid side of the membrane is assumed
to be at saturation C *. The cell bed is located at the bottom of the reactor. Cells consume
oxygen and the uptake rate is described by Michaelis-Menten kinetics (similar to that explained
by the Kroghian model). The local oxygen concentration is computed based on the design
parameters: oxygen partial pressure, medium depth (h), and cell inoculum density.
Figure 2. 4 Two-dimensional schematic diagram of a radial flow perfusion bioreactor
A mathematical model describing this process is developed with the following assumptions:
1. Medium flow rate is slow corresponding to a transit time of 1.33 days. The diffusional
response time is nearly 1 hr. Therefore, the ratio of the diffusional time to transit time is
much smaller than unity, hence the effects of fluid flow can be neglected in the liquid
phase,
7/27/2019 Mathematical Modeling of Transport and Reaction in Cellular and T
http://slidepdf.com/reader/full/mathematical-modeling-of-transport-and-reaction-in-cellular-and-t 51/270
7/27/2019 Mathematical Modeling of Transport and Reaction in Cellular and T
http://slidepdf.com/reader/full/mathematical-modeling-of-transport-and-reaction-in-cellular-and-t 52/270
32
0)( **2 =−+−+ momo K C C DqXhC K C
(2.11)
Non-dimensionalizing the oxygen concentration relative to saturation we get,
uptake
diffusion
m
oo
t
t
qX hC
Dh DC qXh
C K
where
===
−==
=−⋅−++
/
/
05.001.0/
0)1(
*
2*
*
2
φ
κ
κ σ φ κ σ
(2.12)
The parameter φ measures the ratio of the time constants for oxygen diffusion to oxygen uptake
(i.e. reaction). The numerical estimation of φ suggests that at the earlier time of the culture the
value is less than unity as the oxygen diffusion is fast and hence sufficient oxygen reaches thecell bed. With time the cell density changes and hence the time for oxygen uptake becomes
faster and hence the value of φ becomes much higher than unity and by the end of the culture
oxygen delivery is limited to the cells. Therefore, the most important aspect of this bioreactor
design is to maintain the value of φ small, by manipulating the liquid layer height, the cell
density and the gas phase oxygen concentration.
This model is a simple way of quantitatively determining the oxygen concentration in the liquid
layer and explaining the various parameters that need to be manipulated for optimizing the
design and performance of the perfusion hematopoietic bioreactor. This model is definitely a
first step towards describing ways of bioreactor optimization by manipulating the supply vs.
consumption rate.
7/27/2019 Mathematical Modeling of Transport and Reaction in Cellular and T
http://slidepdf.com/reader/full/mathematical-modeling-of-transport-and-reaction-in-cellular-and-t 53/270
33
However, this model has the following major drawbacks which need to be improved.
1. In this model the calculations are made at fixed values of cell density. In reality in
cultures the cell densities are related to the local oxygen concentration and vary in space
and time in cultures.
2. This model accounts for total oxygen consumption rate. Oxygen is consumed for
metabolism and for growth (two distinct processes). In order to understand the oxygen
dependence on cell growth separate functions describing oxygen consumption for
metabolism and oxygen consumption for growth need to be developed.
3. The model assumes diffusion to be the most important mode of oxygen delivery rather
than oxygen delivery by convective transport. Hence the model does not take into
account variations of oxygen concentration in three dimensions. However, for higher
liquid layer heights (greater than 3 mm), hydrodynamic flow would be required along
with supply from headspace oxygen chambers, to avoid oxygen limitations in the
bioreactor. Then it would be necessary to model spatial variation in the oxygen
concentration in the liquid layer.
4. This model does not have a separate cell layer made up of the matrix and cells and hence
need not account for the oxygen concentration and cell density spatial variation in the cell
layer, which exists in ex vivo experiments.
5. The model accounts for the overall cell growth rate. However, hematopoietic cultures are
different from other cell cultures. As discussed in section 2.2 multiple cell types coexist
and cells along different lineages grow, differentiate, mature and die. It is essential to
consider the dynamic distribution of various cell types along different lineages in these
culture systems. A population modeling approach (described in section below) need to
be coupled to these established transport models.
2.5.3.3 Grooved Perfusion Bioreactor Model
Grooved perfusion bioreactors have been shown to overcome some of the mass transfer
limitations present in other cultures, and these reactors retain cells (subjected to constant
perfusion in the bioreactor) under reduced mechanical stresses by isolating them from primary

7/27/2019 Mathematical Modeling of Transport and Reaction in Cellular and T
http://slidepdf.com/reader/full/mathematical-modeling-of-transport-and-reaction-in-cellular-and-t 54/270
34
flow. The bioreactor schematic is shown in Figure 2.5. An advection-diffusion model was
developed by Horner et al ., 1998 to describe 2-dimensional version of this bioreactor system.
’
Figure 2. 5 Model of a flat bed perfusion bioreactor system with a series of grooves to retain cells in thepresence of constant perfusion. This is a closed system with no headspace. Medium flows in the z direction
across the chamber. y’ and z’ represent the local co-ordinate system in a cavity (Horner et al ., 1998)
The model considers oxygen consumption and lactate production by HCs. The model
assumptions include:
1. flow is steady state,
2. mass transfer of model solutes (oxygen and lactate) are given by a pseudo-steady approach,
3. average cell doubling time (~ 1day) is long compared to the time required for establishmentof steady state of model solutes.
The Navier-Stokes equation and species continuity equation are used to describe the flow in the
perfusion chamber and the molar balance for each solute, respectively. The solute balance is
coupled to the flow balance (hydrodynamics) in the dilute solution limit.

7/27/2019 Mathematical Modeling of Transport and Reaction in Cellular and T
http://slidepdf.com/reader/full/mathematical-modeling-of-transport-and-reaction-in-cellular-and-t 55/270
35
⎟⎟ ⎠
⎞⎜⎜⎝
⎛
∂
∂+
∂
∂⋅+
∂∂
−=⎟⎟ ⎠
⎞⎜⎜⎝
⎛
∂
∂+
∂
∂
⎟⎟ ⎠
⎞⎜⎜⎝
⎛
∂
∂+
∂
∂⋅+
∂∂
−=⎟⎟ ⎠
⎞⎜⎜⎝
⎛
∂
∂+
∂
∂
∇+−∇=⎟ ⎠
⎞⎜⎝
⎛ ∇⋅+∂∂
2
2
2
2
2
2
2
2
2
,
z
v
y
v
z
P
z
vv
y
vv
z
v
y
v
y
P
z
vv
y
vv
toreduced
u P uut
u
z z z z
z y
y y y
z
y
y
µ ρ
µ ρ
µ ρ
(2.13)
( )
⎟⎟ ⎠
⎞⎜⎜⎝
⎛
∂
∂+
∂
∂−=
∂∂
+∂
∂
=∇⋅−∇⋅−∂∂
2
2
2
2
,
2
,
0
z
C
y
C D
z
C v
y
C v
toreduced
uuC Dt
C
ii
med i
i
z
i
y
(2.14)
where i denotes solutes oxygen and lactate. Heterogeneous zero order reaction boundary
conditions were applied at the bottom of each groove and the no slip conditions at the reactor
walls and is given as,
( )
)(0
2
'
'
max
condition fluxno y
C D
WL
N qr
y
C D
g
g
H y
timei
H y
=∂∂
−
⋅==
∂∂
−
+=
−=
(2.15)

7/27/2019 Mathematical Modeling of Transport and Reaction in Cellular and T
http://slidepdf.com/reader/full/mathematical-modeling-of-transport-and-reaction-in-cellular-and-t 56/270
36
The magnitude of the effective reaction rate of solutes (i) is obtained by multiplying the specific
reaction rate of the solute (i) to the total cell number and then dividing by the surface area for
reaction. The time period of culture is divided into three phased early, middle and late, and the
cell numbers for these phases are obtained from literature. Computational fluid dynamics (CFD)
code (FIDAP) was used to solve these equations. The velocity field and solute concentration
distribution in the grooved chamber is obtained.
The model showed that the hematopoietic cultures were neither oxygen-limited nor lactate-
inhibited. High (20%) oxygen feed concentration for flow rates greater than 1.0 ml/min the late
cultures with 20*106
cells were not oxygen limited. However, for lower oxygen feed (5%)
concentration, the culture may become oxygen limited during the late phase of the culture. The
model study suggests that the perfusion rate may be started from 0.5 ml/min and increased up to
2.5 ml/min. This would decrease the amount of media needed to be recycled. During the early
phase of the culture medium should be fed at 2.5 ml/min and in equilibrium with low (5%)
oxygen feed concentration, favoring progenitor growth. Later in the culture the oxygen feed
should be increased (20%) to promote progenitor cell differentiation. Similar observations were
also made from calculations with the model developed and shown in Chapter 3 of this proposal.
This model also did not show an increase in lactate concentration above the inhibitory level
(<20mM). However, in culture the cell numbers may increase to levels greater than the fixed
number of cells assumed in the model during the late phase of the culture and this in turn would
increase the lactate concentration in the grooves above the inhibitory range, inhibiting further
cell growth in the grooves.
This model has similar drawbacks as those discussed for the Palsson’s perfusion bioreactor
model. However, this model provides an approximation of averaged nutrient and product
concentrations for a desired cell growth in a grooved perfusion bioreactor. The addition of
grooves as shown in the model provides good cell retention for very high medium flows (20
ml/min). Thus, modification of bioreactor geometry can be used to effectively manipulate cell
growth, by controlling the delivery of nutrients and removal of products. Future work needs to
consider the improvements of this model because of its significance for HC growth.
7/27/2019 Mathematical Modeling of Transport and Reaction in Cellular and T
http://slidepdf.com/reader/full/mathematical-modeling-of-transport-and-reaction-in-cellular-and-t 57/270
37
2.5.3.4 Population balance model
The population balance method is a discrete modeling approach that incorporates the (pseudo-)
stochastic and deterministic elements of the hematopoietic process. A number of models in the
literature have used this modeling approach to incorporate the dynamic variation of the various
cell types in hematopoietic cultures (Nielsen et al ., 1998; Silva et al ., 2003; Hevehan et al ., 2000;
Abkowitz et al ., 2000; Peng et al ., 1996, Williams et al., 2002). The model developed by
Nielsen et al ., 1998 using similarity of the hematopoietic system to chemical engineering
reactors is explained as a basic study for a clear understanding of this approach.
Hematopoiesis is described using chemical engineering metaphors of tanks and tubular reactors.
This kinetic model describes five processes: (1) differentiation (2) growth (3) death (4) phasetransition from cycling to quiescent phase (5) phase transition from quiescent cells to cycling
cells. Modeling these processes of cell expansion and differentiation from the early stem cells to
mature blood cells is complex as the molecular and regulatory mechanisms governing these
processes are still largely unknown.
Differentiation process
Two types of patterns can macroscopically describe the cell differentiation process: discrete and
continuum patterns. Stem cells exist in discrete states in which they grow without loosing their
stem cell potential. They loose this state through an apparently stochastic and discrete process of
commitment. The apparent stochastic nature of stem cells may be due to a set of complex
deterministic mechanisms and hence the process is termed as pseudo-stochastic. In contrast to
stem cells the lineage committed cells follow a continuous, deterministic differentiation pattern.
In between the two, the specialization process can be considered as discrete or continuum.
These two types of differentiation are modeled using the similarities of the process to tank and
tubular reactors. Discrete differentiation of stem cells has the features of a tank reactor; the
elements do not have any history. The probability of a particular cell/molecule leaving the
compartment/tank is independent of how long it has been therein. The commitment /exit of the
cell/molecule is governed by a stochastic process. Similarly the continuum differentiation

7/27/2019 Mathematical Modeling of Transport and Reaction in Cellular and T
http://slidepdf.com/reader/full/mathematical-modeling-of-transport-and-reaction-in-cellular-and-t 58/270
38
process of lineage committed cells shares the features of a tubular reactor: the elements have a
history. The ‘axial dimension of a tubular reactor’ is in ‘a cell compartment’ the measure of the
extent of differentiation and the ‘flow rate’ is equivalent to the ‘rate of differentiation’. The
reactions in these reacting compartments are those of cell growth (auto catalytic), cell death
(degradation) and phase transition. The three distinct stages of differentiation include: stem cell
commitment, specialization and expansion and maturation discussed in detail below.
Stage 1: Stem cell commitment
It is not exactly clear as to how the body balances the stem cell self-renewal versus commitment
which leads to differentiation to maintain homeostasis in the body. Mathematically, this process
can be explained by a multi-component discrete model using the self-renewal probability ( p),
i.e., the probability that a newborn daughter cell will remain as a stem cell. The two-phases or populations are defined as active (S ) and quiescent (S o), the cycle time as T S , exit rate as the
specific rate of commitment λ , the two reaction rates as – the specific growth rate, µ , and the
specific death rate, δ , and the two transition rates as the specific rate of quiescent-to-active
transition, α , and the specific rate of active-to-quiescent transition, β .
( ) ( )S S S T
S pT
S pT
S pdt
dS 121 −=⋅−−⋅=
( ) S S dt
dS o ⋅−−−+⋅= β λ δ µ α
o
o S S dt
dS ⋅−⋅= α β
(2.16)
The growth rate (µ ) and the commitment rate (λ ) are independent parameters as the model is
discrete. The model does not account for any spatial variation or dependence on environmentalfactors.
Stage 2: Specialization
There is no well-established mechanism of specialization and hence it is difficult to propose a
model for the specialization process. The model specialization process has a temporal extension,

7/27/2019 Mathematical Modeling of Transport and Reaction in Cellular and T
http://slidepdf.com/reader/full/mathematical-modeling-of-transport-and-reaction-in-cellular-and-t 59/270
39
which causes cell number expansion, distributes the cells among the different branches of
hematopoiesis, and allows for quiescence. There are three possible models that can be used to
describe this process as shown in Figure 2.6.
Figure 2. 6 Three models of specialization (Nielsen et al ., 1998)
The simplest model is a single tank reactor (Figure 2.6 a) with outlets to all branches of
hematopoiesis. Let P and P o be the numbers of pluripotent progenitors in the cycle and in
quiescence, respectively, then population balance yields,
( ) P P S
dt
dP io ⋅−−−+⋅+⋅= ∑λ β δ µ α λ
o
o P P dt
dP ⋅−⋅= α β
(2.17)
where λi’s represent the rate of commitment into different branches in the tree.
7/27/2019 Mathematical Modeling of Transport and Reaction in Cellular and T
http://slidepdf.com/reader/full/mathematical-modeling-of-transport-and-reaction-in-cellular-and-t 60/270
40
The second model (Figure 2.6 b) is a little more extensive and considers several tanks in series
and parallel. The myeloid branch of hematopoiesis, for example, could be described with
separate tanks for pluripotent cells, erythroid-megakaryocytic bipotent, and granulocytic-
monocytic bipotent cells.
The third model (Figure 2.6 c) describing the specialization process is still more extensive. The
lineage commitment can occur through a series of asymmetric divisions; the committed stem cell
divides into a lymphoid and myeloid progenitor, and then each of these progenitors subdivides
into different distinct lineages. This fully deterministic model is best described by a series of
tubular reactors with each reactor representing a single division cycle. In this case the doubling
of cell number will occur at one upstream and two downstream reactors. For example as cells
leave the granulocytic-monocytic (GM) reactor cell division causes the flux to double so that the
flux into either the granulocytic (G) or monocytic (M) pipe equals the flux leaving the GM
rector.
Stage 3: Expansion and maturation
Following the stage of specialization/lineage commitment, expansion of cells occurs through a
number of cell divisions. This process almost goes hand in hand with the differentiation process
(at least during the later stages of differentiation, when cells are in the mature stage). The kinetic
model for the process is written as,
( )( ) nn
n
t
no ⋅−−+⋅+
∂⋅∂
−=∂∂
β δ µ α τ
ν
(2.18)
where n(t,τ ) is the distributed density population at time t and at a differentiation stage τ (τ = 0
corresponds to the specific lineage cell entering the expansion and maturation phase and τ = 1
corresponds to the mature cells that join the blood stream) and ν (t,τ ) represents the rate of cell
differentiation. The number of cells in the quiescent stage are given as no(t,τ ). The cycling
between the quiescent and active cell populations is given as
7/27/2019 Mathematical Modeling of Transport and Reaction in Cellular and T
http://slidepdf.com/reader/full/mathematical-modeling-of-transport-and-reaction-in-cellular-and-t 61/270
41
o
o nnt
n⋅−⋅=
∂
∂α β
(2.19)
The kinetic model equations 2.16-219 are simultaneously solved to obtain the cell numbers of
different cell types at different stages of differentiation. However to be noted here, the model is
discrete, not continuous, hence it does not account for the continuous process of cell growth,
differentiation, expansion, maturation, and cell death. Moreover, the model does not incorporate
the effects of the cell growth environment, which typically plays a major role in the process of
hematopoiesis. These models have been applied for erythropoietic and granulopoietic processes.
For example, in the erythropoietic process the model can predict the total cell number along the
differentiation lineage and the total number of mature blood cells (RBCs). Using these data it
has been determined that TGF-β1 (differentiation promoting cytokine) accelerated differentiation
throughout the pathway rather than at a particular stage in the pathway.
2.6 Introduction to method of volume averaging
The method of volume averaging first developed by Whitaker (1967) is a technique used to
analyze transport and reaction in multiphase systems. Species continuity equations (mass
balances) describing transport and reaction of every species in particular phases in multiphase
systems can be spatially smoothed to obtain equations that are valid everywhere. Thus, in other
words, the volume averaging approach allows for a single reacting species for example in a two-
phase system, to be represented by a single averaged continuity equation. These equations are
called volume averaged equations (Whitaker, 1999). This method is explained by means of an
example below.
Oxygen transport in respiring tissue can be studied using the method of volume averaging.
Figure 2.7 illustrates the system of analysis. The first step is to select an averaging volume ‘V ’
as shown in Figure 2.7. The averaging volume is large in comparison to the cell volume,
however, much smaller than the total system volume. This volume is representative of the whole
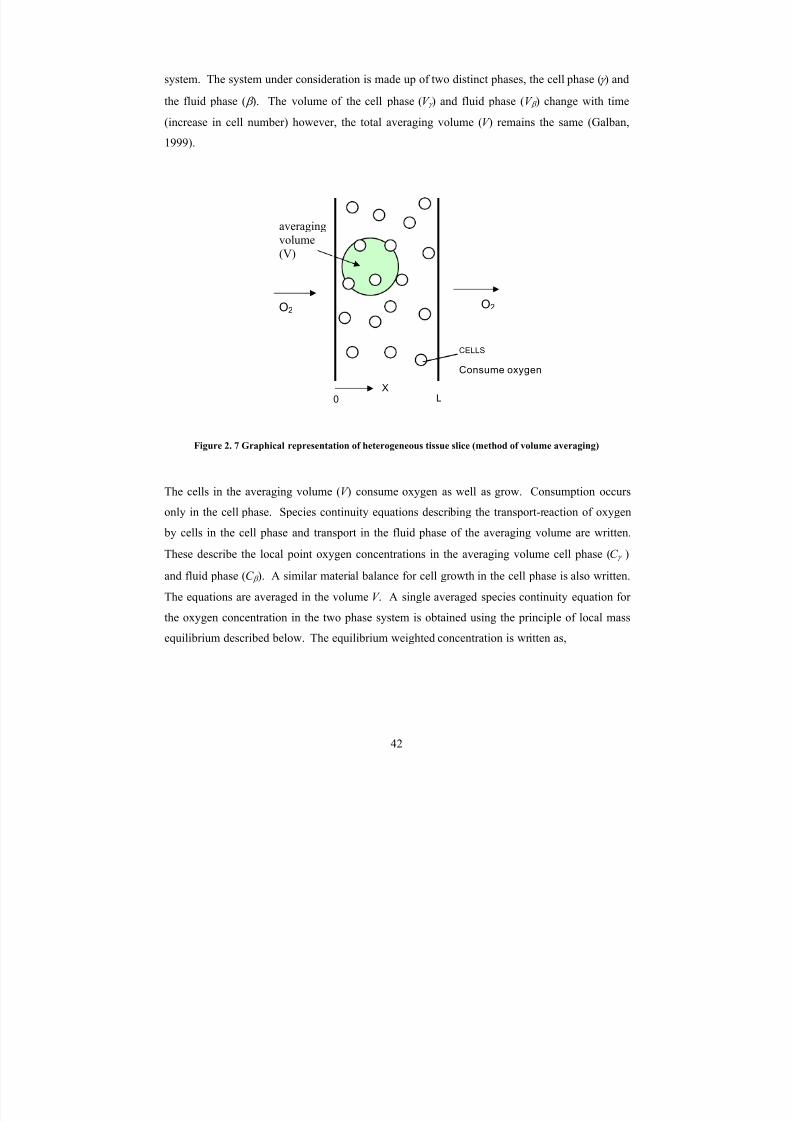
7/27/2019 Mathematical Modeling of Transport and Reaction in Cellular and T
http://slidepdf.com/reader/full/mathematical-modeling-of-transport-and-reaction-in-cellular-and-t 62/270
42
system. The system under consideration is made up of two distinct phases, the cell phase (γ ) and
the fluid phase ( β ). The volume of the cell phase (V γ ) and fluid phase (V β ) change with time
(increase in cell number) however, the total averaging volume (V ) remains the same (Galban,
1999).
Figure 2. 7 Graphical representation of heterogeneous tissue slice (method of volume averaging)
The cells in the averaging volume (V ) consume oxygen as well as grow. Consumption occurs
only in the cell phase. Species continuity equations describing the transport-reaction of oxygen
by cells in the cell phase and transport in the fluid phase of the averaging volume are written.
These describe the local point oxygen concentrations in the averaging volume cell phase (C γ )
and fluid phase (C β ). A similar material balance for cell growth in the cell phase is also written.
The equations are averaged in the volume V . A single averaged species continuity equation for
the oxygen concentration in the two phase system is obtained using the principle of local mass
equilibrium described below. The equilibrium weighted concentration is written as,
X0 L
O2 O2
CELLS
Consume oxygen
averaging
volume
(V)
7/27/2019 Mathematical Modeling of Transport and Reaction in Cellular and T
http://slidepdf.com/reader/full/mathematical-modeling-of-transport-and-reaction-in-cellular-and-t 63/270
43
{ }β
β β
γ
γ γ ε ε C C K
dV C V
C eqV
⋅+⋅⋅=⋅≡ ∫11
(2.20)
along with the macroscopic spatial deviation concentrations given by,
{ }
{ }C C C
C K C C eq
−=
⋅−=
β
β β
γ
γ γ
^
^
(2.21)
and the local spatial deviation in concentration is given by Gray’s decomposition
β
β β β
γ
γ γ γ
C C C
C C C
−=
−=
~
~
(2.22)
where iε is the ith
volume fraction (V i /V ),i
iC is the intrinsic phase average concentration and
K eq is the equilibrium coefficient. Equation 2.22 is based on the fact that the macroscopic spatial
deviations in concentration in β and γ phase given as^
iC is zero when the system is in
equilibrium. The averaged species continuity equations in both the phases are now reduced to a
single equation expressed in terms of both the volume averaged concentration and the local and
macroscopic spatial deviation concentrations. Similar equations are also used in the derivation
of the cell growth equations.
The final step in this approach is to obtain a differential equation for the local spatial deviations
β
~
C and γ
~
C . This is called the ‘closure problem’. Thus, this closure problem would provide a

7/27/2019 Mathematical Modeling of Transport and Reaction in Cellular and T
http://slidepdf.com/reader/full/mathematical-modeling-of-transport-and-reaction-in-cellular-and-t 64/270
44
solution for the local spatial deviation concentration in terms of geometry of the averaged
system. Thus, an effective diffusion coefficient and an effective rate coefficient are derived
which are functions of cell volume fraction. The macroscopic spatial deviation concentration
can be assumed to be very small in comparison to the local spatial deviation concentration.
These equations coupled to the single averaged species continuity equation would give the
species (oxygen/cells) variation in the entire volume (Ochoa, 1986; Galban, 1999; Whitaker,
1999).
In this study we have used this established approach for the analysis of transport process in
multiphase systems. Details of the implications are discussed for the various systems in
Chapters 3, 4, 5, 6 and 7.

7/27/2019 Mathematical Modeling of Transport and Reaction in Cellular and T
http://slidepdf.com/reader/full/mathematical-modeling-of-transport-and-reaction-in-cellular-and-t 65/270
45
CHAPTER 3
ROLE OF NUTRIENT SUPPLY AND PRODUCT FORMATION
ON CELL GROWTH IN BIOREACTOR DESIGN FOR TISSUE
ENGINEERING OF HEMATOPOIETIC CELLS
Analysis of oxygen supply on granulocyte progenitor cell growth in
3-dimensional perfusion bioreactor( Pathi et al., 2005 a; Reproduced with permission from John Wiley & Sons, Inc.)
3.1 Problem Statement
In the present study, a dynamic mathematical model of the growth of granulocyte progenitors in
the hematopoietic process is developed based on the principles of diffusion and chemical
reaction. This model simulates granulocyte progenitor cell growth and oxygen consumption in a
three-dimensional (3-D) perfusion bioreactor system. Molar balances describing oxygen
consumption and cell growth are developed using the volume averaging approach (Whitaker,
1999). Spatial variations of oxygen concentration and granulocyte progenitor cell density areobtained in the bioreactor in order to assess the roles of convection and diffusion on oxygen
supply and cell growth. The model provides quantitative estimates of the oxygen consumption
for growth and for metabolism, and information on oxygen consumption and cell growth are
further used to estimate the roles of key bioreactor design parameters, including flow rates and
liquid depth, and to optimize the reactor performance.

7/27/2019 Mathematical Modeling of Transport and Reaction in Cellular and T
http://slidepdf.com/reader/full/mathematical-modeling-of-transport-and-reaction-in-cellular-and-t 66/270
46
3.2 Model Formulation
3.2.1 Reactor Design
Analysis of granulocyte progenitor cell proliferation is conducted for a 3-dimensional perfusion
bioreactor system developed in Dr Teng Ma’s lab at Florida State University. The bioreactor is a
rectangular block with 10 cm length, 2.5 cm width, and 13.2 mm thick. This bioreactor has a
polyethylene terapthalate (PET) porous matrix (1.2 mm thick) sandwiched between two
perfusion chambers made of polycarbonate (PC). A gas permeable FEP (fluorocarbon film)
membrane is attached on the outer sides along the length of the perfusion chambers as shown in
Figure 3.1. The bioreactor is placed in an incubator with a fixed oxygen supply. Cells grow in
the matrix and form the cell layer of the bioreactor. Medium supplying nutrients to cells in the
cell layer flows through the perfusion chambers above and below the cell layer (labeled bulk
liquid layers). Oxygen diffuses into the reactor through the FEP membranes into the bulk liquid
layers.
The modes of mass transport are convection, diffusion, and inter-phase mass transport across the
gas permeable membranes. In the bulk liquid layer oxygen is subject to both convective and
diffusive transport, whereas in the cell layer oxygen is carried only by diffusive transport. The
absence of flow in the cell layer prevents flow restrictions on cell growth by, for example, shear
forces. Furthermore, the absence of flow in this region promotes adhesion of the cells to the
matrix surface. Oxygen can be supplied by convection through either a once through mode or by
recirculation of the bulk liquid layer medium as well as through inter-phase mass transport across
the FEP membrane from the incubator.
3.2.2 Mathematical model
A mathematical model is developed for this reactor to quantitatively describe the oxygen
concentration variations in space and time. The model describes the effect of oxygen supply on
the growth of cells. This model is also used to assess various configurations for the design of the
bioreactor by quantifying the relative contributions of the diffusive oxygen supply through the
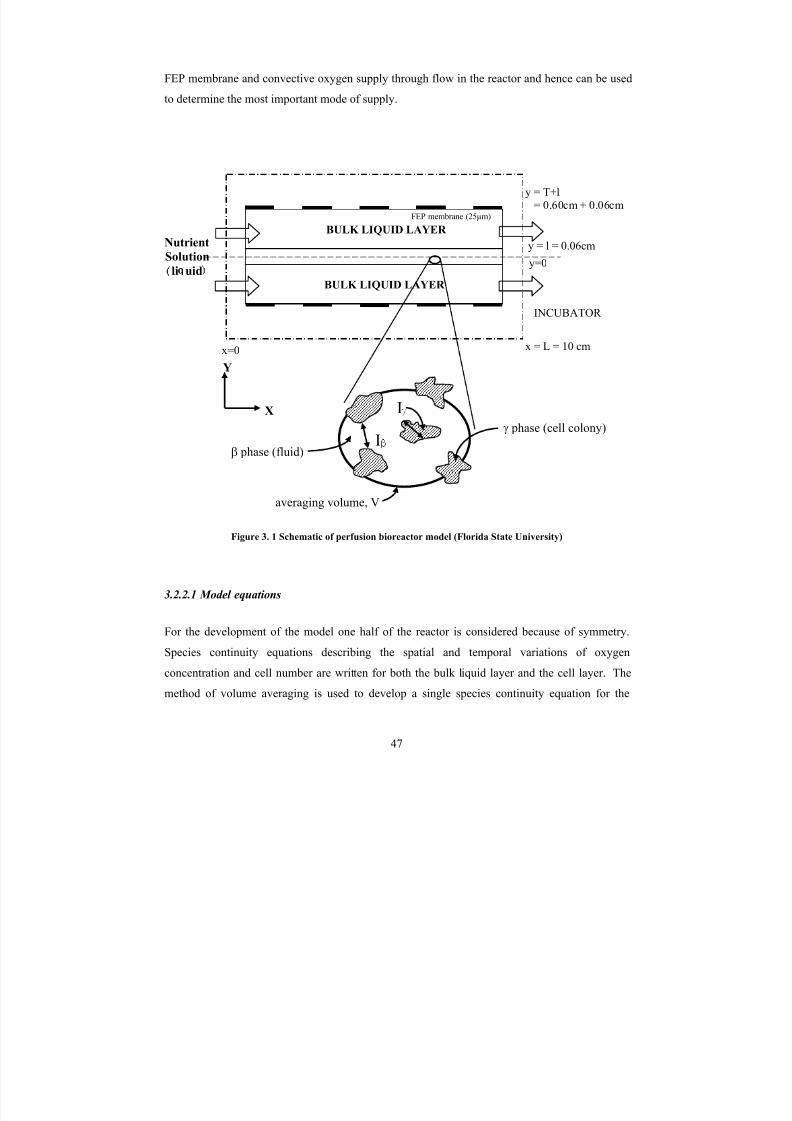
7/27/2019 Mathematical Modeling of Transport and Reaction in Cellular and T
http://slidepdf.com/reader/full/mathematical-modeling-of-transport-and-reaction-in-cellular-and-t 67/270
47
FEP membrane and convective oxygen supply through flow in the reactor and hence can be used
to determine the most important mode of supply.
Figure 3. 1 Schematic of perfusion bioreactor model (Florida State University)
3.2.2.1 Model equations
For the development of the model one half of the reactor is considered because of symmetry.
Species continuity equations describing the spatial and temporal variations of oxygen
concentration and cell number are written for both the bulk liquid layer and the cell layer. The
method of volume averaging is used to develop a single species continuity equation for the
Nutrient
Solution
li uid
INCUBATOR
BULK LIQUID LAYER
FEP membrane (25µm)
x=0 x = L = 10 cm
y=0
y = l = 0.06cm
y = T+l= 0.60cm + 0.06cm
BULK LIQUID LAYER
γ phase (cell colony)
β phase (fluid)
averaging volume, V
I
IX
Y

7/27/2019 Mathematical Modeling of Transport and Reaction in Cellular and T
http://slidepdf.com/reader/full/mathematical-modeling-of-transport-and-reaction-in-cellular-and-t 68/270
48
multiphase cell layer made up of cells and medium solution (Wood et al ., 2000; Wood et al ,
2002; Whitaker, 1999; Galban and Locke, 1999). Volume averaging allows representation of the
local 3-dimensional structure in the porous matrix where the cells are growing. The primary
factor in the present model affected by this 3-dimensional structure is the effective diffusion
coefficient. It can be noted that the overall reactor model is solved in two dimensions since the
width of the reactor is much larger than the depth and thus variations in the width are neglected.
Bulk liquid layer
The bulk liquid consists of the nutrient medium solution containing dissolved oxygen. Transport
of oxygen takes place by diffusion and convective flow in this layer. There are no cells in this
layer, hence there are no reaction terms describing oxygen consumption. The molar species
continuity equation describing the oxygen concentration variation in space and time is given as
cvc Dt
c∇⋅−∇⋅∇=
∂∂
)( β
(3.1)
where c is the non-dimensionless oxygen concentration in the bulk liquid layer *, D β is the
oxygen diffusion coefficient in the liquid, ν is the velocity vector of the fluid flow. The one-
dimensional flow is oriented along the reactor length (x-direction) and is assumed to be laminar
(Re=0.17). The velocity profile is thus
( ) ( ) ( )[ ]l T l y y yl T T
vv
avg
x ⋅+−⋅−⋅+∗⋅
= 2
22
6
(3.2)
where vavg is the average velocity of medium flow in the perfusion chamber (bulk liquid layer), y
is the direction perpendicular to the direction of flow, l is half the height of the matrix (cell layer)
and T is the height of the liquid layer in the bioreactor.
* The oxygen concentration terms are non-dimensionalized by dividing the oxygen concentration at any point in
space and time with the dissolved oxygen concentration in equilibrium with air (20% oxygen).

7/27/2019 Mathematical Modeling of Transport and Reaction in Cellular and T
http://slidepdf.com/reader/full/mathematical-modeling-of-transport-and-reaction-in-cellular-and-t 69/270
49
Cell layer
The cell layer is a two phase region made up of cells and the liquid nutrient medium. The cell
phase is indicated as the γ phase and the nutrient or liquid phase is indicated as the β phase. As
discussed above the method of volume averaging is used to formulate the material balances for
this multi-phase transport problem. Equations valid in a particular phase are written and
spatially smoothed to produce equations that are valid everywhere in the reactor (Whitaker,
1999).
In this method a small representative volume termed the averaging volume (V ) is selected.
Figure 3.1 shows a schematic of the averaging volume. Cell growth is expressed in terms of the
cell volume fraction (εγ), i.e., the volume occupied by cells in the averaging volume, Vγ, relative
to the total averaging volume V in the cell layer. The sum of the volume fractions of the cell
phase and the fluid phase in the averaging volume is one.
β γ ε ε +=1
(3.3)
Molar balances describing the oxygen concentration and cell growth in the cell phase and
nutrient phase (in the averaging volume) are described below.
Nutrient balance
Oxygen is assumed to be the rate limiting nutrient since it plays an important role in granulocyte
progenitor expansion and also because other much more soluble nutrients such as glucose are
assumed to be present in excess. The molar species continuity equations for oxygen include
diffusive transport and consumption in the cell layer and are written for the β (liquid) and γ (cell)
phases as,
β β
β C D
t
C ∇⋅∇=
∂
∂in Vβ
(3.4 a)

7/27/2019 Mathematical Modeling of Transport and Reaction in Cellular and T
http://slidepdf.com/reader/full/mathematical-modeling-of-transport-and-reaction-in-cellular-and-t 70/270
50
g m k k C Dt
C −−∇⋅∇=
∂
∂γ γ
γ in Vγ
(3.4 b)
where C β and C γ are the oxygen concentrations in the fluid phase (β) and cell phase (γ),
respectively; D β and Dγ are the oxygen diffusivities in β and γ phases, respectively; k m and k g are
the oxygen consumption rates by these cells for metabolism and for growth, respectively.
The cells consume oxygen both for metabolic requirements (Hevehan et al ., 2000) as well as for
growth. The metabolic oxygen consumption by cells is suggested in previous literature (Collins
et al ., 1998; Chow et al ., 2001) to be best described by a Michaelis-Menten kinetics,
γ
γ
C K
C Qk
m
mm
m +
⋅=
(3.5)
where Qmm and K m are the metabolic rate parameters. The parameters used in the present study
were obtained from the literature and are listed in Appendix A. The growth rate is given by an
inhibitory kinetic form, and the oxygen consumption for growth is written as,
21
1
γ
γ
γ
C K
C K
C kk
Y k
I
g
++
⋅•=
(3.6)
where Y is the yield coefficient given as the ratio of the mass of cells to the mass of oxygen
consumed and kk , K1, K I are the growth rate parameters. The reason for the use of this type of
kinetic function is described in detail later in the text.

7/27/2019 Mathematical Modeling of Transport and Reaction in Cellular and T
http://slidepdf.com/reader/full/mathematical-modeling-of-transport-and-reaction-in-cellular-and-t 71/270
51
The material balances equations. 3.4 (a) and 3.4 (b) describe the variation of oxygen
concentration in the cell phase and in the fluid phase of V and are generally applicable at any
spatial position in the appropriate phase in V . In order to develop a locally averaged equation to
describe the concentration fields in the cell layer of the reactor, these equations are averaged
spatially to obtain volume-averaged equations. The principle of local mass equilibrium is used
to obtain a single averaged species continuity equation for the oxygen concentration variation in
V (Whitaker, 1999; Ochoa, 1988; Galban and Locke, 1999). Thus, using the kinetic expressions
for oxygen consumption described in equations 3.5 and 3.6, the single averaged species
continuity equation is written as,
21
1
C K C K
C kk
Y C K K
C K QC D
t
C
I
eqm
eqmm
eff
++
⋅⋅⋅−
⋅+
⋅⋅⋅−∇∇=
∂
∂ γ γ ε ε
(3.7)
where C is the volume-averaged dimensional oxygen concentration and Deff is the effective
diffusion coefficient.
The averaged equation 3.7 is obtained assuming the following length scale constraints in the
averaging volume (Galban and Locke, 1999; Carbonell and Whitaker, 1984; Wood et al ., 1994;
Wood et al ., 2002),
l
R
R
l or
l
R
R
l >>>> β γ
(3.8)
where l β and l γ are the distances across the respective phase (fluid and cell respectively) within
averaging volume (V ), R is the radius of averaging volume, and l is the height of the bioreactor
cell layer or the matrix. At least one of these constraints must be valid for changes in cell
volume fraction over time. The initial length scale for the cell phase (l γ ) is nearly 10 µm while
the initial length scale for the liquid phase is approximately 50 µm. As the cell density increases
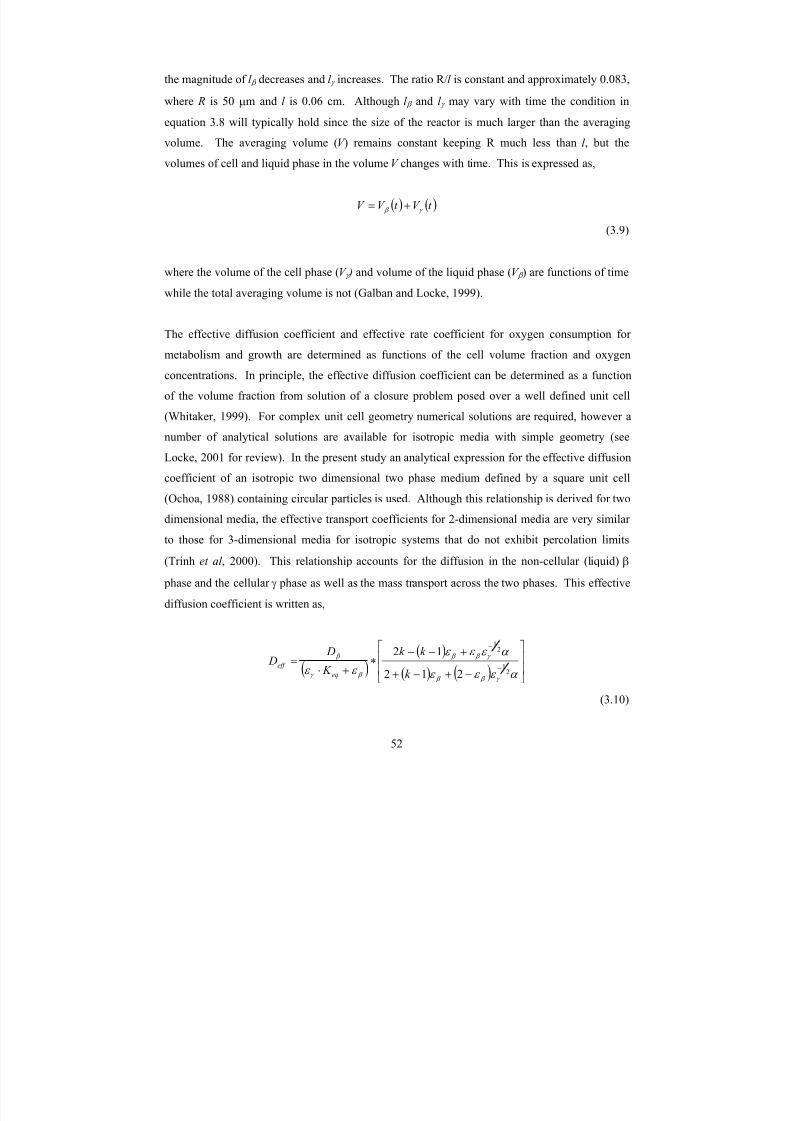
7/27/2019 Mathematical Modeling of Transport and Reaction in Cellular and T
http://slidepdf.com/reader/full/mathematical-modeling-of-transport-and-reaction-in-cellular-and-t 72/270
52
the magnitude of l β decreases and l γ increases. The ratio R/l is constant and approximately 0.083,
where R is 50 µm and l is 0.06 cm. Although l β and l γ may vary with time the condition in
equation 3.8 will typically hold since the size of the reactor is much larger than the averaging
volume. The averaging volume (V ) remains constant keeping R much less than l , but the
volumes of cell and liquid phase in the volume V changes with time. This is expressed as,
( ) ( )t V t V V γ β +=
(3.9)
where the volume of the cell phase (V γ ) and volume of the liquid phase (V β ) are functions of time
while the total averaging volume is not (Galban and Locke, 1999).
The effective diffusion coefficient and effective rate coefficient for oxygen consumption for
metabolism and growth are determined as functions of the cell volume fraction and oxygen
concentrations. In principle, the effective diffusion coefficient can be determined as a function
of the volume fraction from solution of a closure problem posed over a well defined unit cell
(Whitaker, 1999). For complex unit cell geometry numerical solutions are required, however a
number of analytical solutions are available for isotropic media with simple geometry (see
Locke, 2001 for review). In the present study an analytical expression for the effective diffusion
coefficient of an isotropic two dimensional two phase medium defined by a square unit cell
(Ochoa, 1988) containing circular particles is used. Although this relationship is derived for two
dimensional media, the effective transport coefficients for 2-dimensional media are very similar
to those for 3-dimensional media for isotropic systems that do not exhibit percolation limits
(Trinh et al , 2000). This relationship accounts for the diffusion in the non-cellular (liquid) β
phase and the cellular γ phase as well as the mass transport across the two phases. This effective
diffusion coefficient is written as,
( )( )
( ) ( ) ⎥⎥
⎦
⎤
⎢⎢
⎣
⎡
−+−+
+−−∗
+⋅=
−
−
α ε ε ε
α ε ε ε
ε ε γ β β
γ β β
β γ
β
21
21
212
12
k
k k
K
D D
eq
eff
(3.10)
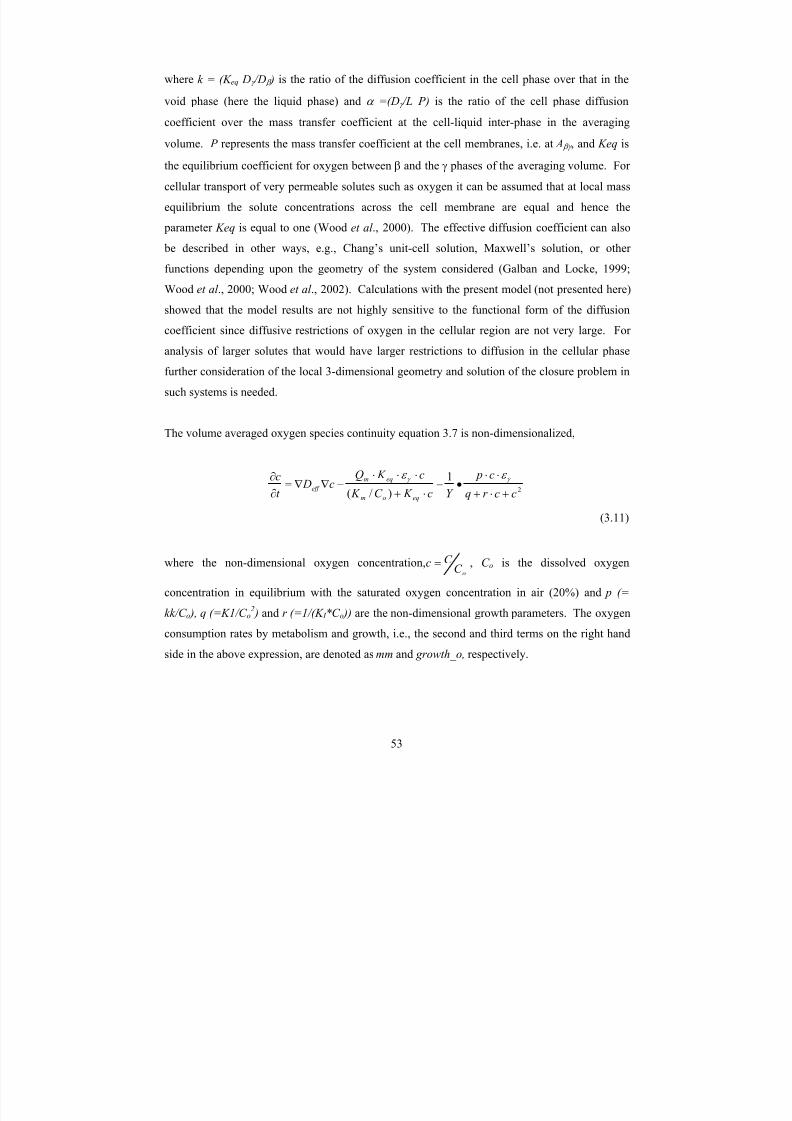
7/27/2019 Mathematical Modeling of Transport and Reaction in Cellular and T
http://slidepdf.com/reader/full/mathematical-modeling-of-transport-and-reaction-in-cellular-and-t 73/270
53
where k = (K eq Dγ /D β ) is the ratio of the diffusion coefficient in the cell phase over that in the
void phase (here the liquid phase) and α =(Dγ /L P) is the ratio of the cell phase diffusion
coefficient over the mass transfer coefficient at the cell-liquid inter-phase in the averaging
volume. P represents the mass transfer coefficient at the cell membranes, i.e. at A βγ , and Keq is
the equilibrium coefficient for oxygen between β and the γ phases of the averaging volume. For
cellular transport of very permeable solutes such as oxygen it can be assumed that at local mass
equilibrium the solute concentrations across the cell membrane are equal and hence the
parameter Keq is equal to one (Wood et al ., 2000). The effective diffusion coefficient can also
be described in other ways, e.g., Chang’s unit-cell solution, Maxwell’s solution, or other
functions depending upon the geometry of the system considered (Galban and Locke, 1999;
Wood et al ., 2000; Wood et al ., 2002). Calculations with the present model (not presented here)
showed that the model results are not highly sensitive to the functional form of the diffusion
coefficient since diffusive restrictions of oxygen in the cellular region are not very large. For
analysis of larger solutes that would have larger restrictions to diffusion in the cellular phase
further consideration of the local 3-dimensional geometry and solution of the closure problem in
such systems is needed.
The volume averaged oxygen species continuity equation 3.7 is non-dimensionalized,
2
1
)/( ccr q
c p
Y c K C K
c K Qc D
t
c
eqom
eqm
eff +⋅+
⋅⋅•−
⋅+
⋅⋅⋅−∇∇=
∂∂ γ γ ε ε
(3.11)
where the non-dimensional oxygen concentration,oC
C c = , C o is the dissolved oxygen
concentration in equilibrium with the saturated oxygen concentration in air (20%) and p (=
kk/C o ), q (=K1/C o2 ) and r (=1/(K I *C o )) are the non-dimensional growth parameters. The oxygen
consumption rates by metabolism and growth, i.e., the second and third terms on the right hand
side in the above expression, are denoted as mm and growth_o, respectively.
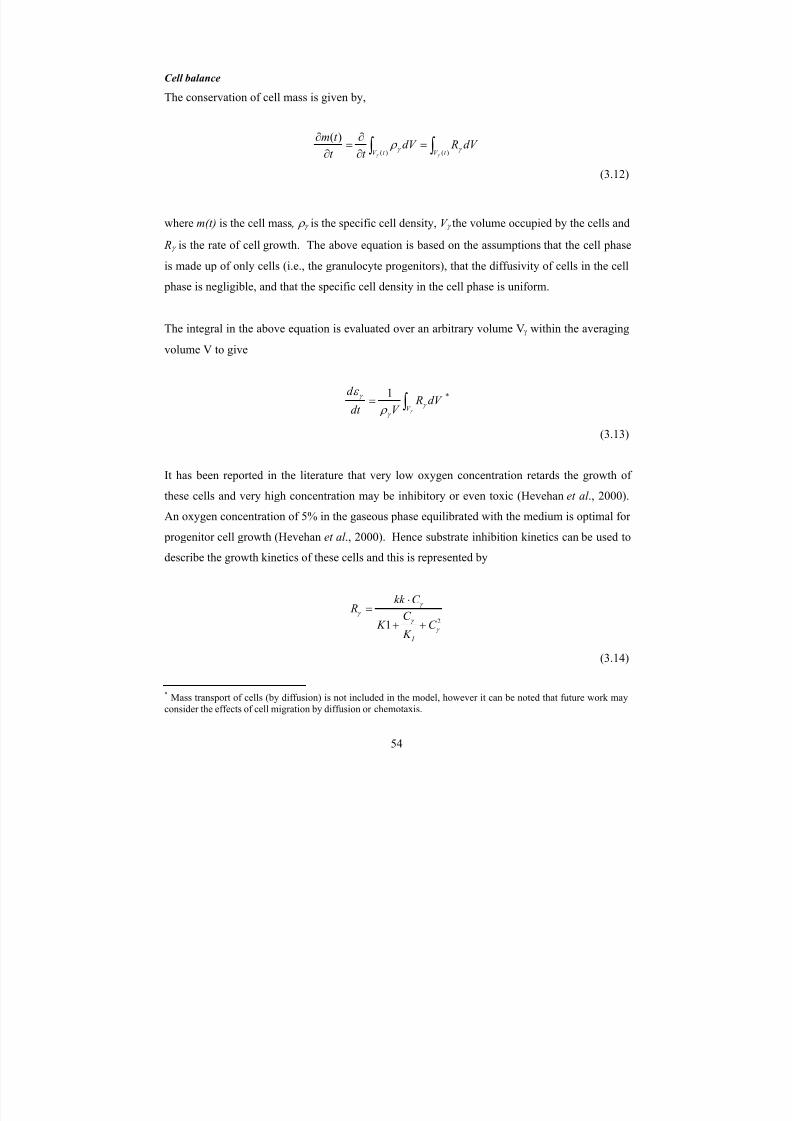
7/27/2019 Mathematical Modeling of Transport and Reaction in Cellular and T
http://slidepdf.com/reader/full/mathematical-modeling-of-transport-and-reaction-in-cellular-and-t 74/270
54
Cell balance
The conservation of cell mass is given by,
∫ ∫=
∂
∂=
∂
∂)( )(
)(
t V t V
dV RdV t t
t m
γ γ γ γ
ρ
(3.12)
where m(t) is the cell mass , ρ γ is the specific cell density, V γ the volume occupied by the cells and
Rγ is the rate of cell growth. The above equation is based on the assumptions that the cell phase
is made up of only cells (i.e., the granulocyte progenitors), that the diffusivity of cells in the cell
phase is negligible, and that the specific cell density in the cell phase is uniform.
The integral in the above equation is evaluated over an arbitrary volume V γ within the averaging
volume V to give
∫=γ
γ
γ
γ
ρ
ε
V dV R
V dt
d 1 *
(3.13)
It has been reported in the literature that very low oxygen concentration retards the growth of
these cells and very high concentration may be inhibitory or even toxic (Hevehan et al ., 2000).
An oxygen concentration of 5% in the gaseous phase equilibrated with the medium is optimal for
progenitor cell growth (Hevehan et al ., 2000). Hence substrate inhibition kinetics can be used to
describe the growth kinetics of these cells and this is represented by
21 γ
γ
γ γ
C K
C K
C kk R
I
++
⋅=
(3.14)
* Mass transport of cells (by diffusion) is not included in the model, however it can be noted that future work may
consider the effects of cell migration by diffusion or chemotaxis.

7/27/2019 Mathematical Modeling of Transport and Reaction in Cellular and T
http://slidepdf.com/reader/full/mathematical-modeling-of-transport-and-reaction-in-cellular-and-t 75/270
55
where kk , K 1 and K I are the kinetic parameters. The values for these parameters were determined
using the experimental results of Hevehan et al . (2000). Oxygen consumption for cell growth in
equation 3.11 was obtained by multiplying a suitable yield coefficient to the above expression.
The cell material balance can be rewritten by substituting equation 3.14 in equation 3.13, and
further integrating and non-dimensionalizing to give,
cccr q
c p
t ⋅+⋅+
⋅⋅=
∂
∂ γ γ ε ε
(3.15)
where c is the dimensionless oxygen concentration, p, q, and r are the non-dimensional rate
parameters. The growth rate on the right hand side of equation 3.15 is denoted as growth. The
growth function is first order with respect to the cell volume fraction and the parameters are
determined to give maximal cell growth in regions where the oxygen concentration is the liquid
phase concentration that is in equilibrium with a 5% gas phase concentration.
Boundary conditions
Oxygen flux at the upper boundary of the bulk liquid layer with the membrane is represented by
the rate of mass transfer of oxygen from the incubator (saturated with oxygen in equilibrium with
concentration co) through the FEP membrane (with permeability, Perm) into the bulk liquid.
This boundary condition is written as,
)( cc Perm y
c D o −⋅=
∂∂
− β [ ] T l y L x +==∀ ,0
(3.16 a)
The Danckwerts boundary conditions, extensively applied to convection-diffusion problems in
chemical reactors, includes a flux balance at the inlet of the reactor coupled with a zero diffusive
gradient condition at the end of the reactor (Danckwerts, 1953). These conditions are given by

7/27/2019 Mathematical Modeling of Transport and Reaction in Cellular and T
http://slidepdf.com/reader/full/mathematical-modeling-of-transport-and-reaction-in-cellular-and-t 76/270
56
x
c Dcvcv in ∂
∂−⋅=⋅ β [ ] 0, =+=∀ xT l l y
(3.16 b)
0=∂∂ x
c D β [ ] L xT l l y =+=∀ ,
(3.16 c)
where cin is the dissolved oxygen concentration being delivered by flow at the inlet. The oxygen
concentration cin is equal to 20 % gas phase oxygen in equilibrium with the liquid phase.
The equal flux condition exists at the interface of the cell layer and the liquid layer, and it is
given as,
celllayer eff r liquidlayec Dc D ∇−=∇− β
(3.16 d)
It is assumed that there is no flux of oxygen along the external boundaries of the cell layer with
the solid walls of the reactor. Hence,
0=∇ c Deff [ ] 0,0 ==∀ xl y
(3.16 e)
0=∇ c Deff [ ] L xl y ==∀ ,0
(3.16 f)
0=∇ c Deff [ ] 0,0 ==∀ y L x
(3.16 g)

7/27/2019 Mathematical Modeling of Transport and Reaction in Cellular and T
http://slidepdf.com/reader/full/mathematical-modeling-of-transport-and-reaction-in-cellular-and-t 77/270
57
3.2.2.2 Solution procedure
The equations describing variations in oxygen concentration in the fluid layer (equation 2.1) and
in the cell region (equation 2.11) and the cell volume fraction in the cell region (equation 2.15) in
space and time are solved simultaneously coupled with the appropriate boundary conditions. A
MATLAB (version 6.5, The Mathworks, Inc.) based FEMLAB (version 2.3, COMSOL) program
utilizing a finite element method was used to numerically solve the system of partial differential
equations. The model is run from the initial state until the time point where the oxygen
concentration is depleted to zero at any position in the reactor. Since the model does not account
for inhibitory factors on cell growth such as natural cell death, the cell growth can also increase
without bound. Thus, an additional limit is when the cell volume fraction approaches 1.0.
3.2.2.3 Macroscopic area averaging
The locally averaged oxygen concentrations and cell volume fractions obtained using the
FEMLAB software can be further averaged over the entire domains, i.e., the cell layer and the
liquid layer, and these averages are referred to as macroscopic averages. One reason to compute
these averages is to condense a large amount of model output, in terms of time and 2-
dimensional spatial variations, into output containing only time variation. Thus, macroscopic
area averaging is performed to obtain the area averaged oxygen concentration c , cell volume
fraction γ ε , oxygen consumption rates ( mm , o growth _ ) and growth rate ( growth ) in
the bulk liquid layer and cell layer separately. For example the area averaged oxygen
concentration is obtained as,
∫∫
∫∫⋅
⋅⋅
=
A
A
dydx
dydxc
c
(3.17)
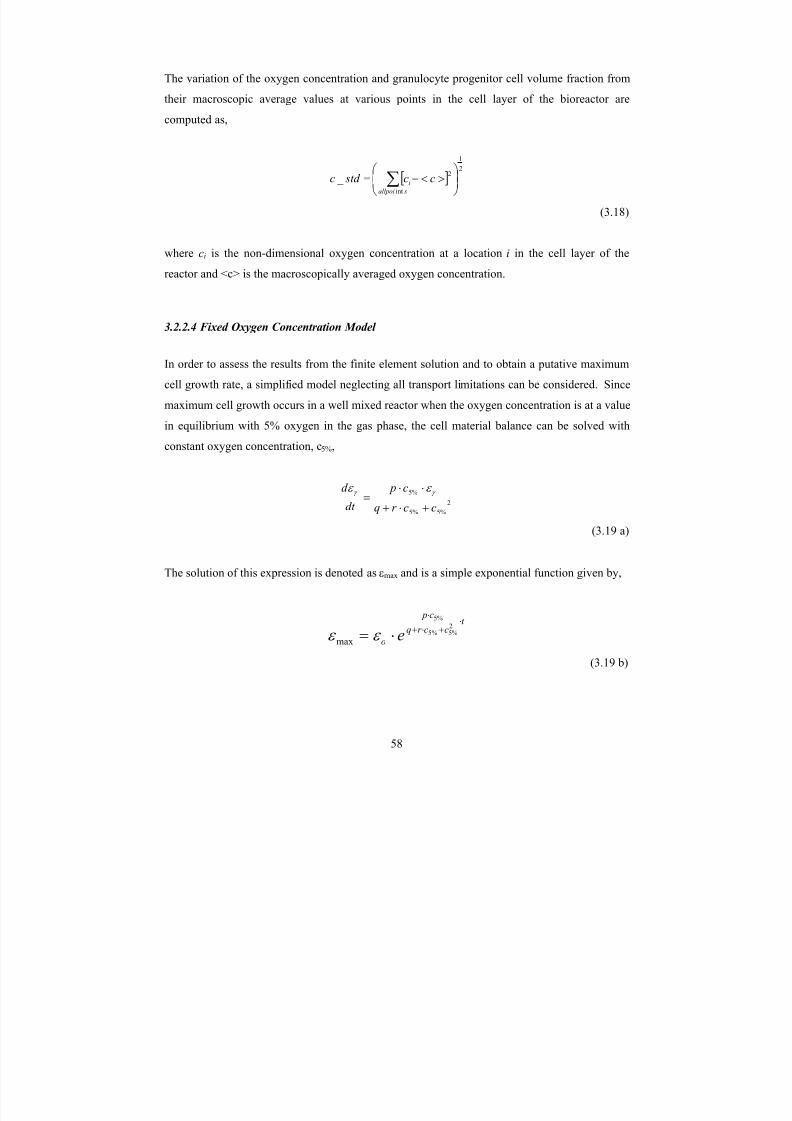
7/27/2019 Mathematical Modeling of Transport and Reaction in Cellular and T
http://slidepdf.com/reader/full/mathematical-modeling-of-transport-and-reaction-in-cellular-and-t 78/270
58
The variation of the oxygen concentration and granulocyte progenitor cell volume fraction from
their macroscopic average values at various points in the cell layer of the bioreactor are
computed as,
[ ]2
1
int
2 _ ⎟⎟
⎠
⎞⎜⎜⎝
⎛ ><−= ∑
sallpoi
i cc std c
(3.18)
where ci is the non-dimensional oxygen concentration at a location i in the cell layer of the
reactor and <c> is the macroscopically averaged oxygen concentration.
3.2.2.4 Fixed Oxygen Concentration Model
In order to assess the results from the finite element solution and to obtain a putative maximum
cell growth rate, a simplified model neglecting all transport limitations can be considered. Since
maximum cell growth occurs in a well mixed reactor when the oxygen concentration is at a value
in equilibrium with 5% oxygen in the gas phase, the cell material balance can be solved with
constant oxygen concentration, c5%,
2
%5%5
%5
ccr q
c p
dt
d
+⋅+
⋅⋅= γ γ ε ε
(3.19 a)
The solution of this expression is denoted as εmax and is a simple exponential function given by,
t ccr q
c p
o e⋅
+⋅+
⋅
⋅=2%5%5
%5
max ε ε
(3.19 b)

7/27/2019 Mathematical Modeling of Transport and Reaction in Cellular and T
http://slidepdf.com/reader/full/mathematical-modeling-of-transport-and-reaction-in-cellular-and-t 79/270
59
3.2.2.5 Well-Mixed bioreactor model
Another limit to the full spatial distribution model can be formed by assuming that the cell layer
and the fluid domain as well mixed compartments. This limit removes the spatial variation of
the oxygen concentrations in the cell and bulk liquid layers and the cell volume fraction in the
cell layer of the bioreactor while retaining the effects of nutrient mass transfer supply. Oxygen is
delivered to the reactor both by mass transfer through the membrane and by hydrodynamic flow
at the entrances and exits of the bulk liquid layer of the bioreactor. Hence, the molar balances
describing variation of the oxygen concentration in the cell layer (1) and bulk liquid layer (2) and
cell volume fraction are written as,
( ) ( )
( )
layer cell ccr q
c p
dt
d
layer cell cc Ak ccr q
c p
Y V
cc K
c K QV
dt
dcV
layer liquid bulk cc Ak cc Ak Fc Fcdt dcV
m
om
eqm
momin
2
22
2
2122
22
2
2
2
2
22
2
2121111
1
1
+⋅+
⋅⋅=
−++⋅+
⋅⋅⋅⋅−
⋅+
⋅⋅⋅⋅−=
−−−+−=
γ γ
γ
γ
γ
ε ε
ε
ε
ε
(3.20)
where V 1 and V 2 are the volumes of the cell and bulk liquid layers, respectively, F is the medium
flow rate, A is the area for mass transfer between the two layers, cin and co are the inlet dissolved
oxygen concentration through flow and through the FEP membrane in saturation with gas phase
oxygen concentration, respectively, and k m1 and k m2 are the mass transfer coefficients for
transport across the membrane to the bulk liquid layer and across the bulk liquid layer to the cell
layer, respectively. The rate of mass transfer across the membrane is determined by the
membrane permeability. Mass transfer in the presence of convective flow in the bulk liquid
layer, k m2 is dominated by the flow field and for laminar flow is written as (Middleman, 1998),
31
32
2 165.1 ⎟ ⎠
⎞⎜⎝
⎛ ⋅
><⋅⋅=
T L
v Dk m β
(3.21)

7/27/2019 Mathematical Modeling of Transport and Reaction in Cellular and T
http://slidepdf.com/reader/full/mathematical-modeling-of-transport-and-reaction-in-cellular-and-t 80/270
60
In principle, these equations can be obtained by averaging the material balances in equations 3.1,
3.11, 3.15 and 3.16 that includes the spatial variation terms.
3.3 Results and Discussion
The spatial variation of the dimensionless oxygen concentration at approximately 15 days in the
reactor is shown in Figure 3.2. The dimensionless oxygen concentration represents the fractional
liquid-phase oxygen saturation as mentioned earlier. The color represents the variation in
oxygen concentration in space, i.e., along the reactor length (varying from 0 cm to 10 cm) and
the reactor thickness (varying from 0 cm to 0.66 cm). The oxygen concentration of the inlet
flowing liquid and the oxygen concentration in the incubator are set to values in equilibrium with
20% gas phase oxygen (which corresponds to the non-dimensional value 1). The residence time
for flow is 1 hr, and the flow rate is computed as the ratio of the volume of the liquid layer and
the residence time of flow. The gradients in oxygen concentration seen in the bulk liquid layer
arise from mass transfer and flow coupled to reaction, i.e., consumption by cells in the cell layer,
that consume oxygen at a rate faster than it can be supplied. The oxygen concentration in the
cell layer is severely depleted by this time because of consumption by the cells (see also
discussion of Figure 3.4(a) below).
As discussed previously, the granulocyte progenitors in the cell layer consume oxygen for their
growth and metabolic needs. The consumption rates are functions of the oxygen concentration
and the amount of cells present at any time in space as shown in equation 3.11. In order to
obtain the total oxygen consumption rate for growth and the oxygen consumption rate for
metabolism in the cell layer at any time the rates are macroscopically averaged in the cell layer
(as given by equation 3.17) and are denoted as < growth_o> and <mm>, respectively. Thevariations in the macroscopically area-averaged consumption rates with time are shown in Figure
3.3. It can be seen that the oxygen consumption rates increase with time over a large time span
because of the formation of cells. However, when the oxygen concentration reaches very low
values where there is little available oxygen for consumption, the metabolic consumption rate
levels off. If the model is run for longer time, as the oxygen concentrations deplete to zero the
7/27/2019 Mathematical Modeling of Transport and Reaction in Cellular and T
http://slidepdf.com/reader/full/mathematical-modeling-of-transport-and-reaction-in-cellular-and-t 81/270
61
rate of metabolism will also decrease to zero. The figure also shows that the metabolic oxygen
consumption rate is nearly three orders of magnitude higher than the rate of oxygen consumption
for cell growth. This result is consistent with the fact that an individual cell spends much more
time in metabolism than in growth.
The variation of cell volume fraction in space (along with the corresponding expanded view of
the oxygen concentration in the cell layer) at approximately 15 days in the reactor is shown in
Figure 3.4 (for all the same parameters as in Figures 3.2 and 3.3). The maximum cell volume
fraction reached is around 0.63 (Figure 3.4(b)) and this corresponds to a cell density of 2.25 *108
cells/ml ( g V
densitycell γ ε
= ). The figure shows that the concentration of progenitor cells is
higher in the region closer to the center of the matrix and nearer to the source of convective
supply. This peak value in cell density is a result of the time course of the process whereby cells
seeded in the deep interior do not obtain enough oxygen for high growth rates while cells on the
periphery are exposed to more inhibitory oxygen levels. The oxygen concentration in the cell
layer at this time is almost completely depleted as seen in Figure 3.4(a). This result partially
resembles the in vivo state where the progenitors are found in the niches (with a relatively lower
oxygen concentration around 5%) farther away from the sinus (higher value of oxygen
concentration around 10%) and is essentially due to the inhibitory nature of the kineticsdescribing cell growth.
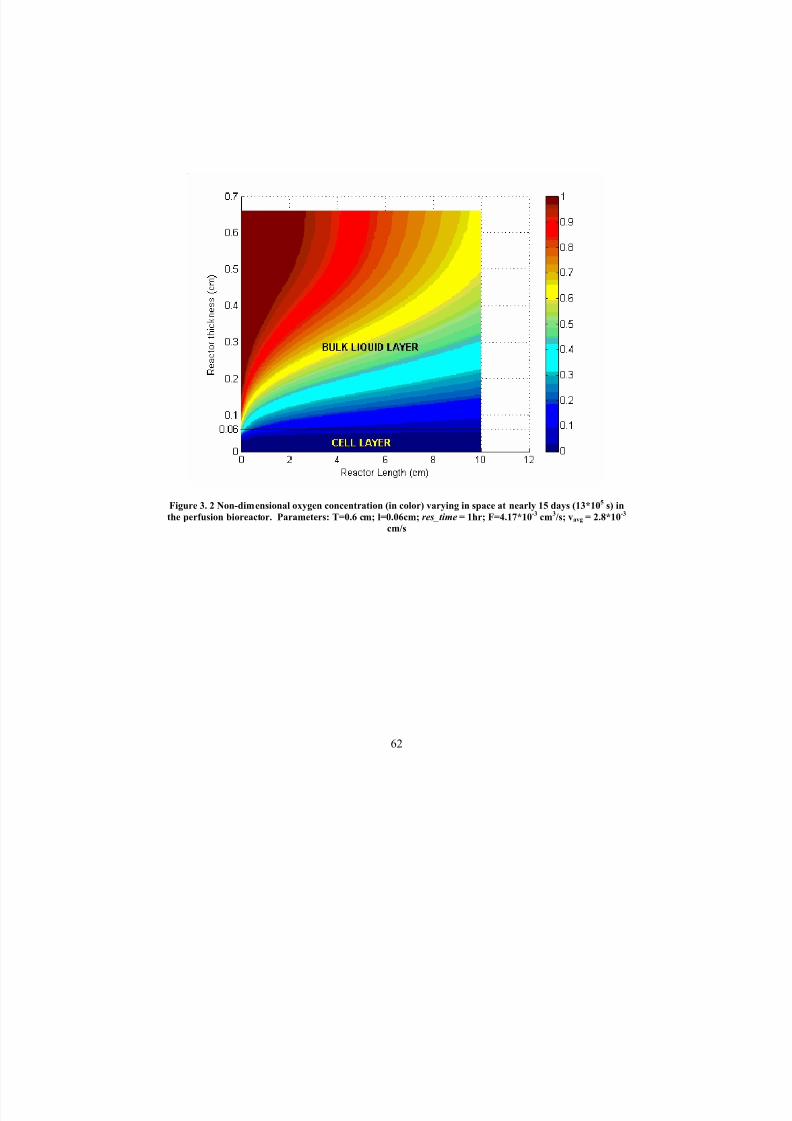
7/27/2019 Mathematical Modeling of Transport and Reaction in Cellular and T
http://slidepdf.com/reader/full/mathematical-modeling-of-transport-and-reaction-in-cellular-and-t 82/270
62
Figure 3. 2 Non-dimensional oxygen concentration (in color) varying in space at nearly 15 days (13*105 s) in
the perfusion bioreactor. Parameters: T=0.6 cm; l=0.06cm; res_time = 1hr; F=4.17*10-3
cm3/s; vavg = 2.8*10
-3
cm/s
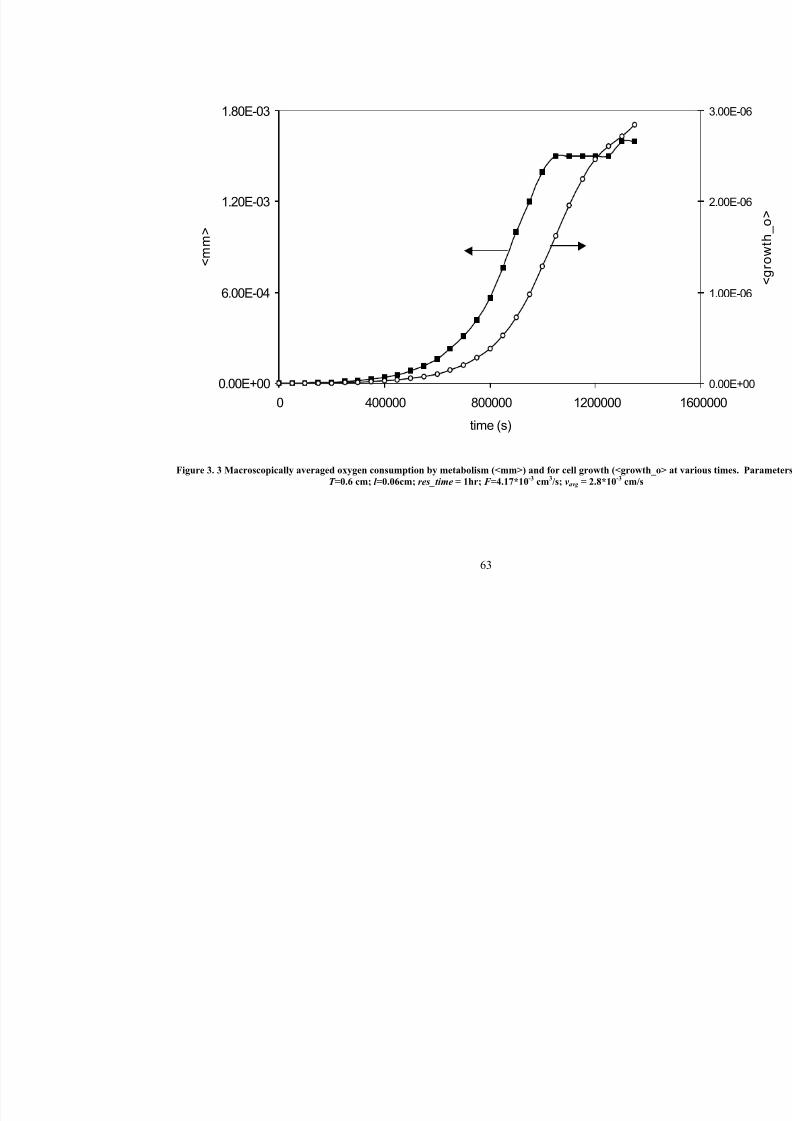
7/27/2019 Mathematical Modeling of Transport and Reaction in Cellular and T
http://slidepdf.com/reader/full/mathematical-modeling-of-transport-and-reaction-in-cellular-and-t 83/270
63
0.00E+00
6.00E-04
1.20E-03
1.80E-03
0 400000 800000 1200000
time (s)
< m m >
Figure 3. 3 Macroscopically averaged oxygen consumption by metabolism (<mm>) and for cell growth (<growth_o
T =0.6 cm; l =0.06cm; res_time = 1hr; F =4.17*10-3 cm3/s; vavg = 2.8*10-3 cm/s
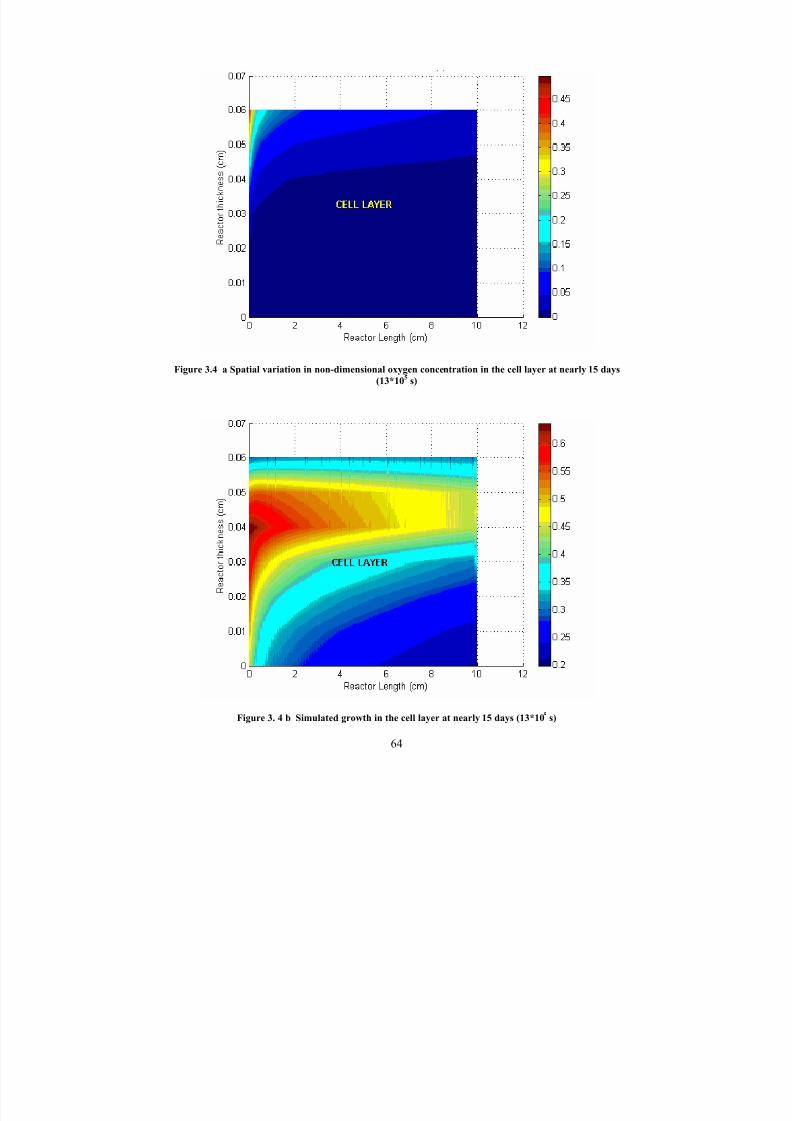
7/27/2019 Mathematical Modeling of Transport and Reaction in Cellular and T
http://slidepdf.com/reader/full/mathematical-modeling-of-transport-and-reaction-in-cellular-and-t 84/270
64
Figure 3.4 a Spatial variation in non-dimensional oxygen concentration in the cell layer at nearly 15 days
(13*105
s)
Figure 3. 4 b Simulated growth in the cell layer at nearly 15 days (13*105 s)
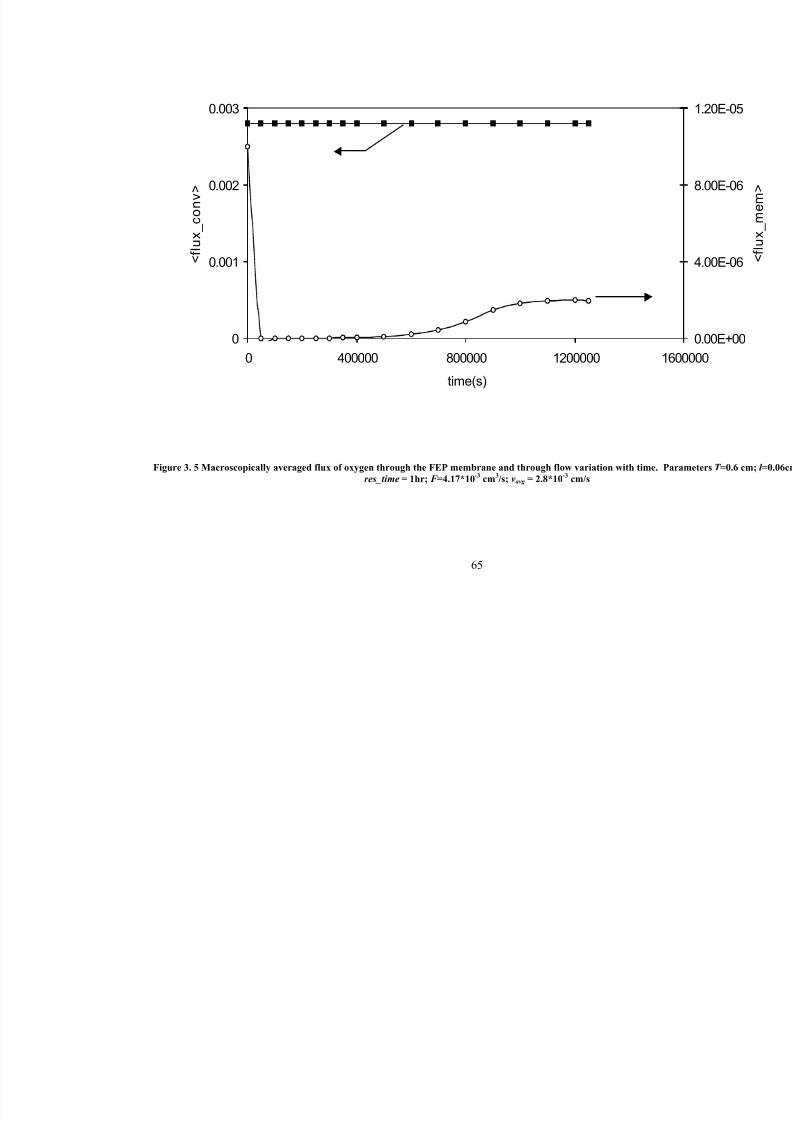
7/27/2019 Mathematical Modeling of Transport and Reaction in Cellular and T
http://slidepdf.com/reader/full/mathematical-modeling-of-transport-and-reaction-in-cellular-and-t 85/270
65
0
0.001
0.002
0.003
0 400000 800000 1200000
time(s)
< f l u x_
c o n v >
Figure 3. 5 Macroscopically averaged flux of oxygen through the FEP membrane and through flow variation with time.
res_time = 1hr; F =4.17*10-3
cm3/s; vavg = 2.8*10
-3cm/s

7/27/2019 Mathematical Modeling of Transport and Reaction in Cellular and T
http://slidepdf.com/reader/full/mathematical-modeling-of-transport-and-reaction-in-cellular-and-t 86/270
66
The perfusion bioreactor has two sources of oxygen: one by diffusion though the FEP membrane
from the incubator filled with oxygen saturated air (20% Oxygen) and the other by convective
flow with the entering media containing dissolved oxygen in equilibrium with saturated air (20%
Oxygen). The variations of the averaged fluxes of oxygen through these two sources with time
are plotted in Figure 3.5 (again for same parameters as in the previous figures). It can be seen
that the influx of oxygen by convective transport (< flux_conv>) is constant, as expected, and is
much higher than by diffusive transport through the membrane (< flux_mem>). As the cell
number increases with time the oxygen demand also increases leading to a larger oxygen
concentration gradients between the bulk liquid and incubator oxygen level, thus increasing the
supply of oxygen by diffusion across the membrane. However, membrane restrictions to oxygen
transport remain very high for all times, hence the values of average flux through the membrane,
< flux_mem> are always considerably smaller than the convective flux.
Design parameters
The model is also used to assess the effects of the liquid layer height, the residence time of the
fluid flow, and the various modes of oxygen supply. The objective is to determine how these
system parameters affect the spatial and temporal variations of cell density and oxygen
concentration in the bioreactor.
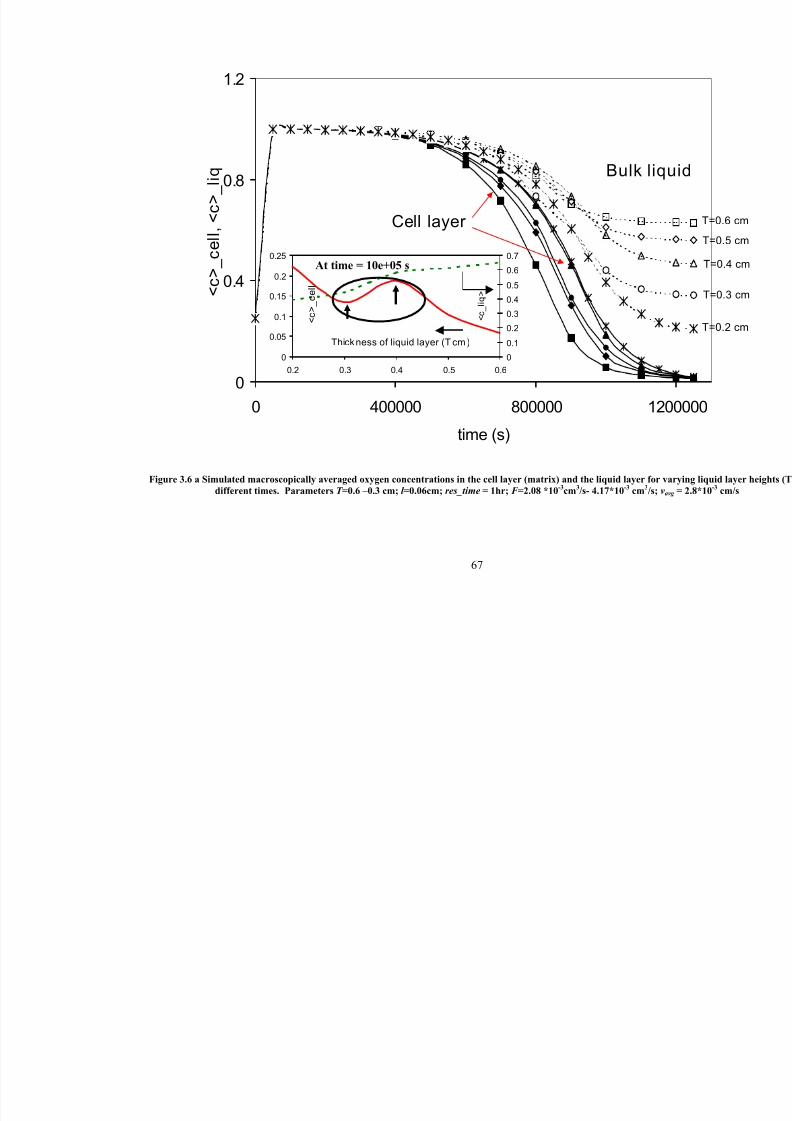
7/27/2019 Mathematical Modeling of Transport and Reaction in Cellular and T
http://slidepdf.com/reader/full/mathematical-modeling-of-transport-and-reaction-in-cellular-and-t 87/270
67
Figure 3.6 a Simulated macroscopically averaged oxygen concentrations in the cell layer (matrix) and the liquid layer for
different times. Parameters T =0.6 –0.3 cm; l =0.06cm; res_time = 1hr; F =2.08 *10-3
cm3/s- 4.17*10
-3cm
3/s; v
0
0.4
0.8
1.2
0 400000 800000 12
time (s)
< c >_
c e l l , < c >_
l i q Bulk liq
Cell layer
0
0.05
0.1
0.15
0.2
0.25
0.2 0.3 0.4 0.5 0.6
Thickness of liquid layer (T cm)
< c >_
c e l l
0
0.1
0.2
0.30.4
0.5
0.6
0.7
< c_
l i q >
At time = 10e+05 s

7/27/2019 Mathematical Modeling of Transport and Reaction in Cellular and T
http://slidepdf.com/reader/full/mathematical-modeling-of-transport-and-reaction-in-cellular-and-t 88/270
68
Figure 3.6 b Spatially averaged cell growth for various liquid layer heights at different time. ParametersT =0.6 –0.3 cm;
*10-3
cm3/s- 4.17*10
-3cm
3/s; vavg = 2.8*10
-3cm/s
0
0.1
0.2
0.3
0.4
0.5
0 400000 800000 1200000time (s)
< e p
T=
T=
T=
T=0.4
T=
0
0.05
0.1
0.15
0.2
0.2 0.3 0.4 0.5 0.6
T (cm) < e p > ( C e l l V o l u
f r a c t i o n )
At time = 10e+05 s
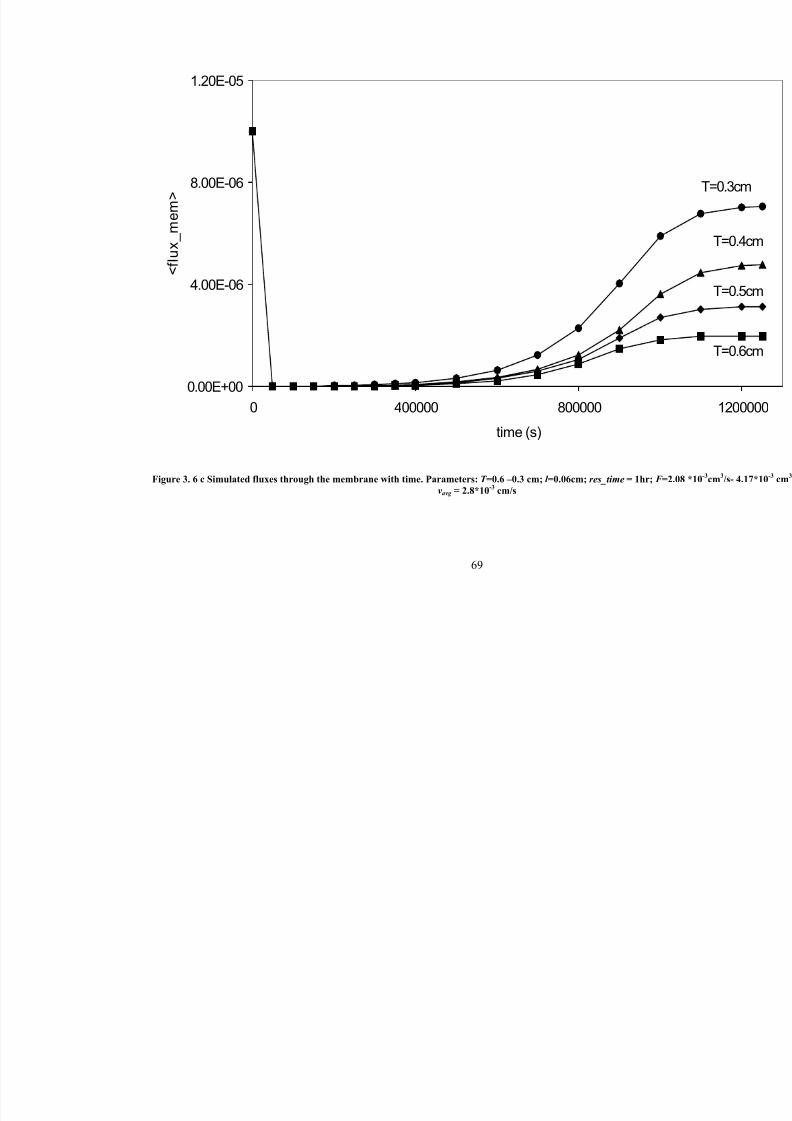
7/27/2019 Mathematical Modeling of Transport and Reaction in Cellular and T
http://slidepdf.com/reader/full/mathematical-modeling-of-transport-and-reaction-in-cellular-and-t 89/270
69
0.00E+00
4.00E-06
8.00E-06
1.20E-05
0 400000 800000
time (s)
< f l u x_
m e m >
Figure 3. 6 c Simulated fluxes through the membrane with time. Parameters: T =0.6 –0.3 cm; l =0.06cm; res_time = 1hr; F
vavg = 2.8*10-3
cm/s

7/27/2019 Mathematical Modeling of Transport and Reaction in Cellular and T
http://slidepdf.com/reader/full/mathematical-modeling-of-transport-and-reaction-in-cellular-and-t 90/270
70
0
0.3
0.6
0.9
0 400000 800000 1200000
time (s)
< c >_
c e l l
c_F=0 c_F=F/2c_F c_3F
ep_F=0 ep_F=F/2
ep_F ep_3F
Figure 3.7 a Simulated average oxygen concentration and averaged cell volume fraction in the cell layer of the bioreactor
l =0.06cm; res_time = 0hr-2hr; F =0 cm3/s- 8.33*10
-3cm
3/s; vavg = 2.8*10
-3cm/s

7/27/2019 Mathematical Modeling of Transport and Reaction in Cellular and T
http://slidepdf.com/reader/full/mathematical-modeling-of-transport-and-reaction-in-cellular-and-t 91/270
71
Figure 3. 7 b Spatial variation in cell volume fraction in the cell layer at nearly 15 days (13*105
s) for different residence ti
flow rates (F)
F=0 F=F low
F=Flo w F=3*F lo w
F=0 F=F low
F=Flo w F=3*F lo w
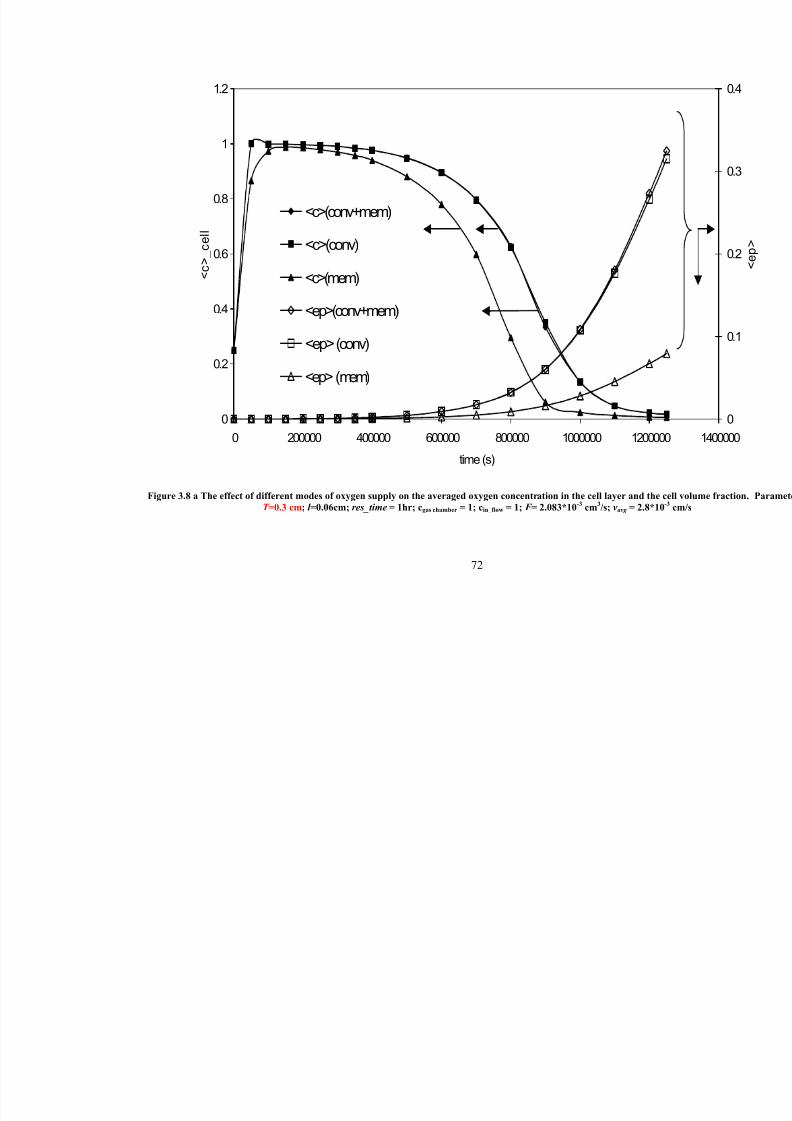
7/27/2019 Mathematical Modeling of Transport and Reaction in Cellular and T
http://slidepdf.com/reader/full/mathematical-modeling-of-transport-and-reaction-in-cellular-and-t 92/270
72
0
0.2
0.4
0.6
0.8
1
1.2
0 200000 400000 600000 800000 1000000 120000
time (s)
< c >_
c e l l
<c>(conv+mem)
<c>(conv)
<c>(mem)
<ep>(conv+mem)
<ep> (conv)
<ep> (mem)
Figure 3.8 a The effect of different modes of oxygen supply on the averaged oxygen concentration in the cell layer and the
T =0.3 cm; l =0.06cm; res_time = 1hr; cgas chamber = 1; cin_flow = 1; F = 2.083*10-3
cm3/s; vavg = 2.8*10

7/27/2019 Mathematical Modeling of Transport and Reaction in Cellular and T
http://slidepdf.com/reader/full/mathematical-modeling-of-transport-and-reaction-in-cellular-and-t 93/270
73
0
0.2
0.4
0.6
0.8
1
1.2
0 200000 400000 600000 800000 1000000 120000
time (s)
< c >_
c e l l
<c> (conv+mem)
<c> (conv)
<c> (mem)
<ep> (conv+mem)
<ep> (conv)
<ep> (mem)
Figure 3.8 b The effect of different modes of oxygen supply on the averaged oxygen concentration in the cell layer and the
T =0.4 cm; l =0.06cm; res_time = 1hr; cgas chamber = 1; cin_flow = 1; F = 2.8*10-3
cm3/s; vavg = 2.8*10
-

7/27/2019 Mathematical Modeling of Transport and Reaction in Cellular and T
http://slidepdf.com/reader/full/mathematical-modeling-of-transport-and-reaction-in-cellular-and-t 94/270
74
0
0.2
0.4
0.6
0.8
1
1.2
0 200000 400000 600000 800000 1000000 120000
time (s)
< c >_
c e l l
<c> (conv+mem)
<c> (conv)
<c> (mem)
<ep>(conv+mem)
<ep> (conv)
<ep> (mem)
Figure 3. 8 c The effect of different modes of oxygen supply on the averaged oxygen concentration in the cell layer and the
T =0.6 cm; l =0.06cm; res_time = 1hr; c gas chamber = 1; cin_flow = 1; F = 4.17*10-3
cm3/s; vavg = 2.8*10

7/27/2019 Mathematical Modeling of Transport and Reaction in Cellular and T
http://slidepdf.com/reader/full/mathematical-modeling-of-transport-and-reaction-in-cellular-and-t 95/270
75
Liquid layer height
Figure 3.6(a) shows the effect of varying the liquid layer height on the macroscopically area-
averaged oxygen concentrations in the cell and bulk liquid layers. The average oxygen
concentrations in the bulk liquid layer are higher for larger liquid layer heights since the bulk
molar flow rate is larger at a fixed residence time. At long times the oxygen concentrations in the
bulk liquid appear to level off indicating limitations in metabolic consumption. In general since
there is more available oxygen, the oxygen consumption rates are higher for larger liquid layer
heights thus leading to larger depletion of oxygen in the cell layer and thus the figure also shows
lower oxygen concentration in the cell layer at larger liquid layer thickness. However, the oxygen
profiles in the cell layer are not monotonic functions of the bulk liquid layer height as indicated by
similar rates of decrease for the 0.5 and 0.3 cm and the 0.4 and 0.2 cm. These trends are partially
reflected in the cell density profiles (Figure 3.6(b)) whereby growth is highest for 0.6 cm and
lowest for 0.2 cm, but the growth of cells is slightly larger for 0.3 cm than for 0.4 cm. Similar
results were also seen when the flow is changed to plug flow (results not shown here). These non-
monotonic variations might be attributed to the convective flow coupled to the non-linear growth
characteristics. It can be noted that calculations with the well mixed model did not lead to such
variation in the oxygen profile with bulk liquid layer height (results not shown). There was a
monotonic decrease in oxygen concentration in the cell layer with various liquid layer heights and
a monotonic increase in cell growth with higher supply of oxygen by convective flow.
The oxygen supply by diffusion through the FEP membrane is also affected by increases in bulk
liquid layer heights. As seen in Figure 3.6( c) the oxygen delivery by diffusive supply through the
membrane is larger in the case of smaller bulk liquid layer heights in comparison to larger bulk
liquid layers. However, the magnitude of oxygen delivery by diffusion is much smaller compared
to that of flow, and thus this larger supply is still not as significant at the smaller bulk liquid layer
heights.
Residence time
The residence time of the flow is a measure of the contact time for the flowing fluid, i.e., the rate at
which oxygen is supplied to the cells through convection. Longer residence times imply the flow
is slow and that there would be large oxygen depletion in the regions of the reactor farther away

7/27/2019 Mathematical Modeling of Transport and Reaction in Cellular and T
http://slidepdf.com/reader/full/mathematical-modeling-of-transport-and-reaction-in-cellular-and-t 96/270
76
from the supply end in comparison to the cell regions closer to the inlet. Thus, longer residence
times lead to regions of very low oxygen concentration and might lead to formation of dead zones.
Figure 3.7(a) shows the averaged oxygen concentrations and cell volume fractions in the cell layer
of the reactor at different residence times. Variation of residence time with a constant liquid layer
height of 0.6 cm changes the medium flow rate, and hence the average velocity at which oxygen is
transported by convection through the reactor. A residence time of 1 hr corresponds to a flow rate
F. The oxygen concentration in the cell layer is seen to deplete much faster (Figure 3.7b) in the
case where there is no flow (F = 0), i.e., oxygen is delivered only through the FEP membrane.
Correspondingly, the growth rate of cells is much slower due to these transport limitations and the
maximum cell volume fraction reached is less than 0.1 (Figure 3.7a). However, upon introducing
flow more oxygen is delivered to the cell layer by convective flow and hence the growth rate
increases for flows of F/2 and F. However, at flow rates of 3F the growth rate as shown in Figure
3.7(a) is less than that for F. It is likely that the higher oxygen concentrations (Figure 3.7b)
occurring at this higher flow rate lead to inhibitory kinetics thus decreasing the growth rate. Thus,
there exists an optimal flow rate that leads to maximum cell growth due to transport limitations at
low flow and kinetic inhibitions at high flow. Similar effects were also seen for the case in which
oxygen was supplied by plug flow with the same average velocity rather than by laminar flow
(result not shown here).
Mode of oxygen supply
It is already shown above that convection clearly enhances the cell growth, as compared to cell
growth that occurs when diffusion is the only mode of supply. In order to further consider this
factor, analysis is conducted to compare cases with convection alone, diffusion alone, and
combinations of convection and diffusion. These comparisons are important because perfusion
bioreactors are generally more complex and difficult to set up and operate than reactors that only
utilize diffusive supply. Therefore a quantitative analysis of the role of convection on oxygen
supply is needed to determine when flow is necessary. The present model can be used to
quantitatively determine the relative contribution of oxygen supply through flow in comparison to
diffusive supply though the FEP membrane. Thus, the model can be used to determine if diffusive
7/27/2019 Mathematical Modeling of Transport and Reaction in Cellular and T
http://slidepdf.com/reader/full/mathematical-modeling-of-transport-and-reaction-in-cellular-and-t 97/270
77
transport of oxygen through the FEP membrane can meet the demands of the cells or if convective
flow needs to be added in the bioreactor design.
Figures 3.8(a), 3.8(b) and 3.8(c) show that for three different liquid layer heights the oxygen
delivered to the cell layer by diffusion through the membrane is less effective in maintaining cell
growth for longer periods of time than would be possible with the addition of convective flow.
The membrane restrictions are so large that the amount of oxygen delivered to the cell layer in the
case of both membrane transport and hydrodynamic flow and the case of only oxygen delivered by
convective flow are seen to be similar by model calculations. In addition, the cell volume fractions
in the cell layers are similar for these two cases. Thus for these levels of oxygen consumption the
membrane would appear to be superfluous, however it may still be useful to incorporate such a
backup mechanism for oxygen supply in case of problems with the fluid pumps.
Figure 3.9 summarizes results for the cell density and oxygen concentration for a number of cases.
For example, increasing the concentration of oxygen in the incubator and the oxygen concentration
in the supply by flow to values in equilibrium with 100% oxygen gas causes the oxygen
concentration in the cell layer to take a longer time to deplete in comparison to supply at 20%. In
addition, convection and membrane transport at 100% supply maintains the oxygen concentration
at higher values for longer periods of time than all other cases. However, the higher oxygen
concentrations for this 100% supply lead to kinetic inhibition for longer times, thus reducing the
growth rate (Figure 3.9b). The cell volume fraction achieved upon complete depletion of oxygen
(at some position in the reactor) for the 100% supply is lower than the case with 20% supply as
shown in Figure 3.9(b). Further the convective diffusive supply at 100% has a lower rate of cell
growth than the membrane supply alone and the convection supply alone. This confirms the effect
that the higher oxygen concentrations in the 100% range lead to slower cell growth.

7/27/2019 Mathematical Modeling of Transport and Reaction in Cellular and T
http://slidepdf.com/reader/full/mathematical-modeling-of-transport-and-reaction-in-cellular-and-t 98/270
78
0
1
2
3
4
5
0 200000 400000 600000 800000 1000000 120
time (s)
< c >_
c e l l
<c> (conv 20%+ mem 20%)<c> (conv 20%)<c> (mem 20%)<c> (con 100%+mem 100%)
<c> (conv 100%)<c> (mem 100%)c_0.25c_ode_solution (F:20% diff:20%)
Figure 3.9 a Oxygen concentration variation with time in a mixed bioreactor under different oxygen supply conditio
permeability, km and medium flow rates (Perm=1.343*10-4 cm/s known value of permeability of the FEP memb
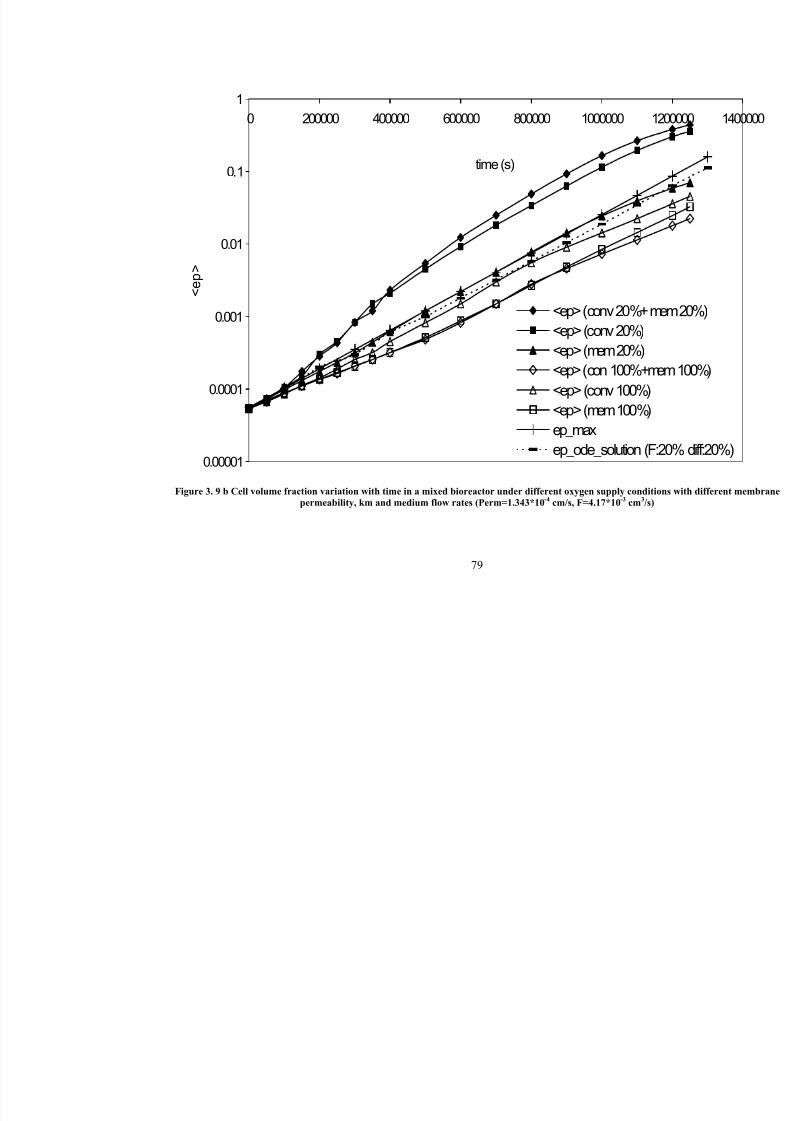
7/27/2019 Mathematical Modeling of Transport and Reaction in Cellular and T
http://slidepdf.com/reader/full/mathematical-modeling-of-transport-and-reaction-in-cellular-and-t 99/270
79
0.00001
0.0001
0.001
0.01
0.1
1
0 200000 400000 600000 800000 1000000 12
time (s)
< e p >
<ep> (conv 20%+ me
<ep> (conv 20%)
<ep> (mem 20%)
<ep> (con 100%+me
<ep> (conv 100%)
<ep> (mem 100%)
ep_max
ep_ode_solution (F:2
Figure 3. 9 b Cell volume fraction variation with time in a mixed bioreactor under different oxygen supply conditio
permeability, km and medium flow rates (Perm=1.343*10-4 cm/s, F=4.17*10-3 cm3/s)
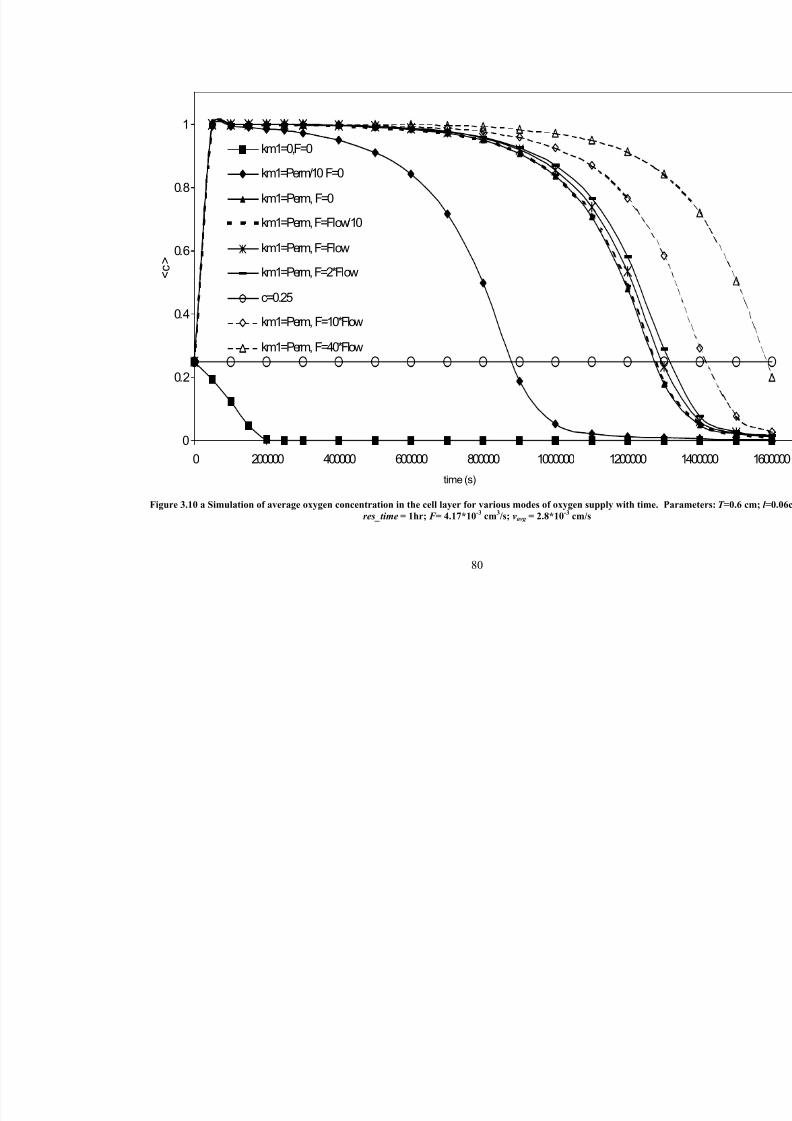
7/27/2019 Mathematical Modeling of Transport and Reaction in Cellular and T
http://slidepdf.com/reader/full/mathematical-modeling-of-transport-and-reaction-in-cellular-and-t 100/270
80
0
0.2
0.4
0.6
0.8
1
0 200000 400000 600000 800000 1000000 1200000
time (s)
< c >
km1=0,F=0
km1=Perm/10 F=0
km1=Perm, F=0
km1=Perm, F=Flow/10
km1=Perm, F=Flow
km1=Perm, F=2*Flow
c=0.25km1=Perm, F=10*Flow
km1=Perm, F=40*Flow
Figure 3.10 a Simulation of average oxygen concentration in the cell layer for various modes of oxygen supply with time.
res_time = 1hr; F = 4.17*10-3
cm3/s; vavg = 2.8*10
-3cm/s

7/27/2019 Mathematical Modeling of Transport and Reaction in Cellular and T
http://slidepdf.com/reader/full/mathematical-modeling-of-transport-and-reaction-in-cellular-and-t 101/270
81
0.00001
0.0001
0.001
0.01
0.1
1
0 200000 400000 600000 800000 1000000 1200000 140
time (s)
< e p >
km=0,F=0
km=Perm/10 F=0
km=Perm, F=0
km=Perm, F=Flow/10
km=Perm, F=Flow
km=Perm, F=2*Flow
km=Perm, F=10*Flow
km=Perm, F=40*Flow
ep_max
Figure 3. 10 b Effect of mode of oxygen supply on cell volume fraction of granulocyte progenitors at different times.
res_time = 1hr; F = 4.17*10-3
cm3/s; vavg = 2.8*10
-3cm/s

7/27/2019 Mathematical Modeling of Transport and Reaction in Cellular and T
http://slidepdf.com/reader/full/mathematical-modeling-of-transport-and-reaction-in-cellular-and-t 102/270
82
The case of a well-mixed tank reactor for 20% supply at similar flow rates was analyzed using
equation 3.20. In this case, the cell growth rate is higher than all cases for 100% supply but
lower than most of the other cases for 20% supply. The mixed reactor gave cell growth similar
to the membrane-only supply at 20%, however the growth was significantly lower than the
convective and convective-diffusive supplies at 20%. Mixing clearly decreases performance of
the flow reactor, as expected, but only slightly affects performance of the diffusion only.
Also shown in Figure 3.9 are the results for the putative maximum growth rate (ep_max)
whereby the oxygen concentration is set at concentration in equilibrium with 5% gas phase
oxygen throughout the reactor (Fixed oxygen concentration model). The kinetics for the cell
growth are developed from experimental results that show that these cell have maximum growth
rates at an oxygen concentration around 5%. Oxygen concentrations higher and lower to this
value inhibit cell growth. Equation 3.19 was used to determine the cell volume fraction changes
with time for a uniform oxygen concentration in the cell layer of 5%. The growth rate at this
putative maximum is higher than the cases for 100% supply and for the mixed reactor and
membrane-only supply at 100%. However, surprisingly as shown in Figure 3.9(b) the cell
growth is faster for the cases of oxygen supply at 20% by flow and membrane transport and by
flow alone than the putative maximum growth case.
It is possible that this effect can be due to either the amount of nutrient delivery or to the spatial
distribution of the delivery. To address this issue, the mixed bioreactor case is solved for
different oxygen supply rates. Supply in the mixed reactor case was varied by changing the flow
rates (‘Flow’ corresponding to flow rate for 0.6 cm liquid layer height and residence time of 1 hr,
i.e. 4.17*10-3
cm/s) and by changing mass transfer rates across the membrane (the membrane
permeability, km1). It is seen clearly in Figure 3.10(a) and 3.10(b) that either by increasing the
oxygen supply by flow to 40 times the value ‘Flow’ or increasing the membrane permeability the
growth rates is still below the expected putative maximum growth rate. Hence the higher growth
rates for the cases seen in Figure 3.9 (b) cannot be obtained simply by increasing supply rates
and must be attributed to the spatial distribution of oxygen in the bulk liquid layer and the cell
layer of the bioreactor.

7/27/2019 Mathematical Modeling of Transport and Reaction in Cellular and T
http://slidepdf.com/reader/full/mathematical-modeling-of-transport-and-reaction-in-cellular-and-t 103/270
83
The results shown in Figure 3.9(b) clearly indicate that optimal cell growth can be attained by
operating the reactor with convective-diffusive supply at 20% concentration for nearly 15 days
(12.5*105
s). However, by that time the oxygen concentration is severely depleted. In order to
maintain high cell growth for a longer time, it is thus necessary to increase the gas phase supply
to 100% and add convective flow at 100% gradually. Thus, the model results suggest that an
increase in feed oxygen concentration should begin at approximately 105 s and should gradually
rise to maintain the highest rates of cell growth.
3.4 Conclusions
The present study models a three-dimensional perfusion bioreactor system seeded with
granulocyte progenitors. The method of volume averaging is used to formulate the material
balances for the cells and nutrients in the porous matrix containing the progenitor cells. The
model is used to compute the variation in oxygen concentration with space and time in the matrix
as well as the bulk liquid region. The results of the model illustrate the effects of oxygen mass
transfer restrictions in the matrix due to cell growth. This model includes the dependence of cell
growth on the oxygen concentration. The derived effective diffusivities and effective rate
expressions used for solving the effect of oxygen delivery to the cells account for local 3-
dimensional geometry. However, the volume averaged expressions do not include the effect of
the local 3-dimensional cell-cell interactions and ECM environment, an important factor in the 3-
dimensional structure that affects cell proliferation. Future experimental and theoretical work
shall consider these aspects.
The model is used to analyze the various design parameters of the reactor. Cells consume much
larger amounts of oxygen for metabolism compared to cell growth. Hence, a larger supply of
oxygen with an optimal reactor design is necessary to improve the productivity of the reactor.
The model shows the effects of liquid layer height and residence time, as well as the roles of the
mode of oxygen supply. Variation of the liquid layer height between 0.3 cm and 0.6 cm affected
the rates of oxygen supply by hydrodynamic flow and membrane delivery. However, the
delivery of oxygen by hydrodynamic flow always exceeds that by membrane transport, thus

7/27/2019 Mathematical Modeling of Transport and Reaction in Cellular and T
http://slidepdf.com/reader/full/mathematical-modeling-of-transport-and-reaction-in-cellular-and-t 104/270
84
leading to larger growth rates at higher liquid layer heights. Lower residence times, i.e. higher
flow rates, supplied larger amounts of oxygen to the cell layer of the bioreactor. Larger amounts
of the oxygen were then available for cell growth and metabolic consumption, which produced
larger number of progenitor cells. However, an optimal growth rate at a specific flow rate was
found whereby at lower flows the growth was transport limited by oxygen supply and at higher
flows the growth was limited by kinetic inhibition. The spatial pattern of delivery by convection
was also found to play a significant role increasing the rate of cell growth. The model results
clearly indicate that variation of the oxygen concentration in the inlet feed with time may lead to
enhanced granulocyte progenitor cell growth in the 3-dimensional perfusion bioreactor.
This model can be further extended to include the effects of glucose consumption and the effects
of lactate production (Patel et al ., 2000). Cell loss because of flow and product inhibition may
occur and needs to be included in future studies. Moreover, in order to model a bioreactor used
for growing hematopoietic cultures it will also be necessary to incorporate the presence of
multiple cell populations, starting from the progenitor cells to the mature cells of all lineages
(Cabrita et al ., 2003; Nielsen et al ., 1988; Silva et al ., 2003; Hevehan et al ., 2000). Our
preliminary work on including these parameters in the model is discussed in detail in Chapter 4.
7/27/2019 Mathematical Modeling of Transport and Reaction in Cellular and T
http://slidepdf.com/reader/full/mathematical-modeling-of-transport-and-reaction-in-cellular-and-t 105/270
85
CHAPTER 4
ROLE OF NUTRIENT SUPPLY AND PRODUCT FORMATION
ON CELL GROWTH IN BIOREACTOR DESIGN FOR TISSUE
ENGINEERING OF HEMATOPOIETIC CELLS
Analysis of glucose and oxygen supply and by-product (lactate)concentration on progenitor and mature cells in 3-dimensional well-
mixed reactor
4.1 Introduction
In Chapter 2 we discussed the complicated process of hematopoiesis (cell proliferation,
differentiation, and maturation), the need for ex vivo hematopoietic cell expansion, the various
factors that affect hematopoietic cell expansion in cultures, and also the different culture devices
that are being used for this process. The necessity for higher cell production and more
progenitor expansion led researchers from simple Dexter hematopoietic (bone marrow) cultures
to various complicated bioreactors (spinner flasks, perfusion bioreactors) by maintaining systems
at ‘better-defined’ culture conditions (pH, dissolved oxygen, other metabolic reactants and
products).
The reactor designed at Florida State University, as discussed in Chapter 3, is a continuous
perfusion bioreactor with cells growing on 3-dimensional PET matrices. The bioreactor is
chosen so that the reactor is maintained at the so-called ‘better-defined’ culture conditions with

7/27/2019 Mathematical Modeling of Transport and Reaction in Cellular and T
http://slidepdf.com/reader/full/mathematical-modeling-of-transport-and-reaction-in-cellular-and-t 106/270
86
cells continuously bathing with nutrients and flow removing the byproducts. The reactor
provides a 3-dimensional growth environment for cells, close to the microenvironment in vivo
and results in long-term multilineage production of hematopoietic cells. The hydrodynamic flow
in the bulk liquid layer allows cells to settle in the matrix and grow. However, some cells will
fall and be carried away by the flowing fluid. Moreover, by isolating the cells from the primary
flow they can be protected from the mechanical stressed exerted by the flow.
Chapter 2 discussed the various continuous and discrete mathematical models developed for
describing hematopoietic process in bone marrow and in culture devices in literature. The
Krogh’s model of the bone marrow is indicative of the distribution of the various progenitor and
mature cell types in the bone marrow and their location relative to the sinus. Oxygen was found
to be one of the most important parameters that controlled this cell distribution in the bone
marrow compartment. Efforts were also made to develop mathematical models to describe
physicochemical behavior of cells in ‘in vitro’ culture devices (discussed in Chapter 2.5.3). This
can be done by a careful selection of suitable design characteristics and operational variables to
achieve a desirable level of one or more culture parameters (dissolved oxygen, pH, and nutrient
or byproduct concentrations) that directly affect the growth.
The importance of oxygen on hematopoietic cells led to the development of the dynamic
mathematical model explained in Chapter 3. The reactor as mentioned has a distinct cell layer
comprising of the PET matrix where the cells grow, squeezed in between two flow chambers,
which make up the bulk liquid layer of the reactor. The granulocyte progenitor cells are shown
to become oxygen-limited in the cell layer although there is a large supply from the bulk liquid
above. This mathematical model was the first of its kind to describe the spatio-temporal changes
in cells coupled to transport of nutrient (oxygen) delivery in ex vivo hematopoietic cultures.
Thus, the mathematical model determines the immune lineage cell growth characteristics
(granulocyte progenitors) in the 3-dimensional matrix of the bioreactor and quantitatively
describes progenitor cell production and substrate consumption (oxygen) over an extended
period of time. Material balances on cells are coupled to the nutrient (oxygen) balances in 3-
dimensional matrices to determine the effects of transport limitations on cell growth. This model
has flexibility to be extended to cell types other than hematopoietic cells based on the availability
7/27/2019 Mathematical Modeling of Transport and Reaction in Cellular and T
http://slidepdf.com/reader/full/mathematical-modeling-of-transport-and-reaction-in-cellular-and-t 107/270
87
of growth kinetics for that cell type of interest. However, future work on understanding the other
important parameters is necessary in order to improve the modeling of 3-dimensional
hematopoietic bioreactor system. To address this issue, the current chapter develops models that
build upon the model developed in Chapter 3, by incorporating other important environmental
factors (other than oxygen), accounting for the co-existence of multiple cell population,
understanding the effects of various cell-cells, cell-ECM interactions, and addressing the effects
of using of different matrix geometries.
4.2 Literature Review
4.2.1 Model Factors
The most important factors that have been addressed extensively in literature and discusses here
in the model perspective include are the metabolic parameters - glucose consumption and lactate
production by hematopoietic cells; multiple cell populations in culture systems, and the effects of
a different cell microenvironment in terms of geometry of the reactor.
4.2.1.1 Effect of glucose supply on cell growth in the 3-dimensional perfusion bioreactor
Glucose is the most commonly used carbohydrate energy source for cells and it is normally
included in culture at concentrations between 5 and 25 mM. Few studies have been conducted to
determine the glucose consumption rate and to assess its effect on hematopoietic cell metabolism
and growth. This is because experiments reported (Collins et al ., 1997; Patel et. al., 2000) have
shown that cell cultures inoculated at low cell densities in spinner flask cultures have shown a
wide scatter in glucose data. The error in the glucose assay was approximately the same order of
magnitude as the amount of glucose consumed. Experimental studies in the perfusion bioreactor
in Dr Ma’s lab and modeled in our current study (Chapter 3) have shown similar scatter in data
during the early culture phase, however the scatter stabilizes late during the culture. Therefore,
the effect of glucose on hematopoietic cell growth in culture should be studied for two reasons.
Glucose is one of the most important nutrients for cell metabolism and growth and is also one of

7/27/2019 Mathematical Modeling of Transport and Reaction in Cellular and T
http://slidepdf.com/reader/full/mathematical-modeling-of-transport-and-reaction-in-cellular-and-t 108/270
88
the sources of lactate production observed in hematopoietic cultures. Moreover, glucose
concentration can be measured in real time in the culture, thus enabling comparison of model
results to experimental data.
Glucose is consumed in cultures both aerobically and anaerobically. In oxidative or aerobic
metabolism glucose and oxygen produce carbon dioxide, water, and energy in the form of ATP
through the well known Krebs cycle. Anaerobic metabolism, which takes place in the absence of
oxygen, involves the formation of lactate from glucose by glycolysis.
Collins et al ., 1997 examined the specific glucose consumption rate for hematopoietic cultures
carried out in spinner flasks. The glucose consumption increased from day zero until a
maximum was attained, and then decreased until it reached a minimum value maintained until
the end of the culture. A similar increase and decrease in the fraction of colony forming cells
(CFCs) in this culture system was also seen. This shows that rapidly proliferating cells (CFCs)
have much greater metabolic demand. These cells consume glucose for metabolism, and, thus
manipulating glucose concentration in ex vivo cultures can help in manipulating desired cell
growth. The specific glucose consumption rate at day ‘n’ was computed by Collins and
coworkers as a time weighted average given as,
ba
bb LM
b
a
aa LM
a
b
n glut t
t CD
Gt
t CD
Gt
q∆+∆
⎟⎟ ⎠
⎞⎜⎜⎝
⎛
∆
∆−∆+⎟
⎟ ⎠
⎞⎜⎜⎝
⎛
∆
∆−∆
=))(())(( ,,
,
(4.1)
The effect of glucose as a substrate (or nutrient) along with oxygen on the growth of different
cell types is explored by adding a glucose mass balance to the model developed in Chapter 3.
Suitable glucose consumption rates for metabolism and cell growth were obtained from the
literature. Details on the model development are discussed in section 4. 2.2.
7/27/2019 Mathematical Modeling of Transport and Reaction in Cellular and T
http://slidepdf.com/reader/full/mathematical-modeling-of-transport-and-reaction-in-cellular-and-t 109/270
89
4.2.1.2 Effect of lactate production on cell growth in the 3-dimensional perfusion bioreactor
Lactate is a metabolic product of glycolysis and is largely derived from glucose although
glutamine may also contribute to the accumulation of lactate. Studies have shown that the cell
proliferation ceases – in hematopoietic cultures of varying cell densities – when the lactate
concentration approaches 20 mM (Patel et. al., 2000). Hence the effect of lactate on
hematopoietic cell growth has been extensively studied and reported in the literature.
Collins et al ., 1997 observed a strong correlation between the specific lactate production rate
(qlac) and the percentage of CFCs – with a close correspondence between maxima in qlac and %
CFC and a low value for qlac after the CFCs are depleted for cultures of cord blood (CB)
mononuclear cells (MNC), peripheral blood (PB) MNC. Hence as for glucose, an understanding
of the lactate production would help in increased expansion of the CFC (early progenitor cells) incultures. It was also shown that this difference in the qlac can be used to group cells along a
lineage into two distinct groups - progenitors and post-progenitor cell types. This information is
used to develop a two cell population model which will be discussed in detail in section 4.2.2.
Further analysis by the same group (Collins et. al., 1998) for different feeding protocols also
showed that there was a maximum in qlac near the maximum in %CFC. However, for some
feeding protocols there was a secondary increase in qlac that exceeded the initial peak value
although the specific oxygen consumption rate qO2 did not show a significant secondary peak.
Thus, this showed that post-progenitors are highly glycolytic and do not have high oxidative
metabolic activity. The ratio of the specific lactate production rate to specific oxygen
consumption rate (Y lac,ox) for the cells in this stirred bioreactor culture varied with time,
increasing with increase in post-progenitor cells further showing utilization of glycolysis by post-
progenitor cells for energy production.
Two distinct models were proposed to model lactate concentration in culture units (Collins et al.,
1997, 1998; Yang et al ., 2000)-
a) Linear Chemometric or Two Population Model
Based upon the experimental observation of the linear correlation between the specific lactate
production rate (qlac) and the percentage of colony forming cells (%CFCs) Collins et al . 1997

7/27/2019 Mathematical Modeling of Transport and Reaction in Cellular and T
http://slidepdf.com/reader/full/mathematical-modeling-of-transport-and-reaction-in-cellular-and-t 110/270
90
established a ‘Linear Chemometric model’ relating the lactate production rate to the percentage
of the CFC production,
β α ⋅⎟ ⎠
⎞⎜⎝
⎛ −+⋅= 100
%
1100
%
)(
CFC CFC
t ql
(4.2)
where α and β are the model parameters for the two population model (CFC or progenitor cells
and other post-progenitor cells). The model groups all the different progenitor cells as CFCs and
remaining cells as post-progenitor cells assuming that cells belonging to each of these separate
groups have the same lactate production rate. This is correct as a first approximation due to
unavailability of quantitative experimental data on rate constants for individual cell types.
However in culture, different progenitor cells and post-progenitor cells have a different lactate
production rate that also varies with the culture conditions.
b) Modified Linear Chemometric Model
Multi- population Model
Yang et al ., 2000 extended the two population model of Collins and co-workers by grouping all
cell types of granulomonocytic lineage into six distinct cell types (groups) with different growth
rates, cell density and metabolite consumption/formation rates.
∑=
= p
j
j s j s t xt q1
,)()( β
(4.3)
where x j(t) and β S,j are the respective cell fraction and specific metabolic rate of cell type j, and p
(=6) is the number of cell types (groups) considered. The model assumes that the specific
metabolic rates for each cell type are constant at any culture time and any cell composition.
However, for hematopoietic cultures the metabolic activities depend on culture conditions, such
as pH, availability of nutrients (dissolved oxygen, glucose), amino acids and cytokines.
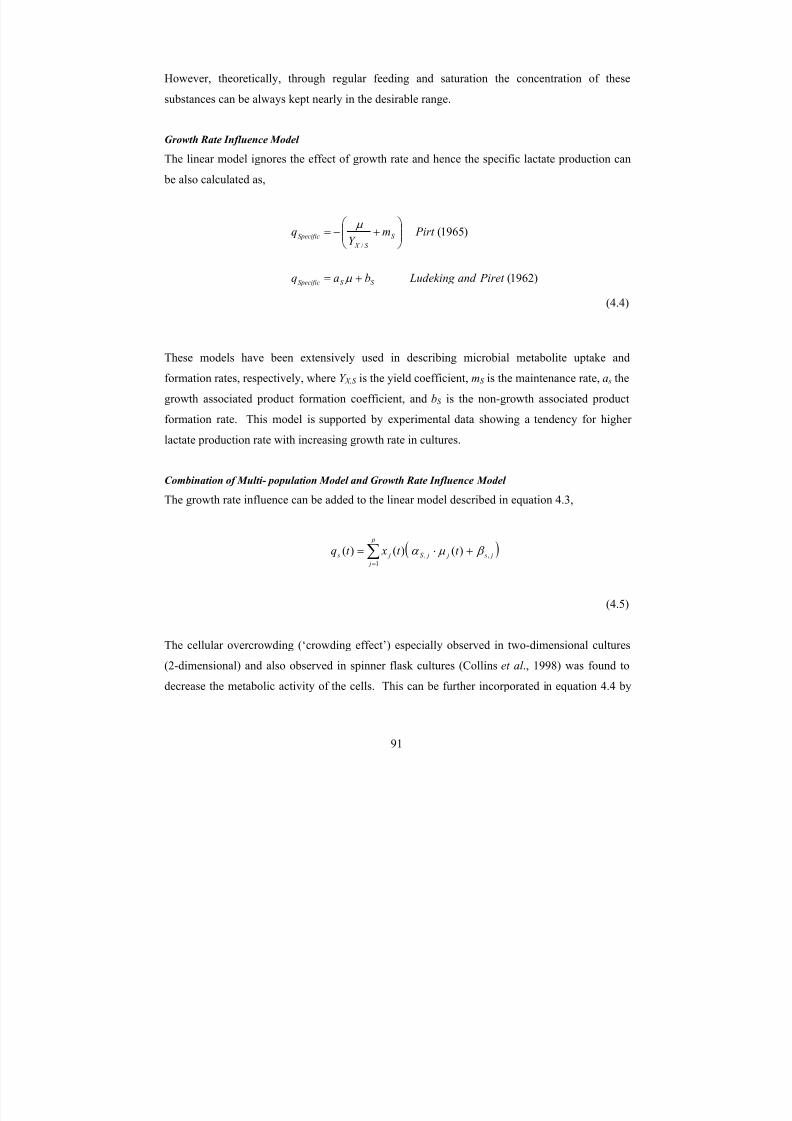
7/27/2019 Mathematical Modeling of Transport and Reaction in Cellular and T
http://slidepdf.com/reader/full/mathematical-modeling-of-transport-and-reaction-in-cellular-and-t 111/270
91
However, theoretically, through regular feeding and saturation the concentration of these
substances can be always kept nearly in the desirable range.
Growth Rate Influence Model
The linear model ignores the effect of growth rate and hence the specific lactate production can
be also calculated as,
)1962(
)1965(/
Piret and Ludeking baq
Pirt mY
q
S S Specific
S
S X
Specific
+=
⎟⎟ ⎠
⎞⎜⎜⎝
⎛ +−=
µ
µ
(4.4)
These models have been extensively used in describing microbial metabolite uptake and
formation rates, respectively, where Y X,S is the yield coefficient, mS is the maintenance rate, a s the
growth associated product formation coefficient, and bS is the non-growth associated product
formation rate. This model is supported by experimental data showing a tendency for higher
lactate production rate with increasing growth rate in cultures.
Combination of Multi- population Model and Growth Rate Influence Model
The growth rate influence can be added to the linear model described in equation 4.3,
( )∑=
+⋅= p
j
j s j jS j s t t xt q1
,, )()()( β µ α
(4.5)
The cellular overcrowding (‘crowding effect’) especially observed in two-dimensional cultures
(2-dimensional) and also observed in spinner flask cultures (Collins et al ., 1998) was found to
decrease the metabolic activity of the cells. This can be further incorporated in equation 4.4 by

7/27/2019 Mathematical Modeling of Transport and Reaction in Cellular and T
http://slidepdf.com/reader/full/mathematical-modeling-of-transport-and-reaction-in-cellular-and-t 112/270
92
assuming that the cell density and other factors (growth rate and cell types) affect cell
metabolism independently.
( )∑= ++⋅=
p
j X jS
jS
j s j jS j st C K
K
t t xt q1 ,
,
,,)()()()( β µ α
(4.6)
Thus, the total metabolic activity is made up of two parts. The first part describes the metabolic
activity at very low (‘zero’) cell density, while the second part represents the dependence of the
maximum metabolic activity on cell density.
These developed models could be used to establish accurate relationship between the specific
lactate production rate and the cell density of various cell types in the granulomonocytic lineage.
After model parameters are determined by comparing the model output of lactate concentration
with the available experimental results for the system, the model can be used to get an estimate
of the percentage of the cell types in culture for a known lactate concentration. This would
further help in calculating the harvest time for different cell types in culture to obtain a desired
cell density than using the uniform harvest time for all cell types. The model development
section outlined below incorporates these already proposed approaches for lactate productionkinetic rates to the overall model.
Experiments in the perfusion bioreactor with hematopoietic mononuclear cells (at FSU) have not
shown an increase in lactate concentration beyond the inhibitory range for the culture conditions
used in the model. However, it is necessary to examine the effects of lactate for a better
understanding of the sensitivity to the toxic metabolite (lactate) accumulation on the growth of
different hematopoietic cell types. This understanding would further add to the long range goal
of optimization and control of the developed bioreactor.

7/27/2019 Mathematical Modeling of Transport and Reaction in Cellular and T
http://slidepdf.com/reader/full/mathematical-modeling-of-transport-and-reaction-in-cellular-and-t 113/270
93
4.2.1.3 Multiple cell population
As described in Chapter 2, hematopoietic cultures are made up of multiple cell types starting
from the stem cells, to progenitor cells, to lineage committed cells and mature cells with different
growth rates and metabolite consumption and production rates. Hence a complete mathematical
model to describe such a culture needs to consider multiple cell types. Use of specific cytokines
helps to produce cells of certain lineages only, thus streamlining the model to a three
compartment model as described in Chapter 2.5.3.4. Each compartment involves the production
of different cell types by processes of proliferation, differentiation, and maturation. The models
discussed in Chapter 2 with multiple-population are discrete models and does not account for the
effects of environmental changes on cell growth of different cell types. These models do not
describe the growth rate in culture, nor do they account for mass transfer restrictions and itseffects on cell growth.
There are no continuous mathematical models that have accounted for the effect of changes in
the environmental condition, for example oxygen tension, glucose or lactate concentrations on
the changing hematopoietic cell population (cell growth, cell differentiation and cell maturation)
in ex vivo 3-dimensional cultures. The model developed in Chapter 3 of this work using a single
population model (granulocyte progenitor cells) has shown the importance of a continuous
change in oxygen tension with time and in space and its effects on cell growth in perfusion 3-
dimensional bioreactor. The importance of oxygen tension distribution has also been shown in
vivo in the bone marrow (Chow et al ., 2001).
As a next step towards improvement of the current models we intend to add the effects of
nutrient supply (oxygen and glucose) and metabolite product (lactate) removal in the 3-
dimensional perfusion bioreactor by diffusion and convection. As a first step this model
incorporates the coexistence of only two distinct cell types the ‘progenitor cells’ and the ‘post-
progenitor cells’ as discussed above.
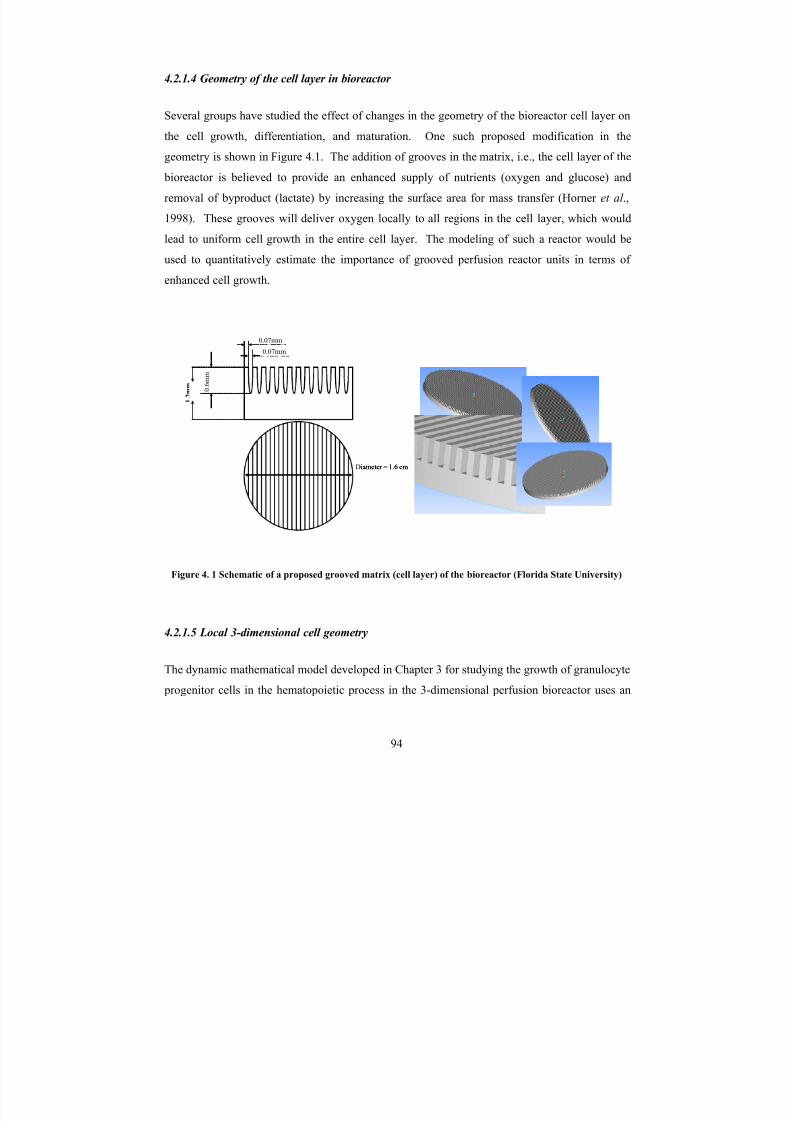
7/27/2019 Mathematical Modeling of Transport and Reaction in Cellular and T
http://slidepdf.com/reader/full/mathematical-modeling-of-transport-and-reaction-in-cellular-and-t 114/270
94
4.2.1.4 Geometry of the cell layer in bioreactor
Several groups have studied the effect of changes in the geometry of the bioreactor cell layer on
the cell growth, differentiation, and maturation. One such proposed modification in the
geometry is shown in Figure 4.1. The addition of grooves in the matrix, i.e., the cell layer of the
bioreactor is believed to provide an enhanced supply of nutrients (oxygen and glucose) and
removal of byproduct (lactate) by increasing the surface area for mass transfer (Horner et al .,
1998). These grooves will deliver oxygen locally to all regions in the cell layer, which would
lead to uniform cell growth in the entire cell layer. The modeling of such a reactor would be
used to quantitatively estimate the importance of grooved perfusion reactor units in terms of
enhanced cell growth.
Figure 4. 1 Schematic of a proposed grooved matrix (cell layer) of the bioreactor (Florida State University)
4.2.1.5 Local 3-dimensional cell geometry
The dynamic mathematical model developed in Chapter 3 for studying the growth of granulocyte
progenitor cells in the hematopoietic process in the 3-dimensional perfusion bioreactor uses an
1 . 2 m m
0 . 6 m m
0.07mm
0.07mm
Diameter = 1.6 cm
1 . 2 m m
0 . 6 m m
0.07mm
0.07mm
Diameter = 1.6 cm

7/27/2019 Mathematical Modeling of Transport and Reaction in Cellular and T
http://slidepdf.com/reader/full/mathematical-modeling-of-transport-and-reaction-in-cellular-and-t 115/270
95
analytical expression for the effective diffusion coefficient of an isotropic two dimensional two
phase medium defined by a square unit cell (Ochoa, 1988) containing spherical particles. This
relationship accounts for the diffusion in the non-cellular β phase and the cellular γ phase as well
as the mass transport across the two phases. This macroscopic viewing of the process can be
used for analysis of low molecular weight solutes in 3-dimensional environment. However, for
analysis of solutes that have larger restrictions (glucose and lactate) to diffusion in the cellular
phase further consideration of the local 3-dimensional geometry and solution of the closure
problem in such systems are needed.
Moreover, Chang’s unit cell approach can be transformed from the original cubic unit cell (used
in the model in Chapter 3) with the spherical γ phase to a spherical unit cell with similar γ phase
particles (Ochoa, 1988). The effective diffusivity is then given as,
( )( )
( ) ( ) ⎥⎥
⎦
⎤
⎢⎢
⎣
⎡
−⋅⋅+−+
+⋅−⋅−∗
+⋅=
−
−
31
31
3213
4123
γ β γ β
γ γ β β
β γ
β
ε ε α ε
ε α ε ε
ε ε k
k k
K
D D
eq
eff
(4.7)
In order to address the local 3-dimensional cell geometry 3-dimensional cell-cells interactions,the effects of cellular overcrowding and environmental factors needs to be addressed. Analysis
of these factors requires more extensive evaluation of the volume averaging formalism. The
current work utilizes effective diffusion coefficients based on specific ‘unit cells’. In the full 3-
dimensional culture, the three dimensional nature of the local environment may affect more than
the effective diffusion coefficient as accounted for in the present work. To fully deal with these
issues we may need to take more creative approaches such as incorporating the cellular automata
or other simulations of cell growth in local regions and coupling those to the macroscopic
models based on volume averaging. The approach as to which other models need to be
incorporated (for studying hematopoietic cell growth and the changes in their local cell
environment) with the macroscopic volume averaging approach has not been worked out for this
tissue engineering application. This is primarily because even if the model was developed there
7/27/2019 Mathematical Modeling of Transport and Reaction in Cellular and T
http://slidepdf.com/reader/full/mathematical-modeling-of-transport-and-reaction-in-cellular-and-t 116/270
96
is not sufficient quantitative experimental data available in literature or work in Dr Ma’s lab to
validate the model for the current system under study.
To be noted here, however, Chapter 6 of this dissertation outlines a step-by-step procedure to
approach the effects of 3-dimensional local geometry that incorporates local cell-cell interactions
along with the overall macroscopic variation in mass transport of various reacting species for
cartilage growth in a hollow fiber bioreactor. The model can be extended for this system,
however, unlike the cartilage tissue which is made up of a single type of cells (chondrocytes) this
system is made up of a number of different cell types where obtaining the growth, metabolic, and
extracellular matrix synthesis rates for each cell type is not that simple.
4.2.2 Model Equations
Outline
The next step towards improvement of the current model discussed in Chapter 3 is to incorporate
the metabolic nutrients – oxygen and glucose; metabolic by-product – lactate and the presence of
more than one cell type in the perfusion reactor. The model developed has two cell types the
‘progenitor cells (cell type 1)’ and the ‘post-progenitor cells (cell type 2)’. The schematic of this
process is shown in Figure 4.2
Well-Mixed Model
Species continuity balances describing the variation in oxygen, glucose and lactate
concentrations are written in the cell and bulk liquid layer of the bioreactor (shown in Figure
4.3). The cell volume fractions of cell type 1 (progenitor cells) and cell type 2 (post progenitor
cells) are written in the cell layer.
The modeling approach similar to that described for well-mixed compartments in Chapter 3
(section 3.2.2.5) is used. The spatial variations of metabolic species concentrations in the cell
and bulk liquid layers and the cell volume fractions in the cell layer of the bioreactor are
removed while retaining the effects of nutrient mass transfer supply.
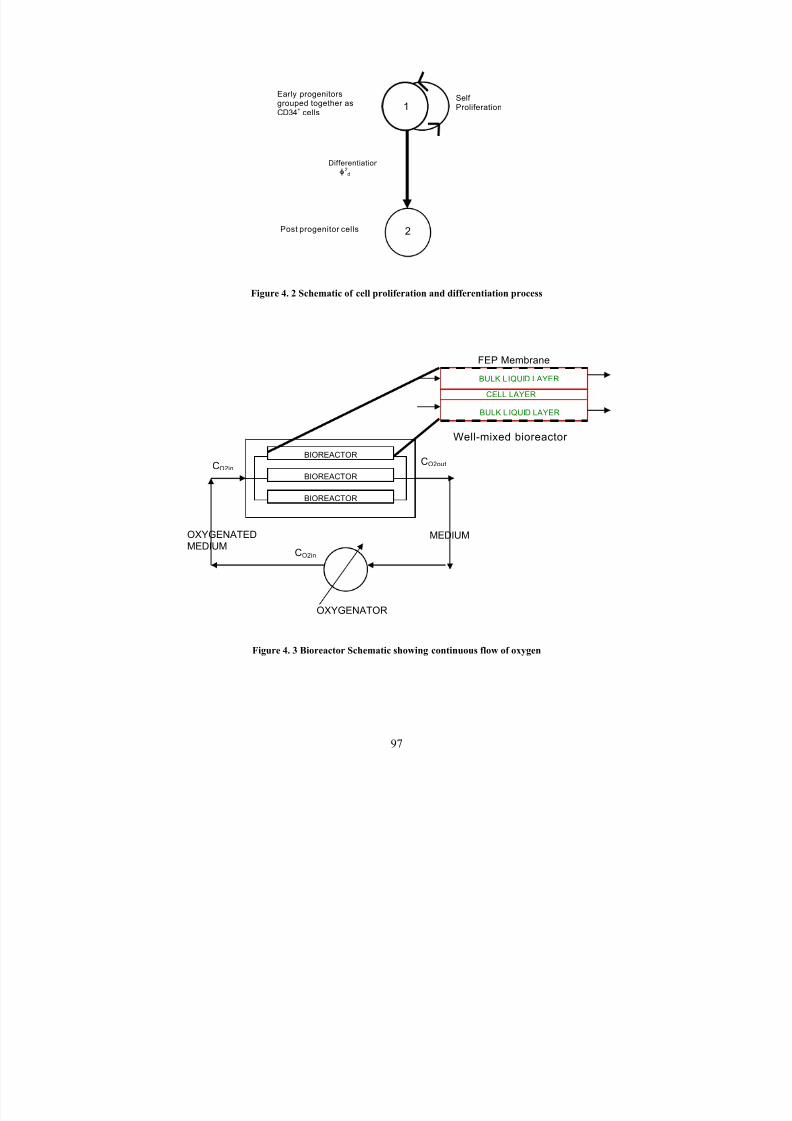
7/27/2019 Mathematical Modeling of Transport and Reaction in Cellular and T
http://slidepdf.com/reader/full/mathematical-modeling-of-transport-and-reaction-in-cellular-and-t 117/270
97
Figure 4. 2 Schematic of cell proliferation and differentiation process
Figure 4. 3 Bioreactor Schematic showing continuous flow of oxygen
OXYGENATOR
MEDIUM
CO2in
CO2inCO2out
BIOREACTOR
BIOREACTOR
BIOREACTOR
OXYGENATEDMEDIUM
BULK LIQUID LAYER
BULK L IQUID LAYER
Well-mixed bioreactor
FEP Membrane
CELL LAYER
Self Proliferation
Differentiation
φ2d
Early progenitorsgrouped together asCD34
+cells
Post progenitor cells
1
2
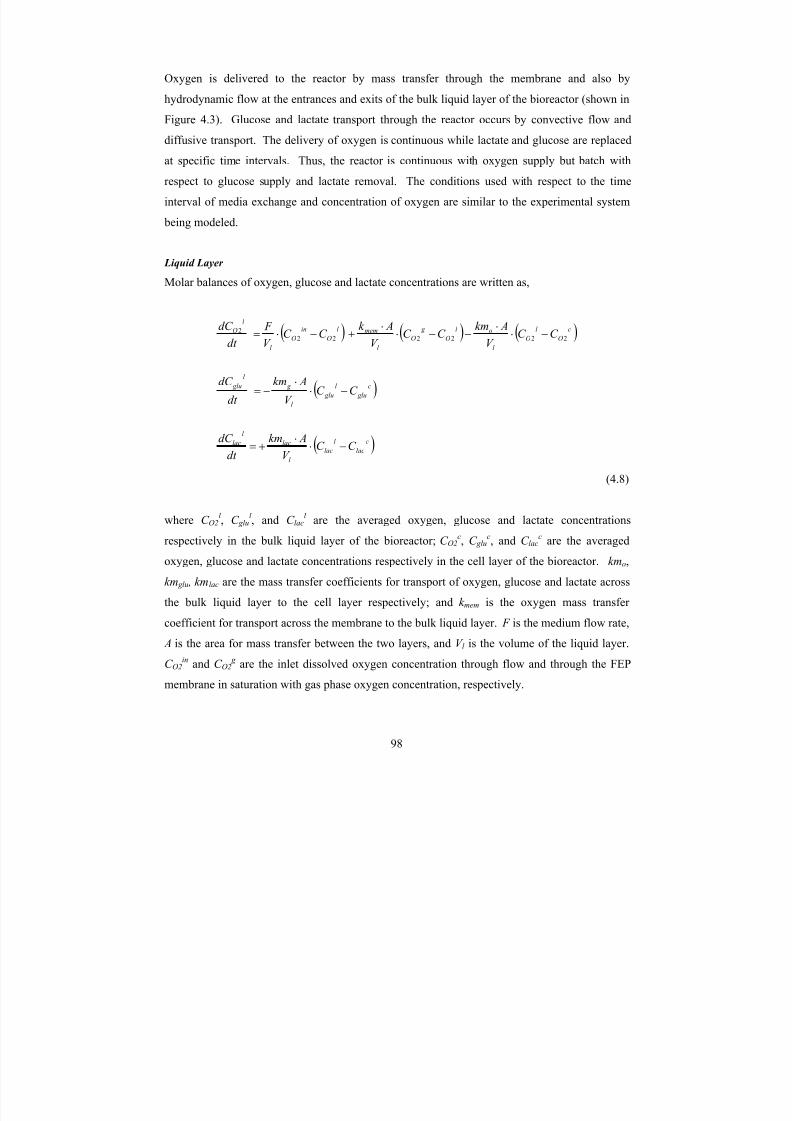
7/27/2019 Mathematical Modeling of Transport and Reaction in Cellular and T
http://slidepdf.com/reader/full/mathematical-modeling-of-transport-and-reaction-in-cellular-and-t 118/270
98
Oxygen is delivered to the reactor by mass transfer through the membrane and also by
hydrodynamic flow at the entrances and exits of the bulk liquid layer of the bioreactor (shown in
Figure 4.3). Glucose and lactate transport through the reactor occurs by convective flow and
diffusive transport. The delivery of oxygen is continuous while lactate and glucose are replaced
at specific time intervals. Thus, the reactor is continuous with oxygen supply but batch with
respect to glucose supply and lactate removal. The conditions used with respect to the time
interval of media exchange and concentration of oxygen are similar to the experimental system
being modeled.
Liquid Layer
Molar balances of oxygen, glucose and lactate concentrations are written as,
( ) ( ) ( )
( )
( )c
lac
l
lac
l
lac
l
lac
c
glu
l
glu
l
g
l
glu
c
O
l
O
l
ol
O
g
O
l
meml
O
in
O
l
l
O
C C V
Akm
dt
dC
C C V
Akm
dt
dC
C C V
AkmC C
V
Ak C C
V
F
dt
dC
−⋅⋅
+=
−⋅⋅
−=
−⋅⋅
−−⋅⋅
+−⋅= 2222222
(4.8)
where C O2l , C glu
l , and C lac
l are the averaged oxygen, glucose and lactate concentrations
respectively in the bulk liquid layer of the bioreactor; C O2c, C glu
c, and C lac
c are the averaged
oxygen, glucose and lactate concentrations respectively in the cell layer of the bioreactor. kmo,
km glu , kmlac are the mass transfer coefficients for transport of oxygen, glucose and lactate across
the bulk liquid layer to the cell layer respectively; and k mem is the oxygen mass transfer coefficient for transport across the membrane to the bulk liquid layer. F is the medium flow rate,
A is the area for mass transfer between the two layers, and V l is the volume of the liquid layer.
C O2in
and C O2 g
are the inlet dissolved oxygen concentration through flow and through the FEP
membrane in saturation with gas phase oxygen concentration, respectively.
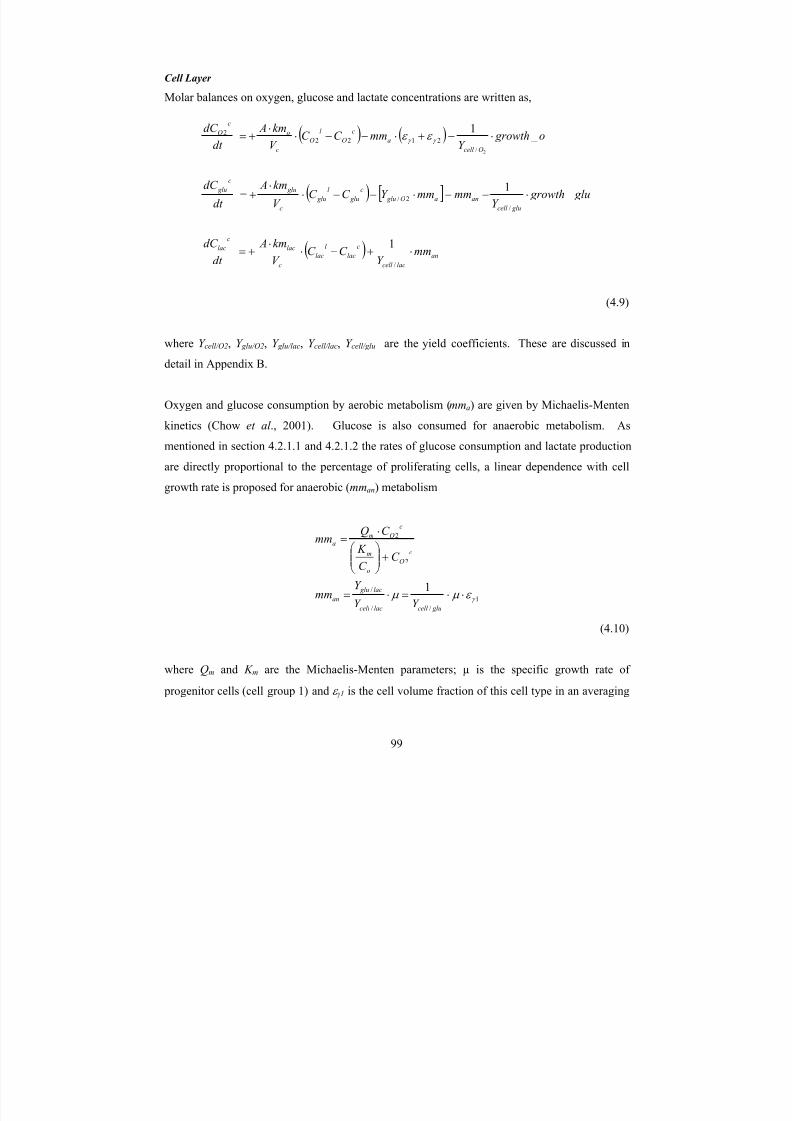
7/27/2019 Mathematical Modeling of Transport and Reaction in Cellular and T
http://slidepdf.com/reader/full/mathematical-modeling-of-transport-and-reaction-in-cellular-and-t 119/270
99
Cell Layer
Molar balances on oxygen, glucose and lactate concentrations are written as,
( ) ( )
( ) [ ]
( ) an
laccell
c
lac
l
lac
c
lac
c
lac
glucell
anaO glu
c
glu
l
glu
c
glu
c
glu
Ocell
a
c
O
l
O
c
o
c
O
mmY
C C V
km A
dt
dC
glu growthY
mmmmY C C V
km A
dt
dC
o growthY
mmC C V
km A
dt
dC
⋅+−⋅⋅
+=
⋅−−⋅−−⋅⋅
+=
⋅−+⋅−−⋅⋅
+=
/
/
2/
/
21222
1
_ 1
_ 1
2
γ γ ε ε
(4.9)
where Y cell/O2, Y glu/O2, Y glu/lac, Y cell/lac, Y cell/glu are the yield coefficients. These are discussed in
detail in Appendix B.
Oxygen and glucose consumption by aerobic metabolism (mma) are given by Michaelis-Menten
kinetics (Chow et al ., 2001). Glucose is also consumed for anaerobic metabolism. As
mentioned in section 4.2.1.1 and 4.2.1.2 the rates of glucose consumption and lactate production
are directly proportional to the percentage of proliferating cells, a linear dependence with cell
growth rate is proposed for anaerobic (mman) metabolism
1
//
/
2
2
1γ ε µ µ ⋅⋅=⋅=
+⎟⎟ ⎠
⎞⎜⎜⎝
⎛
⋅=
glucell laccell
lac glu
an
c
O
o
m
c
Oma
Y Y
Y mm
C C
K
C Qmm
(4.10)
where Qm and K m are the Michaelis-Menten parameters; µ is the specific growth rate of
progenitor cells (cell group 1) and ε γ1 is the cell volume fraction of this cell type in an averaging

7/27/2019 Mathematical Modeling of Transport and Reaction in Cellular and T
http://slidepdf.com/reader/full/mathematical-modeling-of-transport-and-reaction-in-cellular-and-t 120/270
100
volume. As mentioned before cell volume fraction is defined as the ratio of volume occupied by
the cells to the total volume of the selected averaging volume. The specific growth rate of
progenitor cells ( µ) depends on glucose, oxygen, lactate concentrations and is discussed in more
detail below.
Oxygen consumption for cell growth ( growth_o) is described by inhibition kinetics as discussed
in Chapter 3. Glucose consumption for growth ( growth_glu) is given as a Michaelis-Menten
function.
( )
c
gluo
glu
glu
c glu glu
c
O
o I
c
O
o
c
Oo
C C
K
C k glu growth
C C K
C
C
K
C C kk o growth
++
⋅=
+⋅
+
⋅=
_
)/( _
2
22
2
1
2
(4.11)
The cell growth of cell type 1, i.e. the progenitor cells in the cell layer, is written as a function of
oxygen, glucose and lactate concentrations. The dependence of growth rate of cell group 1 on
glucose and lactate concentration is given by competitive product inhibition kinetics as used by
Truskey and coworkers (1990) for HuT-78 cell line. Differentiation of cell type 1 at a rate φ d 2
gives rise to the post progenitor cells or cell type 2. The species balances for varying cell
volume fractions of cells in the culture is written as,
( )
( )
1
22
1
2
11
2
2
22
2
1
2
1
1
)(
)/(
1
_ , _ , _
γ
γ
γ γ γ γ
γ
ε φ ε
ε φ µ ε ε φ µ
ε
ε
⋅=
⋅−⋅=⋅−
⎥⎥⎥
⎥⎥
⎦
⎤
⎢⎢⎢
⎢⎢
⎣
⎡
+⋅
+
⋅⋅
+⋅⋅+⋅
⋅⋅=
+=
d
d d c
O
o I
cO
o
c
Oo
c
glu
c
lac
o
lac P o
glu
s
c
glum
dt
d
C C K
C
C
K
C C kk
C C C K C K
C
lacinhib glu growtho growth f dt
d
(4.12)

7/27/2019 Mathematical Modeling of Transport and Reaction in Cellular and T
http://slidepdf.com/reader/full/mathematical-modeling-of-transport-and-reaction-in-cellular-and-t 121/270
101
4.2.3 Parameter Estimation
The parameters for the model can be obtained by comparing experimental data performed by
using a cytokine, directing cells to differentiate along a particular lineage and fitting the model to
the total number of early progenitor cells started off with and the total number of mature cells
formed. Moreover, on-line measurements of glucose and oxygen consumption and lactate
production obtained experimentally in 3-dimensional batch culture units are used to fit the model
bulk liquid layer glucose, oxygen and lactate concentrations.
In order to obtain the metabolic and growth parameters, the model equations for species
concentrations are reduced for a tissue culture flask system (2-dimensional). This is done to
compare with the experimental data of Yan et al ., 2001. In the experimental set-up the HCs
were grown in 3-dimensional non-woven PET matrices (diameter = 1.4 cm; thickness = 1mm)
and placed in 24 culture plates. 2 ml of long-term culture medium was added to each of the
plates. Twice weekly medium exchange was performed with 1 ml replaced every week. The
cells were cultured for 7-10 weeks.
The model equations of only the liquid layer (equation 4.8) has to be changed to incorporate no-
flow conditions for this culture system and are given as,
( )
( )c
lac
l
lac
l
lac
l
lac
c
glu
l
glu
l
g
l
glu
g
O
l
O
C C V
Akm
dt
dC
C C V
Akm
dt
dC
C C
−⋅⋅
+=
−⋅⋅
−=
= 22
(4.13)
Oxygen in this system is not supplied by convective transport by medium flow or by diffusive
transport through any membranes. Diffusion of oxygen occurs from the outside gas phase to the
bulk liquid layer and then to the cell layer. Assuming that the gradient across the bulk liquid

7/27/2019 Mathematical Modeling of Transport and Reaction in Cellular and T
http://slidepdf.com/reader/full/mathematical-modeling-of-transport-and-reaction-in-cellular-and-t 122/270
102
layer can be neglected due to frequent medium exchanges, the oxygen concentration can be
assumed to be constant in the liquid layer and is the same as the 21% gas phase oxygen
concentration in equilibrium with liquid. Glucose and lactate concentration change in the liquid
layer due to removal from the liquid layer and byproduct addition to the liquid layer of the
reactor.
The model equations in the cell layer (equation 4.9) and in the bulk liquid layer (equation 4.13)
along with metabolic and growth kinetics (equation 4.10 – 4.12) for the 3-dimensional batch
culture were solved in MATLAB, to obtain the time-varying changes in the cell numbers of cell
group 1 and group 2, and metabolic species i.e. glucose, lactate and oxygen concentrations.
These model results are compared with available experimental results on cell numbers and
lactate metabolism (Yan et al., 2001). Yan and coworkers have reported the total cell number
and number of progenitor (CD34+) cells in their work. The experimental results are shown
below in Table 4.1.
Table 4. 1 Experimental results of cell numbers from Yan et al ., 2001
Time(weeks)
% CD34+cells
CD34+ cellnumber
(Cell Type 1)
Total cell no. Total – CD34+ cellnumber
(Cell Type 2)
0 69.4 0.35*105
0.504*105
0.154*105
3 12.4 1.89*105
1.524*106
1.335*106
5 10.1 2.46*105
2.436*106
2.1896*106
7 7.7 2.39*105
3.104*106
2.865*106
The experimental results on the specific lactate production rate in the liquid medium as a
function of time were available for this system. The trapezoidal rule of integration under a given
area was used to compute the lactate concentration at specific intervals of time (as shown in
Table 4.2). The lactate fold increase is computed comparing the lactate concentration at all time
points compared to the initial lactate concentration in the media added to the tissue culture plates.

7/27/2019 Mathematical Modeling of Transport and Reaction in Cellular and T
http://slidepdf.com/reader/full/mathematical-modeling-of-transport-and-reaction-in-cellular-and-t 123/270
103
Table 4. 2 Experimental result of lactate concentration from Yan et al ., 2001
Time
(days)Sp. Lac Prod. Rate
(mg/l/h)[Lactate]
mol/cm3Lactate fold
increase
0 0.25 2.360*10-8
10 0.7 5.970*10
-82.53
15 0.8 1.014*10-7
4.30
20 2.25 1.860*10-7
7.88
25 4.9 3.850*10-7
16.31
30 6.4 6.990*10-7
29.62
35 6.95 1.153*10-6
48.86
40 6.95 1.540*10-6
65.25
To be noted here, the model reduction, allows for comparison with available on-line
measurements of metabolites and cell numbers, in order to obtain the unknown metabolic and
growth parameters for this cell type under consideration. Modeling results for cell numbers in
cell group 1 and group 2 are plotted in Figure 4.4 (a). The model appears to follow the
experimental results very well. Figure 4.4 (b) shows the lactate concentrations varying with time
of culture. 50% liquid media is exchanged twice weekly which can be seen as a decrease in
lactate concentration every 3.5 days in the culture. The drop in lactate concentration in the cell
layer is due to lactate transport to the bulk liquid layer, which as seen in equation 4.14 is driven
by a concentration difference between the cell and liquid layer. Medium exchange lowers the
lactate concentration accumulation in the bulk liquid layer, and allows for more flux of lactate
into the liquid layer. This can be seen as a decrease followed by an increase in lactate
concentration in the cell layer, similar to that of liquid layer. The rate of lactate concentration
increase is smaller during the initial few weeks which is the time corresponding to the formation
of aerobic progenitor cells. However, the lactate concentration reaches a much higher steady
state and rate of lactate consumption after every media exchange due to formation of post- progenitor cells. The lactate concentrations in Figure 4.4 (b) are averaged to compute the lactate
fold increase as shown in Figure 4.4(c). These results are compared to the experimental data as
shown in Table 4.2.
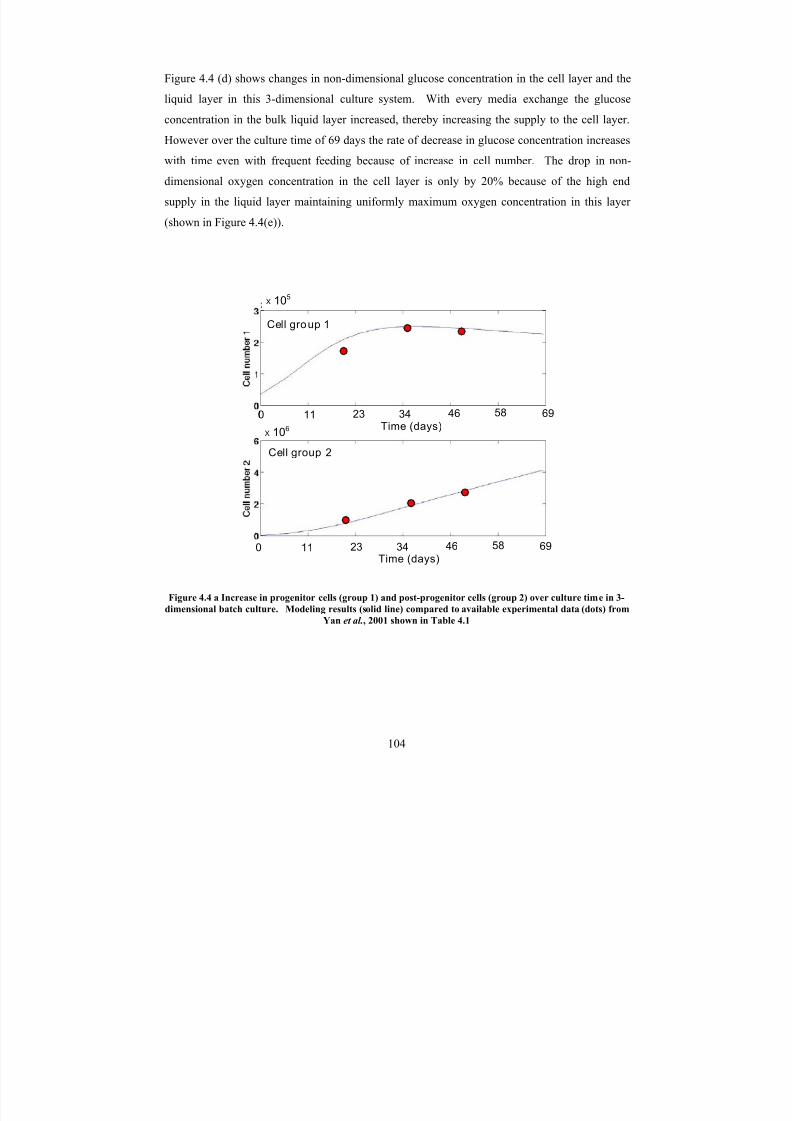
7/27/2019 Mathematical Modeling of Transport and Reaction in Cellular and T
http://slidepdf.com/reader/full/mathematical-modeling-of-transport-and-reaction-in-cellular-and-t 124/270
104
Figure 4.4 (d) shows changes in non-dimensional glucose concentration in the cell layer and the
liquid layer in this 3-dimensional culture system. With every media exchange the glucose
concentration in the bulk liquid layer increased, thereby increasing the supply to the cell layer.
However over the culture time of 69 days the rate of decrease in glucose concentration increases
with time even with frequent feeding because of increase in cell number. The drop in non-
dimensional oxygen concentration in the cell layer is only by 20% because of the high end
supply in the liquid layer maintaining uniformly maximum oxygen concentration in this layer
(shown in Figure 4.4(e)).
Figure 4.4 a Increase in progenitor cells (group 1) and post-progenitor cells (group 2) over culture time in 3-
dimensional batch culture. Modeling results (solid line) compared to available experimental data (dots) fromYan et al., 2001 shown in Table 4.1
11 69584634230Time (days)
11 69584634230Time (days)
Cell group 1
Cell group 2
X 106
X 105

7/27/2019 Mathematical Modeling of Transport and Reaction in Cellular and T
http://slidepdf.com/reader/full/mathematical-modeling-of-transport-and-reaction-in-cellular-and-t 125/270
105
Figure 4.4 b Lactate concentration in 3-dimensional batch culture
Figure 4.4 c Fold increase in Lactate concentration in 3-dimensional batch culture. Modeling results (solid
line) compared to available experimental data (dots) from Yan et al., 2001 shown in Table 4.2
(Mol/cm3)
(Mol/cm3)
Cell Layer
Bulk Liquid
* 10-
Clacc
Clacl
11 69584634230Time (days)
11 69584634230Time (days)
* 10-
11 69584634230Time (days)
11 69584634230Time (days)
Bulk Liquid
Cell Layer

7/27/2019 Mathematical Modeling of Transport and Reaction in Cellular and T
http://slidepdf.com/reader/full/mathematical-modeling-of-transport-and-reaction-in-cellular-and-t 126/270
106
Figure 4.4 d Glucose concentration in 3-dimensional batch culture
Figure 4. 4 e Oxygen in 3-dimensional batch culture
Bulk Liquid
Cell Layer
11 69584634230Time (days)
11 69584634230Time (days)
Cell Layer Bulk Liquid
23 46 69
Time (days)
23 46 69
Time (days)
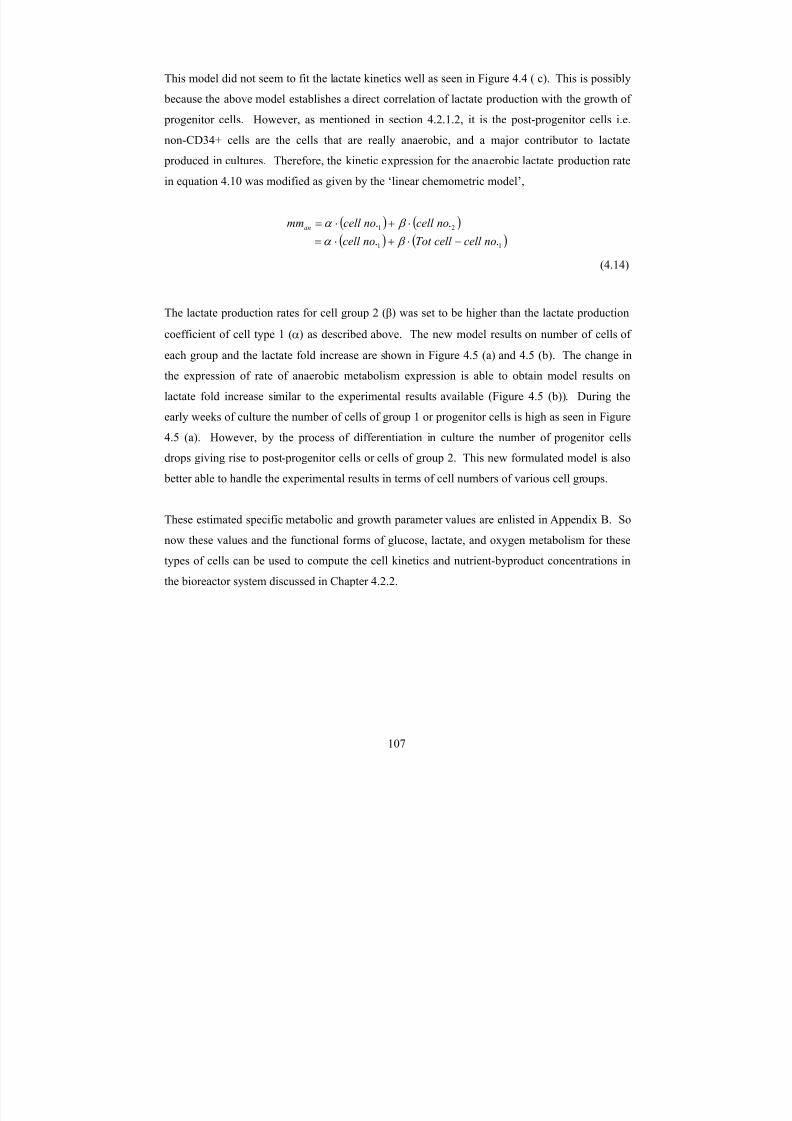
7/27/2019 Mathematical Modeling of Transport and Reaction in Cellular and T
http://slidepdf.com/reader/full/mathematical-modeling-of-transport-and-reaction-in-cellular-and-t 127/270
107
This model did not seem to fit the lactate kinetics well as seen in Figure 4.4 ( c). This is possibly
because the above model establishes a direct correlation of lactate production with the growth of
progenitor cells. However, as mentioned in section 4.2.1.2, it is the post-progenitor cells i.e.
non-CD34+ cells are the cells that are really anaerobic, and a major contributor to lactate
produced in cultures. Therefore, the kinetic expression for the anaerobic lactate production rate
in equation 4.10 was modified as given by the ‘linear chemometric model’,
( ) ( )
( ) ( )11
21
..
..
nocell cell Tot nocell
nocell nocell mman
−⋅+⋅=
⋅+⋅=
β α
β α
(4.14)
The lactate production rates for cell group 2 (β) was set to be higher than the lactate production
coefficient of cell type 1 (α) as described above. The new model results on number of cells of
each group and the lactate fold increase are shown in Figure 4.5 (a) and 4.5 (b). The change in
the expression of rate of anaerobic metabolism expression is able to obtain model results on
lactate fold increase similar to the experimental results available (Figure 4.5 (b)). During the
early weeks of culture the number of cells of group 1 or progenitor cells is high as seen in Figure
4.5 (a). However, by the process of differentiation in culture the number of progenitor cells
drops giving rise to post-progenitor cells or cells of group 2. This new formulated model is also
better able to handle the experimental results in terms of cell numbers of various cell groups.
These estimated specific metabolic and growth parameter values are enlisted in Appendix B. So
now these values and the functional forms of glucose, lactate, and oxygen metabolism for these
types of cells can be used to compute the cell kinetics and nutrient-byproduct concentrations in
the bioreactor system discussed in Chapter 4.2.2.

7/27/2019 Mathematical Modeling of Transport and Reaction in Cellular and T
http://slidepdf.com/reader/full/mathematical-modeling-of-transport-and-reaction-in-cellular-and-t 128/270
108
Figure 4.5 a Increase in progenitor cells (group 1) and post-progenitor cells (group 2) over culture time in 3-
dimensional batch culture using new kinetic expression for anaerobic metabolism shown in equation 4.15.
Modeling results (solid line) compared to available experimental data (dots) from Yan et al., 2001 shown in
Table 4.1.
Figure 4. 5 b Fold increase in lactate concentration in 3-dimensional batch culture using new kinetic
expression for anaerobic metabolism shown in equation 4.15. Modeling results (solid line) compared to
available experimental data (dots) from Yan et al., 2001 shown in Table 4.2
* 105
Cell Group 1
Cell Group 2
11 69584634230time (days)
81
11 69584634230time (days)
81
* 106
* 105
Cell Group 1
Cell Group 2
11 69584634230time (days)
8111 69584634230time (days)
11 69584634230time (days)
81
11 69584634230time (days)
8111 69584634230time (days)
11 69584634230time (days)
81
* 106
11 69584634230time (days)
81
11 69584634230time (days)
Cell Layer
Bulk Liquid
Lactate
Fold
Increase
Lactate
Fold
Increase
11 69584634230time (days)
81
11 69584634230time (days)
Cell Layer
Bulk Liquid
Lactate
Fold
Increase
11 69584634230time (days)
8111 69584634230time (days)
11 69584634230time (days)
81
11 69584634230time (days)
11 69584634230time (days)
Cell Layer
Bulk Liquid
Lactate
Fold
Increase
Lactate
Fold
Increase

7/27/2019 Mathematical Modeling of Transport and Reaction in Cellular and T
http://slidepdf.com/reader/full/mathematical-modeling-of-transport-and-reaction-in-cellular-and-t 129/270
109
4.2.4 Preliminary results on Well-Mixed Bioreactor Model
Once the rate parameters are obtained by model-experimental fit for the current cell type in 3-
dimensional batch reactor systems, these numbers are used to predict the cell growth and
metabolic characteristics for the well-mixed reactor. The growth of progenitor cells (Group 1)
and post progenitor cells in the reactor are shown in Figure 4.6 (a). The model predicts an
increase in cells of both group 1and group 2 throughout the entire time of culture. The maximum
progenitor cell number and post progenitor cell number reached are ~ 6*104
cells and ~ 1*106
cells by the end of ~ 70 day.
Figure 4.6 a Increase in progenitor cells (group 1) and post-progenitor cells (group 2) over culture time in 3-
dimensional well-mixed perfusion bioreactor system. Model parameters used are discussed in Appendix B.
* 105
Cell Group 1
Cell Group 2
* 104
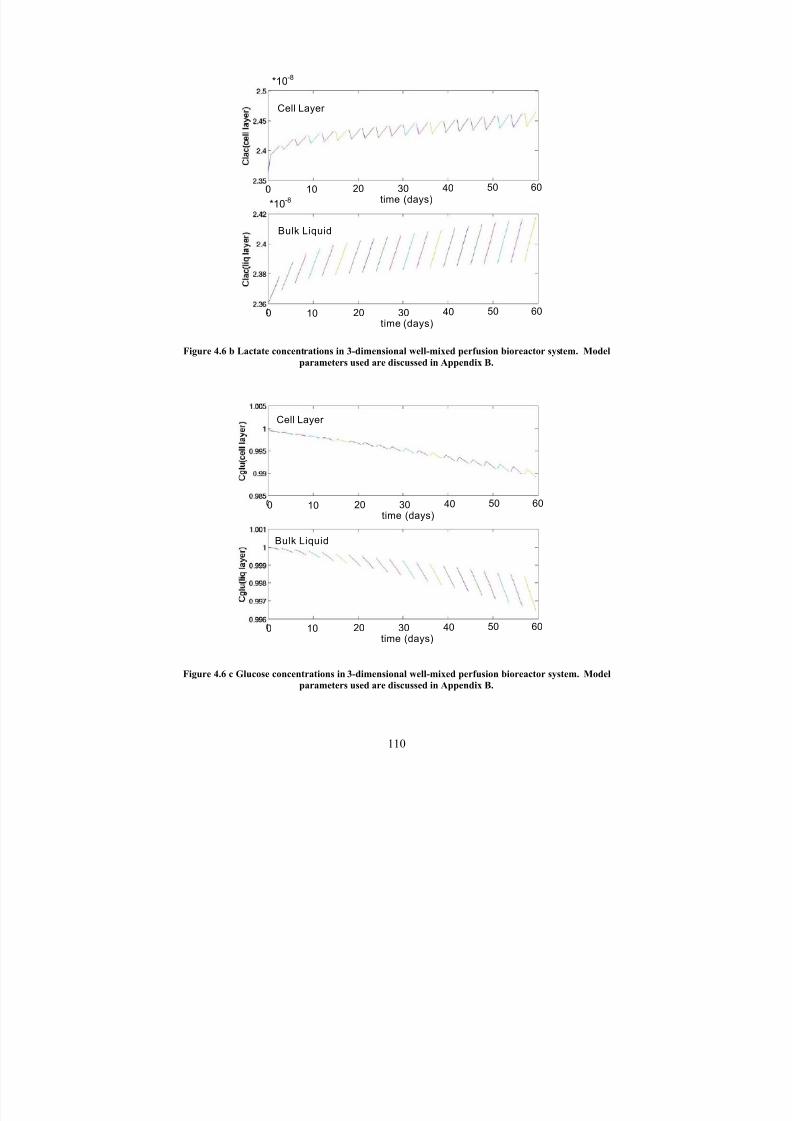
7/27/2019 Mathematical Modeling of Transport and Reaction in Cellular and T
http://slidepdf.com/reader/full/mathematical-modeling-of-transport-and-reaction-in-cellular-and-t 130/270
110
Figure 4.6 b Lactate concentrations in 3-dimensional well-mixed perfusion bioreactor system. Model
parameters used are discussed in Appendix B.
Figure 4.6 c Glucose concentrations in 3-dimensional well-mixed perfusion bioreactor system. Model
parameters used are discussed in Appendix B.
*10-8
10 60504030200time (days)
10 60504030200time (days)*10
-8
Bulk Liquid
Cell Layer
10 60504030200time (days)
10 60504030200time (days)
Cell Layer
Bulk Liquid
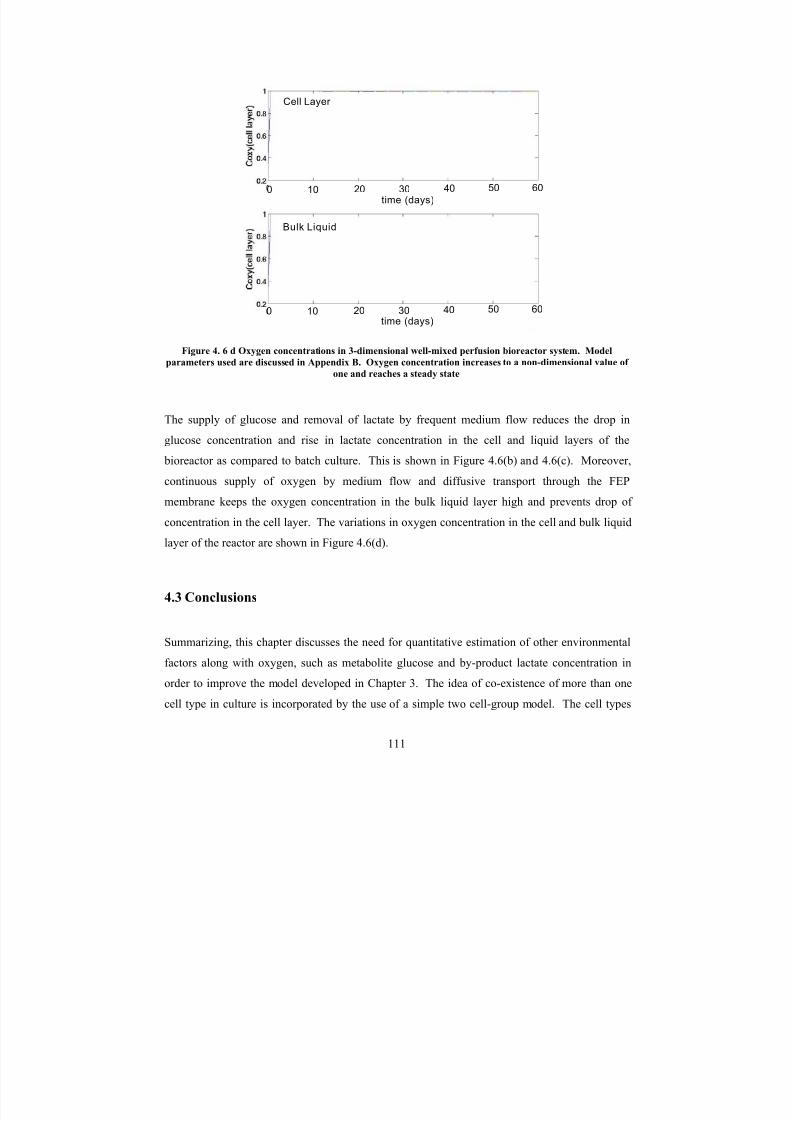
7/27/2019 Mathematical Modeling of Transport and Reaction in Cellular and T
http://slidepdf.com/reader/full/mathematical-modeling-of-transport-and-reaction-in-cellular-and-t 131/270
111
Figure 4. 6 d Oxygen concentrations in 3-dimensional well-mixed perfusion bioreactor system. Model
parameters used are discussed in Appendix B. Oxygen concentration increases to a non-dimensional value of
one and reaches a steady state
The supply of glucose and removal of lactate by frequent medium flow reduces the drop in
glucose concentration and rise in lactate concentration in the cell and liquid layers of the
bioreactor as compared to batch culture. This is shown in Figure 4.6(b) and 4.6(c). Moreover,
continuous supply of oxygen by medium flow and diffusive transport through the FEP
membrane keeps the oxygen concentration in the bulk liquid layer high and prevents drop of
concentration in the cell layer. The variations in oxygen concentration in the cell and bulk liquid
layer of the reactor are shown in Figure 4.6(d).
4.3 Conclusions
Summarizing, this chapter discusses the need for quantitative estimation of other environmental
factors along with oxygen, such as metabolite glucose and by-product lactate concentration in
order to improve the model developed in Chapter 3. The idea of co-existence of more than one
cell type in culture is incorporated by the use of a simple two cell-group model. The cell types
10 60504030200time (days)
10 60504030200time (days)
Cell Layer
Bulk Liquid

7/27/2019 Mathematical Modeling of Transport and Reaction in Cellular and T
http://slidepdf.com/reader/full/mathematical-modeling-of-transport-and-reaction-in-cellular-and-t 132/270
112
are separated on the basis of large differences in their metabolic lactate production rates.
Experimental data for 3-dimensional batch culture (tissue-flask) system is utilized for obtaining
the rate parameters for the CD34+ or the progenitor cells (cell group 1) and the mature or post-
progenitor cells (cell group 2) by model-experimental data fit. Once a suitable list of parameters
is obtained, these numbers are utilized for predicting cell growth, glucose and oxygen
consumption, and lactate production in the bioreactor system. The model developed here is for a
well-mixed reactor system. This is done by spatially averaging the concentration of metabolites
and cells in the cell layer and the bulk liquid layer of the perfusion reactor unit discussed in
chapter 3. The current study shows that the reactor system can sustain larger cell growth rates,
by maintaining the glucose and oxygen concentration high enough and by efficient removal of
lactate.
4.4 Recommendations for Future Work
This model can be extended by improving the well-mixed reactor model by incorporating the
effects of mass transport due to flow and computing the spatial distribution of nutrients and
products. This could be done by adding glucose, lactate, and cell growth balances for the
progenitor and post-progenitor cell types to the full spatial variation model presented in Chapter
3. The mathematical model results of glucose, oxygen and lactate concentrations in the bulk
liquid layer can be compared to experimental results obtained from the experiment on the 3-
dimensional perfusion bioreactor from Dr Ma’s lab. The effects of rates of nutrients (oxygen and
glucose) delivery and byproduct (lactate) removal and their spatial distributions in the cell layer
on cell growth can be studied. Initial calculation of the model would incorporate two cell types
as developed above. However, in further studies glucose consumption and lactate production by
multiple cells in the same lineage and in different lineages need to be studied. This
understanding would add to the long-range goal of optimization and control of the developed
bioreactor. Despite the large potential contribution, numerical models involving multiple cell
types and their kinetic and metabolic behavior in culture systems will only be useful when
properly validated. This requires a large amount of systematic experimental data with respect to
the same or similar reference systems. Hence, suitable experimental strategies should be
7/27/2019 Mathematical Modeling of Transport and Reaction in Cellular and T
http://slidepdf.com/reader/full/mathematical-modeling-of-transport-and-reaction-in-cellular-and-t 133/270
113
developed to obtain this information. The model is a good way of suggesting new experimental
designs by making it easy for the experimenter to know the parameters to be accurately
determined.
The growth and kinetic parameters for the perfusion unit can then be obtained by fitting model to
available experimental data for this system. This model could then be used to obtain variable
variations in terms of design, flow, and media used for the 3-dimensional perfusion bioreactor
model (FSU). Moreover, the effects of 3-dimensional cell-cell interactions and the formation of
extracellular matrix (ECM) leading to cell-ECM interactions on cell behavior as discussed in
Chapter 4.2.1.5 need to be studied. The study could incorporate model developments for
different matrix geometries, to improve upon cell growth in the reactor unit. One such matrix
type is suggested in Chapter 4.2.1.4 of the text. This model when complete would closely
replicate the ex vivo environment in cultures more effectively. This robust model can be used in
the estimation of different cell numbers and in the long run for designing appropriate conditions
for the formation of the cell types of interest.

7/27/2019 Mathematical Modeling of Transport and Reaction in Cellular and T
http://slidepdf.com/reader/full/mathematical-modeling-of-transport-and-reaction-in-cellular-and-t 134/270
114
CHAPTER 5
EFFECTS OF OXYGEN TRANSPORT ON 3-DIMENSIONAL
HUMAN MESENCHYMAL STEM CELL TISSUE
DEVELOPMENT IN PERFUSION AND STATIC CULTURES(Reproduced in part with permission from Biotechnology Progress, in press Zhao et al., 2005.
Unpublished work copyright [2005] American Chemical Society.)
5.1 Problem Statement
Human Mesenchymal Stem Cell’s (hMSC’s) potential applications for treating wide range of
diseases including osteogenesis imperfecta (Horwitz et al ., 1999, Prockop, 1997), stroke (Chenet al ., 2004, Chen et al ., 2003), and heart failure (Orlic et al ., 2001) have made it necessary to
obtain high yields of these cells in vitro in suitable culture devices. Experimental data on hMSC
growth-kinetics and spatial growth patterns, metabolism, and oxygen consumption in various
hMSC culture devices such as static and perfusion units have been studied (Zhao et al ., 2005
(a,b)) to elucidate the effects of perfusion culture on cell growth and tissue development. The
modular perfusion system similar to the unit discussed in Chapter 3 was used to measure growth
kinetics, metabolism, and oxygen consumption experimentally in Dr Ma’s lab (Florida State
University). Convective oxygen transport was found to be important for enabling and sustaining
high cell growth rates, high cell density, and uniform growth pattern. In order to reemphasize
the significance of flow quantitatively in terms of oxygen delivery on hMSC development, a
dynamic mathematical model describing oxygen distribution in the static and perfusion culture
units is developed. The model is based on the principles of mass transport and reaction and

7/27/2019 Mathematical Modeling of Transport and Reaction in Cellular and T
http://slidepdf.com/reader/full/mathematical-modeling-of-transport-and-reaction-in-cellular-and-t 135/270
115
provides estimates of the spatio-temporal oxygen concentration profiles in the two units, which is
difficult to be measured experimentally. The objective here is not to develop an a priori
predictive model but to use the developed model along with the available experimental data and
understand the role of oxygen transport on cell behavior (growth and metabolism) in these
different culture units.
5.2 Reactor Designs
Perfusion reactor design (Unit 1)
Unit 1 represents the 3-dimensional perfusion chamber as shown as a schematic in Figure 5.1(a).
The dimensions of this perfusion unit are similar to the one discussed in Chapter 3. hMSCs are
grown in the 3-dimensional matrix and form what is termed the ‘cell layer’ of the chamber. This
cell layer is assumed to be a rectangle for modeling simplicities and also because the accuracy of
calculation does not need the exact dimensions of circular constructs used for experiments (Zhao
et al ., 2005 (a)). Medium supplying nutrients to cells in the cell layer flows through the
perfusion chambers above and below the matrix and is termed the ‘bulk liquid layer’.
As mentioned earlier oxygen transport to the bulk liquid layer is by convective and diffusive
transport. Nutrients are supplied by convection through either a once through mode or by re-
circulation of the bulk liquid layer medium. Diffusion of oxygen from the incubator occurs
through the gas permeable, FEP membrane into the perfusion chambers. In the cell layer oxygen
is delivered by diffusive transport only. Convective oxygen supply in the construct is not
proposed because the matrix is assumed to be incompressible and the two perfusion chambers
above and below the matrix are identical with respect to flow and resistances. Moreover, the
absence of flow in the cell layer prevents flow restrictions on cell growth by shear or other
mechanical forces and promotes adhesion of the cells to the matrix surface.
Static culture design (Unit 2)
In order to study the effects of flow on tissue development the same 3-dimensional PET matrix is
placed in a tissue culture plate as is used in a static culture unit. Unit 2 (Figure 5.1b) is used to
7/27/2019 Mathematical Modeling of Transport and Reaction in Cellular and T
http://slidepdf.com/reader/full/mathematical-modeling-of-transport-and-reaction-in-cellular-and-t 136/270
116
model this static culture system. The unit used for the model is a similar rectangular block 10
cm length, 2.5 cm width, and 13.2 mm thick as the flow unit. The 3-dimensional PET porous
matrix (1.2 mm thick) is placed on the bottom of the reactor and forms the ‘cell layer’. Medium
supplying nutrients (oxygen) above the matrix forms the ‘bulk liquid layer’. The mode of
oxygen supply to the cells in the cell layer is only by diffusion through the stagnant liquid layer
above the construct. Transport of oxygen in the cell layer is also by diffusion only, again to
avoid the effects of shear and to allow cell adhesion to the matrix. In addition to the absence of
convection in the bulk liquid layer of Unit 2, the surface area for oxygen transport to the
construct is also reduced to one half of that in the perfusion bioreactor (Unit 1), reducing the
amount of oxygen delivered to meet cell demands.
5.3 Experimental Data
Cell numbers in the PET matrices in static and perfusion culture units were determined by DNA
assays. The cell density was computed by dividing the cell number and matrix volume and is
shown as open triangles in Figure 5.2 (a), (b). Oxygen tension was measured through sampling
ports located at the inlets and outlets of the perfusion chambers. Oxygen consumption is
computed by the difference between the measured oxygen tensions at the two ports. The specific
oxygen consumption rate in the perfusion reactor was obtained by dividing this oxygen
consumption in the perfusion chambers by the cell numbers at that time point and the residence
time of the nutrient media (Zhao et al ., 2005 b).
5.4 Mathematical Model Development
Mathematical models for oxygen transport and reaction are modeled in perfusion and static
culture units to assess the importance of perfusion flow on cell proliferation and metabolism.
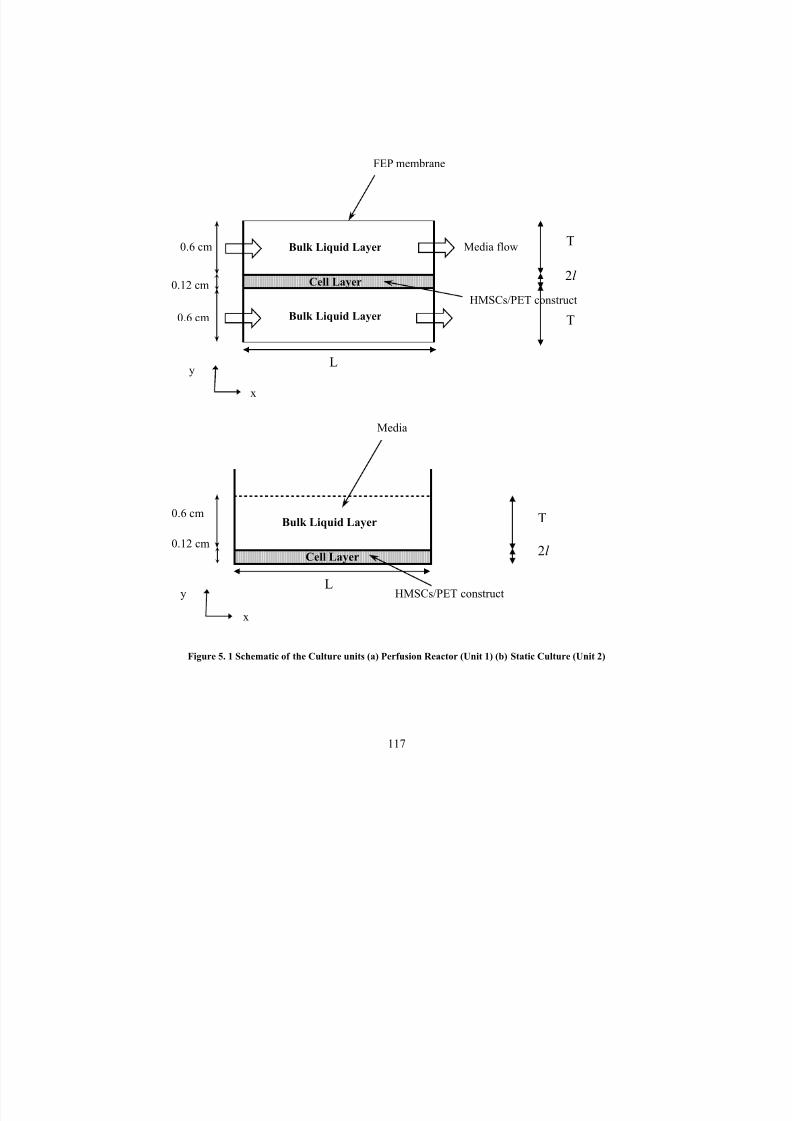
7/27/2019 Mathematical Modeling of Transport and Reaction in Cellular and T
http://slidepdf.com/reader/full/mathematical-modeling-of-transport-and-reaction-in-cellular-and-t 137/270
117
Figure 5. 1 Schematic of the Culture units (a) Perfusion Reactor (Unit 1) (b) Static Culture (Unit 2)
FEP membrane
HMSCs/PET construct0.6 cm
0.6 cm
0.12 cm
Media flow T
2l
L
T
Bulk Liquid Layer
Cell Layer
Bulk Liquid Layer
x
y
Media
0.6 cm
0.12 cm
HMSCs/PET construct
T
2l
L
Bulk Liquid Layer
Cell Layer
x
y

7/27/2019 Mathematical Modeling of Transport and Reaction in Cellular and T
http://slidepdf.com/reader/full/mathematical-modeling-of-transport-and-reaction-in-cellular-and-t 138/270
118
5.4.1 Model Equations Perfusion Reactor (Unit 1)
For the model development of Unit 1, only half of the reactor needed to be considered because of
symmetry. Species continuity equations describing the spatial and temporal variations of oxygen
concentration were written for both the bulk liquid layer and the cell layer. The method of
volume averaging was used to develop a single species continuity equation for the multiphase
cell layer made up of cells and medium solution (Pathi et al ., 2005; Galban et al ., 1999;
Whitaker et al ., 1999). It can be noted that the overall reactor model was solved in two
dimensions (length and depth) since variation over the width are small compared to the length
and depth. Similar formulation of the model and boundary conditions as described in chapter 3
was considered for this reactor unit (equations 3.16).
Layer Cell c K C K
c K Qc D
t
c
Layer Liquid Bulk cvc Dt
c
ceqom
ceqm
ceff
c
l xl l
γ
γ
β
ε
ε
⋅⋅+
⋅⋅⋅−∇∇=
∂
∂
∇⋅−∇⋅∇=∂
∂
)/(
)(
(5.1)
where cc and cl are non-dimensional oxygen concentration in the cell layer and bulk liquid layer 1
; ε γ is the cell volume fraction; v x is the velocity profile; D β is the oxygen diffusion coefficient of
oxygen in the bulk liquid layer; Deff is the effective diffusion coefficient; K eq is the equilibrium
coefficient of oxygen between the cell and the nutrient phases of the averaging volume. The
effective diffusion coefficient accounts for the diffusion in the cellular and the nutrient (non-
cellular) phase as well as the mass transport between the two phases in the cell layer (Pathi et al .,
2005; Ochoa et al ., 1988; Galban et al ., 1999 a,b; Whitaker et al ., 1999). The one-dimensional
flow is oriented along the reactor length (x-direction) and is assumed to be laminar (Re = 0.28)
corresponding to flow rate of 0.1 mL/min). The reaction rate kinetic function describing the
overall oxygen consumption (for metabolic and growth processes) is assumed to follow
1 The oxygen concentration terms are non-dimensionalized by dividing the oxygen concentration at all point in
space and time with the dissolved oxygen concentration in equilibrium with air (C o=20% oxygen or 152 mmHg or
2.10*10-7 mol/cm3).
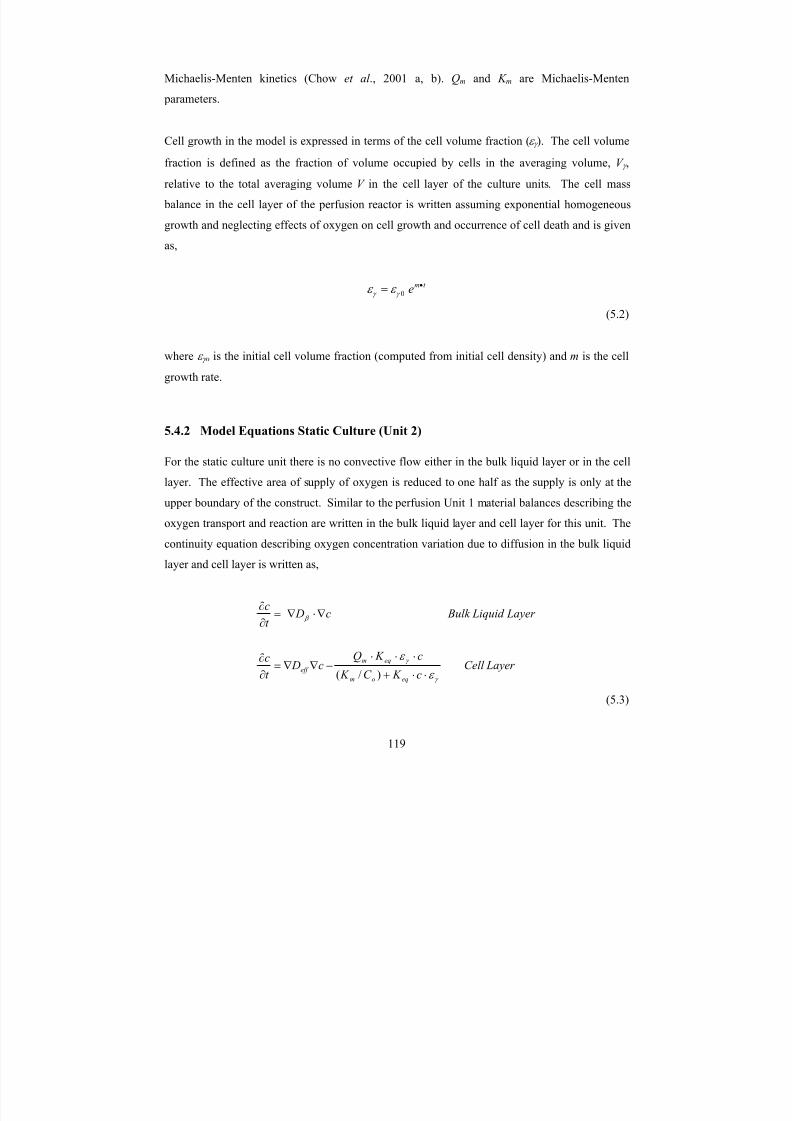
7/27/2019 Mathematical Modeling of Transport and Reaction in Cellular and T
http://slidepdf.com/reader/full/mathematical-modeling-of-transport-and-reaction-in-cellular-and-t 139/270
119
Michaelis-Menten kinetics (Chow et al ., 2001 a, b). Qm and K m are Michaelis-Menten
parameters.
Cell growth in the model is expressed in terms of the cell volume fraction (ε γ ). The cell volume
fraction is defined as the fraction of volume occupied by cells in the averaging volume, V γ ,
relative to the total averaging volume V in the cell layer of the culture units. The cell mass
balance in the cell layer of the perfusion reactor is written assuming exponential homogeneous
growth and neglecting effects of oxygen on cell growth and occurrence of cell death and is given
as,
t me •= 0γ γ ε ε
(5.2)
where ε γ o is the initial cell volume fraction (computed from initial cell density) and m is the cell
growth rate.
5.4.2 Model Equations Static Culture (Unit 2)
For the static culture unit there is no convective flow either in the bulk liquid layer or in the cell
layer. The effective area of supply of oxygen is reduced to one half as the supply is only at the
upper boundary of the construct. Similar to the perfusion Unit 1 material balances describing the
oxygen transport and reaction are written in the bulk liquid layer and cell layer for this unit. The
continuity equation describing oxygen concentration variation due to diffusion in the bulk liquid
layer and cell layer is written as,
Layer Cell c K C K
c K Qc D
t
c
Layer Liquid Bulk c Dt c
eqom
eqm
eff
γ
γ
β
ε
ε
⋅⋅+
⋅⋅⋅−∇∇=
∂∂
∇⋅∇=∂∂
)/(
(5.3)
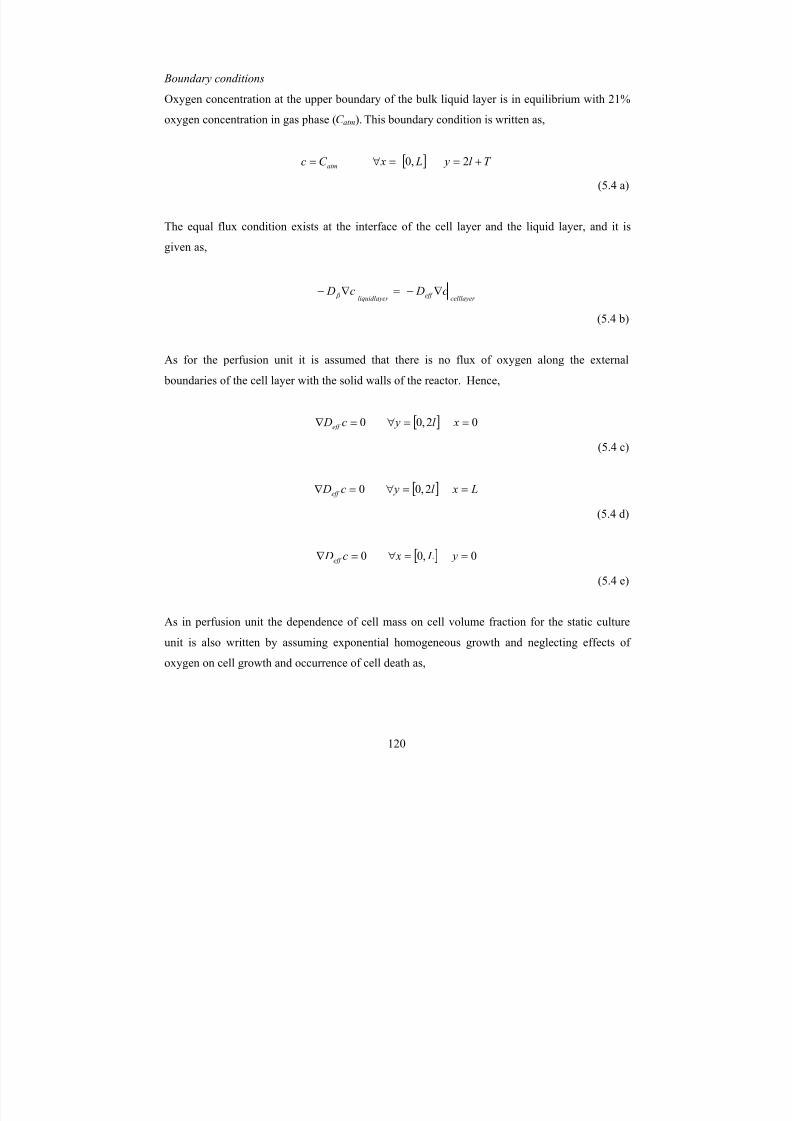
7/27/2019 Mathematical Modeling of Transport and Reaction in Cellular and T
http://slidepdf.com/reader/full/mathematical-modeling-of-transport-and-reaction-in-cellular-and-t 140/270
120
Boundary conditions
Oxygen concentration at the upper boundary of the bulk liquid layer is in equilibrium with 21%
oxygen concentration in gas phase (C atm). This boundary condition is written as,
atmC c = [ ] T l y L x +==∀ 2,0
(5.4 a)
The equal flux condition exists at the interface of the cell layer and the liquid layer, and it is
given as,
celllayer eff r liquidlayec Dc D ∇−=∇− β
(5.4 b)
As for the perfusion unit it is assumed that there is no flux of oxygen along the external
boundaries of the cell layer with the solid walls of the reactor. Hence,
0=∇ c Deff [ ] 02,0 ==∀ xl y
(5.4 c)
0=∇ c Deff [ ] L xl y ==∀ 2,0
(5.4 d)
0=∇ c Deff [ ] 0,0 ==∀ y L x
(5.4 e)
As in perfusion unit the dependence of cell mass on cell volume fraction for the static culture
unit is also written by assuming exponential homogeneous growth and neglecting effects of
oxygen on cell growth and occurrence of cell death as,
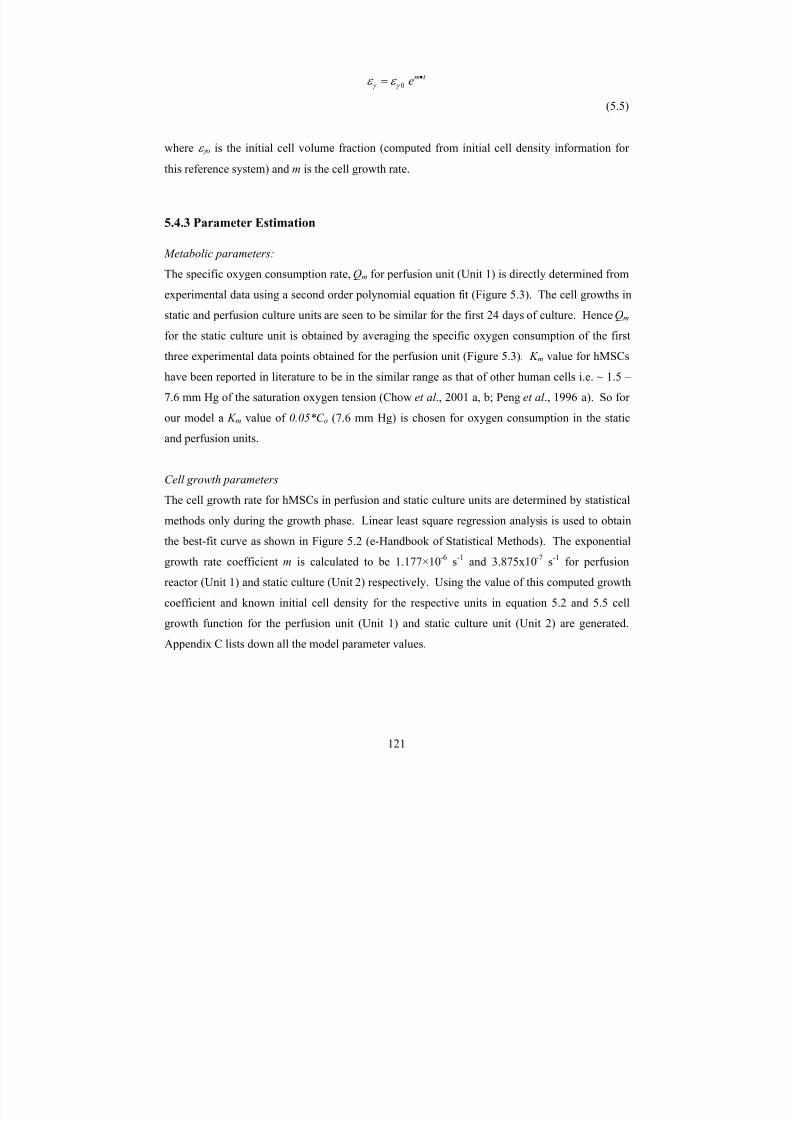
7/27/2019 Mathematical Modeling of Transport and Reaction in Cellular and T
http://slidepdf.com/reader/full/mathematical-modeling-of-transport-and-reaction-in-cellular-and-t 141/270
121
t me •= 0γ γ ε ε
(5.5)
where ε γ o is the initial cell volume fraction (computed from initial cell density information for this reference system) and m is the cell growth rate.
5.4.3 Parameter Estimation
Metabolic parameters:
The specific oxygen consumption rate, Qm for perfusion unit (Unit 1) is directly determined from
experimental data using a second order polynomial equation fit (Figure 5.3). The cell growths in
static and perfusion culture units are seen to be similar for the first 24 days of culture. Hence Qm
for the static culture unit is obtained by averaging the specific oxygen consumption of the first
three experimental data points obtained for the perfusion unit (Figure 5.3). K m value for hMSCs
have been reported in literature to be in the similar range as that of other human cells i.e. ~ 1.5 –
7.6 mm Hg of the saturation oxygen tension (Chow et al ., 2001 a, b; Peng et al ., 1996 a). So for
our model a K m value of 0.05*C o (7.6 mm Hg) is chosen for oxygen consumption in the static
and perfusion units.
Cell growth parameters
The cell growth rate for hMSCs in perfusion and static culture units are determined by statistical
methods only during the growth phase. Linear least square regression analysis is used to obtain
the best-fit curve as shown in Figure 5.2 (e-Handbook of Statistical Methods). The exponential
growth rate coefficient m is calculated to be 1.177×10⁻⁶
s-1
and 3.875x10⁻⁷
s-1
for perfusion
reactor (Unit 1) and static culture (Unit 2) respectively. Using the value of this computed growth
coefficient and known initial cell density for the respective units in equation 5.2 and 5.5 cellgrowth function for the perfusion unit (Unit 1) and static culture unit (Unit 2) are generated.
Appendix C lists down all the model parameter values.

7/27/2019 Mathematical Modeling of Transport and Reaction in Cellular and T
http://slidepdf.com/reader/full/mathematical-modeling-of-transport-and-reaction-in-cellular-and-t 142/270
122
(a)
(b)
Figure 5. 2 Growth kinetics of hMSCs under (a) static and (b) perfusion conditions. Cell density is expressed
in cells/ml.
14.8
15.2
15.6
16
16.4
0 10 20 30 40
Time (days)
expt.
model
Static culture
(Unit 2) l n
c e l l d e n s i t
12
13
14
15
16
17
18
0 10 20 30 40
Time (days)
Expt
model
Perfusion
culture (Unit 1) l n
c e l l d e n s i t
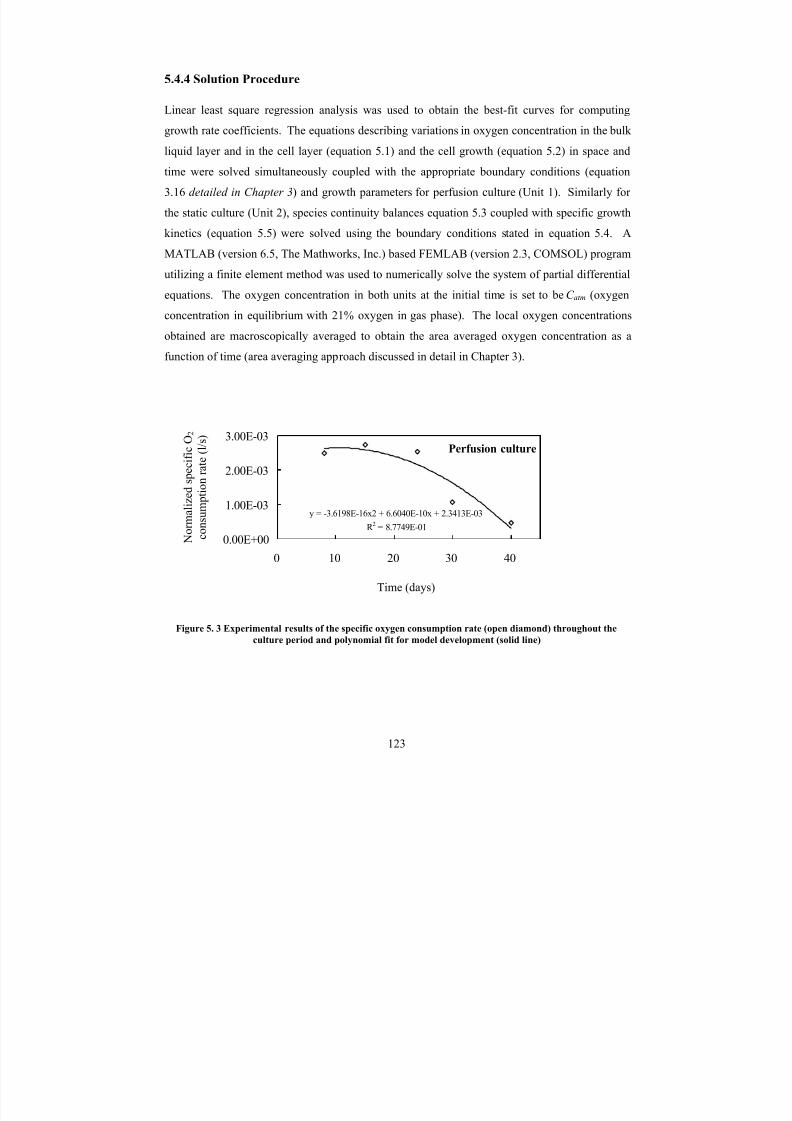
7/27/2019 Mathematical Modeling of Transport and Reaction in Cellular and T
http://slidepdf.com/reader/full/mathematical-modeling-of-transport-and-reaction-in-cellular-and-t 143/270
123
5.4.4 Solution Procedure
Linear least square regression analysis was used to obtain the best-fit curves for computing
growth rate coefficients. The equations describing variations in oxygen concentration in the bulk
liquid layer and in the cell layer (equation 5.1) and the cell growth (equation 5.2) in space and
time were solved simultaneously coupled with the appropriate boundary conditions (equation
3.16 detailed in Chapter 3) and growth parameters for perfusion culture (Unit 1). Similarly for
the static culture (Unit 2), species continuity balances equation 5.3 coupled with specific growth
kinetics (equation 5.5) were solved using the boundary conditions stated in equation 5.4. A
MATLAB (version 6.5, The Mathworks, Inc.) based FEMLAB (version 2.3, COMSOL) program
utilizing a finite element method was used to numerically solve the system of partial differential
equations. The oxygen concentration in both units at the initial time is set to be C atm (oxygen
concentration in equilibrium with 21% oxygen in gas phase). The local oxygen concentrations
obtained are macroscopically averaged to obtain the area averaged oxygen concentration as a
function of time (area averaging approach discussed in detail in Chapter 3).
Figure 5. 3 Experimental results of the specific oxygen consumption rate (open diamond) throughout the
culture period and polynomial fit for model development (solid line)
y = -3.6198E-16x2 + 6.6040E-10x + 2.3413E-03
R 2 = 8.7749E-01
0.00E+00
1.00E-03
2.00E-03
3.00E-03
0 10 20 30 40
N o r m a l i z e d s p e c i f i
c O 2
c o n s u m p t i o n r a t e ( l / s )
Time (days)
Perfusion culture
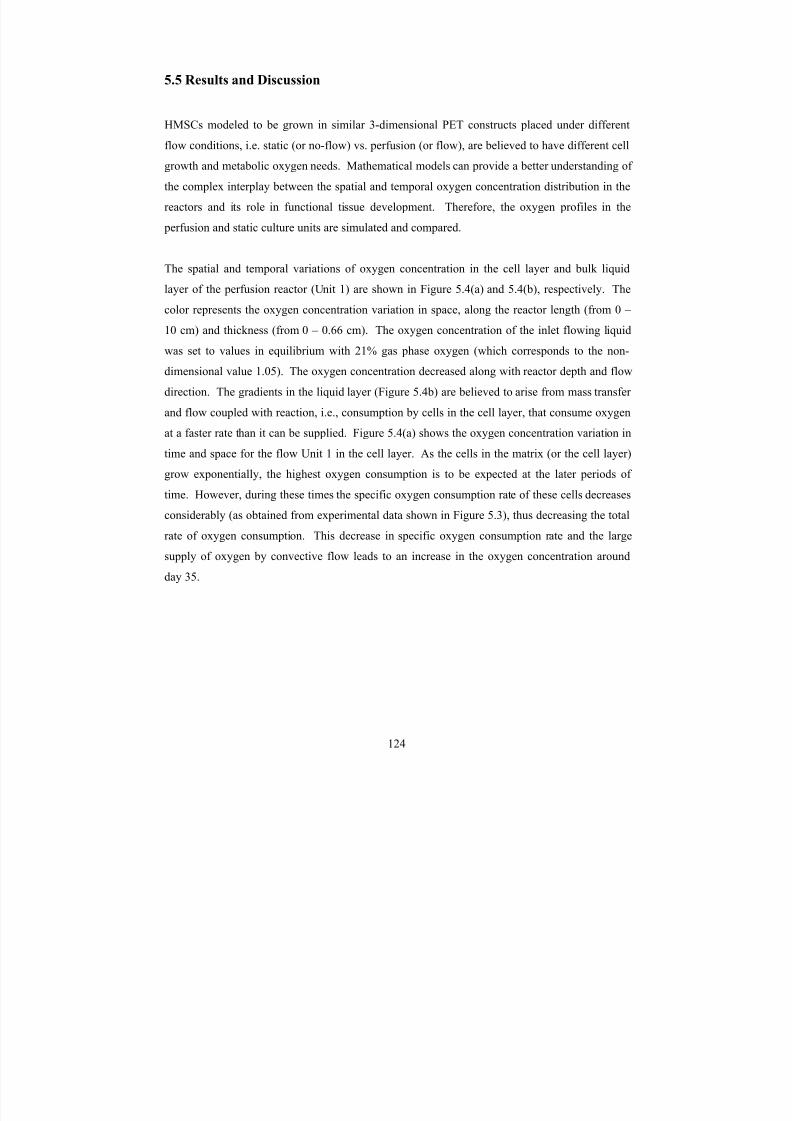
7/27/2019 Mathematical Modeling of Transport and Reaction in Cellular and T
http://slidepdf.com/reader/full/mathematical-modeling-of-transport-and-reaction-in-cellular-and-t 144/270
124
5.5 Results and Discussion
HMSCs modeled to be grown in similar 3-dimensional PET constructs placed under different
flow conditions, i.e. static (or no-flow) vs. perfusion (or flow), are believed to have different cellgrowth and metabolic oxygen needs. Mathematical models can provide a better understanding of
the complex interplay between the spatial and temporal oxygen concentration distribution in the
reactors and its role in functional tissue development. Therefore, the oxygen profiles in the
perfusion and static culture units are simulated and compared.
The spatial and temporal variations of oxygen concentration in the cell layer and bulk liquid
layer of the perfusion reactor (Unit 1) are shown in Figure 5.4(a) and 5.4(b), respectively. The
color represents the oxygen concentration variation in space, along the reactor length (from 0 –
10 cm) and thickness (from 0 – 0.66 cm). The oxygen concentration of the inlet flowing liquid
was set to values in equilibrium with 21% gas phase oxygen (which corresponds to the non-
dimensional value 1.05). The oxygen concentration decreased along with reactor depth and flow
direction. The gradients in the liquid layer (Figure 5.4b) are believed to arise from mass transfer
and flow coupled with reaction, i.e., consumption by cells in the cell layer, that consume oxygen
at a faster rate than it can be supplied. Figure 5.4(a) shows the oxygen concentration variation in
time and space for the flow Unit 1 in the cell layer. As the cells in the matrix (or the cell layer)
grow exponentially, the highest oxygen consumption is to be expected at the later periods of
time. However, during these times the specific oxygen consumption rate of these cells decreases
considerably (as obtained from experimental data shown in Figure 5.3), thus decreasing the total
rate of oxygen consumption. This decrease in specific oxygen consumption rate and the large
supply of oxygen by convective flow leads to an increase in the oxygen concentration around
day 35.

7/27/2019 Mathematical Modeling of Transport and Reaction in Cellular and T
http://slidepdf.com/reader/full/mathematical-modeling-of-transport-and-reaction-in-cellular-and-t 145/270
125
Figure 5.4 a Mathematical simulation of the spatio-temporal variation of oxygen concentration in the cell
layer of the perfusion bioreactor Unit 1
For static culture (Unit 2), the calculated growth rate from the experimental data (Figure 5.2b)
and oxygen consumption parameters as described in the parameter estimation section are used to
determine the oxygen concentration distribution. Oxygen concentration profiles in the bulk
liquid layer and the cell layer are obtained as a function of space and time for the no-flow Unit 2
(Figure 5.4c). Compared with perfusion culture, this unit has a more uniform oxygen
concentration distribution in space but a faster depletion during the whole culture time period.
The larger depletion of oxygen in static culture (drops to non-dimensional value of 0.19)
compared to the perfusion bioreactor (drops to a non-dimensional value of 0.47), is attributed to
the mode of oxygen supply, the surface area for oxygen supply, different cell growth kinetics
and, the physiological differences in specific oxygen consumption in the two units.
30
20
10
40
Media flow
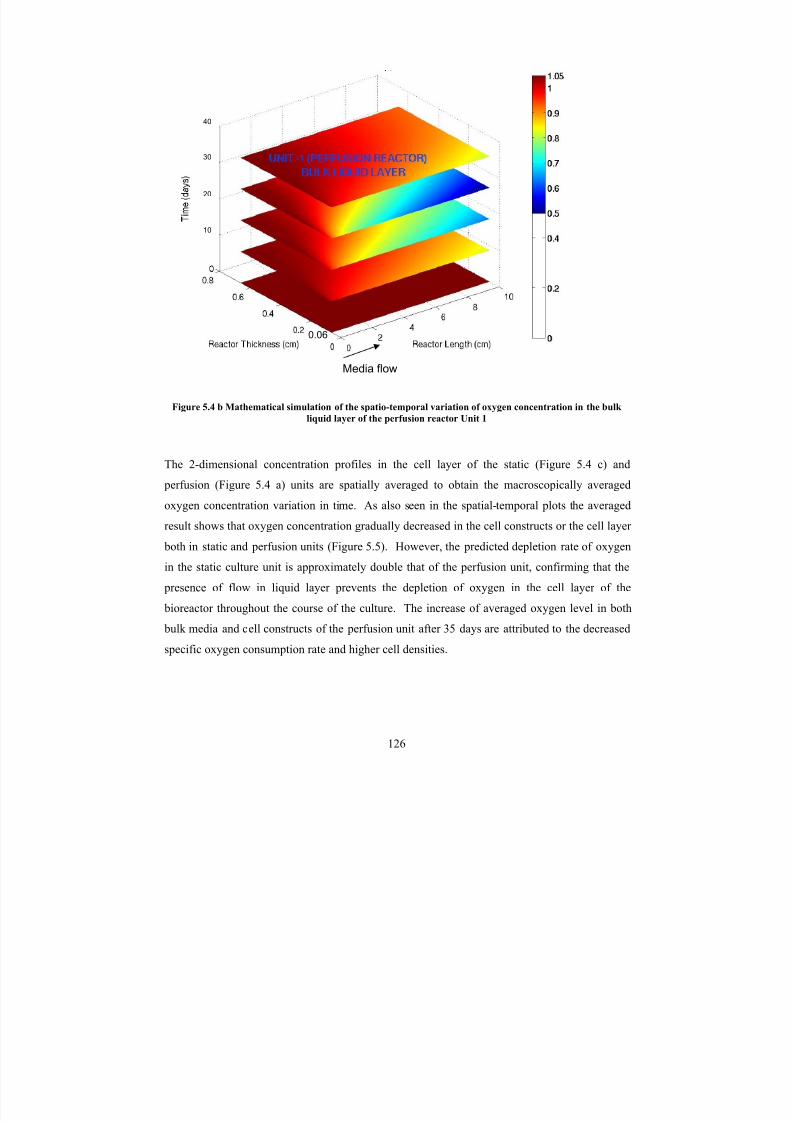
7/27/2019 Mathematical Modeling of Transport and Reaction in Cellular and T
http://slidepdf.com/reader/full/mathematical-modeling-of-transport-and-reaction-in-cellular-and-t 146/270
126
Figure 5.4 b Mathematical simulation of the spatio-temporal variation of oxygen concentration in the bulk
liquid layer of the perfusion reactor Unit 1
The 2-dimensional concentration profiles in the cell layer of the static (Figure 5.4 c) and
perfusion (Figure 5.4 a) units are spatially averaged to obtain the macroscopically averaged
oxygen concentration variation in time. As also seen in the spatial-temporal plots the averaged
result shows that oxygen concentration gradually decreased in the cell constructs or the cell layer
both in static and perfusion units (Figure 5.5). However, the predicted depletion rate of oxygen
in the static culture unit is approximately double that of the perfusion unit, confirming that the
presence of flow in liquid layer prevents the depletion of oxygen in the cell layer of the
bioreactor throughout the course of the culture. The increase of averaged oxygen level in both
bulk media and cell constructs of the perfusion unit after 35 days are attributed to the decreased
specific oxygen consumption rate and higher cell densities.
40
30
20
10
0.06
Media flow

7/27/2019 Mathematical Modeling of Transport and Reaction in Cellular and T
http://slidepdf.com/reader/full/mathematical-modeling-of-transport-and-reaction-in-cellular-and-t 147/270

7/27/2019 Mathematical Modeling of Transport and Reaction in Cellular and T
http://slidepdf.com/reader/full/mathematical-modeling-of-transport-and-reaction-in-cellular-and-t 148/270
128
Oxygen tension has been mentioned to be one of the various environmental factors that influence
cellular events leading to the construct formation, including cell attachment and spreading
(Mitchell et al ., 2004, Rotem et al ., 1994), proliferation (Mitchell et al ., 2004, Duggan et al .,
2004), migration (Annabi et al ., 2003), secretion of ECM (Chen et al , 2003, Gebb et al ., 2003),
and differentiation (Cipolleschi et al ., 1993, Terai et al ., 2002). Experimental results using BrdU
staining in Dr Ma’s lab have shown different cell proliferation patterns under static culture on
either sides of the PET construct (Zhao et al ., 2005 b); with higher proliferating cells on the
upper surface of the construct exposed to higher oxygen and nutrient supply. On the other hand
for constructs grown in the perfusion condition there was no difference in the growth patterns at
the two surfaces of the constructs (Zhao et al ., 2005 b).
In the perfusion bioreactor (Unit 1) the results from modeling indicate that there exists an oxygen
gradient in the constructs at high cell densities. The lowest level of oxygen tension in the
construct was maintained above 0.47 (~ 9.4 % gas phase oxygen) throughout the culture period
even at the highest cell densities. However, to be noted in static culture (Unit 2) the lowest non-
dimensional oxygen level in the cell layer decreased from nearly 0.5 (~ 10 % gas phase oxygen)
in the initial phase (around 10 days) of the culture period to nearly 0.19 (~ 3.8 % gas phase
oxygen) at end of the culture period (around 40 days). Experimental studies have shown that the
effects of oxygen tension on cell proliferation and ECM secretion are significant only when the
oxygen tension is lower than 40 mmHg (Jiang et al ., 1996), which corresponds to the
dimensionless oxygen tension of 0.26 (~ 5.3 % gas phase oxygen) in this study. Therefore, it is
reasoned that the oxygen level in the constructs of the perfusion bioreactor system (Unit 1) is
maintained above the level that could lead to the significant cellular physiological changes,
whereas oxygen distribution might limit the cell growth and metabolism of the constructs in
static culture (Unit 2). The non-uniform growth patterns in the static culture are again attributed
to the oxygen and nutrient transfer limitations. These results demonstrate the significant role of
perfusion in sustaining the development of engineered tissue constructs.
It is important to note, however, that oxygen tension may not be the only factor that influences
cell spatial growth pattern in these different culture units. In addition to oxygen, diffusion also
limits other nutrients delivery and waste removal in the static culture that possibly hinders cell

7/27/2019 Mathematical Modeling of Transport and Reaction in Cellular and T
http://slidepdf.com/reader/full/mathematical-modeling-of-transport-and-reaction-in-cellular-and-t 149/270
129
growth in this unit. Moreover, the medium flow and shear stress also influence cell proliferation
in the perfusion bioreactor (Li et al ., 2004) and the expression of various hMSC differentiation
markers (Li et al ., 2004; Meinel et al ., 2004; Park et al ., 2004). While the flow rate of 0.1
ml/min (Re = 0.28) used in this study is sufficiently low compared to these studied (Re ~ 50),
further investigation under different flow rate is necessary to independently elucidate the effects
of shear stress on cell growth.
5.6 Conclusions
High cell density and construct uniformity are important parameters for in vitro 3-dimensional
tissue development which require sufficient nutrient delivery. In this study, we modeled the
oxygen profiles of the 3-dimensional constructs grown under static and perfusion conditions, and
evaluated the effects of the culture environment on construct development. Within the construct,
some degree of empiricism and approximation is utilized to determine an estimate of oxygen
concentration. The results show that the 3-dimensional constructs grown in static cultures
developed significant oxygen gradients and have the tendency to give rise to spatially non-
uniform and inconsistent construct development. The perfusion system provides the cells a
controlled environment with enhanced nutrient transport by maintaining a much higher oxygen
concentrations that sustains a high proliferation rate and high cell density. Experimental results
on the cell spatial developmental patterns between the cells grown in static culture as opposed to
perfusion culture could possibly be attributed to the spatial variations in oxygen concentration in
the 3-dimensional constructs within the flow and no-flow units. Our study demonstrates the
need to use perfusion bioreactor systems to support engineered tissue construct development.

7/27/2019 Mathematical Modeling of Transport and Reaction in Cellular and T
http://slidepdf.com/reader/full/mathematical-modeling-of-transport-and-reaction-in-cellular-and-t 150/270
130
CHAPTER 6
ANALYSIS OF CARTILAGE TISSUE GROWTH AND
EXTRACELLULAR MATRIX FORMATION EX VIVO IN
HOLLOW FIBER BIOREACTOR (Submitted July 2005 to Biotechnology and Bioengineering)
6.1 Introduction
Articular cartilage is a thin layer of connective tissue located within joints at the end of bones
(Buckwalter et al ., 1997). It is made up of relatively few cartilage cells called chondrocytes
present in an extensively hydrated extracellular matrix (ECM), composed primarily of collagens
and proteoglycans. The proteoglycan molecules exhibit a tendency to swell and provide the
tissue with resistance to compression. The collagen network in the cartilage provides the tissue
with integrity and mechanical strength during tensile and shear loading (Dimico et al ., 2003).
The chondrocyte cells though few in number do fulfill a very essential function of ensuring that
the composition of the cartilage matrix (or ECM) remains constant. The synthesis of ECM alters
the microenvironment around the cells. In vivo or in vitro it is clearly seen that cells and ECM
are mutually interdependent; chondrocyte activity is necessary for matrix synthesis; in turnmatrix controls the environment of cells (Wilkins et al ., 2000).
Degeneration of articular cartilage occurs during osteoarthritis and joint injury. The limited
capacity of cartilage to respond to mechanical injury with a reparative process has motivated the
incorporation of cell-based repair approaches to articular cartilage lesions (Raimondi et al .,
7/27/2019 Mathematical Modeling of Transport and Reaction in Cellular and T
http://slidepdf.com/reader/full/mathematical-modeling-of-transport-and-reaction-in-cellular-and-t 151/270
131
2002). Tissue engineering approaches are extensively being employed to produce replacement
cartilage, which closely resembles healthy native cartilage both structurally and functionally.
These neocartilage samples, commonly designed as plugs, are manufactured within in vitro
bioreactor systems, which can further be used for systematic studies of the process of
chondrogenesis. Current bioreactor technologies – spinner flasks, rotating vessels, perfusion
reactor, hollow fiber reactors, and cylindrical bioreactors – provide a uniform and quantifiable
growth environment (Temenoff et al ., 2000; Williams et al ., 2002). Enhanced growth observed
in these bioreactor systems is partly due to increased efficiency in nutrient transport as compared
to static culture systems. Efficient oxygen delivery in mixed flasks and rotating vessels resulted
in aerobic conditions, which is shown to favor rapid tissue formation (Vunjak-Novakovi et al .,
1996; Obradovic et al ., 1999). It is seen that the morphology, composition, and mechanical
properties of the developed tissue constructs are strongly influenced by the microenvironment of
the cells.
Although these bioreactor systems deliver large amounts of nutrients to cells and provide a better
biochemical and mechanical environment to support chondrogenesis in comparison to static
culture units, there exist spatial and temporal gradients in nutrient concentrations that would
directly affect the growth of cartilage tissue. For suitable scale-up for clinical applicability to
produce cartilage constructs with desired composition and functional properties a better
understanding of the processes occurring in the reactor is necessary. Mathematical models can
be used to parametrically relate the kinetics of in vitro tissue formation to events occurring at cell
and molecular levels, and can also be utilized to investigate various designs and operating
conditions for enhancing bioreactor performance. This could be done by quantifying the
nutrient transport and consumption processes for various tissue functionalities. Understanding of
the transport and reaction processes of various metabolites would enhance our understanding of
the complex interplay among the array of known factors that control the functional tissue
development (Sengers et al ., 2004). The model can be used to predict the spatio-temporal
variations in construct composition, with regard to new tissue mass (cell and ECM) and the
microenvironment around the cartilage cell. Further, the mathematical model can also be used to
compile and understand the vast amounts of experimental data available for cartilage growth in
7/27/2019 Mathematical Modeling of Transport and Reaction in Cellular and T
http://slidepdf.com/reader/full/mathematical-modeling-of-transport-and-reaction-in-cellular-and-t 152/270
132
2-dimensional flasks and 3-dimensional bioreactors and can be utilized for suggesting rational
designs for tissue constructs.
Various models have been developed to simulate chondrogenesis in tissue culture systems.
Galban and Locke (1999 b) used volume averaging methods, first developed by Whitaker, 1967,
to study growth kinetics, diffusion, mass transfer restrictions, and spatial variations of cell mass
within polymer matrix. The model results were compared to the experimental data of Freed at
al., 1994b for chondrocyte growth in petri-dishes. They refined their model (Galban and Locke,
1999 a) by introducing effects of nutrient concentration and product inhibition and cell death in
expression for cell growth kinetics. However, in their study they observed that two component
models including cells and substrate are not sufficient to describe the range of behavior observed
in the experiments and a more wide range of cell and tissue specific parameters need to be
incorporated. Computational fluid dynamics (CFD) models to quantify momentum and mass
transport under conditions of tissue growth in cylindrical bioreactors have also been developed
(Williams et al ., 2002). CFD models are used to calculate flow-fields, shear stresses, and oxygen
profiles around non-porous constructs simulating cartilage development in concentric cylinder
bioreactors.
Several other models have been developed to describe the role of oxygen on GAG synthesis and
distribution in cellular constructs in rotating bioreactors (Obradovic et al ., 2000, Pisu et al ,
2003). These models account for the spatio-temporal changes in oxygen concentration due to
diffusion and consumption for chondrocyte metabolism and matrix synthesis. GAG deposition is
described by product inhibition kinetics with respect to GAG formation and a first order
dependence with respect to oxygen concentrations. Cell density variations in time and space are
described using mass structured population balances. The simulated GAG concentrations were
compared with available experimental data as a function of space. Several other time varying
models describing ECM synthesis (accumulation of both GAG and collagen) and the degradation
of polymeric scaffold for constant cell mass have been formulated for engineered cartilage
construct (Wilson et al ., 2002). Malda et al ., 2004 have improved upon the work of Obradovic
and coworkers by correlating pseudo-steady state simulated oxygen concentration variations in
the construct with their experimentally measured local oxygen concentrations. However, all
7/27/2019 Mathematical Modeling of Transport and Reaction in Cellular and T
http://slidepdf.com/reader/full/mathematical-modeling-of-transport-and-reaction-in-cellular-and-t 153/270
133
these models suffer from the inherent drawback of not accounting for suitable mass transport of
nutrients that is directly affected by the increase in cell mass by growth and differentiation, as
well as ECM production. The above models also do not incorporate the effects of the restricted
diffusion of nutrients on the chondrocyte activity.
The present study develops a mathematical model of cartilage tissue formation in the hollow
fiber bioreactor (HFBR) unit developed by Spencer’s group (Petersen et al ., 1997; Potter et al .,
1998; Ellis et al ., 2001). As seen in this unit, cells were not grown in constructs (compared to
the study by Langer’s group). The cells were injected into the extracapillary space between the
hollow fiber tubes in the reactor. Thereafter these cells attach themselves onto the outer surface
of the hollow fiber tubes or capillaries. These cells then proliferate radially outwards in the
space available. The moving boundary approach (Galban and Locke, 1997) coupled with the
method of volume averaging (Whitaker, 1967) is proposed to simulate the experimental radial
cell proliferation pattern, as well as account for transport and reaction processes in the reactor by
determination of effective diffusion and reaction terms for tissue formation in terms of local
geometry and spatial restrictions. The model computes the tissue and NMR measurable
parameters for comparison with available experimental results.
This study is intended to enhance our understanding of various factors that affect cell growth and
ECM production in vitro in bioreactors. The model would enable a further rationalization of
experimental results providing suggestions for improved experimental design and identifying the
key cell and tissue parameter measurements need to be made during cell cultures. Understanding
the responses of chondrocyte cells in terms of growth, differentiation, and ECM production with
respect to changes in the environment in the reactor would help in development of optimal
operational strategies in these reactors. Indirectly, the model would improve our understanding
of ways to monitor and control the development of the tissue engineered constructs in vitro in
bioreactors.

7/27/2019 Mathematical Modeling of Transport and Reaction in Cellular and T
http://slidepdf.com/reader/full/mathematical-modeling-of-transport-and-reaction-in-cellular-and-t 154/270
134
6.2 Methodology
6.2.1 Experimental Data
Spencer’s group at NIH have used HFBR units for production and development of 3-dimensional
hyaline cartilage from isolated chondrocytes (Petersen et al ., 1997; Potter et al ., 1998; Ellis et
al ., 2001). The unique feature of their methodology is the use of NMR to monitor tissue
development. This technique evaluates the over-all- tissue formation in the reactor without
disrupting the sample. The NMR measurable parameters are correlated to the chemical
characteristics of the tissue (cartilage tissue growth, metabolism and ECM composition); opening
up a new field in tissue engineering.
The NMR measurable parameters include water diffusion coefficient, relaxation parameters (T1,
longitudinal spin-lattice relaxation time constant and T2, transverse spin-spin relaxation time
constant), and magnetization transfer and proton densities. Measurement of the water diffusion
coefficient ( Deff w) and T1 relaxation constant (T1eff ) gives information on the obstruction to the
motion of water in the tissue due to tissue formation. This can be due to an increase in cell mass
or increase in ECM mass produced by the cells over the culture time. Magnetization transfer
(MT) measures the degree of interaction between the free and bound components of water.
Appendix D enlists the variation of these parameters with time as observed in the experiments of
Potter et al ., 1998.
6.2.2 Model Formulation
6.2.2.1 Outline
The HFBR set-up used for model development is described by Petersen et al ., 1997. The major
findings of Potter et al ., 1998 on macroscopic tissue development are incorporated in the model.
Cells were found organized into columns radiating from individual hollow fiber tubes. The
transverse slices show bright central hollow fiber or capillary and cylindrical symmetry of tissue
7/27/2019 Mathematical Modeling of Transport and Reaction in Cellular and T
http://slidepdf.com/reader/full/mathematical-modeling-of-transport-and-reaction-in-cellular-and-t 155/270
135
growth. After week 2 of tissue formation, the extracapillary space is almost filled with tissue
mass due to cell proliferation. The mean cell area is seen to increase with development time
after 2 weeks. This is consistent with a period of rapid cell proliferation during the early culture
time (first 2-3 weeks) followed by over-all tissue maturation (last 2-4 weeks). Following
development, the wet tissue weight increased with time, whereas the tissue water content drops,
consistent with an increase in tissue GAG and collagen content. Collagen content increased
significantly for all the 4 weeks of culture whereas the GAG content increased till 3 weeks of
culture and reached saturation. Water diffusion coefficient decreased from week 1 to week 4.
However the drop is seen to be remarkable between weeks 3 and 4, in spite the fact that the
overall tissue growth is almost over by week 3. The reduction is attributed to cartilage cell
maturation (increase in dry weight) that occurs during later weeks of culture, and also to increase
in collagen content over time (Potter et al ., 1998). These variations of the cell and NMR
parameters as observed in the experiments are listed in Appendix D.
The modeling approach incorporates the idea of ‘unit cells’. A ‘unit cell’ comprises of a single
chondrocyte cell and the niche it creates around itself. The niche is made up of the cell produced
ECM mainly proteoglycan (GAG) and collagen and the void phase associated around it. These
‘unit cells’ propagate outwards from the surface of the hollow fiber as shown in Figure 6.1. The
method of volume averaging is employed to derive effective diffusion and reaction rates of
components in this cartilage tissue, a multiphase system (Wood et al ., 2000; Wood et al , 2002;
Whitaker, 1999). However, this method is not sufficient to account for the radial growth of cells
in this reactor unit. Hence the moving boundary approach proposed by Galban and Locke, 1997
is incorporated with the volume averaging method to model the spatial growth patterns.
The developed model describes the following tissue and NMR parameters - cell mass production
which includes cell proliferation (accounting for increase in number of cells) and cell growth
(accounting for increase in area of cells during the maturation stage); cell metabolism (oxygen
consumption by cells); cell ECM production (Proteoglycan (GAG) and Collagen); NMR
parameters i.e. Deff w
and T1 relaxation time. It must be noted here that the cell proliferation and
cell growth are separated into two different distinct processes because experimental results
clearly show that cells in these stages are different both metabolically and in their rates of ECM
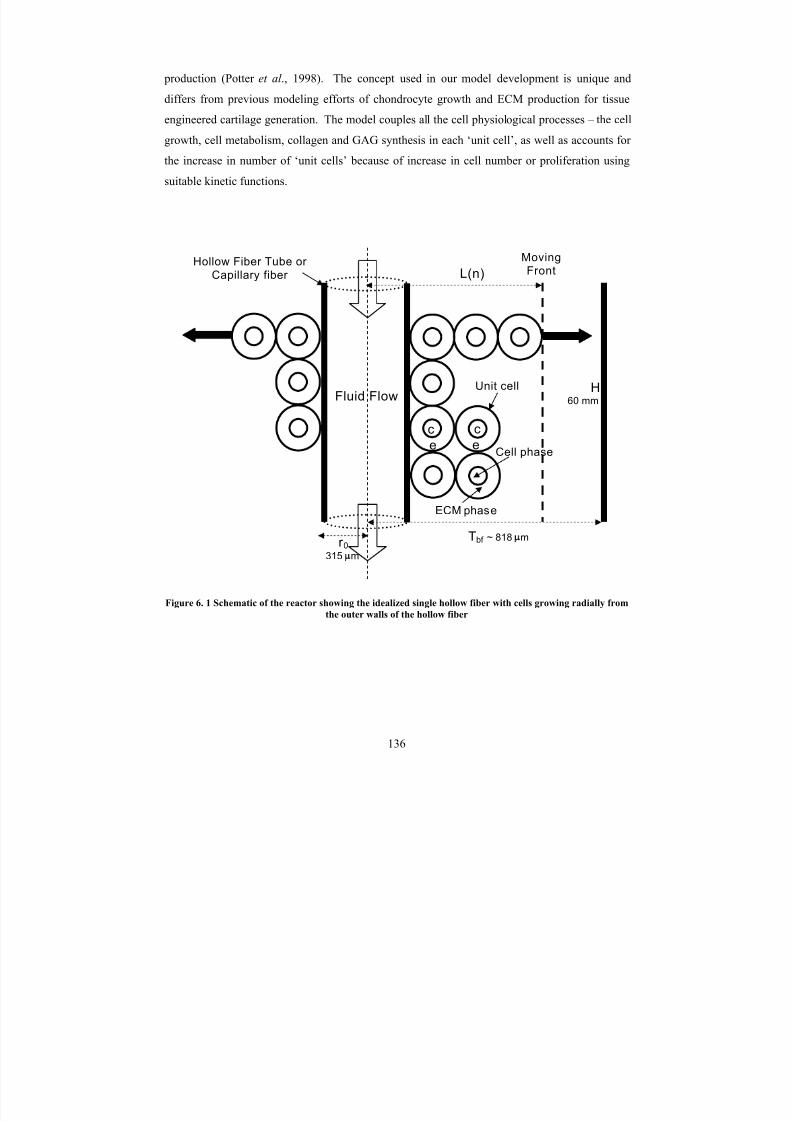
7/27/2019 Mathematical Modeling of Transport and Reaction in Cellular and T
http://slidepdf.com/reader/full/mathematical-modeling-of-transport-and-reaction-in-cellular-and-t 156/270
136
production (Potter et al ., 1998). The concept used in our model development is unique and
differs from previous modeling efforts of chondrocyte growth and ECM production for tissue
engineered cartilage generation. The model couples all the cell physiological processes – the cell
growth, cell metabolism, collagen and GAG synthesis in each ‘unit cell’, as well as accounts for
the increase in number of ‘unit cells’ because of increase in cell number or proliferation using
suitable kinetic functions.
Figure 6. 1 Schematic of the reactor showing the idealized single hollow fiber with cells growing radially fromthe outer walls of the hollow fiber
c
e
c
e
MovingFront
Fluid Flow
Hollow Fiber Tube or
Capillary fiber
Unit cell H60 mm
Tbf ~ 818 µmr 0
315 µm
L(n)
Cell phase
ECM phase
7/27/2019 Mathematical Modeling of Transport and Reaction in Cellular and T
http://slidepdf.com/reader/full/mathematical-modeling-of-transport-and-reaction-in-cellular-and-t 157/270
137
6.2.2.2 Model Equations
For the development of the model one hollow fiber tube is considered (Figure 6.1). It is assumed
that tissue formation around each hollow fiber tube or capillary is identical. Each ‘unit cell’ is
made up of two phases, the cell phase comprising of a single chondrocyte cell and the ECM
phase. The ECM phase is made up of three phases, GAG or proteoglycans, collagen, and the
void (or free) phase. Species continuity equations describing the local spatial and temporal
variations of nutrient (oxygen) concentration are written for both the cell and ECM phases. The
method of volume averaging is used to develop a single species continuity equation for this
multi-phase system (Wood et al ., 2000; Wood et al , 2002; Whitaker, 1999; Galban and Locke,
1999). Assuming that the processes of ECM synthesis and chondrocyte growth (maturation) in
each ‘unit cell’ are identical; this material balance is then averaged in space along the availableextracapillary space for tissue formation. Mass balances for ECM production are written in each
‘unit cell’ and then multiplied with the number of ‘unit cells’ to obtain the total GAG and
collagen mass produced. Similarly cell growth mass balance is also written in each ‘unit cell’.
Balance for increase in number of these ‘unit cells’ is written to account for the process of cell
proliferation.
Nutrient (Oxygen) Balance
Due to its low solubility, oxygen is expected to be one of the first nutrients to become limiting.
Apart from being an essential nutrient, oxygen plays an important role in chondrocyte expansion
and ECM production (Obradovic et al ., 2000; Zhou et al ., 2004, Malda et al ., 2004).
Chondrocytes in hollow fiber reactor cultures need approximately 20% oxygen in the gas phase
to produce ideal growth and GAG and collagen production (Ellis et al ., 2001). The current
model assumes that the other much more soluble nutrients such as glucose are present in excess.
Method of Volume Averaging
The method of volume averaging is used to formulate the material balances for this multiphase
transport-reaction problem (Whitaker, 1967; Ochoa, 1988). In this method a small representative
volume termed the averaging volume (V ) is selected. This corresponds to the ‘unit cell’ in our
model. Figure 6.2 shows a schematic of the averaging volume. It is made up of two distinct

7/27/2019 Mathematical Modeling of Transport and Reaction in Cellular and T
http://slidepdf.com/reader/full/mathematical-modeling-of-transport-and-reaction-in-cellular-and-t 158/270
138
phases - the cell phase, indicated as ‘c’ and the ECM phase indicated as ‘e’. Cell growth is
expressed in terms of the cell volume fraction (ε c), i.e., the volume occupied by cells in the
averaging volume, V c, relative to the total averaging volume V . The sum of the volume fractions
of the cell phase and the ECM phase in the averaging volume is one,
V
V
V
V where e
ec
cec ==+= ε ε ε ε ,1
(6.1)
Figure 6. 2 Schematic of the averaging volume showing the cell phase and details of the extracellular matrix
The ECM phase is made up of three distinct phases – the fiber or GAG phase ( g ), collagen phase
(col ), and the void phase (l ). As mentioned before the sum of the volume fractions of these
phases is also one,
Cell phase, V c
ECM phase, V e
Averaging volume or
unit cell, V
‘col ’ phase
(Collagen)
‘l ’ phase (fluid)
‘ g ’ phase (GAG)
R g
R l
R col
7/27/2019 Mathematical Modeling of Transport and Reaction in Cellular and T
http://slidepdf.com/reader/full/mathematical-modeling-of-transport-and-reaction-in-cellular-and-t 159/270
139
e
l l
e
e
col col
e
e
g g
e
l
e
col
e
g
eV
V and
V
V
V
V where ===++= ε ε ε ε ε ε ,,1
(6.2)
Species continuity balances of oxygen concentration in the particular phases are written and
spatially smoothed to produce a single equation that is valid everywhere in the ‘unit cell’
(Whitaker, 1999).
Cell Phase
This phase comprises of a single chondrocyte cell. The molar species continuity equations for
oxygen in this phase incorporates oxygen diffusive transport, and also consumption of oxygen by
the chondrocyte cell, and is written as,
cccccc V inS k S D
t
S −∇∇=
∂∂
(6.3)
where S c is the local oxygen concentration in the cell phase, Dc is the diffusion coefficient of
oxygen through the cell phase, and k c is the metabolic rate constant for oxygen consumption in
the cell phase. The metabolic oxygen consumption reaction rate kinetic function is assumed to
be first-order and independent of cell growth kinetics. This can be assumed by considering that
the rate of oxygen consumption by metabolic reactions is much higher than the consumption for
cell growth.
ECM Phase
Oxygen in the ECM phase is not consumed by reaction. The molar balance describing the
oxygen concentration variation in space and time by diffusive transport in the GAG, collagen
and void phases are written as,
7/27/2019 Mathematical Modeling of Transport and Reaction in Cellular and T
http://slidepdf.com/reader/full/mathematical-modeling-of-transport-and-reaction-in-cellular-and-t 160/270
140
col l col l
o
col
o
col l l col
g l g l
o
g
o
g l l g
l l l l
Aat S S P S Dn
Collagen
Aat S S P S Dn
GAG
V inS Dt
S
_
_
)(
)(
−=∇⋅−
−=∇⋅−
∇∇=∂
∂
σ
σ
(6.4)
where S g , S col are the point oxygen concentrations on GAG and collagen surfaces, respectively
and S l is the point oxygen concentrations in the void phase; Dl is the diffusion coefficient of
oxygen in the void phase; σ g o, σ col
oare detachment rate of oxygen on the surface of GAG fibers
and collagen; and P g o and P col
oare the binding coefficients of oxygen to GAG and collagen,
respectively.
Equations 6.4 describe the oxygen concentration distribution throughout the various phases
within the ECM of an averaging volume and are applicable at any spatial position in the
appropriate phases. In order to develop a locally averaged equation to describe the concentration
fields in the ECM phase of the ‘unit cell’, these equations are averaged spatially to obtain a
single volume-averaged equations. Approach similar to that presented by Penke et al ., 1998 and
Whitaker and coworkers (Carbonell and Whitaker, 1984; Ryan et al ., 1981; Nozad et al , 1985;
Kim et al ., 1987; Ochoa et al ., 1994) is used. The single averaged species continuity equation is
written as,
ee
e
eff e V inS Dt
S ∇⋅⋅∇=
∂
∂
(6.5)

7/27/2019 Mathematical Modeling of Transport and Reaction in Cellular and T
http://slidepdf.com/reader/full/mathematical-modeling-of-transport-and-reaction-in-cellular-and-t 161/270
141
where S e is the local oxygen concentration averaged over the entire ECM phase and Deff e
is the
effective diffusion coefficient of oxygen in the ECM phase. The effective diffusion coefficient is
given as,
⎥⎦
⎤⎢⎣
⎡
−⋅
⎥⎦
⎤⎢⎣
⎡⎟ ⎠
⎞⎜⎝
⎛ ⋅+⎟⎟ ⎠
⎞⎜⎜⎝
⎛ ⋅+
⋅=
l
e
l
e
col o
col
g o
g
l
e
l
el e
eff
V
A P
V
A P
D D
ε
ε
ε
ε
2
(6.6)
The area to volume ratio for GAG and collagen in equation 6.6 is given as,
V
V
V
V
V
R
V
A
V
R
V
A
col col
g
g
col
col
g
g
==
⋅⋅⋅=⋅⋅⋅=
ε ε
ε π
ε π
,
4,
43
22
322
(6.7)
Single Nutrient Balance
The overall point equations in the cell phase and the ECM phase with appropriate boundary
conditions can be summarized as,
ee
e
eff e V inS Dt
S ∇∇=
∂∂
eccccec
e
eff ec
ceecccce
AS DnS Dn BC
AS KeqS P S Dn BC
∀∇⋅−=∇⋅−
∀−=∇⋅−
:2
:1
cccccc V inS k S Dt
S −∇∇=∂
∂
(6.8)
where P represents the mass transfer coefficient at the cell membranes, i.e. at Aec(ECM-Cell
interface), and Keq is the equilibrium coefficient for oxygen between the ‘c’ and the ‘e’ phases

7/27/2019 Mathematical Modeling of Transport and Reaction in Cellular and T
http://slidepdf.com/reader/full/mathematical-modeling-of-transport-and-reaction-in-cellular-and-t 162/270
142
of the averaging volume. The method of volume averaging is used to obtain a single species
nutrient balance by combining the local nutrient balances in the phases with appropriate
boundary conditions (equation 6.8). The principle of local mass equilibrium is used to obtain a
single averaged species continuity equation for the oxygen concentration (Whitaker, 1999;
Ochoa, 1988; Galban and Locke, 1999). The single averaged species continuity equation is
written as,
{ }{ } { }S k S D
t
S eff eff −∇∇=
∂∂
(6.9)
Equation 6.9 was obtained by assuming the following length scale constraints in the averaging
volume (Ochoa, 1988),
Tbf
R
R
Ror
Tbf
R
R
R ec >>>>maxmax
(6.10)
where Rcmax
and Remax
are the maximum radius across the respective phase (cell and ECM,
respectively) within the averaging volume (V ), R is the radius of the averaging volume, and Tbf
is the available radius in the extracapillary space of the bioreactor for tissue production. One of
the constraints needs to be valid for all changes in cell volume fraction over time. The initial
length scale for the cell phase ( Rc) is nearly 3.34 µm while the initial length scale for the ECM
phase is approximately 0.6 µm. With time in culture more ECM is produced by cells and the
magnitude of Re increases and so does the cell size, corresponding to increase in Rc. The ratio
R/Tbf is a constant with an approximate value of 0.015, where R is 12.03 µm and Tbf is 818 µm.
Although Rc and Re may vary with time the condition in equation 6.8 will typically hold since the
size of the reactor is much larger than the averaging volume. To be noted here while the
individual volumes of the cell (V c) and ECM (V e) phase in the averaging volume (V ) vary with
time, the volume of the averaging volume remains constant and is given as (Whitaker, 1985),

7/27/2019 Mathematical Modeling of Transport and Reaction in Cellular and T
http://slidepdf.com/reader/full/mathematical-modeling-of-transport-and-reaction-in-cellular-and-t 163/270
143
( ) ( )t V t V V ec +=
(6.11)
The effective diffusion coefficient and effective rate constant for oxygen consumptions are
derived as functions of the cell and ECM volume fractions by using the solution of a closure
problem posed over a well-defined ‘unit cell’ (Whitaker, 1999). However, for complex unit cell
geometry numerical solutions are required, and a number of analytical solutions are available for
isotropic media with simple geometry (see Locke, 2001 for review). In the present study an
analytical expression for the effective diffusion coefficient of an isotropic two dimensional two
phase medium defined by a square unit cell (Ochoa, 1988) containing circular particles is used.
This relationship accounts for the diffusion in the non-cellular ‘e’ phase and the cellular ‘c’
phase as well as the mass transport across the two phases. This effective diffusion coefficient is
written as,
( )( )
( ) ( ) ⎥⎥⎦
⎤
⎢⎢⎣
⎡
−+−+
+−−∗
+⋅=
−
−
α ε ε ε
α ε ε ε
ε ε 21
21
212
12
cee
cee
eeqc
e
eff
eff
k
k k
K
D D
(6.12)
where k = (K eq Dc / Deff e ) is the ratio of the diffusion coefficient in the cell phase over that in the
ECM phase (here the non-cellular phase) and α =(Dc /R P) is the ratio of the cell phase diffusion
coefficient over the mass transfer coefficient at the cell-ECM interface in the averaging volume.
The parameter K eq is computed by dividing the solubility of oxygen in lipids to solubility of
oxygen in water (Chow et al ., 2000). From our study of hematopoietic cells with much higher
oxygen consumption rates we have seen that the model results are not highly sensitive to the
functional form of the diffusion coefficient since diffusive restrictions of oxygen in the cellular
region are not very large (Pathi et al ., 2005). For analysis of solutes that have larger restrictions
to diffusion in the cellular phase further consideration of the local 3-dimensional geometry and
solution of the closure problem would be needed. The effective oxygen consumption rate is
found to be,

7/27/2019 Mathematical Modeling of Transport and Reaction in Cellular and T
http://slidepdf.com/reader/full/mathematical-modeling-of-transport-and-reaction-in-cellular-and-t 164/270
144
( )eeqc
cceff
K
k Keqk
ε ε
ε
+⋅⋅⋅
=
(6.13)
Moving Boundary Approach
Experimentally, tissue growth along the long axis of the bioreactor was observed to be largely
uniform (Potter et al ., 2000; Ellis et al ., 2001). Thus, it is reasonable to use a 1-D assumption for
model development. The moving boundary approach as described in Galban and Locke, 1997 is
used to account for the total nutrient concentration and total ECM production over the entire
number of averaging volume units (‘unit cells’). In contrast, if the cells were uniformly seeded
in the space around the hollow fiber volume averaging could be used in that region and need not
be coupled with the moving boundary approach.
L(n) in Figure 6.1 is referred to as the moving front or the boundary and is a function of the
number of averaging volumes or ‘unit cells’, n. It is the radius up to which cells are
proliferating. The magnitude of L(n) can range from r 0, radius of a hollow fiber to Tbf , the
maximum available radius for tissue mass production. For r 0>L(n) the reaction terms
(accounting for oxygen consumption by cells) in the balance in equation 6.9 would be zero since
no cells are assumed present.
An analytical expression of nutrient (oxygen) concentration is obtained by simplifying equation
6.9 with the following assumptions,
a) 1-D geometry
b) quasi-steady state approximation (since the time scale for cell proliferation in the
experiment is of the order of 4 weeks). This would mean,
Deff t
Tbf
*2 1>>
(6.14 a)
7/27/2019 Mathematical Modeling of Transport and Reaction in Cellular and T
http://slidepdf.com/reader/full/mathematical-modeling-of-transport-and-reaction-in-cellular-and-t 165/270
145
c) oxygen concentration can be spatially averaged from 0< r <δ by assuming that the rate of
nutrient consumption is small relative to the rates of diffusion provided,
1
2
<<⋅
Deff
Tbf k eff
(6.14 b)
This assumption for small oxygen gradients is supported by experimental studies of Ellis et al .,
2001 using EPROM (EPR Oxygen Mapping). Although the spatial resolution was small this
study showed that for chondrocyte cultures grown in HFBR for 4 weeks, small oxygen gradients
occur in the cartilage tissue constructs. The constraints shown in equations 14 were found in the
present study to hold for the entire culture time under consideration.
Using assumptions (a) [1-D geometry] and (b) [pseudo-steady state] equation 6.9 reduces to,
{ } { }S k S dx
d D eff eff ⋅=⋅
2
2
(6.15)
The flux of oxygen from the capillary to the tissue region at x = r 0 occurs at both the cell
boundary as well as ECM boundary (Galban and Locke, 1997). The oxygen flux at the moving
front is set to zero. The macroscopic boundary condition is given as,
{ } ( )
{ } )(0
0
n L xS dx
d
r x Keq
S S K S S K S
dx
d D c
ocmeoemeff
=∀=
=∀⎟⎟ ⎠
⎞⎜⎜⎝
⎛ −⋅+−⋅=⋅ ε ε
(6.16)

7/27/2019 Mathematical Modeling of Transport and Reaction in Cellular and T
http://slidepdf.com/reader/full/mathematical-modeling-of-transport-and-reaction-in-cellular-and-t 166/270
146
where K m is the external mass transfer coefficient at the interface between the cell and ECM
phases, S o is nutrient concentration in the hollow fiber. It is assumed that there is no significant
drop in oxygen concentration in the axial and radial directions in the lumen of the hollow fiber or
capillary.
The nutrient balance from equation 6.15 and the boundary conditions from equation 6.16 are
non-dimensionalized to give,
µ φ µ δ
µ ⋅=⋅⎟
⎟ ⎠
⎞⎜⎜⎝
⎛ ⋅= 2
2
2
2
eff
eff
D
Tbf k
d
d
( )
vTbf
n L
d
d D
Tbf KmShu
Tbf
r Sh
d
d
eff
==∀=
⋅===∀−⋅=
)(0
,0
1
δ δ
µ
δ µ
δ
(6.17)
where the non-dimensional oxygen concentration, { } oS S /= , and non-dimensional distance,
Tbf x /=δ . Boundary condition in equation 6.16 is simplified to the above equation by utilizing
the principle of local mass equilibrium and by assuming the local and macroscopic spatial
deviations in nutrient concentrations to be negligible in the cell and ECM phases. Here one
would appreciate the reason for choosing a first order kinetics for oxygen consumption vs. a
Michaelis-Menten as has been extensively reported by Obradovic et al ., 2000 and others. The
first order kinetics helps in obtaining a standard analytical solution as compared to any non-
linear kinetic expressions. However, in the future once experimental data for the variation of
nutrient concentration with time in the HFBR unit is available various kinetic expressions can be
used to determine the effects of other kinetic forms if necessary. A spatially independent
average nutrient concentration equation is obtained by deriving the analytical solution for the
boundary-value problem in equation 6.17 and then averaging over r 0 and L(n). The average
nutrient concentration is given as,
7/27/2019 Mathematical Modeling of Transport and Reaction in Cellular and T
http://slidepdf.com/reader/full/mathematical-modeling-of-transport-and-reaction-in-cellular-and-t 167/270
147
[ ]( ) ( ){ } ( ) ( ) ( ){ }[ ]
( ) ( ) ( )
( ) ( ) ( )uSinhvuCoshCTC
uCoshvuSinhSTC
STC CTC Sh
Sh A
uCoshvCoshvuSinhvSinhuv
A
⋅⋅−⋅=
⋅⋅−⋅=
⋅−⋅
=
⋅−⋅⋅⋅−⋅−⋅−⋅
=
φ φ φ
φ φ φ
φ
φ φ φ φ φ φ
µ
.tanh
.tanh
tanh
(6.18)
It must be noted here that φ 2
is not a constant with time since the effective rate coefficient for
oxygen consumption, k eff and effective rate of constant for oxygen diffusion through the cartilage
tissue, Deff , vary in time due to changes in the volume fractions of cells and ECM.
Cell mass balance
With tissue formation over time there is an increase in total cell mass due to the processes of cell
proliferation and cell growth in the hollow fiber reactor. Experimentally it was observed around
3 weeks of culture that the cell number remained constant, however the average cell area
(accounting for cell growth in a ‘unit cell’) increased significantly. Because these two processes
occur at two different time frames and under different surrounding environmental conditions,
they need to be accounted for by writing two distinct balances.
The increase in cell number is the process of cell proliferation and the total cell mass balance
accounting for this process is given as,
∫ ∫==
)( )(
)(
t V t V pcT c T c
dV RdV dt
d
dt
t dM ρ
(6.19)
where M(t) is the total cell mass surrounding a hollow fiber in the reactor , ρ c is the specific cell
density, V cT the total volume occupied by the cells around a single fiber and R p is the specific
7/27/2019 Mathematical Modeling of Transport and Reaction in Cellular and T
http://slidepdf.com/reader/full/mathematical-modeling-of-transport-and-reaction-in-cellular-and-t 168/270
148
total cell mass production rate. The total volume occupied by cells is a product of the volume of
each chondrocyte cell, V c and the number of ‘unit cells’ or averaging volumes, nc (V cT
= V c*nc ).
The above equation is based on the assumptions that the diffusivity and migration of cells are
negligible, and that the specific cell density in the cell phase is uniform. Further expanding
equation 6.19, dividing by the averaging volume V and rearranging we obtain,
( ) ( )
( )
( )
⎥⎥⎦
⎤
⎢⎢⎣
⎡−⋅⎟⎟
⎠
⎞⎜⎜⎝
⎛ =
⋅⋅⋅⎟⎟ ⎠
⎞⎜⎜⎝
⎛ =+
⋅⋅⋅⎟⎟ ⎠
⎞⎜⎜⎝
⎛ =+
⋅=⋅
dt
d Rn
dt
dn
arranging
n Rdt
dn
dt
d n
V by Dividing
V n Rdt
dnV
dt
dV n
Expanding
V n RV ndt
d
c
c
c
p
c
cc
cc p
c
c
c
c
c
cc p
c
cc
cc
cc pccc
ε ε
ρ ε
ε ρ
ε ε
ρ
ρ
,Re
1
,
1
,
(6.20)
where dnc /dt accounts for increase in cell number (or the number of averaging volumes) while
d ε c /dt signifies increase in cell area (cell growth) in each averaging volume or ‘unit cell’.
A modified Contois function (Galban and Locke, 1999) is used to describe overall increase in
cell mass due to growth and proliferation and is given as,
{ }
{ } c pd
cmf
p
p k S n K
S k R ρ ⋅
⎥⎥⎦
⎤
⎢⎢⎣
⎡−
+⋅
⋅=
(6.21)

7/27/2019 Mathematical Modeling of Transport and Reaction in Cellular and T
http://slidepdf.com/reader/full/mathematical-modeling-of-transport-and-reaction-in-cellular-and-t 169/270
149
where k p, K mf and k pd are the cell mass formation, cell saturation and cell death parameters. The
overall cell proliferation balance is obtained by substituting equation 6.21 into 6.20 and non-
dimensionalizing with respect to the maximum number of averaging volumes that can fill the
available volume in the reactor (nmax) and the nutrient concentration (S o).
⎥⎥⎦
⎤
⎢⎢⎣
⎡−⋅⎟
⎟ ⎠
⎞⎜⎜⎝
⎛ −
+⋅
⋅=
dt
d k
n K
k n
dt
dn c
c pd
p
p
c
ε ε
µ
µ
ε
(6.22)
where non-dimensional number of cells is give as,maxn
nn c= and
( )o
p S n Kmf
K max⋅= .
Cell growth balance
Cell growth (denoted by a change in cell volume fraction, εc) is obtained by writing a cell mass
balance of a single chondrocyte cell in the averaging volume or ‘unit cell’. The conservation of
cell mass is given by,
∫ ∫==)( )(
)(
t V t V cc
c c
dV RdV dt
d
dt
t dm ρ
(6.23)
where m(t) is the cell mass in a ‘unit cell’ or averaging volume , ρ c is the specific cell density, V c
the averaging volume containing the cells and Rc is the specific cell growth rate. The above
equation is based on the assumptions that the cell phase is made up of only chondrocyte cells, the
diffusivity and migration of cell2
in the cell phase are negligible, and the specific cell density in
the cell phase is uniform. This balance signifies the stage of cell maturation, where increase in
chondrocyte cell size takes place in each ‘unit cell’ or averaging volume, filling up the available
extracapillary space.
2 Mass transport of cells (by diffusion) is not included in the model, however it can be noted that future work may
consider the effects of cell migration by diffusion or chemotaxis.

7/27/2019 Mathematical Modeling of Transport and Reaction in Cellular and T
http://slidepdf.com/reader/full/mathematical-modeling-of-transport-and-reaction-in-cellular-and-t 170/270
150
The integral in the above equation is evaluated over the cell volume V c within the averaging
volume V to give
∫=
cV c
c
c dV R
V dt
d
ρ
ε 1
(6.24)
A Michaelis-Menten dependence of cell growth on nutrient (oxygen) concentration is proposed.
Potter et al ., 1998 observed distinct cell growth only after cells stopped proliferating due to
contact inhibition. Thus a marked decrease in cell proliferation favors cell maturation. To
represent the experimental observations several kinetic functions were tested (see Results
section) for the dependence of the cell growth rate on the number of cells; the second order
dependence was found to fit best to the data. Therefore, the effects of nutrient concentration and
number of cells (similar to number of averaging volumes or ‘unit cells’) on the growth of a
single chondrocyte cell in a ‘unit cell’ is given as,
{ }
( ) { } ⎥⎥⎦
⎤
⎢⎢⎣
⎡−⋅⎟⎟
⎠
⎞⎜⎜⎝
⎛
+⋅
⋅⋅⎟⎟
⎠
⎞⎜⎜⎝
⎛ = cd
growth
c k nS Kc
S k
n R 2
2
max
1
ρ
(6.25)
where k growth is the homogeneous growth rate coefficient, Kc is the modified Contois saturation
constant, ρ is the overall cell density ( ρ c*ε c), k cd cell death parameter; and n is the fractional
number of cells [= number of cells at a particular time (nc) / maximum number of cells that can
fit in the available volume (nmax) ]. A modified Contois (Galban and Locke, 1999) is used to
include effects of cell crowding and restricted volume of cell mass formation.
Substituting equation 6.25 in 6.24 and non-dimensionalizing with the nutrient concentration (S o),
the material balance for cell growth can be rewritten as,
7/27/2019 Mathematical Modeling of Transport and Reaction in Cellular and T
http://slidepdf.com/reader/full/mathematical-modeling-of-transport-and-reaction-in-cellular-and-t 171/270
151
ccd
ccont
g c k K
nk
dt
d ε
µ ε
µ ε ⋅
⎥⎥⎦
⎤
⎢⎢⎣
⎡−
+⋅
⋅⋅=
2
(6.26)
where the overall growth coefficient, 2
maxnk k growth g ⋅= and overall Contois parameter
o
cccont S
K K
ρ ⋅= .
Extracellular Matrix (ECM) balance
The material balance on the extracellular matrix, assuming negligible diffusion of ECM is given
in terms of the local volume fraction of extracellular matrix, εe, as
( )ec ECM
e Rdt
d ε ε µ
ε ,,=
(6.27)
where R ECM denotes the rate function for extracellular matrix production. As mentioned before
the cartilage ECM is primarily made up of GAG and collagen components. Specific balances for
these components are written to quantify the amount of each ECM components present.
GAG and collagen molecules, when densely packed around a cell provide a mechanically
competent native tissue-like housing, capable of changing pericellular osmolarity, permeability,
and pH. These local physicochemical changes, which gradually occur with matrix molecule
accumulation, may control cell metabolism by interfering with nutrient uptake and waste
withdrawal, adjusting cell volume, or changing the ion channel activity (Wilkins et al ., 2000).
Therefore, this model would help to understand the various factors controlling formation of these
different ECM components. However, our current model does not account for the effects of
osmolarity and pH change on cell growth, metabolism or ECM production and analysis of these
factors is proposed as future work.

7/27/2019 Mathematical Modeling of Transport and Reaction in Cellular and T
http://slidepdf.com/reader/full/mathematical-modeling-of-transport-and-reaction-in-cellular-and-t 172/270
152
GAG -
The conservation of GAG mass is given by,
∫ ∫== )( )(
)(
t V t A g g
g
g g dA RdV dt
d
dt
t dm
ρ
(6.28)
where m g (t) is the total GAG mass in a unit averaging volume , ρ g is the specific GAG density, V g
the total volume of GAG produced by a single chondrocyte cell in an averaging volume and R g is
the specific GAG production rate per unit area. The above equation is based on the assumptions
that the diffusivity of GAG is negligible and that the specific GAG density in the ECM phase is
uniform.
Obradovic et al ., 2000 have shown in engineered tissue constructs, GAG deposition begins at the
construct periphery, where a high cell density promotes rapid GAG synthesis than catabolism.
However, over the time of cultivation, a limiting steady state concentration ‘εGAGmax
’ is
approached at which there is a balance of production, degradation, and incorporation of GAG.
Accordingly, they formulated a local GAG kinetics using product-inhibition kinetics, with
‘εGAG
max
’ the maximum GAG concentration (εGAG at final time of experiment). The dependenceupon oxygen concentration was modeled as first-order dependence. A similar kinetic form with
respect to GAG and oxygen is used in our model as it best fits the experimental data as compared
to the use of a Michaelis-Menten nutrient dependence and first order GAG dependences. Thus,
the rate of GAG synthesis is formulated as,
{ }S k RGAG
g
G g ⋅⎥⎦
⎤⎢⎣
⎡−⋅=
max1
ε
ε
(6.29)
where k G, and ε GAGmax
are the GAG production rate and maximum GAG volume fraction
respectively. Non-dimensionalizing the nutrient concentration and substituting the specific GAG
production rate in equation 6.28 the overall GAG balance is written as,

7/27/2019 Mathematical Modeling of Transport and Reaction in Cellular and T
http://slidepdf.com/reader/full/mathematical-modeling-of-transport-and-reaction-in-cellular-and-t 173/270
153
31
32
32
max
43,/1 ⎥⎦
⎤⎢⎣
⎡⋅==∗⎪⎭
⎪⎬⎫
⎪⎩
⎪⎨⎧
⋅⎥⎦
⎤⎢⎣
⎡−⋅∗=
V qV V wherek q
dt
d
g
GAG g g c
GAG
g
GAGGAG
g π
ρ ε ε µ
ε
ε ε
(6.30)
where overall GAG production coefficient, oGGAG S k k ⋅= .
Collagen –
The mass balance on collagen is given by,
∫ ∫== )( )(
)(
t Vcol t Acol col col col dA RdV
dt
d
dt
t dm ρ
(6.31)
where mcol (t) is the total collagen mass in a unit averaging volume , ρ col is the specific collagen
density, V col the total volume of collagen produced by a single chondrocyte cell in an averaging
volume and Rcol is the specific collagen production rate per unit area. The above equation is
similarly based on the assumptions that the diffusivity of collagen is negligible and that the
specific collagen density in the ECM phase is uniform.
The specific collagen formation rate is modeled with Michaelis-Menten dependence on oxygen
concentration and is given as,
µ +⋅
=col
emcol
K
k R
(6.32)
where k em and K col are the Michaelis-Menten parameters. The overall collagen balance is written
as,

7/27/2019 Mathematical Modeling of Transport and Reaction in Cellular and T
http://slidepdf.com/reader/full/mathematical-modeling-of-transport-and-reaction-in-cellular-and-t 174/270
154
31
32
32 43
, ⎥⎦⎤
⎢⎣⎡⋅==∗
⎭⎬⎫
⎩⎨⎧
+⋅
∗=V
qV
V where
K
k q
dt
d
col
col col
col c
ec
emcol
col π
ρ ε ε
µ
µ ε
(6.33)
where overall ECM saturation coefficient is given by,o
col ec S
K K = .
NMR measurable parameters
Effective water diffusion coefficient (Deff w ) and T1 relaxation time
The proton magnetization M l , M g , M col , M c within the bulk water volume, on the surface of the
GAG fibers, on the surface of the collagen fibers, and within the cells, respectively, are describedusing Bloch equations (Penke et al ., 1997). Equations describing the proton magnetization in the
void, collagen and the GAG phases, components in the ECM are written as,
g l g l
w
g g l l g
g l g l
w
g g
g
g g
g g
g
col l col l
w
col col l l col
col l col l
w
col col
col
col col col col
col
l
l
l l l l
l
Aat M M P M Dn
Aat M M P T
M M M D
t
M
Aat M M P M Dn
Aat M M P
T
M M M D
t
M
V inT
M M M D
t
M
_
_
_
_
)(
)(1
0
)(
)(
1
0
1
0
−=∇⋅−
−+−
−∇∇=∂
∂
−=∇⋅−
−+−
−∇∇=∂
∂
−−∇∇=
∂∂
∞
∞
∞
σ
σ
σ
σ
(6.34)
where T1l -1
(= k1l ), T1col -1
(= k1col ), T1 g -1
(= k1 g ) are the bulk and surface (collagen and GAG)
relaxation times; σ g , σ col are detachment rate per proton of protons on the surface of GAG fibers
and collagen; M0l ∞
, M0 g ∞ , M0col
∞ are the equilibrium magnetization values of the protons in the
bulk water and on the surface of the GAG fiber and collagen; P g w and P col
ware the binding
coefficient of water to GAG and collagen respectively.
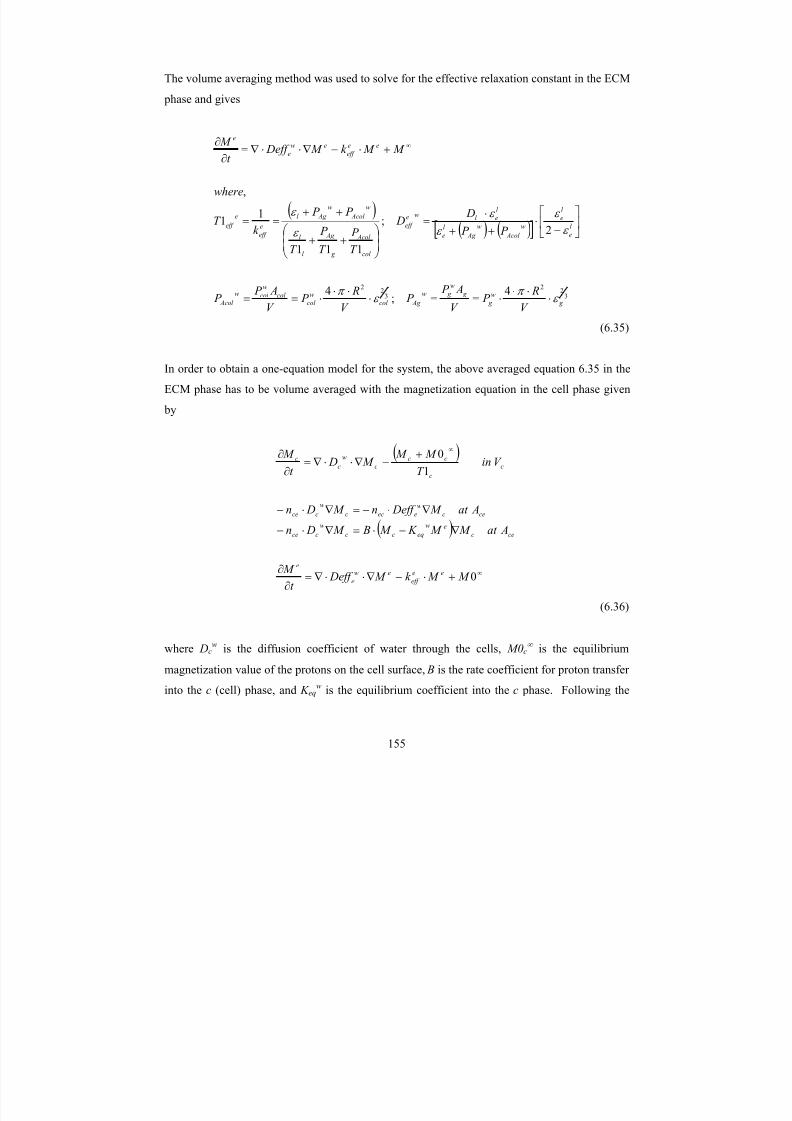
7/27/2019 Mathematical Modeling of Transport and Reaction in Cellular and T
http://slidepdf.com/reader/full/mathematical-modeling-of-transport-and-reaction-in-cellular-and-t 175/270
155
The volume averaging method was used to solve for the effective relaxation constant in the ECM
phase and gives
( )( ) ( )[ ]
32
2
32
2 4
;
4
2;
111
11
,
g
w
g
g
w
g w
Ag col
w
col
col
w
col w
Acol
l
e
l
e
w
Acol
w
Ag
l
e
l
el we
eff
col
Acol
g
Ag
l
l
w
Acol
w
Ag l
e
eff
e
eff
ee
eff
ew
e
e
V
R
P V
A P
P V
R
P V
A P
P
P P
D D
T
P
T
P
T
P P
k T
where
M M k M Deff t
M
ε
π
ε
π
ε
ε
ε
ε
ε
ε
⋅
⋅⋅
⋅==⋅
⋅⋅
⋅==
⎥⎦
⎤⎢⎣
⎡
−⋅
++
⋅=
⎟⎟ ⎠
⎞⎜⎜⎝
⎛ ++
++==
+⋅−∇⋅⋅∇=∂∂ ∞
(6.35)
In order to obtain a one-equation model for the system, the above averaged equation 6.35 in the
ECM phase has to be volume averaged with the magnetization equation in the cell phase given
by
( )
( )
∞
∞
+⋅−∇⋅⋅∇=∂
∂
∇−⋅=∇⋅−
∇⋅−=∇⋅−
+−∇⋅⋅∇=∂
∂
0
10
M M k M Deff t
M
Aat M M K M B M Dn
Aat M Deff n M Dn
V inT
M M M Dt
M
ee
eff
ew
e
e
cec
ew
eqcc
w
cce
cec
w
eecc
w
cce
c
c
ccc
w
cc
(6.36)
where Dcw is the diffusion coefficient of water through the cells, M0c
∞ is the equilibrium
magnetization value of the protons on the cell surface, B is the rate coefficient for proton transfer
into the c (cell) phase, and K eqw
is the equilibrium coefficient into the c phase. Following the

7/27/2019 Mathematical Modeling of Transport and Reaction in Cellular and T
http://slidepdf.com/reader/full/mathematical-modeling-of-transport-and-reaction-in-cellular-and-t 176/270
156
similar averaging methodology the governing one-equation model for diffusion and relaxation
constant in the reactor is,
{ }
{ } { }( )
( )
( )
( )
( ) ( ) ⎥⎥⎦
⎤
⎢⎢⎣
⎡
−+−+
+−−∗
+⋅=
⎥⎥⎥⎥⎥
⎦
⎤
⎢⎢⎢⎢⎢
⎣
⎡
⋅⋅+⋅
⎟⎟⎟⎟⎟
⎠
⎞
⎜⎜⎜⎜⎜
⎝
⎛
++
++
+==
−⋅−∇⋅⋅∇=∂
∂
−
−
∞
wcee
w
w
cee
ww
eweqc
we
eff w
eff
c
c
w
e
Acol Ag l
col
Acol
g
Ag
l
l
e
w
ceff
T
eff
eff
T
eff
w
k
k k
K
D D
T Keq
P P
T
P
T
P
T
KeqT k
where
M M k M Deff t
M
α ε ε ε
α ε ε ε
ε ε
ε ε ε
ε
ε ε
21
21
212
12
)1
1(
1111
1
1
,
0
(6.37)
where k w
= (K eqw
Dcw
/ Deff ew ) is the ratio of the diffusion coefficient of water in the cell phase
over that in the ECM phase (here the non-cellular phase) and α w
=(Dcw /R P w ) is the ratio of the
cell phase water diffusion coefficient over the mass transfer coefficient at the cell-liquid inter-
phase in the averaging volume. P w represents the mass transfer coefficient at the cell
membranes, i.e. at Aec, and Keqw
is the equilibrium coefficient for water between the ‘c’ and the‘e’ phases of the averaging volume.
6.2.3 Note on Parameters
Reactor dimensions are taken from Peterson et al ., 1997. Data on diffusion coefficients of
oxygen and water in the cell phase and the respective self-diffusion coefficients are obtained
from the literature (Chow et al ., 2001; Horner et al ., 1998). The specific oxygen consumption
rate for cell metabolism is obtained from Obradovic et al ., 2000. The first order rate constant
(k c) is computed by calculating the ratio of Qmax /Km, the Michaelis-Menten parameters in the
proposed Michaelis-Menten oxygen consumption rate in their model. Specific GAG and
collagen densities are obtained from Baser et al ., 1998.

7/27/2019 Mathematical Modeling of Transport and Reaction in Cellular and T
http://slidepdf.com/reader/full/mathematical-modeling-of-transport-and-reaction-in-cellular-and-t 177/270

7/27/2019 Mathematical Modeling of Transport and Reaction in Cellular and T
http://slidepdf.com/reader/full/mathematical-modeling-of-transport-and-reaction-in-cellular-and-t 178/270
158
processes. The rate parameters of these cell processes along with the oxygen and water binding
coefficient to ECM are varied to fit the model to experimental data (Potter et al ., 1998).
The equations describing cell growth [equation 6.26], cell proliferation [equation 6.22], and
ECM (GAG [equation 6.30] and collagen [equation 6.33] production as functions of time are
solved simultaneously using MATLAB (version 6.5, The Mathworks, Inc.). The model results
are used in equations 6.18 and 6.12 to compute the nutrient concentration and effective diffusion
coefficient variation of oxygen with time, due to changes in tissue mass, respectively. Similarly,
the volume fractions of cell and ECM components are substituted in equation 6.37 to obtain the
effective T1 relaxation time constant and effective diffusion coefficient of water in the tissue.
6.3 Results and Discussion
The current model simulates the changes in cell mass, ECM mass, oxygen concentration,
effective diffusion coefficient of oxygen, water diffusion coefficient and NMR relaxation
coefficient as functions of time. Physiological kinetic functions describing cartilage tissue
developmental processes are used. The effect of the microenvironment on the intrinsic tissue
development characteristics in the 3-dimensional hollow fiber bioreactor system is studied. The
model is used to determine the NMR measurable parameters to further establish their correlation
with the chemical characteristics of the tissue.
The growth of a single chondrocyte cell inside an averaging volume with time is shown in Figure
6.3. Cell growth (maturation) is expressed in terms of volume fraction of cell and accounts for
an increase in the average area of a chondrocyte cell in a ‘unit cell’ or averaging volume during
the culture time. Since all ‘unit cells’ are identical this cell growth is representative of growth in
all averaging volumes. The solid line represents the simulated results from the model whereas
the solid dots denote the experimental data from Potter et al ., 1998 (Appendix D). Growth of
cells is seen to be slow during early period in time, corresponding to the initial lag phase of cell
growth. However, after week 3, the growth is exponential. The results shown here are for
kinetic growth rate function with Michaelis-Menten nutrient dependence, second order cell

7/27/2019 Mathematical Modeling of Transport and Reaction in Cellular and T
http://slidepdf.com/reader/full/mathematical-modeling-of-transport-and-reaction-in-cellular-and-t 179/270
159
number dependence and first order cell volume fraction dependence, which gives the best fit to
the experimental data among the various functions used. This kinetic function used in the model
could not completely account for the higher cell growth during the later times in culture (Figure
3). Several other growth rate functions such as Contois, Modified Contois, Moser and
heterogeneous functions (Galban and Locke, 1999a) were tested (results shown in Figure 6.13).
However, these other functional forms did not fit the data as well. Probably there is a need to
incorporate the effect of other environmental factors in future modeling efforts like lactate and
glucose in order to better explain the growth pattern of chondrocytes as observed in the
experiments. Moreover, in order to provide quantitative information of cell growth behavior
there is need for further systematic experimental data on oxygen concentration for example, for
the same reference system.
Cells synthesize ECM, which in our model system includes collagen and GAG, throughout the
culture time. Figure 6.4 shows increase in collagen mass. The collagen mass is obtained by
multiplying the volume fraction of collagen (ε col ) in a ‘unit cell’ with the total of the sum of all
the volume of the averaging volume (V ) and the density of the collagen fibers
( ( ) col col nnV MassCollagen ρ ε ⋅⋅⋅⋅= max ). Model simulations are is good accordance with the
experimental results. Similarly, simulated GAG mass in the reactor is shown as a solid line as
function of time in Figure 6.5. The GAG mass is also obtained by multiplying the simulated
volume fraction of GAG in a ‘unit cell’ with the total volume of averaging volumes and density
of GAG ( ( ) g g nnV MassGAG ρ ε ⋅⋅⋅⋅= max ). The GAG content increases during the early
weeks in culture. However, once the maximum GAG concentration is reached at almost 2 weeks
in culture a saturation level is reached. The model trend fits the experimental data very well.

7/27/2019 Mathematical Modeling of Transport and Reaction in Cellular and T
http://slidepdf.com/reader/full/mathematical-modeling-of-transport-and-reaction-in-cellular-and-t 180/270
160
0.02
0.022
0.024
0.026
0.028
0.03
0.032
0.034
0.036
0 0.5 1 1.5 2 2.5 3 3.5 4 4.5
Time (wks)
C e l l V o l u m e F r a c t i o n
Figure 6. 3 Model-data comparison for the growth of cells (εc=Vc/V) with time (Experimental error bars
obtained using error percentage of 5%)
0
0.001
0.002
0.003
0.004
0.005
0.006
0 0.5 1 1.5 2 2.5 3 3.5 4 4.5
Time (wks)
C o l l a g e n M a s s ( g )
Figure 6. 4 Model-data comparison for total Collagen mass (g) in the reactor with time (Experimental error
bars obtained using error percentage of 5%)
Model
Expt.
Model
Expt.

7/27/2019 Mathematical Modeling of Transport and Reaction in Cellular and T
http://slidepdf.com/reader/full/mathematical-modeling-of-transport-and-reaction-in-cellular-and-t 181/270
161
0
0.005
0.01
0.015
0.02
0.025
0 0.5 1 1.5 2 2.5 3 3.5 4 4.5
Time (wks)
G A G
M a s s
Figure 6. 5 Model-data comparison for total GAG mass (g) in the reactor variation with time (Experimental
error bars obtained using error percentage of 5%)
2.00E+07
3.00E+07
4.00E+07
5.00E+07
6.00E+07
7.00E+07
8.00E+07
9.00E+07
1.00E+08
1.10E+08
0 0.5 1 1.5 2 2.5 3 3.5 4 4.5
Time (wks)
C e l l N o .
Figure 6. 6 Model-data comparison for total number of cells in the reactor (around all 6 fibers), [nc] with time
(Experimental error bars obtained using error percentage of 5%)
Model
Expt.
Model
Expt.

7/27/2019 Mathematical Modeling of Transport and Reaction in Cellular and T
http://slidepdf.com/reader/full/mathematical-modeling-of-transport-and-reaction-in-cellular-and-t 182/270
162
0.88
0.9
0.92
0.94
0.96
0.98
1
0 0.5 1 1.5 2 2.5 3 3.5 4 4.5
Time (wks)
N o n - D i m e n s i o n a l N u t r i e n t C o n c e n t r a t i o n
Figure 6. 7 Non-dimensional nutrient concentration (µ) variation with time
Figure 6.6 denotes changes in cell number (or ‘unit cells’), i.e. cell proliferation during the
culture time of 4 weeks. An increase in cell number occurs during the first 3 weeks of culture
and then levels off with time. The model predicts saturation, i.e. no further increase in cellnumber, at later times in the culture, and this is primarily due to contact inhibition as reflected in
the Contois form of the kinetic rate function. The model results seem to fit the experimental data
very well. The experimental results of Potter et al ., 1998 have suggested that during cartilage
tissue culture cell proliferation occurs during the early time period. Once the cells stop
proliferating, cells start maturing by growing in size, corresponding to cell growth in our model.
This developed mathematical model is able to explain the experimental data in this context very
well.
Figure 6.7 shows the averaged non-dimensional nutrient concentration during the culture time.
Due to the small hollow fiber or capillary diameter and high nutrient flow rate the variations in
oxygen concentration in both the axial and radial directions inside the hollow fiber tube lumen
are assumed to be negligible. The constant supply of oxygen at the surface of the hollow fiber or

7/27/2019 Mathematical Modeling of Transport and Reaction in Cellular and T
http://slidepdf.com/reader/full/mathematical-modeling-of-transport-and-reaction-in-cellular-and-t 183/270
163
capillary provides more oxygen for cell metabolism, even accounting for the presence of very
high cell numbers. Hence, the drop of oxygen concentration is only to a non-dimensional value
of nearly 0.885 (corresponding to a drop of nearly 12% of the feed concentration S o in the hollow
fiber tube). The simulated oxygen concentration results cannot be compared to experimental
results because the rate of oxygen depletion over time in these types of reactors has not been
reported in the literature, and it is recommended that such data need to be taken in future
experiments.
An increase in cell mass (due to proliferation and cell growth) and ECM mass production over
time increases the restrictions to diffusive transport of oxygen and water. Figure 6.8 (a) and 6.8
(b) show the decrease in effective diffusion coefficient of oxygen and water, respectively, in the
reactor with time. The lower effective diffusion coefficient of oxygen due to larger restrictions
and binding in the tissue construct, in turn, reduces the supply of oxygen for consumption by the
cells for various physiological processes such as metabolism, growth, proliferation, and ECM
synthesis. Figure 9 shows the simulated and experimental apparent diffusion coefficient of water
as a function of time. The apparent diffusion coefficient is computed by normalizing the
effective diffusion coefficient of water by dividing it by the self-diffusion coefficient of water.
This is a measure of restricted transport of water due to increase in cell and ECM mass and is
experimentally measured by NMR. Model results show a steady drop of this coefficient over
the entire culture time of 4 weeks. However, experimental results (solid dots) show that the
normalized diffusion coefficient does not drop until the 3rd
week of the culture, after which it
drops from a value of 0.8 to 0.43. Clearly the model is not able to capture that aspect of the
experimental data.
One possible reason for the discrepancy between experimental and modeling results of the
apparent diffusion coefficient of water is likely due to the NMR experimental diffusion
measurement technique. Small NMR diffusion time (∆ ) 10 ms considered in the experiments
corresponds to a water diffusion distance of nearly 4.7 µm. However, the roughly estimated
average void phase radii at time = 1 wk and time = 4wk are 11.92 µm and 11.79 µm, respectively
(Appendix F). These length scales were calculated based upon the free volume in the cellular
domain (radius L(n)) and assuming that the ECM components are clumped around the cells.

7/27/2019 Mathematical Modeling of Transport and Reaction in Cellular and T
http://slidepdf.com/reader/full/mathematical-modeling-of-transport-and-reaction-in-cellular-and-t 184/270
164
Since the length scale at the early times is higher than the NMR diffusion distance, probably the
NMR measurement does not capture the restrictions due to spatial constraints and adsorption.
The assumption that most of the ECM is clumped around the cell may be more appropriate at
these earlier times when there is less ECM and more free void space around the cell/ECM
complex. However, as the cells grow and produce ECM over time the fibrous nature of the
matrix may be more pronounced and lead to more restrictions than are reflected in the computed
length scale above. Therefore, the model can explain the data at four weeks and not at the earlier
times.
It should also be stated that the decrease in diffusion coefficient shown in Figure 6.9 is
dominated primarily by the binding of water to collagen and GAG fibers and not due to
restrictions because of cell and ECM mass formation over time (model results shown in dotted
line). This is further reflected by increase in magnetization transfer coefficient with time in the
experimental results described by Potter et al ., 1998 as this denotes higher binding of water to
the ECM components.
The effect of restricted transport because of tissue development can also be seen in Figure 6.10.
The figure shows the variation of effective longitudinal relaxation coefficient (T1eff ) with time.
The relaxation constant decreases gradually between weeks 1 and 4, consistent with increases in
collagen and GAG molecules, corresponding to not only increase in tissue mass but also larger
binding of water to these ECM components. There appears to be a slightly larger drop between
weeks 3 and 4 than in the earlier weeks, in partial agreement with the diffusion coefficient data.
The significance of this drop is not known and more detailed analysis of the experimental error
and the water binding process may help in further understanding the reason for the model-data
comparison.
Figure 6.11 validates the basic model assumptions for derivation of analytical solution for
nutrient (oxygen) concentration in the reactor. Figure 6.11 (a) shows the quasi-steady state
assumption holds for the culture time of 4 weeks. Also, Figure 6.11 (b) shows that nutrient
concentration can be spatially averaged in the reactor by assuming the nutrient consumption rate
to be small compared to the rate of diffusion, again for the time of culture of 4 weeks. However,
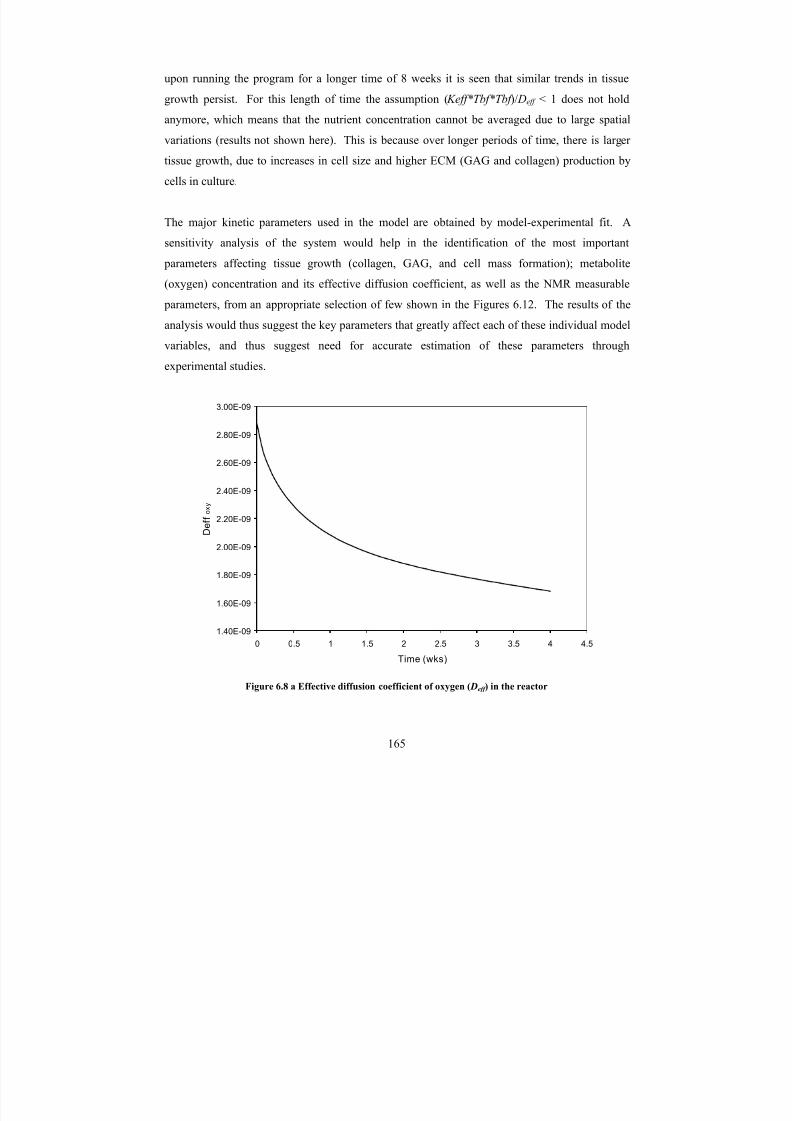
7/27/2019 Mathematical Modeling of Transport and Reaction in Cellular and T
http://slidepdf.com/reader/full/mathematical-modeling-of-transport-and-reaction-in-cellular-and-t 185/270
165
upon running the program for a longer time of 8 weeks it is seen that similar trends in tissue
growth persist. For this length of time the assumption ( Keff*Tbf*Tbf )/ Deff < 1 does not hold
anymore, which means that the nutrient concentration cannot be averaged due to large spatial
variations (results not shown here). This is because over longer periods of time, there is larger
tissue growth, due to increases in cell size and higher ECM (GAG and collagen) production by
cells in culture.
The major kinetic parameters used in the model are obtained by model-experimental fit. A
sensitivity analysis of the system would help in the identification of the most important
parameters affecting tissue growth (collagen, GAG, and cell mass formation); metabolite
(oxygen) concentration and its effective diffusion coefficient, as well as the NMR measurable
parameters, from an appropriate selection of few shown in the Figures 6.12. The results of the
analysis would thus suggest the key parameters that greatly affect each of these individual model
variables, and thus suggest need for accurate estimation of these parameters through
experimental studies.
1.40E-09
1.60E-09
1.80E-09
2.00E-09
2.20E-09
2.40E-09
2.60E-09
2.80E-09
3.00E-09
0 0.5 1 1.5 2 2.5 3 3.5 4 4.5
Time (wks)
D e f f o x y
Figure 6.8 a Effective diffusion coefficient of oxygen ( Deff ) in the reactor
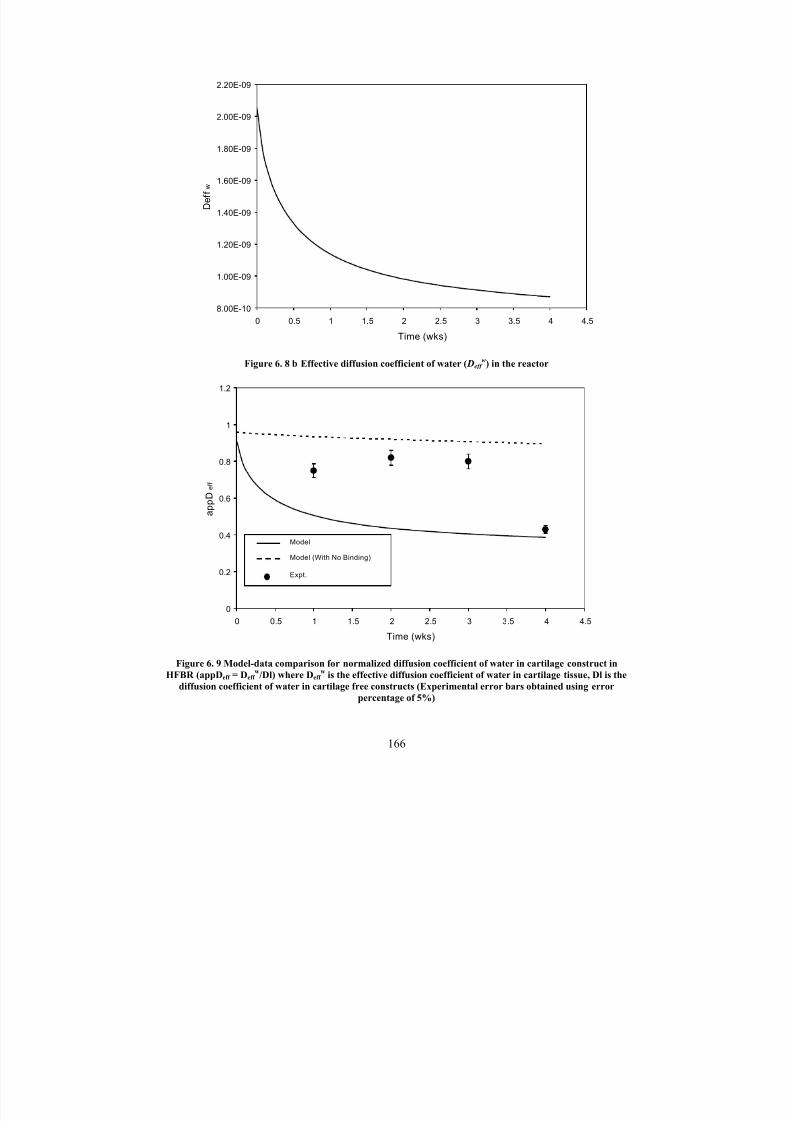
7/27/2019 Mathematical Modeling of Transport and Reaction in Cellular and T
http://slidepdf.com/reader/full/mathematical-modeling-of-transport-and-reaction-in-cellular-and-t 186/270
166
8.00E-10
1.00E-09
1.20E-09
1.40E-09
1.60E-09
1.80E-09
2.00E-09
2.20E-09
0 0.5 1 1.5 2 2.5 3 3.5 4 4.5
Time (wks)
D e f f w
Figure 6. 8 b Effective diffusion coefficient of water ( Deff w) in the reactor
0
0.2
0.4
0.6
0.8
1
1.2
0 0.5 1 1.5 2 2.5 3 3.5 4 4.5
Time (wks)
a p p D
e f f
Model
Model (With No Binding)
Expt.
Figure 6. 9 Model-data comparison for normalized diffusion coefficient of water in cartilage construct in
HFBR (appDeff = Deff w/Dl) where Deff
wis the effective diffusion coefficient of water in cartilage tissue, Dl is the
diffusion coefficient of water in cartilage free constructs (Experimental error bars obtained using error
percentage of 5%)
7/27/2019 Mathematical Modeling of Transport and Reaction in Cellular and T
http://slidepdf.com/reader/full/mathematical-modeling-of-transport-and-reaction-in-cellular-and-t 187/270
167
1.8
2.3
2.8
3.3
3.8
4.3
4.8
5.3
0 0.5 1 1.5 2 2.5 3 3.5 4 4.5
Time (wks)
T 1 e f f ( s )
Figure 6. 10 Model-data comparison for effective relaxation constant [T1eff ] variation with time
(Experimental error bars obtained using error percentage of 5%)
8E-10
1000
2000
3000
4000
5000
6000
7000
0 0.5 1 1.5 2 2.5 3 3.5 4 4.5
Time (wks)
( D e f f * t ) / ( T b f * T b f )
Figure 6.11 a Validity test for the quasi-steady state assumption (Equation 6.14 a)
Model
Expt.

7/27/2019 Mathematical Modeling of Transport and Reaction in Cellular and T
http://slidepdf.com/reader/full/mathematical-modeling-of-transport-and-reaction-in-cellular-and-t 188/270
168
0
0.1
0.2
0.3
0.4
0.5
0.6
0.7
0.8
0.9
1
0 0.5 1 1.5 2 2.5 3 3.5 4 4.5
Time (wks)
( k e f f * T b f * T b f ) / D e f f
Figure 6. 11 b Validity test of Equation 6.14 b showing that the nutrient consumption rate is small relative to
diffusion during the 4 weeks of culture
Figure 6.12 (a) shows the normalized sensitivity of the collagen volume fraction inside an
averaging volume. It is seen that this model variable is most sensitive to the collagen production
rate ‘k em’ and the saturation Michaelis-Menten parameter ‘ K ec’. Increasing ‘k em’ or decreasing
‘ K ec’ is shown to increase the rate of collagen production over nearly 2 weeks. However, after
week 2 the effects of the collagen production rate parameters level off. The normalized GAG
production expressed as concentration is seen to be highly sensitive to its production rate ‘k GAG’,
and increases to 0.9 in the first 1-2 days and then drops gradually at later times to a value close to
0.1 (Figure 6.12 b). Positive sensitivity denotes that an increased ‘k GAG’ would increase the
GAG synthesis rate. The mass balance of GAG formation utilizes product-inhibition kinetics
with ‘ε GAGmax’ the maximum GAG concentration. Hence, after the maximum limit of GAG
volume fraction is reached the sensitivity of ‘k GAG’ to a GAG volume fraction change decreases.
Increases in the collagen and GAG volume fractions would lead to larger oxygen binding to
these ECM components and thus decrease the diffusivity of oxygen (Figure 6.12 f).
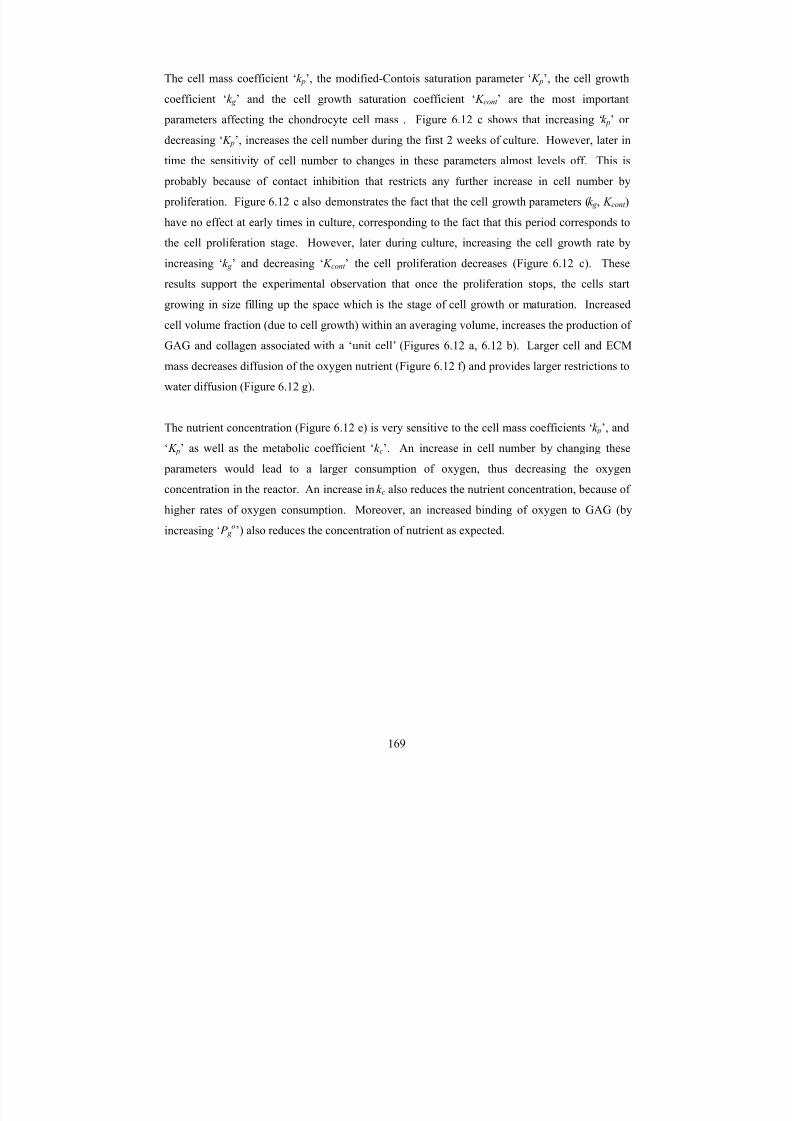
7/27/2019 Mathematical Modeling of Transport and Reaction in Cellular and T
http://slidepdf.com/reader/full/mathematical-modeling-of-transport-and-reaction-in-cellular-and-t 189/270
169
The cell mass coefficient ‘k p’, the modified-Contois saturation parameter ‘ K p’, the cell growth
coefficient ‘k g ’ and the cell growth saturation coefficient ‘ K cont ’ are the most important
parameters affecting the chondrocyte cell mass . Figure 6.12 c shows that increasing ‘k p’ or
decreasing ‘ K p’, increases the cell number during the first 2 weeks of culture. However, later in
time the sensitivity of cell number to changes in these parameters almost levels off. This is
probably because of contact inhibition that restricts any further increase in cell number by
proliferation. Figure 6.12 c also demonstrates the fact that the cell growth parameters (k g , K cont )
have no effect at early times in culture, corresponding to the fact that this period corresponds to
the cell proliferation stage. However, later during culture, increasing the cell growth rate by
increasing ‘k g ’ and decreasing ‘ K cont ’ the cell proliferation decreases (Figure 6.12 c). These
results support the experimental observation that once the proliferation stops, the cells start
growing in size filling up the space which is the stage of cell growth or maturation. Increased
cell volume fraction (due to cell growth) within an averaging volume, increases the production of
GAG and collagen associated with a ‘unit cell’ (Figures 6.12 a, 6.12 b). Larger cell and ECM
mass decreases diffusion of the oxygen nutrient (Figure 6.12 f) and provides larger restrictions to
water diffusion (Figure 6.12 g).
The nutrient concentration (Figure 6.12 e) is very sensitive to the cell mass coefficients ‘k p’, and
‘ K p’ as well as the metabolic coefficient ‘k
c’. An increase in cell number by changing these
parameters would lead to a larger consumption of oxygen, thus decreasing the oxygen
concentration in the reactor. An increase in k c also reduces the nutrient concentration, because of
higher rates of oxygen consumption. Moreover, an increased binding of oxygen to GAG (by
increasing ‘ P g o’) also reduces the concentration of nutrient as expected.

7/27/2019 Mathematical Modeling of Transport and Reaction in Cellular and T
http://slidepdf.com/reader/full/mathematical-modeling-of-transport-and-reaction-in-cellular-and-t 190/270
170
-1
-0.8
-0.6
-0.4
-0.2
0
0.2
0.4
0.6
0.8
1
0 0.5 1 1.5 2 2.5 3 3.5 4 4.5
Time (wks)
N o r m a l i z e d S e n s i t i v i t y o f C
o l l a g e n V o l
F r a c . ,
S c o l
Scol_kp Scol_Kp Scol_kc Scol_kg Scol_Kcont
Scol_kGAG Scol_kem Scol_Kec Scol_Pfo Scol_Pcolo
Figure 6.12 a Normalized Sensitivity of Collagen volume fraction with varying model parameters as a
function of time; sensitivity highest to collagen production parameters
-0.2
0
0.2
0.4
0.6
0.8
1
0 0.5 1 1.5 2 2.5 3 3.5 4 4.5
Time (wks)
N o r m a l i z e d S e n s i t i v i t y o f G A G
V o l F r a c . ,
S G A G
Sgag_kp Sgag_Kp Sgag_kc Sgag_kg Sgag_Kcont
Sgag_kgag Sgag_kem Sgag_Kec Sgag_Pfo Sgag_Pcolo
Figure 6.12 b Normalized Sensitivity of GAG volume fraction with varying model parameters as a function of
time; sensitivity highest to GAG production parameter

7/27/2019 Mathematical Modeling of Transport and Reaction in Cellular and T
http://slidepdf.com/reader/full/mathematical-modeling-of-transport-and-reaction-in-cellular-and-t 191/270
171
-0.6
-0.4
-0.2
0
0.2
0.4
0.6
0 0.5 1 1.5 2 2.5 3 3.5 4 4.5
Time (wks)
N o r m a l i z e d S e n s i t i v i t y o f C e
l l n u m b e r ( S n )
Sn_kp Sn_Kp Sn_kc Sn_kg Sn_Kcont
Sn_kGAG Sn_kem Sn_Kec Sn_Pfo Sn_Pcolo
Figure 6.12 c Normalized Sensitivity of cell number with varying model parameters as a function of time;
sensitivity highest to cell proliferation and cell growth parameters
-0.4
-0.3
-0.2
-0.1
0
0.1
0.2
0.3
0.4
0 0.5 1 1.5 2 2.5 3 3.5 4 4.5
Time (wks)
N o r m a l i z e d S e n s i t i v i t y o f C e l l
V o l F r a c .
( S c )
Sc_kp Sc_Kp Sc_kc Sc_kg Sc_Kcont
Sc_kGAG Sc_kem Sc_Kec Sc_Pfo Sc_Pcolo
Figure 6.12 d Normalized Sensitivity of cell volume fraction with varying model parameters as a function of
time; sensitivity highest to cell growth and proliferation parameters

7/27/2019 Mathematical Modeling of Transport and Reaction in Cellular and T
http://slidepdf.com/reader/full/mathematical-modeling-of-transport-and-reaction-in-cellular-and-t 192/270
172
-0.14
-0.09
-0.04
0.01
0.06
0.11
0 0.5 1 1.5 2 2.5 3 3.5 4 4.5
Time(wks)
N o r m a l i z e d S e n s i t i v i t y o f N u t r i e n t C o n c e n t r a t i o n
( S n u t r )
Snutr_kp Snutr_Kp Snutr_kc Snutr_kg Snutr_Kcont
Snutr_kGAG Snutr_kem Snutr_Kec Snutr_Pfo Snutr_Pcolo
Figure 6.12 e Normalized Sensitivity of nutrient concentration with varying model parameters as a function
of time; sensitivity highest to cell proliferation, first order oxygen consumption rate and oxygen binding
parameters
-0.35
-0.3
-0.25
-0.2
-0.15
-0.1
-0.05
0
0.05
0 0.5 1 1.5 2 2.5 3 3.5 4 4.5
Time (wks)
N o r m a l i z e d S e n s i t i v t y o f D e f f O x y g e n
Sdeffo_kp Sdeffo_Kp Sdeffo_kc Sdeffo_kg Sdeffo_Kcont
Sdeffo_kGAG Sdeffo_kem Sdeffo_Kec Sdeffo_Pfo Sdeffo_Pcolo
Figure 6.12 f Normalized Sensitivity of effective oxygen diffusion coefficient in the reactor with varying model
parameters as a function of time; sensitivity highest to oxygen GAG binding coefficient and the GAG
production rate
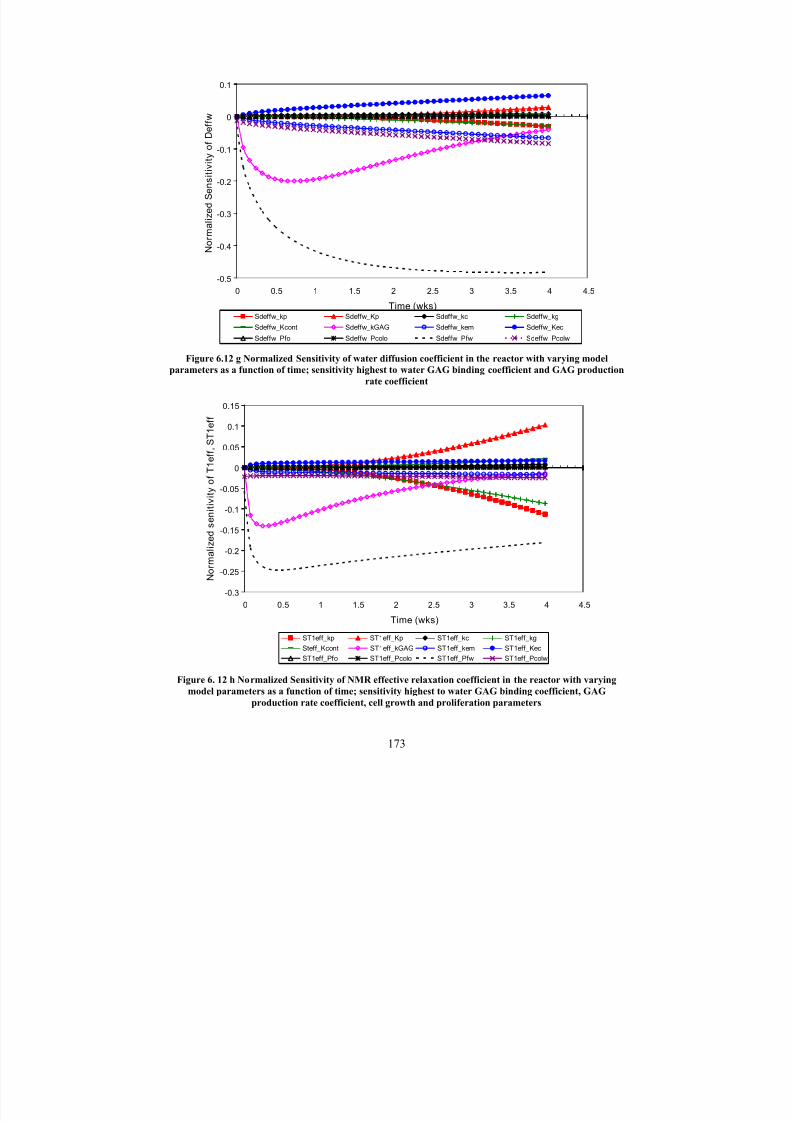
7/27/2019 Mathematical Modeling of Transport and Reaction in Cellular and T
http://slidepdf.com/reader/full/mathematical-modeling-of-transport-and-reaction-in-cellular-and-t 193/270
173
-0.5
-0.4
-0.3
-0.2
-0.1
0
0.1
0 0.5 1 1.5 2 2.5 3 3.5 4 4.5
Time (wks)
N o r m a l i z e d S e n s i t i v i t y o f D e f f w
Sdeffw_kp Sdeffw_Kp Sdeffw_kc Sdeffw_kg
Sdeffw_Kcont Sdeffw_kGAG Sdeffw_kem Sdeffw_Kec
Sdeffw_Pfo Sdeffw_Pcolo Sdeffw_Pfw Sdeffw_Pcolw
Figure 6.12 g Normalized Sensitivity of water diffusion coefficient in the reactor with varying model
parameters as a function of time; sensitivity highest to water GAG binding coefficient and GAG production
rate coefficient
-0.3
-0.25
-0.2
-0.15
-0.1
-0.05
0
0.05
0.1
0.15
0 0.5 1 1.5 2 2.5 3 3.5 4 4.5
Time (wks)
N o r m a l i z e d s e n i t i v i t y o f T 1 e f f , S T 1 e f f
ST1eff_kp ST1eff_Kp ST1eff_kc ST1eff_kg
Steff_Kcont ST1eff_kGAG ST1eff_kem ST1eff_Kec
ST1eff_Pfo ST1eff_Pcolo ST1eff_Pfw ST1eff_Pcolw
Figure 6. 12 h Normalized Sensitivity of NMR effective relaxation coefficient in the reactor with varying
model parameters as a function of time; sensitivity highest to water GAG binding coefficient, GAG
production rate coefficient, cell growth and proliferation parameters

7/27/2019 Mathematical Modeling of Transport and Reaction in Cellular and T
http://slidepdf.com/reader/full/mathematical-modeling-of-transport-and-reaction-in-cellular-and-t 194/270
174
VARYING GROWTH RATE FUNCTIONS – [For the same set of parameters as used in model]
Case 1:
⎥⎥⎦
⎤
⎢⎢⎣
⎡−⋅⎟⎟
⎠
⎞⎜⎜⎝
⎛
+⋅
⋅= cd
c
g
c k n Kcont
k R 0
µ ε
µ
Figure 6.13 a Cartilage tissue growth over time obtained by the use of modified Contois function with respect
to nutrient concentration and no dependence on cell number (as shown by the equation in case 1). Model
results are shown by solid line and experimental results in dots.
Case 2:
⎥⎥⎦
⎤
⎢⎢⎣
⎡
−⋅⎟⎟ ⎠
⎞⎜⎜⎝
⎛
+⋅
⋅
= cd
c
g
c k n Kcont
k
R1
µ ε
µ
Figure 6.13 b Cartilage tissue growth over time obtained by the use of modified Contois function with respect
to nutrient concentration and 1st
order dependence on cell number (as shown by the equation in case 2).
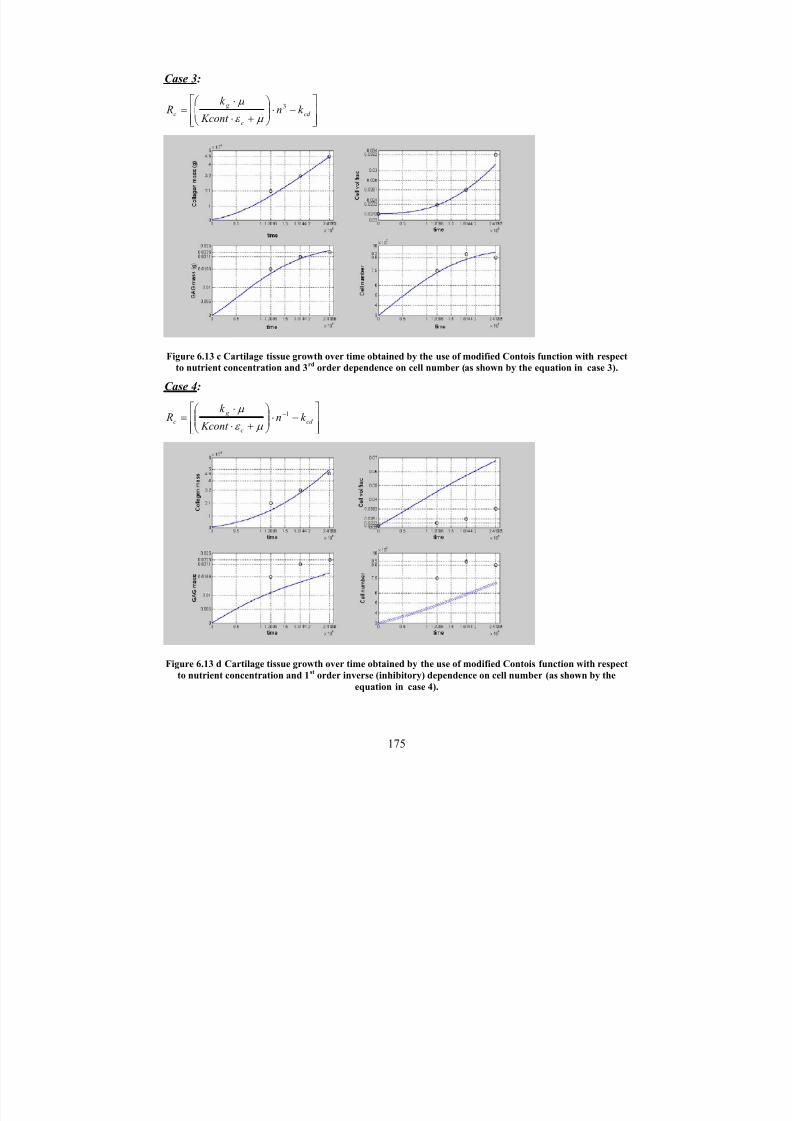
7/27/2019 Mathematical Modeling of Transport and Reaction in Cellular and T
http://slidepdf.com/reader/full/mathematical-modeling-of-transport-and-reaction-in-cellular-and-t 195/270
175
Case 3:
⎥⎥⎦
⎤
⎢⎢⎣
⎡−⋅⎟⎟
⎠
⎞⎜⎜⎝
⎛
+⋅
⋅= cd
c
g
c k n Kcont
k R 3
µ ε
µ
Figure 6.13 c Cartilage tissue growth over time obtained by the use of modified Contois function with respect
to nutrient concentration and 3rd order dependence on cell number (as shown by the equation in case 3).
Case 4:
⎥⎥⎦
⎤
⎢⎢⎣
⎡−⋅⎟⎟
⎠
⎞⎜⎜⎝
⎛
+⋅
⋅= −
cd
c
g
c k n Kcont
k R 1
µ ε
µ
Figure 6.13 d Cartilage tissue growth over time obtained by the use of modified Contois function with respect
to nutrient concentration and 1st order inverse (inhibitory) dependence on cell number (as shown by the
equation in case 4).
7/27/2019 Mathematical Modeling of Transport and Reaction in Cellular and T
http://slidepdf.com/reader/full/mathematical-modeling-of-transport-and-reaction-in-cellular-and-t 196/270
176
Case 5:
⎥⎥⎦
⎤
⎢⎢⎣
⎡−⋅⎟
⎟ ⎠
⎞⎜⎜⎝
⎛
+⋅
⋅= cd
c
g
c k n Kcont
k R 0
2
2
µ ε
µ
Figure 6.13 e Cartilage tissue growth over time obtained by the use of modified Contois function with respect
to nutrient concentration and no dependence on cell number (as shown by the equation in case 5).
Case 6:
⎥⎥⎦
⎤
⎢⎢⎣
⎡−⋅⎟
⎟ ⎠
⎞⎜⎜⎝
⎛
+⋅
⋅= cd
c
g
c k n Kcont
k R 1
2
2
µ ε
µ
Figure 6.13 f Cartilage tissue growth over time obtained by the use of modified Contois function with respect
to nutrient concentration and 1st order dependence on cell number (as shown by the equation in case 6).
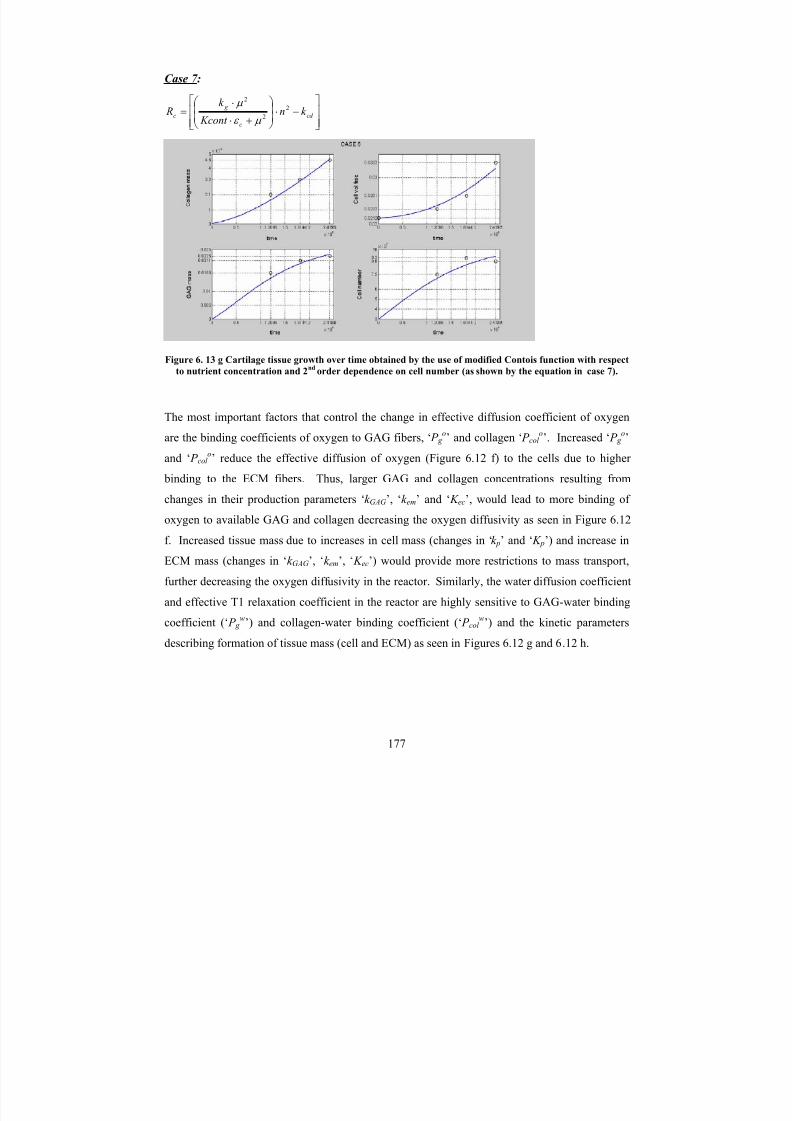
7/27/2019 Mathematical Modeling of Transport and Reaction in Cellular and T
http://slidepdf.com/reader/full/mathematical-modeling-of-transport-and-reaction-in-cellular-and-t 197/270
177
Case 7:
⎥⎥⎦
⎤
⎢⎢⎣
⎡−⋅⎟
⎟ ⎠
⎞⎜⎜⎝
⎛
+⋅
⋅= cd
c
g
ck n
Kcont
k R 2
2
2
µ ε
µ
Figure 6. 13 g Cartilage tissue growth over time obtained by the use of modified Contois function with respect
to nutrient concentration and 2nd
order dependence on cell number (as shown by the equation in case 7).
The most important factors that control the change in effective diffusion coefficient of oxygen
are the binding coefficients of oxygen to GAG fibers, ‘ P g o’ and collagen ‘ P col
o’. Increased ‘ P g
o’
and ‘ P col o’ reduce the effective diffusion of oxygen (Figure 6.12 f) to the cells due to higher
binding to the ECM fibers. Thus, larger GAG and collagen concentrations resulting from
changes in their production parameters ‘k GAG’, ‘k em’ and ‘ K ec’, would lead to more binding of
oxygen to available GAG and collagen decreasing the oxygen diffusivity as seen in Figure 6.12
f. Increased tissue mass due to increases in cell mass (changes in ‘k p’ and ‘ K p’) and increase in
ECM mass (changes in ‘k GAG’, ‘k em’, ‘ K ec’) would provide more restrictions to mass transport,
further decreasing the oxygen diffusivity in the reactor. Similarly, the water diffusion coefficient
and effective T1 relaxation coefficient in the reactor are highly sensitive to GAG-water bindingcoefficient (‘ P g
w’) and collagen-water binding coefficient (‘ P col
w’) and the kinetic parameters
describing formation of tissue mass (cell and ECM) as seen in Figures 6.12 g and 6.12 h.

7/27/2019 Mathematical Modeling of Transport and Reaction in Cellular and T
http://slidepdf.com/reader/full/mathematical-modeling-of-transport-and-reaction-in-cellular-and-t 198/270
178
6.4 Conclusions
Summarizing, the developed mathematical model is able to quantify the bioreactor environment
very well. The proposed modeling framework enables a study of restricted transport of important nutrients and its influence on cell behavior. The model supports the experimental
evidence suggesting that construct growth in the reactor is not hindered by oxygen transport
limitations (Williams et al ., 2002). NMR measurable parameters such as the effective water
diffusion coefficient and T1 relaxation constant are also computed as functions of tissue mass.
These model results are validated with available experimental data (Potter et al ., 1998) and show
that restrictions to water diffusion are primarily due to binding of water to ECM components
rather than due to increase in tissue mass. This work supports the use of NMR as a suitable
monitoring tool for ECM production in ex vivo cartilage growth in hollow fiber bioreactors. The
effective water diffusion coefficient predicted by the model did not correspond well with the
experimental data during the earlier time periods and estimations of diffusion times in the
experimental data suggest that the experimental measurements do not fully probe restrictions to
transport due to binding of water to ECM components at these times. Additionally, the
sensitivity analysis of tissue formation with various culture parameters provides information
about the relative roles of cell mass production rates on ECM formation, and the change in
microenvironment around the cell due to ECM formation on cell growth and proliferation.
The current model can be readily extended to include the effects of other environmental factors
by incorporating mass balances of nutrients such as glucose and metabolic byproducts like
lactate that might be important to be controlled in reactor culture units. Thus, modeling of
transient events in the bioreactor - chondrocyte mass, matrix biosynthesis and nutrient transport
provide additional insights into cartilage growth in vitro in bioreactors. This quantitative
information could be used for proposing better reactor designs and suitable operational
conditions for reactor scale-up. The model is also found to be suitable for suggesting improved
experimental design and can be used to assess the important parameters to be measured
experimentally.
7/27/2019 Mathematical Modeling of Transport and Reaction in Cellular and T
http://slidepdf.com/reader/full/mathematical-modeling-of-transport-and-reaction-in-cellular-and-t 199/270

7/27/2019 Mathematical Modeling of Transport and Reaction in Cellular and T
http://slidepdf.com/reader/full/mathematical-modeling-of-transport-and-reaction-in-cellular-and-t 200/270
180
macro-environmental changes to facilitate various cellular processes involved in cellular tissue
substitute formations in vitro in bioreactors. The current study aims to develop an understanding
of transport and reaction of these metabolites at the cellular level and to understand the role
metabolite spatial distribution on cell structure and metabolic regulation. Such a structured
framework, in future, would provide integration and coordination of detailed cellular metabolic
pathways to overall inputs of the reactor system (or in vivo models), and in the long run with
tissue, organ, and whole-body processes.
A complete quantitative analysis of metabolic regulation cannot be obtained just from in vivo or
in vitro experimental studies even if all necessary measurements were possible. The complexity
of interacting biochemical reactions distributed spatially, in the cellular metabolic pathways, and
their integration to tissue/organ and eventually the whole organism level requires a formal
theoretical framework for quantitative understanding (Saidel et al ., 2003). This framework is
built by the development of physiological models based on the basic principles of conservation
of mass, momentum, and energy, describing the metabolite production, transport and utilization
through the various enzyme pathways. These model results can be analyzed using suitable
analytical and numerical methods to understand the regulation pathways in metabolic reactions
and its effect on cell structure.
Muscle cells are considered to be ideal models for this study. These cells are highly structured
with very slight variations in organization from organism to organism. They can perform diverse
mechanical functions and they display the largest changes in metabolic rates when undergoing
transitions between rest and exercise (Suraez, 2003). Moreover, extensive literature on energy
metabolism in muscle presents an excellent opportunity to develop quantitative, predictive, and
testable models of cellular function across a wide range of spatial and temporal boundaries.
Ultimately, the quantitative understanding of interaction between metabolism and cell structure
would help in setting up a rationale for cellular design for attaining the desired functions.
The complexity of muscle metabolism is explored by developing suitable reaction-diffusion
models of the transport and reaction dynamics of phosphorous metabolites involved in various
metabolic pathways in the muscle. This descriptive mathematical model would account for the
7/27/2019 Mathematical Modeling of Transport and Reaction in Cellular and T
http://slidepdf.com/reader/full/mathematical-modeling-of-transport-and-reaction-in-cellular-and-t 201/270
181
spatial distribution of the various enzyme catalyzed reactions and provide quantitative
understanding of the effects of diffusion on the chemical reaction processes under various
physiological conditions. Understanding intracellular muscle energetics is a basic problem of
optimizing ATP supply to meet ATP demands in these reaction processes. This metabolic study
is designed to address the basic question ‘what are the rules that govern cell size, and in specific,
muscle cell size in organisms?’. One of the possible factors governing cell size and organization
is proposed to be the metabolic processes. Rationally, if the metabolic process is one of the
reasons, then the model would help us quantitatively determine which one of the following is the
controlling step –
a) intracellular metabolite diffusion, and/or
b) rates of ATP utilization corresponding to the contractile machinery of the cell, and/or
c) rates of ATP production at the mitochondrial surface co-related directly to rate of oxygen
delivery from the surrounding capillaries.
7.2 Current Modeling Objectives
Muscle cells or fibers typically fall in the size range of 10-100 µm along the shortest axis,
usually the diameter (Johnson et al ., 2004). Fibers with dimension exceeding this range are
believed to compromise aerobic metabolism, which relies upon oxygen flux across cell
membranes, as well as ATP-equivalent flux from mitochondria to sites of ATP demand
(Mainwood and Rakusan, 1982). This is because fiber diameters greater than 100 µm would
lead to a dramatic decrease in surface area to volume ratio (SA:V) and thus increase the time
required for the metabolites to diffuse radially across the cell. Cell size maximum is thus
believed to be modulated by the balance between aerobic ATP demand and oxygen supply to
mitochondria. This can be justified by observations that aerobic muscle fibers have smaller
diameter than anaerobic fibers in animal groups as diverse as mammals, fishes and crustaceans
(Tse et al ., 1983).
Most work on aerobic energy metabolism in skeletal muscle in the literature has focused only on
the catalytic aspects of cellular enzyme systems rather than the diffusive flux of metabolites from
7/27/2019 Mathematical Modeling of Transport and Reaction in Cellular and T
http://slidepdf.com/reader/full/mathematical-modeling-of-transport-and-reaction-in-cellular-and-t 202/270
182
the site of formation to its site of utilization and the other way around. This simplification has
been based on the reasoning that cellular dimensions tend to be modest (muscle fibers ranging
from 10-100 µm in diameter; Russell et al ., 2000), and intracellular diffusion distances between
mitochondria are typically very short in both aerobic and anaerobic skeletal muscle (e.g., Tyler
and Sidell, 1984) fibers. Diffusion is assumed to be rapid, relative to the catalytic capacity of the
mitochondria, leading to a global chemical equilibrium across the cell. This approach has been
effectively employed to describe some of the major processes of energy metabolism in muscle,
and a variety of kinetic models have been developed that closely match experimental data (e.g.,
Meyer, 1988; Jeneson et al ., 1995; Vicini and Kushmerick, 2000; Korzeniewski, 2003; Beard,
2005).
While the value of purely kinetic analysis of muscle energy metabolism is readily apparent, the
conditions under which diffusive flux may be important in either limiting the net rate of aerobic
process or influencing the evolution of metabolic pathways and further governing cellular
designs to keep up with the muscle functions are unresolved (Suarez, 2003). The principal
hurdle to understanding the role of diffusion and metabolic organization in muscle cells is that
most metabolic measurements are weighted-averages over an entire cell or tissue, making it
difficult to observe localized intracellular events or concentration gradients. However, several
studies that have employed reaction-diffusion mathematical modeling of aerobic metabolismhave found theoretical evidence for concentration gradients in high-energy phosphate molecules
during steady-state contraction in muscle (Mainwood and Rakusan, 1982; Meyer et al . 1984;
Hubley et al . 1997; Aliev and Saks, 1997; Kemp et al ., 1998; Vendelin et al ., 2000; Saks et al .,
2003).
In an effort to understand the role of diffusion and metabolic organization on the control of
metabolism, we have been examining metabolic processes in an extremely anaerobic crustacean
muscle model system. It is often difficult to test vertebrate models because the time scales of
diffusive and catalytic processes seem to coincide (Meyer et al ., 1984). In contrast, the SA:V
and diffusion challenges imposed by large muscle cells of crustaceans are dramatic and should
result in easily discernible metabolic consequences and compensatory responses. Further, these

7/27/2019 Mathematical Modeling of Transport and Reaction in Cellular and T
http://slidepdf.com/reader/full/mathematical-modeling-of-transport-and-reaction-in-cellular-and-t 203/270
183
giant cells can be easily manipulated and this has made them a classic model system for
metabolic physiologists.
The crustacean blue crab, Callinectes Sapidus have two distinct kinds of muscle fibers - small,
dark region of aerobic fibers called ‘dark fibers’ that power sustainable swimming, surrounded
by a large mass of anaerobic fibers called ‘white fibers’ used for burst swimming (Tse et al .,
1983). The white muscle fibers of large crustaceans like the blue crab have wide range of cell
sizes during their life time. The juvenile blue crabs likely have muscle cells less than 60 µm in
diameter while the adult crustacean fiber diameters exceed 600 µm (Boyle et al ., 2003). This
means that during development these juvenile fibers cross and exceed the usual limit on cell
dimensions while preserving muscle function (Boyle et al ., 2003). Moreover, the distribution of
mitochondria in these white fibers has been also seen to change dramatically with increase in cell
size during the life time of the crab. In small (juvenile) anaerobic white fibers mitochondria are
uniformly distributed throughout the cell, whereas in large (adult) fibers the mitochondria are
largely clustered at the sarcolemmal membrane forming an oxidative cylinder at the periphery of
the cell (Boyle et al . 2003). Thus, the average distance between mitochondria in small fibers is
several microns, while in large fibers there may be hundreds of microns between mitochondrial
clusters. Aerobic dark fibers, however, have similar cell sizes as the small white fibers and
uniformly distributed mitochondria throughout the cell. The average distance between twomitochondria in these fibers are also few microns.
In the muscle fibers of blue crabs the factors potentially limiting the rate of diffusive flux are not
only the large metabolite diffusion distances but also the presence of various intracellular
barriers. Experiments by various groups (Kinsey et al ., 1999; De Graaf et al ., 2001; Kinsey and
Moerland, 2002) have shown that these barriers could lead to a time-dependent reduction in
metabolite diffusion coefficients for substrate movements in the direction perpendicular to the
fiber axis ( D⊥). Over shorter diffusion distances characteristic of dark aerobic fibers and small
anaerobic white fibers, the D⊥ is shown to be about 2-fold higher than D⊥ for the long diffusion
distances that typify large white fibers. While the burst contraction functions of these muscles
are not impacted by intracellular diffusion rates, the ‘aerobic recovery’ process may be
compromised by the extreme fiber size in adult animals. This is again because of slower rate of
7/27/2019 Mathematical Modeling of Transport and Reaction in Cellular and T
http://slidepdf.com/reader/full/mathematical-modeling-of-transport-and-reaction-in-cellular-and-t 204/270
184
diffusion compared to the rate of metabolite demand. Furthermore, several size-dependent
differences in the recovery of the anaerobic white fibers following burst contraction have been
observed experimentally. Small anaerobic fibers are seen to accumulate lactate and modestly
deplete glycogen during burst contractions, and both of these metabolites recover to resting
levels relatively quickly following an exercise bout (Boyle et al ., 2003; Johnson et al ., 2004).
The large anaerobic fibers similarly accumulate lactate and deplete glycogen during contraction,
but following exercise they continue to accumulate large amounts of lactate and further deplete
glycogen. Full aerobic recovery of metabolic species in these large white fibers of adult blue
crabs requires several hours (Milligan et al ., 1989; Henry et al ., 1994; Boyle et al ., 2003;
Johnson et al ., 2004).
The present study develops descriptive mathematical models to improve the quantitative
understanding of the effects of diffusion on the chemical reaction processes occurring in this
muscle model system. These models would include not only the appropriate chemical reactions,
but also the specific spatial distribution of the reaction sites and other barriers or factors that
affect mass transport. The proposed reaction-diffusion model would provide insight into the
roles of cellular structure in the energy metabolism of muscle. This model could be easily
extended to different muscle fiber types, with varying size, ATP demand and ATP supply, to
study the metabolic consequences on cellular design.
Our general hypothesis is that increasing fiber size would induce in metabolic organization and
dramatically impact the rates of metabolic processes. Experiments conducted in Dr S. T.
Kinsey’s laboratory (University of North Carolina, Wilmington) have aimed at detecting the
effects of fiber size in blue crabs. Their focus is primarily the white anaerobic fibers because of
the unique feature of these muscle fibers to grow during development by increasing their size
and reorganizing the distribution of their mitochondria. In their previous work, Kinsey and
coworkers have hypothesized that in large (adult) white fibers anaerobic metabolism is recruited
following burst contractions in order to accelerate certain key phases of metabolite recovery that
would otherwise be overly slow due to intracellular diffusion constraints (Kinsey and Moerland,
2002; Boyle et al ., 2003; Johnson et al ., 2004). In the present study we test this hypothesis by
examining the fiber size-dependence of the rate of post-contractile arginine phosphate (AP)
7/27/2019 Mathematical Modeling of Transport and Reaction in Cellular and T
http://slidepdf.com/reader/full/mathematical-modeling-of-transport-and-reaction-in-cellular-and-t 205/270
185
resynthesis, by comparing the available experimental data to our mathematical model of aerobic
metabolism in these fibers. The focus is to develop a suitable reaction-diffusion model of this
model system (blue crab) that can be used to interpret the measured metabolic parameters in the
light of cellular organization and diffusional constraints. From our study we propose probable
model modifications to be able to explain the experimental results better.
7.3 Model Formulation
7.3.1 Model Schematic
The schematic of a muscle fiber cross-section is shown in Figure 7.1 (A). The myofibrils or the
contractile units of muscles are packed within the muscle fiber. Few myofibrils are surrounded
by a tubular system, the sarcoplasmic reticulum (SR), which stores the calcium ions that regulate
muscle contraction. Rows of mitochondria are clustered near the SR and myofibrils, ready to
supply ATP needed to fuel the contractile process. A plasma membrane, the sarcolemma,
surrounds the muscle fiber.
As a first estimate for model development, it is reasonable to obtain a representative one
dimensional radial profile of the fiber as shown in Figure 7.1 (B). The contraction of muscle
requires consumption of ATP. ATP is formed in the mitochondria by oxidative phosphorylation.
Once produced, ATP must diffuse across the cell cytoplasm to the myofibril, the functional unit
of muscle contraction. The model developed for this study is a simplified 1-dimensional system
that extends from the surface of a mitochondrion to a distance λ/2, equal to half of the mean free
spacing between mitochondria or between clusters of mitochondria around a myofibril.
The proposed reaction-diffusion mathematical model is used to predict the concentration of five
key muscle metabolites: Adenosine Triphosphate (ATP), Adenosine Diphosphate (ADP),
Arginine Phosphate (AP), Arginine (Arg) and inorganic phosphate (Pi). These metabolic species
participate in several reactions that take place in the myofibrilar region or in the mitochondria.
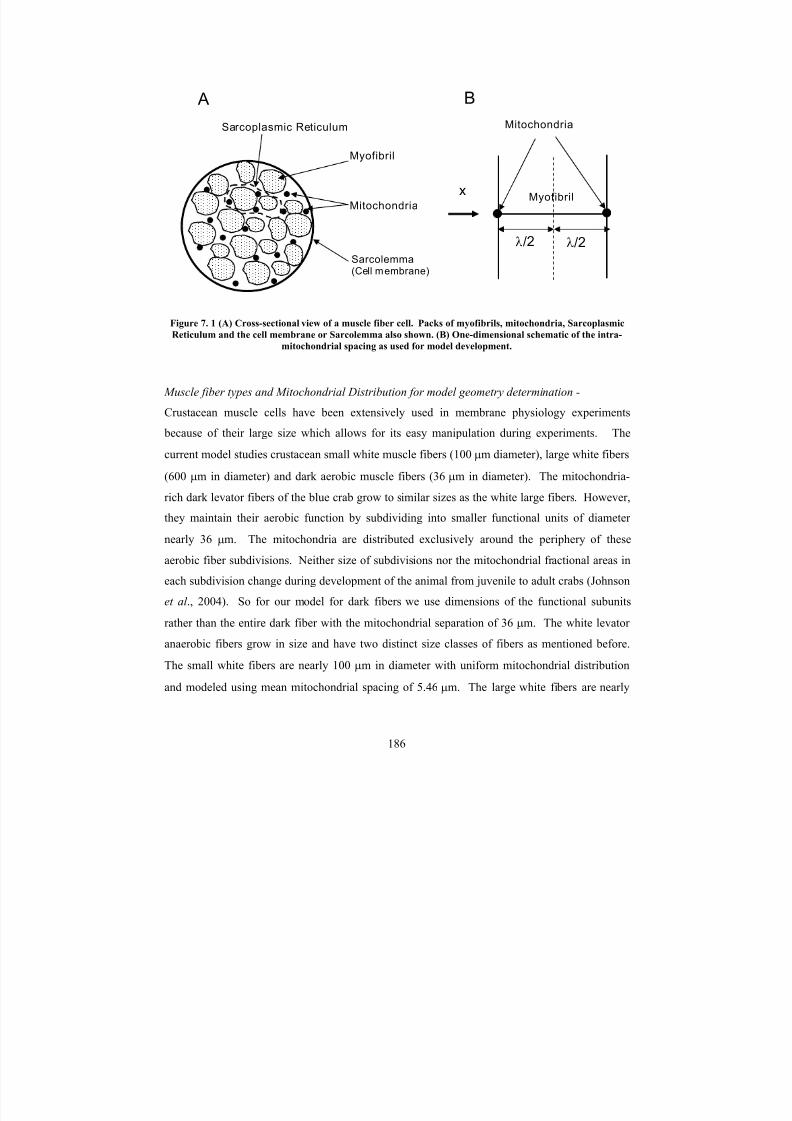
7/27/2019 Mathematical Modeling of Transport and Reaction in Cellular and T
http://slidepdf.com/reader/full/mathematical-modeling-of-transport-and-reaction-in-cellular-and-t 206/270
186
Figure 7. 1 (A) Cross-sectional view of a muscle fiber cell. Packs of myofibrils, mitochondria, Sarcoplasmic
Reticulum and the cell membrane or Sarcolemma also shown. (B) One-dimensional schematic of the intra-
mitochondrial spacing as used for model development.
Muscle fiber types and Mitochondrial Distribution for model geometry determination -
Crustacean muscle cells have been extensively used in membrane physiology experiments
because of their large size which allows for its easy manipulation during experiments. The
current model studies crustacean small white muscle fibers (100 µm diameter), large white fibers
(600 µm in diameter) and dark aerobic muscle fibers (36 µm in diameter). The mitochondria-
rich dark levator fibers of the blue crab grow to similar sizes as the white large fibers. However,
they maintain their aerobic function by subdividing into smaller functional units of diameter
nearly 36 µm. The mitochondria are distributed exclusively around the periphery of these
aerobic fiber subdivisions. Neither size of subdivisions nor the mitochondrial fractional areas in
each subdivision change during development of the animal from juvenile to adult crabs (Johnson
et al ., 2004). So for our model for dark fibers we use dimensions of the functional subunitsrather than the entire dark fiber with the mitochondrial separation of 36 µm. The white levator
anaerobic fibers grow in size and have two distinct size classes of fibers as mentioned before.
The small white fibers are nearly 100 µm in diameter with uniform mitochondrial distribution
and modeled using mean mitochondrial spacing of 5.46 µm. The large white fibers are nearly
Sarcolemma(Cell membrane)
Myofibril
Mitochondria
Sarcoplasmic Reticulum
x
λ/2 λ/2
Myofibril
Mitochondria
A B
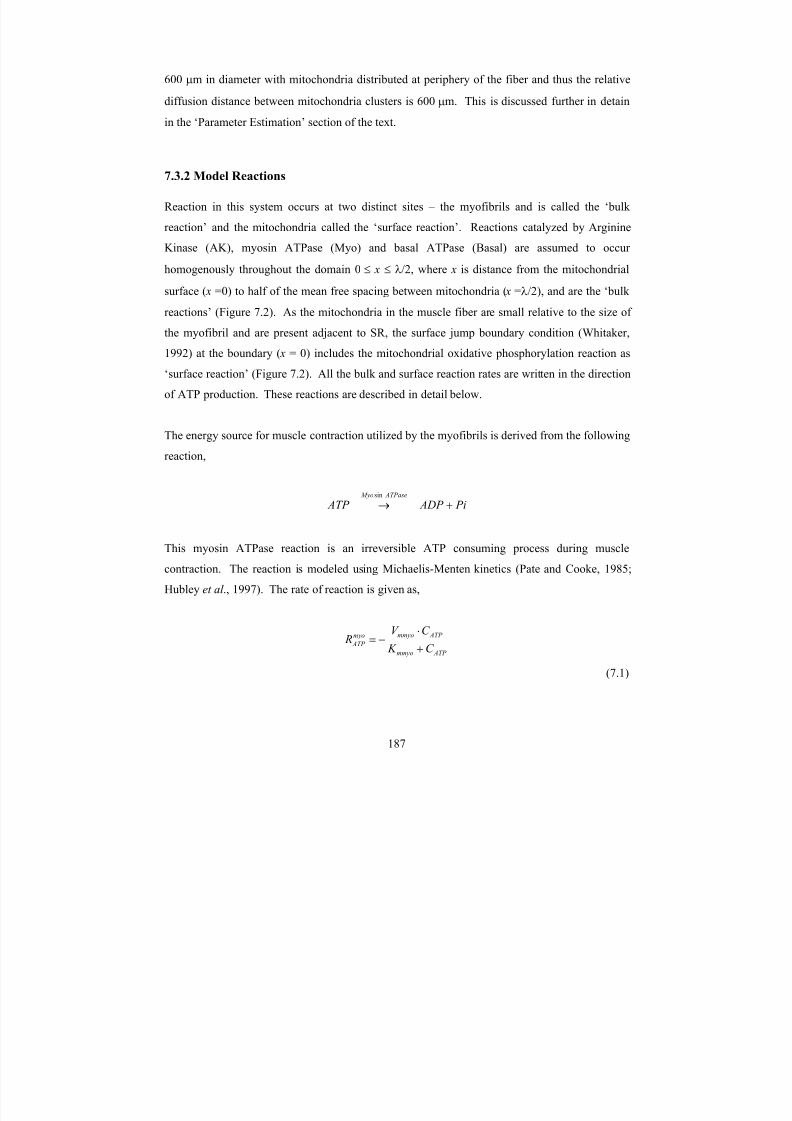
7/27/2019 Mathematical Modeling of Transport and Reaction in Cellular and T
http://slidepdf.com/reader/full/mathematical-modeling-of-transport-and-reaction-in-cellular-and-t 207/270
187
600 µm in diameter with mitochondria distributed at periphery of the fiber and thus the relative
diffusion distance between mitochondria clusters is 600 µm. This is discussed further in detain
in the ‘Parameter Estimation’ section of the text.
7.3.2 Model Reactions
Reaction in this system occurs at two distinct sites – the myofibrils and is called the ‘bulk
reaction’ and the mitochondria called the ‘surface reaction’. Reactions catalyzed by Arginine
Kinase (AK), myosin ATPase (Myo) and basal ATPase (Basal) are assumed to occur
homogenously throughout the domain 0 ≤ x ≤ λ/2, where x is distance from the mitochondrial
surface ( x =0) to half of the mean free spacing between mitochondria ( x =λ/2), and are the ‘bulk
reactions’ (Figure 7.2). As the mitochondria in the muscle fiber are small relative to the size of
the myofibril and are present adjacent to SR, the surface jump boundary condition (Whitaker,
1992) at the boundary ( x = 0) includes the mitochondrial oxidative phosphorylation reaction as
‘surface reaction’ (Figure 7.2). All the bulk and surface reaction rates are written in the direction
of ATP production. These reactions are described in detail below.
The energy source for muscle contraction utilized by the myofibrils is derived from the following
reaction,
Pi ADP ATP ATPase Myo
+→sin
This myosin ATPase reaction is an irreversible ATP consuming process during muscle
contraction. The reaction is modeled using Michaelis-Menten kinetics (Pate and Cooke, 1985;
Hubley et al ., 1997). The rate of reaction is given as,
ATP mmyo
ATP mmyomyo
ATP C K
C V R
+
⋅−=
(7.1)

7/27/2019 Mathematical Modeling of Transport and Reaction in Cellular and T
http://slidepdf.com/reader/full/mathematical-modeling-of-transport-and-reaction-in-cellular-and-t 208/270
188
where V mmyo is the V max, K mmyo is the apparent Michaelis constant. Determination of these
parameters is discussed in the ‘ Parameter Estimation’ section of the text. The rate of ADP and
Pi formation in this step is given as,
myo
Pi
myo
ADP
myo
ATP R R R −=−=
(7.2)
The enzyme, Arginine Kinase (AK), catalyzes the reversible transfer of a phosphate group from
arginine phosphate to ADP to form ATP,
ArgATPADPAP +⇔+
AK
This reaction is called the Arginine Kinase reaction and is comparable to the Creatine Kinase
reaction in vertebrates (Sweeny, 1994). During burst activities the AK reaction acts as a spatial
and temporal buffer for ATP, by generating ATP by breaking down phosphagens, the high
energy storage compounds of the muscle. Thus, intracellular AP serves as the initial fuel used
during burst contraction in crustacean muscles. The model assumes AK to be uniformly
distributed in the cytoplasm (Ellington, 2001) comprising of the space in between the
mitochondria’s in our system. This reaction proceeds by a rapid equilibrium, random
mechanism and is modeled according to the kinetic expression of Smith and Morrison (1969),
iADP IArg
ADP Arg mArg iATP
iAP IATP
Arg ATP mArg iATP
iADP iAP
ADP AP mArg iATP
iADP
ADP mArg iATP
iAP
AP mArg iATP
Arg ATP ATP mArg Arg mATP mArg iATP
ADP AP
iADP mAP
iArg iATP
mAKfor Arg ATP mAKrev
AK
ATP
K K
C C K K
K K
C C K K
K K
C C K K
K
C K K
K
C K K C C C K C K K K
C C K K
K K V C C V
R
+++
+++++
−=
(7.3)
where V mAKfor and V mAKrev are V max values in the forward (ATP formation) and reverse direction,
respectively, K m values are Michaelis constants for ternary complex formation, K i values are free
7/27/2019 Mathematical Modeling of Transport and Reaction in Cellular and T
http://slidepdf.com/reader/full/mathematical-modeling-of-transport-and-reaction-in-cellular-and-t 209/270
189
enzyme-substrate complex dissociation constants, K I values are dissociation constants relevant to
the formation of dead-end complexes. All rate constants are taken from study of Smith and
Morrison (1969). Again the rates of AP consumption and ATP and Arg species formation are
given as,
AK
Arg
AK
AP
AK
ADP
AK
ATP R R R R =−=−= .
(7.4)
Even when the muscle is not exercising there exist a low rate of ATP consumption which is
accounted for by incorporating the ‘basal ATPase reaction’. This rate in the bulk phase is
modeled using a Michaelis-Menten equation and is given as,
ATP mbas
ATP mbasbasal
ATP C K
C V R
+
⋅−=
(7.5)
where V mbas and K mbas are the V max and saturation constants of the basal reaction rate. This
reaction is added as one of the bulk reactions occurring in the myofibrilar region in order to
maintain the concentrations of metabolites (C i) constant over time in inactive fibers and to
promote a return to the initial steady state following metabolic recovery. Details of the model
parameter determination are discussed in the ‘ Parameter Estimation’ section of the text. The
reaction rate for species ADP and Pi involved in this reaction is written as,
basal
Pi
basal
ADP
basal
ATP R R R −=−=
(7.6)

7/27/2019 Mathematical Modeling of Transport and Reaction in Cellular and T
http://slidepdf.com/reader/full/mathematical-modeling-of-transport-and-reaction-in-cellular-and-t 210/270
190
Figure 7. 2 One-dimensional schematic of the intra-mitochondrial spacing as used for model development
showing the various reactions occurring in the myofibrilar region (bulk) and in the mitochondria (surface).Arginine Kinase (AK) mediates ATP-equivalent flux in Crustacean muscle. (A) Reactions and diffusion
distance in small white fibers of juvenile crabs (B) Reaction and diffusion distances over hundreds of microns
in large white fibers of adult crab. Anaerobic glycogenolysis is believed to occur following contraction in
large fibers, presumably to speed up phases of the recovery process. [Johnson et al ., 2004]
The rate of ATP formation in the mitochondria is modeled as a first order activation by ADP,
making a reasonable assumption that concentrations of oxidizable substrates (pyruvate derived
from glycogen) are present at saturated levels in the muscle. The reaction is given as,
ATP Pi ADP OxPhos
→+
There are significant controversies in literature about the exact mechanism of activation of this
mitochondrial oxidative phosphorylation (OxPhos) reaction and control is likely distributed
Surface reaction Bulk reactions
x
ATP → ADP + PiMyosin ATPase (Myo)
ADP + AP ↔ ATP + Arg Arginine K inase (AK)
ATP → ADP + PiBasal ATPase reaction
Mitochondria ADP + Pi
ATP

7/27/2019 Mathematical Modeling of Transport and Reaction in Cellular and T
http://slidepdf.com/reader/full/mathematical-modeling-of-transport-and-reaction-in-cellular-and-t 211/270
191
among several metabolites (Jeneson et al ., 1996) other than ADP. However, as a first step, a
more established ADP activated reaction rate (Meyer, 1984; 1988) kinetics expression is used.
More complex kinetics would be incorporated as the model progresses. The mitochondrial
reaction follows Michaelis-Menten kinetics and is given as,
ADP mmito
ADP mmitoOxPhos
ATP C K
C V R
+⋅
=
(7.7)
where V mmito is the maximal velocity (V max) of the boundary reaction, and K mmito is the Michaelis
constant for ADP for the boundary reaction. The simplified approach assumes this reaction to be
functioning near V mmito during most of recovery rate. This process assumes that oxygen is not
limiting to oxidative phosphorylation, which we believe likely occurs in vivo, and is certainly
valid using isolated muscle fibers and a high prevailing pO2 (Crow and Kushmerick, 1982). The
reaction rate of species ADP and Pi is given as,
OxPhos
Pi
OxPhos
ADP
OxPhos
ATP R R R −=−=
(7.8)
During burst contractions, crustacean muscle metabolism is similar to that of vertebrates.
Crustacean muscle initially relies on phosphagen (AP) hydrolysis and, once the AP pool is
depleted, anaerobic glycogenolysis provides ATP for additional contractions. The
glycogenolytically powered contractions are slower and less forceful than the initial phosphagen
powered bursts (Baldwin et al ., 1999; Boyle et al ., 2003) which is consistent with the fact that in
crustacean muscle glycolytic enzyme maximal activities are lower than that of myosin ATPase
(Zammit and Newsholme, 1976). Lactate production, therefore, only occurs during prolonged
series of burst contractions.
7/27/2019 Mathematical Modeling of Transport and Reaction in Cellular and T
http://slidepdf.com/reader/full/mathematical-modeling-of-transport-and-reaction-in-cellular-and-t 212/270
192
7.3.3 Model Equations
The diffusion and reaction of ATP, ADP, AP, arginine (Arg), and Pi are modeled in the one-
dimensional system. Again the geometry extends from the surface of a mitochondrion ( x = 0) to
a distance ( x = λ/2) equal to half of the mean free spacing between mitochondria or between
clusters of mitochondria. Reactions catalyzed by AK, myosin ATPase and basal ATPase are
assumed to occur homogenously throughout the domain 0 ≤ x ≤ λ/2. The species continuity
equations for the metabolites (i) is written as,
ii
ii R
X
C D
t
C +
∂∂
=∂
∂2
2
(7.9)
where C i and Di are the concentrations and diffusion coefficients of species i (ATP, ADP, AP,
Arg, Pi) respectively and t is time. Ri denotes the sum of the reaction rates in the inter-
mitochondrial bulk space (myofibril) in which species i participates and includes the basal ATP
consumption, myosin ATPase and AK. The concentration terms in the continuity equation are
non-dimensionalized using a fixed concentration of 1mM; and the spatial term using the value of
half mean free spacing between mitochondria’s. The time and space varying concentrations of
each metabolite can be written as,
( )
( )
( )
( )
( )basal
Pi
myo
Pi
o
Pi Pi Pi
AK
Arg o
Arg Arg Arg
AK
AP
o
AP AP AP
basal
ADP
AK
ADP
myo
ADP
o
ADP ADP ADP
basal
ATP
AK
ATP
myo
ATP
o
ATP ATP ATP
R RC x
u
L
D
t
u
RC x
u
L
D
t
u
RC x
u
L
D
t
u
R R RC x
u
L
D
t
u
R R RC x
u
L
D
t
u
++∂
∂⋅=
∂∂
+∂
∂⋅=
∂
∂
+∂
∂⋅=
∂∂
+++∂
∂⋅=
∂∂
+++∂
∂⋅=
∂∂
1
1
1
1
2
2
2
2
2
2
2
2
2
2
2
2
2
2
2
(7.10)

7/27/2019 Mathematical Modeling of Transport and Reaction in Cellular and T
http://slidepdf.com/reader/full/mathematical-modeling-of-transport-and-reaction-in-cellular-and-t 213/270
193
where L is equal to λ\2 and x (= X/L) is the non-dimensionalized spatial co-ordinate. ui (=C i / C o)
is the non-dimensionalized metabolite concentrations of species i and C o of 1 mM (or 1*10-15
mmole/µm3) is used to non-dimensionalize the concentrations.
Frequency and Duty Cycle
The myosin ATPase reaction is responsible for the consumption of ATP during muscle
contractile activities. For each simulation, myosin ATPase was activated for 7 s at a frequency
of 5 Hz and 50% duty to simulate burst contraction and was then deactivated during the post-
contractile recovery period♣
.
Boundary Conditions
The boundary conditions at the mitochondrial surface at x = 0 balances the fluxes of ATP, ADP
and Pi into the bulk phase with the rates of formation and consumption at the mitochondria. No
fluxes for metabolites AP, Arg and Pi into the bulk phase occur, as they do not participate in the
mitochondrial reaction. The boundary conditions are written as,
( )
( )
0
11
11
2
2
=∂
∂=
∂
∂=
∂∂
⋅=∂
∂
⋅=∂
∂
x
u
x
u
x
u
RC L x
u
L
D
RC L x
u
L
D
Pi Arg AP
OxPhos
ADP
o
ADP ADP
OxPhos
ATP
o
ATP ATP
(7.11)
Because of symmetry no-flux boundary conditions for all the species are written at x = λ/2
♣ Frequency is expressed in Hz (cycle/s) and is characterized by its on/off cycle. The frequency of activation can be
varied through the duty cycle. Duty cycle is defined as the ratio of muscle contraction time to the total cycle time
(work + rest time). The frequency, duty cycle, and time of contraction of the model were varied to fit the
experimental data provided by Dr. S. T. Kinsey.
7/27/2019 Mathematical Modeling of Transport and Reaction in Cellular and T
http://slidepdf.com/reader/full/mathematical-modeling-of-transport-and-reaction-in-cellular-and-t 214/270
194
0=∂
∂=
∂
∂=
∂∂
=∂
∂=
∂∂
x
u
x
u
x
u
x
u
x
u Pi Arg AP ADP ATP
(7.12)
Initial Conditions
The initial conditions for the five metabolite species are written as,
ui = ui0 ∀ 0 ≤ x ≤ λ /2 t = 0
(7.13)
where ui
0
is the non-dimensional concentration of species i at time t = 0, and is given as Ci/Ci
0
,and Ci
0is the resting concentration of species i (see Appendix G).
Averaged Equations
While the solution of the model generate concentrations of metabolites varying in time and
space, the experimental measurements from Dr Kinsey’s lab obtained concentration values that
were spatially averaged across the fiber. In order to compare the model results to the
experimental data, some of the model data was mathematically volume averaged over the
domain from x = 0 to x=λ/2:
2/
),(
)(
2/
0
λ
λ
∫=
=>=<
x
x
i
i
dxt xC
t C
(7.14)
Since the time for the contraction phase is very small compared to the recovery phase,experimentally only the approximate averaged concentration to which AP is depleted can be
obtained. The duration of myosin ATPase activation was adjusted so that the decrease in [AP]
was comparable to that in the observed data. For the white small fibers and large fibers the
duration of activation used in the model is 5.7s and 4s respectively.
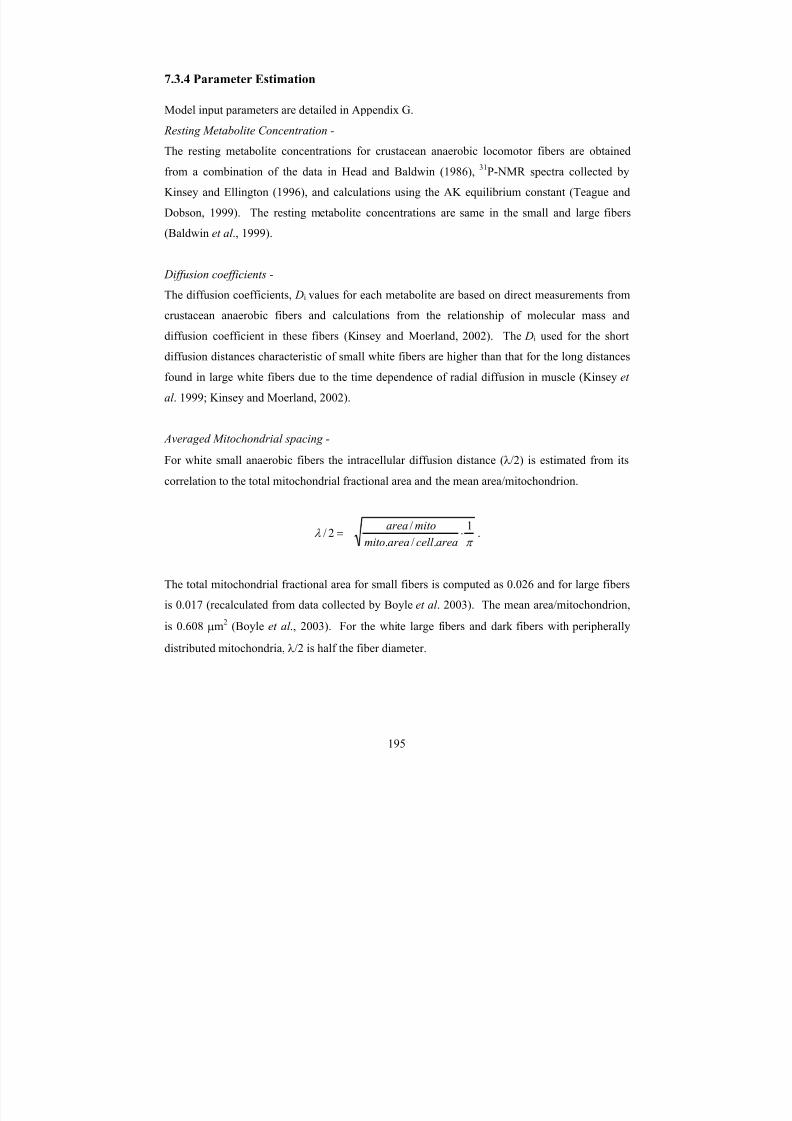
7/27/2019 Mathematical Modeling of Transport and Reaction in Cellular and T
http://slidepdf.com/reader/full/mathematical-modeling-of-transport-and-reaction-in-cellular-and-t 215/270
195
7.3.4 Parameter Estimation
Model input parameters are detailed in Appendix G.
Resting Metabolite Concentration -
The resting metabolite concentrations for crustacean anaerobic locomotor fibers are obtained
from a combination of the data in Head and Baldwin (1986),31
P-NMR spectra collected by
Kinsey and Ellington (1996), and calculations using the AK equilibrium constant (Teague and
Dobson, 1999). The resting metabolite concentrations are same in the small and large fibers
(Baldwin et al ., 1999).
Diffusion coefficients -
The diffusion coefficients, Di values for each metabolite are based on direct measurements from
crustacean anaerobic fibers and calculations from the relationship of molecular mass and
diffusion coefficient in these fibers (Kinsey and Moerland, 2002). The Di used for the short
diffusion distances characteristic of small white fibers are higher than that for the long distances
found in large white fibers due to the time dependence of radial diffusion in muscle (Kinsey et
al . 1999; Kinsey and Moerland, 2002).
Averaged Mitochondrial spacing -
For white small anaerobic fibers the intracellular diffusion distance (λ/2) is estimated from its
correlation to the total mitochondrial fractional area and the mean area/mitochondrion.
π λ
1
./.
/2/ ⋅=
areacell areamito
mitoarea.
The total mitochondrial fractional area for small fibers is computed as 0.026 and for large fibers
is 0.017 (recalculated from data collected by Boyle et al . 2003). The mean area/mitochondrion,
is 0.608 µm2
(Boyle et al ., 2003). For the white large fibers and dark fibers with peripherally
distributed mitochondria, λ/2 is half the fiber diameter.
7/27/2019 Mathematical Modeling of Transport and Reaction in Cellular and T
http://slidepdf.com/reader/full/mathematical-modeling-of-transport-and-reaction-in-cellular-and-t 216/270
196
Kinetic rate parameters -
For white anaerobic fibers the V mmito values were estimated from rates of aerobic post-contractile
phosphagen resynthesis from white muscle fibers with a mitochondrial density comparable to
blue crab light levator muscle♦. This approach was necessary due to an absence of suitable
measurements of maximal oxygen consumption or ATP production rates from isolated
crustacean anaerobic fibers, and because estimates of V mmito derived from mammalian studies
(corrected for differences in mitochondrial density) yielded AP recovery rates that were several-
fold higher than observed in the literature or presented herein. This is consistent with the fact
that PCr recovery rates in mammalian muscle (e.g., Vicini and Kushmerick, 2000) are >10-fold
higher than rates in crustacean muscle (Thébault et al ., 1987). The rates of mitochondrial ATP
production per cell volume were converted to rates of flux per mitochondrial surface area using a
mitochondrial SA:V of 6.81 and the mitochondrial fractional area data for small and large levator
fibers (Boyle et al . 2003). A K mmito value for ADP of 20 µM was used, which is within the range
for fast skeletal muscle (Meyer et al ., 1984).
AK dissociation constants are obtained from Smith and Morrison (1969), V mAKrev is taken from
Zammitt and Newsholme (1976) and V mAKfor is calculated from the AK Haldane relationship
from Smith and Morrison (1969) using an equilibrium constant for AK of 39 (Teague and
Dobson, 1999). Values for V mmyo and K mmyo for the Myosin ATPase reaction are the same as inHubley et al . (1997) for white and red fibers corresponding to our white and dark fibers
respectively. The basal reaction rate constants are computed by equating the basal rate of ATP
consumption and the AK reaction rate of ATP production in the bulk with the oxidative
phosphorylation reaction rate for ATP production in the mitochondrial surface. K mbas is initially
set to 10-15
mol/µm3, and V mbas is determined so that the concentrations of the metabolites do not
change over time.
♦ Data from small prawn anaerobic tail muscle that would not be expected to have large fibers (Thébault et al.,1987) and from isolated dogfish white muscle, which resynthesizes phosphocreatine (PCr) using only aerobic
metabolism and has a mitochondrial fractional area of about 0.01 (Curtin et al. 1997) yielded very similar estimates
for V mmito.
7/27/2019 Mathematical Modeling of Transport and Reaction in Cellular and T
http://slidepdf.com/reader/full/mathematical-modeling-of-transport-and-reaction-in-cellular-and-t 217/270
197
7.3.5 Solution Procedure
The system of species continuity equations (equation 7.10) are solved by coupling with the
boundary conditions (equation 7.11 and 7.12) and initial condition (equation 7.13) for the
different fiber types – white small, white large, and dark fibers, using a commercially available
finite element computer code FEMLAB (Comsol, Inc., Burlington, MA). The model
calculations yield temporally and spatially resolved concentrations of AP, Arg, ATP, ADP, and
Pi during a contraction-recovery cycle. The concentration of AP is spatially averaged as shown
in equation 7.14 to compare with experimental data on white muscle fiber.
The solution of the partial differential equation using FEMLAB needed careful meshing and
appropriate use of time steps. The number of mesh points used for the simulations was 120.
Further mesh points close to the mitochondrial boundary were refined to prevent steep changes
around this region. During the period of contraction, with a frequency of 5 Hz and 50 % duty,
the muscle contracted every 0.1 s and contraction was turned off for the next 0.1 s, during the
entire contractile phase of 7s. Time steps much smaller than 0.1s (e.g. 0.01s) had to be chosen to
capture this effect. However, during muscle recovery period a larger time step was chosen. The
mesh dimensions and time steps used in computations are mentioned below each of the result
figures.
7.4 Results
Experimental results from Dr Kinsey’s studies on white small (juvenile) and large (adult)
anaerobic fibers and dark aerobic fibers of blue crab have shown that stimulation of these fibers
gave rise to similar burst exercise responses. The frequency of swimming leg movement is seen
to be higher in the juvenile animals, while the duration of swimming was greater in the adult
animals. During exercise all these fibers had similar AP depletion (Figure 7.3; Kinsey et al .,
2005), glycogen depletion (Boyle et al ., 2003), and lactate accumulation (Johnson et al ., 2004)
indicating that the metabolic effects of exercise on the muscle are independent of fiber size. To
note here the experimental results reported are for only the white anaerobic fibers as these fibers
are ‘metabolically giant’.
7/27/2019 Mathematical Modeling of Transport and Reaction in Cellular and T
http://slidepdf.com/reader/full/mathematical-modeling-of-transport-and-reaction-in-cellular-and-t 218/270
198
The time course of relative changes in AP and Pi concentrations in the small and large white
fibers are obtained using NMR (Figure 7.3, Dr Kinsey’s laboratory). It can be seen that a rapid
depletion of AP and corresponding increase in Pi is observed in the small and large fibers during
contraction, and this is followed by a slow recovery that is complete in about 60 min. Despite
the large differences in body mass and fiber size between the small and large animals, the rate of
recovery of AP (Figure 7.3) is seen to be essentially the same for both muscle fiber groups .
In this study, the reaction-diffusion mathematical model is used to understand this size-
independent post-contractile AP resynthesis in the white anaerobic fibers of blue crab. The
similarity in the rate of recovery of AP is presumably due to anaerobic contributions to recovery
in the large fibers (Boyle et al ., 2003; Johnson et al ., 2004). The mathematical model allows
testing whether the need for this anaerobic recovery in the large fibers arises from diffusive
constraints on the metabolites in these fibers. The space and time resolved concentrations of the
high energy metabolites simulated in the aerobic model for the small and large white fibers are
shown in Figure 7.4 and Figure 7.5, respectively. As can be seen from the model computations,
the rate of recovery is somewhat faster in the small than in the large fibers, and there are no
significant intracellular gradients in metabolite concentrations in the small fiber, as expected
(Figure 7.4). However, in large fibers, there are mild gradients of metabolites, indicating that the
diffusive flux is fast relative to the mitochondrial ATP production (Figure 7.5). This result
seems to be inconsistent with the fact that intracellular diffusive flux is not limiting (no
significant spatial gradients) aerobic metabolism in the large fibers during post-contractile
recovery, even though metabolite diffusion in these fibers are modeled over a large diffusion
distance of 300 µm. Thus, it is believed that the relatively small differences in gradients between
the small and large fibers result most exclusively due to differences in mitochondrial density.
The model results are volume-averaged over the spatial co-ordinate to obtain a comparison
between the experimentally observed and simulated recovery rates of AP. The observed and
modeled AP recovery data for the small white fibers are shown in Figure 7.6(A). The model
seems to explain the experimental data very well. However, for large fibers, as seen in Figure
7.6 (B), the model simulated aerobic metabolism alone does not seem to account for the

7/27/2019 Mathematical Modeling of Transport and Reaction in Cellular and T
http://slidepdf.com/reader/full/mathematical-modeling-of-transport-and-reaction-in-cellular-and-t 219/270
199
relatively high observed rate of post-contractile AP recovery. Thus, anaerobic metabolism
appears to be a necessity to account for AP recovery in these large fibers.
So now that we know that the recovery in the large fibers is not substantially constrained by
diffusion, then how close are these fibers to being limited by intracellular diffusive flux? Figure
7.7 shows the effect of incremental increase in the rate of the mitochondrial boundary reaction.
It can be seen that doubling the Vmmito leads to the formation of only slightly steeper
concentration gradients, which means that there is a minimally increased control of aerobic flux
by intracellular diffusion. However, the concentration gradients grow more substantial as Vmmito
is increased further by 100 times.
Figure 7. 3 Relative changes in AP and Pi concentrations in small (filled symbols) and large (open symbols)
light levator fibers during a contraction-recovery cycle. [N≥ 5 for every point]. (Experimental results from
Dr Kinsey’s Laboratory, University of North Carolina, Wilmington)
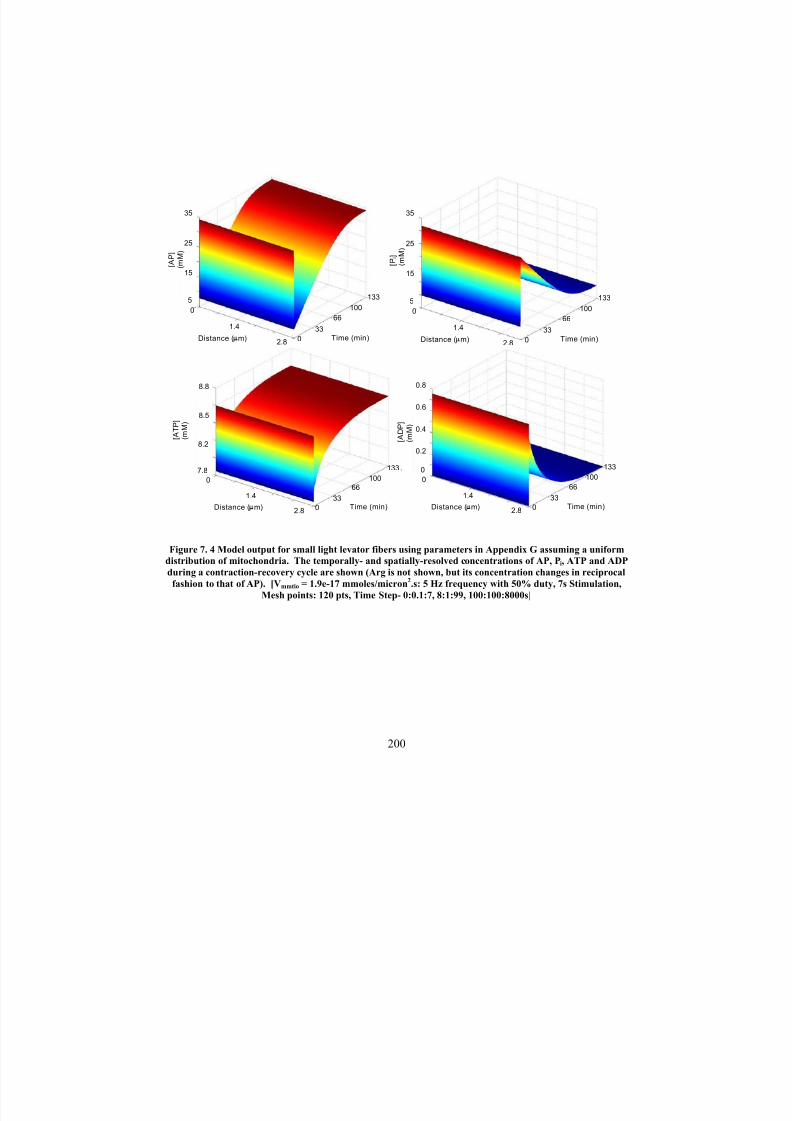
7/27/2019 Mathematical Modeling of Transport and Reaction in Cellular and T
http://slidepdf.com/reader/full/mathematical-modeling-of-transport-and-reaction-in-cellular-and-t 220/270
200
Figure 7. 4 Model output for small light levator fibers using parameters in Appendix G assuming a uniform
distribution of mitochondria. The temporally- and spatially-resolved concentrations of AP, Pi, ATP and ADP
during a contraction-recovery cycle are shown (Arg is not shown, but its concentration changes in reciprocal
fashion to that of AP). [Vmmtio = 1.9e-17 mmoles/micron2.s: 5 Hz frequency with 50% duty, 7s Stimulation,
Mesh points: 120 pts, Time Step- 0:0.1:7, 8:1:99, 100:100:8000s]
33 66
100
133
0 2.8
5
35
1.4
0
25
15 [ A P ]
( m M )
Distance (µm) Time (min)33
66 100
133
0 2.8
5
35
1.4
0
25
15
[ P i ]
( m M )
Distance (µm) Time (min)
33
66
100
133
0 2.8
7.8
8.8
1.4
0
8.5
8.2 [ A T P ]
( m M )
Distance (µm) Time (min)
33 66
100
133
0 2.8
0
0.8
1.4
0
0.6
0.4
[ A D P ]
( m M )
Distance (µm) Time (min)
0.2

7/27/2019 Mathematical Modeling of Transport and Reaction in Cellular and T
http://slidepdf.com/reader/full/mathematical-modeling-of-transport-and-reaction-in-cellular-and-t 221/270
201
Figure 7. 5 Model output for large light levator fibers using parameters in Appendix G assuming only
subsarcolemmal mitochondria. The temporally- and spatially-resolved concentrations of AP, Pi, ATP and
ADP during a contraction-recovery cycle are shown (Arg is not shown, but its concentration changes in
reciprocal fashion to that of AP). Arrows indicate the mild spatial gradients seen in the concentration 3-
dimensional profiles. [Vmmtio = 1.67e-15 mmoles/micron2.s: 5 Hz frequency with 50% duty, 7s Stimulation,
Mesh points: 120 pts, Time Step - 0:0.1:7, 8:1:99, 100:100:8000s]
33 66
100
133
0 300
0
150
0
20
10 [ A P ]
( m M )
Distance (µm) Time (min)
30
33 66
100 133
0300
0
150
0
40
20 [ P i ]
( m M )
Distance (µm) Time (min)
33 66
100
133
0 300
6
150
0
9
7.5
[ A T P ]
( m M )
Distance (µm) Time (min)
33 66
100 133
0 300
0
150
0
2.5
1.3
[ A D P ]
( m M )
Distance (µm) Time (min)

7/27/2019 Mathematical Modeling of Transport and Reaction in Cellular and T
http://slidepdf.com/reader/full/mathematical-modeling-of-transport-and-reaction-in-cellular-and-t 222/270
202
Figure 7. 6 Measured AP recovery (symbols) compared to the volume averaged model of AP recovery (solid
line) in small (top) and large (bottom) fibers. The measured AP data has been normalized to a resting
concentration of 34.3 mM to coincide with that of the model. In the model, the myosin ATPase was activated
long enough to cause a decrease in AP that was comparable to the measured data. The dotted line indicates
the resting concentration. [Small: Vmmtio = 1.9e-17 mmoles/micron2.s, 5 Hz frequency with 50% duty, 5.7s
Stimulation; Large: Vmmtio = 1.67e-15 mmoles/micron2.s, 5 Hz frequency with 50% duty, 4s Stimulation]

7/27/2019 Mathematical Modeling of Transport and Reaction in Cellular and T
http://slidepdf.com/reader/full/mathematical-modeling-of-transport-and-reaction-in-cellular-and-t 223/270
203
It is clear that the metabolic recovery rate is directly proportional to the Vmmito. It is also seen
(Figure 7.7) that only when unrealistically high rates of Vmmito are used the steeper concentration
gradients are observed, indicating that diffusion is limiting the rate of recovery in these muscle
cells. As can be seen from the averaged plots the mitochondrial reaction rate used in the model
fits the data well (Figure 7.6) and is considerably below the reaction rate which would lead to
substantial diffusion limitations to aerobic flux in large fibers (Figure 7.7).
In the model computations for large white fibers the mitochondria were assumed to be
distributed in the periphery of the fiber (subsarcolemmal). In order to assess the impact of this
reorganization of mitochondria on muscle function as the animal grows from juvenile to adult,
we also ran our model for uniform distribution of mitochondria in these fibers similar to that seen
in small white fibers from juvenile crabs. The average λ/2 value was computed by using a
similar relationship between the mitochondrial fractional area and mean area/mitochondrion and
obtained to be 3.4 µm. This value is slightly higher from that obtained from small fibers (see
Appendix G) but nearly two orders of magnitude less than that used for subsarcolemmal
distribution used in the large fibers. Despite the large difference in diffusion distances of
metabolites, the rate of metabolic recovery, assuming a uniform distribution of mitochondria in
large fibers, was almost identical to that shown in Figure 7.5 (slightly higher), and no
concentration gradients were observed (data not shown). So this result is consistent with the factthat there exists very limited control of metabolic flux by intracellular diffusion.
The model also computes the concentration profiles of metabolites in the dark aerobic fibers of
the blue crab as shown in Figure 7.8. These fibers being aerobic rely on the supply of ATP by
oxidative phosphorylation at the mitochondrial surface, and sustain long time burst exercise
contractions. The model is run for a stimulation phase of 30s at 1 Hz frequency and 50% duty
cycle. Mitochondrial clusters at the periphery of the segments of dark fibers seem to give rise to
significant ATP production rates which are higher than the rates of diffusive flux. This can be
observed as spatial gradients seen in the 3-dimensional concentration plots of ATP, ADP, and
AP. After exercise burst, these dark fibers follow aerobic recovery. As can be seen from the
recovery rates, the metabolites recover in less than 4 minutes, as compared to more than 100
minutes in the white anaerobic fibers.

7/27/2019 Mathematical Modeling of Transport and Reaction in Cellular and T
http://slidepdf.com/reader/full/mathematical-modeling-of-transport-and-reaction-in-cellular-and-t 224/270
204
Thus the principal finding of this study includes -
1. Model predicted rate of aerobic metabolism is insufficient to account for the relatively high
rate of metabolite recovery in the large fibers, which is consistent with the hypothesis that
anaerobic metabolism contributes to AP recovery to a greater extent.
2. Intracellular diffusive flux do not appear to limit metabolic recovery in large fibers, despite
the fact that diffusion occurs over hundreds of microns. The fiber seems to have aerobic
capacity that is considerably below the magnitude that would lead to substantial diffusion
limitations (Figure 7.7).
3. Complete metabolite recovery in aerobic dark fibers occurs in a few minutes.
7.5 Discussion
In the previous work by Kinsey and coworkers they have discussed the fiber size-dependence of
post-exercise glycogen depletion (Boyle et al ., 2003) and lactate production (Johnson et al .,
2004) in crustacean muscle and have attributed this observed pattern to (a) long intracellular
diffusion distances and/or (b) low SA:V of the large levator anaerobic fibers. While all these
studies have shown that the post-contractile recovery is accelerated by anaerobic metabolism, the
present study to our knowledge is the first quantitative demonstration in crustacean muscle of a
metabolic recovery process (AP resynthesis) that is faster in large fibers as a result of anaerobic
contributions. The model is used in light of experimental observations to explain the changes in
metabolic capacity and organization associated with increasing cell size.

7/27/2019 Mathematical Modeling of Transport and Reaction in Cellular and T
http://slidepdf.com/reader/full/mathematical-modeling-of-transport-and-reaction-in-cellular-and-t 225/270
205
Figure 7. 7 The effect of increasing the rate of mitochondrial ATP production in large fibers on the temporal
and spatial profiles of AP (left panels) and ATP (right panels) concentration. All parameters are the same as
in Figure 7.5, except that the V mmito has been increased over the value used in Figure 7.5 by 2-fold (A), 10-foldand (B), and 100-fold (C). [Vmmtio = 1.67e-15 mmoles/micron
2.s: 5 Hz frequency with 50% duty, 7s
Stimulation, Mesh points: 120 pts, Time Step - 0:0.1:7, 8:1:99, 100:100:8000s]
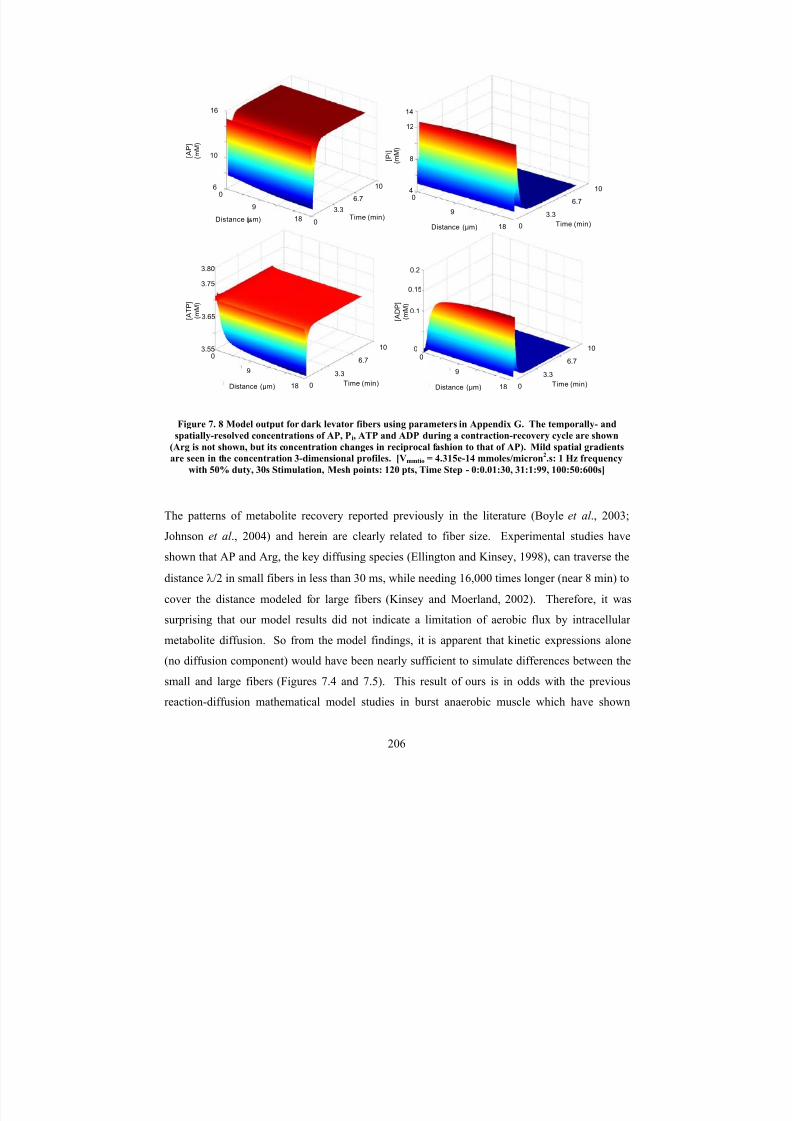
7/27/2019 Mathematical Modeling of Transport and Reaction in Cellular and T
http://slidepdf.com/reader/full/mathematical-modeling-of-transport-and-reaction-in-cellular-and-t 226/270
206
Figure 7. 8 Model output for dark levator fibers using parameters in Appendix G. The temporally- and
spatially-resolved concentrations of AP, Pi, ATP and ADP during a contraction-recovery cycle are shown
(Arg is not shown, but its concentration changes in reciprocal fashion to that of AP). Mild spatial gradients
are seen in the concentration 3-dimensional profiles. [Vmmtio = 4.315e-14 mmoles/micron2.s: 1 Hz frequency
with 50% duty, 30s Stimulation, Mesh points: 120 pts, Time Step - 0:0.01:30, 31:1:99, 100:50:600s]
The patterns of metabolite recovery reported previously in the literature (Boyle et al ., 2003;
Johnson et al ., 2004) and herein are clearly related to fiber size. Experimental studies have
shown that AP and Arg, the key diffusing species (Ellington and Kinsey, 1998), can traverse the
distance λ/2 in small fibers in less than 30 ms, while needing 16,000 times longer (near 8 min) to
cover the distance modeled for large fibers (Kinsey and Moerland, 2002). Therefore, it was
surprising that our model results did not indicate a limitation of aerobic flux by intracellular
metabolite diffusion. So from the model findings, it is apparent that kinetic expressions alone
(no diffusion component) would have been nearly sufficient to simulate differences between the
small and large fibers (Figures 7.4 and 7.5). This result of ours is in odds with the previous
reaction-diffusion mathematical model studies in burst anaerobic muscle which have shown
3.3
6.7
10
0
[ A P ]
( m M )
18
6
9 0
Distance (µm) Time (min)
16
10
0
3.3
6.7
10
Time (min)Distance (µm)
0
9
18
[ P i ]
( m M
)
12
8
4
14
0
3.3
6.7
10
Time (min)Distance (µm)
0
9
18
[ A T P ]
( m M )
3.75
3.65
3.55
3.80
0
3.3
6.7
10
Time (min)Distance (µm)
0
9
18
[ A D P ]
( m M )
0.15
0.1
0
0.2

7/27/2019 Mathematical Modeling of Transport and Reaction in Cellular and T
http://slidepdf.com/reader/full/mathematical-modeling-of-transport-and-reaction-in-cellular-and-t 227/270
207
substantial concentration gradients for high energy phosphate metabolites. Hubley et al ., 1997
have shown spatial gradients for PCr and free energy of ATP hydrolysis in fish white muscle
during contraction. Mainwood and Rakusan, 1982 have likewise found dramatic concentration
gradients for AP and free energy of ATP hydrolysis in blue crab light levator muscle. However,
to be noted here, both these models assume high rates of steady state ATP demand and perfect
buffering of high-energy phosphate concentrations at the mitochondrial membrane. This means
that the rate of ATP supply at the mitochondria is always relatively high compared to the rates of
diffusive flux. In contrast, the present model uses a simple kinetic expression for the
mitochondrial boundary reaction producing ATP at reasonable rates (instead of constant supply
at the mitochondrial surface). Furthermore, no additional ATP demand (as in previous models)
was applied during the recovery beyond the thermodynamic drive to restore the resting steady-
state metabolite concentrations (Basal ATPase rate).
However, it could also be argued here that we have underestimated the V mmito and post-
contractile ATP demand, and hence have eventually misjudged the effects of diffusion. It should
be noted, however, that the model results for AP recovery paralleled our observations in the
small fibers (Figure 7.6), which rely exclusively on aerobic metabolism for recovery (Boyle et
al ., 2003; Johnson et al ., 2004), and the low V mmito values were consistent with observations that
complete aerobic recovery from exercise in blue crabs occurs over many hours (Booth and
McMahon, 1985; Milligan et al ., 1989; Henry et al ., 1994; Boyle et al . 2003; Johnson et al .,
2004). Our results on varying Vmmito (Figure 7.7) are also consistent with the generalized
analysis of diffusion limitation described by Weisz (1973), which relates the observed rate of the
catalytic process to rates of diffusive flux. Applying this approach to the present case we can
conclude that even if V mmito and post-contractile ATPase rates were underestimated, the observed
rate of AP recovery is simply too slow to be limited by diffusive flux (Weisz, 1973).
As can be seen the findings in the present study are somewhat paradoxical. If it is assumed that a
relatively rapid post-contractile recovery in burst muscle is beneficial, which is apparently the
case since large fibers use anaerobic metabolism to speed up recovery, and if intracellular
diffusive flux does not limit recovery, then why do the large fibers not simply increase the
mitochondrial density to accelerate recovery rather than relying on anaerobic processes that put

7/27/2019 Mathematical Modeling of Transport and Reaction in Cellular and T
http://slidepdf.com/reader/full/mathematical-modeling-of-transport-and-reaction-in-cellular-and-t 228/270
208
them further in oxygen debt? It is clear from our model study on varying the maximal reaction
rate (Vmmtio) of the mitochondria (Figure 7.7), that doubling the mitochondrial density would lead
to a near doubling of recovery rate, with only mild limitations by diffusion. So, we propose that
in blue crabs the low SA:V associated with large fiber size is more important in limiting aerobic
metabolism and/or driving metabolic design than is intracellular metabolite diffusion. The most
compelling evidence in support of this argument is the dramatic shift in the distribution of
mitochondria towards the periphery of the fiber as the light levator muscle fibers grow (Boyle et
al ., 2003) into large ones. This distributional change places more mitochondria at the
sarcolemmal membrane near the source of O2 at the expense of increased intracellular diffusion
distances. In our model analysis, there was a very slight advantage associated with a uniform,
instead of subsarcolemmal, distribution of mitochondria in the large fibers (data not shown).
However, the fact that the developmental shift in mitochondria occurs anyway indicating that O2
flux (which was not included in the model) drives mitochondrial distribution more than
intracellular diffusive flux. This view has been suggested previously to explain mitochondrial
clustering at the sarcolemma in non-giant mammalian (Mainwood and Rakusan, 1982) and
crustacean muscle (Stokes and Josephson, 1992).
In addition to the above argument, the partial pressure of oxygen (PO2) in crustacean blood
(including blue crabs) is low (Gannon and Wheatly, 1995; Forgue et al ., 2001) which leads to
shallow PO2 gradients across the sarcolemma. These shallow oxygen gradients when coupled to
low SA:V of large fibers would lead to low rates of O2 flux into the muscle fiber. Additionally,
the lack of myoglobin (Mb) in the light levator muscle amplifies this effect , since Mb-less fibers
require a higher extracellular PO2 to support a given rate of O2 consumption compared to
muscles with Mb (Groebe and Thews, 1990). To add here, recent observations in isolated
Xenopus laevis skeletal muscle fibers, which are also relatively large and lack Mb, that low
intracellular PO2 limits the rate of NAD(P)H oxidation by the electron transport system during
steady-state contraction (Hogan et al ., 2004). Further, the modeled differences between the
recovery rate in small and large fibers are modest, due to the relatively small differences in their
oxidative potentials (Figure 7.4 and 7.5; Appendix G note the Vmmito), but the measured
differences in post-contractile lactate production among these size classes are dramatic; far
greater than would be necessary to accelerate AP resynthesis by the relatively small amount

7/27/2019 Mathematical Modeling of Transport and Reaction in Cellular and T
http://slidepdf.com/reader/full/mathematical-modeling-of-transport-and-reaction-in-cellular-and-t 229/270
209
indicated in Figure 7.6 (Johnson et al . 2004). If fiber SA:V limits aerobic metabolism then the
size-dependence of aerobic recovery may be much more substantial than shown in Figures 7.4,
7.5 and 7.6, which would explain the strong size-dependence of post-contractile lactate
production.
What then are the potential advantages associated with large muscle fibers? Rome and
Lindsbelt, 1998 have proposed that burst contractile muscle composed of relatively few large
fibers may yield a greater percentage of total muscle volume that is devoted to myofibrils, and
therefore improve contractile force, compared to muscle with a much larger number of small
fibers. Johnston et al . (2003; 2004) have also proposed that in certain cold-water fish groups
white muscle fibers attain a size that is just below that which would be diffusion-limited in order
to minimize sarcolemmal surface area over which ionic gradients must be maintained, thus
lowering metabolic rates. A similar argument could be made for blue crab anaerobic fibers, with
the additional consideration that a low mitochondrial content may also constitute an energy
saving strategy to avoid the costs of mitochondrial biogenesis and the maintenance of
electrochemical gradients across the inner membrane. Forgue et al . (2001) have made
complimentary arguments that the low blood PO2 in crustaceans limits resting metabolic rate to
reduce costs during periods of inactivity. These proposed energy saving measures are linked; if
the capacity to produce ATP is strategically lowered, then there is no negative consequence to
the low SA:V associated with large fibers. Similarly, if SA:V is lowered, then there is no further
consequence to lowering aerobic capacity, since O2 flux would limit mitochondrial respiration in
large fibers anyways. It should be noted that even the small fibers in the present study are
relatively large and have a low mitochondrial content compared to anaerobic fibers from most
animals, thus benefiting from this putative energy saving strategy.
The implication of the above is that the benefits of a rapid aerobic recovery following a burst
contraction are outweighed by long-term energetic savings. Blue crabs have large chelipeds and
highly effective defensive behavior, and they also have the capacity to rapidly bury themselves
to avoid predators. These characteristics may obviate the need for additional high-force
contractions following an initial bout of burst swimming, and may explain why the juvenile
crabs do not also employ anaerobic metabolism to accelerate recovery. Large fibers might be

7/27/2019 Mathematical Modeling of Transport and Reaction in Cellular and T
http://slidepdf.com/reader/full/mathematical-modeling-of-transport-and-reaction-in-cellular-and-t 230/270
210
particularly important in reducing metabolic costs in cases where anaerobic muscle constitutes a
large fraction of the total body mass and is used infrequently, but must maintain a polarized
sarcolemma at all times. Examples may include lobster abdominal muscle that is used for tail-
flip escape maneuvers, or fish white muscle in species that infrequently undergo burst
swimming. At present, however, the benefits of large fiber size, if any, in crustaceans and other
groups are not known.
7.6 Future Recommendations
This present work primarily deals with improving on the previous work by Hubley et al ., 1997,
utilizing a simple geometrical arrangement of the region surrounding a single mitochondrion,
and incorporating the detailed description of reactions at the mitochondrial surface and in the
sarcoplasmic region near the mitochondrion (the myofibril). This model is used to explain the
possible reasons for recruitment of anaerobic recovery processes in large adult white fibers of
blue crab. The most important conclusion is that intracellular diffusive flux of metabolites even
over the modeled large diffusion distances does not seem to restrict high energy phosphate
recovery during post-exercise period. This is because of the low ATP demand-ATP supply
region this muscle fiber is in. So we propose the possible reason for anaerobic recovery in these
large fibers is attributed to the mitochondrial distribution and low SA:V of the muscle fiber
limiting oxygen flux into the fiber, and consequently ATP production by oxidative
phosphorylation.
Therefore, in order to quantify the experimental results for the large white fibers the simple
mitochondria ADP dependent ATP production needs to be modified. We think this can be done
by incorporating the effects of extracellular O2 concentration along with the ADP dependence on
mitochondrial ATP production reaction. An oxygen flux balance accounting for its diffusion and
consumption by various enzyme catalyzed processes in the Tri-carboxylic acid (TCA) cycle and
Electron Transport Chain (ETC) in the mitochondria, as proposed actively in the works of
Korzeniewski, 2003 and Beard, 2005 needs to be obtained.
7/27/2019 Mathematical Modeling of Transport and Reaction in Cellular and T
http://slidepdf.com/reader/full/mathematical-modeling-of-transport-and-reaction-in-cellular-and-t 231/270
211
The subsequent models would utilize the reaction kinetics from these developed models, but
should incorporate the entire muscle fiber (with a one-dimensional radial coordinate system)
including a multi-domain (myofibril) system with sarcoplasmic reticulum (SR) barriers. This SR
has been believed to impose considerable restrictions to metabolite transport (Kinsey and
Moerland, 2002). This could be further extended to a 2-dimensional system (axial and radial) to
account for anisotropic diffusion, mitochondrial distribution, and variation of SR barrier
properties.
While in the current study with anaerobic blue crab giant muscle fibers, intracellular diffusive
fluxes of high-energy phosphate metabolites did not appear to exert substantial control over the
rate of aerobic metabolism, there may be several other cell types where diffusion is limiting.
These cell types likely include systems with relatively high rates of ATP production and distant
sites of ATP utilization, such as in some muscle fibers with a higher aerobic capacity than
examined here (Meyer et al . 1984; Stokes and Josephson, 1992; Vendelin et al ., 2000; Saks et
al ., 2003; Suarez, 2003) or in the flagellum of spermatozoa, which has been the subject of many
reaction-diffusion analyses (e.g., Nevo and Rikmenspoel, 1969; Tombes and Shapiro, 1985; Van
Dorsten et al ., 1997; Ellington and Kinsey, 1998). Even in cases where neither intracellular
metabolite diffusion nor sarcolemmal O2 flux limit aerobic metabolism per se, the interaction
between the two, i.e. the diffusive processes and ATP demand, has certainly shaped the evolution
of cellular design. The model developed in this study can be extended for these cell types.
Moreover, it is believed that in certain muscle types the presence of myoglobin, a small
intracellular oxygen-binding heme protein, accelerates oxygen delivery to the mitochondria. The
current model could be extended for these muscle types to incorporate measurements of
myoglobin and oxygen consumption rate in the muscle fibers. This can be done by using the
facilitated diffusion mechanism and using suitable boundary conditions and reaction kinetics
proposed before for CK in skeletal muscle systems (Meyer et al ., 1984).
Summarizing, the complete reaction-diffusion analysis provides insight into the role of cellular
structure in energy metabolism of muscle. Practical motivations of this project come from the
interest in utilizing the model for quantitative evaluation of metabolic pathways and regulatory
mechanisms under normal and abnormal condition of the muscle, and in turn, offer a logical

7/27/2019 Mathematical Modeling of Transport and Reaction in Cellular and T
http://slidepdf.com/reader/full/mathematical-modeling-of-transport-and-reaction-in-cellular-and-t 232/270
212
basis for assessing the progress of disease processes, thus evaluating possible treatments. To be
also noted here, the model approach developed has broader impact and significance, as it
provides a general applicable framework that could be extended for the analysis of complex
spatial and temporal process in other cells and tissues.

7/27/2019 Mathematical Modeling of Transport and Reaction in Cellular and T
http://slidepdf.com/reader/full/mathematical-modeling-of-transport-and-reaction-in-cellular-and-t 233/270
213
CHAPTER 8
SUMMARY
Ex vivo engineering of living tissue is a rapidly developing area with vast potential to impact
significantly a wide-range of biomedical applications (Martin et al ., 2004). Bioreactor cultures
have been shown to be essential for improving the functional properties of these tissue
engineered constructs. However, the major obstacles to the generation of functional tissues in
these reactors for wide-spread clinical use is the limited understanding of the regulatory role of
specific physicochemical culture parameters on tissue development. Not only is the cellular
environment within and around the constructs ill defined, in addition, the complex cellular responses to this environment are not fully understood. In this context, computational methods
can serve as a valuable tool to facilitate better understanding of the micro and macro
environmental changes of biochemical factors as well as reveal the fundamental mechanisms of
cell function in a 3-dimensional environment in culture units. This study has the potential to
improve tissue engineered functional constructs.
In this context, in the present work, a general modeling framework for hematopoietic cell tissue
engineering, human mesenchymal stem cell tissue engineering and cartilage tissue engineering
was proposed and subsequently elaborated. The aim of this approach was to provide an
integration of interactions between the biochemical factors and the cell behavior, which are
believed to affect each other in a mutual iterative way. This chapter summarizes the findings of
all the previous chapters of the work presented in this dissertation.

7/27/2019 Mathematical Modeling of Transport and Reaction in Cellular and T
http://slidepdf.com/reader/full/mathematical-modeling-of-transport-and-reaction-in-cellular-and-t 234/270
214
Chapters 2, 3 and 4 of this dissertation focused on the study of hematopoietic cell expansion in
bioreactors. Chapter 2 provided a detailed biological background towards the understanding of
hematopoiesis process, discussed the various culture systems currently being used for expansion
of these types of cells, and also the various environmental factors that have been found to be
important for these cell types in different culture systems. In the model study developed in this
work ex vivo cell expansion in perfusion reactor systems are considered. The later part of
Chapter 2 summarized the various mathematical models that have been developed in literature to
describe hematopoietic process in vivo in the bone marrow and ex vivo in bioreactors. The
mathematical approach used for the study of cell growth characteristics and environmental
changes in this dissertation, is the method of volume averaging . This approach has been
carefully outlined with a simple example at the end of Chapter 2.
Chapter 3 discusses the dynamic mathematical model developed in the present study to
understand the expansion of granulocyte progenitors in the hematopoietic process in a 3-
dimensional perfusion bioreactor system. Molar balances describing oxygen consumption and
cell growth were written to describe the physiological process in the reactor. The method of
volume averaging (Whitaker, 1999) was used to compute the effective reaction and transport
terms accounting for the effects of the local 3-dimensional geometry. All the model parameters
were obtained from literature. Spatial and temporal variations of oxygen concentration and
granulocyte progenitor cell density are obtained in the bioreactor. The maximum cell volume
fraction reached when oxygen is depleted in the cell layer at 15 days is nearly 0.63,
corresponding to a cell density of 2.25 *108
cells/ml. The model results illustrate the effects of
oxygen mass transfer restrictions in the matrix to the growth of these cells. Moreover, the
substrate inhibition kinetics used for cell growth has been shown to lead to complex effects with
respect to the roles of oxygen concentration and its supply by convection and diffusion on cell
growth.
Additionally, the model provides quantitative estimates of the oxygen consumption for growth
and for metabolism, and this information on oxygen consumption and cell growth was further
used to estimate the roles of key bioreactor design parameters, including flow rates and liquid
depth, and to optimize the reactor performance. Variation in the height of the liquid layer above

7/27/2019 Mathematical Modeling of Transport and Reaction in Cellular and T
http://slidepdf.com/reader/full/mathematical-modeling-of-transport-and-reaction-in-cellular-and-t 235/270
215
the cell matrix where nutrient supply is introduced affected the relative and absolute amounts of
oxygen supply by hydrodynamic flow and by diffusion across a gas permeable FEP membrane.
However, due to high mass transfer restrictions of the FEP membrane, the delivery of oxygen by
hydrodynamic flow always exceeded that by membrane transport, thus leading to larger growth
rates at higher liquid layer heights. A maximum growth rate occurs at a specific flow rate.
Lower residence times, i.e. higher flow rates, supplied larger amounts of oxygen to the cell layer
of the bioreactor. Larger amounts of the oxygen were then available for cell growth and
metabolic consumption, which produced a larger number of progenitor cells. However, an
optimal growth rate at a specific flow rate was found whereby at lower flows the growth was
transport limited by oxygen supply and at higher flows the growth was limited by kinetic
inhibition. The spatial pattern of delivery by convection was also found to play a significant role
increasing the rate of cell growth. The model results clearly indicate that variation of the oxygen
concentration in the inlet feed with time may lead to enhanced cell growth.
In order to rationally optimize ex vivo expansion of hematopoietic cells, there was a need to
improve our understanding of the complex dynamics of hematopoiesis by incorporating other
important reactor input biochemical factors such as glucose and lactate. Additionally, as
mentioned these culture systems are different from other culture systems in terms of multiple
cells coexisting in the culture at the same time which makes it essential to go beyond modeling a
single cell type. The model incorporates the effects of local 3-dimensional geometry by deriving
the effective diffusivities and effective rate expressions used for solving the effect of oxygen
delivery to the cells. However, the volume averaged expressions do not include the effect of the
local 3-dimensional cell-cell interactions and ECM environment, an important factor in the 3-
dimensional structure that affects cell proliferation.
The model in Chapter 3 was improved in Chapter 4 by addition of glucose and lactate to thematerial balances along with oxygen. The idea of co-existence of more than one cell type in
culture was studied by the use of a simple two cell-group model. The cell types were separated
on the basis of large differences in their metabolic lactate production rates. The dynamic model
was developed for a well-mixed system. This was done by spatially averaging the
concentrations of the various reacting species in the reactor components of the perfusion
7/27/2019 Mathematical Modeling of Transport and Reaction in Cellular and T
http://slidepdf.com/reader/full/mathematical-modeling-of-transport-and-reaction-in-cellular-and-t 236/270
216
bioreactor. The model showed that reactor systems can sustain larger cell growth rates, while
maintaining the glucose and oxygen concentration high enough and also facilitate efficient
removal of lactate.
As a first step towards model improvement, the dynamic model developed in Chapter 4 should
be extended to study growth and metabolism in the perfusion reactor (Chapter 3) by
incorporating the effects of mass transport due to diffusion and flow and computing the spatial
distribution of the nutrients and products. The model also needs to be improved to account for
the existence of a complete lineage of hematopoietic cells or multi-lineages in cultures. The
major obstacle to this model extension is the limited availability of experimental data on
metabolic and growth kinetics for cells in this hematopoietic process. Moreover, in future for the
determination of improved delivery of nutrients and better mass transfer conditions in the
perfusion bioreactor system, the model needs to be analyzed for different matrix geometries to
study the formers effect on cell growth. Finally, in order to completely model a 3-dimensional
system, analyzing the variation in diffusion coefficient of metabolites due to restrictions and/or
consumption due to cell growth is not enough. It is essential to account for the local 3-
dimensional cell-cell and cell-ECM interactions. In order to address the effects of cell-ECM
interactions a systematic model describing ECM production by the cells and change in the cell
microenvironment due to presence of ECM needs to be developed. To do so the current model
hints at the necessity of systematic quantitative information of ECM formation by various cell
types in culture. The information obtained from experiments, used suitably in these models
would help to improve our understanding of hematopoietic cell growth in ex vivo culture
systems.
In a broader sense, the developed transport-reaction model framework is very general, and could
be easily applied for any cell type, by using suitable kinetic parameters, to describe cell growth,
nutrient depletion and product formation in 2-dimensional or 3-dimensional ex vivo culture
systems. This was illustrated in the study in Chapter 5. In this study, experimental results on
hMSC metabolism and growth were available for cell cultures in 3-dimensional PET matrices
placed in two different culture units – the perfusion bioreactor system and the static culture
system. Mathematical models describing the transport and consumption of oxygen for
7/27/2019 Mathematical Modeling of Transport and Reaction in Cellular and T
http://slidepdf.com/reader/full/mathematical-modeling-of-transport-and-reaction-in-cellular-and-t 237/270
217
experimentally determined cell growth were written for the two culture systems. The model
simulations on spatial and temporal oxygen distribution were used to address the role of oxygen
distribution on cell growth and metabolic processes. Thus, this combination of model and
experimental result analysis in our study demonstrates the effects of perfusion conditions on
intrinsic cellular events and the significant role of perfusion culture environment to sustain the
development of engineered tissue constructs.
The next major application of mathematical modeling in tissue engineering was illustrated by
studying the development of cartilage constructs in reactors described in Chapter 6 of this
dissertation. The limited repair capacity of the articular cartilage along with its simple tissue
structure, and available experimental data enabled the development of a detailed structured
computational model for this tissue engineering application. The study developed a dynamic
mathematical model of cartilage tissue formation in a hollow fiber bioreactor unit and compared
the model results with available experimental data obtained by in situ NMR experiments
(reported in the work of Potter et al ., 1998). In this approach, the volume averaging method was
combined with elements of a moving boundary approach in order to account for the radial
growth of cells from the surface of the hollow fibers. Model simulations of cell and extracellular
matrix formation as well as changes in the NMR spin-lattice relaxation time constant and water
diffusion coefficient with time were compared to experimental results in hollow fiber bioreactor
over four weeks of culture. Although several of the model parameters were fit to the
experimental data, the model trends showed good agreement with the data. A model sensitivity
analysis was performed to indicate the important key parameters effecting cell behavior in the
reactor. The model was successfully utilized to establish relationships between the
environmental factors, such as nutrients, within and around the constructs to the processes
occurring at the cellular level, such as chondrocyte cell maturation, proliferation and ECM
synthesis.
These tissue engineering model development applications have considered the cellular metabolic
and growth processes in terms of net kinetic expressions linked to changes in macroscopic
environmental parameters. In order to understand and incorporate a complete model framework
understanding of processes at the cellular level is necessary. To do so, muscle cell was chosen to

7/27/2019 Mathematical Modeling of Transport and Reaction in Cellular and T
http://slidepdf.com/reader/full/mathematical-modeling-of-transport-and-reaction-in-cellular-and-t 238/270
218
study metabolic processes in terms of production, transport, conversion and utilization of
metabolite species. It is known that in a muscle cell many cellular compartments, chemical
species, enzymes, biochemical reactions, metabolic pathways, and control mechanisms interact
with each other simultaneously to maintain homeostasis of the most important energy delivering
metabolite, ATP. The proposed reaction-diffusion model of phosphorous metabolites involved
in various metabolic pathways in the muscle described in Chapter 7 was shown to provide a
suitable framework for the study of diffusion, reaction and metabolic organization on the control
of muscle metabolism. In this study of crustacean blue crabs the model results suggest that in the
interaction between mitochondrial ATP production rates, ATP consumption rates and diffusion
distances yield a system that is not particularly close to being limited by intracellular metabolite
diffusion. We concluded that the fiber SA:V and oxygen flux exert more control than
intracellular diffusive flux over the developmental changes in metabolic organization and
metabolic fluxes that characterize these muscles. This metabolic study is intended to answer the
basic questions on the role of metabolite spatial and temporal distribution due to transport and
reaction on cell structure, and vice versa, and the current model is a first step towards this overall
goal.
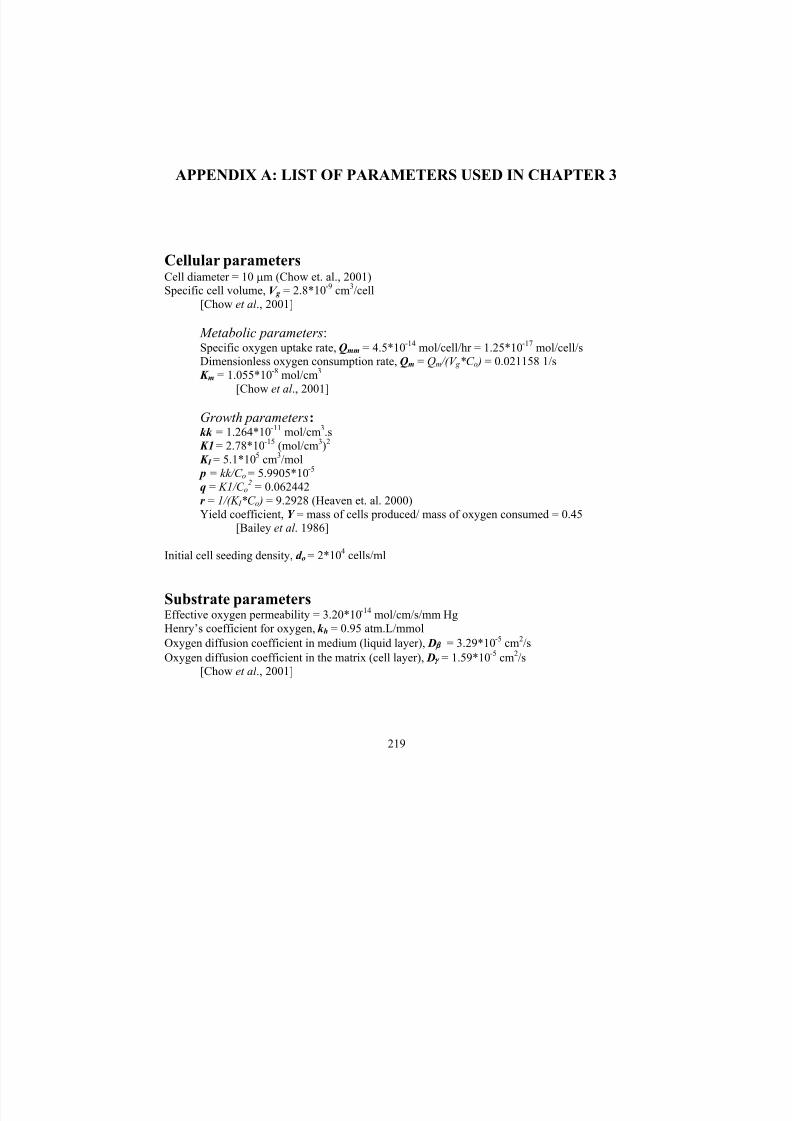
7/27/2019 Mathematical Modeling of Transport and Reaction in Cellular and T
http://slidepdf.com/reader/full/mathematical-modeling-of-transport-and-reaction-in-cellular-and-t 239/270
219
APPENDIX A: LIST OF PARAMETERS USED IN CHAPTER 3
Cellular parametersCell diameter = 10 µm (Chow et. al., 2001)Specific cell volume, V g = 2.8*10
-9cm
3/cell
[Chow et al ., 2001]
Metabolic parameters:Specific oxygen uptake rate, Qmm = 4.5*10
-14mol/cell/hr = 1.25*10
-17mol/cell/s
Dimensionless oxygen consumption rate, Qm = Qm /(V g *C o ) = 0.021158 1/s
K m = 1.055*10-8
mol/cm3
[Chow et al ., 2001]
Growth parameters:kk = 1.264*10
-11mol/cm
3.s
K1 = 2.78*10-15
(mol/cm3)
2
K I = 5.1*105 cm3/mol
p = kk/C o = 5.9905*10-5
q = K1/C o2 = 0.062442
r = 1/(K I *C o ) = 9.2928 (Heaven et. al. 2000)
Yield coefficient, Y = mass of cells produced/ mass of oxygen consumed = 0.45[Bailey et al . 1986]
Initial cell seeding density, d o = 2*104
cells/ml
Substrate parametersEffective oxygen permeability = 3.20*10-14
mol/cm/s/mm Hg
Henry’s coefficient for oxygen, k h = 0.95 atm.L/mmol
Oxygen diffusion coefficient in medium (liquid layer), Dβ = 3.29*10-5
cm2/s
Oxygen diffusion coefficient in the matrix (cell layer), Dγ = 1.59*10-5
cm2/s
[Chow et al ., 2001]
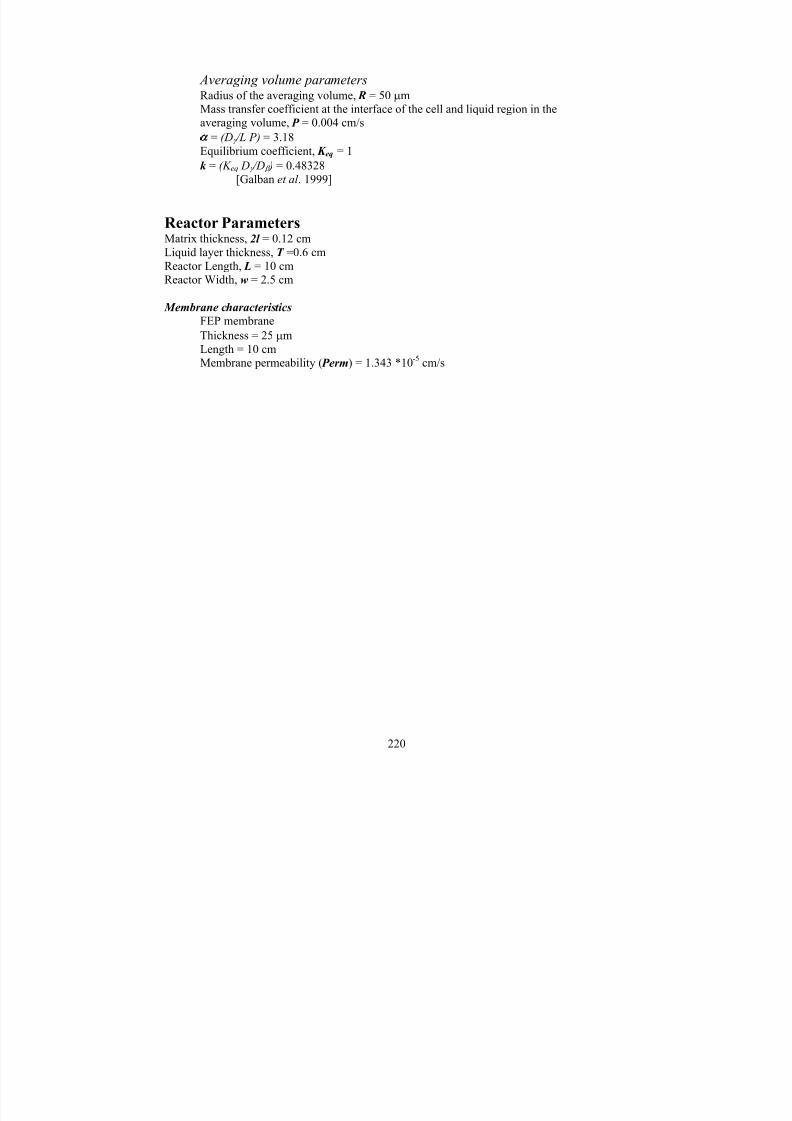
7/27/2019 Mathematical Modeling of Transport and Reaction in Cellular and T
http://slidepdf.com/reader/full/mathematical-modeling-of-transport-and-reaction-in-cellular-and-t 240/270
220
Averaging volume parametersRadius of the averaging volume, R = 50 µmMass transfer coefficient at the interface of the cell and liquid region in theaveraging volume, P = 0.004 cm/s
α = (Dγ /L P) = 3.18
Equilibrium coefficient, K eq = 1k = (K eq Dγ /D β ) = 0.48328
[Galban et al . 1999]
Reactor ParametersMatrix thickness, 2l = 0.12 cm
Liquid layer thickness, T =0.6 cm
Reactor Length, L = 10 cmReactor Width, w = 2.5 cm
Membrane characteristicsFEP membrane
Thickness = 25 µm
Length = 10 cmMembrane permeability ( Perm) = 1.343 *10
-5cm/s
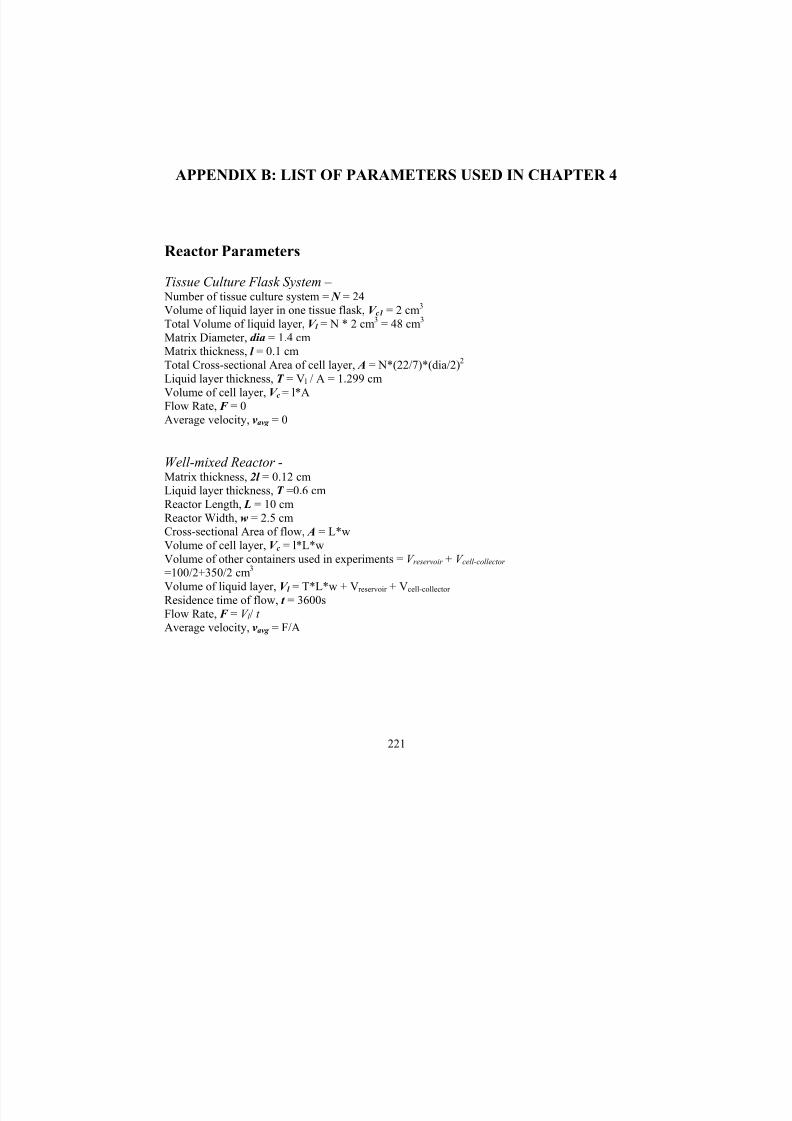
7/27/2019 Mathematical Modeling of Transport and Reaction in Cellular and T
http://slidepdf.com/reader/full/mathematical-modeling-of-transport-and-reaction-in-cellular-and-t 241/270
221
APPENDIX B: LIST OF PARAMETERS USED IN CHAPTER 4
Reactor Parameters
Tissue Culture Flask System – Number of tissue culture system = N = 24Volume of liquid layer in one tissue flask, V c1 = 2 cm3
Total Volume of liquid layer, V l = N * 2 cm3
= 48 cm3
Matrix Diameter, dia = 1.4 cmMatrix thickness, l = 0.1 cm
Total Cross-sectional Area of cell layer, A = N*(22/7)*(dia/2)2
Liquid layer thickness, T = Vl / A = 1.299 cm
Volume of cell layer, V c = l*AFlow Rate, F = 0
Average velocity, vavg = 0
Well-mixed Reactor -Matrix thickness, 2l = 0.12 cmLiquid layer thickness, T =0.6 cm
Reactor Length, L = 10 cm
Reactor Width, w = 2.5 cmCross-sectional Area of flow, A = L*w
Volume of cell layer, V c = l*L*w
Volume of other containers used in experiments = V reservoir + V cell-collector =100/2+350/2 cm
3
Volume of liquid layer, V l = T*L*w + Vreservoir + Vcell-collector
Residence time of flow, t = 3600s
Flow Rate, F = V l / t Average velocity, vavg = F/A

7/27/2019 Mathematical Modeling of Transport and Reaction in Cellular and T
http://slidepdf.com/reader/full/mathematical-modeling-of-transport-and-reaction-in-cellular-and-t 242/270
222
Mass Transfer Coefficients for transport of oxygen, glucose and
lactate across the liquid layer to the cell layer
Oxygen diffusivity in the liquid layer, Dl o =3.29e-5 cm2/s
Glucose diffusivity in the liquid layer, Dl glu =0.6e-05 cm2/s
Lactate diffusivity in the liquid layer, Dl lac =1.45e-05 cm2/s
Tissue Culture Flask System – Oxygen, kmo = Dl o /T
Glucose, km glu = Dl glu/T Lactate, kmlac = Dl lac/T
Well-mixed Reactor -Oxygen, kmo = 1.165*( Dl o
(2/3))*(vavg /( L*T ))
(1/3)
Glucose, km glu = Dl glu/T
Lactate, kmlac = Dl lac/T
Membrane characteristicsFEP membrane
Thickness = 25 µm
Length = 10 cmMembrane permeability (k mem) = 1.343 *10
-5cm/s
Initial ConcentrationsOxygen concentration used for non-dimensionalizing, C o = 2.10*10-7 mmol/cm3
[Oxygen concentration in equilibrium with 20% gas phase oxygen]
Tissue Culture Flask System – Initial lactate concentration , C lac
o = 2.36*10
-8mol/cm
3
[Equivalent to 2.125 mg/l; MW = 90]
Initial glucose concentration, C gluo
= 2.822*10-6
mol/cm3
[Equivalent to 0.95 g/l; MW = 180]Initial oxygen concentration, C o2
o= 0.25
[Dissolved oxygen concentration in equilibrium with 5% gas phase oxygen]
Well-mixed Reactor -Initial glucose concentration, C glu
o= 5.07*10
-6mol/cm
3
[Equivalent to 0.913 g/l; MW = 90]Initial oxygen concentration, C o2
o = 0.25
[Dissolved oxygen concentration in equilibrium with 5% gas phase oxygen]
Initial lactate concentration , C laco
= 2.822*10-6
mol/cm3
[Equivalent to 0.0254 g/l; MW = 180]
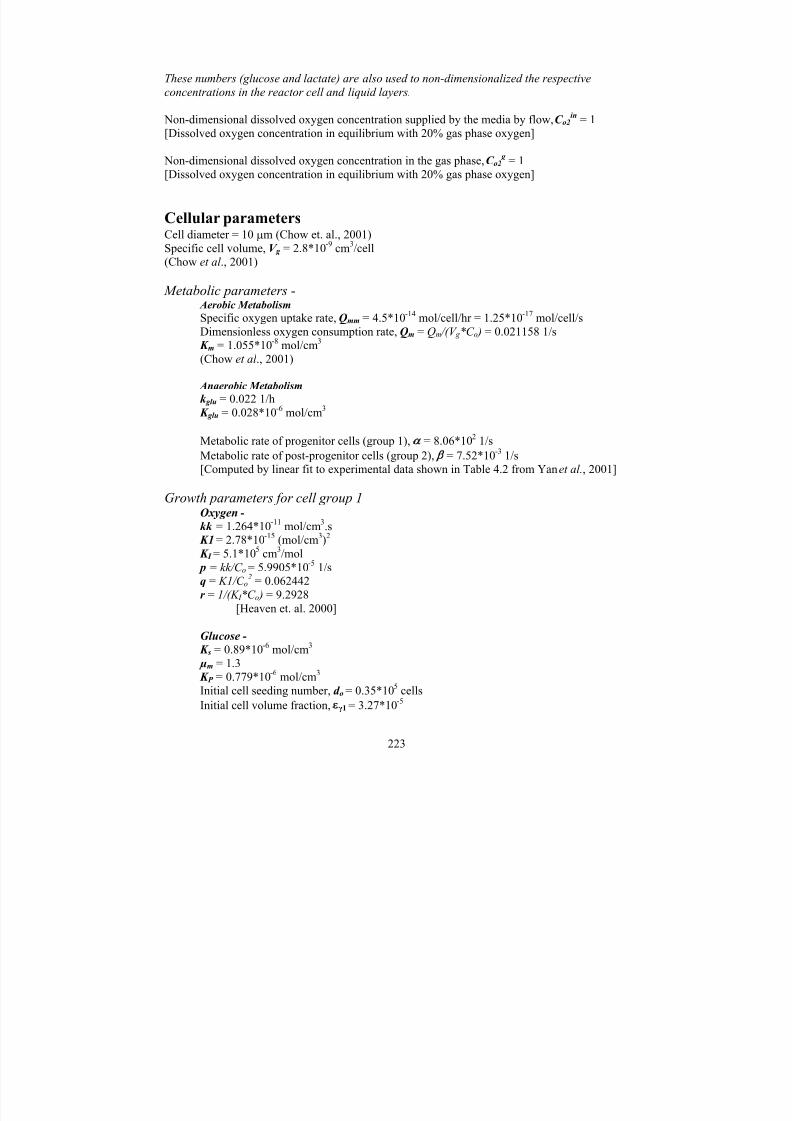
7/27/2019 Mathematical Modeling of Transport and Reaction in Cellular and T
http://slidepdf.com/reader/full/mathematical-modeling-of-transport-and-reaction-in-cellular-and-t 243/270
223
These numbers (glucose and lactate) are also used to non-dimensionalized the respective
concentrations in the reactor cell and liquid layers.
Non-dimensional dissolved oxygen concentration supplied by the media by flow, C o2in
= 1
[Dissolved oxygen concentration in equilibrium with 20% gas phase oxygen]
Non-dimensional dissolved oxygen concentration in the gas phase, C o2 g
= 1
[Dissolved oxygen concentration in equilibrium with 20% gas phase oxygen]
Cellular parametersCell diameter = 10 µm (Chow et. al., 2001)
Specific cell volume, V g = 2.8*10-9
cm3/cell
(Chow et al ., 2001)
Metabolic parameters - Aerobic MetabolismSpecific oxygen uptake rate, Qmm = 4.5*10
-14mol/cell/hr = 1.25*10
-17mol/cell/s
Dimensionless oxygen consumption rate, Qm = Qm /(V g *C o ) = 0.021158 1/s K m = 1.055*10
-8mol/cm
3
(Chow et al ., 2001)
Anaerobic Metabolism
k glu = 0.022 1/h
K glu = 0.028*10-6
mol/cm3
Metabolic rate of progenitor cells (group 1), α = 8.06*102
1/s
Metabolic rate of post-progenitor cells (group 2), β = 7.52*10-3 1/s[Computed by linear fit to experimental data shown in Table 4.2 from Yan et al., 2001]
Growth parameters for cell group 1Oxygen -
kk = 1.264*10-11
mol/cm3.s
K1 = 2.78*10-15
(mol/cm3)
2
K I = 5.1*105
cm3/mol
p = kk/C o = 5.9905*10-5
1/s
q = K1/C o2 = 0.062442
r = 1/(K I *C o ) = 9.2928
[Heaven et. al. 2000]
Glucose -
K s = 0.89*10-6
mol/cm3
µm = 1.3 K P = 0.779*10
-6mol/cm
3
Initial cell seeding number, d o = 0.35*105
cells
Initial cell volume fraction, εγ1 = 3.27*10-5

7/27/2019 Mathematical Modeling of Transport and Reaction in Cellular and T
http://slidepdf.com/reader/full/mathematical-modeling-of-transport-and-reaction-in-cellular-and-t 244/270
224
Growth parameters for cell group 2Differentiation rate coefficient of cell group 1 to cell group 2, φd
2= 4*10
-61/s
Initial cell number, d o = 0.15*105
cells
Initial cell volume fraction, εγ2 = 1.44*10-5
Yield CoefficientsY cell/o2 = mol of cells produced/ mol of oxygen consumed = 0.45
[Bailey et. al. 1986]
Y lac/o2 = mol of lactate produced/mol of oxygen consumed = 1
[Collins et al., 1998][At earlier stages of culture maximum number of progenitors present]
Y lac/glu = mol of lactate produced/mol of glucose consumed = 1.4
[Heidemann et al., 1998]
Y glu/o2 = mol of glucose consumed/mol of oxygen = Y glu/lac*Y lac/o*(C o2o /C glu
o )
Y lac/cell = (0.65*100)*4.4*10-12
mol/cell
Computed yield = [Y lac/cell / (V g * C laco)] = 7.08*10
2mol/mol / cell vol fraction
Y cell/glu = 10*0.062*1012
cell/µmol
Computed Yield = [(Y cell/glu * V g * C gluo)]
[RPMI 8226 cell, Truskey et al., 1990]

7/27/2019 Mathematical Modeling of Transport and Reaction in Cellular and T
http://slidepdf.com/reader/full/mathematical-modeling-of-transport-and-reaction-in-cellular-and-t 245/270
225
APPENDIX C: LIST OF PARAMETERS USED IN CHAPTER 5
Cellular parametersSpecific cell volume, V g = 2.8*10
-9cm
3/cell
[Chow et. al., 2001]
Metabolic parameters Static
Dimensionless specific oxygen consumption rate, Qm = 0.002588 1/s
[ From experimental data reported in this paper ]Saturation constant, K m = 1.105265*10
-8mol/cm
3(= 0.05*Co)
[ Peng and Palsson, 1996; Chow et al., 2001a]
Perfusion
Dimensionless specific oxygen consumption rate, Qm (1/s)= -3.6198E-16*t
2+ 6.6040E-10*t + 2.3413E-03
[ From experimental data reported in this paper ]Saturation constant, K m = 1.105265*10-8
mol/cm3
(= 0.05*Co)
[ Peng and Palsson, 1996; Chow et al., 2001a]
Growth parameters Static
Cell growth rate, m = 3.87454*10-7
1/s
Initial cell volume fraction, εγo = 9.65*10-3
[ From experimental data reported in this paper ]
Perfusion
Cell growth rate, m = 1.18*10
-6
1/sInitial cell volume fraction, εγo = 1.53*10
-3
[ From experimental data reported in this paper ]
Substrate parametersHenry’s coefficient for oxygen, k h = 0.95 atm.L/mmol
C o = 2.10*10-7
mmol/cm3
7/27/2019 Mathematical Modeling of Transport and Reaction in Cellular and T
http://slidepdf.com/reader/full/mathematical-modeling-of-transport-and-reaction-in-cellular-and-t 246/270
226
[Oxygen concentration in equilibrium with 20% gas phase oxygen]
Oxygen diffusion coefficient in medium (liquid layer), Dβ = 3.29*10-5
cm2/s
Oxygen diffusion coefficient through cells in the matrix (in cell layer), Dγ = 1.59*10-5
cm2/s
[Chow et. al., 2001]
Averaging volume parametersRadius of the averaging volume, R = 50 µm
Mass transfer coefficient at the interface of the cell and liquid region in the averagingvolume, P = 0.004 cm/s
α = (Dγ /L P) = 3.18Equilibrium coefficient, K eq = 1
k = (K eq Dγ /D β ) = 0.48328[ Pathi et. al., 2005]
Reactor Parameters Static
Matrix thickness, 2 l = 0.12 cm
Liquid layer thickness, T =0.6 cmReactor Length, L = 10 cm
Reactor Width, w = 2.5 cm
Perfusion
Matrix thickness, 2 l = 0.12 cm
Liquid layer thickness, T =0.6 cmReactor Length, L = 10 cm
Reactor Width, w = 2.5 cm
Flow rate/ chamber = 0.1 ml/min = 1.67*10-3 cm3 /sAverage velocity, vavg = 1.11*10
-3cm /s
Membrane characteristics
FEP membrane
Thickness = 130 µm
Length = 10 cmMembrane permeability ( Perm) = 1.343 *10
-5cm/s
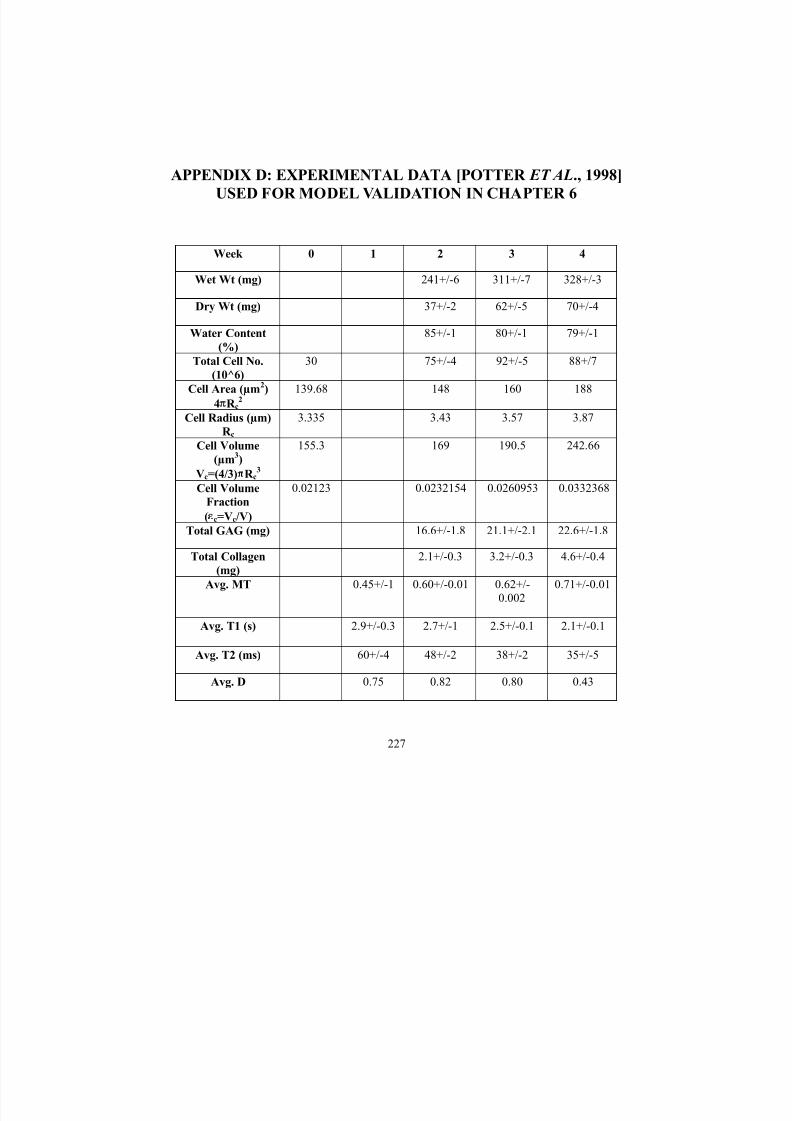
7/27/2019 Mathematical Modeling of Transport and Reaction in Cellular and T
http://slidepdf.com/reader/full/mathematical-modeling-of-transport-and-reaction-in-cellular-and-t 247/270
227
APPENDIX D: EXPERIMENTAL DATA [POTTER ET AL., 1998]
USED FOR MODEL VALIDATION IN CHAPTER 6
Week 0 1 2 3 4
Wet Wt (mg) 241+/-6 311+/-7 328+/-3
Dry Wt (mg) 37+/-2 62+/-5 70+/-4
Water Content
(%)
85+/-1 80+/-1 79+/-1
Total Cell No.
(10^6)
30 75+/-4 92+/-5 88+/7
Cell Area (µm2)
4πR c2
139.68 148 160 188
Cell Radius (µm)
R c
3.335 3.43 3.57 3.87
Cell Volume
(µm3)
Vc=(4/3)πR c3
155.3 169 190.5 242.66
Cell Volume
Fraction
(εc=Vc/V)
0.02123 0.0232154 0.0260953 0.0332368
Total GAG (mg) 16.6+/-1.8 21.1+/-2.1 22.6+/-1.8
Total Collagen
(mg)
2.1+/-0.3 3.2+/-0.3 4.6+/-0.4
Avg. MT 0.45+/-1 0.60+/-0.01 0.62+/-0.002
0.71+/-0.01
Avg. T1 (s) 2.9+/-0.3 2.7+/-1 2.5+/-0.1 2.1+/-0.1
Avg. T2 (ms) 60+/-4 48+/-2 38+/-2 35+/-5
Avg. D 0.75 0.82 0.80 0.43
7/27/2019 Mathematical Modeling of Transport and Reaction in Cellular and T
http://slidepdf.com/reader/full/mathematical-modeling-of-transport-and-reaction-in-cellular-and-t 248/270
228
APPENDIX E: LIST OF PARAMETERS USED FOR MODEL
DEVELOPMENT IN CHAPTER 6
Reactor ParametersFlow rate = ~5ml/min – 14 ml/min (increased gradually in 10 days)
Bioreactor Dimensions:Inner diameter, T = 4*10
-3m
Height, H = 60*10-3
m
Total Bioreactor Volume, BV = π*(T/2)2*H = 7.54*10
-7m
3
Capillary Dimensions: Number of hollow/capillary fibers, fnum = 6
Capillary Inner diameter, d0 = 330*10-6
mCapillary fiber wall thickness, wt0 = 150*10
-6m
Capillary fiber radius, r0 = d0/2 + wt0 = 3.15*10-4
m
Capillary fiber volume, fV = π*(r0)2*H = 1.87*10-8 m3 Volume around a single fiber, BVf = BV/fnum = 1.26*10
-7m
3
Radius of the volume around single fiber, Tbf = (BVf/πH)1/2
= 8.18*10-4
mVolume available for tissue formation, BVtf = BVf- fV = 1.073*10
-7m
3
Radius of the available volume for cell growth, Tb = Tbf-r0 = 6.53*10-4
m
Transport ParametersWater self diffusion coefficient, Dl = 2.25*10
-9m
2/s
Water diffusion coefficient in cellular phase, Dcw =Dl = 2.25*10-9
m2/s
Oxygen diffusion coefficient in aqueous medium, Dl Oxy=3.29*10-9
m2/s
[Horner et al., 1998; Chow et al, 2000]
Oxygen diffusion coefficient through cells, DcOxy=1.50*10-9
m2/s
[Chow et al, 2000; Obradovic, 2000]
Equilibrium coefficient of water between the cell ‘c’ and the ECM ‘e’ phases of the averaging
volume, Keqw
= 1Equilibrium coefficient of oxygen between the cell ‘c’ and the ECM ‘e’ phases of the averaging
volume, Keq = oxygen solubility in lipids or membranes / oxygen solubility in water
= 4.387 [Chow et. al ., 2001]

7/27/2019 Mathematical Modeling of Transport and Reaction in Cellular and T
http://slidepdf.com/reader/full/mathematical-modeling-of-transport-and-reaction-in-cellular-and-t 249/270
229
Averaging volume parametersVolume of averaging volume or unit cell, V
= (BVtf*fnum)/Maximum cell number at 4 weeks)
= 7.316 * 10-15
m3
Radius of the averaging volume, R = 1.203 * 10-5
m
Mass transfer coefficient at the interface of the cell and ECM phases in the averagingvolume, P = 1*10
-5m/s
[Galban and Locke, 1999]
Cellular parametersCell Metabolic parameters:Specific oxygen uptake rate, k c = 1.86*10
-21/s
[Obradovic et. al., 2000; ratio of Qmax /Km, the Michaelis-Menten parameters]Mass transfer coefficient, K m = 1*10
-31/s
Cell Growth parameters:Overall cell Contois parameter, K cont = 1.13*10
1
Overall cell growth coefficient, k g = 3.78 * 10-7
1/s
Cell death coefficient, k cd = 1*10-8
1/sInitial cell seeding number, d o = 3*10
7cells
Cell proliferation parameters:Estimated cell mass at week 4, EstCellmass
4wk
= Dry Wt. - (ECM+GAG) value at 4th week
= 0.07 - (0.0226 + 0.0046) gMaximum Available volume for cell growth, around a single fiber
= ( ) H r Tbf ⋅−⋅ 220π
Maximum available volume for cell growth / Volume of an averaging volume= nmax (single fiber)
=( )
3
22
4
03
R
r Tbf H
⋅
−⋅⋅
Total number of averaging volumes, Total_n = nmax * fnum
Total cell volume at week 4, Totalcellvol4wk
= [εc4wk
]* (V * Total_n)
Cell density, ρc = EstCellmass4wk
/ Totalcellvol4wk
Total Cell Mass production coefficientsOverall Contois parameter, K p = 3.045*107/rhoc
Cell mass formation coefficient, k p = 7.97143 * 10-6
1/s
Total cell death coefficient, k pd = 1.2*10-8
1/s
Cell ECM parameters:GAG – Specific fiber density = 0.54 cm
3/g

7/27/2019 Mathematical Modeling of Transport and Reaction in Cellular and T
http://slidepdf.com/reader/full/mathematical-modeling-of-transport-and-reaction-in-cellular-and-t 250/270
230
[Baser et. al., 1998]
Density of GAG fibers, ρ f = 1.85185*106
g/m3
GAG production coefficient, k GAG = 2.52*10-6
1/s
GAG saturation coefficient, εGAG max
=V nTotal f ⋅⋅ _
GAGmass4wk
ρ = 0.019016
Binding coefficient of water to GAG, P g w
= (7/10)*9*10-5
Binding coefficient of oxygen to GAG, P g o
= (7/10)*4*10-5
[Penke et. al., 1998; Letnam, 1951]
COLLAGEN – Specific collagen density = 0.695 cm
3/g
[Baser et. al., 1998]
Density of collagen, ρcol = 1.43885 * 106
g/m3
Overall ECM Collagen Saturation Constant, K ec = 4*10
7
/ ρcol ECM Collagen Production Coefficient, k em = 3.975*10-6
1/s
Binding coefficient of water to collagen, P col w
= (3/10)*9*10-5
Binding coefficient of oxygen to collagen, P col
o= (3/10)*4*10
-5
[Penke et. al., 1998; Letnam, 1951]

7/27/2019 Mathematical Modeling of Transport and Reaction in Cellular and T
http://slidepdf.com/reader/full/mathematical-modeling-of-transport-and-reaction-in-cellular-and-t 251/270
231
APPENDIX F: COMPUTAION OF AVERAGE RADII OF FREE
SPACE FOR WATER DIFFUSION IN EX VIVO CARTILAGE
CULTURE IN HFBR
t = 10 ms
Dl = 2.25 * 10
-9
m
2
/sWater diffusion distance, t Dl x ⋅= = 4.74*10
-6m = 4.74 µm
Time: 0 s
Cell volume per fiber –
Initial cell area = 139.68*10-12
m2
= 4πR c2
Radius of chondrocyte cell, Rc = 3.33*10-6
m
Volume of a single chondrocyte cell, V c = (4/3)πR c3
= 154.74*10-18
m3
No. of cells = 30*106
Total volume occupied by cells, V cT
= Vc*No. of cells = 4.64*10-9
m3
Collagen volume per fiber –
Initial collagen volume fraction, εcol = 0.0001 = Vcol/V
V col = 0.0001*(7.316*10-15
m3) = 7.316*10
-19m
3
Total volume occupied by collagen = V col T
= Vcol*No. of cells = 2.195*10-11
m3
GAG volume per fiber –
Initial GAG volume fraction, εGAG = 0.0001 = VGAG/V
V GAG = 0.0001*(7.316*10-15
m3) = 7.316*10
-19m
3
Total volume occupied by GAG = V GAG T
= VGAG*No. of cells = 2.195*10-11
m3
Total available volume for tissue formation around a single fiber, V T
= (BVf- fV)*fnum = 1.073*10-7
* 6 m3
Volume of void phase, V l = VT
– (VcT
+ VcolT
+ VGAGT)
= (1.073*10-7
*6) – (4.64*10-9
+ 2.915*10-11
+ 2.915*10-11
) ~ = 6.3912*10-7
m3

7/27/2019 Mathematical Modeling of Transport and Reaction in Cellular and T
http://slidepdf.com/reader/full/mathematical-modeling-of-transport-and-reaction-in-cellular-and-t 252/270
232
Representative volume of void phase, V l rep
= (V l / No. of cells) ~ = 2.13*10-14
m3
Assuming spherical geometry, radii of free space available for water diffusion, R free-space
~ = 1.719 * 10-5
m = 17.19 µm >> x (= 4.74 µm)
Similarly calculations are done for free space radii from weeks 1 to 4 as shown below.
Time
(wk )No. of averaging volumes
(N)
Volume occupied by the tissue Vtissue
= N*Volume of a single unit cell (V)
1 5.24*107
3.834*10-7
2 7.10*107
5.194*10-7
3 8.45*107
6.182*10-7
4 9.29*107
6.797*10-7
Time
(wk )Cell volume fraction
εc
Total Volume of cells (VcT
= εc*N*V)
(m3)
1 5.24*107 8.4531*10-9 2 7.10*10
71.2451*10
-8
3 8.45*107
1.6908*10-8
4 9.29*107
2.1919*10-8
Time
(wk )Cell volume fraction
εcol
Total Volume of Collagen (VcolT
= εcol *N*V)
(m3)
1 5.24*107
2.5187*10-10
2 7.10*107
8.9343*10-10
3 8.45*107
1.9072*10-10
4 9.29*107
3.1400*10-10
Time
(wk )GAG volume fraction
εGAG
Total Volume of GAG (VGAGT
= εGAG *N*V)
(m3)
1 5.24*107
2.9135*10-9
2 7.10*107
7.6877*10-9
3 8.45*107
1.2302*10-8
4 9.29*107
1.5700*10-8
Time
(wk )
Volume of Void Phase
Vl = Vtissue-(Vc
T
+ Vcol
T
+ VGAG
T
)(m3)
Representative volume of
void phase, Vl
rep
= Vl/N(m3)
Radii of free space
available for water
diffusion [R free-space]
(µm)
1 3.71782*10-7
7.09508*10-15
11.919
2 4.98368*10-7
7.01927*10-15
11.876
3 5.87083*10-7
6.94773*10-15
11.836
4 6.38941*10-7
6.87773*10-15
11.796

7/27/2019 Mathematical Modeling of Transport and Reaction in Cellular and T
http://slidepdf.com/reader/full/mathematical-modeling-of-transport-and-reaction-in-cellular-and-t 253/270
233
APPENDIX G: LIST OF PARAMETERS USED IN CHAPTER 7
Parameter type Parameter White
Small Fiber
White
Large
Fiber
Dark Fiber Units
Initialconcentrations AP 34.3 34.3 15 mmoles/L
Arginine 0.47 0.47 1.58 mmoles/L
Pi 4.88 4.88 5 mmoles/LATP 8.6 8.6 3.7 mmoles/L
ADP 0.003 0.003 0.01 mmoles/L
Diffusion D AP 2.20 x 10⁻⁶
1.00 x 10⁻⁶
1.00 x 10⁻⁶
cm2/s
D Arg 2.79 x 10⁻⁶
1.27 x 10⁻⁶
1.27 x 10⁻⁶
cm2/s
D Pi 3.56 x 10⁻⁶
1.62 x 10⁻⁶
1.62 x 10⁻⁶
cm2/s
D ATP 1.54 x 10⁻⁶
0.70 x 10⁻⁶
0.70*10-6
cm2/s
D ADP 1.75 x 10⁻⁶
0.79 x 10⁻⁶
0.79*10-6
cm2/s
λ/2 2.73 300 18 µm
Mitochondrial
boundary reactionV mmito 1.9*10
-171.67*10
-154.315*10
-14 mmoles/µm
2/s
K mmito 20 20 20 µmoles/L
Basal ATPase V mbas 11.75 11.75 182.7 µmoles/L/s
K mbas 100 100 10 mmoles/L
Arginine kinase
reactionV mAKfor 611 611 331.8 mmoles/L/s
V mAKrev 39 39 21.15 mmoles/L/s K ATP 0.32 0.32 0.32 mmoles/L
K Arg 0.75 0.75 0.75 mmoles/L
K AP 3.82 3.82 3.82 mmoles/L
K ADP 0.40 0.40 0.40 mmoles/L
K iATP 0.34 0.34 0.34 mmoles/L
K iArg 0.81 0.81 0.81 mmoles/L
K iAP 0.26 0.26 0.26 mmoles/L

7/27/2019 Mathematical Modeling of Transport and Reaction in Cellular and T
http://slidepdf.com/reader/full/mathematical-modeling-of-transport-and-reaction-in-cellular-and-t 254/270
234
Parameter type Parameter White
Small Fiber
White
Large
Fiber
Dark Fiber Units
Arginine kinase
reaction K iADP 0.024 0.024 0.024 mmoles/L
K IATP 2.43 2.43 2.43 mmoles/L
K IArg 3.45 3.45 3.45 mmoles/L
Myosin ATPase V mmyo 6.92 6.92 3.81 mmoles/L/s
K mmyo 0.15 0.15 0.15 mmoles/L

7/27/2019 Mathematical Modeling of Transport and Reaction in Cellular and T
http://slidepdf.com/reader/full/mathematical-modeling-of-transport-and-reaction-in-cellular-and-t 255/270
235
APPENDIX H: PERMISSION FROM JOHN WILEY & SONS,
INC.

7/27/2019 Mathematical Modeling of Transport and Reaction in Cellular and T
http://slidepdf.com/reader/full/mathematical-modeling-of-transport-and-reaction-in-cellular-and-t 256/270
236
REFERENCES
Abkowitz, J. L., Golinelli, D., Harrison, D. E., and Guttorp, P, “In vivo kinetics of murinehematopoietic stem cells”, Blood, Vol. 96(10), 3399 (2000)
Aliev, M. K. and Saks, V., “Compartmentalized energy transfer in cardiomyocytes: use of
mathematical modeling for analysis of in vivo regulation of respiration”, Biophys. J., Vol. 73,428 (1997)
Annabi, B., Lee, Y. T, Turcotte, S., Naud, E., Desrosiers, R. R., Champagne, M., Eliopoulos, N.,Galipeau, J., and Beliveau, R., “Hypoxia promotes murine bone-marrow-derived stromal cell
migration and tube formation”, Stem Cells, Vol. 21, 337 (2003)
Baldwin, J., Gupta, A. and Iglesias, X., “Scaling of anaerobic energy metabolism during tail
flipping behavior in the freshwater crayfish”, Cherax destructor. Mar. Freshwater Res., Vol.
50,183 (1999)
Baser P. J., R. Schneiderman, R. A. Bank, E. Wachtel, and A. Maroudas, “Mechanical Propertiesof the Collagen Network in Human Articular Cartilage as Measured by Osmotic Stress
Techniques”, Archives of Biochemistry, Vol. 351 (2), 207 (1998)
Bailey, J. E., Ollis D. F., “Biochemical engineering fundamentals”, Second edition, 1986,
McGraw-Hill Book Company
Bailey, J., “Mathematical modeling and analysis in biochemical engineering: past
accomplishments and future opportunities”, Biotechnology Progress, Vol. 14, 8 (1998)
Beard, D. A., “Biophysical Model of Oxidative Phosphorylation”, PLOS Computational
Biology, In Review (2005)
Bhatia, M., Bonnet, D., Kapp, U., Wang J. C. Y., Murdoch, B., and Dick, J. E., “Quantitative
analysis reveals expansion of human hematopoietic repopulation cells after short-term ex vivo
culture”, J. Exp. Med., Vol. 186(4), 619 (1997)
Booth, C. E. and McMahon, B. R., “Lactate dynamics during locomotor activity in the blue crab,
Callinectes sapidus”, J. Exp. Biol., Vol. 118, 461 (1985)

7/27/2019 Mathematical Modeling of Transport and Reaction in Cellular and T
http://slidepdf.com/reader/full/mathematical-modeling-of-transport-and-reaction-in-cellular-and-t 257/270
237
Boyle, K. L., Dillaman, R. M. and Kinsey, S. T., “Mitochondrial distribution and glycogen
dynamics suggest diffusion constraints in muscle fibers of the blue crab, Callinectes sapidus”, J.Exp. Zool., Vol. 297A, 1 (2003)
Buckwalter, J.A., and Mankin, H.J., “Articular Cartilage. Part I: tissue design and chondrocyte-
matrix interactions”, J. Bone Joint Surgery, Vol. 79-A, 600 (1997)
Bursac, P.M., L.E. Freed, R.J.Biron and G. Vunjak-Novakovic, “Mass Transfer Studies of Tissue
Engineered Cartilage”, Tissue Engineering, Vol. 2, 141 (1996)
Cabrita, G. J. M., Ferreira, B. S., Silva, C. L., Goncalves, R., Porada, G. A., and Cabral, J. M. S.,
“Hematopoietic stem cells: from the bone to the bioreactor”, TRENDS in Biotechnology, Vol.21(5), 233 (2003)
Carbonell, R. G., Whitaker, S., “Heat and mass transport in porous media”, In: Bear J,Corapcioglu M Y, editors. Mechanics of Fluids in porous media. Brussels:Martinus Nijhoff.
(1984)
Chen, C. P., and Aplin, J. D., “Placental extracellular matrix: Gene expression, deposition by
placental fibroblasts and the effect of oxygen”, Placenta, Vol. 24, 316 (2003)
Chen, J. L., Li, Y., Zhang, R. L., Katakowski, M., Gautam, S. C., Xu, Y. X., Lu, M., Zhang, Z.G., Chopp, M., “Combination therapy of stroke in rats with a nitric oxide donor and human bone
marrow stromal cells enhances angiogenesis and neurogenesis”, Brain Res, Vol. 1005, 21-28
(2004)
Chen, J. L., Zhang, Z. G., Li, Y., Wang, L., Xu, Y. X., Gautam, S. C., Lu, M., Zhu, Z., Chopp,M., “Intravenous administration of human bone marrow stromal cells induces angiogenesis in the
ischemic boundary zone after stroke in rats”, Circ Res, Vol. 92, 692-699 (2003)
Chow, D. C., Wenning, L. A., Miller, W. M., and Papoutsakis, E. T., “Modeling pO2
distributions in the bone marrow hematopoietic compartment I. Krogh’s Model”, Biophysical
Journal, Vol. 81(2), 675 (2001 a)
Chow, D. C., Wenning, L. A., Miller, W. M., and Papoutsakis, E. T., “Modeling pO2
distributions in the bone marrow hematopoietic compartment II. Modified Krogh’s Models”,
Biophysical Journal, Vol. 81(2), 685 (2001 b)
Cipolleschi, M. G., Sbarba, P. D., and Olivotto, M., “The role of hypoxia in the maintenance of
hematopoietic stem cells”, Blood, Vol. 7, 2031 (1993)
Collins, P. C., Nielsen, L. K., Wong, C. K., Papoutsakis, E. T., and Miller, W. M., “Real-time
method for determining the colony-forming cell content of human hematopoietic cell cultures”,Biotechnology and Bioengineering, Vol. 55(4), 693 (1997)
7/27/2019 Mathematical Modeling of Transport and Reaction in Cellular and T
http://slidepdf.com/reader/full/mathematical-modeling-of-transport-and-reaction-in-cellular-and-t 258/270
238
Collins, P. C., Nielsen, L. K., Patel, S. D., Papoutsakis, E. T., and Miller, W. M.,
“Characterization of hematopoietic cell expansion, oxygen uptake, and glycolysis in a controlled,stirred tank bioreactor system”, Biotechnol. Prog., Vol. 14, 466 (1998)
Contois, D. E., “Kinetics of Bacterial Growth: Relationship between Population Density and
Specific Growth Rate of Continuous Cultures. J. Gen. Microbiol., 21:40-50 (1959)
Crow, M. T., and Kushmerick, M. J., “Chemical energetics of slow- and fast-twitch muscles of
the mouse”, J. Gen. Physiol., Vol. 79, 147 (1982)
Damas, N. M., Rodriguez, J. M., Carmona, M., Gonzalez, M., and Prieto, J., “Ex-vivo expansion
and maturation of CD34-positive hematopoietic progenitors optimization of culture conditions”,Leukemia Research, Vol. 23, 1035 (1999)
Danckwerts, P. V., “Continuous flow systems”, Chemical Engineering Science, Vol. 2, 1 (1953)
de Graaf, R. A., van Kranenburg, A. and Nicolay, K., “In vivo
31
P-NMR diffusion spectroscopyof ATP and phosphocreatine in rat skeletal muscle”, Biophys. J., Vol. 78, 1657 (2000)
Dimicco MA, Sah RL., “Dependence of Cartilage Matrix Composition on Biosynthesis,
Diffusion, and Reaction”, Transport in Porous Media, Vol. 50, 57 (2003)
Duggan, O., Hyland, P., Annett, K., Freeburn, R., Barnett, C., Pawelec, G., and Barnett, Y.,
“Effects of a reduced oxygen tension culture system on human T cell clones as a function of in
vitro age”, Exp Gerontol, Vol. 39, 525 (2004)
Ellington, W.R. and Kinsey, S.T., “Functional and evolutionary implications of the distributionof phosphagens in primitive-type spermatozoa”, Biol. Bull., Vol. 195, 264 (1998)
Ellington, W.R., “Evolution and physiological roles of phosphagen systems”, Ann. Rev.Physiol., Vol. 63, 289 (2001)
Ellis, S. J., M. Velayutham, S. Sendhil Velan, E. F. Peterson, J. L. Zweier, P. Kuppusamy, and R.G. Spencer, “EPR Oxygen Mapping (EPROM) of Engineered Cartilage Growth in a Hollow-
Fiber Bioreactor”, Magnetic Resonance in Medicine, Vol. 46, 819 (2001)
Forgue, J., Legeay, A. and Massabuau, J. C., “Is the resting rate of oxygen consumption of locomotor muscles in crustaceans limited by the low blood oxygenation strategy?”, J. Exp. Biol.,
Vol. 204, 933 (2001)
Freed, L. E., J. C. Marquis, G. Vunjak-Novakovic, J. Emmanual, A. G. Mikos, and R. Langer,
“Composition of Cell-Polymer Cartilage Implants,” Biotechnology and Bioengineering, Vol. 43,
605 (1994a)
Freed, L. E., G. Vunjak-Novakovic, J. C. Marquis, and R. Langer, “Kinetics of Chondrocyte
Growth in Cell-Polymer Implants,” Biotechnology and Bioengineering, Vol. 43, 597 (1994b)

7/27/2019 Mathematical Modeling of Transport and Reaction in Cellular and T
http://slidepdf.com/reader/full/mathematical-modeling-of-transport-and-reaction-in-cellular-and-t 259/270
239
Freed, L.E., G. Vunjak-Novakovic, “Tissue Culture Bioreactors,” Principles of TissueEngineering., R.P.Lanza, R.Langer, and W.Chick, eds., 2
nded., Academic Press, San Diego, CA,
143 (2000b)
Galban, C.J., Locke, B. R.,. “Analysis of Cell Growth in a Polymer Scaffold Using a MovingBoundary Approach”, Biotechnology and Bioengineering, Vol. 56 (4), 422 (1997)
Galban, C.J., Locke, B. R., “Effects of spatial variation of cells and nutrient and productconcentrations coupled with product inhibition on cell growth in a polymer scaffold”,
Biotechnology and Bioengineering, Vol. 64(6), 633 (1999 a)
Galban, C.J., Locke, B. R., “Analysis of cell growth kinetics and substrate diffusion in a polymer
scaffold”, Biotechnology and Bioengineering, Vol. 65(2), 121 (1999 b)
Gannon, A. T. and Wheatly, M. G., “Physiological effects of a gill barnacle on host blue crabs
during short-term exercise and recovery”, Mar. Behav. Physiol., Vol. 24, 215 (1995)
Gebb, S. A.. and Jones, P. L., “Hypoxia and lung branching morphogenesis”, Adv Exp Med
Biol, Vol. 543, 117-125 (2003)
Green, J. E. F., Byrne, H. M., Walters, S. L., and Shakesheff, K. M., “Mathematical modeling intissue engineering”, European Cells and Materials, Vol. 6, Suppl. 2, 38 (2003)
Grayson, W. L., Ma, T., and Bunnel, B., “Human mesenchymal stem cells tissue development in3D PET matrices”, Biotechnol Prog, Vol. 20, 905 (2004)
Grimshaw, M.J., R.M.Mason, “Bovine articular chondrocyte function in vitro depends upon
oxygen tension”, Osteoarthritis and Cartilage, Vol. 8, 386 (2000)
Groebe, K. and Thews, G., “Calculated intra- and extracellular gradients in heavily working red
muscle”, Am. J. Physiol. Heart Circ. Physiol., Vol. 259, H84 (1990)
Hascall, V.C., J.D.Sandy, and C.J.Handley, “Regulation of Proteoglycan Metabolism in Articular
Cartilage”, Biology of the Snyovial Joint, C.W.Archer, ed., Ch 7, Harwood Academic
Publishers, Amsterdam (1999)
Heidemann, R., Lutkeyemeyer, D., Lehmann, J., “Effects of dissolved oxygen levels and role of
extra- and intracellular amino acid concentrations upon metabolism of mammalian cell lines
during batch and continuous cultures”, Cytotechnol., Vol. 26, 185 (1998)
Head, G., and Baldwin, J., “Energy metabolism and the fate of lactate during recovery from
exercise in the Australian freshwater crayfish, Cherax destructor.” Aust. J. Mar. Freshw. Res.,Vol. 37, 641 (1986)

7/27/2019 Mathematical Modeling of Transport and Reaction in Cellular and T
http://slidepdf.com/reader/full/mathematical-modeling-of-transport-and-reaction-in-cellular-and-t 260/270
240
Henry, R. P., Booth, C. E., Lallier, F. H. and Walsh, P. J., “Post-exercise lactate production and
metabolism in three species of aquatic and terrestrial decapod crustaceans”. J. Exp. Biol., Vol.186, 215 (1994)
Hevehan, D. L., Papoutsakis, E. T., and Miller, W. M., “Physiologically significant effects of pH
and oxygen tension on granulopoiesis”, Experimental Hematology, Vol. 28, 267 (2000)
Hevehan, D. L., Wenning, L. A., Miller, W. M., and Papoutsakis, E. T., “Dynamic model of ex
vivo granulocytic kinetics to examine the effects of oxygen tension, pH, and interleukin-3”,Experimental Hematology, Vol. 28, 1016 (2000)
Hogan, M. C., Stary, C. M., Balaban, R. S. and Combs, C. A., “NAD(P)H fluorescence imagingof mitochondrial metabolism in contracting Xenopus skeletal muscle fibers: effect of oxygen
availability”, J. Appl. Physiol. (2004) [e-pub ahead of print].
Horner, M., Miller, W. M., Ottino, J. M., and Papoutsakis E. T., “Transport in a grooved
perfusion flat-bed bioreactor for cell therapy applications”, Biotechnol. Prog. Vol. 14, 689(1998)
Horwitz, E. M., Prockop, D. J., Fitzpartick, L. A., Koo, W. W., Gordonm, P. L., Neel, M.,
Sussman, M., Orchard, P., Marx, J. C., Pyeritz, R. E., and Brenner, M. K., “Transplantability and
therapeutic effects of bone marrow-derived mesenchymal cells in children with osteogenesisimperfecta”, Nature Med, Vol. 5, 309-313 (1999)
Hubley, M. J., Locke, B. R., and Moerland, T. S., “Reaction-diffusion analysis of effects of temperature on high-energy phosphate dynamics in goldfish skeletal muscle”, J. Exp. Biol., Vol.
200, 975 (1997)
Ishikawa, Y., and Ito, T., “Kinetics of hematopoietic stem cells in a hypoxic culture”. Eur J
Haematol, Vol. 40, 126 (1998)
Jeneson, J. A. L., Westerhoff, H. V., Brown, T. R., van Echteld, C. J. A. and Berger, R., “Quasi-
linear relationship between Gibbs free energy of ATP hydrolysis and power output in humanforearm muscle”, Am. J. Physiol. Cell Physiol., Vol. 268, C1474 (1995)
Jeneson, J. A. L., Wiseman, R. W., Westerhoff, H. V., and Kushmerick, M. J., “The signaltransduction function for oxidative phosphorylation is at least second order in ADP”, J. Biol.
Chem., Vol. 271(45), 27995 (1996)
Jiang, B., Semenza, G. L., Bauer, C., Marti, H. H., “Hypoxia Inducible Factor 1 levels varyexponentially over a physiologically relevant range of O2 Tension”, Am J Phys., Vol. 271,
C1172 – C 1180 (1996)
Johnson, L. K., Dillaman, R. M., Gay, D. M., Blum, J. E. and Kinsey, S. T., “Metabolic
influences of fiber size in aerobic and anaerobic muscles of the blue crab, Callinectes sapidus”,
J. Exp. Biol., Vol. 207, 4045 (2004)

7/27/2019 Mathematical Modeling of Transport and Reaction in Cellular and T
http://slidepdf.com/reader/full/mathematical-modeling-of-transport-and-reaction-in-cellular-and-t 261/270
241
Johnston, I. A., Fernández, D. A., Calvo, J., Vieira, V. L. A., North, A. W., Abercromby, M. and
Garland, T., Jr., “Reduction in muscle fiber number during the adaptive radiation of notothenioidfishes: a phylogenetic perspective”, J. Exp. Biol., Vol. 206, 2595 (2003)
Johnston, I. A., Abercromby, M., Vieira, V. L. A., Sigursteindóttir, R. J., Kristjánsson, B. K.,
Sibthorpe, D. and Skúlason, S., “Rapid evolution of muscle fiber number in post-glacial populations of charr Salvelinus alpinus”, J. Exp. Biol., Vol. 207, 4343 (2004)
Kemp, G. J., Manners, D. N., Clark, J. F., Bastin, M. E. and Radda, G. K., “Theoretical modelingof some spatial and temporal aspects of the mitochondrion/creatine kinase/myofibril system in
muscle”, Mol. Cell. Biochem., Vol. 184, 249 (1998)
Kim JH, Ochoa JA, Whitaker S. 1987, “Diffusion in Anisotropic Porous Media”, Transport in
porous Media, Vol. 2, 327 (1987)
Kinsey, S. T. and Ellington, W. R., “1H- and
31P-Nuclear magnetic resonance studies of L-lactate
transport in isolated muscle fibers from the spiny lobster, Panulirus argus”, J. Exp. Biol., Vol.199, 2225 (1996)
Kinsey, S. T., Penke, B., Locke, B. R. and Moerland, T. S., “Diffusional anisotropy is induced by
subcellular barriers in skeletal muscle”, NMR Biomed., Vol. 11, 1 (1999)
Kinsey, S.T. and Moerland, T.S., “Metabolite diffusion in giant muscle fibers of the spiny
lobster”, Panulirus argus”. J. Exp. Biol., Vol. 205, 3377 (2002)
Kinsey, S. T., Pathi, P., Hardy, K. M., Jordan, A., and Locke, B. R., “Does Intracellular
metabolite Diffusion Limit Post-Contractile Recovery in Burst Locomotor Muscle”, Journal of Experimental Biology, In Press (2005)
Koller, M. R., Bender, J. G., Miller, W. M., and Papoutsakis, E. T., “Reduced oxygen tensionincreases hematopoiesis in long-term culture of human stem and progenitor cells from cord
blood and bone marrow”, Exp. Hematol, Vol. 20, 264 (1992)
Koller, M. R., Bender, J. G., Miller, W. M., and Papoutsakis, E. T., “Expansion of primitive
human hematopoietic progenitors in a perfusion bioreactor system with IL-3, IL-6, and stem cell
factor”, Bio/Technology, Vol. 11, 358 (1993a)
Koller, M. R., Emerson, S. G., and Palsson, B., “Large-scale expansion of human stem and
progenitor cells from bone marrow mononuclear cells in continuous perfusion cultures”, Blood,
Vol. 82(2), 378-384 (1993b)
Koller, M. R., and Palsson B., “Tissue engineering: Reconstitution of human hematopoiesis ex
vivo”, Biotechnology and Bioengineering, Vol. 42, 909 (1993c)

7/27/2019 Mathematical Modeling of Transport and Reaction in Cellular and T
http://slidepdf.com/reader/full/mathematical-modeling-of-transport-and-reaction-in-cellular-and-t 262/270
242
Koller, M. R., Manchel, I., Palsson, M. A., Maher, R. J., and Palsson, B., “Different measures of
human hematopoietic cell culture performance are optimized under vastly different conditions”,Biotechnology and Bioengineering, Vol. 50, 505 (1996)
Korzeniewski, B., “Regulation of oxidative phosphorylation in different muscles and various
experimental conditions”, Biochem. J., Vol. 375, 799 (2003)
Laluppa, J. A, Papoutsakis, E. T., and Miller, W. M., “Oxygen tension alters the effects of
cytokines on the megakaryocyte, erythrocyte, and granulocyte lineages”, ExperimentalHematology, Vol. 26, 835 (1998)
Langer, R., Vacanti, J. P., “Tissue Engineering”, Science, 920-926 (1993)
Lee, R. B., Urban, J. P. G., “Evidence for a negative Pasteur effect in articular cartilage”,
Biochemical J., Vol. 321, 95 (1997)
Letnam, M. C. 1951. Adsorption. McGraw-Hill, New York
Li, Y., Ma, T., Kniss, D. A., Yang, S. T., and Lasky, L. C. “Human cord cell hematopoiesis in
three-dimensional nonwoven fibrous matrices: In vitro simulation of the marrow
microenvironment”, Journal of Hematotherapy & Stem Cell Research, Vol. 10, 355 (2001)
Li, Y. J., Batra, N. N., You, L., Meier, S. C., Coe, I. A., Yellowley, C. E., Jacobs, C. R.,
“Oscillatory fluid flow affects human marrow stromal cell proliferation and differentiation”, J
Orthop Res, Vol. 22, 1283 (2004)
Locke, B. R., “Electro-transport in hydrophilic nanostructured materials”, Chapter 15, 527,
Nano-Surface Chemistry, Marcel Dekker, Inc., New York
Mahaffy, J. M., Belair, J., and Mackey, M. C., “Hematopoietic model with moving boundary
conditions and state dependent delay: Applications in erythropoiesis”, J .Theor. Biol, Vol. 190,135 (1998)
Mainwood, G.W., and Raukusan, K., “A model for intracellular energy transport”, Can. J.
Physiol. Pharmacol., Vol. 60, 98 (1982)
Malda, J., Rouwkema, J., Martens, D. E., Comte, E. P. Le, Kooy, F. K., Tramper, J., Blitterswijk,
C. A. van, Riesle, J., “Oxygen Gradients in Tissue-Engineered PEGT/PBT Cartilaginous
Constructs: Measurement and Modeling”, Biotechnology and Bioengineering, Vol. 86 (1), 9(2004)
Mantalaris, A., Keng, P., Bourne, P., Chang, A. Y. C., and Wu, J. H. D., “Engineering a human
bone marrow model: A case study on ex vivo erythropoiesis”, Biotechnol. Prog., Vol. 14, 126
(1998)

7/27/2019 Mathematical Modeling of Transport and Reaction in Cellular and T
http://slidepdf.com/reader/full/mathematical-modeling-of-transport-and-reaction-in-cellular-and-t 263/270
243
Martin, I., B. Obradovic, L. E. Freed, G. Vunjak-Novakovic, “Method for Quantitative Analysis
of Glycosaminoglycan Distribution in Cultured Natural and Engineering Cartilage,” Annals of Biomedical Engineering, Vol. 27, 656 (1999)
Martin, I. B.., Wendt, D., and Heberer, M., “The Role of Bioreactors in Tissue Engineering”,
Trends in Biotechnology, Vol. 22 (2), 80 (2004)
McAdams, T., A, Miller, W., M., and Papoutsakis, E. T., “Hematopoietic cell culture therapies
(Part I): cell culture considerations”, TIBTECH, 14 (1996)
MacArthur, B. D., and Oreffo, R. O. C., “Concept Bridging the gap”, Nature, Vol. 433, 19
(2005)
Meinel, L., Karageorgiou, V., Fajardo, R., Snyder, B., Shinde-Patil, V., Zichner, L., Kaplan, D.,
Langer, R., Vunjak-Novakovic, G., “Bone tissue engineering using human mesenchymal stem
cells: Effects of scaffold material and medium flow”, Ann Biomed. Eng., Vol. 32, 112 (2004)
Meyer, R. A., Sweeney, H. L. and Kushmerick, M. J., “A simple analysis of the
‘phosphocreatine shuttle”, Am. J. Physiol., Vol. 246, C365 (1984)
Meyer, R.A., “A linear model of muscle respiration explains monoexponential phosphocreatine
changes”, Am. J. Physiol., Vol. 254, C548 (1988)
Middleman, S., “An Introduction to mass and heat transfer: Principal of analysis and design”,
John Wiley & Sons, Inc., (1998)
Milligan C. L., Walsh P. J., Booth C. E. and McDonald D. L. (1989), “Intracellular acid-base
regulation during recovery from locomotor activity in the blue crab, Callinectes sapidus”,Physiol. Zool., Vol. 62, 621 (1989)
Mitchell, S. A., Poulsson, A. H. C., Davidson, M. R., Emmison, N., Shard, A. G., and Bradley,R. H., “Cellular attachment and spatial control of cells using micro-patterned ultra-violet/ozone
treatment in serum enriched media”, Biomaterials, Vol. 25, 4079-4086 (2004)
Mostafa, S. S., Miller, W. M., and Papoutsakis, E. T., “Oxygen tension influences thedifferentiation, maturation and apoptosis of human megakaryocytes”, British Journal of
Haematology, Vol. 111, 879 (2000)
Mow, V.C., W.C.Hayes (Eds.), “Basic Orthopaedic Biomechanics”, 2nd ed., Lippincott-RavenPublishers, PA, 113-117 (1997)
Nevo, A. C. and Rikmenspoel, R., “Diffusion of ATP in sperm flagella”, J. Theor. Biol. 26, 11
(1970)
Nielsen, L. K., “Bioreactors for hematopoietic cell culture”, Annu. Rev. Biomed. Eng., Vol. 1,129 (1999)

7/27/2019 Mathematical Modeling of Transport and Reaction in Cellular and T
http://slidepdf.com/reader/full/mathematical-modeling-of-transport-and-reaction-in-cellular-and-t 264/270
244
Nielsen, L. K., Papoutsakis, E. T., and Miller, W. M., “Modeling ex vivo hematopoiesis usingchemical engineering metaphors”, Chemical Engineering Science, Vol. 53(10), 1913 (1988)
NIST/SEMATECH e-Handbook of Statistical Methods,
[http://www.itl.nist.gov/div898/handbook/, section 4.1.4.1]
Nordin M, Frankel VH., “Basic Biomechanics of the Muscoskeletal System”, 2nd
ed. Lee &
Febiger, PA, USA. 36 (1989)
Obradovic, B., Carrier, R. L., G.Vunjak-Novakovic, and Freed, L. E., “Gas Exchange is
Essential for Bioreactor Cultivation of Tissue Engineered Cartilage,” Biotechnology andBioengineering, Vol. 63 (2), 197 (1999)
Obradovic, B., Meldon, J. H., Freed, L. E., and G.Vunjak-Novakovic, “GlycosaminoglycanDeposition in Engineered Cartilage: Experiments and Mathematical Model,” AIChE. J., Vol.
46(9), 1860 (2000)
Ochoa, J., “Diffusion and reaction in heterogeneous media”, Ph.D. Dissertation, University
California Davis, (1988)
Oh, D. J., Koller, M. R., and Palsson, B. O., “Frequent harvesting from perfused bone marrowcultures results in increased overall cell and progenitor expansion”, Biotechnology and
Bioengineering, Vol. 44, 609 (1994)
Orlic, D., Kajstura, J., Chimenti, S., Jakoniuk, I., Anderson; S. M., Li, B. S., Pickel, J., McKay,
R., Nadal-Ginard, B., Bodine, D. M., Leri, A., and Anversa, P., “Bone marrow cells regenerateinfarcted myocardium”, Nature, Vol. 410, 701 (2001)
Palsson, B. O., Paek, S. H., Schwartz, R. M., Palsson, M., Lee, G. M., Silver, S., and Emerson, S.G., “Expansion of human bone marrow progenitor cells in a high cell density continuous
perfusion system”, Bio/Technology, Vol. 11, 368 (1993)
Park, J. S., Chu, J. S. F., Cheng, C., Chen, F., Chen, D., Li, S., “Differential effects of equiaxial
and uniaxial strain on mesenchymal stem cells”, Biotechnol Bioeng, Vol. 88, 359 (2004)
Pate, E. and Cooke, R., “The inhibition of muscle contraction by adenosine 5’ (β, γ-imido)triphosphate and by pyrophosphate”, Biophys. J., Vol. 47, 773 (1985)
Patel, S. D., Miller, W. M., Winter, J. N., and Papoutsakis, E. T., “Cell density-dependent
proliferation in frequently-fed peripheral blood mononuclear cell cultures”, Cytotherapy, Vol.
2(4), 267 (2000)
Patel, S. D., Papoutsakis, E. T., Winter, J. N., and Miller, W. M., “The Lactate issue revisited:
Novel feeding protocols to examine inhibition of cell proliferation and glucose metabolism inhematopoietic cell cultures”, Biotechnol. Prog., Vol. 16, 885 (2000)

7/27/2019 Mathematical Modeling of Transport and Reaction in Cellular and T
http://slidepdf.com/reader/full/mathematical-modeling-of-transport-and-reaction-in-cellular-and-t 265/270
245
Pathi, P., Ma, T., and Locke, B. R., “Role of nutrient supply on cell growth in bioreactor designfor tissue engineering of hematopoietic cells”, Biotechnology and Bioengineering, Vol. 89, 743
(2005 a)
Pathi, P., Galban, C. J., Spencer, R. G., Locke, B. R., “Analysis of Tissue Growth andExtracellular Matrix Formation in a Hollow Fiber Bioreactor”, submitted Biotechnology and
Bioengineering (June 2005 b)
Peng, C. A., and Palsson, B. O., “Determination of specific oxygen uptake rates in human
hematopoietic cultures and implications for bioreactor designs”, Annals of Biomedical
Engineering, Vol. 24, 373 (1996 a)
Peng, C. A., Koller, M. R., and Palsson, B., “Unilineage model of hematopoiesis predicts self-
renewal of stem and progenitor cells based on ex vivo growth data”, Biotechnology andBioengineering, Vol. 52, 24 (1996 b)
Penke, B., S. Kinsey, S. J. Gibbs, T. S. Moerland, and B. R. Locke, “Proton Diffusion and T1 relaxation in Polyacrimide Gels: A Unified Approach Using Volume Averaging”, Journal of
Magnetic Resonance, Vol. 132, 240 (1998)
Petersen, E., Potter, K., Butler, J. J., Fishbein, K. W., Horton, W. E., Spencer, R. G., andMcFarland, E. W., “Bioreactor and Probe System for Magnetic resonance Microimaging and
Spectroscopy of Chondrocytes and Neocarilage”, Int. J. Imag. Sys. and Tech., Vol. 8, 285 (1997)
Pisu, M., Lai, N., Coincotti, A., Delogu, F., and Cao, G., “A Simulation Model for the Growth of
Engineered Cartilage on Polymeric Scaffolds”, International Journal of Chemical reactor Engineering, Vol. 1, Article A. 38 (2003)
Potter, K., Butler, J. J., Adams, C., Fishbein, K. W., Mcfarland, E. W., Horton, W. E. andSpencer, R. G., “Cartilage formation in a Hollow Fiber Bioreactor Studied by Proton Magnetic
Resonance Microscopy”, Matrix Biology, Vol. 17, 513 (1998)
Potter, K., Butler, J. J., Horton, W. E., and Spencer, R. G., “Response of Engineered Cartilage
Tissue to Biochemical Agents as Studied by Proton Magnetic Resonance Microscopy”, Arthritis
& Rheumatism, Vol. 43 (7), 1580 (2000)
Prockop, D. J., “Marrow stromal cells as stem cells for nonhematopoietic tissues”, Science, Vol.
276, 71 (1997)
Raimondi, M. T., Boschetti, F., Falcone, L., Fiore, G., B., Remuzzi, A., Marinoni, E., Marazzi,
M., and Pietrabissa, R., “Mechanobiology of Engineered Cartilage Cultured under a Quantified
Fluid Dynamic Environment”, Biomechan Model Mechanobiol, 69 (2002)
Rome, L. C. and Lindstedt, S. L., “The quest for speed: muscles built for high-frequency
contractions”. NIPS., Vol. 13, 261 (1998)
7/27/2019 Mathematical Modeling of Transport and Reaction in Cellular and T
http://slidepdf.com/reader/full/mathematical-modeling-of-transport-and-reaction-in-cellular-and-t 266/270
246
Rotem, A., Toner, M., Bhatia, S., Foy, B. D., Tompkins, R. G., and Yarmush, M. L., “Oxygen is
a factor determining in vitro tissue assembly: Effect on attachment and spreading of hepatocytes”, Biotechnol Bioeng, Vol. 43, 654-660 (1994)
Russel, B., Motlagh, D., and Ashley, W. W., “Form follows function: how muscle shape is
regulated by work”, J. Appl. Physiol., Vol. 88, 1127 (2000)
Ryan DJ, Carbonell RG, Whitaker S., “A Theory of Diffusion and Reaction in Porous Media”,
AIChE Symposium Series, Vol. 71, 46 (1981)
Saks, V., Kuznetsov, A., Andrienko, T., Usson, Y., Appaix, F., Guerrero, K., Kaambre, T., Sikk,
P., Lemba, M. and Vendelin, M., “Heterogeneity of ADP diffusion and regulation of respirationin cardiac cells”, Biophys. J. 84, 3436 (2003)
Saidel, G. M., DiBella II, J. A., Cabrera, M. E., “Metabolic system dynamics: lumped anddistributed models”, Simulations in Biomedicine V, Transaction: Biomedicine and Health
volume 6 (2003)
Schwartz, R. M., Palsson, B. O., and Emerson, S. G., “Rapid medium perfusion rate significantly
increases the productivity and longevity of human bone marrow cultures”, Proc. Natl. Acad. Sci.
USA, Vol. 88, 6760 (1991)
Sengers, B. G., Oomens, Cees W. J., and Baaijens, Frank P. T., “An Integrated Finite-Element
Approach to Mechanics, Transport and Biosynthesis in Tissue Engineering”, Transactions of the
ASME, Vol. 126, 82 (2004)
Silva, C. L., Goncalves, R., Lemos, F., Lemos, M. A. N. D. A., Zanjani, E. D., Porada, G. A.,and Gabral, J. M. S., “Modeling of ex vivo expansion/maintenance of hematopoietic stem cells”,
Bioprocess and Biosystems engineering, Vol. 25, 365 (2003)
Skalak, R., Fox, C. F., “Tissue engineering”, Ann Biomed Eng., Vol. 19, 529 (1991)
Smith, C., “Hematopoietic stem cells and hematopoiesis”, Cancer Control, Vol. 10, 9 (2003)
Smith, E. and Morrison J. F., “Kinetic studies on the arginine kinase reaction”, J. Biol. Chem.,
Vol. 244(15), 4224 (1969)
Stokes, D. R. and Josephson, R. K., “Structural organization of two fast, rhythmically active
crustacean muscles”, Cell Tiss. Res., Vol. 267, 571 (1992)
Suarez, R.K., “Shaken and stirred: muscle structure and metabolism”, J. Exp. Biol., Vol. 206,
2021 (2003)
Sweeney, H. L., “The importance of the creatine kinase reaction: the concept of metabolic
capacitance”, Medicine and Science in Sports and Exercise, Vol. 26 (1), 30 (1994)
7/27/2019 Mathematical Modeling of Transport and Reaction in Cellular and T
http://slidepdf.com/reader/full/mathematical-modeling-of-transport-and-reaction-in-cellular-and-t 267/270
247
Teague, W. E. and Dobson, G. P., “Thermodynamics of the arginine kinase reaction”, J. Biol.
Chem., 274(32), 22459 (1999)
Temenoff, J. S., Mikos, A. G., “Review: Tissue Engineering for Regeneration of Articular
Cartilage”, Biomaterials, Vol. 21, 431 (2000)
Terai, H., Hannouche, D., Ochoa, E., Yamano, Y., and Vacanti, J. P., “In vitro engineering of
bone using a rotational oxygen-permeable bioreactor system”, Mat Sci Eng C-Bio, S 20, 3-8 Sp.
Iss. SI (2002)
Thébault, M. T., Raffin, J. P., and LeGall, J. Y., “In vivo31
P NMR in crustacean muscles: fatigue
and recovery in the tail musculature from the prawn, Palaemon elegans. Biochem”. Biophys.Res. Comm, Vol. 145, 453 (1987)
Tombes, R. M. and Shapiro, B. M., “Metabolite channeling: a phosphocreatine shuttle to mediatehigh energy phosphate transport between sperm mitochondrion and tail”, Cell, Vol. 41, 325
(1985)
Trinh, S. H., Arce, P., Locke, B. R., “Effective diffusivities of point-like molecules in isotropic
porous media by Monte Carlo Simulation”, Transport in Porous Media, Vol. 38, 241-259 (2000)
Truskey, G. A., Nicolakis, D.P., DiMasi, D., Haberman, A., “Kinetic studies and unstructuredmodels of lymphocyte metabolism in fed-batch culture”, Biotechnology and Bioengineering,
Vol. 36, 797 (1990)
Tse, F. W., Govind, C. K., and Atwood, H. L., “Diverse fiber composition of swimming muscles
in the blue crab, Callinectes sapidus”, Can. J. Zool., Vol. 61, 52 (1983)
Tyler, S., and Sidell, B. D., “Changes in mitochondrial distribution and diffusion distances in
muscle of goldfish upon acclimation to cold temperatures”, J. Exp. Biol., Vol. 232, 1 (1984)
Van Dorsten, F. A., Wyss, M., Walliman, T. and Nicolay, K., “Activation of sea urchin sperm
motility is accompanied by an increase in the creatine kinase flux”, Biochem. J., Vol. 325, 411(1997)
Varma, A., Morbidelli, M., and Wu, H., “Parametric Sensitivity in Chemical Systems”. Oxford
University Press, New York, NY (1999)
Vendelin, M., Kongas, O. and Saks, V., “Regulation of mitochondrial respiration in heart cells
analyzed by reaction-diffusion model of energy transfer”, Am. J. Physiol. Cell Physiol., Vol.278, C747 (2000)
Vicini, P. and Kushmerick, M., “Cellular energetics analysis by a mathematical model of energy balance: estimation of parameters in human skeletal muscle”, Am. J. Physiol. Cell Physiol., Vol.
279, C213 (2000)
7/27/2019 Mathematical Modeling of Transport and Reaction in Cellular and T
http://slidepdf.com/reader/full/mathematical-modeling-of-transport-and-reaction-in-cellular-and-t 268/270
248
Vunjak-Novakovic, G., Freed, L. E., Biron, R. J., and Langer, R., “Effects of Mixing on the
Composition and Morphology of Tissue-Engineered Cartilage”, AIChE J., Vol. 42, 860 (1996)
Vunjak-Novakovic, G., Martin, G. I., Obradovic, B., Treppo, S., Grodzinsky, A. J., and Freed, L.
E., “Bioreactor Cultivation Conditions Modulate the Composition and Mechanical Properties of
Tissue-Engineered Cartilage”, J. Orthop. Res., Vol. 17, 130 (1999)
Vunjak-Novakovic, G., Obradovic, B., Martin, G. I., and Freed, L. E., “Bioreactor Studies of
Native and Tissue-Engineered Cartilage”, Biorheology, Vol. 39, 259 (2002)
Walliman, T., Wyss, M., Brdiczka, D., Nicolay, K. and Eppenberger, H.M., “Intracellular
compartmentation, structure and function of creatine kinase isoenzymes in tissues with high andfluctuating energy demands: the ‘phosphocreatine circuit’ for cellular energy homeostasis”,
Biochem. J., Vol. 281, 21 (1992)
Weisz, P.B., “Diffusion and chemical transformation”, Science, Vol. 179, 433 (1973)
Wang, T. Y., and Wu, J. H. D., “A continuous perfusion bioreactor for long-term bone marrowculture”, Annals New York Academy of Sciences, Vol. 665, 274 (1992)
Wang, T. Y., Brennan, J., and Wu, J. H. D., “Multilineal hematopoiesis in a three-dimensional
long-term bone marrow culture”, Experimental Hematology, Vol. 23, 26 (1995)
Wastney, M. E., Yang, D. C., Andretta, D. F., Blumenthal, J., Hylton, J., Canolty, N., Collins, J.
C., and Boston, R. C., “Distributing working versions of published mathematical models for biological systems via the Internet”, Adv Exp Med Biol., Vol. 445, 131 (1998)
Whitaker S., “Diffusion and Dispersion in porous Media”, AIChE J, Vol.13, 420 (1967)
Whitaker, S., “The method of volume averaging - Theory and applications of transport in porousmedia”, Kluwer Academic Publishers (1999)
Wilkins, R. J., Browning, J. A., and Ellory, J. C., “Surviving in a Matrix: Membrane Transport inArticular Chondrocytes”, Journal of Membrane Biology, Vol. 177, 95 (2000)
Williams, K. A., Saini, S., and Wick, T. M., “Computational Fluid Dynamics Modeling of Steady-State Momentum and Mass Transport in a Bioreactor for Cartilage Tissue Engineering”,
Biotechnology Progress, Vol. 18, 951 (2002)
Wilson, C. G., Bonssar, L. G., and Kohles, S. S., “Modeling the dynamic composition of engineered cartilage”, Archives of Biochemistry and Biophysics, Vol. 408, 246 (2002)
Wood, B.D., Whitaker, S., “Diffusion and reaction in biofilms”, Chemical Engineering Science,Vol. 53, 397 (1994)

7/27/2019 Mathematical Modeling of Transport and Reaction in Cellular and T
http://slidepdf.com/reader/full/mathematical-modeling-of-transport-and-reaction-in-cellular-and-t 269/270
249
Wood, B. D., Whitaker, S., “Multi-species Diffusion and reaction in biofilms and cellular
media”, Chemical Engineering Science, Vol. 55, 3397 (2000)
Wood, B. D., Quintard, M., Whitaker, S., “Calculation of effective diffusivities for biofilms and
tissues”, Biotechnology and Bioengineering, Vol. 77(5), 495 (2002)
Yang H., Papoutsakis, E. T., Miller, W. M., “Model-based estimation of myeloid hematopoietic
progenitor cells in ex vivo cultures for cell and gene therapies”. Biotechnology and
Bioengineering, Vol. 72 (2), 144 (2000)
Zammitt, V. A., and Newsholme, E. A., “The maximum activities of hexokinase, phosphorylase,
phosphofructokinase, glycerol phosphate dehydrogenases, lactate dehydrogenase, octopinedehydrogenase, phophoenolpyruvate carboxykinase, nucleoside diphosphatekinase, glutamate-
oxaloacetate transaminase, and arginine kinase in relation to carbohydrate utilization in muscles
from marine invertebrates”, Biochem. J., Vol. 160, 447 (1976)
Zhao, F., and Ma, T., “Perfusion bioreactor system for human mesenchymal stem cell tissueengineering: dynamic cell seeding and constructs development”, Biotechnol Bioeng. , In earlyreview (2005 a)
Zhao, F., Pathi, P., Grayson, W., Xing, Q., Locke, B., R., Ma, T., “Effects of oxygen transport on
3-dimensional human mesenchymal stem cell metabolic activity in perfusion and static cultures:experiments and mathematical model”, Biotechnology Progress, In print (2005 b)
Zhou S, Cui Z, Urban JPG, “Factors Influencing the Oxygen Concentration Gradient from theSynovial Surface of Articular Cartilage to the Cartilage-Bone Interface”, Arthritis &
Rheumatism, Vol. 50 (12) 3915 (2004)

7/27/2019 Mathematical Modeling of Transport and Reaction in Cellular and T
http://slidepdf.com/reader/full/mathematical-modeling-of-transport-and-reaction-in-cellular-and-t 270/270