Embed Size (px)
Citation preview
189U. Schmitz et al. (eds.), MicroRNA Cancer Regulation: Advanced Concepts, Bioinformatics and Systems Biology Tools, Advances in Experimental Medicine and Biology 774,DOI 10.1007/978-94-007-5590-1_11, © Springer Science+Business Media Dordrecht 2013
A. Zinovyev (*) Institut Curie , 26 rue d’Ulm , Paris F-75248 , France
INSERM , U900 , Paris F-75248 , France
Mines ParisTech , Fontainebleau F-77300 , France e-mail: [email protected]
N. Morozova • A. Harel-Belan Laboratoire Epigenetique et Cancer CEA Saclay , CNRS FRE 3377 , 91191 , Gif-sur-Yvette , France
A.N. Gorban Centre for Mathematical Modelling , University of Leicester , Leicester , UK
11
Abstract
MicroRNAs can affect the protein translation using nine mechanistically different mechanisms, including repression of initiation and degradation of the transcript. There is a hot debate in the current literature about which mechanism and in which situations has a dominant role in living cells. The worst, same experimental systems dealing with the same pairs of mRNA and miRNA can provide ambiguous evidences about which is the actual mechanism of translation repression observed in the experiment. We start with reviewing the current knowledge of various mechanisms of miRNA action and suggest that mathematical modeling can help resolving some of the controversial interpretations. We describe three simple mathematical models of miRNA translation that can be used as tools in interpreting the experimental data on the dynamics of protein synthesis. The most complex model developed by us includes all known mechanisms of miRNA action. It allowed us to study possible dynamical patterns corresponding to different miRNA-mediated mechanisms of translation repression and to suggest concrete recipes on determining the dominant mechanism of miRNA action in the form of kinetic signatures. Using computational experiments and systematizing existing evidences from the literature, we justify a hypothesis about co-existence of distinct miRNA-mediated mechanisms of translation repression. The actually observed mechanism will be that acting on or changing the sensitive parameters of the translation process. The limiting place can vary from one experimental setting to another. This model explains the majority of existing controversies reported.
Mathematical Modeling of microRNA-Mediated Mechanisms of Translation Repression
Andrei Zinovyev , Nadya Morozova , Alexander N. Gorban , and Annick Harel-Belan
190 A. Zinovyev et al.
Keywords
microRNA mechanism • Translation • Mathematical modeling • Chemical kinetics • Limiting step • Relaxation time • Dominant system
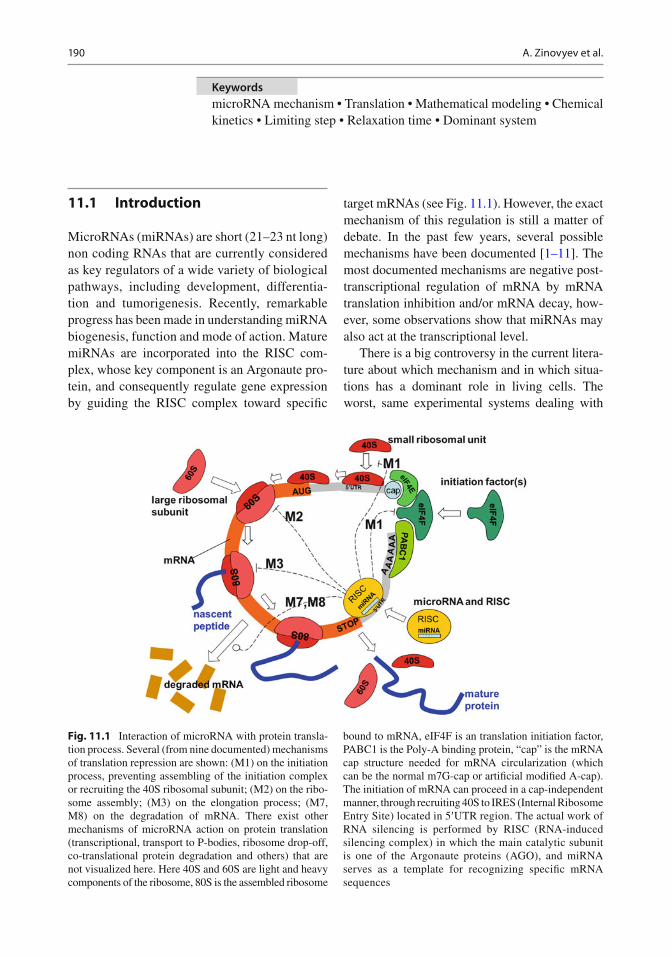
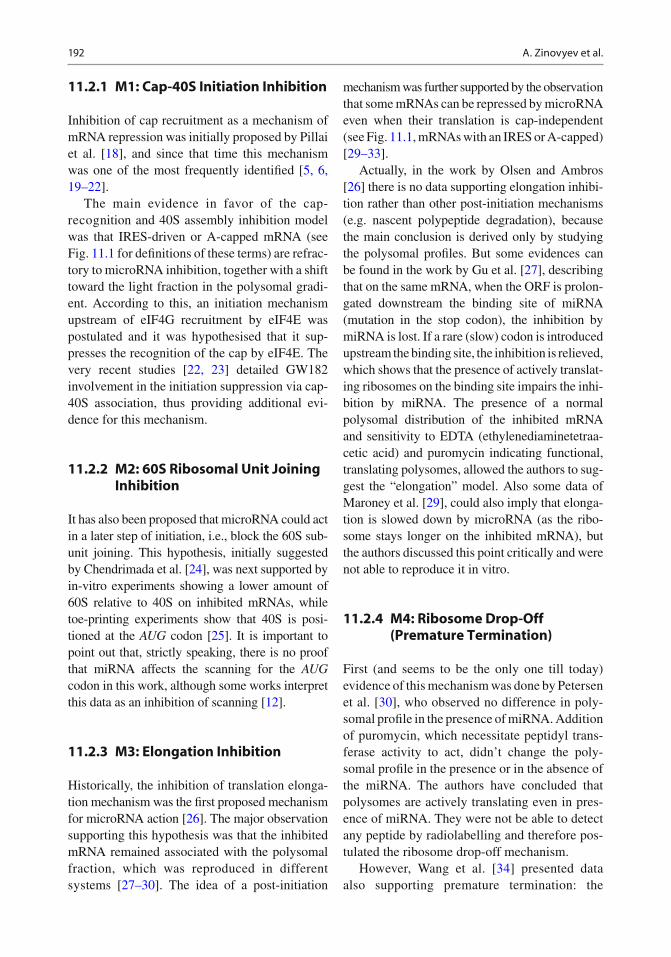
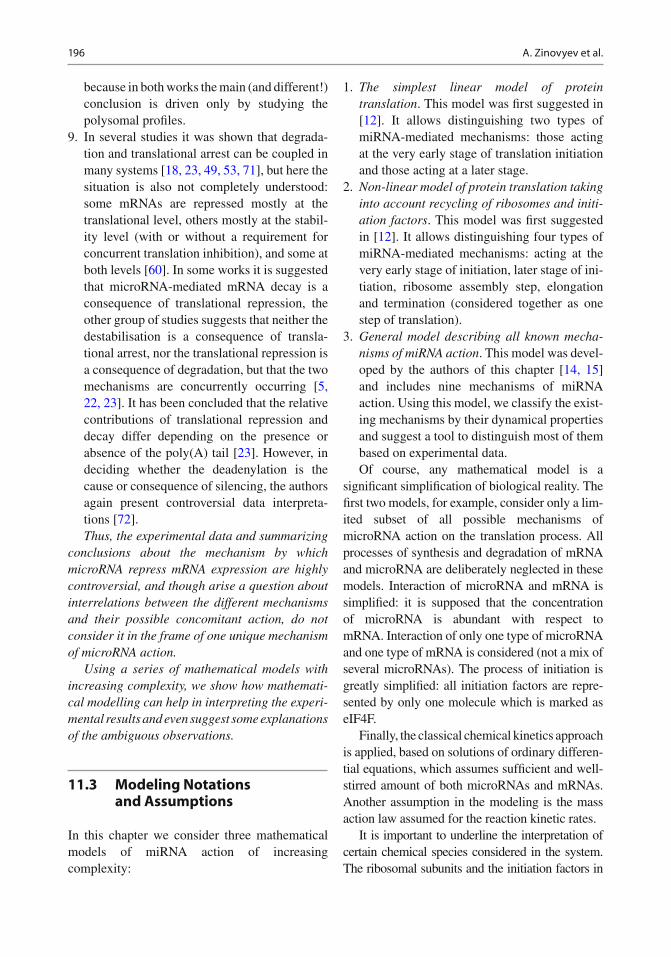
Fig. 11.1 Interaction of microRNA with protein transla-tion process. Several (from nine documented) mechanisms of translation repression are shown: (M1) on the initiation process, preventing assembling of the initiation complex or recruiting the 40S ribosomal subunit; (M2) on the ribo-some assembly; (M3) on the elongation process; (M7, M8) on the degradation of mRNA. There exist other mechanisms of microRNA action on protein translation (transcriptional, transport to P-bodies, ribosome drop-off, co-translational protein degradation and others) that are not visualized here. Here 40S and 60S are light and heavy components of the ribosome, 80S is the assembled ribosome
bound to mRNA, eIF4F is an translation initiation factor, PABC1 is the Poly-A binding protein, “cap” is the mRNA cap structure needed for mRNA circularization (which can be the normal m7G-cap or arti fi cial modi fi ed A-cap). The initiation of mRNA can proceed in a cap-independent manner, through recruiting 40S to IRES (Internal Ribosome Entry Site) located in 5 ¢ UTR region. The actual work of RNA silencing is performed by RISC (RNA-induced silencing complex) in which the main catalytic subunit is one of the Argonaute proteins (AGO), and miRNA serves as a template for recognizing speci fi c mRNA sequences
11.1 Introduction
MicroRNAs (miRNAs) are short (21–23 nt long) non coding RNAs that are currently considered as key regulators of a wide variety of biological pathways, including development, differentia-tion and tumorigenesis. Recently, remarkable progress has been made in understanding miRNA biogenesis, function and mode of action. Mature miRNAs are incorporated into the RISC com-plex, whose key component is an Argonaute pro-tein, and consequently regulate gene expression by guiding the RISC complex toward speci fi c
target mRNAs (see Fig. 11.1 ). However, the exact mechanism of this regulation is still a matter of debate. In the past few years, several possible mechanisms have been documented [ 1– 11 ] . The most documented mechanisms are negative post-transcriptional regulation of mRNA by mRNA translation inhibition and/or mRNA decay, how-ever, some observations show that miRNAs may also act at the transcriptional level.
There is a big controversy in the current litera-ture about which mechanism and in which situa-tions has a dominant role in living cells. The worst, same experimental systems dealing with
19111 Mathematical Modeling of microRNA–Mediated Mechanisms of Translation Repression
the same pairs of mRNA and miRNA can provide controversial evidences about which is the actual mechanism of translation repression observed in the experiment. In this chapter we claim that using mathematical modeling can shed light on resolv-ing contradicting experiment interpretations.
The structure of the chapter is the following: First, we review the whole corpus of available
experimental evidences suggesting existence of various mechanisms of miRNA action. Second, we give a detailed description of three mathematical models all describing the process of protein transla-tion in the presence of miRNA. We start with the simplest linear model, suggested before by Nissan and Parker [ 12 ] . By analytical analysis of this sim-ple model we demonstrate the importance of exploiting not only the stationary properties but also the dynamical properties in interpreting the experi-ments on miRNA-mediated silencing of translation. The second model of protein translation, also sug-gested fi rst by Nissan and Parker and analyzed in [ 13 ] shows how recycling of initiation factors and ribosomal subuntis can be taken explicitly into account and to what limitation effects this can lead. We fi nalize the chapter by describing a mathemati-cal model in which all nine known mechanisms of miRNA action are taken into account, developed by the authors of this chapter [ 14, 15 ] . Based on this model, we formulate practical recipes of distin-guishing mechanisms of miRNA action by observ-ing stationary and dynamical properties of three quantities: total amount of mRNA, amount of pro-tein synthesized and the average number of ribo-somes located on one transcript.
We analyze all three models following a common recipe. The purpose of the analysis is to obtain understanding of how the stationary states and the relaxation times of the model variables depend on model parameters. Though analysis of the stationary state is a well-known approach, analysis of relaxation time is a relatively poorly explored method in systems biology. By de fi nition, the relaxation time is the characteristic time needed for a dynamic variable to change from the initial condition to some close vicinity of the stationary state . The relaxation time is a relatively easily observable quantity, and in some experi-mental methods it is an essential measurement
(relaxometry, for example, see [ 16 ] ). Most natu-rally the relaxation time is introduced in the case of a linear relaxation dynamics. For example, if a variable follows simple dynamics in the form ( )( ) 1 −= − tx t A e λ , where A is the steady-state
value of x , then the relaxation time is =1
tl
and it is the time needed for x to increase from the zero initial value to approximately 1/ e » 63% of the A value. Measuring the approximate relaxation time in practical applications consists in fi tting the linear dynamics to the experimental time curves and estimating l (for example, see [ 17 ] ).
The most complete model allows us to sim-ulate the scenario when several concurrent miRNA mechanisms act at the same time. We show that in this situation interpretation of a biological experiment might be ambiguous and dependent on the context of the experi-mental settings. This allows us to suggest a hypothesis that most of the controversies pub-lished in the literature can be attributed to the fact of co-occurrence of several miRNA mecha-nisms of action, when the observable mecha-nism acts on the limiting place of protein translation which can change from one experi-ment to another.
11.2 Review of Published Experimental Data Supporting Each of Proposed Mechanisms of microRNA Action
Protein translation is a multistep process which can be represented as sequence of stages (initia-tion, ribosome assembly, elongation, termination) involving circularization of mRNA, recruiting the mRNA cap structure and several protein initiation factors and ribosomal components. The process of normal translation can be regulated by small non-coding microRNAs through multiple mecha-nisms (Fig. 11.1 ).
Here we are reviewing available experimental data on all reported mechanisms of microRNA action, grouping them in a way which elucidates the main details supporting each of these pro-posed mechanisms.
192 A. Zinovyev et al.
11.2.1 M1: Cap-40S Initiation Inhibition
Inhibition of cap recruitment as a mechanism of mRNA repression was initially proposed by Pillai et al. [ 18 ] , and since that time this mechanism was one of the most frequently identi fi ed [ 5, 6, 19– 22 ] .
The main evidence in favor of the cap-recognition and 40S assembly inhibition model was that IRES-driven or A-capped mRNA (see Fig. 11.1 for de fi nitions of these terms) are refrac-tory to microRNA inhibition, together with a shift toward the light fraction in the polysomal gradi-ent. According to this, an initiation mechanism upstream of eIF4G recruitment by eIF4E was postulated and it was hypothesised that it sup-presses the recognition of the cap by eIF4E. The very recent studies [ 22, 23 ] detailed GW182 involvement in the initiation suppression via cap-40S association, thus providing additional evi-dence for this mechanism.
11.2.2 M2: 60S Ribosomal Unit Joining Inhibition
It has also been proposed that microRNA could act in a later step of initiation, i.e., block the 60S sub-unit joining. This hypothesis, initially suggested by Chendrimada et al. [ 24 ] , was next supported by in-vitro experiments showing a lower amount of 60S relative to 40S on inhibited mRNAs, while toe-printing experiments show that 40S is posi-tioned at the AUG codon [ 25 ] . It is important to point out that, strictly speaking, there is no proof that miRNA affects the scanning for the AUG codon in this work, although some works interpret this data as an inhibition of scanning [ 12 ] .
11.2.3 M3: Elongation Inhibition
Historically, the inhibition of translation elonga-tion mechanism was the fi rst proposed mechanism for microRNA action [ 26 ] . The major observation supporting this hypothesis was that the inhibited mRNA remained associated with the polysomal fraction, which was reproduced in different systems [ 27– 30 ] . The idea of a post-initiation
mechanism was further supported by the observation that some mRNAs can be repressed by microRNA even when their translation is cap-independent (see Fig. 11.1 , mRNAs with an IRES or A-capped) [ 29– 33 ] .
Actually, in the work by Olsen and Ambros [ 26 ] there is no data supporting elongation inhibi-tion rather than other post-initiation mechanisms (e.g. nascent polypeptide degradation), because the main conclusion is derived only by studying the polysomal pro fi les. But some evidences can be found in the work by Gu et al. [ 27 ] , describing that on the same mRNA, when the ORF is prolon-gated downstream the binding site of miRNA (mutation in the stop codon), the inhibition by miRNA is lost. If a rare (slow) codon is introduced upstream the binding site, the inhibition is relieved, which shows that the presence of actively translat-ing ribosomes on the binding site impairs the inhi-bition by miRNA. The presence of a normal polysomal distribution of the inhibited mRNA and sensitivity to EDTA (ethylenediaminetetraa-cetic acid) and puromycin indicating functional, translating polysomes, allowed the authors to sug-gest the “elongation” model. Also some data of Maroney et al. [ 29 ] , could also imply that elonga-tion is slowed down by microRNA (as the ribo-some stays longer on the inhibited mRNA), but the authors discussed this point critically and were not able to reproduce it in vitro.
11.2.4 M4: Ribosome Drop-Off (Premature Termination)
First (and seems to be the only one till today) evidence of this mechanism was done by Petersen et al. [ 30 ] , who observed no difference in poly-somal pro fi le in the presence of miRNA. Addition of puromycin, which necessitate peptidyl trans-ferase activity to act, didn’t change the poly-somal pro fi le in the presence or in the absence of the miRNA. The authors have concluded that polysomes are actively translating even in pres-ence of miRNA. They were not be able to detect any peptide by radiolabelling and therefore pos-tulated the ribosome drop-off mechanism.
However, Wang et al. [ 34 ] presented data also supporting premature termination: the
19311 Mathematical Modeling of microRNA–Mediated Mechanisms of Translation Repression
read-through codon-stop and more rapid loss of polyribosome upon initiation block.
11.2.5 M5: Co-translational Nascent Protein Degradation
Initially, the idea of nascent protein degradation was proposed by Nottrott et al. [ 35 ] , according to the presence of inhibited mRNA and AGO protein in polysomes, which suggests the action of miRNA on actively translated mRNA. However, no nascent peptide has ever been experimentally demonstrated [ 11, 30, 34, 35 ] ; thus the nascent polypeptide degradation, if it exists, should occur extremely rapidly after the synthesis. Anyhow, being able to immunoprecipitate the nascent poly-peptide together with the mRNA and the poly-some in the case of normal translation, the authors failed to do so in the case of miRNA inhibition [ 35 ] . Pillai et al. in [ 11 ] showed that this degrada-tion, if exists, should be proteasome-independent, and no speci fi c protease or complex involved in this polypeptide degradation has ever been identi fi ed. Data supporting nascent polypeptide degradation are the following: (a) sedimentation of mRNA together with miRNA-RISC complexes in actively translating (puromycin-sensitive) poly-somes; (b) blocking the initiation (in a cap-depen-dent manner), resulted in a shift in polysomal pro fi le, suggesting that the repressed mRNA is actively transcribed. In Wang et al. [ 34 ] the authors also support nascent protein degradation showing polysomal distribution with puromycin sensitiv-ity, but in the same paper they also present data supporting premature termination. Maroney et al. [ 29 ] and Gu et al. [ 27 ] presented experimental data which are very coherent with this line though not concluding that this mechanism is the domi-nating one: presence of miRNA/mRNA complex in polysomes, sensitivity to different conditions is an indication of translating ribosomes.
11.2.6 M6: Sequestration in P-Bodies
An effect of sequestration of mRNA targeted by AGO-microRNA complex in cytoplasmic struc-tures called P-bodies was initially shown in [ 18,
36 ] . Next this result was con fi rmed in many studies characterising P-bodies as structures where the translational machinery is absent and the degradation machinery is functional [ 18, 36– 42 ] . The main propositions about P-bodies’ func-tion was that they sequestrate targeted mRNA apart from translational machinery, or that P-bodies give a kinetics advantage for mRNA decay (local concentration of all needed enzymes). Two additional important points were elucidated in [ 43 ] , showing that mRNA localised in the P-bodies, can be still associated with polysomes, and also that miRNA silencing is still possible when P-bodies are disrupted. This led to the con-clusion that P-bodies are not required for but rather a consequence of microRNA-driven RNA degradation or translational inhibition. This con-clusion is also supported by other studies [ 44 ] and is mostly accepted today. Moreover, only a small portion of miRNA, mRNA and RISC complex is localised inside macroscopic P-bodies [ 18, 44 ] .
11.2.7 M7: mRNA Decay (Destabilisation)
Recently, starting from the fi rst description by Lim et al. [ 45 ] , a lot of data has revealed miRNA-mediated mRNA decay (destabiliza-tion) of targeted mRNA without direct cleavage at the binding site [ 45– 53 ] . Also, most of the authors note that only a slight protein decrease can be obtained by translational inhibition only. When the protein level decreases by more than 33%, mRNA destabilization is the major com-ponent of microRNA-driven silencing [ 46 ] . Anyhow, all these data, concordant in the main point (mRNA decay mechanism), are different in details of its concrete mechanism (decay by mRNA deadenylation, decapping, or 5 ¢ –3 ¢ deg-radation of the mRNA). In the review of Valencia-Sanchez et al. [ 54 ] , it is concluded that the decapping followed by 5 ¢ > 3 ¢ degrada-tion is the most plausible mechanism for the miRNA inhibition, while deadenylation could lead only to a decrease in the initiation ef fi ciency by disrupting the loop between polyA and cap. Behn-Ansmant et al. [ 48 ] , showed that GW182, an AGO partner in the microRNA pathway,
194 A. Zinovyev et al.
triggers deadenilation and decapping of bound mRNA, which leads to mRNA decay. Filipowicz et al. [ 6 ] supports the idea of the degradation running mostly in 5 ¢ > 3 ¢ direction after deade-nylation and decapping, in contradiction to [ 53 ] , where it is claimed that deadenylation is the principal cause of the mRNA decay but deg-radation goes fi rst in the 3 ¢ - > 5 ¢ way. The latter work also indicated that the degradation mech-anism is supposed to be only an addition to the translational inhibition and that translational inhibition has the same ef fi ciency with or with-out degradation. Coller and Parker in 2004 pro-posed that as the poly(A) tail can enhance translation rates and inhibit mRNA decay, then the increase of deadenylation rates by miRNA/RISC could be counted as additional mecha-nism by which translation repression and mRNA decay could be stimulated [ 55 ] . Finally, Eulalio et al. showed that there could be two different cases in mRNA degradation by microRNA: in one the ongoing translation is required for the decay, and in the second the decay occurs in the absence of active transla-tion, and assume that this depends on mRNAs undergoing the decay [ 49 ] .
11.2.8 M8: mRNA Cleavage
mRNA cleavage (similar to what is observed with siRNA) can be observed when the sequence of microRNA is completely or almost completely complementary to its target binding site. The fi rst proposition for this mechanism was made for plants [ 56, 57 ] , and since that time, the miRNA-mediated mRNA cleavage was proved to be very common for plants, and much more rare in ani-mals [ 58, 59 ] .
Though the most of known mammalian microRNAs are only partially complementary to their targets, there is some data on miRNA-medi-ated mRNA cleavage, for example, for miR-196 [ 59 ] . A few other works (e.g., in mammals [ 54, 60 ] or in C. elegans [ 47 ] ) also mentioned cleav-age as a possible mechanism of microRNA repression in animals.
11.2.9 M9: Transcriptional Inhibition Through microRNA-Mediated Chromatin Reorganization Following by Gene Silencing
Although the fi rst publication for siRNA-medi-ated transcriptional repression [ 61 ] was made in 2004, the fi rst publication proving miRNA-medi-ated transcriptional repression in mammalian cells appeared only recently [ 62 ] . Around this time also appeared the fi rst publication for miRNA-mediated transcriptional activation, showing that microRNA-373 induces expression of genes with complementary promoter sequences [ 63 ] . Since then very few evidences of miRNA-directed transcriptional gene silencing (TGS) in mammalian cells were obtained [ 62, 64 ] .
11.2.10 Controversies Between the miRNA-Mediated Mechanisms of Translation Repression
It is important to note that it is extremely dif fi cult to discriminate experimentally between different potential post-initiation mechanisms, such as elon-gation inhibition, premature ribosome dissociation (“ribosome drop-off”) or normal elongation with nascent polypeptide degradation. Both elongation slowing down and nascent polypeptide degradation are supported by the fact that the mRNA-polysomal association is puromycin-sensitive, indicating poly-somes’ activity [ 29, 35 ] and by the observed requirement for microRNA binding in the unstrans-lated region [ 27 ] . Premature ribosome dissociation is supported by decreased read-through of inhib-ited mRNA [ 30 ] . Both ribosome drop-off and ribo-somal “slowing down” are supported by the slight decrease in the number of associated ribosomes [ 29, 35 ] . But, eventually with premature drop-off, the polysomal pro fi le will not be the same as in the case of nascent protein degradation, as one should have less ribosomes per mRNA.
Summarizing overview on the proposed mech-anisms, we brie fl y emphasize the main contro-versial data.
19511 Mathematical Modeling of microRNA–Mediated Mechanisms of Translation Repression
1. First of all, even the question at which level (transcriptional, translational, etc.) the microRNA action takes place is still strongly debated. The most frequently reported, but also very contradictory in details, is the mech-anism of gene repression by microRNAs occurring at the level of mRNA translation (this includes mechanisms of arrest at initia-tion and elongation steps, ribosome drop-off and nascent polypeptide degradation), but repression at the level of mRNA (before trans-lation) have been also proposed as the princi-pal one in many studies (this includes mechanisms of microRNA-mediated mRNA decay, sequestration of target mRNAs in P-bodies and rare in animals but frequent in plants mechanism of target mRNA cleavage). Moreover, it was proposed that some microR-NAs mediate chromatin reorganization fol-lowed by transcriptional repression, which involves mechanisms strikingly different from the previous modes of repression. Finally, the transcriptional activation by microRNA [ 62, 63 ] and translational activation by microRNA have been also proposed [ 65, 66 ] .
2. Currently, the action of microRNAs at the level of initiation of translation seems to be the most favourite one accordingly to many recent publications. Anyhow, the experimen-tal data, supporting this mechanism, are also controversial in the result interpretations of different groups suggesting this mechanism. For example, it has been proposed that AGO2 protein could interact with the cap via the eIF4E-like domain and therefore compete with eIF4E for binding the cap [ 20 ] . However, this has been weakened by the recent fi nding that this domain could be involved in the binding with GW182, an important protein for miRNA action, and by crystallographic analy-sis showing that the folding will not allow such a interaction with the cap [ 23, 67 ] .
The main observation supporting the initia-tion mechanism is that mRNA with IRES or A-cap can’t be inhibited by microRNA, but in the considerable number of works it was shown that some mRNAs can be repressed by
a microRNA even when their translation is cap-independent [ 30– 33 ] .
3. For blocking the 60S subunit joining mecha-nism, it was shown that eIF6, an inhibitor of 60S joining, is required for microRNA action [ 24 ] , but this was contradicted by other studies [ 23 ] .
4. An interesting observation was reported in [ 68 ] about that the same mRNA targeted by the same microRNA can be regulated either at the initia-tion or the elongation step depending on the mRNA promoter. But next, using the same pro-moter described in [ 68 ] , as leading to the initia-tion mechanism, the authors suggests the “elongation” model, according to the polysomal distribution on the inhibited mRNA [ 27 ] .
5. Different results about mechanisms of microRNA action were obtained depending on the transfection method of the inhibited mRNA [ 33 ] .
6. Karaa et al. describes the VEGF gene, which is endogenously regulated by a miRNA, miR16, acting on an IRES (see Fig. 11.1 leg-end) [ 32 ] . VEGF is translated from one of two IRES, and only one of these IRES allows inhi-bition by miR16. Therefore, inhibition by microRNA is possible even in IRES-driven translation, but not for all IRES-driven cases, even if those two IRES have been described as similar.
7. Kozak et al., reviewing different papers about miRNA-mediated inhibition, claimed a lot of experiments to be faulty [ 69 ] and reported that only few studies are based on reliable experi-ments could be considered, namely [ 19, 20, 24, 25, 52, 70 ] . The statement of the author that “other suggested mechanisms are not mentioned here because the speculations greatly exceed the facts” seems to concern [ 18, 30, 33, 35 ] . Together with this, the author is very critical about interpretations of the IRES experiments.
8. Olsen et al. has described inhibition of elonga-tion step, based on the presence of polysomal distribution [ 26 ] . But, actually, there is no additional data supporting elongation inhibition rather than nascent polypeptide degradation,
196 A. Zinovyev et al.
because in both works the main (and different!) conclusion is driven only by studying the polysomal pro fi les.
9. In several studies it was shown that degrada-tion and translational arrest can be coupled in many systems [ 18, 23, 49, 53, 71 ] , but here the situation is also not completely understood: some mRNAs are repressed mostly at the translational level, others mostly at the stabil-ity level (with or without a requirement for concurrent translation inhibition), and some at both levels [ 60 ] . In some works it is suggested that microRNA-mediated mRNA decay is a consequence of translational repression, the other group of studies suggests that neither the destabilisation is a consequence of transla-tional arrest, nor the translational repression is a consequence of degradation, but that the two mechanisms are concurrently occurring [ 5, 22, 23 ] . It has been concluded that the relative contributions of translational repression and decay differ depending on the presence or absence of the poly(A) tail [ 23 ] . However, in deciding whether the deadenylation is the cause or consequence of silencing, the authors again present controversial data interpreta-tions [ 72 ] . Thus, the experimental data and summarizing
conclusions about the mechanism by which microRNA repress mRNA expression are highly controversial, and though arise a question about interrelations between the different mechanisms and their possible concomitant action, do not consider it in the frame of one unique mechanism of microRNA action.
Using a series of mathematical models with increasing complexity, we show how mathemati-cal modelling can help in interpreting the experi-mental results and even suggest some explanations of the ambiguous observations.
11.3 Modeling Notations and Assumptions
In this chapter we consider three mathematical models of miRNA action of increasing complexity:
1. The simplest linear model of protein translation . This model was fi rst suggested in [ 12 ] . It allows distinguishing two types of miRNA-mediated mechanisms: those acting at the very early stage of translation initiation and those acting at a later stage.
2. Non-linear model of protein translation taking into account recycling of ribosomes and initi-ation factors . This model was fi rst suggested in [ 12 ] . It allows distinguishing four types of miRNA-mediated mechanisms: acting at the very early stage of initiation, later stage of ini-tiation, ribosome assembly step, elongation and termination (considered together as one step of translation).
3. General model describing all known mecha-nisms of miRNA action . This model was devel-oped by the authors of this chapter [ 14, 15 ] and includes nine mechanisms of miRNA action. Using this model, we classify the exist-ing mechanisms by their dynamical properties and suggest a tool to distinguish most of them based on experimental data. Of course, any mathematical model is a
signi fi cant simpli fi cation of biological reality. The fi rst two models, for example, consider only a lim-ited subset of all possible mechanisms of microRNA action on the translation process. All processes of synthesis and degradation of mRNA and microRNA are deliberately neglected in these models. Interaction of microRNA and mRNA is simpli fi ed: it is supposed that the concentration of microRNA is abundant with respect to mRNA. Interaction of only one type of microRNA and one type of mRNA is considered (not a mix of several microRNAs). The process of initiation is greatly simpli fi ed: all initiation factors are repre-sented by only one molecule which is marked as eIF4F.
Finally, the classical chemical kinetics approach is applied, based on solutions of ordinary differen-tial equations, which assumes suf fi cient and well-stirred amount of both microRNAs and mRNAs. Another assumption in the modeling is the mass action law assumed for the reaction kinetic rates.
It is important to underline the interpretation of certain chemical species considered in the system. The ribosomal subunits and the initiation factors in
19711 Mathematical Modeling of microRNA–Mediated Mechanisms of Translation Repression
the model exist in free and bound forms. Moreover, the ribosomal subunits can be bound to several regions of mRNA (the initiation site, the start codon, the coding part). Importantly, several copies of fully assembled ribosomes can be bound to one mRNA. To model this situation, we have to introduce the fol-lowing quanti fi cation rule for chemical species: amount of “ribosome bound to mRNA” means the total number of ribosomes translating proteins, which is not equal to the number of mRNAs with ribosome sitting on them, since one mRNA can hold several translating ribosomes (polyribosome). In this view, mRNAs act as places or catalyzers , where translation takes place, whereas mRNA itself for-mally is not consumed in the process of translation, but, of course, can be degraded or synthesized.
Let us introduce notations that will be used throughout the chapter for designation of chemi-cal species: 1. 40S , free small ribosomal subunit. 2. 60S , free large ribosomal subunit. 3. eIF4F , free initiation factor. 4. M, free mRNA (models 1 and 2) and mRNA
with free initiation site (model 3). 5. P, translated protein. 6. B , mRNA located in P-bodies. 7. F , state of mRNA when the small ribosomal
subunit bound to the initiation site. 8. A , state of mRNA when the small ribosomal
subunit bound to the start codon. 9. R , translating ribosome, located on mRNA.
Square brackets will denote the amounts of the corresponding species. For example, [ M ] will denote the amount of free mRNA in the system.
Note that the notations for the kinetic rate constants are not equivalent in three models. For example, while k
1 noti fi es the kinetic rate of the
cap initiation in the models 1 and 2, it has differ-ent measure units in linear and non-linear mod-els. Moreover, in the model 3, k
1 noti fi es the rate
constant for translation initiation (recruiting 40S subunit) of mRNA already in translation pro-cess. Hence, the meaning of k
i constants should
be considered differently per each model type.
11.4 Simplest Linear Model of Protein Translation
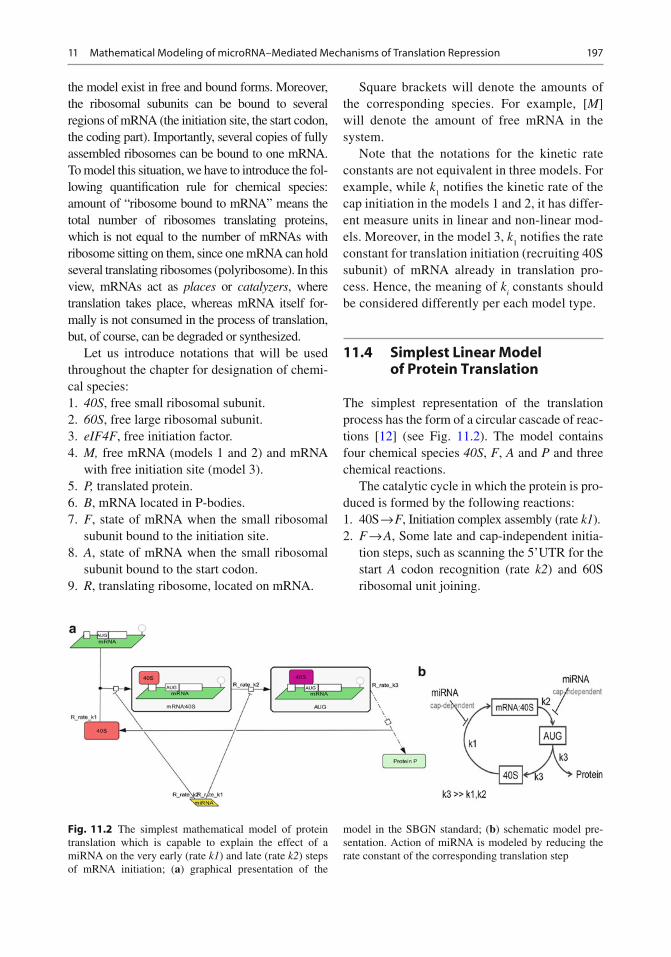
The simplest representation of the translation process has the form of a circular cascade of reac-tions [ 12 ] (see Fig. 11.2 ). The model contains four chemical species 40S , F , A and P and three chemical reactions.
The catalytic cycle in which the protein is pro-duced is formed by the following reactions: 1. 40S → F , Initiation complex assembly (rate k1 ). 2. F → A , Some late and cap-independent initia-
tion steps, such as scanning the 5’UTR for the start A codon recognition (rate k2 ) and 60S ribosomal unit joining.
Fig. 11.2 The simplest mathematical model of protein translation which is capable to explain the effect of a miRNA on the very early (rate k1 ) and late (rate k2 ) steps of mRNA initiation; ( a ) graphical presentation of the
model in the SBGN standard; ( b ) schematic model pre-sentation. Action of miRNA is modeled by reducing the rate constant of the corresponding translation step
198 A. Zinovyev et al.
3. A → 40S, combined processes of protein elon-gation and termination, which leads to pro-duction of the protein (rate k3 ), and fall off of the ribosome from mRNA. The model is described by the following
system of equations [ 12 ] :
[40 ]( )1[40 ] 3[ ]
[ ]( )1[40 ] 2[ ]
[ ]( )2[ ] 3[ ]
( ) 3[ ]( )
⎧ = − +⎪⎪⎪ = −⎪⎨⎪
= −⎪⎪⎪ =⎩
d S tk S k A
dtd F t
k S k Fdt
d A tk F k A
dtPsynth t k A t (11.1)
where Psynth ( t ) is the rate of protein synthesis. Following [ 12 ] , let us assume that k3 >> k1 ,
k2 . This choice was justi fi ed by the following statement: “…The subunit joining and protein production rate ( k3 ) is faster than k1 and k2 since mRNA-40 S complexes bound to the A without the 60S subunit are generally not observed in translation initiation unless this step is stalled by experimental methods, and elonga-tion is generally thought to not be rate limiting in protein synthesis…” [ 12 ] .
Under this condition, the Eq. 11.1 have the following approximate solution (which becomes the more exact the smaller the ( k1 + k2 )/ k3 ratio), suggested earlier in [ 13 ] :
3 ( 1 2)0
40 ( ) 1 / 1 1 040 1 1
( ) 1 / 2 1 1 ,1 1 3 2
( ) 1 / 3 0 11 2
− − +
⎛ ⎞−⎡ ⎤ ⎡ ⎤ ⎡ ⎤ ⎡ ⎤⎢ ⎥ ⎢ ⎥ ⎢ ⎥ ⎢ ⎥⎜ ⎟= + +⎢ ⎥ ⎢ ⎥ ⎢ ⎥ ⎢ ⎥⎜ ⎟⎜ ⎟+⎢ ⎥ ⎢ ⎥ ⎢ ⎥ ⎢ ⎥−⎝ ⎠⎣ ⎦ ⎣ ⎦ ⎣ ⎦ ⎣ ⎦
k t k k t
S t kS
F t k e ek k
A t kk k
(11.2)
− +⎛ ⎞= −⎜ ⎟⎝ ⎠+
( 1 2)040 3(t) 1
1 1 21 2
k k tS kPsynth e
kk k
(11.3)
for the initial condition
040 ( ) 40
( ) 0.
( ) 0
0
S t S
F t
A t
Psynth
⎡ ⎤ ⎡ ⎤⎢ ⎥ ⎢ ⎥⎢ ⎥ ⎢ ⎥=⎢ ⎥ ⎢ ⎥⎢ ⎥ ⎢ ⎥⎣ ⎦ ⎣ ⎦
From the solution ( 11.2 – 11.3 ) it follows that the dynamics of the system evolves on two time scales: (1) fast elongation dynamics on the time scale » 1/ k3 ; and (2) relatively slow translation initiation dynamics with the relaxation time t
rel »
+1
1 2k k . The protein synthesis rate formula
(2–3) does not include the k3 rate, since it is neglected with respect to k1 , k2 values. From (2–3) we can extract the formula for the protein synthesis steady-state rate Psynth ( t ) (multiplier before the parentheses) and the relaxation time t
rel
for it (inverse of the exponent power):
= =++
040 1, .
1 1 1 21 2
rel
SPsynth t
k kk k
(11.4)
Now let us consider two experimental situa-tions: (1) the rate constants for the two transla-tion initiation steps are comparable k1 » k2 , and (2) the cap-dependent rate k1 is limiting: k1 << k2 . Accordingly to [ 12 ] , the second situation can correspond to modi fi ed mRNA with an alterna-tive cap-structure (A-cap), which is much less ef fi cient for the assembly of the initiation factors, 40S ribosomal subunit and polyA-binding proteins.
For these two experimental systems (let us call them “wild-type” and “modi fi ed” corre-spondingly), let us study the effect of microRNA action. We will model the microRNA action by diminishing the value of a kinetic rate constant for the reaction representing the step on which the microRNA is acting. Let us assume that there are two alternative mechanisms: (1) microRNA acts in a cap-dependent manner (thus, reducing the k1 constant) and (2) microRNA acts in a cap-independent manner, for example, through
19911 Mathematical Modeling of microRNA–Mediated Mechanisms of Translation Repression
interfering with 60S subunit joining (thus, reducing the k2 constant). The dependence of the
steady rate of protein synthesis Psynth ~ +
11 11 2k k
and the relaxation time t rel
» +1
1 2k k on the
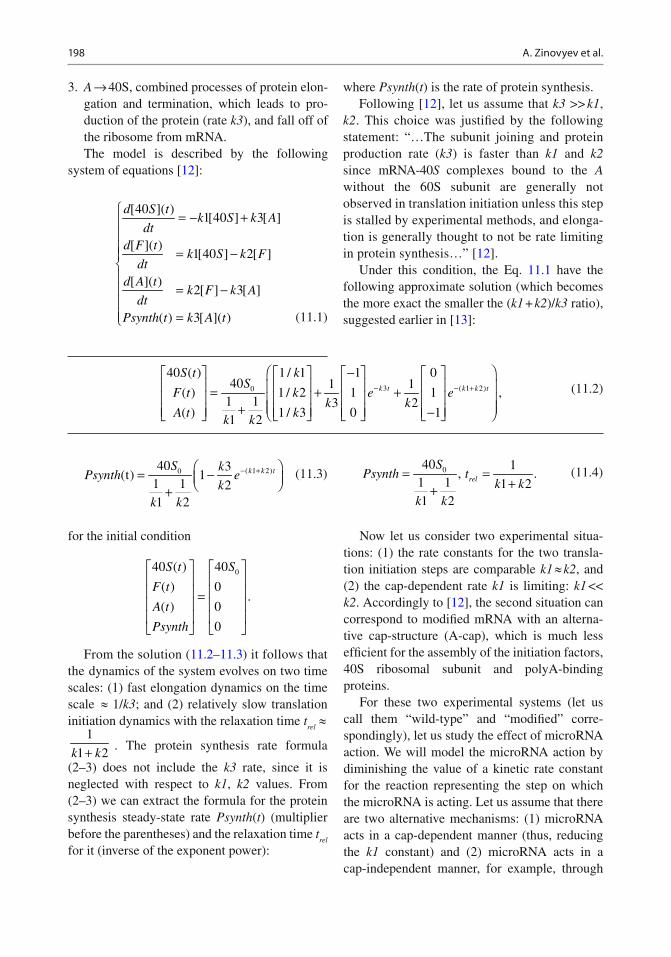
ef fi ciency of the microRNA action (i.e., how much it is capable to diminish a rate coef fi cient) is shown in Fig. 11.3 .
Interestingly, experiments with cap structure replacement were made and the effect of microRNA action on the translation was mea-sured [ 21, 70 ] . No change in the protein rate syn-thesis after applying microRNA was observed. From this it was concluded that microRNA in this system should act through a cap-dependent mechanism (i.e., the normal “wild-type” cap is required for microRNA recruitment). It was argued that this could be a misinterpretation [ 12 ] since in the “modi fi ed” system, cap-dependent translation initiation is a rate limiting process ( k1 << k2 ). Hence, even if microRNA acts in the cap-independent manner (inhibiting k2 ), it will have no effect on the fi nal steady state protein synthesis rate. This was con fi rmed by the graph similar to the Fig. 11.3a .
From the analytical solution (2–3) we can fur-ther develop this idea and claim that it is possible to detect the action of microRNA in the “modi fi ed” system if one measures the protein synthesis relaxation time: if it signi fi cantly increases then microRNA probably acts in the cap-independent manner despite the fact that the steady state rate of the protein synthesis does not change. This is a simple consequence of the fact that the relaxation time in a cycle of biochemical reactions is limited by the second slowest reaction, see [ 13, 73 ] . If the relaxation time does not change in the pres-ence of microRNA then we can conclude that none of the two alternative mechanisms of microRNA-based translation repression is acti-vated in the system, hence, microRNA action is dependent on the structure of the “wild-type” transcript cap.
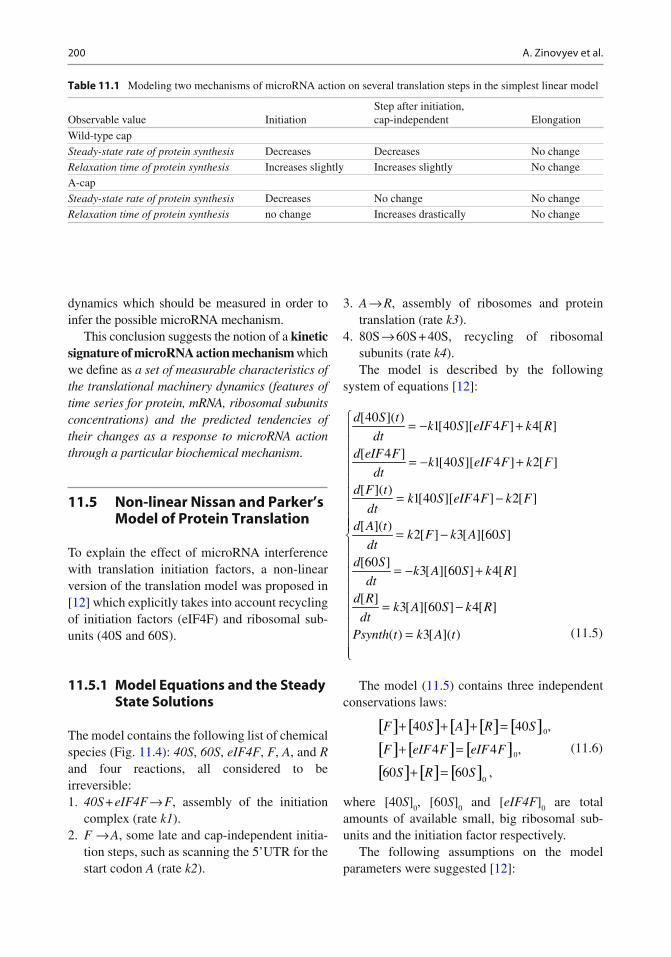
The observations from the Fig. 11.3 are reca-pitulated in the Table 11.1 . This analysis (of course, over-simpli fi ed in many aspects) provides us with an important lesson: observed dynamical features of the translation process with and without pres-ence of microRNA can give clues on the mecha-nisms of microRNA action and help to distinguish them in a particular experimental situation. Theoretical analysis of the translation dynamics highlights the important characteristics of the
Fig. 11.3 Dependence of the relative change of the pro-tein synthesis steady rate and the relaxation time (time needed to achieve the steady rate) on the ef fi ciency with which microRNA can act at an early cap-dependent ( k1 )
or late cap-independent ( k2 ) rate of translation. Two sce-narios are considered: a wild-type one when k1 value is similar to k2 and the case of a modi fi ed A-cap structure when k1 << k2 even in the absence of miRNA
200 A. Zinovyev et al.
dynamics which should be measured in order to infer the possible microRNA mechanism.
This conclusion suggests the notion of a kinetic signature of microRNA action mechanism which we de fi ne as a set of measurable characteristics of the translational machinery dynamics (features of time series for protein, mRNA, ribosomal subunits concentrations) and the predicted tendencies of their changes as a response to microRNA action through a particular biochemical mechanism .
11.5 Non-linear Nissan and Parker’s Model of Protein Translation
To explain the effect of microRNA interference with translation initiation factors, a non-linear version of the translation model was proposed in [ 12 ] which explicitly takes into account recycling of initiation factors (eIF4F) and ribosomal sub-units (40S and 60S).
11.5.1 Model Equations and the Steady State Solutions
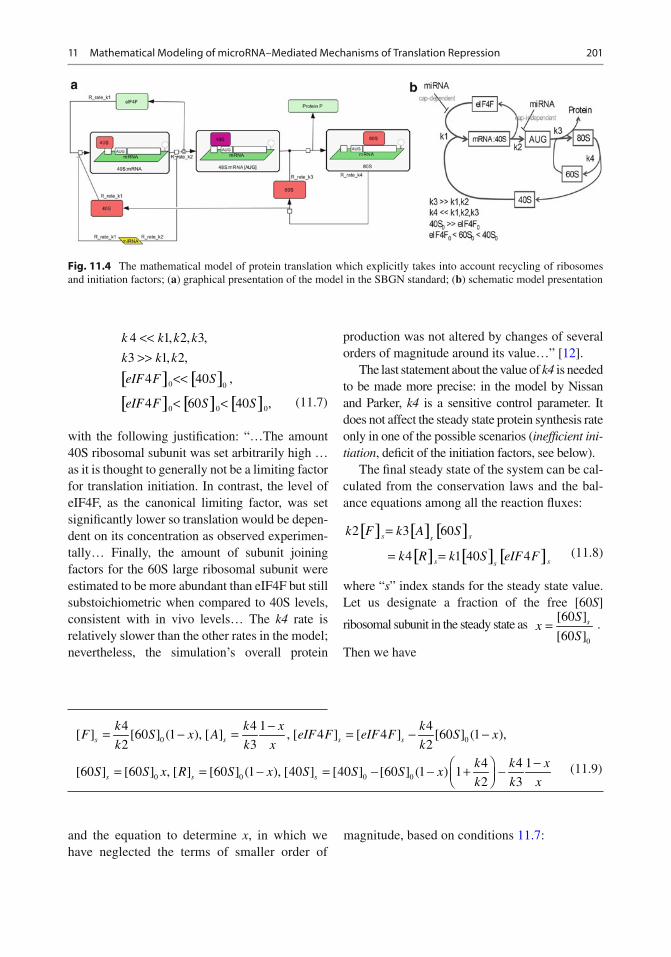
The model contains the following list of chemical species (Fig. 11.4 ): 40S , 60S , eIF4F , F , A , and R and four reactions, all considered to be irreversible: 1. 40S + eIF4F → F , assembly of the initiation
complex (rate k1 ). 2. F → A , some late and cap-independent initia-
tion steps, such as scanning the 5’UTR for the start codon A (rate k2 ).
3. A → R , assembly of ribosomes and protein translation (rate k3 ).
4. 80S → 60S + 40S, recycling of ribosomal subunits (rate k4 ). The model is described by the following
system of equations [ 12 ] :
⎧ = − +⎪⎪⎪ = − +⎪⎪⎪ = −⎪⎪⎪ = −⎨
= − +
= −
=⎩
[40 ]( )1[40 ][ 4 ] 4[ ]
[ 4 ]1[40 ][ 4 ] 2[ ]
[ ]( )1[40 ][ 4 ] 2[ ]
[ ]( )2[ ] 3[ ][60 ]
[60 ]3[ ][60 ] 4[ ]
[ ]3[ ][60 ] 4[ ]
( ) 3[ ]( )
d S tk S eIF F k R
dtd eIF F
k S eIF F k Fdt
d F tk S eIF F k F
dtd A t
k F k A Sdt
d Sk A S k R
dtd R
k A S k Rdt
Psynth t k A t
⎪⎪⎪⎪⎪⎪⎪⎪⎪
(11.5)
The model ( 11.5 ) contains three independent conservations laws:
[ ] [ ] [ ] [ ] [ ][ ] [ ] [ ][ ] [ ] [ ]
0
0
0
40 40 ,
4 4 ,
60 60 ,
F S A R S
F eIF F eIF F
S R S
+ + + =
+ =
+ =
(11.6)
where [40 S ] 0 , [60 S ]
0 and [ eIF4F ]
0 are total
amounts of available small, big ribosomal sub-units and the initiation factor respectively.
The following assumptions on the model parameters were suggested [ 12 ] :
Table 11.1 Modeling two mechanisms of microRNA action on several translation steps in the simplest linear model
Observable value Initiation Step after initiation, cap-independent Elongation
Wild-type cap Steady-state rate of protein synthesis Decreases Decreases No change Relaxation time of protein synthesis Increases slightly Increases slightly No change A-cap Steady-state rate of protein synthesis Decreases No change No change Relaxation time of protein synthesis no change Increases drastically No change
20111 Mathematical Modeling of microRNA–Mediated Mechanisms of Translation Repression
[ ] [ ][ ] [ ] [ ]
0 0
0 0 0
4 1, 2, 3,
3 1, 2,
4 40 ,
4 60 40 ,
<<>>
<<
< <
k k k k
k k k
eIF F S
eIF F S S (11.7)
with the following justi fi cation: “…The amount 40S ribosomal subunit was set arbitrarily high … as it is thought to generally not be a limiting factor for translation initiation. In contrast, the level of eIF4F, as the canonical limiting factor, was set signi fi cantly lower so translation would be depen-dent on its concentration as observed experimen-tally… Finally, the amount of subunit joining factors for the 60S large ribosomal subunit were estimated to be more abundant than eIF4F but still substoichiometric when compared to 40S levels, consistent with in vivo levels… The k4 rate is relatively slower than the other rates in the model; nevertheless, the simulation’s overall protein
production was not altered by changes of several orders of magnitude around its value…” [ 12 ] .
The last statement about the value of k4 is needed to be made more precise: in the model by Nissan and Parker, k4 is a sensitive control parameter. It does not affect the steady state protein synthesis rate only in one of the possible scenarios ( inef fi cient ini-tiation , de fi cit of the initiation factors, see below).
The fi nal steady state of the system can be cal-culated from the conservation laws and the bal-ance equations among all the reaction fl uxes:
[ ] [ ] [ ][ ] [ ] [ ]
2 3 60
4 1 40 4
s ss
s ss
k F k A S
k R k S eIF F
=
= = (11.8)
where “ s ” index stands for the steady state value. Let us designate a fraction of the free [60 S ]
ribosomal subunit in the steady state as =0
[60 ]
[60 ]sS
xS
.
Then we have
Fig. 11.4 The mathematical model of protein translation which explicitly takes into account recycling of ribosomes and initiation factors; ( a ) graphical presentation of the model in the SBGN standard; ( b ) schematic model presentation
0 0
0 0 0 0
4 4 1 4[ ] [60 ] (1 ), [ ] , [ 4 ] [ 4 ] [60 ] (1 ),
2 3 24 4 1
[60 ] [60 ] , [ ] [60 ] (1 ), [40 ] [40 ] [60 ] (1 ) 12 3
−= − = = − −
−⎛ ⎞= = − = − − + −⎜ ⎟⎝ ⎠
s s s s
s s s
k k x kF S x A eIF F eIF F S x
k k x kk k x
S S x R S x S S S xk k x
(11.9)
and the equation to determine x , in which we have neglected the terms of smaller order of
magnitude, based on conditions 11.7 :
202 A. Zinovyev et al.
From the inequalities on the parameters of the model, we have d > 1, g << 1 and, if k1 >> k4 /[ eIF4F ]
0 then a << b . From these remarks it fol-
lows that the constant term g (1– b ) of the
Eq. 11.10 should be much smaller than the other polynomial coef fi cients, and the Eq. 11.10 should have one solution close to zero and two others:
+ + − + − + − + − − + − =
= = = =
3 2
0 0
0 0 0 0
( ( 1) ( 1)) ( ( 1)( 1)) (1 ) 0,
2[ 4 ] [40 ]2 4, , , .
1[60 ] 4[60 ] 3[60 ]
[60 ]
x x x
k eIF F Sk k
k S k S k S S
a d b a d b g b
a b g d
(11.10)
2
0 0 00 1 2
00 0 0 0 0
0
2[ 4 ] 2 [ 4 ] [40 ]4 1, 1 , 1
2[ 4 ]3([40 ] [60 ] ) 4[60 ] 1· 4·[40 ] [60 ]14[40 ]
≈ ≈ − + ≈ −− −
k eIF F k eIF F Skx x x
k eIF Fk S S k S k k S Sk S
(11.11)
provided that a <<|1– d | or a <<|1– b |. In the expression for x1 we cannot neglect the term pro-portional to a , to avoid zero values in 11.10 .
The solution x 2 is always negative, which
means that one can have one positive solution
x 0 <<1, if
0
0
2[ 4 ]1
4[60 ]≥
k eIF F
k S , and two positive
solutions x 0 and x
1 , if 0
0
2[ 4 ]1
4[60 ]≤
k eIF F
k S . However,
it is easy to check that if x 1 > 0 then x
0 does not
correspond to a positive value of [ eIF4F ] s . This
means that for a given combination of parameters satisfying ( 11.7 ) we can have only one steady state (either x
0 or x
1 ).
The two values x = x 0 and x = x
1 correspond to
two different modes of translation . When, for example, the amount of the initiation factors [ eIF4F ]
0 is not enough to provide ef fi cient
initiation ( <00
2[ 4 ]
4[60 ]
keIF F
k S , x = x
1 ) then
most of the 40S and 60S subunits remain in the free form, the initiation factor eIF4F being always the limiting factor. If the initiation is ef fi cient
enough ( >00
2[ 4 ]
4[60 ]
keIF F
k S ), then we have
x = x 0 <<1 when almost all 60S ribosomal sub-
units are engaged in the protein elongation, and [ eIF4F ] being a limiting factor at the early stage.
However, it is liberated after and ribosomal sub-units recycling becomes limiting in the initiation (see the next section for the analysis of the dynamics).
Let us notice that the steady state protein syn-thesis rate under these assumptions is
0
00
0
0
4[60 ] (1 )
2[ 4 ]4[60 ] , 1
4[60 ] .
2[ 4 ] ,
= −
⎧ >⎪= ⎨⎪⎩
Psynth k S x
k eIF Fk S if
k S
k eIF F else (11.12)
This explains the numerical results obtained in [ 12 ] : with low concentrations of [ eIF4F ]
0
microRNA action would be ef fi cient only if it affects k2 or if it competes with eIF4F for bind-ing to the mRNA cap structure (thus, effectively further reducing the level [ eIF4F ]
0 ). With higher
concentrations of [ eIF4F ] 0 , other limiting fac-
tors become dominant: [60S] 0 (availability of
the heavy ribosomal subunit) and k4 (speed of ribosomal subunits recycling which is the slow-est reaction rate in the system). Interestingly, in any situation the protein translation rate does not depend on the value of k1 directly (of course, unless it does not become “globally” rate limit-ing), but only through competing with eIF4F (which makes the difference with the simplest linear protein translation model).
Equation 11.12 explains also some experi-mental results reported in [ 70 ] : increasing the
20311 Mathematical Modeling of microRNA–Mediated Mechanisms of Translation Repression
concentration of [eIF4F] translation initiation factor enhances protein synthesis but its effect is abruptly saturated above a certain level.
11.5.2 Analysis of the Model Dynamics
It was proposed to use the following model parameters: k1 = k2 = 2, k3 = 5, k4 = 1, [40S]
0 = 100,
[60S] 0 = 25, [eIF4F]
0 = 6 [ 12 ] . As we have shown
in the previous section, there are two scenarios of translation possible in the Nissan and Parker’s model which we called “ef fi cient” and “inef fi cient” initiation. The choice between these two scenarios is determined by the combination
of parameters = 0
0
2[ 4 ]
4[60 ]
k eIF F
k Sb . For the original
parameters from [ 12 ] , b = 0.48 < 1 and this corre-sponds to the simple one-stage “inef fi cient” ini-tiation scenario. To illustrate the alternative situation, we changed the value of k4 parameter, putting it to 0.1, which makes b = 4.8 > 1. The lat-ter case corresponds to the “ef fi cient” initiation scenario, the dynamics is more complex and goes in three stages (see below).
Simulations of the protein translation model with these parameters and the initial conditions
0
0
0
[40 ][40 ]
[ 4 ][ 4 ]
0[ ]
0[ ]
0[ ]
[60 ][60 ]
SS
eIF FeIF F
F
A
R
SS
⎡ ⎤⎡ ⎤⎢ ⎥⎢ ⎥⎢ ⎥⎢ ⎥⎢ ⎥⎢ ⎥
= ⎢ ⎥⎢ ⎥⎢ ⎥⎢ ⎥⎢ ⎥⎢ ⎥⎢ ⎥⎢ ⎥
⎢ ⎥ ⎢ ⎥⎣ ⎦ ⎣ ⎦
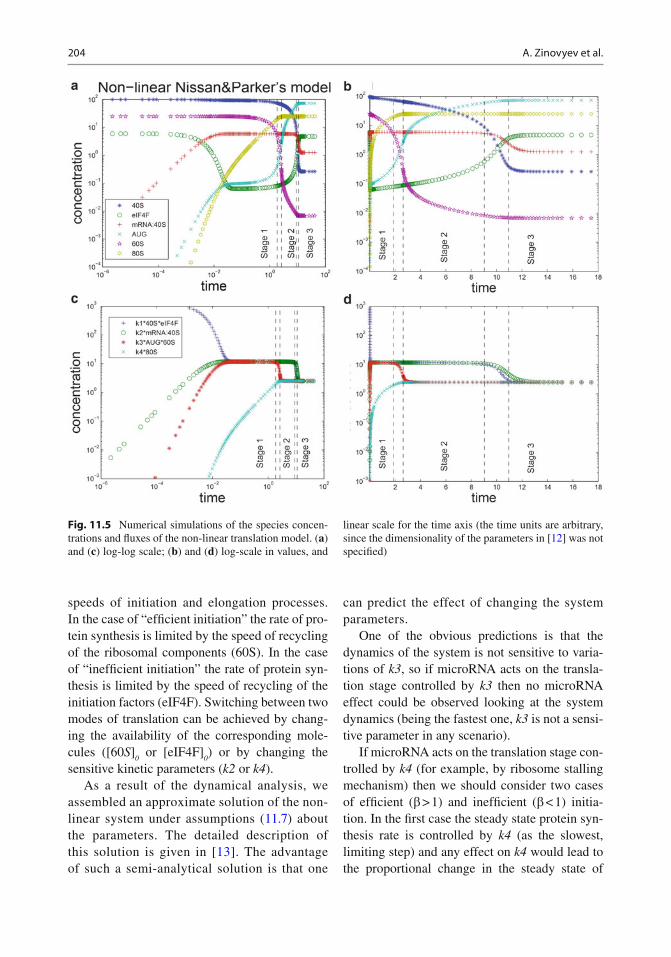
are shown in Fig. 11.5 . The system shows non-trivial relaxation process which takes place in several epochs. Qualitatively we can distinguish the following stages: 1. Stage 1: Relatively fast relaxation with condi-
tions [40 S ] >> [ eIF4F ], [60 S ] >> [ A ]. During this stage, the two non-linear reactions 40 S + eIF4F → F and A + 60 S → R can be con-sidered as pseudo-monomolecular ones: eIF4F → F and A → R with rate constants
dependent on [40 S ] and [60 S ] respectively. This stage is characterized by rapidly estab-lishing quasiequilibrium of three fi rst reac-tions (R1, R2 and R3 with k1 , k2 and k3 constants). Biologically, this stage corre-sponds to the assembling of the translation initiation machinery, scanning for the start codon and assembly of the fi rst full ribosome at the start codon position.
2. Transition between Stage 1 and Stage 2. 3. Stage 2: Relaxation with the conditions [40 S ]
>> [eIF4F], [60 S ] << [ A ]. During this stage, the reactions 40 S + eIF4F → F and A + 60 S → R can be considered as pseudo-monomolecular eIF4F → F and 60 S → 80 S . This stage is char-acterized by two local quasi-steady states established in the two network reaction cycles (formed from R1–R2 and R3–R4 reactions). Biologically, this stage corresponds to the fi rst round of elongation, when fi rst ribosomes move along the coding region of mRNA. The small ribosomal subunit 40 S is still in excess which keeps the initiation stage (reaction R1–R2 fl uxes) relatively fast.
4. Transition between Stage 2 and Stage 3. 5. Stage 3: Relaxation with the conditions
[40 S ] << [eIF4F], [60 S ] << [ A ]. During this stage, the reactions 40 S + eIF4F → F and A + 60 S → R can be considered as pseudo-monomolecular 40 S → F and 60 S → R . During this stage all reaction fl uxes are balanced. Biologically, this stage corresponds to the sta-ble production of the protein with constant recycling of the ribosomal subunits. Most of ribosomal subunits 40 S are involved in protein elongation, so the initiation process should wait the end of elongation for that they would be recycled. Our analysis of the non-linear Nissan and
Parker’s model showed that the protein transla-tion machinery can function in two qualitatively different modes, determined by the ratio
= 0
0
2[ 4 ]
4[60 ]
k eIF F
k Sb [ 13 ] . We call these two modes
“ef fi cient initiation” ( b > 1) and “inef fi cient initi-ation” ( b < 1) scenarios. Very roughly, this ratio determines the balance between the overall
204 A. Zinovyev et al.
speeds of initiation and elongation processes. In the case of “ef fi cient initiation” the rate of pro-tein synthesis is limited by the speed of recycling of the ribosomal components (60S). In the case of “inef fi cient initiation” the rate of protein syn-thesis is limited by the speed of recycling of the initiation factors (eIF4F). Switching between two modes of translation can be achieved by chang-ing the availability of the corresponding mole-cules ([60 S ]
0 or [eIF4F]
0 ) or by changing the
sensitive kinetic parameters ( k2 or k4 ). As a result of the dynamical analysis, we
assembled an approximate solution of the non-linear system under assumptions ( 11.7 ) about the parameters. The detailed description of this solution is given in [ 13 ] . The advantage of such a semi-analytical solution is that one
can predict the effect of changing the system parameters.
One of the obvious predictions is that the dynamics of the system is not sensitive to varia-tions of k3 , so if microRNA acts on the transla-tion stage controlled by k3 then no microRNA effect could be observed looking at the system dynamics (being the fastest one, k3 is not a sensi-tive parameter in any scenario).
If microRNA acts on the translation stage con-trolled by k4 (for example, by ribosome stalling mechanism) then we should consider two cases of ef fi cient ( b > 1) and inef fi cient ( b < 1) initia-tion. In the fi rst case the steady state protein syn-thesis rate is controlled by k4 (as the slowest, limiting step) and any effect on k4 would lead to the proportional change in the steady state of
Fig. 11.5 Numerical simulations of the species concen-trations and fl uxes of the non-linear translation model. ( a ) and ( c ) log-log scale; ( b ) and ( d ) log-scale in values, and
linear scale for the time axis (the time units are arbitrary, since the dimensionality of the parameters in [ 12 ] was not speci fi ed)
20511 Mathematical Modeling of microRNA–Mediated Mechanisms of Translation Repression
protein production. By contrast, in the case of inef fi cient initiation, the steady state protein synthesis is not affected by k4 . Instead, the
relaxation time is affected, being 1
~4k
. However,
diminishing k4 increases the b parameter: hence, this changes “inef fi cient initiation” scenario for the opposite, making k4 sensitive for the steady state protein synthesis anyway, when k4 becomes
smaller than 0
0
2[ 4 ]
[60 ]
k eIF F
S . For example, for the
default parameters of the model, decreasing k4 value fi rstly leads to no change in the steady state rate of protein synthesis, whereas the relaxation time increases and, secondly, after the threshold
value 0
0
2[ 4 ]
[60 ]
k eIF F
S starts to affect the steady state
protein synthesis rate directly. This is in contra-diction to the message from [ 12 ] that the change in k4 by several orders of magnitude does not change the steady state rate of protein synthesis.
Analogously, decreasing the value of k2 can convert the “ef fi cient” initiation scenario into the
opposite after the threshold value 0
0
4[60 ]
[ 4 ]
k S
eIF F . We
can recapitulate the effect of decreasing k2 in the following way: (1) in the case of the “ef fi cient” initiation k2 does not affect the steady state protein synthesis rate up to the threshold value after which it affects it in a linear manner. The relaxation time drastically increases, because decreasing k2 leads to elongation of all dynamical stages duration (for example, we have estimated the time of the end of the dynamical Stage 2 as
=′′′ 0
0
[40 ]
2[ 4 ]
St
k eIF F . However, after the threshold
value the relaxation time decreases together with k2 , quickly dropping to its unperturbed value; (2) in the case of “inef fi cient” initiation the steady state protein synthesis rate depends proportion-ally on the value of k2 (12), while the relaxation time is not affected.
MicroRNA action on k1 directly does not pro-duce any strong effect neither on the relaxation
time nor on the steady state protein synthesis rate. This is why in the original work [ 12 ] cap-depen-dent mechanism of microRNA action was taken into account through effective change of the [eIF4F]
0 value (total concentration of the transla-
tion initiation factors), which is a sensitive param-eter of the model (5).
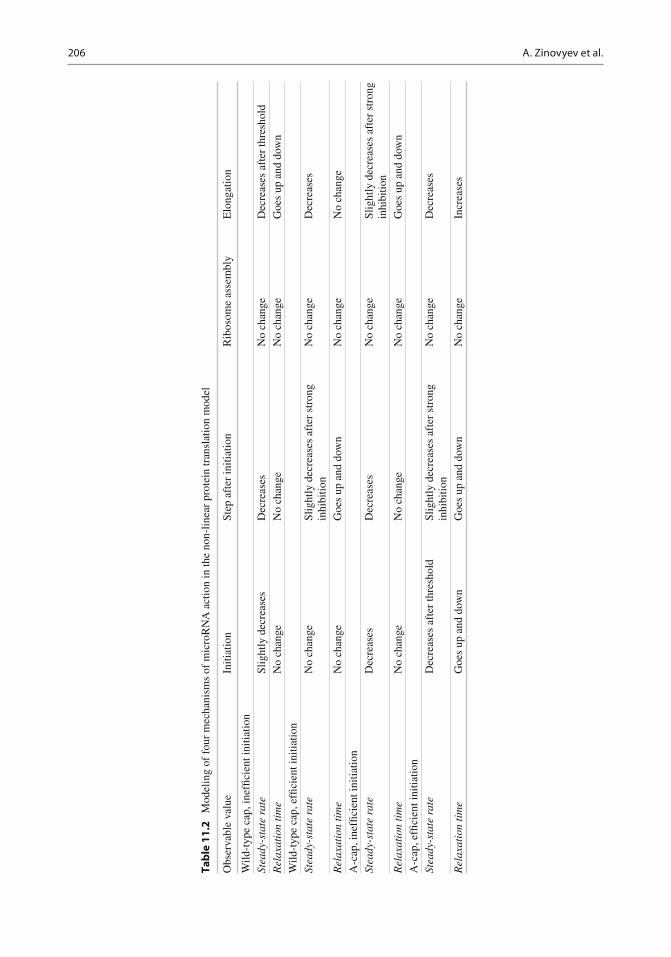
The effect of microRNA through various mechanisms and in various experimental settings (excess or de fi cit of eIF4F, normal cap or A-cap) is recapitulated in Table 11.2 . The conclusion that can be made from this table is that all four mechanisms show clearly different patterns of behavior in various experimental settings. From the simulations one can make a conclusion that it is still not possible to distinguish between the situation when microRNA does not have any effect on protein translation and the situation when it acts on the step which is neither rate lim-iting nor “second rate limiting” in any experi-mental setting ( k3 in our case). Nevertheless, if any change in the steady-state protein synthesis or the relaxation time is observed, theoretically, it is possible to specify the mechanism responsible for it.
11.6 General Model of miRNA-Mediated Translation Regulation
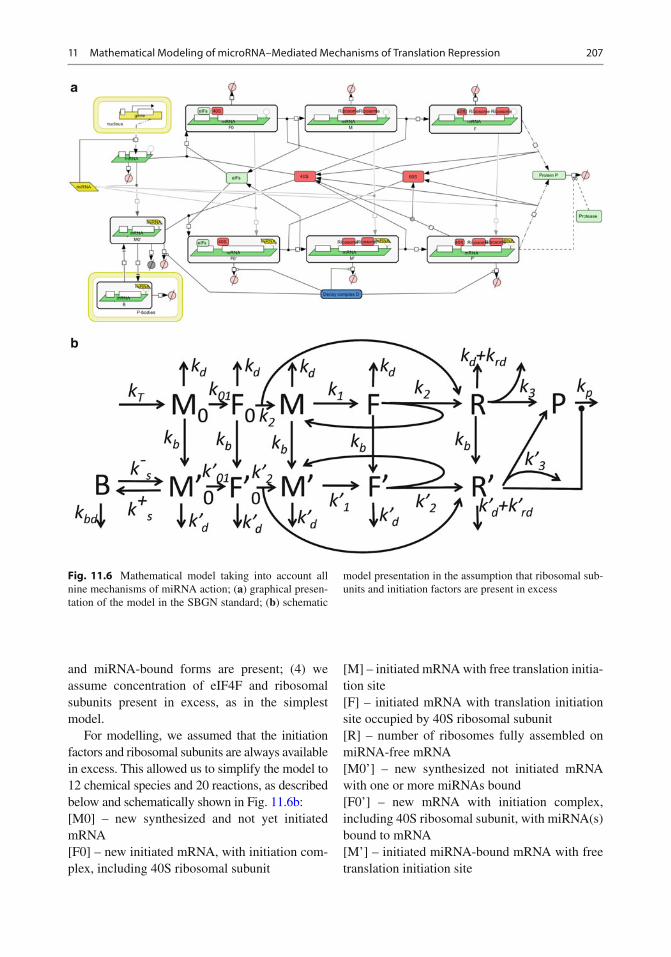
Nine distinct mechanisms of microRNA action have been described in the literature: the main experimental data supporting each proposed mechanism are summarized in the review section of this chapter. The complete model containing all known microRNA action mechanisms is shown in Fig. 11.6a using an SBGN standard diagram.
The principal differences between the Nissan and Parker’s model and the model described in this section are (1) the complete model describes all nine known mechanisms of miRNA action; (2) mRNA amount is a dynamical variable, i.e. it is modelled explicitly, taking into account its synthesis and degradation; (3) we explicitly model binding of miRNA at various stages of translation, i.e. in our model both mRNA in free
206 A. Zinovyev et al.
Tab
le 1
1.2
M
odel
ing
of f
our
mec
hani
sms
of m
icro
RN
A a
ctio
n in
the
non-
linea
r pr
otei
n tr
ansl
atio
n m
odel
Obs
erva
ble
valu
e In
itiat
ion
Step
aft
er in
itiat
ion
Rib
osom
e as
sem
bly
Elo
ngat
ion
Wild
-typ
e ca
p, in
ef fi c
ient
initi
atio
n St
eady
-sta
te r
ate
Slig
htly
dec
reas
es
Dec
reas
es
No
chan
ge
Dec
reas
es a
fter
thre
shol
d R
elax
atio
n ti
me
No
chan
ge
No
chan
ge
No
chan
ge
Goe
s up
and
dow
n W
ild-t
ype
cap,
ef fi
cien
t ini
tiatio
n St
eady
-sta
te r
ate
No
chan
ge
Slig
htly
dec
reas
es a
fter
str
ong
inhi
bitio
n N
o ch
ange
D
ecre
ases
Rel
axat
ion
tim
e N
o ch
ange
G
oes
up a
nd d
own
No
chan
ge
No
chan
ge
A-c
ap, i
nef fi
cien
t ini
tiatio
n St
eady
-sta
te r
ate
Dec
reas
es
Dec
reas
es
No
chan
ge
Slig
htly
dec
reas
es a
fter
str
ong
inhi
bitio
n R
elax
atio
n ti
me
No
chan
ge
No
chan
ge
No
chan
ge
Goe
s up
and
dow
n A
-cap
, ef fi
cien
t ini
tiatio
n St
eady
-sta
te r
ate
Dec
reas
es a
fter
thre
shol
d Sl
ight
ly d
ecre
ases
aft
er s
tron
g in
hibi
tion
No
chan
ge
Dec
reas
es
Rel
axat
ion
tim
e G
oes
up a
nd d
own
Goe
s up
and
dow
n N
o ch
ange
In
crea
ses
20711 Mathematical Modeling of microRNA–Mediated Mechanisms of Translation Repression
and miRNA-bound forms are present; (4) we assume concentration of eIF4F and ribosomal subunits present in excess, as in the simplest model.
For modelling, we assumed that the initiation factors and ribosomal subunits are always available in excess. This allowed us to simplify the model to 12 chemical species and 20 reactions, as described below and schematically shown in Fig. 11.6b : [M0] – new synthesized and not yet initiated mRNA [F0] – new initiated mRNA, with initiation com-plex, including 40S ribosomal subunit
[M] – initiated mRNA with free translation initia-tion site [F] – initiated mRNA with translation initiation site occupied by 40S ribosomal subunit [R] – number of ribosomes fully assembled on miRNA-free mRNA [M0’] – new synthesized not initiated mRNA with one or more miRNAs bound [F0’] – new mRNA with initiation complex, including 40S ribosomal subunit, with miRNA(s) bound to mRNA [M’] – initiated miRNA-bound mRNA with free translation initiation site
Fig. 11.6 Mathematical model taking into account all nine mechanisms of miRNA action; ( a ) graphical presen-tation of the model in the SBGN standard; ( b ) schematic
model presentation in the assumption that ribosomal sub-units and initiation factors are present in excess
208 A. Zinovyev et al.
[F’] – initiated miRNA-bound mRNA with trans-lation initiation site occupied by 40S ribosomal subunit [R’] – ribosomes fully assembled on miRNA-bound mRNA [P] – protein, completely translated from the given mRNA [B] – mRNA sequestered in P bodies.
Let us make a notice on interpretation of some of the model variables. Explicit description of mRNA:ribosome complexes would require sepa-rate dynamical variables for the amounts of mRNA with one ribosome, mRNA with two ribosomes, mRNA with three ribosomes, and so on (potentially, large number of variables). To avoid this complexity, we apply lumping of the detailed model, described in [ 14 ] . In the lumped reaction network, new produced mRNA (state M0) is fi rst initiated and prepared for the fi rst round of translation (state F0). After that, the initiated mRNA alternates between states M (state ready for the next round of translation) and F (mRNA prepared for the next ribosome assem-bly). During each such a round, a new assembled ribosomal complex (R) appears in the system. Thus, we explicitly separate the process of mRNA initiation (which can include capping, adenylylation, circularization, mRNA transport to speci fi c cellular regions) and the process of recruiting 40S ribosomal subunit at already initi-ated mRNA for the next round of translation. In our model, these two processes proceed with different speeds.
In our interpretation, we consider mRNAs as places for a catalytic reaction (protein transla-tion). These places (amount of catalyzer) in our model can be synthesized or destroyed and pres-ent in four states (non-initiated, initiated, in ‘translating’ state ready for assembling new ribo-some and in ‘translating’ state with a new assem-bling ribosome). To take into account miRNA, we say that there are two types of catalyzer: miRNA-free and miRNA-bounded, with differ-ent rate constants of degradation. miRNA-free catalyzer can be irreversibly transformed into miRNA-bounded type of catalyzer.
Importantly, [R] in our interpretation is not the amount of mRNA translating proteins but the
amount of ribosomes bound to mRNA and trans-lating proteins, i.e. the number of sites where the catalysis takes place. Dividing the number of these sites on the amount of the catalyzer in the initiated state [M] + [F] gives the average number of ribosomes per translating mRNA, which we denote as [RB].
The de fi nition of the kinetic rate constants used further in the paper is the following: 1. null → M
0 , the free mRNA is transcribed in
the system with the rate constant k t .
2. M 0 → F
0 , assembly of initiation complex and
40S ribosomal subunit with mRNA occurs with the rate constant k
01
3. F 0 → M + R, assembly of the fi rst ribosome
on the initiation site with the rate constant k 2
4. M → F, initiation of the translation (recruit-ment of 40S subunit) on already translated mRNA, with the rate constant k
1
5. F → M + R, assembly of full ribosome (S80) on mRNA occurs with the rate constant k
2
6. R → P, translation of the protein with conse-quent release of ribosomes occurs with the rate constant k
3
7. R → null, degradation of mRNA leads to release of ribosomes with the rate constant k
d , same reaction describes premature ribo-
some drop-off from mRNA with the rate constant k
rd
We will assume that the process of micro-RNA binding to mRNA can occur at various stages of translation and that its rate k
b will
be the same in each of the following reactions: 8. M
0 → M
0 '
9. F 0 → F
0 '
10. M → M' 11. F → F' 12. R → R'
In the same way we will assume that the rate of degradation of mRNA not driven by microRNA action ( k
d ) can be considered as
the same one at all stages of translation: 13. M
0 → null
14. F 0 → null
15. M → null 16. F → null
The degradation rate of mRNA bound to microRNA could occur with or without direct
20911 Mathematical Modeling of microRNA–Mediated Mechanisms of Translation Repression
action of microRNA on its degradation. For the beginning we will assume that this rate constant ( k
d ’) is different from the free mRNA
degradation and it is the same one for all stages of translation:
17. M' 0 → null
18. F' 0 → null
19. M' → null 20. F' → null 21. R' → null
Next we assume that the reaction corre-sponding to the assembly of the initiation complex and 40S ribosomal subunit with mRNA in the presence of miRNA (M'
0 → F'
0 ) will occur with the rate con-
stant k 01
'. 22. M'
0 → F'
0
Recruitment of 40S subunit on already trans-lating miRNA-bound mRNA occurs with the rate constant k
1 ':
23. M' → F' Reactions of assembly of the full ribosome (S80) on mRNA in the presence of microRNA occur with the rate constant k
2 ':
24. F' 0 → M ' + R
25. F' → M ' + R The rate of protein production in the case of microRNA action is described by the follow-ing reaction:
26. R ¢ → P, with the rate constant k 3 '
27. R ¢ → null, describes possible mechanism of ribosomal drop-off (without protein produc-tion), with the rate constant k
rd ', and mRNA
degradation with ribosome release, with the rate constant k
d '.
Reactions 26 and 27 describe the reverse pro-cess of mRNA sequestration in P-bodies, with rates k
+ s and k
- s correspondingly:
28. M 0 ¢ → B,
29. B → M 0 ¢
The mRNA in P-bodies is degraded with speci fi c rate k
bd '
30. B → null 31. P + R ¢ → null, the rate of protein degradation
by microRNA-independent mechanisms is k
p , while it can be increased in the presence
of miRNA by k r × R ¢ .
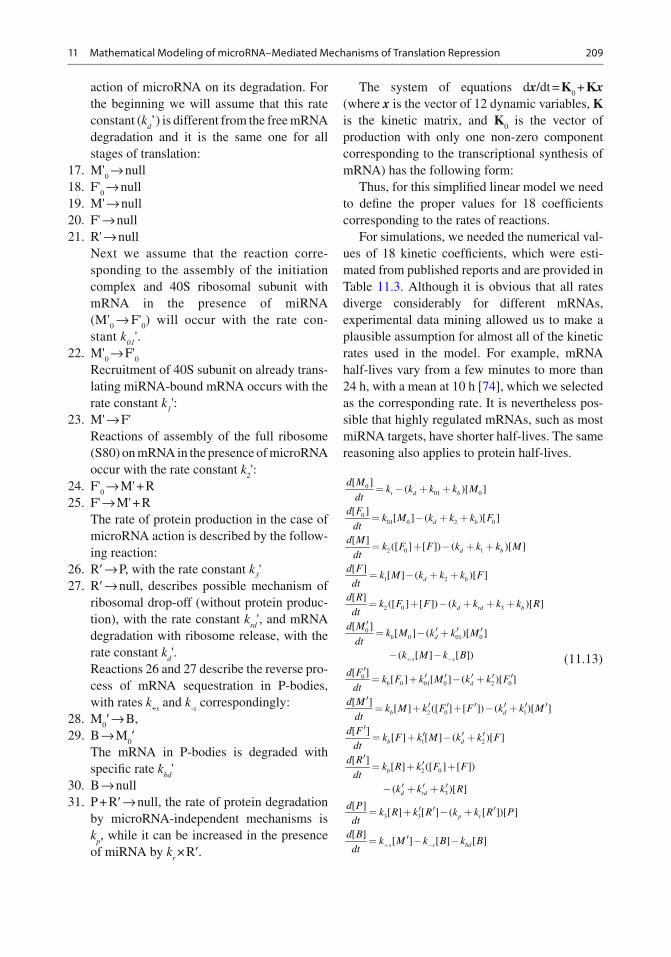
The system of equations d x /dt = K 0 + K x
(where x is the vector of 12 dynamic variables, K is the kinetic matrix, and K
0 is the vector of
production with only one non-zero component corresponding to the transcriptional synthesis of mRNA) has the following form:
Thus, for this simpli fi ed linear model we need to de fi ne the proper values for 18 coef fi cients corresponding to the rates of reactions.
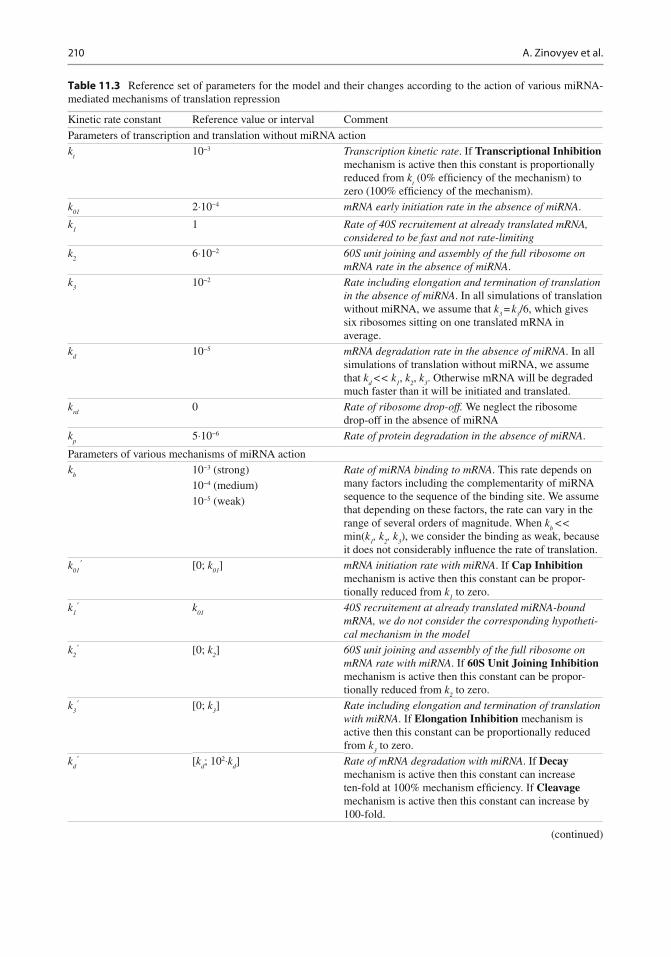
For simulations, we needed the numerical val-ues of 18 kinetic coef fi cients, which were esti-mated from published reports and are provided in Table 11.3 . Although it is obvious that all rates diverge considerably for different mRNAs, experimental data mining allowed us to make a plausible assumption for almost all of the kinetic rates used in the model. For example, mRNA half-lives vary from a few minutes to more than 24 h, with a mean at 10 h [ 74 ] , which we selected as the corresponding rate. It is nevertheless pos-sible that highly regulated mRNAs, such as most miRNA targets, have shorter half-lives. The same reasoning also applies to protein half-lives.
001 0
001 0 2 0
2 0 1
1 2
2 0 3
00 01 0
[ ]( )[ ]
[ ][ ] ( )[ ]
[ ]([ ] [ ]) ( )[ ]
[ ][ ] ( )[ ]
[ ]([ ] [ ]) ( )[ ]
[ ][ ] ( )[ ]
( [ ] [ ])
t d b
d b
d b
d b
d rd b
b d
s s
d Mk k k k M
dtd F
k M k k k Fdt
d Mk F F k k k M
dtd F
k M k k k Fdt
d Rk F F k k k k R
dtd M
k M k k Mdt
k M k B
d+ −
= − + +
= − + +
= + − + +
= − + +
= + − + + +
′′ ′ ′= − +
− −
00 01 0 2 0
2 0 1
1 2
2 0
3
3 3
[ ][ ] [ ] ( )[ ]
[ ][ ] ([ ] [ ]) ( )[ ]
[ ][ ] [ ] ( )[ ]
[ ][ ] ([ ] [ ])
( )[ ]
[ ][ ] [ ] ( [ ])[ ]
[ ]
b d
b d
b d
b
d rd
p r
Fk F k M k k F
dtd M
k M k F F k k Mdt
d Fk F k M k k F
dtd R
k R k F Fdt
k k k R
d Pk R k R k k R P
dtd B
d
′′ ′ ′ ′ ′= + − +
′′ ′ ′ ′ ′ ′= + + − +
′′ ′ ′= + − +
′′= + +
′ ′ ′− + +
′ ′ ′= + − +
[ ] [ ] [ ]s s bdk M k B k Bt + −
′= − −
(11.13)
210 A. Zinovyev et al.
Table 11.3 Reference set of parameters for the model and their changes according to the action of various miRNA-mediated mechanisms of translation repression
Kinetic rate constant Reference value or interval Comment
Parameters of transcription and translation without miRNA action k
t 10 −3 Transcription kinetic rate . If Transcriptional Inhibition
mechanism is active then this constant is proportionally reduced from k
t (0% ef fi ciency of the mechanism) to
zero (100% ef fi ciency of the mechanism). k
01 2⋅10 −4 mRNA early initiation rate in the absence of miRNA .
k 1 1 Rate of 40S recruitement at already translated mRNA,
considered to be fast and not rate-limiting k
2 6⋅10 −2 60S unit joining and assembly of the full ribosome on
mRNA rate in the absence of miRNA . k
3 10 −2 Rate including elongation and termination of translation
in the absence of miRNA . In all simulations of translation without miRNA, we assume that k
3 = k
3 /6, which gives
six ribosomes sitting on one translated mRNA in average.
k d 10 −5 mRNA degradation rate in the absence of miRNA . In all
simulations of translation without miRNA, we assume that k
d << k
1 , k
2 , k
3 . Otherwise mRNA will be degraded
much faster than it will be initiated and translated. k
rd 0 Rate of ribosome drop-off. We neglect the ribosome
drop-off in the absence of miRNA k
p 5⋅10 −6 Rate of protein degradation in the absence of miRNA .
Parameters of various mechanisms of miRNA action k
b 10 −3 (strong) Rate of miRNA binding to mRNA . This rate depends on
many factors including the complementarity of miRNA sequence to the sequence of the binding site. We assume that depending on these factors, the rate can vary in the range of several orders of magnitude. When k
b <<
min( k 1 , k
2 , k
3 ), we consider the binding as weak, because
it does not considerably in fl uence the rate of translation.
10 −4 (medium) 10 −5 (weak)
k 01
¢ [0; k 01
] mRNA initiation rate with miRNA . If Cap Inhibition mechanism is active then this constant can be propor-tionally reduced from k
1 to zero.
k 1 ¢ k
01 40S recruitement at already translated miRNA-bound
mRNA, we do not consider the corresponding hypotheti-cal mechanism in the model
k 2 ¢ [0; k
2 ] 60S unit joining and assembly of the full ribosome on
mRNA rate with miRNA . If 60S Unit Joining Inhibition mechanism is active then this constant can be propor-tionally reduced from k
2 to zero.
k 3 ¢ [0; k
3 ] Rate including elongation and termination of translation
with miRNA . If Elongation Inhibition mechanism is active then this constant can be proportionally reduced from k
3 to zero.
k d ¢ [ k
d ; 10 2 ⋅ k
d ] Rate of mRNA degradation with miRNA . If Decay
mechanism is active then this constant can increase ten-fold at 100% mechanism ef fi ciency. If Cleavage mechanism is active then this constant can increase by 100-fold.
(continued)
21111 Mathematical Modeling of microRNA–Mediated Mechanisms of Translation Repression
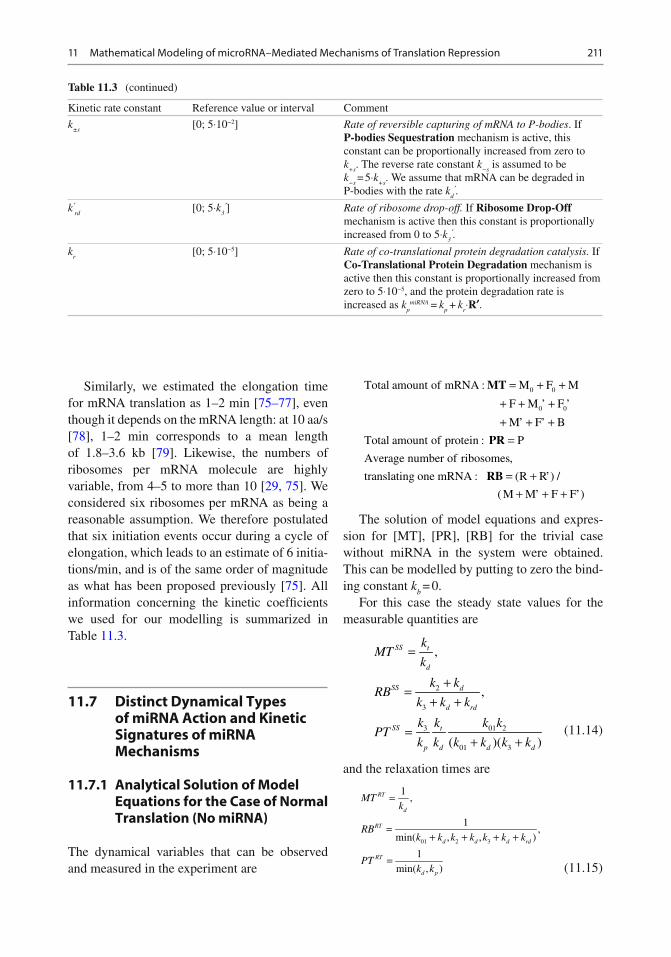
Similarly, we estimated the elongation time for mRNA translation as 1–2 min [ 75– 77 ] , even though it depends on the mRNA length: at 10 aa/s [ 78 ] , 1–2 min corresponds to a mean length of 1.8–3.6 kb [ 79 ] . Likewise, the numbers of ribosomes per mRNA molecule are highly variable, from 4–5 to more than 10 [ 29, 75 ] . We considered six ribosomes per mRNA as being a reasonable assumption. We therefore postulated that six initiation events occur during a cycle of elongation, which leads to an estimate of 6 initia-tions/min, and is of the same order of magnitude as what has been proposed previously [ 75 ] . All information concerning the kinetic coef fi cients we used for our modelling is summarized in Table 11.3 .
11.7 Distinct Dynamical Types of miRNA Action and Kinetic Signatures of miRNA Mechanisms
11.7.1 Analytical Solution of Model Equations for the Case of Normal Translation (No miRNA)
The dynamical variables that can be observed and measured in the experiment are
0 0
0 0
Total amount of mRNA : M F M
F M F
M F B
Total amount of protein : P
Average number of ribosomes,
translating one mRNA : ( )
( )
R R /
M M F F
= + ++ + ++ + +
=
= ++ + +
MT
PR
RB
’ ’
’ ’
’
’ ’
The solution of model equations and expres-sion for [MT], [PR], [RB] for the trivial case without miRNA in the system were obtained. This can be modelled by putting to zero the bind-ing constant k
b = 0.
For this case the steady state values for the measurable quantities are
2
3
3 01 2
01 3
,
,
( )( )
=
+=
+ +
=+ +
SS t
d
SS d
d rd
SS t
p d d d
kMT
k
k kRB
k k k
k k k kPT
k k k k k k (11.14)
and the relaxation times are
01 2 3
1,
1,
min( , , )
1min( , )
=
=+ + + +
=
RT
d
RT
d d d rd
RT
d p
MTk
RBk k k k k k k
PTk k (11.15)
Table 11.3 (continued)
Kinetic rate constant Reference value or interval Comment
k ±s
[0; 5⋅10 −2 ] Rate of reversible capturing of mRNA to P-bodies . If P-bodies Sequestration mechanism is active, this constant can be proportionally increased from zero to k
+s . The reverse rate constant k
−s is assumed to be
k −s
= 5⋅ k +s
. We assume that mRNA can be degraded in P-bodies with the rate k
d ¢ .
k ¢ rd [0; 5⋅ k
3 ¢ ] Rate of ribosome drop-off. If Ribosome Drop-Off
mechanism is active then this constant is proportionally increased from 0 to 5⋅ k
3 ¢ .
k r [0; 5⋅10 −5 ] Rate of co-translational protein degradation catalysis. If
Co-Translational Protein Degradation mechanism is active then this constant is proportionally increased from zero to 5⋅10 −5 , and the protein degradation rate is increased as k
p miRNA = k
p + k
r ⋅ R ¢ .
212 A. Zinovyev et al.
where we have assumed that k 1 >> k
01 , k
2 , k
3 .
These formulas allow qualitative understand-ing of the effect of miRNA on various steps of translation and the corresponding kinetic signa-tures. They can also help to decipher experimen-tally observed kinetic signatures when multiple mechanisms are present simultaneously and the translation parameters are not known. Exact rec-ipe on doing this will be a subject of our future work.
11.7.2 Dominant Paths of the Model and Their Relations to the miRNA Mechanisms
According to the methodology of asymptotology [ 73 , 81 ] , let us consider the case of well separated constants, i.e. when any two kinetic constants in the graph in the Fig. 11.6b have different orders of magnitude at each fork (i.e., a node with sev-eral outgoing reactions). Each such a (partial) ordering of kinetic constants will generate a path on the graph (possibly, cyclic), starting at M
0
node. We will call it the dominant path . Each path corresponds to one (if it does not contain cycles) or several (if it contains a cycle) dominant systems and to a distinguishable biochemical scenario. For example, the partial ordering ( k
b
>> k 1 , k
d ; k
01 >> k
- s , k ¢
d ; k ¢
2 << k ’
d ) corresponds to
the dominant path describing the process of trans-lation inhibition via 60S subunit joining repres-sion (see Table 11.4 , path M
0 M ¢
0 F ¢
0 ).
A dominant path is connected to a dominant system (whose solution of the corresponding dynamics equations provides an asymptotic approximation of the whole system dynamics) in the following way. If the path does not contain cycles, then it represents the dominant system. If the path contains cycles then the cycles should be glued and represented by single nodes (which will represent quasistationary distribution of chemical species concentrations inside the cycle). Then one should fi nd the dominant path for the new graph with glued cycles and continue until an acyclic dominant path will be found. Depending on the ordering of kinetic rates inside each cycle, one cyclic dominant path can lead to several
different dominant systems. The dominant sys-tem in general represents a hierarchy of glued cycles. The details of constructing dominant sys-tems are provided in [ 73 , 74 , 81 ] .
It is convenient to designate each dominant path by nodes through which it passes. There are many possible reaction graph traversals leading to multiple possible dominant paths, if one con-siders all partial orderings of the constants in the reaction forks. However, some of them are bio-logically non-relevant. For example, the ordering k
d >> k
01 (dominant path M
0 ) will not lead to any
translation (the mRNA will be degraded before it will be initiated). In the same way, k
d >> k
2 (domi-
nant path M 0 F
0 ) will terminate the normal trans-
lation prematurely. Thus, we postulate k d << k
01 ,
k 2 , k
3. Also for simplicity we assume that binding
of miRNA to mRNA is more rapid than normal initiation, i.e., k
b >> k
01 , k
2 , k
3 if there is miRNA in
the system, and k b = 0, if not. Also we assume that
k 01
<< k 1 , because k
1 corresponds to recruiting
40S subunit on already initiated and translated mRNA (which we assume never be rate-limiting), while k
01 includes both mRNA initiation and 40S
subunit recruiting. This leads to six biologically relevant dominant paths, all of which are listed in Table 11.4 .
Table 11.4 shows that the types of dynamical behavior (dominant paths) can be mapped onto the biologically characterized mechanisms of miRNA action, but this mapping is not one-to-one: several biological mechanisms can corre-spond to one dynamical type (for example, M
0 M ¢
0
dominant path corresponds to M1, M7 and M8 biological mechanisms and, conversely, biologi-cal mechanism M1 can correspond to M
0 M ¢
0 or
M 0 M ¢
0 F ¢
0 M ¢ F ¢ R’P dominant paths).
11.7.3 Kinetic Signatures of miRNA-Mediated Mechanisms of Protein Translation Inhibition
In order to provide a practical recipe to distin-guish between nine different mechanisms of miRNA action, we studied the dynamical behaviour of the model for the reference set of parameters for weak, medium and strong miRNA binding
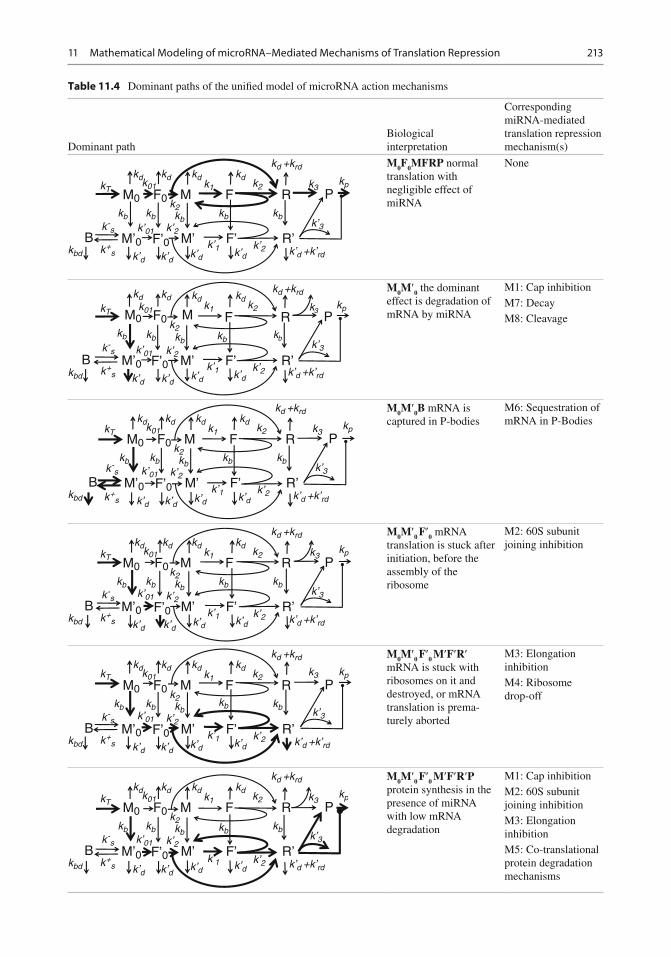
21311 Mathematical Modeling of microRNA–Mediated Mechanisms of Translation Repression
Table 11.4 Dominant paths of the uni fi ed model of microRNA action mechanisms
Dominant path Biological interpretation
Corresponding miRNA- mediated translation repression mechanism(s)
M F R Pk2
F0M0
k01
M’ F’ R’k’d k’d +k’rd
kd +krd
k’2k’1
k’2k’01
k’dk’dk’d
k’3
kpk3
kbkbkb
k2kb
kbd
kd kd kd kdk1
kb
kT
F’0M’0Bk+
s
k-s
M 0 F
0 MFRP normal
translation with negligible effect of miRNA
None
F R Pk3
M’ F’ R’B
kb
k’d +k’rd
kd +krd
kp
kbd
kd
kT
k’3kb kb kb
kb
k+s
k-s
kd kd kdk1 k2
k’dk’2k’1
k’dk’dk’d
k’2k’01
k01F0 k2MM0
F’0M’0
M 0 M ¢
0 the dominant
effect is degradation of mRNA by miRNA
M1: Cap inhibition M7: Decay M8: Cleavage
M F R Pk2
F0M0
k01
M’ F’ R’k’d k’d +k’rd
kd +krd
k’2k’1
k’2k’01
k’dk’dk’d
k’3
kpk3
kbkbkb
k2kb
kbd
kd kd kd kdk1
kb
kT
F’0M’0Bk+
s
k-s
M 0 M ¢
0 B mRNA is
captured in P-bodies M6: Sequestration of mRNA in P-Bodies
M F R Pk2
F0M0
k01
M’ F’ R’k’d k’d +k’rd
kd +krd
k’2k’1
k’2k’01
k’dk’dk’d
k’3
kpk3
kbkbkb
k2kb
kbd
kd kd kd kdk1
kb
kT
F’0M’0Bk+
s
k-s
M 0 M ¢
0 F ¢
0 mRNA
translation is stuck after initiation, before the assembly of the ribosome
M2: 60S subunit joining inhibition
M F R Pk2
F0M0
k01
M’ F’ R’k’d k’d +k’rd
kd +krd
k’2k’1
k’2k’01
k’dk’dk’d
k’3
kpk3
kbkbkb
k2kb
kbd
kd kd kd kdk1
kb
kT
F’0M’0Bk+
s
k-s
M 0 M ¢
0 F ¢
0 M ¢ F ¢ R ¢
mRNA is stuck with ribosomes on it and destroyed, or mRNA translation is prema-turely aborted
M3: Elongation inhibition M4: Ribosome drop-off
M F R Pk2
F0M0
k01
M’ F’ R’k’d k’d +k’rd
kd +krd
k’2k’1
k’2k’01
k’dk’dk’d
k’3
kpk3
kbkbkb
k2kb
kbd
kd kd kd kdk1
kb
kT
F’0M’0Bk+
s
k-s
M 0 M ¢
0 F ¢
0 M ¢ F ¢ R ¢ P
protein synthesis in the presence of miRNA with low mRNA degradation
M1: Cap inhibition M2: 60S subunit joining inhibition M3: Elongation inhibition M5: Co-translational protein degradation mechanisms
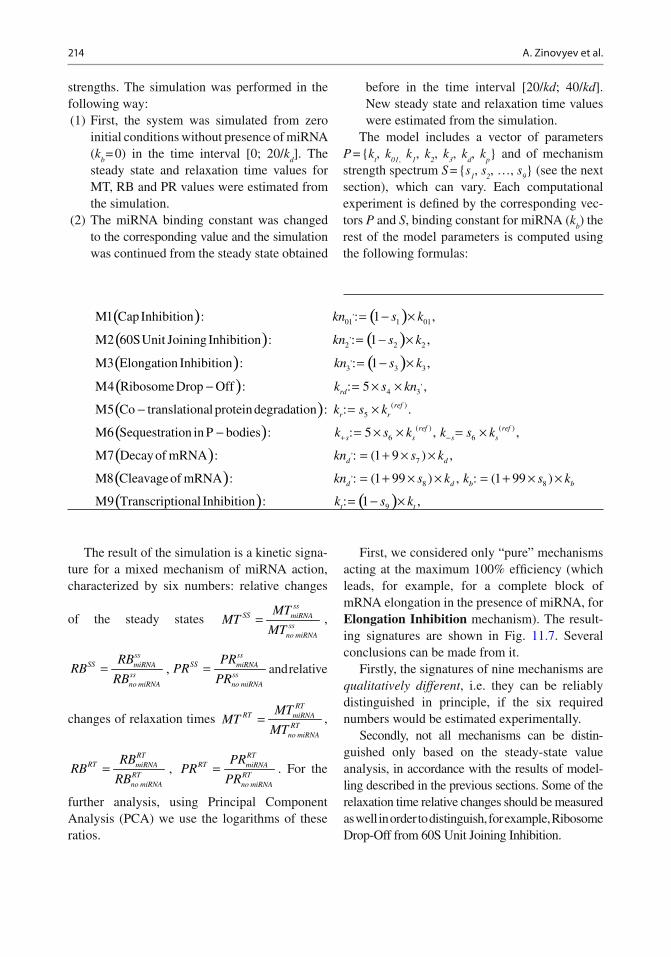
214 A. Zinovyev et al.
strengths. The simulation was performed in the following way: (1) First, the system was simulated from zero
initial conditions without presence of miRNA ( k
b = 0) in the time interval [0; 20/ k
d ]. The
steady state and relaxation time values for MT, RB and PR values were estimated from the simulation.
(2) The miRNA binding constant was changed to the corresponding value and the simulation was continued from the steady state obtained
before in the time interval [20/ k d ; 40/ k d ]. New steady state and relaxation time values were estimated from the simulation.
The model includes a vector of parameters P = { k
t , k
01 , k
1 , k
2 , k
3 , k
d , k
p } and of mechanism
strength spectrum S = { s 1 , s
2 , …, s
9 } (see the next
section), which can vary. Each computational experiment is de fi ned by the corresponding vec-tors P and S , binding constant for miRNA ( k
b ) the
rest of the model parameters is computed using the following formulas:
( ) ( )( ) ( )( ) ( )( )( )
01 1 01
2 2 2
3 3 3
4 3
5
M1 Cap Inhibition : : 1 ,
M2 60S Unit Joining Inhibition : : 1 ,
M3 Elongation Inhibition : : 1 ,
M4 Ribosome Drop Off : : 5 ,
M5 Co translational protein degradation : :
,
,
,
,
= − ×
= − ×
= − ×
− = × ×
− =rd
r
kn s k
kn s k
kn s k
k s kn
k s
( )( )( )( ) ( )
( )
( ) ( )6 6
7
8 8
9
.
M6 Sequestration in P bodies : : 5 , ,
M7 Decay of mRNA : : (1 9 ) ,
M8 Cleavage of mRNA : : (1 99 ) , : (1 99 )
M9 Transcriptional Inhibition : : 1
,
+ −
,
×
− = × × = ×
= + × ×
= + × × = + × ×
= − ×
refr
ref refs s s s
d d
d d b b
t
k
k s k k s k
kn s k
kn s k k s k
k s ,tk
The result of the simulation is a kinetic signa-ture for a mixed mechanism of miRNA action, characterized by six numbers: relative changes
of the steady states =ss
SS miRNAss
no miRNA
MTMT
MT ,
=ss
SS miRNAssno miRNA
RBRB
RB , =
ssSS miRNA
ssno miRNA
PRPR
PR and relative
changes of relaxation times =RT
RT miRNART
no miRNA
MTMT
MT ,
=RT
RT miRNARTno miRNA
RBRB
RB , =
RTRT miRNA
RTno miRNA
PRPR
PR . For the
further analysis, using Principal Component Analysis (PCA) we use the logarithms of these ratios.
First, we considered only “pure” mechanisms acting at the maximum 100% ef fi ciency (which leads, for example, for a complete block of mRNA elongation in the presence of miRNA, for Elongation Inhibition mechanism). The result-ing signatures are shown in Fig. 11.7 . Several conclusions can be made from it.
Firstly, the signatures of nine mechanisms are qualitatively different , i.e. they can be reliably distinguished in principle, if the six required numbers would be estimated experimentally.
Secondly, not all mechanisms can be distin-guished only based on the steady-state value analysis, in accordance with the results of model-ling described in the previous sections. Some of the relaxation time relative changes should be measured as well in order to distinguish, for example, Ribosome Drop-Off from 60S Unit Joining Inhibition.
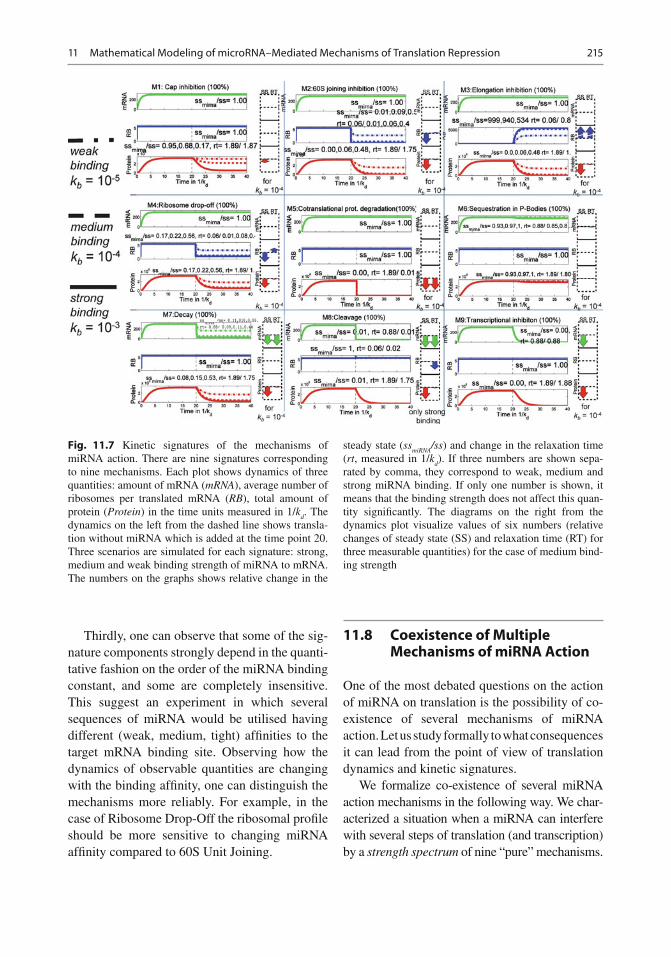
21511 Mathematical Modeling of microRNA–Mediated Mechanisms of Translation Repression
Thirdly, one can observe that some of the sig-nature components strongly depend in the quanti-tative fashion on the order of the miRNA binding constant, and some are completely insensitive. This suggest an experiment in which several sequences of miRNA would be utilised having different (weak, medium, tight) af fi nities to the target mRNA binding site. Observing how the dynamics of observable quantities are changing with the binding af fi nity, one can distinguish the mechanisms more reliably. For example, in the case of Ribosome Drop-Off the ribosomal pro fi le should be more sensitive to changing miRNA af fi nity compared to 60S Unit Joining.
11.8 Coexistence of Multiple Mechanisms of miRNA Action
One of the most debated questions on the action of miRNA on translation is the possibility of co-existence of several mechanisms of miRNA action. Let us study formally to what consequences it can lead from the point of view of translation dynamics and kinetic signatures.
We formalize co-existence of several miRNA action mechanisms in the following way. We char-acterized a situation when a miRNA can interfere with several steps of translation (and transcription) by a strength spectrum of nine “pure” mechanisms.
Fig. 11.7 Kinetic signatures of the mechanisms of miRNA action. There are nine signatures corresponding to nine mechanisms. Each plot shows dynamics of three quantities: amount of mRNA ( mRNA ), average number of ribosomes per translated mRNA ( RB ), total amount of protein ( Protein ) in the time units measured in 1/ k
d . The
dynamics on the left from the dashed line shows transla-tion without miRNA which is added at the time point 20. Three scenarios are simulated for each signature: strong, medium and weak binding strength of miRNA to mRNA. The numbers on the graphs shows relative change in the
steady state ( ss miRNA
/ss ) and change in the relaxation time ( rt , measured in 1/ k
d ). If three numbers are shown sepa-
rated by comma, they correspond to weak, medium and strong miRNA binding. If only one number is shown, it means that the binding strength does not affect this quan-tity signi fi cantly. The diagrams on the right from the dynamics plot visualize values of six numbers (relative changes of steady state (SS) and relaxation time (RT) for three measurable quantities) for the case of medium bind-ing strength
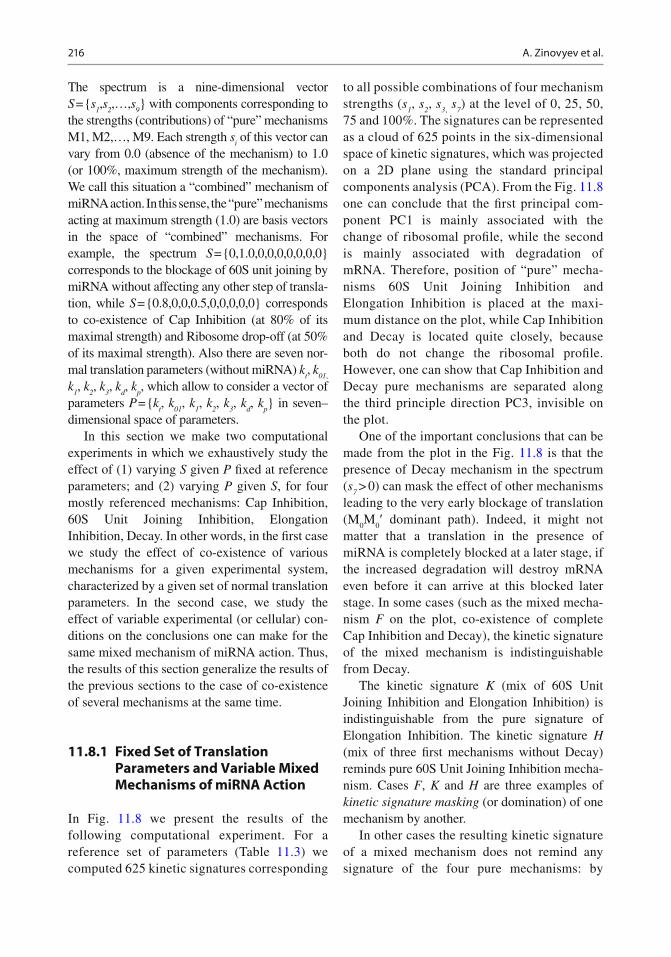
216 A. Zinovyev et al.
The spectrum is a nine-dimensional vector S = { s
1 , s
2 ,…, s
9 } with components corresponding to
the strengths (contributions) of “pure” mechanisms M1, M2,…, M9. Each strength s
i of this vector can
vary from 0.0 (absence of the mechanism) to 1.0 (or 100%, maximum strength of the mechanism). We call this situation a “combined” mechanism of miRNA action. In this sense, the “pure” mechanisms acting at maximum strength (1.0) are basis vectors in the space of “combined” mechanisms. For example, the spectrum S = {0,1.0,0,0,0,0,0,0,0} corresponds to the blockage of 60S unit joining by miRNA without affecting any other step of transla-tion, while S = {0.8,0,0,0.5,0,0,0,0,0} corresponds to co-existence of Cap Inhibition (at 80% of its maximal strength) and Ribosome drop-off (at 50% of its maximal strength). Also there are seven nor-mal translation parameters (without miRNA) k
t , k
01 ,
k 1 , k
2 , k
3 , k
d , k
p , which allow to consider a vector of
parameters P = { k t , k
01 , k
1 , k
2 , k
3 , k
d , k
p } in seven–
dimensional space of parameters. In this section we make two computational
experiments in which we exhaustively study the effect of (1) varying S given P fi xed at reference parameters; and (2) varying P given S , for four mostly referenced mechanisms: Cap Inhibition, 60S Unit Joining Inhibition, Elongation Inhibition, Decay. In other words, in the fi rst case we study the effect of co-existence of various mechanisms for a given experimental system, characterized by a given set of normal translation parameters. In the second case, we study the effect of variable experimental (or cellular) con-ditions on the conclusions one can make for the same mixed mechanism of miRNA action. Thus, the results of this section generalize the results of the previous sections to the case of co-existence of several mechanisms at the same time.
11.8.1 Fixed Set of Translation Parameters and Variable Mixed Mechanisms of miRNA Action
In Fig. 11.8 we present the results of the following computational experiment. For a reference set of parameters (Table 11.3 ) we computed 625 kinetic signatures corres ponding
to all possible combinations of four mechanism strengths ( s
1 , s
2 , s
3 , s
7 ) at the level of 0, 25, 50,
75 and 100%. The signatures can be represented as a cloud of 625 points in the six-dimensional space of kinetic signatures, which was projected on a 2D plane using the standard principal components analysis (PCA). From the Fig. 11.8 one can conclude that the fi rst principal com-ponent PC1 is mainly associated with the change of ribosomal pro fi le, while the second is mainly associated with degradation of mRNA. Therefore, position of “pure” mecha-nisms 60S Unit Joining Inhibition and Elongation Inhibition is placed at the maxi-mum distance on the plot, while Cap Inhibition and Decay is located quite closely, because both do not change the ribosomal pro fi le. However, one can show that Cap Inhibition and Decay pure mechanisms are separated along the third principle direction PC3, invisible on the plot.
One of the important conclusions that can be made from the plot in the Fig. 11.8 is that the presence of Decay mechanism in the spectrum ( s
7 > 0) can mask the effect of other mechanisms
leading to the very early blockage of translation (M
0 M
0 ¢ dominant path). Indeed, it might not
matter that a translation in the presence of miRNA is completely blocked at a later stage, if the increased degradation will destroy mRNA even before it can arrive at this blocked later stage. In some cases (such as the mixed mecha-nism F on the plot, co-existence of complete Cap Inhibition and Decay), the kinetic signature of the mixed mechanism is indistinguishable from Decay.
The kinetic signature K (mix of 60S Unit Joining Inhibition and Elongation Inhibition) is indistinguishable from the pure signature of Elongation Inhibition. The kinetic signature H (mix of three fi rst mechanisms without Decay) reminds pure 60S Unit Joining Inhibition mecha-nism. Cases F , K and H are three examples of kinetic signature masking (or domination) of one mechanism by another.
In other cases the resulting kinetic signature of a mixed mechanism does not remind any signature of the four pure mechanisms: by
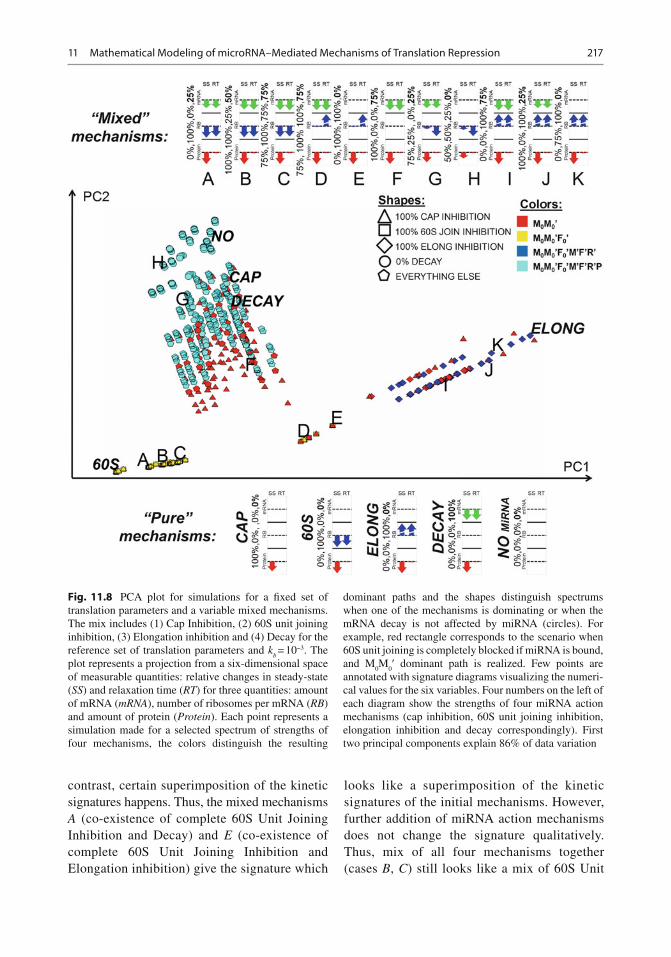
21711 Mathematical Modeling of microRNA–Mediated Mechanisms of Translation Repression
Fig. 11.8 PCA plot for simulations for a fi xed set of translation parameters and a variable mixed mechanisms. The mix includes (1) Cap Inhibition, (2) 60S unit joining inhibition, (3) Elongation inhibition and (4) Decay for the reference set of translation parameters and k
b = 10 −3 . The
plot represents a projection from a six-dimensional space of measurable quantities: relative changes in steady-state ( SS ) and relaxation time ( RT ) for three quantities: amount of mRNA ( mRNA ), number of ribosomes per mRNA ( RB ) and amount of protein ( Protein ). Each point represents a simulation made for a selected spectrum of strengths of four mechanisms, the colors distinguish the resulting
dominant paths and the shapes distinguish spectrums when one of the mechanisms is dominating or when the mRNA decay is not affected by miRNA (circles). For example, red rectangle corresponds to the scenario when 60S unit joining is completely blocked if miRNA is bound, and M
0 M
0 ¢ dominant path is realized. Few points are
annotated with signature diagrams visualizing the numeri-cal values for the six variables. Four numbers on the left of each diagram show the strengths of four miRNA action mechanisms (cap inhibition, 60S unit joining inhibition, elongation inhibition and decay correspondingly). First two principal components explain 86% of data variation
contrast, certain superimposition of the kinetic signatures happens. Thus, the mixed mechanisms A (co-existence of complete 60S Unit Joining Inhibition and Decay) and E (co-existence of complete 60S Unit Joining Inhibition and Elongation inhibition) give the signature which
looks like a superimposition of the kinetic signatures of the initial mechanisms. However, further addition of miRNA action mechanisms does not change the signature qualitatively. Thus, mix of all four mechanisms together (cases B , C ) still looks like a mix of 60S Unit
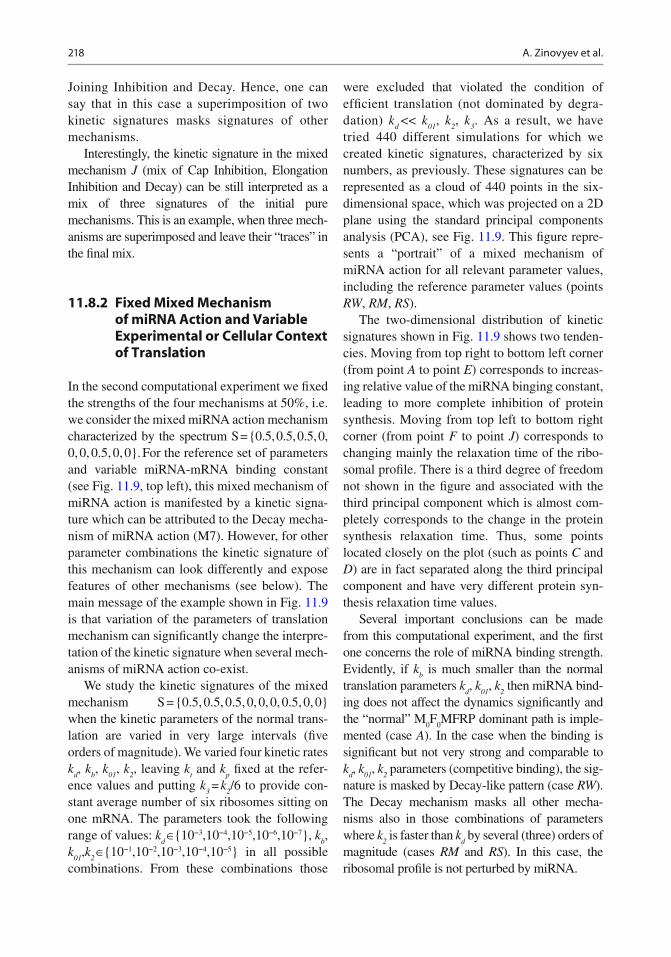
218 A. Zinovyev et al.
Joining Inhibition and Decay. Hence, one can say that in this case a superimposition of two kinetic signatures masks signatures of other mechanisms.
Interestingly, the kinetic signature in the mixed mechanism J (mix of Cap Inhibition, Elongation Inhibition and Decay) can be still interpreted as a mix of three signatures of the initial pure mechanisms. This is an example, when three mech-anisms are superimposed and leave their “traces” in the fi nal mix.
11.8.2 Fixed Mixed Mechanism of miRNA Action and Variable Experimental or Cellular Context of Translation
In the second computational experiment we fi xed the strengths of the four mechanisms at 50%, i.e. we consider the mixed miRNA action mechanism characterized by the spectrum S = {0.5, 0.5, 0.5, 0, 0, 0, 0.5, 0, 0}. For the reference set of parameters and variable miRNA-mRNA binding constant (see Fig. 11.9 , top left), this mixed mechanism of miRNA action is manifested by a kinetic signa-ture which can be attributed to the Decay mecha-nism of miRNA action (M7). However, for other parameter combinations the kinetic signature of this mechanism can look differently and expose features of other mechanisms (see below). The main message of the example shown in Fig. 11.9 is that variation of the parameters of translation mechanism can signi fi cantly change the interpre-tation of the kinetic signature when several mech-anisms of miRNA action co-exist.
We study the kinetic signatures of the mixed mechanism S = {0.5, 0.5, 0.5, 0, 0, 0, 0.5, 0, 0} when the kinetic parameters of the normal trans-lation are varied in very large intervals ( fi ve orders of magnitude). We varied four kinetic rates k
d , k
b , k
01 , k
2 , leaving k
t and k
p fi xed at the refer-
ence values and putting k 3 = k
2 /6 to provide con-
stant average number of six ribosomes sitting on one mRNA. The parameters took the following range of values: k
d Î{10 −3 ,10 −4 ,10 −5 ,10 −6 ,10 −7 }, k
b ,
k 01
, k 2 Î{10 −1 ,10 −2 ,10 −3 ,10 −4 ,10 −5 } in all possible
combinations. From these combinations those
were excluded that violated the condition of ef fi cient translation (not dominated by degra-dation) k
d << k
01 , k
2 , k
3 . As a result, we have
tried 440 different simulations for which we created kinetic signatures, characterized by six numbers, as previously. These signatures can be represented as a cloud of 440 points in the six-dimensional space, which was projected on a 2D plane using the standard principal components analysis (PCA), see Fig. 11.9 . This fi gure repre-sents a “portrait” of a mixed mechanism of miRNA action for all relevant parameter values, including the reference parameter values (points RW , RM , RS ).
The two-dimensional distribution of kinetic signatures shown in Fig. 11.9 shows two tenden-cies. Moving from top right to bottom left corner (from point A to point E ) corresponds to increas-ing relative value of the miRNA binging constant, leading to more complete inhibition of protein synthesis. Moving from top left to bottom right corner (from point F to point J ) corresponds to changing mainly the relaxation time of the ribo-somal pro fi le. There is a third degree of freedom not shown in the fi gure and associated with the third principal component which is almost com-pletely corresponds to the change in the protein synthesis relaxation time. Thus, some points located closely on the plot (such as points C and D ) are in fact separated along the third principal component and have very different protein syn-thesis relaxation time values.
Several important conclusions can be made from this computational experiment, and the fi rst one concerns the role of miRNA binding strength. Evidently, if k
b is much smaller than the normal
translation parameters k d , k
01 , k
2 then miRNA bind-
ing does not affect the dynamics signi fi cantly and the “normal” M
0 F
0 MFRP dominant path is imple-
mented (case A ). In the case when the binding is signi fi cant but not very strong and comparable to k
d , k
01 , k
2 parameters (competitive binding), the sig-
nature is masked by Decay-like pattern (case RW ). The Decay mechanism masks all other mecha-nisms also in those combinations of parameters where k
2 is faster than k
d by several (three) orders of
magnitude (cases RM and RS ). In this case, the ribosomal pro fi le is not perturbed by miRNA.
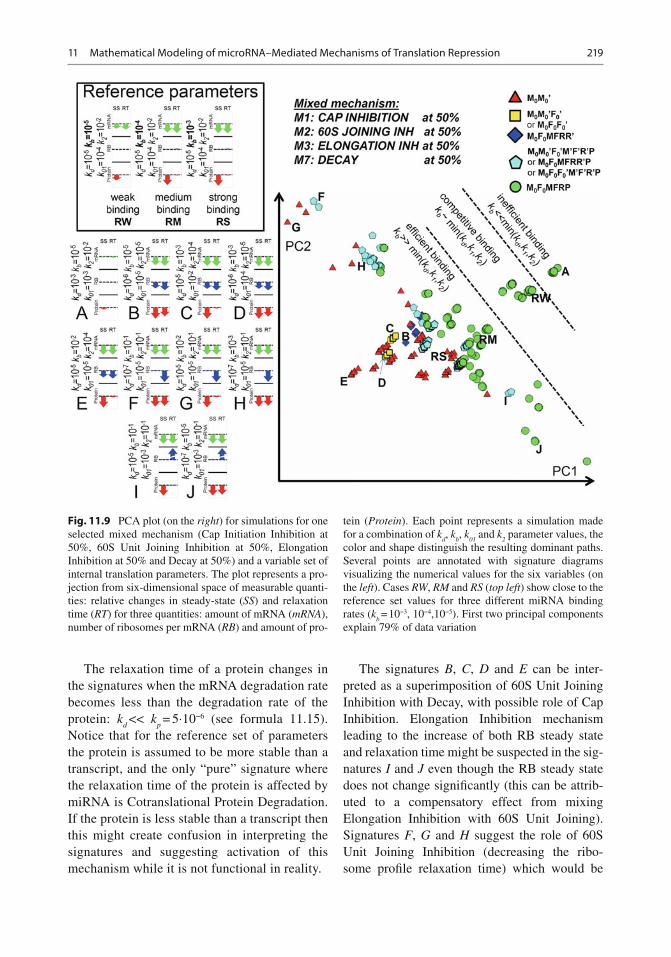
21911 Mathematical Modeling of microRNA–Mediated Mechanisms of Translation Repression
The relaxation time of a protein changes in the signatures when the mRNA degradation rate becomes less than the degradation rate of the protein: k
d << k
p = 5⋅10 −6 (see formula 11.15).
Notice that for the reference set of parameters the protein is assumed to be more stable than a transcript, and the only “pure” signature where the relaxation time of the protein is affected by miRNA is Cotranslational Protein Degradation. If the protein is less stable than a transcript then this might create confusion in interpreting the signatures and suggesting activation of this mechanism while it is not functional in reality.
The signatures B , C , D and E can be inter-preted as a superimposition of 60S Unit Joining Inhibition with Decay, with possible role of Cap Inhibition. Elongation Inhibition mechanism leading to the increase of both RB steady state and relaxation time might be suspected in the sig-natures I and J even though the RB steady state does not change signi fi cantly (this can be attrib-uted to a compensatory effect from mixing Elongation Inhibition with 60S Unit Joining). Signatures F , G and H suggest the role of 60S Unit Joining Inhibition (decreasing the ribo-some pro fi le relaxation time) which would be
Fig. 11.9 PCA plot (on the right ) for simulations for one selected mixed mechanism (Cap Initiation Inhibition at 50%, 60S Unit Joining Inhibition at 50%, Elongation Inhibition at 50% and Decay at 50%) and a variable set of internal translation parameters. The plot represents a pro-jection from six-dimensional space of measurable quanti-ties: relative changes in steady-state ( SS ) and relaxation time ( RT ) for three quantities: amount of mRNA ( mRNA ), number of ribosomes per mRNA ( RB ) and amount of pro-
tein ( Protein ). Each point represents a simulation made for a combination of k
d , k
b , k
01 and k
2 parameter values, the
color and shape distinguish the resulting dominant paths. Several points are annotated with signature diagrams visualizing the numerical values for the six variables (on the left ). Cases RW , RM and RS ( top left ) show close to the reference set values for three different miRNA binding rates ( k
b = 10 −3 , 10 −4 ,10 −5 ). First two principal components
explain 79% of data variation
220 A. Zinovyev et al.
completely missed if one looks at the relative changes of the steady states only.
Finally, let us notice the special role of the M
0 M
0 ¢ dominant path which can produce kinetic
signatures very similar to other dominant paths (this is true both for Figs. 11.8 and 11.9 ). Compare, for example, pairs of cases F and G , D and E . The dominant path M
0 M
0 ¢ requires rela-
tively strong binding k b > > k
01 and relatively fast
degradation or slow initiation, which can be expressed as condition on parameters
−′
= <<+′
01 1 01
4
(1 )1
(1 9 )d d
k s k
k s k , where s
1 and s
7 are the
strengths of the Cap Initiation Inhibition and Decay mechanisms respectively in the mixed mechanism. In the case when s
1 = s
7 = 0.5, this gives
a condition k 01
<<9 k d , i.e. that the normal cap ini-
tiation rate should not exceed the normal degrada-tion rate by more than two orders of magnitude (100-fold). This condition is satis fi ed for the points B , E , G and the reference set of parameters on the plot in the Fig. 11.9 . On the other hand, it can be shown that k
01 is the least sensitive parameter
affecting the relative changes of the steady states and relaxation times for the MT, RB and PR values (decreasing k
01 can affect only the steady state of
the protein and not other values, see (14)). Hence, for many kinetic signatures, given relatively strong miRNA binding constant, there is a possibility to implement the M
0 M
0 ¢ dominant path by slowing
down k 01
without a qualitative signature change. This non-intuitive conclusion can be veri fi ed experimentally.
11.9 Concluding Remarks
MicroRNA mode of action is a highly controver-sial topic. Here, we used mathematical model-ling and found that each of the suggested mechanisms has a speci fi c signature (the pre-dicted dynamics of 3 measurable variables of the translational process, namely, the time course of accumulation of protein and mRNA, and of ribo-sosmal loading on the mRNA). These signatures provide a new tool for discriminating between distinct mechanisms. We thus propose the
concept of a characteristic kinetic signature for miRNA modes of action .
In addition, an essential conclusion of our analysis is that miRNA action will impact the fi nal kinetic output only if it targets a sensitive parameter of the system .
The hypothesis that microRNA action can have a visible impact on protein output only if it affects the rate-limiting step has already been suggested in [ 12 ] for inhibition of translational initiation. However, the notion of rate-limiting step becomes non-trivial when we consider complex networks (more complex than a linear chain or a cycle of monomolecular reactions). The mathematical model that we present here con fi rms the conclu-sions from [ 12 ] , and extends them to all steps of microRNA action. The mathematical approach we have developed for analysis of this complex system uses the notion of dominant dynamical system, itself a generalization of the rate-limiting step concept to complex networks [ 13, 73, 80 ] .
In accordance with the general theory of dynamical limitation [ 73 ] , we can take into account not only the steady-state rates of protein synthesis but also its relaxation time. For exam-ple, for a linear chain of reactions, the steady-state rate depends on the slowest kinetic rate parameter (rate-limiting step), whereas the relax-ation time of the system depends on the second slowest kinetic rate parameter.
The analysis of our results allowed us to sug-gest a unifying theory for miRNA modes of action: all proposed modes of action operate simultaneously, and the apparent mechanism that will be detected depends on a set of sensitive intrinsic parameters of the individual target mRNA under study. This hypothesis would explain the following set of observations: (1) that the same microRNA apparently uses distinct mechanisms on different targets (e.g. for let7: [ 18, 24, 29, 52, 70 ] ; for CXCR4: [ 19, 25, 30, 34 ] ; for miR16: [ 32, 82 ] ; for miR122: [ 83 ] ); (2) that microRNA’s mode of action depends on the pro-moter under which the target mRNA is tran-scribed [ 68 ] ; and (3) that the status of the cell affects the fi nal observable mode of miRNAs action [ 37, 39, 54 ] . Moreover, the possibility of coexistence of two or several mechanisms has
22111 Mathematical Modeling of microRNA–Mediated Mechanisms of Translation Repression
already been discussed and proven in the litera-ture [ 5, 6, 18, 22, 39, 49, 53, 54 ] .
As already stated, our modelling results lead us to propose that, in individual biological sys-tems, the relative abundance and/or activity of some set of intrinsic factors determines the appar-ent inhibition mechanism that will be detected. These factors are not related to the miRNA path-ways , but intrinsically determine the sensitive parameters of the system . Indeed, RNA-binding proteins not related to the miRNA pathway have been shown to have a strong in fl uence on the fi nal outcome of miRNA regulation [ 74, 84– 86 ] .
A body of studies underscore the importance of intrinsic parameters of mRNAs. Revisiting theses studies in the framework of our model provides an explanation for most of the discrepancies in the literature. Thus, in most of the studies showing ini-tiation inhibition, in vitro transcribed mRNAs (transfected into cells or studied directly in vitro ) were used. In contrast, almost all data supporting elongation inhibition were obtaining in living cells, and thus with physiologically modi fi ed tar-get mRNAs [ 18– 21, 25, 70 ] , with only one and very speci fi c exception [ 33 ] . Similarly, most of the studies showing IRES-driven mRNAs as being refractory to microRNAs were carried out either in vitro [ 70 ] or using in vitro transcribed mRNAs transfected into cells [ 18– 20 ] , whereas the studies showing IRES-driven mRNAs to be repressed by miRNAs were carried out with mRNAs transcribed in situ , inside cells [ 30, 32 ] . In all these cases, the difference might come from the status of the target mRNA, rather than from any putative or actual dif-ferences in the microRNA machinery.
Another example is the in fl uence of splicing marks attached to mRNAs in vivo . The process of mRNA splicing leaves protein marks on mRNAs, which promotes the fi rst round of translation at the initiation step [ 87, 88 ] . These marks are dis-sociated during the fi rst round of translation. Splicing marks, by increasing the initial initia-tions, would lead to higher initiation rates on intron-containing mRNAs [ 89 ] . Elongation would thus become a limiting step. In contrast, in vitro transcribed mRNAs lack splicing marks, resulting in a decreased initiation rate, which becomes limiting. Moreover, under in vitro
conditions, initiation is highly dependent on the concentration of initiation factors, providing another possible explanation for discrepancies between in vitro studies.
Another example is the dependence of miRNA effects on codon usage. MicroRNA action has been reported to act on initiation steps when codon usage is optimized for human translation [ 11, 20 ] , whereas, with non-optimized codons, microRNA was found to act on elongation [ 27, 30, 33, 35 ] . This again might have something to do with different rates of elongation, elongation rates being, or not, among the set of limiting (sensitive) parameters for a given mRNA.
Yet another example is the dependence of microRNA mode of action on the experimental procedure for transfection of the mRNA [ 33 ] . The transfection procedure is likely to in fl uence the association of the target mRNA with mRNA-binding proteins, which, in turn, changes the sen-sitive parameters of the system, and hence the fi nal outcome of microRNA action.
All these and some other data clearly support the idea that the observed mode of action of a microRNA depends upon interplay between the intrinsic rates of the different steps of mRNA translation.
In summary, our results provide a mathemati-cal tool to discriminate between different miRNA modes of action. Moreover, we propose a unify-ing model in which the observed mode of action of a particular miRNA is dictated by the relation-ships among the intrinsic parameters of its target mRNA. We anticipate that the tool we have devel-oped will promote better analysis of experimen-tal data, and that our model will permit a better understanding of microRNA action. Most impor-tantly, our hypothesis would explain most of the discrepancies in the corresponding literature.
Acknowledgements This work was supported by a grant from the European Commission Sixth Framework Programme (Integrated Project SIROCCO, contract num-ber LSHG-CT-2006-037900) to AHB, and from the Agence Nationale de la Recherche (project ANR-08-SYSC-003 CALAMAR) and from the Projet Incitatif Collaboratif “Bioinformatics and Biostatistics of Cancer” to Institut Curie. AZ is a member of the team “Systems Biology of Cancer”, labeled by the Ligue Nationale Contre le Cancer.
222 A. Zinovyev et al.
References
1. Bartel DP (2009) MicroRNAs: target recognition and regulatory functions. Cell 136:215–233
2. Carthew RW, Sontheimer EJ (2009) Origins and mechanisms of miRNAs and siRNAs. Cell 136:642–655
3. Chekulaeva M, Filipowicz W (2009) Mechanisms of miRNA-mediated post-transcriptional regulation in animal cells. Curr Opin Cell Biol 21:452–460
4. Esquela-Kerscher A, Slack FJ (2006) Oncomirs – microRNAs with a role in cancer. Nat Rev Cancer 6:259–269
5. Eulalio A, Huntzinger E, Izaurralde E (2008) Getting to the root of miRNA-mediated gene silencing. Cell 132:9–14
6. Filipowicz W, Bhattacharyya SN, Sonenberg N (2008) Mechanisms of post-transcriptional regulation by microRNAs: are the answers in sight? Nat Rev Genet 9:102–114
7. Ghildiyal M, Zamore PD (2009) Small silencing RNAs: an expanding universe. Nat Rev Genet 10:94–108
8. Jackson RJ, Standart N (2007) How do microRNAs regulate gene expression? Sci STKE 2007:re1
9. Kloosterman WP, Plasterk RH (2006) The diverse functions of microRNAs in animal development and disease. Dev Cell 11:441–450
10. Moazed D (2009) Small RNAs in transcriptional gene silencing and genome defence. Nature 457:413–420
11. Pillai RS, Artus CG, Filipowicz W (2004) Tethering of human Ago proteins to mRNA mimics the miRNA-mediated repression of protein synthesis. RNA 10:1518–1525
12. Nissan T, Parker R (2008) Computational analysis of miRNA-mediated repression of translation: implica-tions for models of translation initiation inhibition. RNA 14:1480–1491
13. Zinovyev A, Morozova N, Nonne N, Barillot E, Harel-Bellan A, Gorban AN (2010) Dynamical modelling of microRNA action on the protein translation process. BMC Syst Biol 4:13
14. Gorban AN, Zinovyev A, Morozova N, Harel-Bellan A (2012) Modeling coupled transcription, translation and degradation and miRNA-based regulation of this process. E-print arXiv:1204.5941
15. Morozova N, Zinovyev A, Nonne N, Pritchard L-L, Gorban AN, Harel-Bellan A (2012) Kinetic signatures of microRNA modes of action. RNA 18(9):032284
16. Schwarz G (1968) Kinetic analysis by chemical relax-ation methods. Rev Mod Phys 40:206–218
17. Hammes GG (1968) Relaxation spectrometry of enzy-matic reactions. Accounts Chem Res 1(11):321–329
18. Pillai RS, Bhattacharyya SN, Artus CG, Zoller T, Cougot N, Basyuk E, Bertrand E, Filipowicz W (2005) Inhibition of translational initiation by Let-7 MicroRNA in human cells. Science 309:1573–1576
19. Humphreys DT, Westman BJ, Martin DI, Preiss T (2005) MicroRNAs control translation initiation by inhibiting eukaryotic initiation factor 4E/cap and poly(A) tail function. Proc Natl Acad Sci USA 102:16961–16966
20. Kiriakidou M, Tan GS, Lamprinaki S, De Planell-Saguer M, Nelson PT, Mourelatos Z (2007) An mRNA m7G cap binding-like motif within human Ago2 represses translation. Cell 129:1141–1151
21. Thermann R, Hentze MW (2007) Drosophila miR2 induces pseudo-polysomes and inhibits translation initiation. Nature 447:875–878
22. Zipprich JT, Bhattacharyya S, Mathys H, Filipowicz W (2009) Importance of the C-terminal domain of the human GW182 protein TNRC6C for translational repression. RNA 15(5):781–793
23. Eulalio A, Huntzinger E, Izaurralde E (2008) GW182 interaction with Argonaute is essential for miRNA-mediated translational repression and mRNA decay. Nat Struct Mol Biol 15:346–353
24. Chendrimada TP, Finn KJ, Ji X, Baillat D, Gregory RI, Liebhaber SA, Pasquinelli AE, Shiekhattar R (2007) MicroRNA silencing through RISC recruit-ment of eIF6. Nature 447:823–828
25. Wang B, Yanez A, Novina CD (2008) MicroRNA-repressed mRNAs contain 40S but not 60S compo-nents. Proc Natl Acad Sci USA 105:5343–5348
26. Olsen PH, Ambros V (1999) The lin-4 regulatory RNA controls developmental timing in Caenorhab-ditis elegans by blocking LIN-14 protein synthesis after the initiation of translation. Dev Biol 216:671–680
27. Gu S, Jin L, Zhang F, Sarnow P, Kay MA (2009) Biological basis for restriction of microRNA targets to the 3’ untranslated region in mammalian mRNAs. Nat Struct Mol Biol 16:144–150
28. Landthaler M, Gaidatzis D, Rothballer A, Chen PY, Soll SJ, Dinic L, Ojo T, Hafner M, Zavolan M, Tuschl T (2008) Molecular characterization of human Argonaute-containing ribonucleoprotein complexes and their bound target mRNAs. RNA 14:2580–2596
29. Maroney PA, Yu Y, Fisher J, Nilsen TW (2006) Evidence that microRNAs are associated with trans-lating messenger RNAs in human cells. Nat Struct Mol Biol 13:1102–1107
30. Petersen CP, Bordeleau ME, Pelletier J, Sharp PA (2006) Short RNAs repress translation after initiation in mammalian cells. Mol Cell 21:533–542
31. Baillat D, Shiekhattar R (2009) Functional dissection of the human TNRC6 (GW182-related) family of pro-teins. Mol Cell Biol 29:4144–4155
32. Karaa ZS, Iacovoni JS, Bastide A, Lacazette E, Touriol C, Prats H (2009) The VEGF IRESes are dif-ferentially susceptible to translation inhibition by miR-16. RNA 15:249–254
33. Lytle JR, Yario TA, Steitz JA (2007) Target mRNAs are repressed as ef fi ciently by microRNA-binding sites in the 5’UTR as in the 3’UTR. Proc Natl Acad Sci USA 104:9667–9672
22311 Mathematical Modeling of microRNA–Mediated Mechanisms of Translation Repression
34. Wang B, Love TM, Call ME, Doench JG, Novina CD (2006) Recapitulation of short RNA-directed translational gene silencing in vitro. Mol Cell 22:553–560
35. Nottrott S, Simard MJ, Richter JD (2006) Human let-7a miRNA blocks protein production on actively translat-ing polyribosomes. Nat Struct Mol Biol 13:1108–1114
36. Sen GL, Blau HM (2005) Argonaute 2/RISC resides in sites of mammalian mRNA decay known as cyto-plasmic bodies. Nat Cell Biol 7:633–636
37. Bhattacharyya SN, Habermacher R, Martine U, Closs EI, Filipowicz W (2006) Relief of microRNA-medi-ated translational repression in human cells subjected to stress. Cell 125:1111–1124
38. Jakymiw A, Lian S, Eystathioy T, Li S, Satoh M, Hamel JC, Fritzler MJ, Chan EK (2005) Disruption of GW bodies impairs mammalian RNA interference. Nat Cell Biol 7:1267–1274
39. Leung AK, Calabrese JM, Sharp PA (2006) Quantitative analysis of Argonaute protein reveals microRNA-dependent localization to stress granules. Proc Natl Acad Sci USA 103:18125–18130
40. Liu J, Rivas FV, Wohlschlegel J, Yates JR 3rd, Parker R, Hannon GJ (2005) A role for the P-body compo-nent GW182 in microRNA function. Nat Cell Biol 7:1261–1266
41. Liu J, Valencia-Sanchez MA, Hannon GJ, Parker R (2005) MicroRNA-dependent localization of targeted mRNAs to mammalian P-bodies. Nat Cell Biol 7:719–723
42. Pauley KM, Eystathioy T, Jakymiw A, Hamel JC, Fritzler MJ, Chan EK (2006) Formation of GW bod-ies is a consequence of microRNA genesis. EMBO Rep 7(9):904–910
43. Eulalio A, Behm-Ansmant I, Schweizer D, Izaurralde E (2007) P-body formation is a consequence, not the cause, of RNA-mediated gene silencing. Mol Cell Biol 27:3970–3981
44. Leung AK, Sharp PA (2006) microRNAs: a safeguard against turmoil? Cell 130:581–585
45. Lim LP, Lau NC, Garrett-Engele P, Grimson A, Schelter JM, Castle J, Bartel DP, Linsley PS, Johnson JM (2005) Microarray analysis shows that some microRNAs downregulate large numbers of target mRNAs. Nature 433:769–773
46. Baek D, Villen J, Shin C, Camargo FD, Gygi SP, Bartel DP (2008) The impact of microRNAs on pro-tein output. Nature 455:64–71
47. Bagga S, Bracht J, Hunter S, Massirer K, Holtz J, Eachus R, Pasquinelli AE (2005) Regulation by let-7 and lin-4 miRNAs results in target mRNA degrada-tion. Cell 122:553–563
48. Behm-Ansmant I, Rehwinkel J, Doerks T, Stark A, Bork P, Izaurralde E (2006) mRNA degradation by miRNAs and GW182 requires both CCR4: NOT deadenylase and DCP1: DCP2 decapping complexes. Genes Dev 20:1885–1898
49. Eulalio A, Rehwinkel J, Stricker M, Huntzinger E, Yang SF, Doerks T, Dorner S, Bork P, Boutros M,
Izaurralde E (2007) Target-speci fi c requirements for enhancers of decapping in miRNA-mediated gene silencing. Genes Dev 21:2558–2570
50. Jing Q, Huang S, Guth S, Zarubin T, Motoyama A, Chen J, Di Padova F, Lin SC, Gram H, Han J (2005) Involvement of microRNA in AU-rich element-medi-ated mRNA instability. Cell 120:623–634
51. Selbach M, Schwanhausser B, Thierfelder N, Fang Z, Khanin R, Rajewsky N (2008) Widespread changes in protein synthesis induced by microRNAs. Nature 455:58–63
52. Wakiyama M, Takimoto K, Ohara O, Yokoyama S (2007) let-7 microRNA-mediated mRNA deadenyla-tion and translational repression in a mammalian cell-free system. Genes Dev 21:1857–1862
53. Wu L, Fan J, Belasco JG (2006) MicroRNAs direct rapid deadenylation of mRNA. Proc Natl Acad Sci USA 103:4034–4039
54. Valencia-Sanchez MA, Liu J, Hannon GJ, Parker R (2006) Control of translation and mRNA degradation by miRNAs and siRNAs. Genes Dev 20(5):515–524
55. Coller J, Parker R (2004) Eukaryotic mRNA decap-ping. Annu Rev Biochem 73:861–890
56. Llave C, Xie Z, Kasschau KD, Carrington JC (2002) Cleavage of Scarecrow-like mRNA targets directed by a class of Arabidopsis miRNA. Science 297(5589):2053–2056
57. Rhoades MW, Reinhart BJ, Lim LP, Burge CB, Bartel B, Bartel DP (2002) Prediction of plant microRNA targets. Cell 110(4):513–520
58. Hutvagner G, Zamore PD (2002) A microRNA in a multiple-turnover RNAi enzyme complex. Science 297:2056–2060
59. Yekta S, Shih IH, Bartel DP (2004) MicroRNA-directed cleavage of HOXB8 mRNA. Science 304:594–596
60. Aleman LM, Doench J, Sharp PA (2007) Comparison of siRNA-induced off-target RNA and protein effects. RNA 13:385–395
61. Morris KV, Chan SW, Jacobsen SE, Looney DJ (2004) Small interfering RNA-induced transcriptional gene silencing in human cells. Science 305(5688):1289–92
62. Kim DH, Saetrom P, Snove O Jr, Rossi JJ (2008) MicroRNA-directed transcriptional gene silencing in mammalian cells. Proc Natl Acad Sci USA 105:16230–16235
63. Place RF, Li LC, Pookot D, Noonan EJ, Dahiya R (2008) MicroRNA-373 induces expression of genes with complementary promoter sequences. Proc Natl Acad Sci USA 105:1608–1613
64. Weinberg MS, Villeneuve LM, Ehsani A, Amarzguioui M, Aagaard L, Chen ZX, Riggs AD, Rossi JJ, Morris KV (2006) The antisense strand of small interfering RNAs directs histone methylation and transcriptional gene silencing in human cells. RNA 12(2):256–62
65. Orom UA, Nielsen FC, Lund AH (2008) MicroRNA-10a binds the 5’UTR of ribosomal protein mRNAs and enhances their translation. Mol Cell 30:460–471
224 A. Zinovyev et al.
66. Vasudevan S, Steitz JA (2007) AU-rich-element-mediated upregulation of translation by FXR1 and Argonaute 2. Cell 128:1105–1118
67. Kinch LN, Grishin NV (2009) The human Ago2 MC region does not contain an eIF4E-like mRNA cap binding motif. Biol Direct 4:2
68. Kong YW, Cannell IG, de Moor CH, Hill K, Garside PG, Hamilton TL, Meijer HA, Dobbyn HC, Stoneley M, Spriggs KA et al (2008) The mechanism of micro-RNA-mediated translation repression is determined by the promoter of the target gene. Proc Natl Acad Sci USA 105:8866–8871
69. Kozak M (2008) Faulty old ideas about translational regulation paved the way for current confusion about how microRNAs function. Gene 423(2):108–115
70. Mathonnet G, Fabian MR, Svitkin YV, Parsyan A, Huck L, Murata T, Biffo S, Merrick WC, Darzynkiewicz E, Pillai RS, Filipowicz W, Duchaine TF, Sonenberg N (2007) MicroRNA inhibition of translation initiation in vitro by targeting the cap-binding complex eIF4F. Science 317:1764–1767
71. Eulalio A, Huntzinger E, Nishihara T, Rehwinkel J, Fauser M, Izaurralde E (2009) Deadenylation is a widespread effect of miRNA regulation. RNA 15:21–32
72. Standart N, Jackson RJ (2007) MicroRNAs repress translation of m7Gppp-capped target mRNAs in vitro by inhibiting initiation and promoting deadenylation. Genes Dev 21(16):1975–1982
73. Gorban AN, Radulescu O (2008) Dynamic and static limitation in Multiscale reaction networks, Revisited. Adv Chem Eng 34:103–173, E-print arXiv:physics/0703278 [physics.chem-ph]
74. Radulescu O, Gorban AN, Zinovyev A, Lilienbaum A (2008) Robust simpli fi cations of multiscale biochemi-cal networks. BMC Syst Biol 2:86
75. Yang E, van Nimwegen E, Zavolan M, Rajewsky N, Schroeder M, Magnasco M, Darnell JE Jr (2003) Decay rates of human mRNAs: correlation with func-tional characteristics and sequence attributes. Genome Res 13:1863–1872
76. Bergmann JE, Lodish HF (1979) A kinetic model of protein synthesis. Application to hemoglobin synthe-sis and translational control. J Biol Chem 254:11927–11937
77. Hunt T, Hunter T, Munro A (1969) Control of haemo-globin synthesis: rate of translation of the messenger RNA for the alpha and beta chains. J Mol Biol 43:123–133
78. Scornik OA (1974) In vivo rate of translation by ribo-somes of normal and regenerating liver. J Biol Chem 249:3876–3883
79. Gilchrist MA, Wagner A (2006) A model of protein translation including codon bias, nonsense errors, and ribosome recycling. J Theor Biol 239:417–434
80. Hartl DL, Jones EW (2005) Genetics: analysis of genes and genomes, 6th edn. Jones & Bartlett Publishers, Sudbury
81. Gorban AN, Radulescu O, Zinovyev A (2010) Asymptotology of chemical reaction networks. Chem Eng Sci 65:2310–2324, E-print arXiv:0903.5072 [physics.chem-ph]
82. Huang J, Liang Z, Yang B, Tian H, Ma J, Zhang H (2007) Derepression of microRNA-mediated protein translation inhibition by apolipoprotein B mRNA-editing enzyme catalytic polypeptide-like 3G (APOBEC3G) and its family members. J Biol Chem 282:33632–33640
83. Jopling CL, Schütz S, Sarnow P (2008) Position-dependent function for a tandem microRNA miR-122-binding site located in the Hepatitis C Virus RNA genome. Cell Host Microbe 4(1):77–85
84. Mayr C, Bartel DP (2009) Widespread shortening of 3’UTRs by alternative cleavage and polyadenylation activates oncogenes in cancer cells. Cell 138:673–684
85. Moore MJ (2005) From birth to death: the complex lives of eukaryotic mRNAs. Science 309:1514–1518
86. Sandberg R, Neilson JR, Sarma A, Sharp PA, Burge CB (2008) Proliferating cells express mRNAs with shortened 3’ untranslated regions and fewer microRNA target sites. Science 320:1643–1647
87. Le Hir H, Seraphin B (2008) EJCs at the heart of translational control. Cell 133:213–216
88. Moore MJ, Proudfoot NJ (2009) Pre-mRNA process-ing reaches back to transcription and ahead to transla-tion. Cell 136:688–700
89. Kapp LD, Lorsch JR (2004) The molecular mechan-ics of eukaryotic translation. Annu Rev Biochem 73:657–704