Embed Size (px)
Citation preview
Mathematical Methods in Economics 2011

29th International Conference
Mathematical Methods in Economics 2011
Proceedings – part II
We celebrate 20th Anniversary of the Czech and
Slovak Operational Research Societies
September 6 – 9, 2011 Janská Dolina, Slovakia
The conference is organised by:
Faculty of Informatics and Statistics, University of Economics, Prague
Faculty of Economic Informatics, University of Economics in Bratislava
Czech Society of Operational Research
Slovak Society of Operational Research
Czech Econometric Society
Proceedings of the 29th International Conference on Mathematical Methods in Economics 2011 – part II Publisher: Professional Publishing
Mikulova 1572/13, 149 00 Praha 4, Czech Republic Editors: Martin Dlouhý, Veronika Skočdopolová Pages: 791
ISBN 978-80-7431-059-1
Copyright © 2011 by University of Economics, Prague, Faculty of Informatics and Statistics Copyright © 2011 by authors of the papers
All rights reserved. No part of this publication may be reproduced or transmitted in any form or by any means, electronic or mechanical, including photocopy, recording, or any information storage and retrieval system, without permission in writing from the publisher.
The publication has not passed the language correction.

Programme Committee
Helena Brožová Faculty of Economics and Management, University of Life Science, Prague
Michal Fendek Faculty of Economic Informatics, University of Economics in Bratislava
Petr Fiala Faculty of Informatics and Statistics, University of Economics, Prague
Jana Hančlová Faculty of Economics, Technical University of Ostrava
Zlatica Ivaničová Faculty of Economic Informatics, University of Economics in Bratislava
Josef Jablonský Faculty of Informatics and Statistics, University of Economics, Prague
Ladislav Lukáš Faculty of Economics, University of West Bohemia, Pilsen
Vladimír Mlynarovič Faculty of Social and Economic Sciences, Comenius University in Bratislava
Jan Pelikán Faculty of Informatics and Statistics, University of Economics, Prague
Karel Sladký Institute of Information Theory and Automation of the Academy of Sciences of CR, Prague
Tomáš Šubrt Faculty of Economics and Management, University of Life Science, Prague
Milorad Vidović Faculty of Transport and Traffic Engineering, Uiversity of Belgrade, Serbia
Karel Zimmermann Faculty of Mathematics and Physics Charles University, Prague
Organization Committee
Martin Dlouhý, Jan Fábry Jana Kalčevová, Martina Kuncová
Faculty of Informatics and Statistics, University of Economics, Prague, Czech Republic
Ivan Brezina, Juraj Pekár, Kvetoslava Surmanová, Marian Reiff
Faculty of Economic Informatics, University of Economics in Bratislava, Slovakia
Contents – Part II
Kresta, A., Tichý, T. International Equity Risk Modeling by NIG Model 401
Krištoufek, L. Multifractal Height Cross-Correlation Analysis 407
Kučera, P. Solution of the Time Limited Vehicle Routing Problem by Different Approximation Methods Depending on the Number of Necessary Vehicles
413
Kuncová, M., Doucek, P. Comparison of the Cluster Analysis and the Methods of the Multi-Criteria Evaluation of Alternatives Used to Create a Groups of Countries Similar in the Take up of the Internet Services
419
Kvasnička, M. Multi-Agent Simulation of Tiebout Model 425
Kvasnička, M., Staněk, R., Krčál, O. Monopoly Supply Chain Management via Rubinstein Bargaining 431
Kvet, M. Adaptive Algorithm of Parameter Adjustment for Approximate Solving of the p-Median Problem 437
Liščinský, Z. Analyzing Behaviour of Czech Economy: A Nonlinear DSGE Model Framework 443
Lukáš, L. Weight Generation and Construction of Preferences by Monte Carlo Method in AHP with Inconsistent Interval Comparison Matrices
449
Majerová, I. The Economic Application of Game Theory on the Case of Least Development Countries (LDCs) 455
Mazurek, J. The Fuzzy Permutation Model for the Ordinal Ranking Problem Solution 462
Mazurkiewicz, M., Mercik, J., W., Turnovec, F. Transition of Votes for Consecutive Elections – Ecological Regression Modelling 468
Melecký, L., Staníčková, M. The Competitiveness of Visegrad Four NUTS 2 Regions and its Evaluation by DEA Method Application
474
Mielcová, E. Okun’s Law in Transition Economies – The Case of the Czech and Slovak Republics 1995-2010 480
Mikula, Š. On the Predictability of Institutional Environment 486
Motl, T., Vašíček, O. Analyzing the Czech Output Gap Using a Small Open Economy DSGE Model 492
Myšková, H. The Algorithm for Testing Solvability of Max-Plus Interval Systems 498
Němec, D. Czech Labour Market Through the Lens of a Search and Matching DSGE Model 504
Novotná, M. Application of Selected Scoring Models on Corporate Credit Rating 511
Novotný, J. Were Stocks during the Crisis More Jumpy?: A Comparative Study 517
Palúch, S. A Note to Vehicle Scheduling with Several Bus Types 523
Pánková, V. Q-Model of Investment 529
Pech, M., Smolová, J. Fuzzy Approach to Modification by Enlargement of Supply Chain Based on Logistic Indicators Dimensions
533
Pelikán, J. On the Reducibility of the Pickup and Delivery Problem 540
Perzina, R. Self-Adaptive Genetic Algorithm for Solving Travelling Purchaser Problem 545
Peško, Š Routing Problem with Many Starting Points and Cost Dependent on Starting Point 551
Píša, V., Brůha, J. The Dynamics of the World Agricultural Production and Consumption 556
Plevný, M., Kubišová, T. The Optimization Process of the Stock Control Management by Means of the Random Method of Storing
562
Pozdílková, A. Construction of Monge Matrices in Max-Min Algebra 569
Pražák, P. On Necessary Transversality Condition for Infinite Horizon Optimal Control Problems 575
Princ, P., Černohous, R., Kuncová, M. Simulation Model of the Logistic Flows between Warehouse and Production 581
Ramík, J. Pairwise Comparison Method in Multi-Criteria Optimization - An Alternative Approach 587
Rashid, I., Gavalec, M., Cimler, R. Monotone Eigenspace Structure of a Max- Łukasiewicz Fuzzy Matrix 593
Rozkovec, J. Optimal Strategy in Sports Betting 599
Rydval, J. Quantification of Framing Effect Using ANP and AHP 605
Ryšánek, J., Tonner, J., Vašíček, O. Bayesian Estimation of Model with Financial Frictions on Czech Data 611
Skalská, H. Predictive Modeling and Measures of Performance 617
Skočdopolová, V. Real-World Applications of Goal Programming 623
Sladký, K. Separable Utility Functions in Dynamic Economic Models 629

Slanicay, M. Impact of Asymmetric Shocks and Structural Differences between the Czech Economy and Euro 635
Staněk, R. Price Formation in Random Matching Model 641
Stavárek, D., Heryán, T. Calendar Anomalies in the Central European Stock Exchanges during the Financial Crisis 647
Stoklasa, J., Talašová, J. Using Linguistic Fuzzy Modeling for MMPI-2 Data Interpretation 653
Suchánková, T. Wheat Production Function Analysis Using Panel Data 659
Surmanová, K., Furková, A. Methods for Output Gap Detection 665
Szarowská, I. Development and the Cyclicality of Government Spending in the Czech Republic 671
Szomolányi, K., Lukáčiková, A., Lukáčik, M. The β-Convergence of the EU27 Countries 677
Šindelářová, I., Zouhar, J. Teaching OR and Econometrics: A Case for Emphasizing Links between Graphs and Matrices 682
Škulavíková, Š., Fiala, P. Using Markov Chains in Project Management 688
Šmíd, M. A Simple Decision Problem of a Market Maker 694
Talašová, J., Stoklasa, J. A Model for Evaluating Creative Work Outcomes at Czech Art Colleges 698
Teichmann, D., Dorda, M., Frič, J. An Extended Model for the Design of City Mass Transport Network 704
Tichý, T., Holčapek, M. Simulation Methodology for Financial Assets with Imprecise Data 709
Toman, Ľ Acceleration of Evacuation Problem Solving by Branch and Bound Method with Assistance of Rapid Excluding of Branches
715
Tonner, J., Polanský, J., Vašíček, O. Bayesian Estimation of a Comprehensive Small Open Economy Model on the Czech Data 721
Turnovec, F. Fair Voting Majorities in Proportional Representation 727
Tvrdoň, M., Verner, T. Examining the Relationship between Economic Performance and Unemployment: The Case of Visegrad Countries
733
Tvrz, S., Vašíček, O. Labour Market Frictions in Global Economic Crisis: RBC Model of Czech Economy 739
Valecký, J. Analyzing Relations of Insured Accident and Selected Risk Factors with Interactions 745
Volf, P. Analysis of Occurrence of Extremes in a Time Series with a Trend 751

Wolf, P., Machula, P. Proposal of Determination of the Rules for Design of Fuzzy Sets of Qualitative Indicators Usedin the Decision-Making Processes in Lean Company
757
Zelinková, K., Valecký, J. Evaluating Value at Risk an Expected Shortfall of Individual Insurance Claims 763
Zemková, B., Talašová, J., Holeček, P. Fuzzy Model for Determining the Type of Worker 768
Zmeškal, Z. Investigation of the Real Switch Option Value Sensitivity 774
Zouhar, J. Simultaneous Scheduling of Material Handling and Production Processes: Classification and Heuristics for Parallel Machine Problems
780
Žižka, M. Model for Assessment of the Social Economic Level of Municipalities 786
Fair voting majorities in proportional representation František Turnovec
1
Abstract. In parliaments elected by proportional systems the seats are allocated to
the political parties roughly proportionally to the shares of votes for the party lists
obtained in elections. Assuming that members of the parliament representing the
same party are voting together, it has sense to require that distribution of the influ-
ence of the parties in parliamentary decision making is proportional to the distribu-
tion of seats. There exist measures (so called voting power indices) reflecting an
ability of each party to influence outcome of voting. Power indices are functions of
distribution of seats and voting quota (where voting quota means a minimal number
of votes required to pass a proposal). By a fair voting rule we call such a quota that
leads to proportionality of influence to relative representation. Usually simple major-
ity is not a fair voting rule. That is the reason why so called qualified or constitu-
tional majority is being used in voting about important issues requiring higher level
of consensus. Qualified majority is usually fixed (60% or 66.67%) independently on
the structure of political representation. In the paper we use game-theoretical model
of voting to find a quota that defines the fair voting rule as a function of the structure
of political representation. Such a quota we call a fair majority. Fair majorities can
differ for different structures of the parliament. Concept of a fair majority is illus-
trated on the data for the Lower House of the Czech Parliament elected in 2010.
Keywords: fair majority, power indices, quota interval of stable power, simple
weighted committee, voting power.
JEL Classification: C71, D72, H77
AMS Classification: 91A12, 91A40, 05C65
1 Fairness in voting
A qualified majority is a requirement for a proposal to gain a specified level or type of support which exceeds a
simple majority (over 50%). In some jurisdictions, for example, parliamentary procedure requires that any action
that may alter the rights of the minority has a qualified majority support. Particular designs of qualified majority
(such as 60% or two-thirds majority) are selected “ad hoc”, without quantitative justification. In this paper we try
to provide such a justification, defining qualified majority by a “fair quota”, providing each legislator with
(approximately) the same influence, measured as an a priori voting power.
Let us consider a committee with n members. Each member has some voting weight (number of votes, shares
etc.) and a voting rule is defined by a minimal number of weights required for passing a proposal. Given a voting
rule, voting weights provide committee members with voting power. Voting power means an ability to influence
the outcome of voting. Voting power indices are used to quantify the voting power.
The concept of fairness is being discussed related to the distribution of voting power among different actors
of voting. This problem was clearly formulated by Nurmi [5], p. 204: “If one aims at designing collective deci-
sion-making bodies which are democratic in the sense of reflecting the popular support in terms of the voting
power, we need indices of the latter which enable us to calculate for any given distribution of support and for
any decision rule the distribution of seats that is ‘just’. Alternatively, we may want to design decision rules that –
given the distribution of seats and support – lead to a distribution of voting power which is identical with the
distribution of support.”
Voting power is not directly observable: as a proxy for it voting weights are used. Therefore, fairness is
usually defined in terms of voting weights (e.g. voting weights are proportional to the results of an election).
Assuming that a principle of fair distribution of voting weights is selected, we are addressing the question of how
to achieve equality of voting power (at least approximately) to relative voting weights. For evaluation of voting
power we are using concepts of a priori power indices (a comprehensive survey of power indices theory see in
Felsenthal and Machover [2]). The concepts of optimal quota, introduced by Słomczyński and Życzkowski [10],
[11] for the EU Council of Ministers distribution of national voting weights (weights equal to square roots of
1 Charles University in Prague, Faculty of Social Sciences, Institute of Economic Studies, Opletalova 26, 110 00
Prague 1, Czech Republic, e-mail: [email protected]
.
727
population and quota that provides each citizen of the EU with the same indirect voting power measured by
Penrose-Banzhaf index independently on her national affiliation), and of intervals of stable power (Turnovec
[12]) are used to find, given voting weights, a fair voting rule minimizing the distance between actors’ voting
weights and their voting power.
In the second section basic definitions are introduced and the power indices methodology is shortly resumed. The
third section introduces concepts of quota intervals of stable power and fair quota. The fourth section applies the
concept of fair quota for the Lower House of the Czech Parliament elected in 2010..
2 Committees and voting power
A simple weighted committee is a pair [N, w], where N be a finite set of n committee members ni ,...,2,1 , and w
= (w1, w2, …, wn) be a nonnegative vector of committee members’ voting weights (e.g. votes or shares). By 2N we
denote the power set of N (set of all subsets of N). By voting coalition we mean an element S 2N, the subset of
committee members voting uniformly (YES or NO), and ( ) i
i S
w S w
denotes the voting weight of coalition S. The
voting rule is defined by quota q satisfying 0 ( )q w N , where q represents the minimal total weight necessary to
approve the proposal. Triple [N, q, w] we call a simple quota weighted committee. The voting coalition S in
committee [N, q, w] is called a winning one if qSw )( and a losing one in the opposite case. The winning voting
coalition S is called critical if there exists at least one member k S such that w(S\k) < q (we say that k is critical in
S). The winning voting coalition S is called minimal if any of its members is critical in S.
A priori voting power analysis seeks an answer to the following question: Given a simple quota weighted
committee [ , , ]N q w , what is an influence of its members over the outcome of voting? The absolute voting power
of a member i is defined as a probability [ , , ]i N q w that i will be decisive in the sense that such a situation
appears in which she would be able to decide the outcome of voting by her vote (Nurmi [6] and Turnovec [13]),
and a relative voting power as [ , , ]
[ , , ][ , , ]
i
i
k
k N
N qN q
N q
w
ww
.
Two basic concepts of decisiveness are used: swing position and pivotal position. The swing position is an ability
of an individual voter to change the outcome of voting by a unilateral switch from YES to NO (if member j is critical
with respect to a coalition S, we say that he has a swing in S). The pivotal position is such a position of an individual
voter in a permutation of voters expressing a ranking of attitudes of members to the voted issue (from the most pref-
erable to the least preferable) and the corresponding order of forming of the winning coalition, in which her vote
YES means a YES outcome of voting and her vote NO means a NO outcome of voting (we say that j is pivotal in the
permutation considered).
Let us denote by i the member of the simple quota weighted committee [N, q, w], W(N, q, w) the set of all win-
ning coalitions and by Wi(N, q, w) the set of all winning coalitions with i, C(N, q, w) the set of all critical winning
coalitions, and by Ci(N, q, w) the set of all critical winning coalitions i has the swing in, by P(N) the set of all permu-
tations of N and Pi(N, q, w) the set of all permutations i is pivotal in. By card(S) we denote the cardinality of S,
card() = 0.
Assuming many voting acts and all coalitions equally likely, it makes sense to evaluate the a priori voting power
of each member of the committee by the probability to have a swing, measured by the absolute Penrose-Banzhaf
(PB) power index (Penrose [8], Banzhaf [1]) 1
( )( , , )
2
PB i
i n
card CN q
w , where (card(Ci) is the number of all win-
ning coalitions the member i has the swing in and 2n-1
is the number of all possible coalitions with i). To compare the
relative power of different committee members, the relative form of the PB power index
( )( , , )
( )
PB i
i
k
k N
card CN q
card C
w is used.
While the absolute PB is based on a well-established probability model (see e.g. Owen [5]), its normalization
(relative PB index) destroys this probabilistic interpretation, the relative PB index simply answers the question of
what is the voter i’s share in all possible swings.
Assuming many voting acts and all possible preference orderings equally likely, it makes sense to evaluate an a
priori voting power of each committee member by the probability of being in pivotal situation, measured by the
728
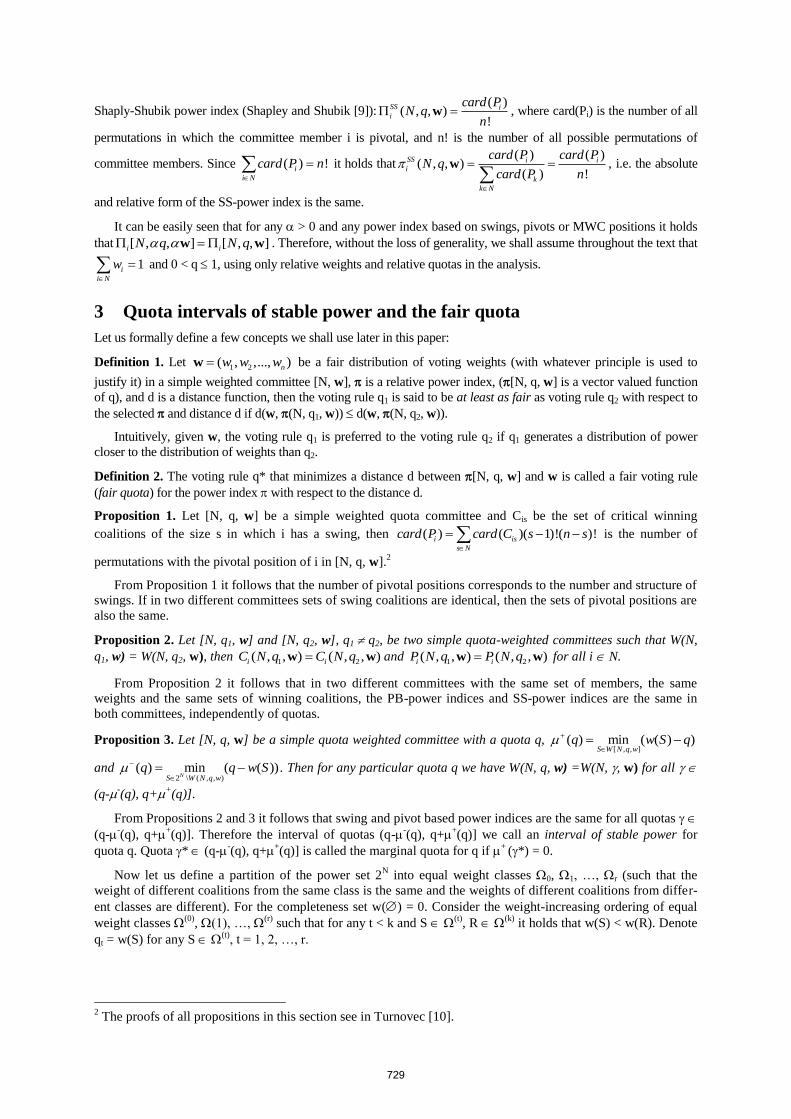
Shaply-Shubik power index (Shapley and Shubik [9]):( )
( , , )!
SS i
i
card PN q
n w , where card(Pi) is the number of all
permutations in which the committee member i is pivotal, and n! is the number of all possible permutations of
committee members. Since ( ) !i
i N
card P n
it holds that( ) ( )
( , , )( ) !
SS i i
i
k
k N
card P card PN q
card P n
w , i.e. the absolute
and relative form of the SS-power index is the same.
It can be easily seen that for any > 0 and any power index based on swings, pivots or MWC positions it holds
that [ , , ] [ , , ]i iN q N q w w . Therefore, without the loss of generality, we shall assume throughout the text that
1i
i N
w
and 0 < q 1, using only relative weights and relative quotas in the analysis.
3 Quota intervals of stable power and the fair quota
Let us formally define a few concepts we shall use later in this paper:
Definition 1. Let 1 2( , ,..., )nw w ww be a fair distribution of voting weights (with whatever principle is used to
justify it) in a simple weighted committee [N, w], is a relative power index, ([N, q, w] is a vector valued function
of q), and d is a distance function, then the voting rule q1 is said to be at least as fair as voting rule q2 with respect to
the selected and distance d if d(w, (N, q1, w)) d(w, (N, q2, w)).
Intuitively, given w, the voting rule q1 is preferred to the voting rule q2 if q1 generates a distribution of power
closer to the distribution of weights than q2.
Definition 2. The voting rule q* that minimizes a distance d between [N, q, w] and w is called a fair voting rule
(fair quota) for the power index with respect to the distance d.
Proposition 1. Let [N, q, w] be a simple weighted quota committee and Cis be the set of critical winning
coalitions of the size s in which i has a swing, then ( ) ( )( 1)!( )!i is
s N
card P card C s n s
is the number of
permutations with the pivotal position of i in [N, q, w].2
From Proposition 1 it follows that the number of pivotal positions corresponds to the number and structure of
swings. If in two different committees sets of swing coalitions are identical, then the sets of pivotal positions are
also the same.
Proposition 2. Let [N, q1, w] and [N, q2, w], q1 q2, be two simple quota-weighted committees such that W(N,
q1, w) = W(N, q2, w), then 1 2( , , ) ( , , )i iC N q C N qw w and 1 2( , , ) ( , , )i iP N q P N qw w for all i N.
From Proposition 2 it follows that in two different committees with the same set of members, the same
weights and the same sets of winning coalitions, the PB-power indices and SS-power indices are the same in
both committees, independently of quotas.
Proposition 3. Let [N, q, w] be a simple quota weighted committee with a quota q, [ , , ]
( ) min ( ( ) )S W N q w
q w S q
and 2 \ ( , , )
( ) min ( ( ))NS W N q w
q q w S
. Then for any particular quota q we have W(N, q, w) =W(N, , w) for all
(q--(q), q++
(q)].
From Propositions 2 and 3 it follows that swing and pivot based power indices are the same for all quotas
(q--(q), q+
+(q)]. Therefore the interval of quotas (q-
-(q), q+
+(q)] we call an interval of stable power for
quota q. Quota * (q--(q), q+
+(q)] is called the marginal quota for q if
+ (*) = 0.
Now let us define a partition of the power set 2N into equal weight classes 0, 1, …, r (such that the
weight of different coalitions from the same class is the same and the weights of different coalitions from differ-
ent classes are different). For the completeness set w() = 0. Consider the weight-increasing ordering of equal
weight classes (0)
, (1), …, (r)
such that for any t < k and S (t)
, R (k)
it holds that w(S) < w(R). Denote
qt = w(S) for any S (t)
, t = 1, 2, …, r.
2 The proofs of all propositions in this section see in Turnovec [10].
729
Proposition 4. Let (0), (1)
, …, (r) be the weight-increasing ordering of the equal weight partition of 2
N. Set qt
= w(S) for any S (t), t = 0, 1, 2, …, r. Then there is a finite number r 2
n-1 of marginal quotas qt and corre-
sponding intervals of stable power (qt-1, qt] such that W(N, qt, w) W(N, qt-1, w) .
From Proposition 4 it follows that there exist at most r distinct voting situations generating r vectors of power
indices.
Proposition 5. Let [N, q, w] be a simple quota weighted committee and (qt-1, qt] is the interval of stable power
for quota q. Then ( ( , , )) ( ( , , ))i icard C N q card C N w w and ( ( , , )) ( ( , , ))i icard P N q card P N w w for any =
1 – qt + , where (0, qt - qt-1] and for all i N.
While in [N, q, w] the quota q means the total weight necessary to pass a proposal (and therefore we can call
it a winning quota), the blocking quota means the total weight necessary to block a proposal. If q is a winning
quota and (qt-1, qt] is a quota interval of stable power for q, then any voting quota 1 - qt-1 + (where 0 < qt –
qt-1), is a blocking quota. From Proposition 5 it follows that the blocking power of the committee members,
measured by swing and pivot-based power indices, is equal to their voting power. It is easy to show that voting
power and blocking power might not be the same for power indices based on membership in minimal winning
coalitions (HP and DP power indices). Let r be the number of marginal quotas, then from Proposition 4 it follows
that for power indices based on swings and pivots the number of majority power indices does not exceed int
(r/2)+1.
Proposition 6. Let [N, q, w] be a simple quota-weighted committee, d be a distance function and i(N, qt, w) be
relative power indices for marginal quotas qt,, and qt* be the majority marginal quota minimizing the distance
( , , ),j id N q w π w where j = 1, 2, …, r, r is the number of intervals of stable power such that qj are marginal
majority quotas, then the fair quota for a particular power index used with respect to distance d is any (qt*-1,
qt*] from the quota interval of stable power for qt*.
From Proposition 6 it follows that the voting rule based on quota qt* minimizes selected distance between the
vector of relative voting weights and the corresponding vector of relative voting power. The problem of fair
quota has an exact solution via the finite number of majority marginal quotas
4 Fair quota in the Lower House of the Czech Parliament
The Lower House of the parliament has 200 seats. Members of the Lower House are elected in 14 electoral districts
from party lists by proportional system with 5% threshold. Seats are allocated to the political parties that obtained not
less than 5% of total valid votes roughly proportionally to fractions of obtained votes (votes for parties not achieving
the required threshold are redistributed among the successful parties roughly proportionally to the shares of obtained
votes). Five political parties qualified to the Lower House: left centre Czech Social Democratic Party (Česká strana
sociálně demokratická, ČSSD), right centre Civic Democratic Party (Občanská demokratická strana, ODS), right
TOP09 (Tradice, Odpovědnost, Prosperita – Traditions, Responsibility, Prosperity 2009), left Communist Party of
Bohemia and Moravia (Komunistická strana Čech a Moravy, KSČM) and supposedly centre (but not very clearly
located on left-right political dimension) Public Issues (Věci veřejné, VV).
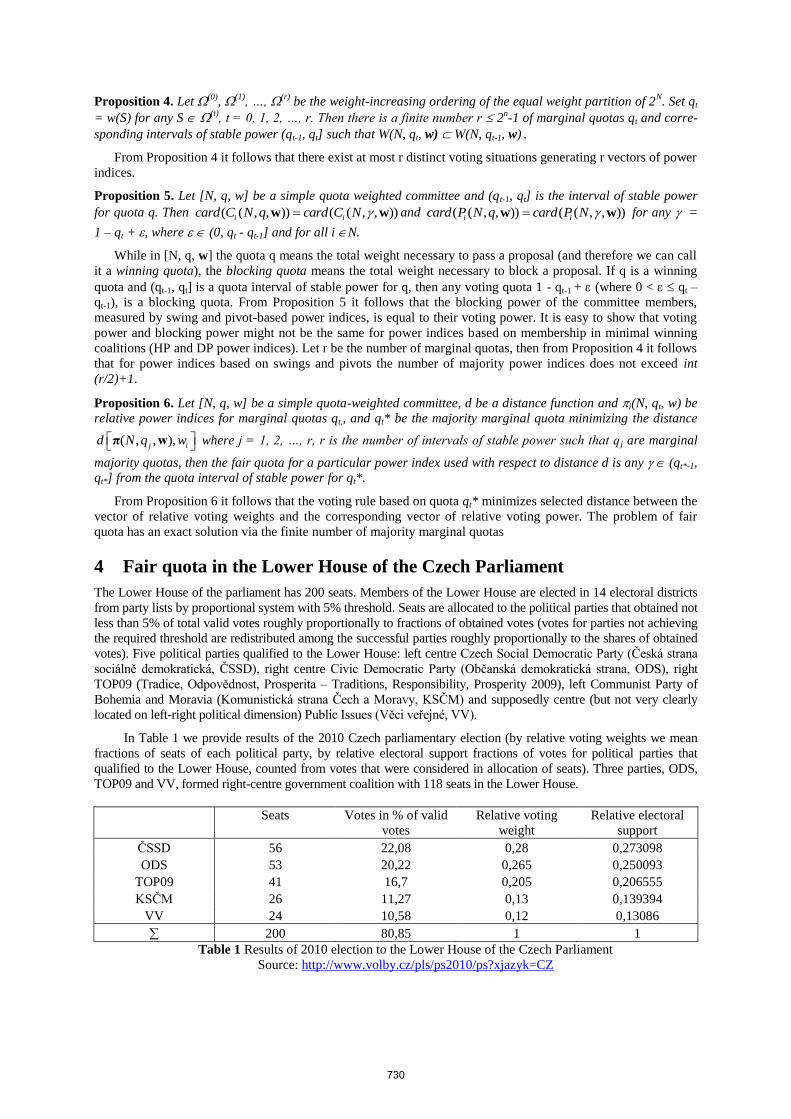
In Table 1 we provide results of the 2010 Czech parliamentary election (by relative voting weights we mean
fractions of seats of each political party, by relative electoral support fractions of votes for political parties that
qualified to the Lower House, counted from votes that were considered in allocation of seats). Three parties, ODS,
TOP09 and VV, formed right-centre government coalition with 118 seats in the Lower House.
Seats
Votes in % of valid
votes
Relative voting
weight
Relative electoral
support
ČSSD 56 22,08 0,28 0,273098
ODS 53 20,22 0,265 0,250093
TOP09 41 16,7 0,205 0,206555
KSČM 26 11,27 0,13 0,139394
VV 24 10,58 0,12 0,13086
200 80,85 1 1
Table 1 Results of 2010 election to the Lower House of the Czech Parliament
Source: http://www.volby.cz/pls/ps2010/ps?xjazyk=CZ
730

We assume that all Lower House members of the same party are voting together and all of them are participating
in each voting act. Two voting rules are used: simple majority (more than 100 votes) and qualified majority (at least
120 votes). There exist 16 possible winning coalitions for simple majority voting (12 of them are winning coalitions
for qualified majority), 16 marginal majority quotas and 16 majority quota intervals of stable power (see Table 2).
Table 2 Possible winning coalitions in the Lower House of the Czech Parliament (own calculations)
For analysis of fair voting rule we selected Shapley-Shubik power index and Euclidean distance function. In
Table 3 we provide Shapley-Shubik power indices (distribution of relative voting power) for all of marginal majority
quotas. For any quota from each of intervals of stable power is Shapley-Shubik relative power identical with relative
power in corresponding marginal majority quota. Entries in the row “distance” give Euclidean distance between
vector of relative voting weights and relative power for each quota interval of stable power.
Party
Seats
Relative
voting
weight
SS power
for
q=0.515
SS power
for q=0.53
SS power
for
q=0.545
SS power
for q=0.59
SS power
for q=0.6
SS power
for
q=0.605
SS power
for
q=0.615
SS pow-
er for
q=0.665
ČSSD 56 0,28 0,3 0,35 0,3167 0,2667 0,3167 0,3667 0,3333 0,3
ODS 53 0,265 0,3 0,2667 0,3167 0,2667 0,2333 0,2 0,25 0,3
TOP09 41 0,205 0,1333 0,1833 0,2333 0,2667 0,2333 0,2 0,1667 0,1333
KSČM 26 0,13 0,1333 0,1 0,0667 0,1 0,15 0,1167 0,1667 0,1333
VV 24 0,12 0,1333 0,1 0,0667 0,1 0,0667 0,1167 0,0833 0,1333
200 1 0,9999 1 1,0001 1,0001 1 1,0001 1 0,9999
distance 0,08339 0,08169 0,10802 0,07271 0,07996 0,01195 0,08501 0,08339
Party
Seats
Relative
voting
weight
SS power
for
q=0.675
SS power
for q=0.72
SS power
for
q=0.735
SS power
for q=0.75
SS power
for
q=0.795
SS power
for q=0.87
SS power
for q=0.88
SS pow-
er for
q=1
ČSSD 56 0,28 0,2667 0,2333 0,4333 0,3833 0,35 0,3 0,25 0,2
ODS 53 0,265 0,2667 0,2333 0,1833 0,3833 0,35 0,3 0,25 0,2
TOP09 41 0,205 0,1833 0,2333 0,1833 0,1333 0,1 0,3 0,25 0,2
KSČM 26 0,13 0,1833 0,15 0,1 0,05 0,1 0,05 0,25 0,2
VV 24 0,12 0,1 0,15 0,1 0,05 0,1 0,05 0 0,2
200 1 1 0,9999 0,9999 0,9999 1 1 1 1
distance 0,06238 0,07271 0,17874 0,20275 0,15637 0,14816 0,17875 0,14816
Table 3 Shapley-Shubik power of political parties for majority marginal quotas (own calculations)
Parties of possible winning coalitions
Absolute
marginal
majority
quota
Relative
marginal
majority
quota
Intervals of sta-
ble power
ODS+KSČM+VV 103 0.515 (0.485, 0.515]
CSSD+KSČM+VV 106 0.53 (0.515, 0.53]
ČSSD+ODS 109 0.545 (0.53, 0.545]
ODS+TOP09+VV 118 0.59 (0.545, 0.59]
ODS+TOP09+KSČM 120 0.6 (0.59, 0.6]
ČSSD+TOP09+VV 121 0.605 (0.6, 0.605]
ČSSD+TOP09+KSČM 123 0.615 (0.605, 0.615]
ČSSD+ODS+VV 133 0.665 (0.615, 0.665]
ČSSD+ODS+KSCM 135 0.675 (0.665, 0.675]
ODS+TOP09+KSČM+VV 144 0.72 (0.675, 0.72]
ČSSD+TOP09+KSČM+VV 147 0.735 (0.72, 0.735]
ČSSD+ODS+TOP09 150 0.75 (0.735, 0.75]
ČSSD+ODS+KSČM+VV 159 0.795 (0.75, 0.795]
CSSD+ODS+TOP09+VV 174 0.87 (0.795, 0.87]
ČSSD+ODS+TOP09+KSČM 176 0.88 (0.87, 0.88]
ČSSD+ODS+TOP09+KSČM+VV 200 1 (0.88, 1]
731

The fair relative majority quota in our case is q = 0.675 (with respect to Euclidean distance between relative
voting weights and relative voting power 0.06238), or any quota from interval of stable power (0.665, 0.675]. It
means that minimal number of votes to approve a proposal is 135 (in contrast to 101 votes required by simple
majority and 120 votes required by qualified majority). Voting rule defined by this quota minimizes Euclidean
distance between relative voting weights and relative voting power (measured by Shapley-Shubik power index) and
approximately equalizes the voting power (influence) of the members of the Lower House independently on their
political affiliation.
The measure of fairness follows the same logic as measures of deviation from proportionality used in politi-
cal science, evaluating the difference between results of an election and the composition of an elected body - e.g.
Gallagher [3] based on the Euclidean distance, or Loosemore-Hanby [4] based on the absolute values distance.
Using in our particular case the absolute values distance we shall get the same fair quota.
Acknowledgements
This research was supported by the Grant Agency of the Czech Republic, project No. 402/09/1066 “Political econ-
omy of voting behavior, rational voters’ theory and models of strategic voting”. The author is grateful to an anony-
mous referee for helpful comments and suggestions on an earlier draft of the paper.
References
[1] Banzhaf, J.F.: Weighted Voting Doesn't Work: A Mathematical Analysis, Rutgers Law Review, 19 (1965),
317-343.
[2] Felsenthal, D. S., and M. Machover : The Measurement of Voting Power, Theory and Practice, Edward
Elgar, Cheltenham, 1998.
[3] Gallagher, M.: Proportionality, Disproportionality and Electoral Systems, Electoral Studies, 10 (1991), 33-
51.
[4] Loosemore, J., and V.J.Hanby: The Theoretical Limits of Maximum Distortion: Some Analytical Expressions
for Electoral Systems, British Journal of Political Science, 1 (1971), 467-477.
[5] Nurmi, H.: The Problem of the Right Distribution of Voting Power. In: Power, Voting and Voting Power
(Holler M.J., ed.), Physica Verlag, Würzburg, Wien, 1982, 203-212.
[6] Nurmi, H.: On Power Indices and Minimal Winning Coalitions, Control and Cybernetics, 26, (1977), 609-611.
[7] Owen, G.: Multilinear Extensions of Games. Management Science, 18 (1972), 64-79.
[8] Penrose, L.S.: The Elementary Statistics of Majority Voting. Journal of the Royal Statistical Society, 109
(1946), 53-57.
[9] Shapley, L.S., and M. Shubik: A Method for Evaluation the Distribution of Power in a Committee System.
American Political Science Review, 48 (1954), 787-792.
[10] Słomczyński, W., and K. Życzkowski: From a Toy Model to Double Square Root System. Homo Oeco-
nomicus, 24 (2007), 381-400.
[11] Słomczyński, W., and K. Życzkowski: Penrose Voting System and Optimal Quota. Acta Physica Polonica
B37 (2006), 3133-3143.
[12] Turnovec F.: Fair Voting Rules in Committees, Strict Proportional Power and Optimal Quota. Homo Oeco-
nomicus, 27 (2011), to appear.
[13] Turnovec, F.: Power, Power Indices and Intuition. Control and Cybernetics, 26 (1997), 613-615
732