Embed Size (px)
Citation preview
Math Pathways and Pitfalls 1
3/12/09
Running head: THE IMPACT OF MATH PATHWAYS AND PITFALLS
The Impact of Math Pathways and Pitfalls on Students’ Mathematics Achievement
Deborah A. Curtis San Francisco State University
Joan I. Heller
Heller Research Associates
Carne Clarke WestEd
Sophia Rabe-Hesketh
University of California, Berkeley
Alma Ramirez WestEd
Paper presented at the Annual Meeting of the American Educational Research Association, San Diego, CA, April 2009.
Heller, J. I., Curtis, D. A., Rabe-Hesketh, S., & Verboncoeur, C. J. (2007). The effects of “Math Pathwaysand Pitfalls” on students' mathematics achievement: National Science Foundation final report (ED498258). Retrieved July 6, 2009, from Education Resources Information Center (ERIC) database: http://www.eric.ed.gov/ERICWebPortal/contentdelivery/servlet/ERICServlet?accno=ED498258
Math Pathways and Pitfalls 2
3/12/09
Abstract
This study assessed the impact of Mathematics Pathways and Pitfalls (MPP) on students’
mathematics learning. The main research questions were: (a) What is the impact of MPP on
students’ knowledge of the mathematics topics addressed, compared to students using the regular
math curriculum? and (b) How equitable is the impact of MPP on students’ mathematics
knowledge across levels of English language proficiency? A cluster-randomized experimental
design was implemented in five school districts. Second, fourth, and sixth-grade teachers were
randomly assigned to either an experimental or control group. The experimental teachers were
taught how to implement MPP and then substituted MPP for part of their regular mathematics
curriculum during the academic year. Ninety-nine teachers and 1,971 students participated.
Multilevel statistical models were used to analyze the mathematics achievement data. Student
performance in MPP classes was higher than in non-MPP classes for all three grades. The effect
size statistics (ES) for second and fourth grade were .43 and .66, respectively. For sixth grade,
MPP had a greater effect for ELL students (ES = .74) than non-ELL students (ES = .28).
Math Pathways and Pitfalls 3
3/12/09
The Effects of Math Pathways and Pitfalls on Students’ Mathematics Achievement
This study was designed to evaluate how the Mathematics Pathways and Pitfalls (MPP)
lessons impact the mathematics that students learn, and the equity of learning across groups of
students at different levels of English language proficiency. The MPP instructional materials
take the unique approach of not only fostering correct ways to represent and reason about
mathematical concepts, but also explicitly calling students' attention to common pitfalls and
misconceptions. MPP also provides lesson-specific assistance in both the student materials and
the teacher's guides for learning how to use mathematical vocabulary and symbols, present
complete and coherent explanations orally and in writing, and participate in mathematical
discourse. Students learn to present, expand, justify, and prove or disprove mathematical ideas in
paired, small-group, and whole-class settings. An important goal of the lessons is to help
students become careful critics of their own thinking and take a proactive stance toward their
own learning.
Background and Review of the Literature
An Overview of Math Pathways and Pitfalls
Math Pathways and Pitfalls (MPP) for K–7 students was developed and field-tested with
grants from the National Science Foundation (ESI 9911374) and the Stuart Foundation. The
program has broad appeal, especially in the existing climate of accountability, since it addresses
some of the toughest math concepts and associated learning pitfalls culled from the research
literature and from national and international assessments. The mathematical topics for grades
K–3 focus on developing whole number concepts and operations, whereas the topics in grades 4–
7 focus on developing rational number concepts. These MPP materials are designed to be
Math Pathways and Pitfalls 4
3/12/09
supplementary and to address the need for improving instruction, regardless of the core
instructional materials being used.
MPP consists of video and print materials which include: (a) eight units, one each for
grades K–7, in English and Spanish, each with 10 to 12 core lessons and follow-up mini lessons
for students; (b) teaching guides for each lesson as well as each mini lesson; (c) four videos—
two professional development videos for teachers and two for students—that model how to
present and discuss mathematical ideas); and (d) MPP achievement tests for each grade to assess
math learning.
Each MPP lesson uses a consistent, easy-to-follow format and includes sections that
(a) introduce key words and symbols; (b) promote discussion about two excerpts of student
dialogue: one that contains a correct example of student thinking and another that contains a
pitfall in thinking; (c) provide teacher-guided and individual practice; and (d) reinforce each
concept through follow-up mini lessons, one requiring responses to multiple-choice questions
and the other eliciting written explanations of a mathematical idea.
Theoretical Framework for the Math Pathways and Pitfalls Materials
A review of the research literature identified fundamental representations and approaches
to developing mathematical concepts, as well as common misconceptions and conceptual
“snags”, which we call “pitfalls”. Specifically, the primary-grade lessons on number and
operation concepts draw primarily on that of Carpenter and Moser (1983), Fuson (1992), Griffin
(1998), and Sowder (1992). The lessons in the upper elementary grades draw on the rational
number research of Behr, Lesh, Post, and Silver (1983), Carraher (1996), Moss and Case (1999),
Parker and Leinhardt (1995), and Wearne and Hiebert (1989).
Math Pathways and Pitfalls 5
3/12/09
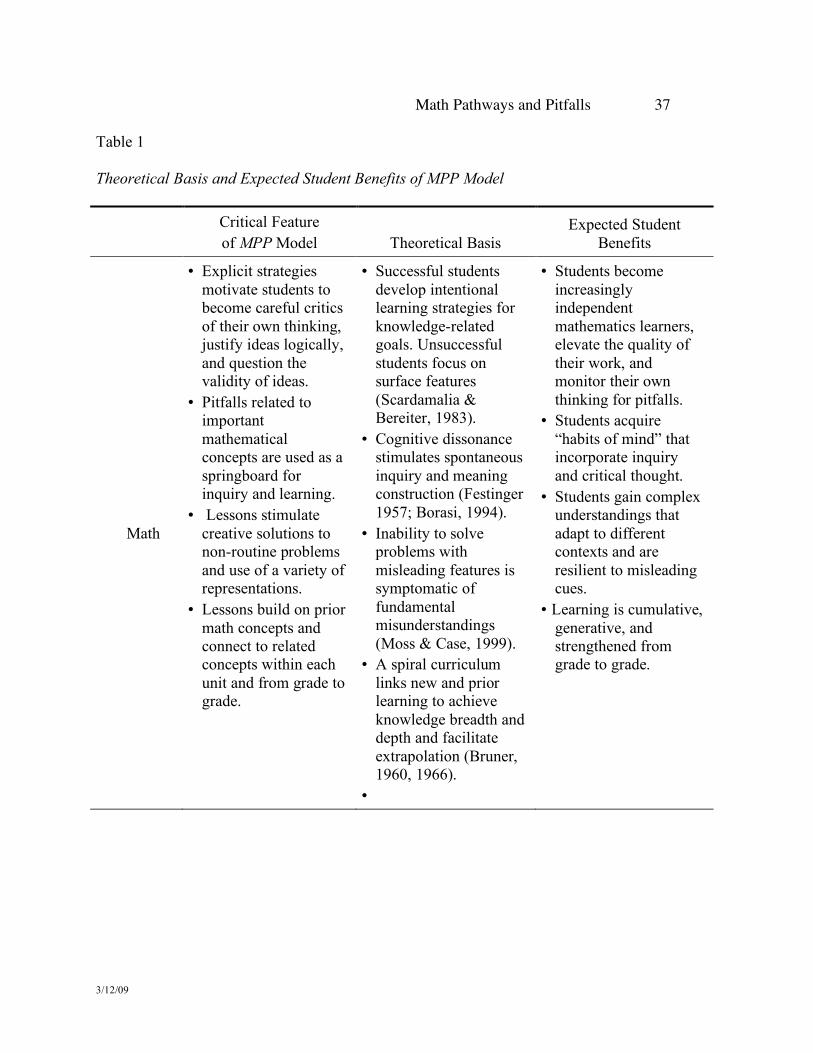
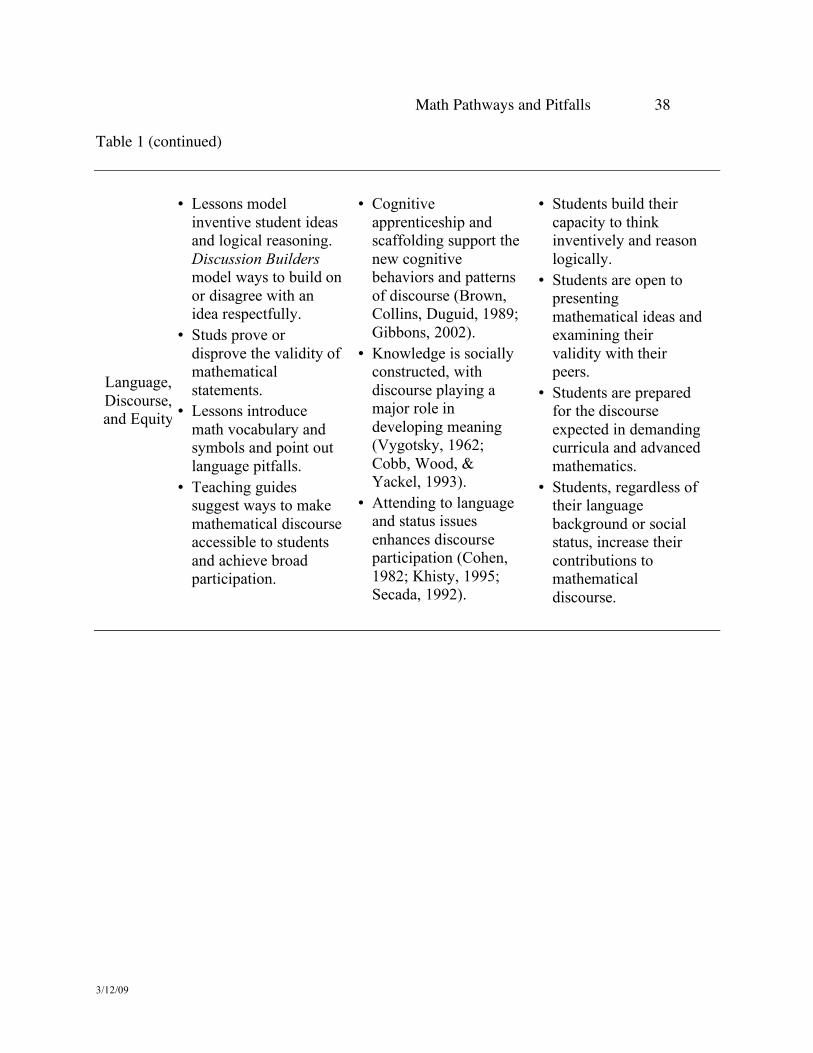
The framework in Table 1 describes the theoretical foundation underlying the
development of MPP. The columns identify the critical features of the materials, the theory
underlying the feature, and the expected student benefits. In the left-hand margin are the key
foci—mathematics, and academic language, discourse, and equity—that drove the development
of the materials.
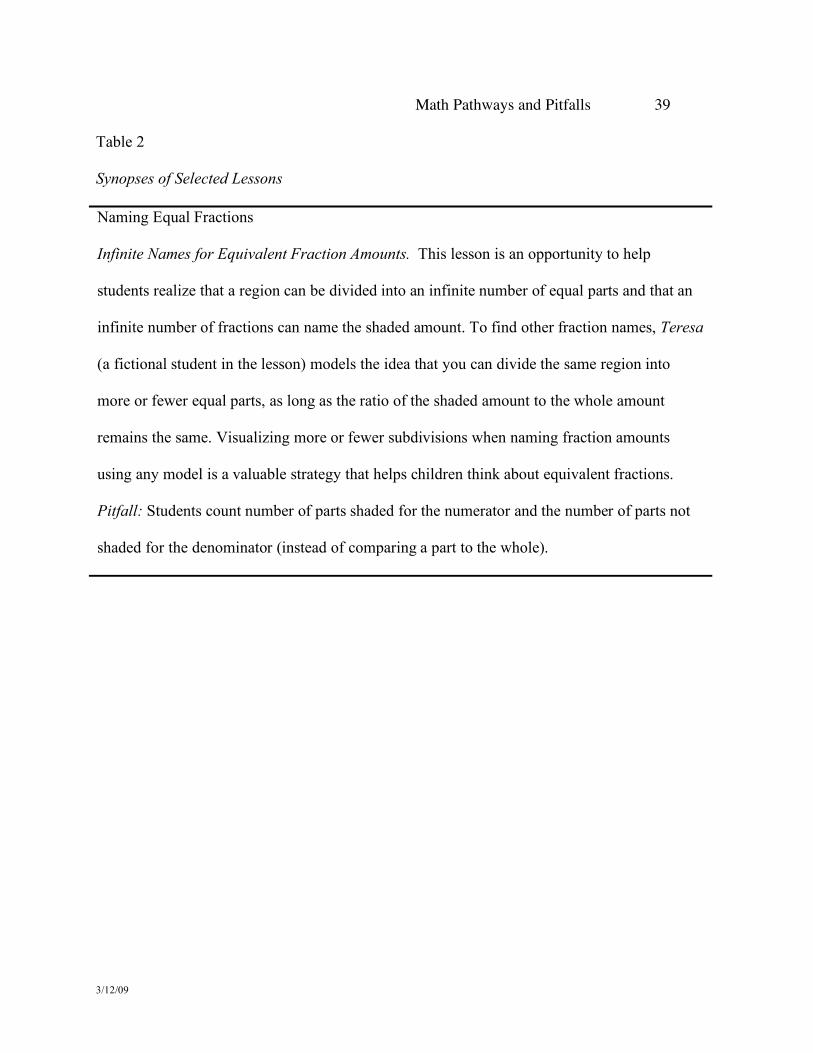
Table 2 provides a synopsis of selected lessons to give examples of the mathematical
concepts and pitfalls targeted by MPP.
Review of the Research on Academic Language, Discourse, and Equity
Language is central to all learning since it plays an important role in the way concepts are
formed, held in memory, and used in reasoning (Pimm, 1987; Vygotsky, 1978). Yet there is
considerable evidence that most mathematical instruction in the United States is characterized by
little verbalization. For example, the TIMSS Video Study (Stigler, Gonzales, Kawanaka, Knoll,
& Serrano, 1999) revealed that in the United States, 78% of the mathematical concepts in lessons
were simply stated by the teacher rather than developed through explanations or discussion of
examples. In a study of bilingual classrooms, Khisty (1992) documented that when teachers
introduce mathematics concepts they often teach by giving a few typical examples with little or
no discussion of the mathematical ideas behind the examples. The few verbal explanations that
are provided are often ambiguous, incorrect, or inappropriate. Teachers often use vocabulary or
symbols assuming that they are meaningful to students, even when words or symbols have
multiple mathematical meanings or have very different meanings from common speech. This
language-impoverished approach to the instruction of mathematical concepts is not working well
for most students, but the negative impact is particularly acute for non-native English-speaking
Math Pathways and Pitfalls 6
3/12/09
students who need to learn to navigate the specialized language of mathematics and do so in their
second language.
Given the prevailing mode of recitation-style instruction, it is not surprising that
conceptual understanding in mathematics, regardless of students' language background, is much
weaker than procedural fluency (National Research Council, 2001). Even on relatively
straightforward mathematics problems, students' understanding easily caves into pitfalls. For
example, on the National Assessment for Educational Progress (NAEP) only 35% of the U.S. 13-
year-olds chose the correct response when asked for a number between .03 and .04. Similarly,
only about 25% of the U.S. sixth graders correctly responded 60% when asked to complete the
number sentence: .6 = ____%. The most likely incorrect response for this problem is 6%, which
is a prevalent pitfall identified in research (Moss & Case, 1999; Parker & Leinhardt, 1995). The
research literature and national and international assessments provide many similar examples,
especially in the realm of rational numbers (Behr, Lesh, Post, and Silver, 1983; Carraher, 1996;
Moss & Case, 1999; Parker & Leinhardt, 1995; Wearne & Hiebert, 1989). What is disconcerting
is that students don't just make a mistake; their lack of conceptual understanding prohibits them
from realizing that their incorrect responses do not make sense, even when it is pointed out. This
feeble conceptual base leaves students unprepared to tackle higher mathematics.
The research literature in language acquisition and ELL instruction points to specific
ways to tailor instruction so that understanding of content in English is enhanced. These
strategies include (a) providing explicit discussion and preview of vocabulary and lesson
structure, (b) building on students’ previous knowledge, (c) using discourse markers (i.e., "next,”
"after"), (d) using visual aids, and (e) helping students develop the ability to regulate their own
Math Pathways and Pitfalls 7
3/12/09
thinking. (Chamot & O’Malley, 1994; Echevarria, 1998; Echevarria & Graves, 1998; Gersten,
1996; Short & Echevarria, 1999; Wong-Fillmore, 1982). Typical mathematics instruction does
not effectively utilize these practices, or if it does, the ideas are often misapplied. When teachers
try to lower the linguistic complexity of a task, they often also lower the cognitive demand of the
instruction. This results in watered-down mathematics instruction, which can only widen the
already large achievement gap. This is just one example of how academic language, discourse,
and equity are interrelated.
Academic language has been defined in the literature in terms of vocabulary, syntax,
discourse, and language functions as they cut across different contexts of use (Butler & Bailey,
2002; Chamot & O'Malley, 1994; Cummins, 1980; Solomon & Rhodes, 1995). Discourse plays a
central role in developing academic language and in promoting equitable learning. For example,
Khisty (1995), in a study of mathematical language and discourse notes how a simple concept
such as talk can either empower students or disenfranchise students. She finds that active
dialogue plays an important role in giving students access to higher cognitive levels of
mathematics, and can increase equity in mathematics learning. Other researchers note that
student-to-student interaction is most effective when students actively provide explanations to
each other (Webb, 1985, 1989); and when they communicate about, in, and with mathematics
(Brenner, 1998). Teacher-to-student interaction is most effective, both for academic language
development and concept development in a content area, when teachers communicate with
students slightly above their level of competence and mediate interaction so that students have
opportunities to produce extended stretches of academic discourse (Gibbons, 2002).
Math Pathways and Pitfalls 8
3/12/09
English language learners (ELLs) in some schools receive instruction from teachers
trained in Specially Designed Academic Instruction in English (SDAIE or sheltered instruction)
or in bilingual strategies. However, many of these students spend their time in mainstream
classes not designed to meet their needs (McKeon, 1994). Their teachers have good intentions,
but little training in adapting their instruction so that the mathematics content remains rigorous
while academic language is incrementally developed. The Math Pathways and Pitfalls materials
offer support to overburdened teachers by embedding the discourse and language acquisition
strategies identified from the research literature cited above directly into the lessons. The
intended goal is for these strategies to become part of regular classroom instruction through
practice with MPP. In addition, the teaching guides provide mathematically robust examples,
and explicit discussion probes, so that teachers can guide students towards increasingly
sophisticated levels of mathematics understanding and discipline-specific use of academic
language. Sentence stems written on posters model appropriate language for students to use as
they learn to participate in mathematical discourse.
Pilot Study of the MPP Instructional Materials
MPP prototype materials were initially pilot-tested with a diverse group of 233 students
whose teachers replaced 11 hours of related instruction with project lessons. Utilizing a quasi-
experimental design with statistical controls, results indicated that students exposed to MPP
materials exhibited greater gains in rational number knowledge than a similar group of students
exposed to regular standards-based instructional materials during the same time period (Heller,
Gordon, Paulukonis, & Kaskowitz, 2000). Effect size statistics (ES) were moderate to strong,
with an overall ES of 0.59 standard deviations.
Math Pathways and Pitfalls 9
3/12/09
Research Questions
This study addressed two major research questions:
1. What is the impact of MPP on students’ knowledge of the mathematics topics addressed,
compared to that of students using the regular math curriculum?
2. How equitable is the impact of MPP on students’ mathematics knowledge across levels of
English language proficiency and entering mathematics ability?
To aid in the interpretation of the experimental findings, a fidelity of implementation
study was also conducted. Specifically, we examined the fidelity of lesson implementation as
enacted within MPP classrooms, compared to the structure and processes that were intended by
the curriculum designers. The fidelity study addressed the following two questions: (a) How
closely does MPP as enacted follow the structure, content, and discourse processes that were
intended by the curriculum designers, and (b) How does MPP as enacted in those classrooms that
had greater student math score gains compare with MPP in classrooms with lower student gains?
Method
Participating Schools and Districts
This study was conducted over a two-year period in second-, fourth-, and sixth-grade
classrooms in five school districts. School districts in California, Missouri, and Arizona served
as research sites. Three of the school districts were in urban or urban-fringe communities, one
was in a suburban community, and one site served several small rural schools spread over a large
geographic area. These sites were selected to provide a balance of urban, rural, and suburban
populations, as well as diversity in the economic, ethnic, and language backgrounds of students.
Altogether, teachers from 40 schools participated. The number of teachers per school
Math Pathways and Pitfalls 10
3/12/09
participating in this study ranged from 1 to 3. On average, there were 1.5, 1.7, and 1.4 teachers
per school in second, fourth, and sixth grades, respectively.
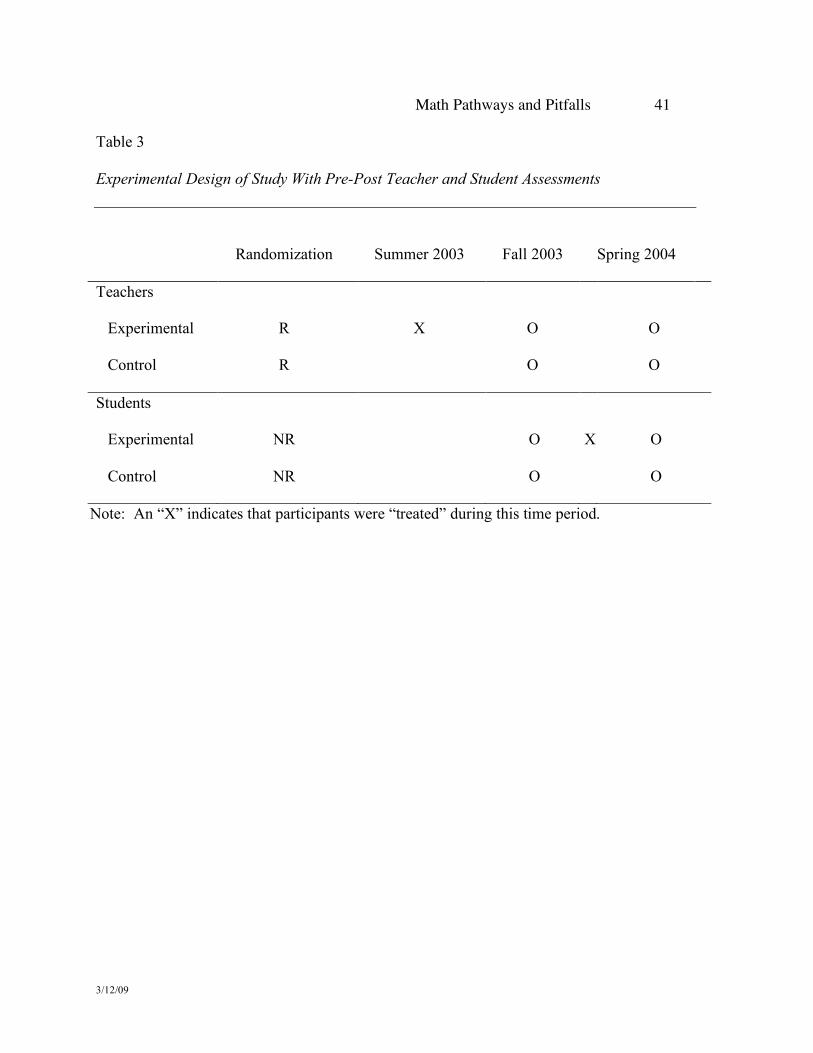
The Experimental Design
In the first year of the study, a cluster randomized experimental design was implemented
to assess the impact of the MPP materials on student learning. A summary of the first year of
this experimental design is presented in Table 3.
In terms of the randomization process, in the spring of 2003, teachers were randomly
assigned within their school district to either an experimental or control group. (Random
assignment was done after receiving informed consent from the teachers). Randomization was
stratified by grade level within each school district. If there was more than one teacher from the
same school and grade level, these teachers were randomly assigned to either the experimental or
control group.
In the summer of 2003, the experimental group teachers were taught how to implement
MPP during one day of professional development (PD). These experimental group teachers then
substituted seven MPP lessons for a portion of their regular mathematics curriculum during the
2003-2004 academic year. During this same time period, the control group teachers used their
regular mathematics curriculum, and received whatever professional development they normally
were provided during that year. These control group teachers were “waitlisted” to receive PD
during the summer of 2004 and to use the MPP materials in the second year of the study.
In the second year of the study, those teachers who had been in the experimental group in
the first year continued using the MPP materials, and those teachers who had been in the control
group then used the MPP materials in their classrooms for the first time in the second year of the
Math Pathways and Pitfalls 11
3/12/09
study. However, only 41 of the 99 teachers continued in the second year of the study. This
teacher attrition rate had several causes. Most notably, continuing in the second year of the study
was considered optional for teachers in the experimental group, and therefore, a number of these
teachers opted to discontinue for personal reasons. In addition, a number of the original 99
teachers from both the experimental and control groups did not participate in the second year for
organizational reasons. For example, one of the study coordinators left the district prior to the
second year of the study. As a result, communication with the teachers in that district was
difficult and several teachers did not continue with the project during Year 2.
Because only 41 teachers remained for the second year of the study, we were concerned
about whether the internal validity of the design that was achieved through the random
assignment of teachers to conditions in the first year of the experimental design would hold in
the second year. Thus, even though student mathematics achievement was assessed in the second
year of the study, the analysis of the second year of data will not presented here.
The Fidelity of Implementation Study
The fidelity of implementation study was conducted in the second year of this research
project, and the fidelity study results will be briefly considered in this paper.
Participating Teachers
The teacher recruitment process. The goal for the number of elementary classrooms in
the study was 100, with about equal numbers of teachers in grades 2, 4, and 6. Depending on the
size of the district, coordinators at each site were charged with recruiting between 15 and 40
teachers. Each site coordinator recruited teachers from his or her district to request voluntary
participation in the study. (In terms of the sixth grade teachers, in some districts, the sixth grade
Math Pathways and Pitfalls 12
3/12/09
was part of an elementary school, whereas in other districts, the sixth-grade was part of a middle
school. If a sixth grade teacher was in middle school, only the data for the first class period in his
or her weekly schedule was included).
Site coordinators in each district first met with school administrators to get their
commitment, then met with teachers to solicit volunteers. The project staff asked the site
coordinators to make every effort to recruit a diverse group of teachers in terms of their
background, experience, and teaching philosophy. The project staff provided site coordinators
with a set of presentation slides and handouts for the recruitment meetings. The purpose of these
teacher recruitment meetings was to provide information about the goals and activities of the
MPP program and the research study. Teachers who volunteered signed consent forms, which
informed them of their rights and responsibilities as research participants.
At the recruitment meeting, teachers were informed that they would receive a stipend to
participate based on the number of hours of project activities they completed and the district
hourly rate. In Year 1, teachers in the experimental group received a stipend of $350, and
teachers in the control group received a stipend of $200. Teachers who participated in a separate
fidelity of implementation study in the second year received an additional $500 stipend.
In the spring of 2005, participants were recruited to participate in the fidelity of
implementation study, a descriptive study of MPP lesson enactment in the classroom. Program
staff invited 17 teachers to take part in the study, all of whom were experimental group teachers
in the first year of the study and who also volunteered to teach MPP in second year of the
project. Of those invited, 11 teachers agreed to participate.
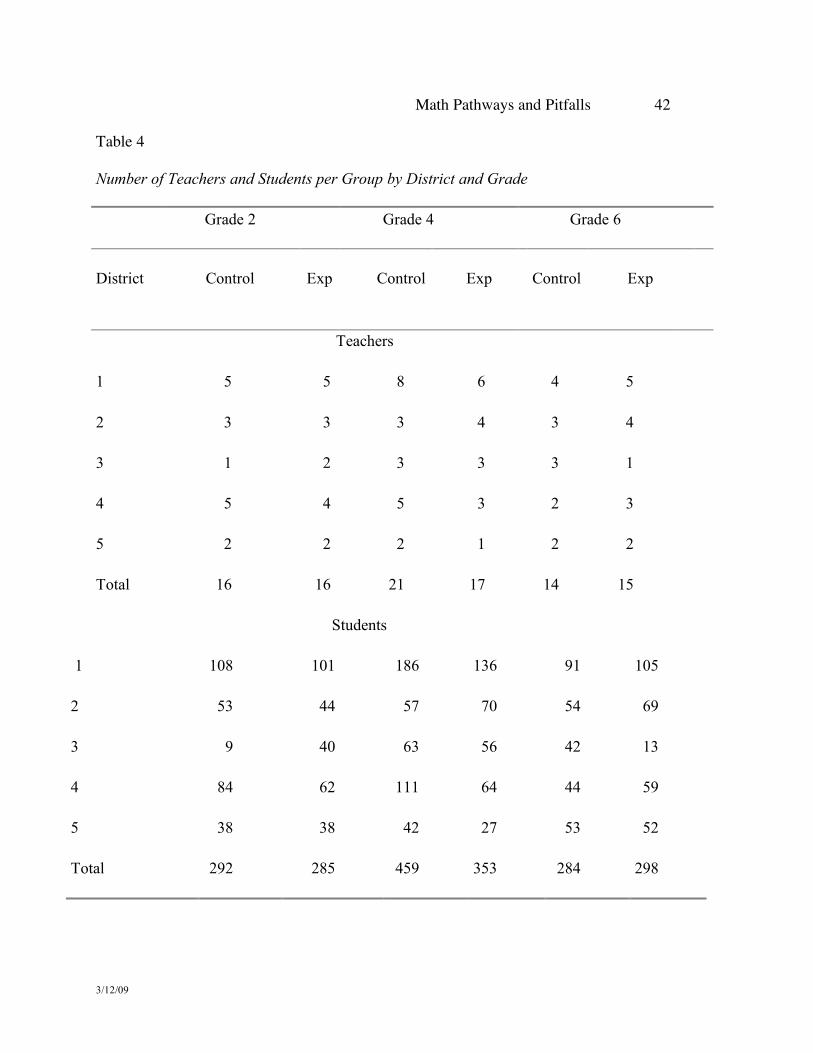
The number of participating teachers and students in the first year of the study is presented
Math Pathways and Pitfalls 13
3/12/09
in Table 4.
The MPP PD Training
Because the study was conducted in three grade levels, separate summer PD trainings
were conducted for each of these grades. Thus during the summer of 2003, three PD trainings
were held at each of three sites, each within driving distance of the teachers’ school districts.
During the summer of 2003, the experimental group teachers attended a one-day, six-
hour introduction to MPP that was conducted by project consultants, trained by project staff.
Most of the PD consultants had used MPP in their classrooms as teachers. During this PD
training, teachers (a) received an introduction to the goals and purpose of MPP, (b) observed a
video of a class participating in an MPP lesson, and (c) participated in a short practicum of how
to teach an MPP lesson. Project staff carefully designed the agenda and activities for this
meeting.
During the school year of 2003-04, the experimental group teachers attended two, two-
hour meetings after school. One was held during the month of either December or January, and
the other held in May. The purpose of the first meeting was primarily to check in informally with
teachers about the lessons they had taught so far and have them look through and discuss the
next set of lessons they would be teaching. The site coordinator conducted these first meetings.
The second meeting was a wrap-up.
Teachers in the control group only participated in data collection activities in the first
year of the study. They did not participate in any MPP PD in the first year. Several steps were
taken to ensure that the control group teachers were not “contaminated” by being exposed to the
experimental group teachers’ MPP materials. First, face-to-face meetings were held with both
Math Pathways and Pitfalls 14
3/12/09
the control group teachers and the teachers using project materials. In these meetings, a project
representative discussed how participation in this project came with a professional obligation to
assist the project in giving the materials a fair test. Project consultants who led the professional
development explained why this is important and gave explicit instructions for not sharing any of
the materials with anyone else and for not looking at the pretests or posttests prior to or
following the assessment. To emphasize the importance of this request, both teachers using the
project materials and the control group teachers were asked to sign an affidavit.
Teacher Implementation of MPP in the Classrooms
In the summer of 2003, experimental group teachers received a binder with three MPP
lessons as part of their summer professional development training. At an after-school meeting
held in December 2003 or January 2004, these teachers received a second binder with four
additional MPP lessons. In the front of each of these two binders was a suggested schedule for
teaching the lessons. Teachers recorded in their binders the dates they actually did the lessons.
Each MPP lesson consisted of a two-period core lesson and two follow-up mini lessons. The
entire lesson took approximately two hours of instructional time and was taught once per month.
Seven lessons were taught over the course of the school year for a total of approximately 15
hours of instructional time.
Instrumentation and Data Collection
Teacher-level data. All teachers were asked to complete a background questionnaire at
the beginning of the academic year, providing information about their education, teaching
experience, and current teaching context as well as teacher and student demographics. An end-
of-year questionnaire was also given to the experimental group teachers. This questionnaire was
Math Pathways and Pitfalls 15
3/12/09
designed to obtain teachers’ ratings of agreement with statements regarding their use of each
component of the MPP materials, their own and their students’ responses to the lessons, and their
overall evaluation of the curriculum.
Student-level data. Students in both the experimental and control group teachers’
classrooms took project-developed mathematics pretests and posttests. These project-developed
tests were called “MPP tests”. All children in the study received an MPP test as a pretest in
September or October of 2003, and the same MPP test as a posttest in May of 2004.
Items on the MPP tests were designed to assess mathematics concepts that are known to
cause difficulty for students as identified from the research literature and prominent assessments
such as the NAEP and TIMMS. For each grade level, a separate MPP test was developed. Each
MPP test was developed to match the MPP lessons for that grade. More specifically, the MPP
tests contained one or more items that relate directly to the content of each lesson and a few
additional transfer items that were indirectly related to the lesson content.
On the second-, fourth-, and sixth-grade MPP tests, there were 18, 17, and 20 items,
respectively. Most items on these MPP tests were multiple-choice format, with one correct
answer. At least one of the choices for items in the multiple-choice format contained a common
misconception that students have with regard to the concept being assessed. A few open-ended
items were included on the tests, and student responses to these open-ended items were scored as
either correct or incorrect. For each MPP test, we calculated the number of items answered
correctly for each student, and then converted this raw score to a percent correct score. Thus, a
student’s score could range from 0 (0% of items answered correctly) to 100 (100% of items
answered correctly).
Math Pathways and Pitfalls 16
3/12/09
Cronbach’s alpha—a measure of internal consistency—was computed for each grade
level for the MPP test posttest data. (Posttest data for two years of the study were combined for
these computations). Cronbach’s alpha for the three grade levels ranged from .80 to .85.
Standardized achievement test data. For each student in the study, district officials were
asked to provide end-of-year standardized mathematics test score information a for the student’s
previous grade level as well as the end-of-year standardized mathematics test score information
for the student’s current grade. (For second grade students, standardized test data were only
obtained for the end of the second grade because first-grade students are not typically given
standardized tests).
Statistical Analysis
For the analysis of the student-level mathematics achievement data, it is not appropriate
to use ordinary linear regression because students within the same classroom cannot be assumed
to be independent of one another. This is because there are likely to be many classroom effects
and characteristics that the students share in common, such as the teacher. The data are
hierarchical, or nested, in that students exist within classrooms. We have data on both these
levels—on student-level (e.g., pretest and posttest MPP test scores, and whether or not the
student is an English language learner), and on the classroom-level (e.g., whether the classroom
is experimental or control group classroom). Because there were so few teachers per school, with
many schools only having one teacher participating, we did not include the students’ school as a
level in these analyses. Using ordinary regression would yield incorrect standard errors. In
particular, since treatment varies between classrooms, the standard error of the treatment effect
estimate and the associated p-values would be too low (e.g., Snijders & Bosker, 1993).
Math Pathways and Pitfalls 17
3/12/09
Multilevel models, also known as hierarchical linear models (HLM) are designed to analyze
relationships precisely for these kinds of nested data (Raudenbush & Bryk, 2002).
The multilevel statistical analyses were performed for each grade level separately. For
each grade level, the MPP test data were analyzed separately from the standardized mathematics
achievement test data. Thus, for each grade level, two sets of analyses were performed: one using
the MPP posttest scores as the outcome variable, and one using the standardized mathematics
achievement scores obtained at the end of the student’s current grade level as the outcome
variable. A 5% level of significance was used for all analyses.
Multilevel statistical analyses of the MPP test data. In terms of the analysis of the MPP
tests, for each grade level, the full multilevel model consisted of four main predictor variables:
the MPP pretest scores (X1), plus seven dummy-variable predictors, as follows:
1. X2. Treatment group dummy variable. The treatment group variable was coded as ‘0’ if the
student was in the control group, and ‘1’ if the student was in the experimental group.
2. X3. English language learner (ELL) dummy variable. The ELL dummy variable was coded as
‘0’ if the student was not an English language learner, and ‘1’ if the student was an English
language learner.
3. X4. ELL-by-treatment group interaction. In order to find out if the MPP curriculum affected
ELL and non-ELL students differently, an interaction term was included in the model. This
interaction term was constructed by multiplying the treatment group dummy variable (X2) by
the ELL dummy variable (X3).
Math Pathways and Pitfalls 18
3/12/09
4. X5 to X8. School district dummy variables. There were five school districts in this study. In
order to evaluate possible differences between school districts, four school district dummy
variables were included in the model.
Lastly, in order to find out if students’ initial performance level (as measured by the MPP
test pretest) had a differential effect on how they performed in the two experimental conditions, a
pretest by treatment group interaction term was also evaluated. (These interactions are
sometimes referred to as “aptitude-by-treatment” interactions). This pretest by treatment
interaction term, labeled X9, was constructed by multiplying the pretest score variable (X1) by
the treatment group dummy variable (X2). If this pretest by treatment group interaction is
statistically significant for a given grade level, then we have evidence that the MPP lessons are
affecting students differently depending on their initial level of performance.
All models included a random intercept for classroom.
Math Pathways and Pitfalls 19
3/12/09
For each grade level, a “primary” and “secondary” multilevel analysis of the MPP test
data were performed. For all the analyses, MPP test posttest scores were used as the outcome
variable.
For the primary analysis, eight predictor variables were included in the model:
1. X1. MPP pretest scores (centered),
2. X2. the treatment group dummy-variable,
3. X3. the ELL-status dummy-variable, and
4. X4. the ELL-by-treatment group interaction term.
5. X5 to X8. the school district dummy-variables.
If the ELL-by-treatment interaction term (X4) was statistically significant for a given
grade level, then two simple-effect comparisons were made. First, a comparison was made
between ELL students in the control group and ELL students in the experimental group,
controlling for all other variables in the model. Second, a comparison was made between non-
ELL students in the control group and non-ELL students in the experimental group, controlling
for all other variables in the model.
If the ELL-by-treatment interaction term (X4) was not statistically significant for a given
grade level, then the multilevel model was simplified by dropping this interaction term, and re-
analyzing the data using a model with the remaining predictor variables from the above list.
As a secondary analysis, we were interested in evaluating the pretest-by-treatment group
membership interaction term (X9). If the ELL-by-treatment group interaction term (X4) was
statistically significant in the previous analysis, then a multilevel analysis was performed by
adding the pretest-by-treatment group interaction (X9) to the full-model, as follows:
Math Pathways and Pitfalls 20
3/12/09
1. X1. MPP test pretest scores (centered),
2. X2. the treatment group dummy variable,
3. X3. the ELL-status dummy variable,
4. X4. the ELL-by-treatment group interaction term,
5. X5 to X8. the school district dummy variables,
6. X9. the pretest-by-treatment group interaction term.
If the ELL-by-treatment group interaction term (X4) was not significant for a given grade
level, then this term was dropped from the model, and the pretest-by-treatment group interaction
term (X9) was evaluated in this simplified model.
Centering the pretest scores. To aid in interpreting the multilevel model results, the MPP
pretest scores were centered to have a mean of zero. For each grade level, pretest scores were
centered by subtracting the pretest grand mean from each student’s pretest score. By centering
the pretest data, we were able to obtain adjusted posttest means, which are the estimated posttest
means for students with mean pretest scores
Multilevel software. The statistical package Stata, published by StataCorp (2005), was used
for the multilevel analyses (Rabe-Hesketh & Skrondal, 2008). For these analyses, parameters
were estimated by maximum likelihood estimation using the “xtmixed” command. To obtain
adjusted means and standard errors, the Stata command “adjust” was used. To obtain the simple
effect comparisons, the Stata command “lincom” was used.
Math Pathways and Pitfalls 21
3/12/09
Calculating effect size statistics. If a dummy-variable predictor was statistically
significant, then an effect size statistic (ES) was calculated. For each grade level, this ES was
calculated by dividing the estimated regression coefficient obtained in the multilevel analysis by
the total residual standard deviation of the posttest scores for all subjects in that grade level.
Results
School, Teacher, and Student Sample Sizes
There were 40 schools that participated in the study. A summary of the number of
teachers and students in the study is presented in Table 4. There were 32, 38, and 29 teachers
altogether in second-, fourth-, and sixth-grade classes, respectively, and 577, 812, and 582
students. Only students who had both pretest and posttest MPP test data were included in these
analyses.
School Settings
Teachers were asked to identify their schools as urban, suburban, or rural. Most teachers
described their schools as “suburban” (56.6% of teachers) or “urban” (27.3% of teachers);
approximately 15% described their school as rural.
Teacher Demographics and Mathematics Background
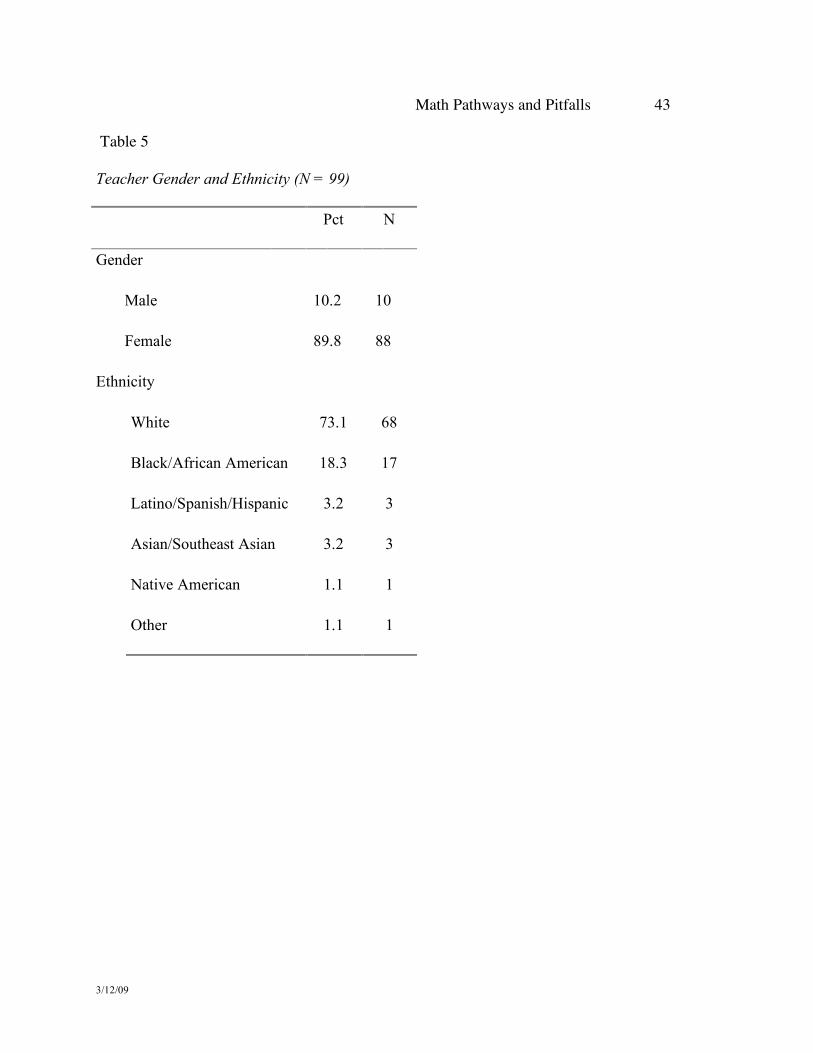
Information on teachers’ gender and ethnicity is presented in Table 5. The majority of
teachers in the study were women (89.8%), and most teachers identified themselves as “White”
(73.1%) or “Black/African American” (18.3%).
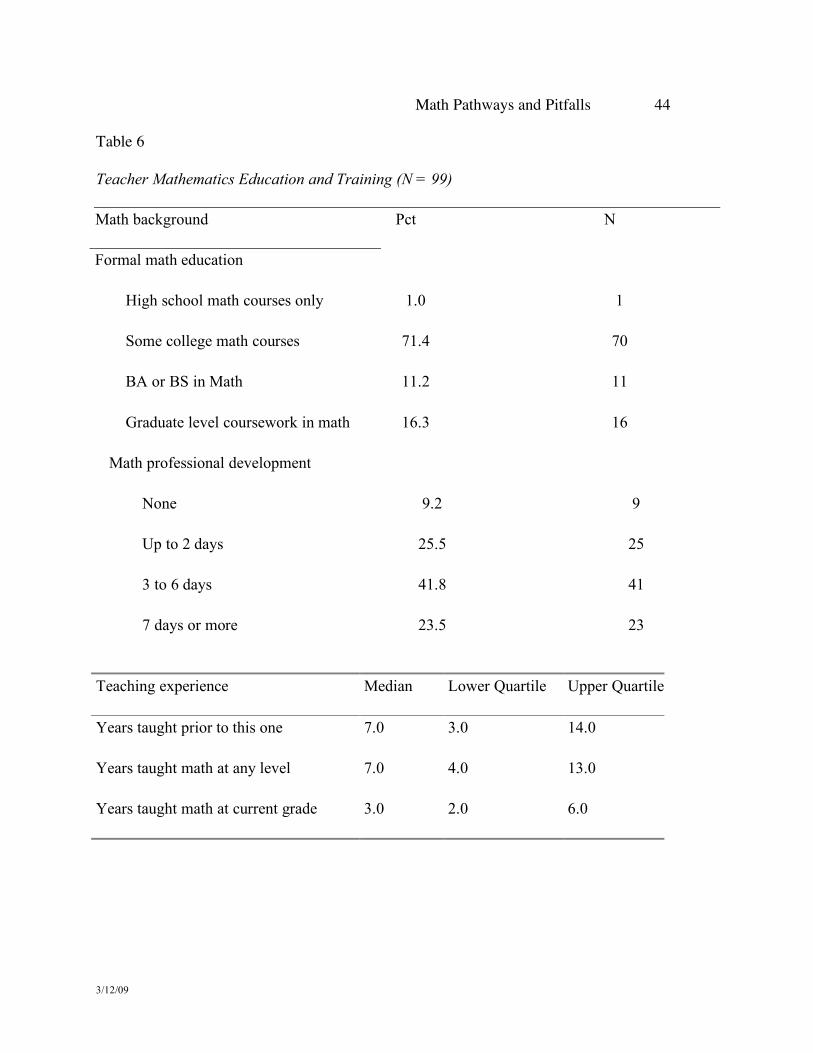
Descriptive statistics on teachers’ mathematics training are presented in Table 6. Most
teachers (71.7%) indicated that they had some college mathematics coursework, and 27.3% said
they had a bachelor’s degree in mathematics or graduate-level mathematics coursework. Nearly
Math Pathways and Pitfalls 22
3/12/09
half of the teachers (42.4%) had between 3 and 6 days of mathematics PD in the previous few
years, and close to one-quarter of the teachers (23.2%) had 7 days or more of mathematics PD.
The typical teacher in this study had 7 years of prior teaching experience altogether, and had
taught mathematics (at any grade level) for roughly the same amount of time. Furthermore, the
typical teacher had been teaching mathematics at his or her current grade level for 3 years.
Lastly, the typical teacher reported teaching 5 mathematics classes per week. The number of
mathematics classes taught per week varied according to grade level.
Student Demographics
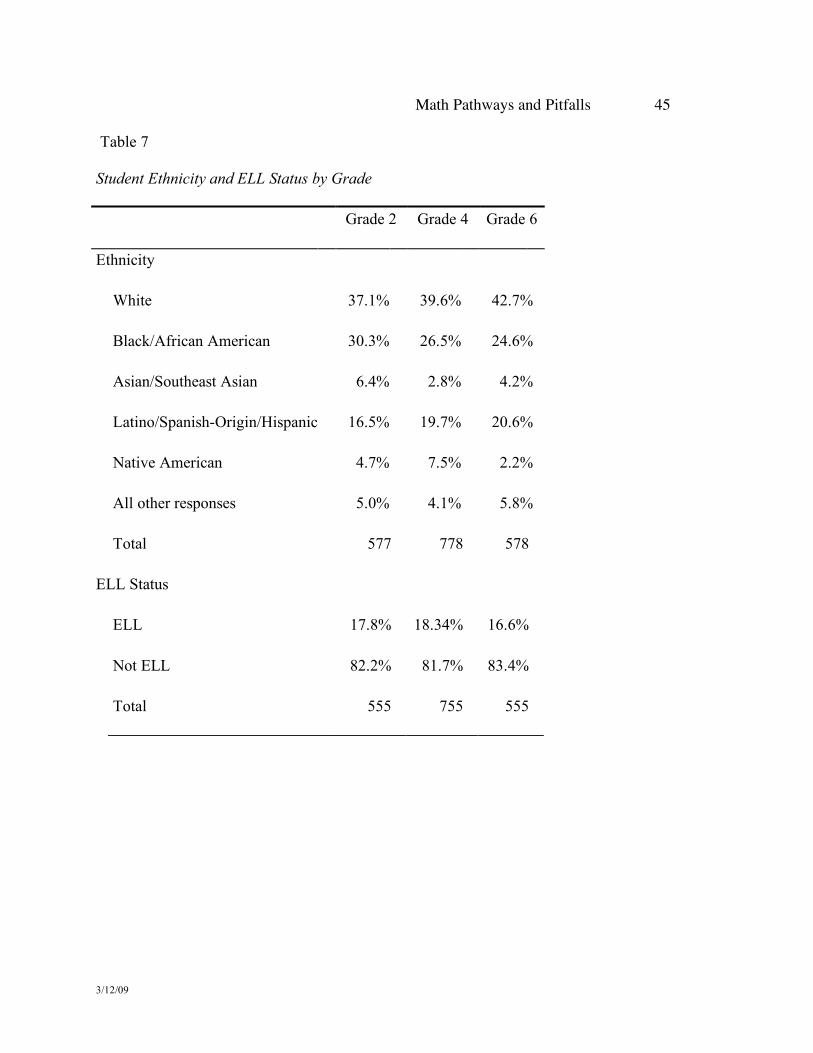
Information on students’ ethnicity and ELL status is presented in Tables 7. In terms of
ethnicity, across grade levels, approximately 40% of the students were European American.
There were roughly equal percentages of African American and Latino students in each grade. In
the second grade, the percentage of African American and Latino students was 30.3% and 16.5%
respectively; in the fourth grade, the percentage of African American and Latino students was
26.5% and 19.7% respectively; and in the sixth grade, the percentage of African American and
Latino students was 24.6% and 26.6% respectively. The proportion of ELL students in this study
was 17.8%, 18.3%, and 16.6%, for second-, fourth-, and sixth-grade students, respectively.
Roughly half of the students were boys, and half were girls, as would be expected.
Analysis of the MPP Tests
Multilevel Analyses of the MPP Tests
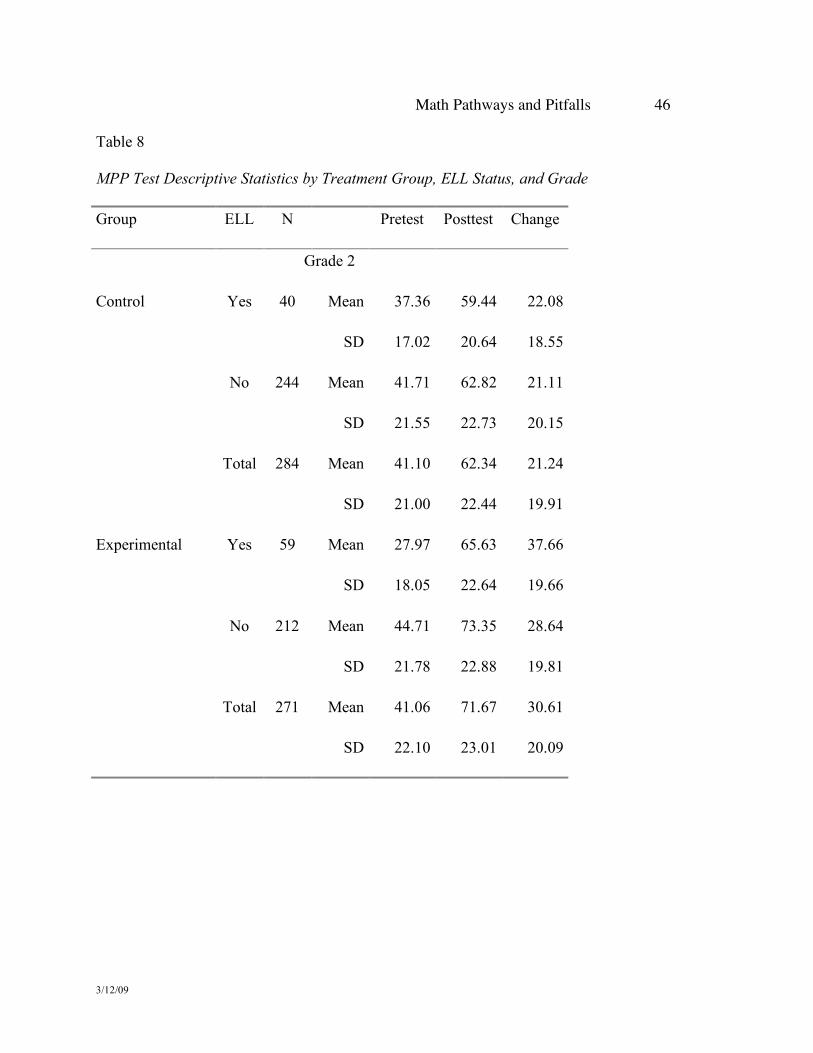
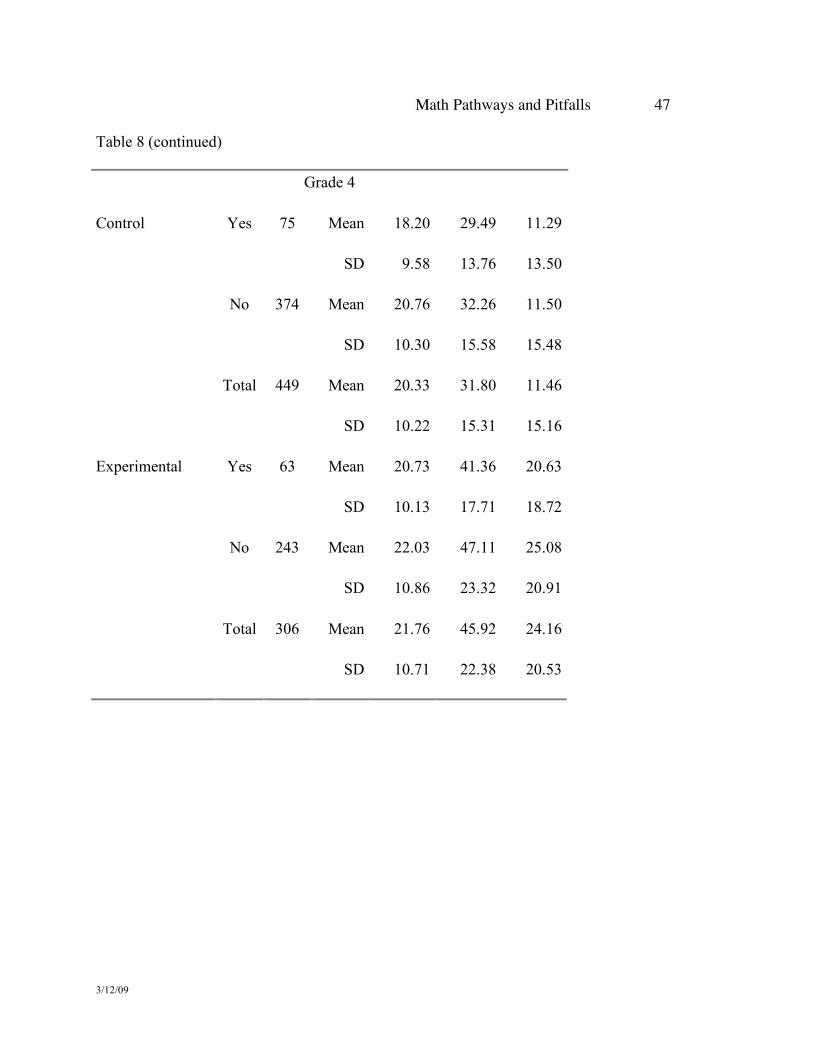
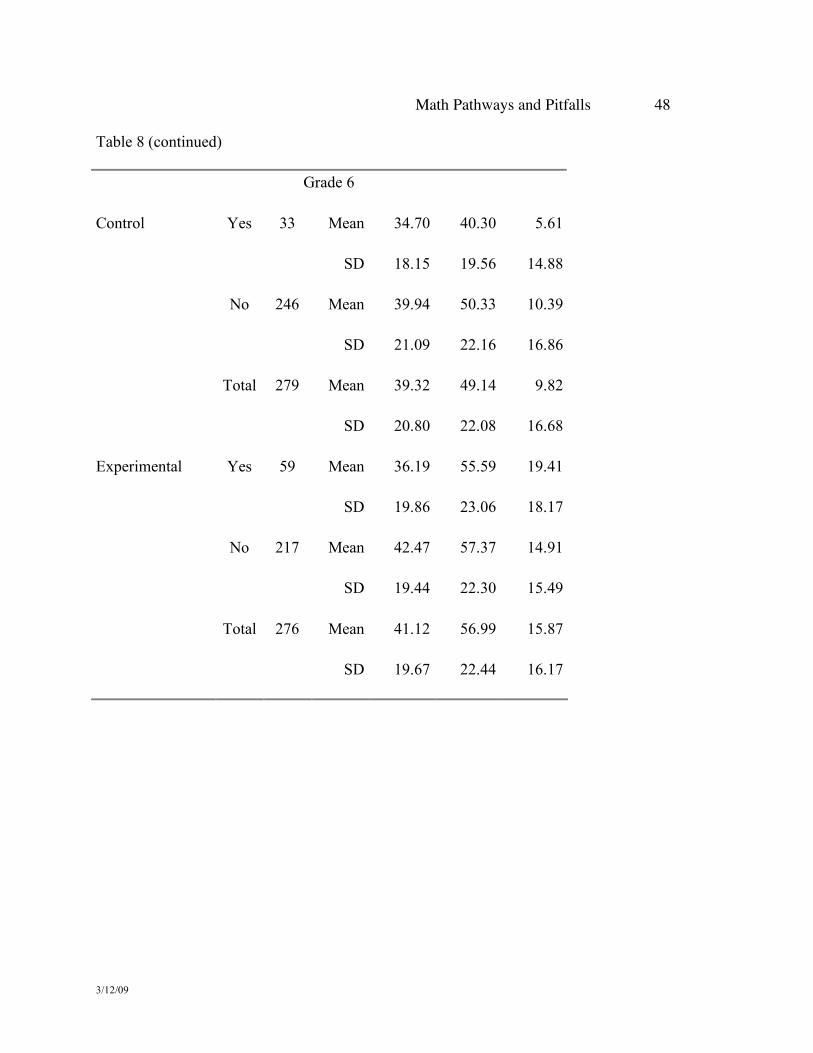
Descriptive statistics for MPP test scores are presented in Table 8. For each grade level,
the mean posttest score was greater in the experimental group than in the control group after
controlling for the MPP pretest score.
Math Pathways and Pitfalls 23
3/12/09
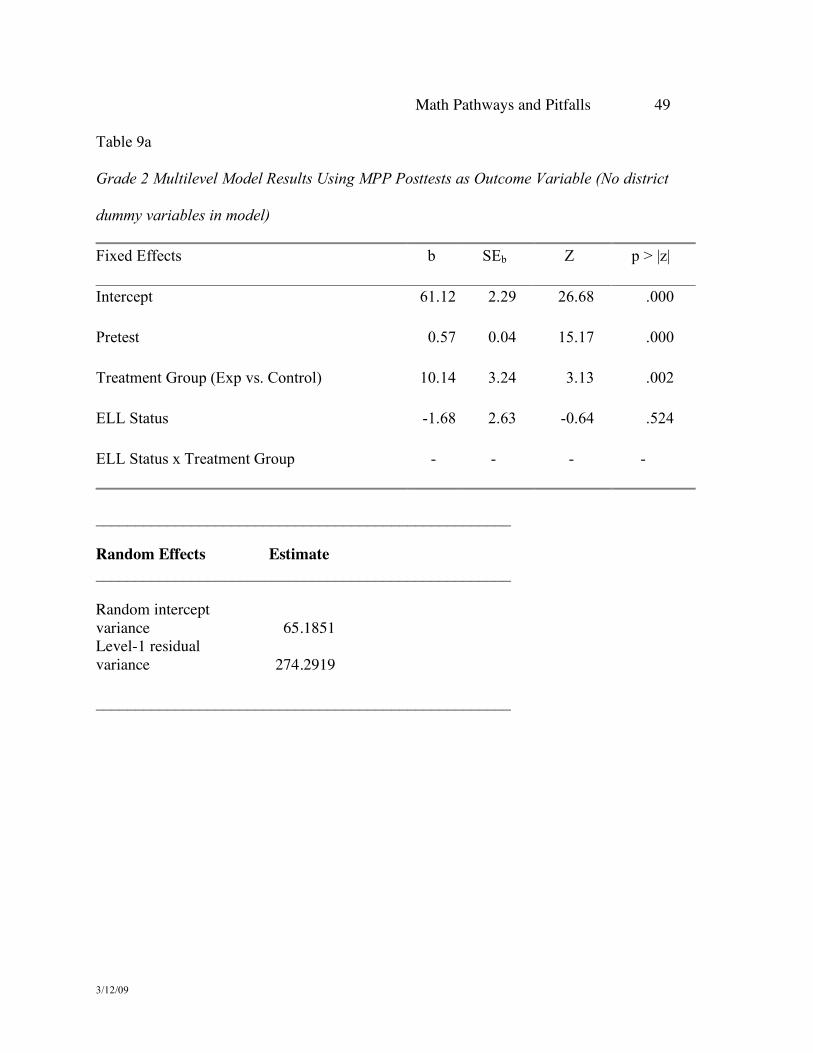
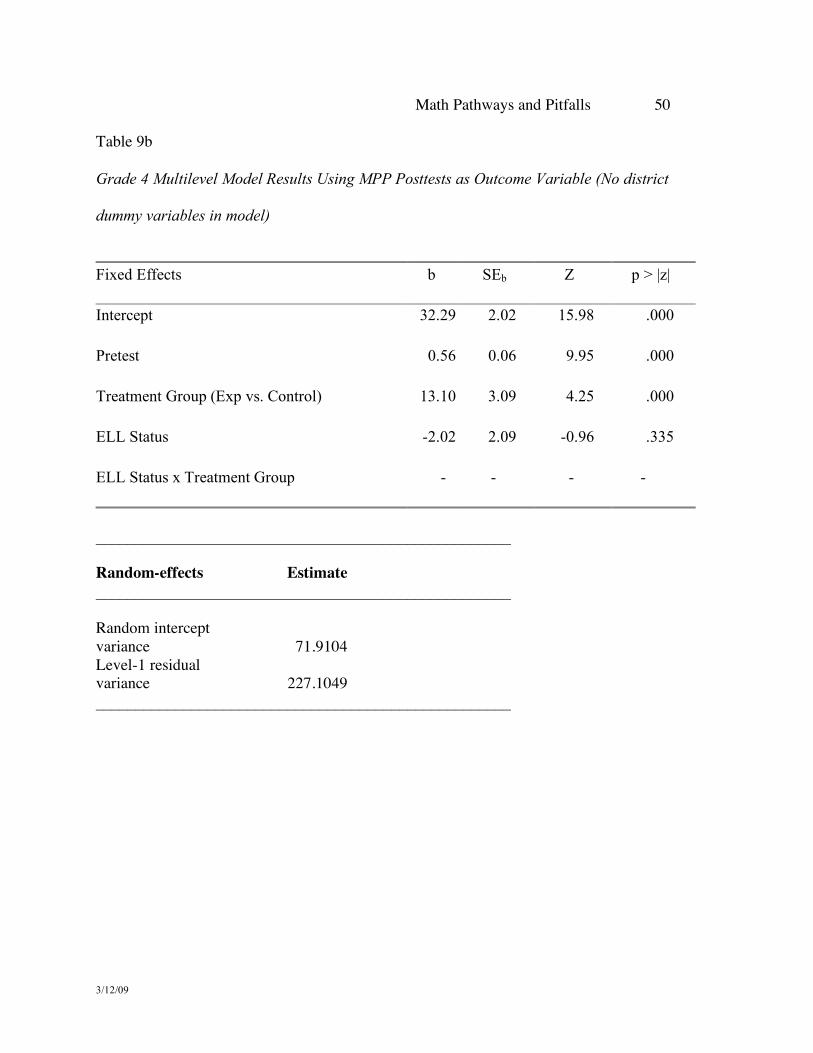
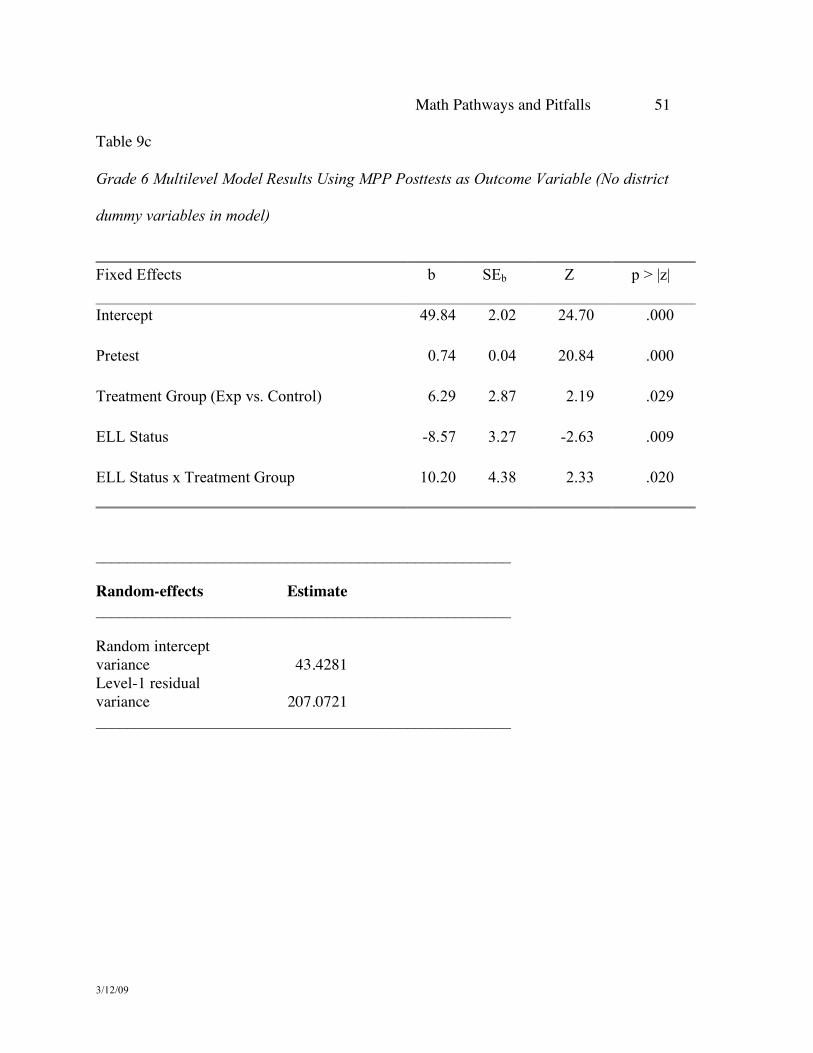
Multilevel analysis results for the 2nd, 4th, and 6th grade are presented in Tables 9a, 9b,
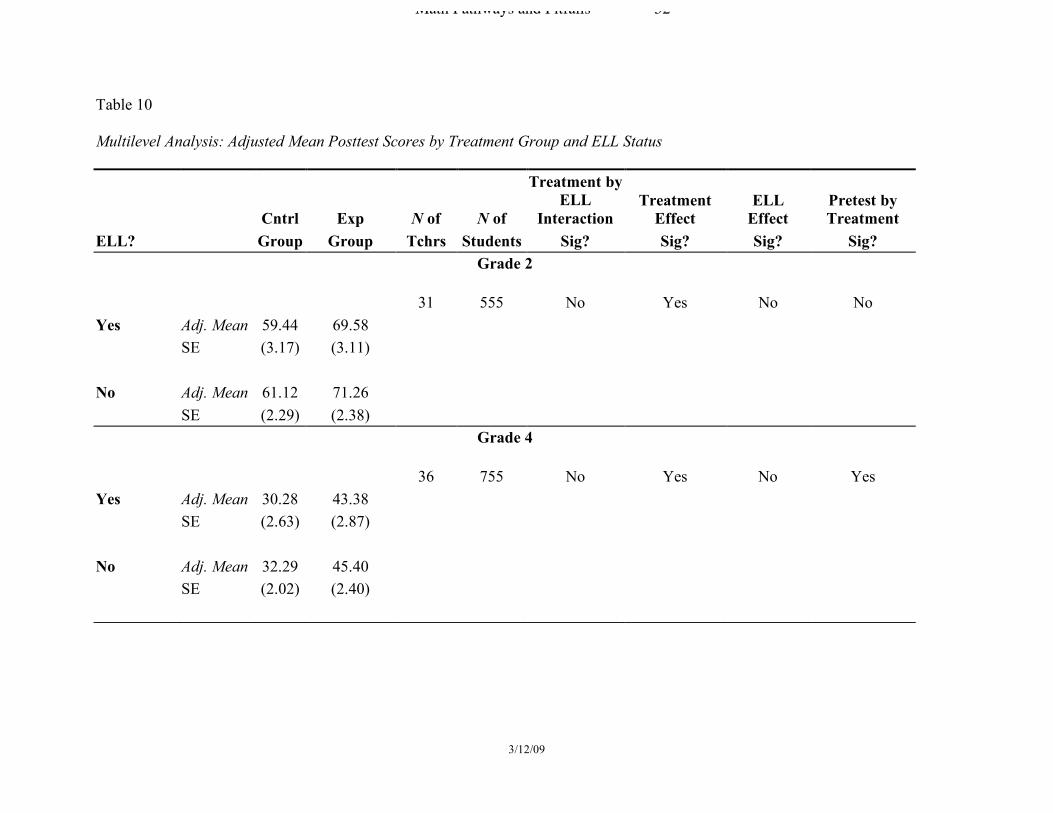
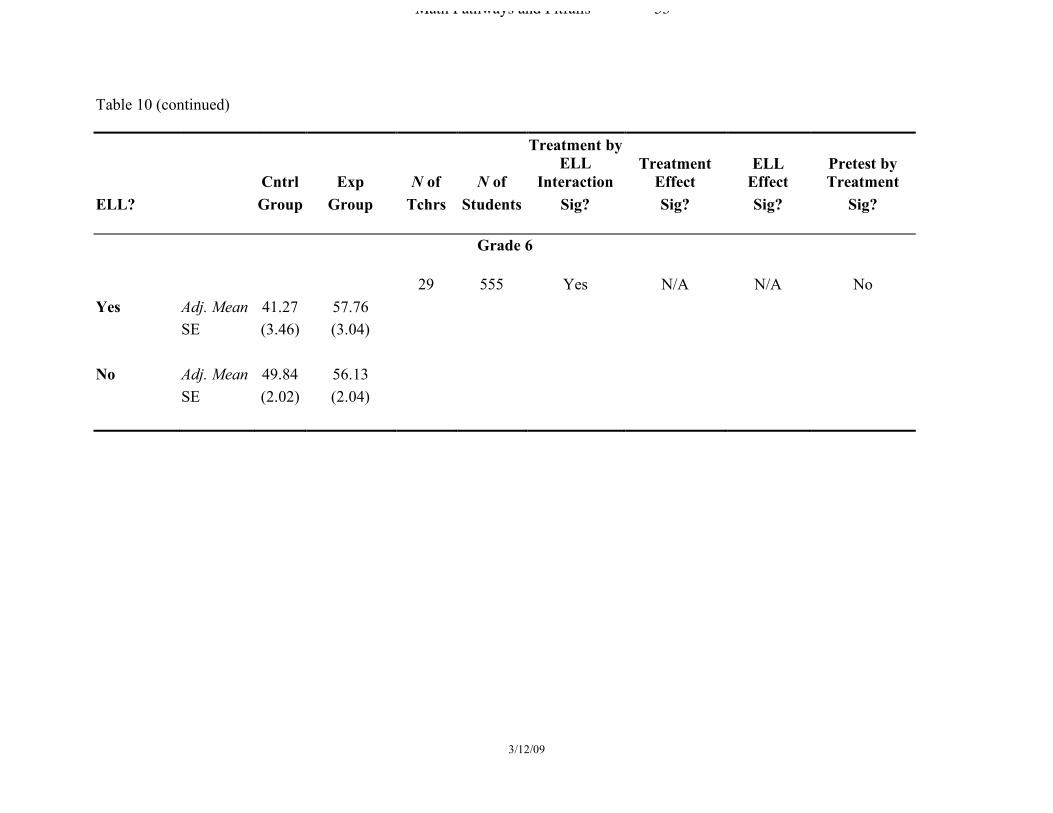
and 9c, respectively. Table 10 contains adjusted MPP posttest means, which can be helpful in
interpreting the multilevel analysis results. For the analysis where the ELL-by-treatment group
interaction term was statistically significant, the adjusted means in Table 10 were obtained from
the model with the significant ELL-by-treatment group interaction term. For the analyses where
the ELL-by-treatment group interaction term was not statistically significant, these adjusted
means were obtained from the simplified model, which did not include the interaction term. The
standard errors are based on the multilevel analyses. For making statements about differences
between the experimental and control group, we report estimated regression coefficients, which
correspond to the difference between adjusted means, and z-tests based on them.
As a preliminary analysis, we investigated the effect of school district membership on
MPP posttest scores. For each grade level, we evaluated a model with the following predictor
variables: (a) MPP pretest scores, (b) treatment group, (c) ELL status, (d) ELL-by-treatment
group interaction, and (e) the four school district dummy variables. For the 2nd grade analysis,
there was a statistically significant school district effect (X2(4) = 17.08, p = .002). But for the 4th
and 6th grade analyses, no statistically significant school district effects were found. Because the
school district dummy variables were not statistically significant in two grade levels, we
simplified the model for all the remaining analyses for all three grade levels by dropping the
school district dummy variables.
In terms of the effect of treatment group and ELL-status, for Grades 2 and 4, no
statistically significant ELL-by-treatment group interactions were found. For both Grades 2 and
4, a statistically significant main effect for treatment group was found—the adjusted posttest
Math Pathways and Pitfalls 24
3/12/09
mean for students in the experimental group was higher than the adjusted posttest mean for
students in the control group (estimated regression coefficient b = 10.14, z = 3.13, p = .002, ES
= 0.43 for Grade 2; and b = 13.10, z = 4.25, p < .001, ES = 0.66 for Grade 4). For second grade
students, there was a 10.14 difference between the experimental and control groups adjusted
posttest means. This difference can be thought of as the value added by being in the experimental
group, after controlling for pretest scores and ELL status. For fourth grade, there was a 13.10
difference between the experimental and control groups adjusted posttest means. Finally, for
sixth grade, there was a statistically significant ELL-by-treatment group interaction (b = 10.20, z
= 2.33, p = .020). Because the interaction term was statistically significant, effects are reported
separately for ELL and non-ELL students. For non-ELL students, a statistically significant
difference was found between the experimental and control groups (b = 6.29, z = 2.19, p = .029,
ES = 0.28). For ELL students, a statistically significant difference was also found between the
two groups (b = 16.49, z = 3.58, p < .001, ES = 0.74). Thus, the value added for non-ELL
students by being in the experimental group was smaller (6.29 percentage points) than the value
added by being in the experimental group for ELL students (16.49 percentage points), after
controlling for the other variables in the model.
To summarize the analysis of the MPP tests, statistically significant differences favoring
the experimental group were found for all three grades. For second and fourth grade, no
statistically significant ELL-by-treatment group interaction was found. The ES for these grade
levels were 0.43 and .061, respectively, favoring the experimental group. For sixth grade, a
statistically significant ELL-by-treatment group interaction was found. The difference between
the experimental and control groups was statistically significant for both non-ELL and ELL
Math Pathways and Pitfalls 25
3/12/09
students (ES equal 0.28 and 0.74, respectively), so that the value added by being in the
experimental group was higher for ELL than non-ELL students.
Analyses of the pretest-by-treatment interactions revealed a statistically significant
difference in Grade 4 (b = 0.24, z = 2.09, p = .036) only. This finding indicates that the MPP
intervention was more effective for fourth-grade children who had higher pretest scores than for
children who initially had lower pretest scores.
Analysis of the Standardized Mathematics Achievement Tests
The MPP tests were constructed to directly assess the impact of MPP. As such, the
analysis of the MPP test data was of primary interest. Standardized mathematics achievement
data were also collected and analyzed, to see if a more global effect of MPP could be seen. As
mentioned previously, all districts were asked to provide standardized mathematics achievement
test score data for all grades. Unfortunately, the standardized achievement test data that were
provided by the districts proved to be problematic. First, different school districts used different
standardized tests, and these different tests do not all measure the same underlying constructs.
Second, different districts provided test score data using different metrics. Some districts
provided test scores as normal curve equivalents (NCEs) and others provided tests scores as
percentile ranks. Third, there was, in fact, a fair amount of missing standardized-test-score data,
either because it was missing district-wide, or because specific students were not tested. Data
from some districts were not available for several reasons, including (a) some grade levels were
not tested in some districts, (b) a computer system change in one district between years 1 and 2
of the project interfered with getting the data, and (c) one of the district coordinators responsible
for providing the student assessment scores left the district too late for a replacement to be found.
Math Pathways and Pitfalls 26
3/12/09
For the district-administered standardized achievement tests, no statistically significant
differences were found in the adjusted standardized achievement test posttest means between the
experimental and control groups for either the fourth-grade students or the sixth-grade students.
(No standardized achievement test data were available for second grade students.)
Fidelity Implementation Study Results
As reported above, analyses of students’ MPP test scores indicated that experimental
group students at all three grades outperformed the control group students. Attributing these
differences to MPP requires evidence that establishes that the lessons were implemented in
experimental classrooms. In addition, it is important to look for systematic differences in lesson
implementation in higher- versus lower-scoring classrooms, in order to understand the conditions
that enhance students’ math learning. Therefore, we also examined the fidelity of lesson
implementation as enacted within MPP classrooms, compared to the structure and processes that
were intended by the curriculum designers. Teacher questionnaires and audio-recorded
classroom discourse were analyzed to address the following questions: (a) How closely does
MPP as enacted follow the structure, content, and discourse processes that were intended by the
curriculum designers, and (b) How does MPP as enacted in classrooms that had greater student
math score gains compare with lessons in classrooms with lower student gains?
With respect to fidelity of lesson implementation, analysis of classroom audio recordings
and teacher questionnaires revealed that (a) almost all teachers implemented every major
component and intended discourse process of the lessons; (b) teachers made some minor
modifications to the lesson structures—namely some steps or prompts were left out more than
others, particularly in lower-scoring classes; (c) some of the tools for building extended student
Math Pathways and Pitfalls 27
3/12/09
talk about math, such as the Discussion Builders, are spontaneously used by teachers and
students, even for lesson segments that are not guided by specific prompts in the teaching guide,
and during class time on subjects other than math; (d) in classes with higher-scoring students,
there was more use of Discussion Builders by both teachers and students, were asked to explain
their thinking less frequently than in lower-scoring classes but more often talked about the math
among themselves, and gave longer responses about the math.
Teachers expressed strongly positive opinions about the value of the program, including
that their students understood the math topics in the lessons better than students in past years,
that MPP helped most of their students learn the math concepts and prevent pitfalls, and their
students really liked MPP. Overall, the teachers strongly agreed that they would liketo use MPP
again next year, and students in their schools would benefit greatly if all of the teachers used
Math Pathways and Pitfalls.
Summary and Conclusions
Using project-developed MPP tests as the measure of mathematics achievement, we
found a positive treatment effect for the MPP lessons for all three grades. For second and fourth
grades, MPP benefited ELL and non-ELL students equally. The ES for second and fourth grades
were .43 and .66, respectively. For sixth grade, MPP had a greater treatment effect for ELL
students (ES = .74) than non-ELL students (ES = .28). In evaluating how equitable the impact of
MPP was on students’ mathematics knowledge across levels of entering math knowledge, the
study found no difference in the effectiveness of MPP for mathematically higher performing
versus lower performing students except at fourth grade, where MPP was more effective for
children who had higher pretest scores than for children who had lower pretest scores.
Math Pathways and Pitfalls 28
3/12/09
For the district-administered standardized achievement tests, no statistically significant
differences were found in the adjusted standardized achievement test posttest means between the
experimental and control groups for either the fourth-grade students or the sixth-grade students.
(No standardized achievement test data were available for second grade students.)
The findings of positive impact of MPP on student mathematics performance across
grades, levels of English proficiency, and entering mathematics achievement levels are
consistent with an earlier study of MPP materials by Heller, Gordon, Paulukonis, and Kaskowitz
(2000). Because the current study was based on a more rigorous research design—namely a
cluster randomized design--than the one used in the Heller et. al. study, the results of the current
study can be viewed as even stronger evidence of the effectiveness of the MPP materials.
Comparing MPP test and standardized achievement test results. Although statistically
significant results were found for all three grades on the MPP test, no statistically significant
results were found using standardized achievement tests as the outcome variable. This disparity
might be due to the fact that the MPP tests were designed to assess the rational number topics
covered by the MPP lessons, whereas the standardized achievement tests assess a more global
construct of mathematical achievement, so may not have been instructionally sensitive enough to
detect differences between the MPP and non-MPP groups.
Implementing cluster randomized designs in education. Cluster randomized designs are a
powerful way of evaluating the impact of a given educational intervention on student learning.
The random assignment of teachers to MPP and non-MPP groups is an important element in the
internal validity of this study.
There are many logistical challenges to implementing a cluster randomized design in
Math Pathways and Pitfalls 29
3/12/09
education. First, random assignment of teachers requires uniformity of schedule, district policy,
and preferences across many different school and district contexts. Because the real world of
education is so complex, there were many challenges involved in implementing and maintaining
the research design. For example, group assignment dictated the timing of professional
development sessions for teachers in a given group, and teachers’ schedules were often in
conflict with the project’s schedule. Teachers and site coordinators were highly mobile, resulting
in considerable attrition in the second year of the study. Furthermore, this study was carried out
in several states, and these states differed in terms of the standardized achievement tests they
used. Because school district officials are reluctant to add any additional standardized testing
requirements over and above the tests they currently use, we had to rely on the standardized
achievement test data provided by each district.
In addition, because the study was conducted in multiple districts, a great deal of effort
was required to get formal consent from each district to conduct the study. Because this study
was conducted in school districts that were distant from each other, the project depended upon
local school and district personnel to implement the research design. The study was vulnerable to
the ongoing availability of these coordinators—when they moved on, communication with
teachers in the district became highly problematic. In addition, a significant amount of time was
devoted to coordinating logistical issues with school personnel representing the various school
sites.
Limitations. Although the MPP materials were found to have a positive impact on student
learning as measured by the MPP tests, several limitations of the study should be noted. First,
because of the large number of teachers who dropped out in the second year of the study, the

Math Pathways and Pitfalls 30
3/12/09
data from the second year of the study were not considered usable, and we were therefore unable
to analyze the data for the second year of the study. Second, the standardized achievement test
data were problematic. Different school districts provided different standardized tests to the
researchers, and these different tests do not all measure the same underlying constructs.
Moreover, there was a fair amount of missing standardized-test data, making the results of the
analyses of these tests difficult to interpret. Finally, in terms of generalizability of the findings to
other students, this study was implemented in five school districts across the country. Although
every effort was made to select districts with diverse student bodies, caution is still needed in
generalizing these results to other students. In addition, teachers participating in the study were
volunteers and may not represent the full spectrum of teachers.
Math Pathways and Pitfalls 31
3/12/09
References
Behr, M., Lesh, R., Post, T., & Silver, E., (1983). Rational number concepts. In R. Lesh & M.
Landau (Eds.). Acquisition of mathematics concepts and process (pp. 91-126) New York:
Academic Press.
Borasi, R., (1994). Capitalizing on errors as “springboards for inquiry.” Journal for Research in
Mathematics Education, 25 (2) 166–208.
Brenner, M. E. (1998). Development of mathematical communication in problem solving groups by
language minority students. Bilingual Research Journal, 22.
Brown, J. S., Collins, A., & Duguid, P.(1989). Situated cognition and the culture of learning.
Educational Researcher, (18) 1, 32-42.
Bruner, J.S. (1960). The process of education. Cambridge MA: Harvard University Press.
Bruner, J.S. (1966). Toward a theory of instruction. Cambridge MA: Harvard University Press.
Butler, F. A., & Bailey, A. L. (2002, Spring). Equity in the assessment of English language learners
K-12. Idiom, 32(1), 1, 3. [Available from New York State TESOL at
http://www.nystesol.org/]
Carpenter, T.P., & Moser, J.M. (1983). The acquisition of addition and subtraction concepts. In R.
Lesh and M. Landau (Eds.) The acquisition of mathematical concepts and processes, (pp. 7–
44). New York: Academic Press.
Carraher, D. W. (1996). Learning about fractions. In: L. P. Steffe, P. Nesher, G. A. Goldin, P. Cobb,
& B. Greer (Eds.), Theories of mathematical learning (pp. 241–266). Mahwah, New Jersey:
Lawrence Erlbaum Associates.
Math Pathways and Pitfalls 32
3/12/09
Chamot, A.U., & O'Malley, J. M. (1994). The CALLA handbook: Implementing the cognitive
academic language learning approach. Reading, MA: Addison-Wesley Publishing
Company.
Cobb, P., Wood, T.L, & Yackel E. L. (1993). Discourse, mathematical thinking and classroom
practice. In E. A. Forman, N. Minick, and C. A. Stone (Eds.). Contexts for learning:
Sociocultural dynamics in children’s development (pp. 91-119). New York: Oxford
University Press.
Cohen, J. (1988). Statistical power analysis for the behavioral sciences. Hillsdale, New Jersey:
Lawrence Erlbaum.
Cohen, E.G. & Intili, J.K., (1982), "Interdependence and management in bilingual classrooms",
Final report II (NIE contract #NIE-G-80-0217), Stanford: Stanford University Center for
Education Research Collier, V. (1995). Acquiring a second language for school. Directions
in Language and Education, 1:4. Washington, DC: The National Clearinghouse for Bilingual
Education. Available: http://www.ncbe.gwu.edu/ncbepubs/directions/04.htm
Cummins, J. (1980). The construct of proficiency in bilingual education. In J. E. Alatis (Ed.),
Georgetown University Round Table on Languages and Linguistics: Current Issues in
Bilingual Education, 81-103.
Echevarria, J. (1998, December). Teaching language minority students in elementary schools.
CREDE Research Brief No. 1.
Echevarria, J., & Graves, A. (1998). Sheltered content instruction: Teaching English-language
learners with diverse abilities. Boston: Allyn & Bacon.
Festinger, L. (1957). A theory of cognitive dissonance. Evanston, IL: Row, Perterson & Company.
Math Pathways and Pitfalls 33
3/12/09
Fuson, K. C., (1992). Research on learning and teaching addition and subtraction of whole numbers. In G.
Leinhardt, R. T. Putnam, and R.A. Hattrup (Eds.). The analysis of arithmetic for mathematics
teaching (pp. 53-187). Hillsdale, NJ: Erlbaum.
Gersten, R. (1996). Literacy instruction for language minority students: The transition years. The
Elementary School Journal 96 (3), 228-244.
Gibbons, P. (2002). Scaffolding language, scaffolding learning. Portsmouth, NH: Heineman.
Griffin, S. (1998, April). Fostering the development of whole number sense. Paper presented at the
annual meeting of the American Educational Research Association, San Diego, CA.
Heller, J. I., Gordon, A., Paulukonis, S., & Kaskowitz, S. (2000). Mathematics Case Methods
Project discussion materials for students: Initial evaluation results. Unpublished manuscript.
Khisty, L. (1995). Making inequality: Issues of language and meanings in mathematics teaching with
hispanic student. In W. G. Seced, Elizabeth Rennema, and Lisa Byrd Adajian (Eds.). New
direction for equity in mathematics education (279-297). New York: Cambridge University
Press.
Khisty, L. (1992, August). A naturalistic look at language factors in mathematics teaching in
bilingual classrooms. Proceedings of the Third National Research Symposium on Limited
English Proficient Student Issues: Focus on Middle and High School Issues. Washington
D.C.
McKeon, D. (1994). When meeting common standards is uncommonly difficult. Educational
Leadership, 51 (8).
Math Pathways and Pitfalls 34
3/12/09
Moss, J., & Case, R. (1999). Developing children's understanding of the rational numbers: A new
model and an experimental curriculum. Journal for Research in Mathematics Education, (30)
2, 122-147.
National Research Council. (2001). Adding it up: Helping children learn mathematics. J. Kilpatrick,
J. Swafford, and B. Findell, (Eds.) Mathematics Learning Study Committee, Center for
Education, Division of Behavioral and Social Sciences and Education, p. 118. Washington,
DC: National Academy Press.
Parker, M., & Leinhardt, G. (1995). Percent: A privileged proportion. Review of Educational
Research, 65, (4), 421-481.
Pimm, D. (1987). Speaking mathematically: Communication in mathematics classrooms. London:
Routledge,
Rabe-Hesketh, S., & Skrondal, A. (2008). Multilevel modeling using Stata (2nd edition). College
Station, TX: Stata Press.
Raudenbush, S. W., & Bryk, A. S. (2002). Hierarchical linear models: Applications and data
analysis (2nd ed.). Thousand Oaks, CA: Sage.
Scardamalia, M. and Bereiter, C. (1983). The development of evaluative, diagnostic, and remedial
capabilities in children composing. In M. Martlew (Ed.). The psychology of written
language: A developmental approach (pp. 67-95). New York, NJ: John Wiley and Sons.
Secada, W. G., (1992) Race, ethnicity, social class, language, and achievement in mathematics. In D.
Grouws (Ed.) Handbook of research on mathematics teaching and learning (pp. 623-660).
New York: Macmillan.
Math Pathways and Pitfalls 35
3/12/09
Short, D. J. & Echevarria, J. (1999). The sheltered instruction observation protocol: A tool for
teacher-researcher collaboration and professional development (Educational Practice Report
No. 3). Santa Cruz, CA: University of California, Santa Cruz, Center for Research on
Education, Diversity & Excellence.
Snijders, T.A.B., & Bosker, R. L. (1993). Standard errors and sample sizes for two-level research.
Journal of Educational Statistics, 18(3), 237-259.
Solomon, J., & Rhodes N. (1995). Conceptualizing academic language (Research Rep. No.15).
Santa Cruz: University of California, National Center for Research on Cultural Diversity and
Second Language Learning.
Sowder, J. T. (1992). Making sense of numbers in school mathematics. In G. Leinhardt, R. Putnam,
& R.A. Hattrup (Eds.). Analysis of teaching arithmetic for mathematics teaching (pp. 1-51).
Hillsdale, NJ: Erlbaum.
StataCorp (2005). Stata statistical software: Release 9. StataCorp LP, College Station, TX.
Stigler, J.W., Gonzales, P. Kawanaka, T., Knoll, S., & Serrano, A. (1999). The TIMSS Videotape
Classroom Study: Methods and finding from an exploratory research project on eighth-grade
mathematics instruction in Germany, Japan, and the United States. Washington, DC:
National Center for Education Statistics. Available: http://nces.ed.gov/timss. [July 10, 2001]
Vygotsky, L.S. (1978). Mind in society: The development of higher psychological processes.
Cambridge, MA: Harvard University Press.
Vygotsky, L. S. (1962). Thought and language. Edited and translated by Eugenia Hanfmann and
Gertrude Vakar. Cambridge, MA, NY: MIT Press; John Wiley.
Math Pathways and Pitfalls 36
3/12/09
Wearne, D., & Hiebert, J. (1989). Cognitive changes during conceptually based instruction on
decimal fractions. Journal of Educational Psychology, 81 (4), 507–513.
Webb, N. (1989). Peer interaction and learning in small groups. International Journal of
Educational Research, 13, 21-39.
Webb, N. (1985) Student interaction and learning in small groups: A research summary. In R.
Slavin, S. Sharan, S. Kagan, R. Lazarowitz, C. Webb, & R. Schmuck (Eds.) Learning to
cooperate, cooperating to learn (pp. 147 - 176). New York, Plenum.
Wong-Fillmore, L. (1982). Language minority students and school participation: What kind of
English is needed? Journal of Education, 164, 143–156.
Math Pathways and Pitfalls 37
3/12/09
Table 1 Theoretical Basis and Expected Student Benefits of MPP Model
Critical Feature of MPP Model Theoretical Basis
Expected Student Benefits
Math
• Explicit strategies motivate students to become careful critics of their own thinking, justify ideas logically, and question the validity of ideas.
• Pitfalls related to important mathematical concepts are used as a springboard for inquiry and learning.
• Lessons stimulate creative solutions to non-routine problems and use of a variety of representations.
• Lessons build on prior math concepts and connect to related concepts within each unit and from grade to grade.
• Successful students develop intentional learning strategies for knowledge-related goals. Unsuccessful students focus on surface features (Scardamalia & Bereiter, 1983).
• Cognitive dissonance stimulates spontaneous inquiry and meaning construction (Festinger 1957; Borasi, 1994).
• Inability to solve problems with misleading features is symptomatic of fundamental misunderstandings (Moss & Case, 1999).
• A spiral curriculum links new and prior learning to achieve knowledge breadth and depth and facilitate extrapolation (Bruner, 1960, 1966).
•
• Students become increasingly independent mathematics learners, elevate the quality of their work, and monitor their own thinking for pitfalls.
• Students acquire “habits of mind” that incorporate inquiry and critical thought.
• Students gain complex understandings that adapt to different contexts and are resilient to misleading cues.
• Learning is cumulative, generative, and strengthened from grade to grade.
Math Pathways and Pitfalls 38
3/12/09
Table 1 (continued)
Language, Discourse, and Equity
• Lessons model inventive student ideas and logical reasoning. Discussion Builders model ways to build on or disagree with an idea respectfully.
• Studs prove or disprove the validity of mathematical statements.
• Lessons introduce math vocabulary and symbols and point out language pitfalls.
• Teaching guides suggest ways to make mathematical discourse accessible to students and achieve broad participation.
• Cognitive apprenticeship and scaffolding support the new cognitive behaviors and patterns of discourse (Brown, Collins, Duguid, 1989; Gibbons, 2002).
• Knowledge is socially constructed, with discourse playing a major role in developing meaning (Vygotsky, 1962; Cobb, Wood, & Yackel, 1993).
• Attending to language and status issues enhances discourse participation (Cohen, 1982; Khisty, 1995; Secada, 1992).
• Students build their capacity to think inventively and reason logically.
• Students are open to presenting mathematical ideas and examining their validity with their peers.
• Students are prepared for the discourse expected in demanding curricula and advanced mathematics.
• Students, regardless of their language background or social status, increase their contributions to mathematical discourse.
Math Pathways and Pitfalls 39
3/12/09
Table 2
Synopses of Selected Lessons
Naming Equal Fractions
Infinite Names for Equivalent Fraction Amounts. This lesson is an opportunity to help
students realize that a region can be divided into an infinite number of equal parts and that an
infinite number of fractions can name the shaded amount. To find other fraction names, Teresa
(a fictional student in the lesson) models the idea that you can divide the same region into
more or fewer equal parts, as long as the ratio of the shaded amount to the whole amount
remains the same. Visualizing more or fewer subdivisions when naming fraction amounts
using any model is a valuable strategy that helps children think about equivalent fractions.
Pitfall: Students count number of parts shaded for the numerator and the number of parts not
shaded for the denominator (instead of comparing a part to the whole).
Math Pathways and Pitfalls 40
3/12/09
Table 2 (continued)
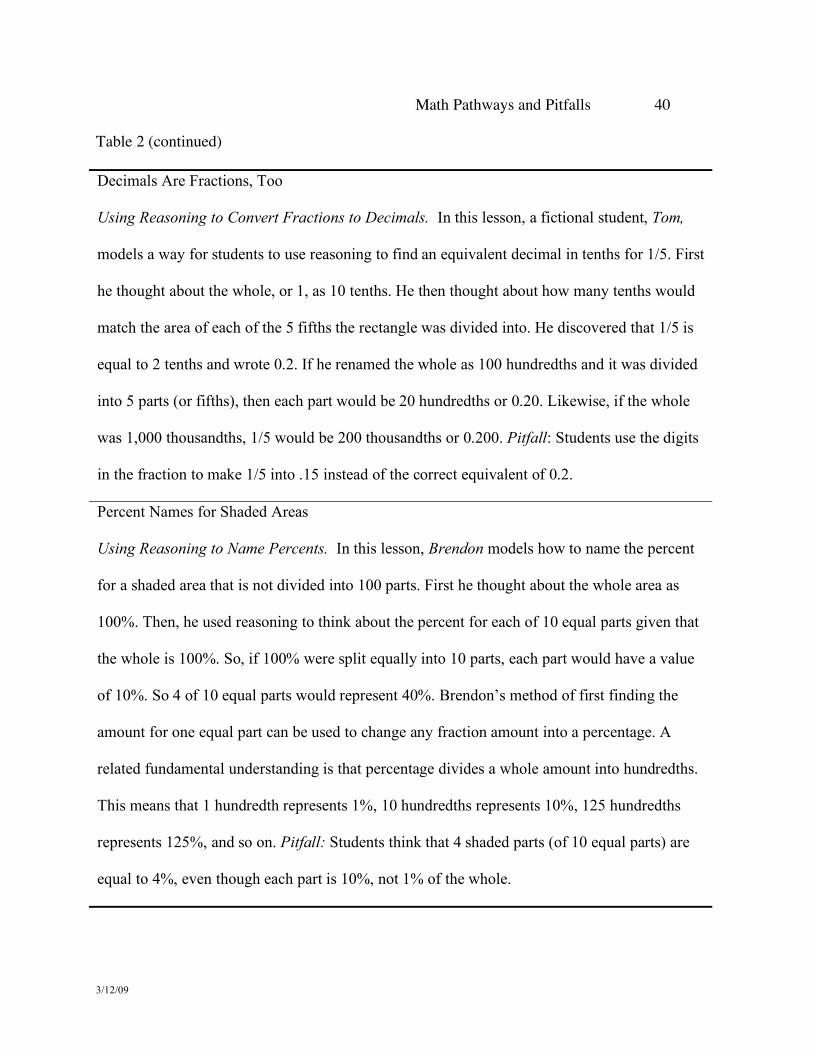
Decimals Are Fractions, Too
Using Reasoning to Convert Fractions to Decimals. In this lesson, a fictional student, Tom,
models a way for students to use reasoning to find an equivalent decimal in tenths for 1/5. First
he thought about the whole, or 1, as 10 tenths. He then thought about how many tenths would
match the area of each of the 5 fifths the rectangle was divided into. He discovered that 1/5 is
equal to 2 tenths and wrote 0.2. If he renamed the whole as 100 hundredths and it was divided
into 5 parts (or fifths), then each part would be 20 hundredths or 0.20. Likewise, if the whole
was 1,000 thousandths, 1/5 would be 200 thousandths or 0.200. Pitfall: Students use the digits
in the fraction to make 1/5 into .15 instead of the correct equivalent of 0.2.
Percent Names for Shaded Areas
Using Reasoning to Name Percents. In this lesson, Brendon models how to name the percent
for a shaded area that is not divided into 100 parts. First he thought about the whole area as
100%. Then, he used reasoning to think about the percent for each of 10 equal parts given that
the whole is 100%. So, if 100% were split equally into 10 parts, each part would have a value
of 10%. So 4 of 10 equal parts would represent 40%. Brendon’s method of first finding the
amount for one equal part can be used to change any fraction amount into a percentage. A
related fundamental understanding is that percentage divides a whole amount into hundredths.
This means that 1 hundredth represents 1%, 10 hundredths represents 10%, 125 hundredths
represents 125%, and so on. Pitfall: Students think that 4 shaded parts (of 10 equal parts) are
equal to 4%, even though each part is 10%, not 1% of the whole.
Math Pathways and Pitfalls 41
3/12/09
Table 3
Experimental Design of Study With Pre-Post Teacher and Student Assessments
Randomization Summer 2003
Fall 2003 Spring 2004
Teachers
Experimental R X O O
Control R O O
Students
Experimental NR O X O
Control NR O O
Note: An “X” indicates that participants were “treated” during this time period.
Math Pathways and Pitfalls 42
3/12/09
Table 4
Number of Teachers and Students per Group by District and Grade
Grade 2 Grade 4 Grade 6
District Control
Exp Control
Exp Control
Exp
Teachers
1 5 5 8 6 4 5
2 3 3 3 4 3 4
3 1 2 3 3 3 1
4 5 4 5 3 2 3
5 2 2 2 1 2 2
Total 16 16 21 17 14 15
Students
1 108 101 186 136 91 105
2 53 44 57 70 54 69
3 9 40 63 56 42 13
4 84 62 111 64 44 59
5 38 38 42 27 53 52
Total 292 285 459 353 284 298
Math Pathways and Pitfalls 43
3/12/09
Table 5
Teacher Gender and Ethnicity (N = 99)
Pct N
Gender
Male 10.2 10
Female 89.8 88
Ethnicity
White 73.1 68
Black/African American 18.3 17
Latino/Spanish/Hispanic 3.2 3
Asian/Southeast Asian 3.2 3
Native American 1.1 1
Other 1.1 1
Math Pathways and Pitfalls 44
3/12/09
Table 6
Teacher Mathematics Education and Training (N = 99)
Math background Pct N
Formal math education
High school math courses only 1.0 1
Some college math courses 71.4 70
BA or BS in Math 11.2 11
Graduate level coursework in math 16.3 16
Math professional development
None 9.2 9
Up to 2 days 25.5 25
3 to 6 days 41.8 41
7 days or more 23.5 23
Teaching experience Median Lower Quartile Upper Quartile
Years taught prior to this one 7.0 3.0 14.0
Years taught math at any level 7.0 4.0 13.0
Years taught math at current grade 3.0 2.0 6.0
Math Pathways and Pitfalls 45
3/12/09
Table 7
Student Ethnicity and ELL Status by Grade
Grade 2 Grade 4 Grade 6
Ethnicity
White 37.1% 39.6% 42.7%
Black/African American 30.3% 26.5% 24.6%
Asian/Southeast Asian 6.4% 2.8% 4.2%
Latino/Spanish-Origin/Hispanic 16.5% 19.7% 20.6%
Native American 4.7% 7.5% 2.2%
All other responses 5.0% 4.1% 5.8%
Total 577 778 578
ELL Status
ELL 17.8% 18.34% 16.6%
Not ELL 82.2% 81.7% 83.4%
Total 555 755 555
Math Pathways and Pitfalls 46
3/12/09
Table 8
MPP Test Descriptive Statistics by Treatment Group, ELL Status, and Grade
Group ELL N Pretest Posttest Change
Grade 2
Control Yes 40 Mean 37.36 59.44 22.08
SD 17.02 20.64 18.55
No 244 Mean 41.71 62.82 21.11
SD 21.55 22.73 20.15
Total 284 Mean 41.10 62.34 21.24
SD 21.00 22.44 19.91
Experimental Yes 59 Mean 27.97 65.63 37.66
SD 18.05 22.64 19.66
No 212 Mean 44.71 73.35 28.64
SD 21.78 22.88 19.81
Total 271 Mean 41.06 71.67 30.61
SD 22.10 23.01 20.09
Math Pathways and Pitfalls 47
3/12/09
Table 8 (continued)
Grade 4
Control Yes 75 Mean 18.20 29.49 11.29
SD 9.58 13.76 13.50
No 374 Mean 20.76 32.26 11.50
SD 10.30 15.58 15.48
Total 449 Mean 20.33 31.80 11.46
SD 10.22 15.31 15.16
Experimental Yes 63 Mean 20.73 41.36 20.63
SD 10.13 17.71 18.72
No 243 Mean 22.03 47.11 25.08
SD 10.86 23.32 20.91
Total 306 Mean 21.76 45.92 24.16
SD 10.71 22.38 20.53
Math Pathways and Pitfalls 48
3/12/09
Table 8 (continued)
Grade 6
Control Yes 33 Mean 34.70 40.30 5.61
SD 18.15 19.56 14.88
No 246 Mean 39.94 50.33 10.39
SD 21.09 22.16 16.86
Total 279 Mean 39.32 49.14 9.82
SD 20.80 22.08 16.68
Experimental Yes 59 Mean 36.19 55.59 19.41
SD 19.86 23.06 18.17
No 217 Mean 42.47 57.37 14.91
SD 19.44 22.30 15.49
Total 276 Mean 41.12 56.99 15.87
SD 19.67 22.44 16.17
Math Pathways and Pitfalls 49
3/12/09
Table 9a
Grade 2 Multilevel Model Results Using MPP Posttests as Outcome Variable (No district
dummy variables in model)
Fixed Effects b SEb Z p > |z|
Intercept 61.12 2.29 26.68 .000
Pretest 0.57 0.04 15.17 .000
Treatment Group (Exp vs. Control) 10.14 3.24 3.13 .002
ELL Status -1.68 2.63 -0.64 .524
ELL Status x Treatment Group - - - -
____________________________________________________
Random Effects Estimate ____________________________________________________
Random intercept variance 65.1851 Level-1 residual variance 274.2919 ____________________________________________________
Math Pathways and Pitfalls 50
3/12/09
Table 9b Grade 4 Multilevel Model Results Using MPP Posttests as Outcome Variable (No district
dummy variables in model)
Fixed Effects b SEb Z p > |z|
Intercept 32.29 2.02 15.98 .000
Pretest 0.56 0.06 9.95 .000
Treatment Group (Exp vs. Control) 13.10 3.09 4.25 .000
ELL Status -2.02 2.09 -0.96 .335
ELL Status x Treatment Group - - - -
____________________________________________________
Random-effects Estimate ____________________________________________________
Random intercept variance 71.9104 Level-1 residual variance 227.1049 ____________________________________________________
Math Pathways and Pitfalls 51
3/12/09
Table 9c
Grade 6 Multilevel Model Results Using MPP Posttests as Outcome Variable (No district
dummy variables in model)
Fixed Effects b SEb Z p > |z|
Intercept 49.84 2.02 24.70 .000
Pretest 0.74 0.04 20.84 .000
Treatment Group (Exp vs. Control) 6.29 2.87 2.19 .029
ELL Status -8.57 3.27 -2.63 .009
ELL Status x Treatment Group 10.20 4.38 2.33 .020
____________________________________________________
Random-effects Estimate ____________________________________________________
Random intercept variance 43.4281 Level-1 residual variance 207.0721 ____________________________________________________
Math Pathways and Pitfalls 52
3/12/09
Table 10
Multilevel Analysis: Adjusted Mean Posttest Scores by Treatment Group and ELL Status
Cntrl Exp N of N of
Treatment by ELL
Interaction Treatment
Effect ELL
Effect Pretest by Treatment
ELL? Group Group Tchrs Students Sig? Sig? Sig? Sig? Grade 2
31 555 No Yes No No Yes Adj. Mean 59.44 69.58 SE (3.17) (3.11) No Adj. Mean 61.12 71.26 SE (2.29) (2.38)
Grade 4
36 755 No Yes No Yes Yes Adj. Mean 30.28 43.38 SE (2.63) (2.87) No Adj. Mean 32.29 45.40 SE (2.02) (2.40)
Math Pathways and Pitfalls 53
3/12/09
Table 10 (continued)
Cntrl Exp N of N of
Treatment by ELL
Interaction Treatment
Effect ELL
Effect Pretest by Treatment
ELL? Group Group Tchrs Students Sig? Sig? Sig? Sig?
Grade 6
29 555 Yes N/A N/A No Yes Adj. Mean 41.27 57.76 SE (3.46) (3.04) No Adj. Mean 49.84 56.13 SE (2.02) (2.04)


![The Effects of Math Pathways and Pitfalls on Students’ … · 2013. 8. 2. · [MPP NSF Final Report 070829.doc] i Printed 8/29/07 The Effects of Math Pathways and Pitfalls on Students’](https://img.pdfslide.us/doc/110x75/5fc70c23c97b484e48077016/the-effects-of-math-pathways-and-pitfalls-on-studentsa-2013-8-2-mpp-nsf.jpg)