Embed Size (px)
Citation preview
Math Anxiety: Not Just a Numbers Game
By
Heather Douglas
A thesis submitted to
the Faculty of Graduate and Postdoctoral Affairs
in partial fulfillment of the requirements of the degree
Master of Cognitive Science
Carleton University
Ottawa, Canada
©2015 Heather Douglas
ii
Abstract
Math anxiety can influence career choices, result in difficulties in everyday situations
involving numbers (e.g., financial decision making) and has been linked with performance
deficits on a variety of mathematical tasks. The roles of the classroom environment, societal
stereotypes and negative math attitudes have all been associated with math anxiety. Current
research suggests that children are developing math-related anxiety at a very young age,
leading some researchers to propose that foundational number skills may be related to the
development of anxiety about math. The goal of the present study was to develop a clearer,
more integrated understanding of the cognitive influences (i.e. attentional, spatial and
quantity skills) on math anxiety and math performance. The results showed that math anxiety
in adults is not related to deficits in the foundational number skills. Instead, both quantity
skills and math anxiety uniquely contributed to variance in math performance.
iii
Acknowledgements
I would like to take this opportunity to thank everyone who assisted and supported me
in completing my thesis. First, I would like to thank Dr. Jo-Anne LeFevre, my supervisor,
who provided ongoing guidance, support, good humour and excellent editing skills. I’m
looking forward to another four years of Dr. LeFevre’s insights and support as I continue
with my Ph.D.
Thanks to my thesis review committee of Dr. Monique Sènèchal and Dr. Deepthi
Kamawar who offered constructive feedback and understanding when plans changed. Thanks
also to my peers in the math cognition lab who have patiently advised me on statistical
methods and analysis. I would not have been able to complete as many tests without Kelsey
MacKay, a forever positive researcher and office mate, who helped gather and organize data.
And finally, thanks to my family. My family was a great help both in the field and at
home. Thanks to Stuart for developing and revising the MadMinute fluency assessment app,
Jillian for helping gather participants and both Ian and Amelia who were patient and
supportive sounding boards for ideas.
iv
Table of Contents
Abstract ……………………………………………………………………………………….ii
List of figures …………………………………………………………………………………v
List of tables ………………………………………………………………………………...vii
List of appendices……………………………………………………….………………….viii
Introduction ……………………………………………………….…………………………..1
Potential Risk Factors …………………………………………………………………..2
Current study ………………………………………………………………………….24
Method ………………………………………………………………………………………30
Participants ……………………………………………………………………………30
Materials and Procedures ……………………….……………………………….……30
Measures ……….………………………………………………………………….….31
Results ………………………………………………………………………………………41
Discussion ……………………………………………………………………….………….71
Limitations ……………………………………………………………………………75
Future Research ………………………………………………………………………77
Implications …………………………………………………………………………..79
Conclusion ………………………………………………………………………………….80
References …………………………………………………………………….…………….82
v
List of Figures
Figure 1. Model outlining the potential risk factors and effects of math anxiety……………2
Figure 2. Hypothesized model capturing the relationships between math anxiety, perceived
math competence and math performance……………………………………………………27
Figure 3. Model suggested by the literature illustrating the relationship between cognitive
math foundations, math anxiety and math performance …………………………………….28
Figure 4. Screen shot of iPad app Pathspan ………………………………………………...34
Figure 5. Sample stimuli from the number sets task. Target number is 5………………….37
Figure 6. Mental rotation task practice item from Peters (1995) …………………………..38
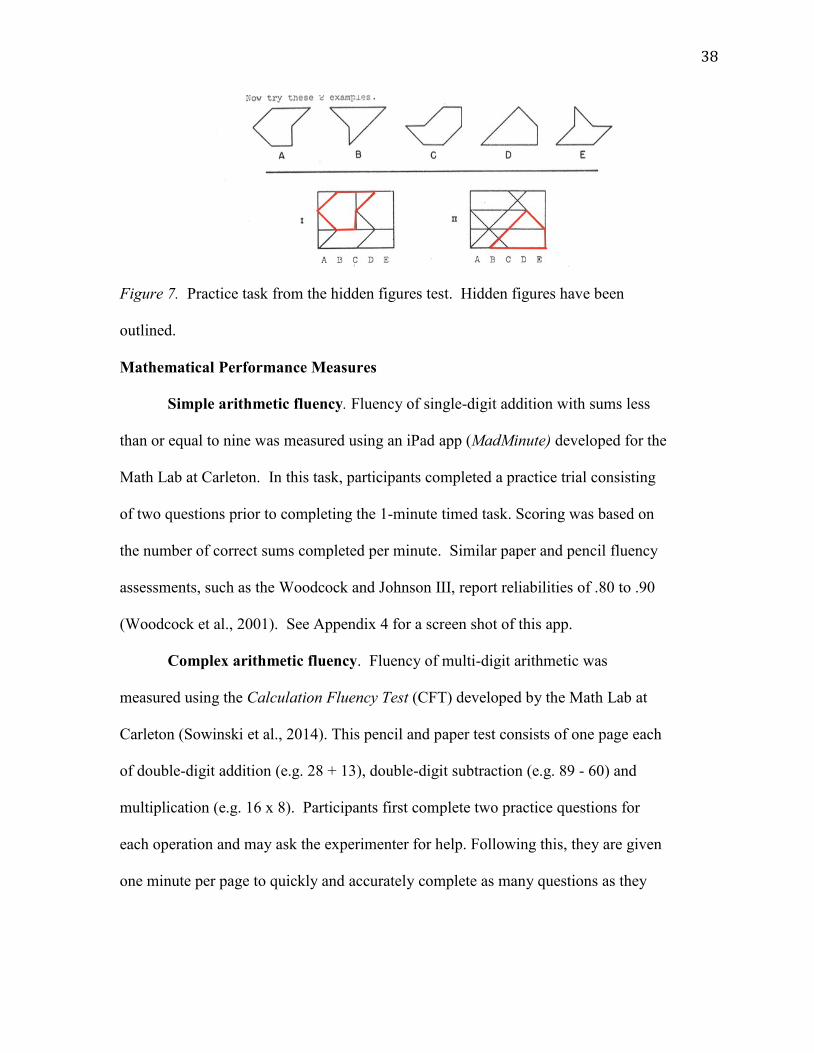
Figure 7. Practice task from the hidden figures test. Hidden figures have been
outlined………………………………………………………………………........................39
Figure 8. Scatter plot showing the relationship between perceived mathematical competence
as measured by PALS and math anxiety as measured by AMAS …………………………..52
Figure 9. Models of math anxiety as a predictor of mathematical performance, mediated by
perceived competence. Dotted lines represent non-significant predictor pathways; b’ is the
coefficient of the indirect effect of math anxiety on performance. The confidence interval for
the indirect effect is a BCa bootstrapped CI based on 1000 samples……………………….54
Figure 10. The distribution and comparison of standardized AMAS scores based on test
timing………………………………………………………………………………………...55
Figure 11: A comparison of mean math anxiety scores based on gender and test timing.
Error bars represent standard error on the mean…………………………………………….56
vi
Figure 12: The box plot distribution of men’s scores on the complex fluency task based on
AMAS test timing……………………………………………………………………….….58
Figure 13. Path model predicting quantitative processing controlling for digit span
backwards…………………………………………………………………………………....63
Figure 14: Linear model predicting performance on simple fluency……………………….67
Figure 15: Linear model predicting performance on complex fluency...…………………...68
Figure 16: Linear model predicting performance on procedural arithmetic……………...…69
vii
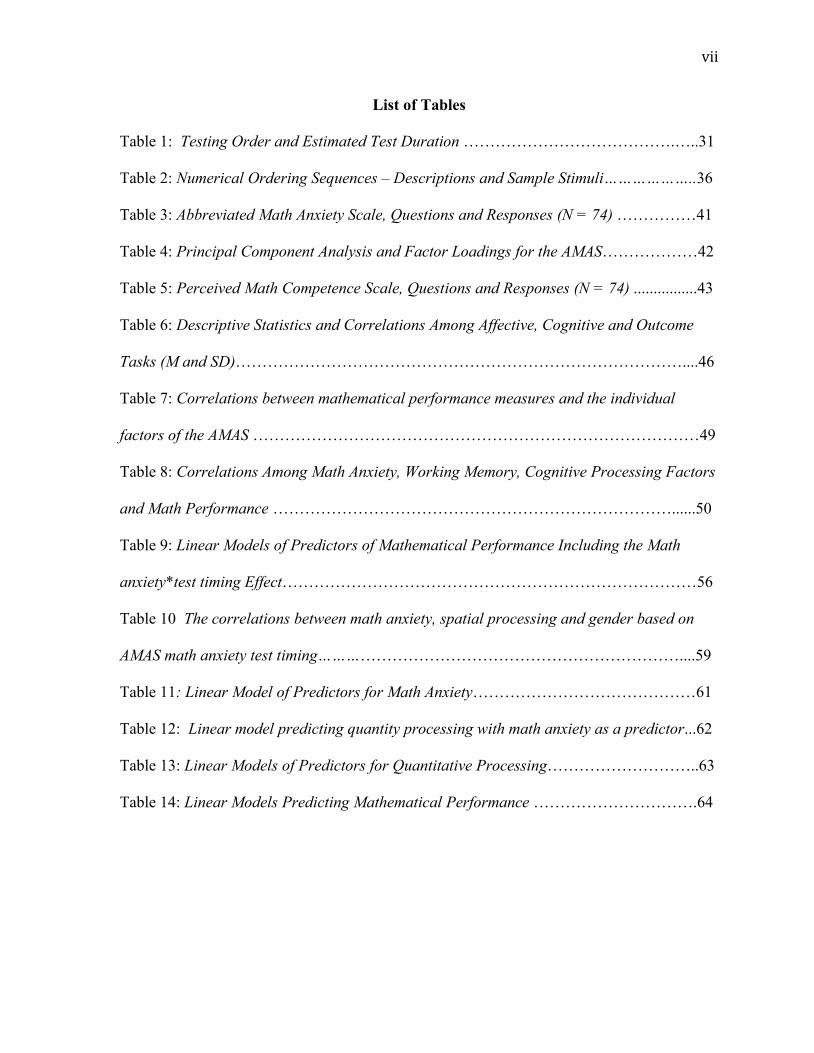
List of Tables
Table 1: Testing Order and Estimated Test Duration ………………………………….…..31
Table 2: Numerical Ordering Sequences – Descriptions and Sample Stimuli………………..36
Table 3: Abbreviated Math Anxiety Scale, Questions and Responses (N = 74) ……………41
Table 4: Principal Component Analysis and Factor Loadings for the AMAS………………42
Table 5: Perceived Math Competence Scale, Questions and Responses (N = 74) ................43
Table 6: Descriptive Statistics and Correlations Among Affective, Cognitive and Outcome
Tasks (M and SD)…………………………………………………………………………....46
Table 7: Correlations between mathematical performance measures and the individual
factors of the AMAS …………………………………………………………………………49
Table 8: Correlations Among Math Anxiety, Working Memory, Cognitive Processing Factors
and Math Performance …………………………………………………………………......50
Table 9: Linear Models of Predictors of Mathematical Performance Including the Math
anxiety*test timing Effect……………………………………………………………………56
Table 10 The correlations between math anxiety, spatial processing and gender based on
AMAS math anxiety test timing……………………………………………………………....59
Table 11: Linear Model of Predictors for Math Anxiety……………………………………61
Table 12: Linear model predicting quantity processing with math anxiety as a predictor...62
Table 13: Linear Models of Predictors for Quantitative Processing………………………..63
Table 14: Linear Models Predicting Mathematical Performance ………………………….64
viii
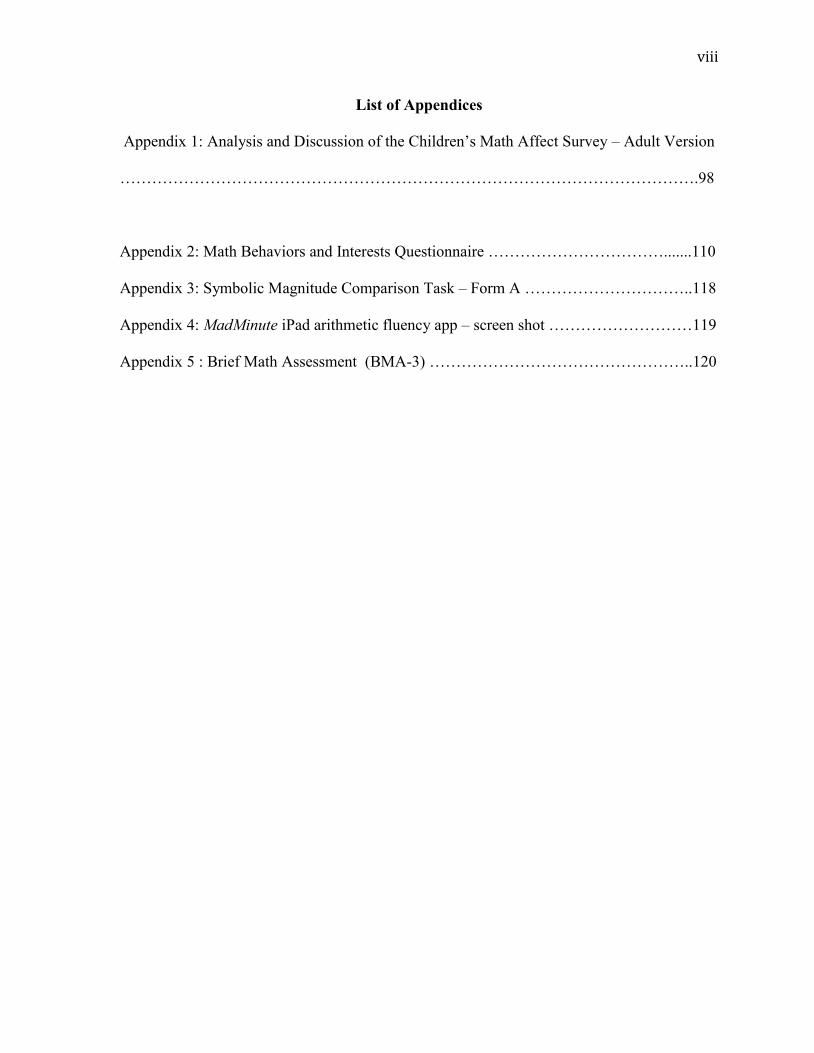
List of Appendices
Appendix 1: Analysis and Discussion of the Children’s Math Affect Survey – Adult Version
……………………………………………………………………………………………….98
Appendix 2: Math Behaviors and Interests Questionnaire …………………………….......110
Appendix 3: Symbolic Magnitude Comparison Task – Form A …………………………..118
Appendix 4: MadMinute iPad arithmetic fluency app – screen shot ………………………119
Appendix 5 : Brief Math Assessment (BMA-3) …………………………………………..120
1
Chapter 1: Introduction
Stephanie is an intelligent, well-spoken young woman currently completing a Masters
degree in International Affairs. Ask her about math, and you’ll discover she has some very
negative feelings about math and situations involving math. These feelings began in grade 2
when she started to feel math was difficult and that she “just didn’t get it”. Stephanie’s not
alone: Research suggests that children in grades one and two report feeling anxious about
mathematics (Harari et al., 2013; Ramirez et al., 2013; Vukovic et al., 2013). Ashcraft et al.
(2007) estimated1 that 1 in 5 adults experience math anxiety; that is “feelings of tension and
anxiety that interfere with the manipulation of numbers and the solving of mathematical
problems in a wide variety of ordinary life and academic situations” (Richardson & Suinn,
1972, p. 551). Considerable research has focused on the consequences of math anxiety in
adults (see Ashcraft & Ridley, 2005 for a discussion), such as poor performance and
avoidance of situations involving mathematics. There is, however, a gap in understanding
when it comes to risk factors for math anxiety. Ashcraft and Krause (2007) suggested that
math anxiety is caused by an accumulation and internalization of negative math experiences.
But what types of negative experiences lead young children to develop math anxiety? Is math
anxiety related to fundamental math deficits or to other environmental factors? This study
aimed to address part of that question by linking the research on foundational mathematical
processing with the math attitudes and performance observed in math anxious adults.
1 This estimate is based on the assumption that high math anxious individuals score one
standard deviation above the mean on a standard math anxiety scale. This works out to 17%
of the population, approximately 1 in 5.
2
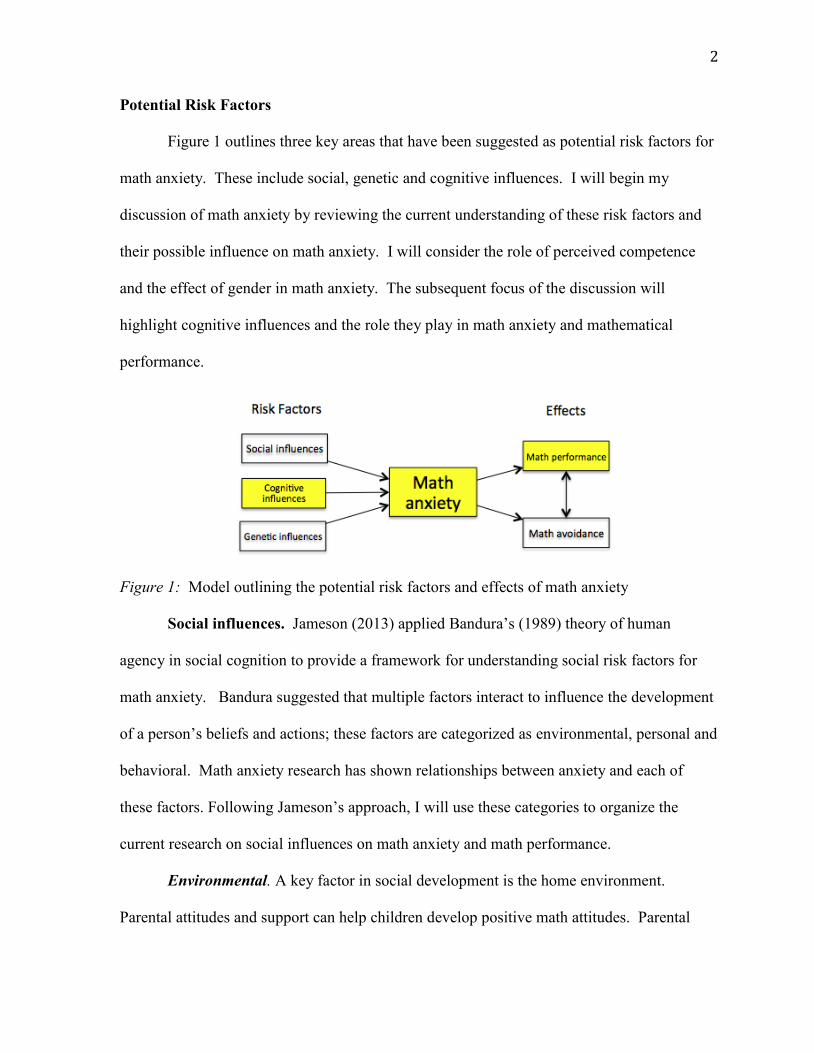
Potential Risk Factors
Figure 1 outlines three key areas that have been suggested as potential risk factors for
math anxiety. These include social, genetic and cognitive influences. I will begin my
discussion of math anxiety by reviewing the current understanding of these risk factors and
their possible influence on math anxiety. I will consider the role of perceived competence
and the effect of gender in math anxiety. The subsequent focus of the discussion will
highlight cognitive influences and the role they play in math anxiety and mathematical
performance.
Figure 1: Model outlining the potential risk factors and effects of math anxiety
Social influences. Jameson (2013) applied Bandura’s (1989) theory of human
agency in social cognition to provide a framework for understanding social risk factors for
math anxiety. Bandura suggested that multiple factors interact to influence the development
of a person’s beliefs and actions; these factors are categorized as environmental, personal and
behavioral. Math anxiety research has shown relationships between anxiety and each of
these factors. Following Jameson’s approach, I will use these categories to organize the
current research on social influences on math anxiety and math performance.
Environmental. A key factor in social development is the home environment.
Parental attitudes and support can help children develop positive math attitudes. Parental
3
involvement has been positively linked with learning early math concepts (LeFevre et al.,
2009; Skwarchuk, Sowinski, & LeFevre, 2014) that predict later academic achievement
(Duncan et al., 2007). Parental involvement can also influence a child’s attitudes and
behavior (Taylor, Clayton, & Rowley, 2004), self-efficacy, and motivation (Ahmed et al.,
2010; Hoover-Dempsey & Sander, 1995). Positive encouragement from parents has even
been linked to the pursuit of math-related careers (Bandura et al., 2001). In one of the few
studies on parental involvement and early math anxiety, Vukovic et al. (2013) demonstrated
that home learning environments that foster high expectations for children’s success in math
can reduce the negative effects of math anxiety. Older students who have internalized these
high expectations for success also report lower levels of math anxiety (Arnold, Fisher,
Doctoroff, & Dobbs, 2002; Meece, Wigfield, & Eccles, 1990). Similarly, Jameson (2013)
identified a positive relation between access to home resources and affect for grade 2
children. These studies suggest that supportive home environments can positively influence
children's feelings about mathematics. In contrast, negative parental attitudes, behaviors and
expectations towards math may be risk factors for math anxiety (Geist, 2010; Scarpello,
2007).
Behavioral. The role of teachers and school in math anxiety are considered
behavioral factors. One of the ways that children learn is through observing adults and then
internalizing and modeling those behaviors and attitudes (see Grusec, 1994). This process is
observed when children adopt the attitudes of their teachers or parents. For example, after
one year of being taught by a math anxious, female teacher, young girls’ gender-related
beliefs about whether girls are good at math shifted and their math performance declined
(Beilock et al., 2010). This finding suggests that math anxious teachers may adversely affect
4
some students’ math beliefs and learning. This relation between math attitudes of teachers
and their students is particularly worrisome because pre-service elementary school teachers
report higher levels of math anxiety than any other college major group (Hembree, 1990).
As well as relaying negative attitudes, math-anxious teachers have less math content
knowledge, a situation that may influence the quality of their teaching (Rayner et al., 2009).
Turner (2002) showed that distant, unsupportive teachers and poor classroom practices such
as demanding correctness lead students to avoid math and perform poorly. Ashcraft and
Ridley (2005) link this avoidance to math anxiety. This connection between anxiety and
avoidance is a concern because avoidance may undermine performance (Turner et al., 2002),
decrease student motivation (Elliot & McGregor, 1999) and lead to “stress in future
situations involving math” (Beilock & Ramirez, 2011). In summary, math-anxious, distant,
and unsupportive teachers are potential risk factors for math anxiety.
Personal. Personal factors include motivation, self-efficacy, perceived competence
and the role of gender. These personal factors are closely linked with both the social and
behavioral factors. For example, beliefs and behaviours of parents and teachers, for example,
whether these adults are supportive of children's learning, can potentially exacerbate or
interact with these personal factors, thus influencing subsequent academic performance (for a
discussion see Ahmed et al., 2010). Zakaria and Nordin (2007) examined the relation
between math anxiety, motivation and performance in 88 senior Malaysian high school
students and found a strong (r=-.72) negative correlation between motivation and math
anxiety. We cannot draw any causal conclusions from this work but it is an indication that
low motivation and math anxiety are related.
5
Self-efficacy refers to students' beliefs in their ability to organize and implement the
actions required to effectively reach their goals (Pajares & Schunk, 2001). Math self-efficacy
is a significant predictor of math anxiety (Pajares & Miller, 1994; Hackett, 1985). Bandura
(1997) offered an explanation for this relation. He hypothesized that self-efficacy beliefs are
informed by emotional and physiological states such as anxiety. For example, a math
anxious student will have a physiological reaction (such as increased heart rate) when their
anxiety is aroused, as in writing a math test. The student may then associate this
physiological response with situations where they performed poorly in the past thereby
interpreting the reaction as an indicator of their competence. Thus high anxiety may
undermine self-efficacy and perceived abilities. Self-efficacy also plays a critical role in
influencing student motivation and shaping children’s career trajectories (Bandura, 1993;
Bandura, Barbaranelli, Caprara, & Pastorelli, 2001; Pajares, 1996). It seems reasonable these
three personal influences, motivation, self-efficacy, and perceived abilities are closely linked.
Perceived academic competence. Perceived competence (also referred to as perceived
ability) is a motivational belief strongly related to self-efficacy. Eccles et al. (1998) argued
that it is the most critical element in self-efficacy beliefs. Perceived competence is also
strongly related to math anxiety (Meece, Wigfield, & Eccles, 1990) but there is a lack of
agreement on whether perceived competence is a distinct construct from math anxiety.
Wigfield and Meece (1988) suggested that it is. Bong and Skaalvik (2003) agreed, arguing
that perceived competence targets a cognitive dimension of self whereas anxiety targets an
affective dimension of self, thus defining the two as distinct constructs. Others (e.g. Pajares
& Kranzler, 1995) suggest these constructs are difficult to distinguish when assessed within
one domain such as mathematics and used to predict math performance (for a discussion see
6
Lee, 2009).. Randhawa et al. (1993) found math self-efficacy mediated the effect of math
attitudes on performance. There is however a lack of published research directly analyzing
the influence and interaction of perceived math competence in relation to math anxiety and
math performance.
Elliot (1999) argued that a student with a high degree of perceived competence will
reframe an anxiety-inducing situation as a challenge whereas a student with low perceived
competence may interpret the same situation as a threat. This “reframing” of their anxiety as
a function of perceived competence would encourage the highly competent student to tackle
the math but encourage the low competence student to avoid the math, with obvious
consequences for subsequent learning and performance. Consider the anxiety reaction as a
balancing act with approach on one side, and avoidance on the other. High perceived
competence can tilt the balance in favor of an approach reaction.
This theory provides a rationale describing how perceived competence can influence
the math anxiety and math performance relationship. This hypothesis was tested in the
current study by assessing if perceived math competence mediated the anxiety and
performance relationship. Based on the similarities between self-efficacy and perceived
competence, I hypothesized that perceived math competence would mediate the effects of
math anxiety on performance much like the mediation effect of math self-efficacy on math
attitudes and performance observed by Randhawa et al. (1993). A lack of mediation will
suggest that math anxiety and perceived competence are overlapping constructs, too similar
to differentiate their individual effects on math performance.
Gender. Data varies when it comes to comparing math anxiety levels between men
and women. In a meta-analysis involving 151 studies, Hembree (1990) found that women
7
reported significantly higher rates of math anxiety than men. More recently, other
researchers have observed a similar difference (Devine, Fawcett, Szűcs, & Dowker, 2012;
Maloney, Waechter, Risko, & Fugelsang, 2012). The interpretation of the source of these
differences is controversial, however. For example, Ashcraft et al. (2002) suggested that
gender differences occur because women are simply more likely to report math anxiety than
men. In contrast, Beilock and colleagues attributed gender differences to the effect of social
stereotyping on women’s math attitudes (Beilock et al., 2007). Maloney et al. (2012)
claimed gender differences in math anxiety were related to gender differences in spatial
skills. Other researchers do not report significant gender differences (e.g. Jameson, 2013;
Jansen et al., 2013; Ma, 1999). These variable findings suggest that it is important to explore
individual differences other than gender that may influence math anxiety.
Goetz et al. (2013) have provided a plausible explanation for the discrepancy across
studies in terms of gender differences. In two different studies involving students from
grades 5 through 11, they compared students’ math trait (i.e., anticipatory) anxiety with their
math state (i.e., in the moment) anxiety. Anxiety was measured in a test environment (Study
1) and classroom-learning environment (Study 2). In both scenarios, girls reported
significantly higher math trait anxiety than men prior to engaging in the math activity. When
anxiety was assessed during the math activity however (state anxiety), there were no
significant gender effects. These results suggest that women report greater anxiety than men
anticipating math (consistent with Ashcraft et al., 2002), but during test taking and classroom
learning men and women report similar levels of anxiety. Many of the published math
anxiety studies assess participants' math anxiety prior to the research, often preselecting
participants for high and low math anxiety (e.g., Maloney et al., 2010; 2011; 2012). This
8
assessment method is therefore more likely to reflect math trait anxiety and, based on
Goetz’s hypothesis, may be more likely to elicit a gender effect.
I tested Goetz's hypothesis about the relation between gender and anxiety by
manipulating when participants complete the anxiety assessment. One group completed the
AMAS math survey before doing the math measures and another group completed the
AMAS after the math measures. Using this design, the same set of questions was used in
both conditions thus providing a consistent comparison tool. Math anxiety levels by gender
both pre (anticipatory or trait) and immediately post (state) the math assessments were
compared. I predicted women will report higher trait but comparable state anxiety as the
men.
Genetic influences. Math anxiety is a multi-component construct that is moderately
related to state (r=. 42) and trait (r=.38) anxiety (reported in Ashcraft, Krause, & Hopko,
2007). In Hembree’s (1990) meta-analysis, a somewhat stronger link was observed, in that
approximately one third of the variance in math anxiety was shared with test anxiety. These
findings suggest that math anxiety will be more prevalent in individuals predisposed to
anxiety. Consistent with this view, Wang et al. (2014) found that genetic influences related
to general anxiety are moderate risk factors for math anxiety based on the results for 257 twin
pairs. Clearly, however, these moderate relations between general and math-specific anxiety
suggest that there are other important factors that need to be identified, either genetic or
environmental, that may predispose children to develop math-specific anxiety.
Cognitive influences. Extensive research into the cognitive foundations of
mathematical learning led to the development of the Pathways model of mathematical
cognition (LeFevre et al., 2010). The Pathways model describes three cognitive skill sets
9
that contribute to early mathematical learning: linguistic, spatial/attentional and quantitative.
Early linguistic and spatial skills predict foundational understanding of the symbolic number
system and the spatial and quantitative skills predict foundational understanding of numerical
magnitude. These foundations form the building blocks for subsequent mathematical learning
in school. To examine the role of these cognitive influences on math anxiety, first I discuss
the broader research on relations between math performance and math anxiety. Then I
address the specific cognitive predictors of math performance identified in the Pathways
model, and their relations to both mathematical outcomes and math anxiety.
The relations between these cognitive building blocks and early math performance
are well established, however, there is some controversy on whether these cognitive building
blocks also influence the development of math anxiety. Maloney and colleagues (2010; 2011;
2012) suggested that deficits in early quantitative and spatial skills predispose a child to math
anxiety. Their rationale is that foundational deficits in these quantitative and spatial skills
can lead to poor math achievement on even very basic mathematical measures, which in turn
leads to negative math experiences that are a risk factor for math anxiety. This argument
proposes that poor math achievement on very basic mathematical tasks is a risk factor for
subsequent development of math anxiety.
Currently, there is some debate on whether it is more likely that poor achievement
causes math anxiety or math anxiety causes poor achievement. According to Hembree
(1990), math anxiety causes poor performance. He concluded this based on two observations.
First, math anxiety is not significantly related to IQ (r = -.06) when math questions are
excluded from the IQ test. This minimal relation suggests that IQ levels of math-anxious
10
adults are comparable to those of non-math-anxious adults when math anxiety is not aroused.
Hopko, Crittendon, Grant and Wilson (2005) also noted that performance deficits in
IQ testing are predicted by test anxiety. That is, the mere act of taking the IQ test arouses
anxiety and thus performance is impaired. Accordingly, IQ scores are a reflection of both
test anxiety and of the cognitive and genetic factors that are related to intelligence. Second,
math-anxious adults treated with behavior intervention therapy and no additional math
training demonstrated comparable math performance to non-math-anxious adults (Hembree,
1990), supporting the view that anxiety interfered with performance, thus masking
competence. Park, Ramirez and Beilock (2014) noted a similar improvement in math
performance after adults participated in an expressive writing intervention that is designed to
reduce negative cognitions. In this writing exercise, participants wrote about their thoughts
and feelings related to a test they were about to complete. Sheffield and Hunt (2006)
observed reduced anxiety and improved performance in children after training on relaxation
breathing techniques and Field et al. (1996) measured anxiety reductions and improved speed
and accuracy on math computations in math anxious adults following massage therapy. In all
these experiments, treating the anxiety appeared to improve the performance.
On the other side of the debate are Ma and Xu (2004). Their results come the closest
to addressing causality in relation to the development of math anxiety. In a longitudinal
cross-lagged study involving American junior and senior high school students, they
compared math anxiety with math achievement. Ma and Xu found that prior low math
achievement related to later math anxiety but prior high math anxiety did not relate to later
math achievement. This analysis supports a causal link between low achievement and math
anxiety and positions low achievement as a potential risk factor for math anxiety. Further,
11
deficits in foundational processes relate to low achievement (Butterworth, 2008; Rubinstein
& Tannock, 2010) thus Maloney’s hypothesis extends this finding suggesting foundational
deficits are a risk factor for poor performance and hence a risk factor for math anxiety.
To frame the argument that early foundational processes may influence math anxiety,
I will discuss the cognitive pathways that contribute to mathematical learning and
performance outcomes as identified in the Pathways model (LeFevre et al., 2010; Sowinski et
al., 2015). These are linguistic/symbolic, spatial/attentional, and quantitative. I will focus
my discussion first on the domain-general spatial/attentional precursors and then consider the
domain-specific quantitative precursors. In each section, the role of these processes in
mathematical performance and math anxiety will be reviewed.
Attentional factors. Attention, and more specifically working memory, is an
important factor in mathematical performance (see reviews by DeStefano & LeFevre, 2004;
Raghubar et al., 2010, and LeFevre, DeStefano, Coleman & Shanahan, 2005). Clearly,
working memory is implicated in mathematics because the latter is a complex cognitive task,
however, it may also be involved in the relations among math anxiety and performance
because math anxiety has been shown to consume working memory capacity, thus depriving
cognitive processes of this resource (Ashcraft & Krause, 2007; Ashcraft & Moore, 2009;
Beilock, 2008; Beilock & DeCaro, 2007; Lyons & Beilock; 2012). Further, attentional shifts
and other processes related to executive function (e.g. executing goal-directed behavior,
inhibiting irrelevant information) have been identified as important in mathematical
performance (LeFevre et al., 2013) and implicated in math anxiety (Hopko et al., 1998;
Hopko et al., 2002; Pletzer et al., 2015).
12
Accordingly, working memory is disrupted in math anxious students when their
anxiety is aroused whereas non-anxious individuals are not affected. Ashcraft and Kirk
(2001) demonstrated this pattern in a dual-task study. Participants completed 2-column
addition problems while maintaining a memory load of up to six letters. High math-anxious
participants performed worse than less math-anxious participants on the math task as the
letter load increased (Ashcraft & Kirk, 2001). In a related study, Beilock et al. (2004) placed
participants in two groups: a low-pressure control group and an anxiety-inducing test group
(e.g., they were told their performance was being videotaped, there were monetary
incentives, and they were responsible for a partner’s winning or losing). Performance was
worse on tasks with high WM demands in the anxiety-inducing test group, further supporting
the view that anxiety compromises working memory leaving fewer resources available for
task performance.
Hopko et al. (1998) attribute this working memory consumption to difficulties
inhibiting the negative thoughts and emotions associated with anxiety. Hopko et al. (2002)
demonstrated this inhibitory effect with a numerical Stroop task. Participants were presented
with cards that contained between 1 to 9 numbers. For example, the card might have six
number “2”s, four number “3”s, five number “4”s etc. High math-anxious individuals were
slower and less accurate identifying the quantity of digits than low math-anxious individuals.
No differences between groups were detected in the standard color-naming Stroop paradigm.
This pattern suggests that inhibitory control is impaired in math-anxious individuals when
they are working with numbers. Neurological support for impaired inhibition in math-
anxious individuals comes in a recent fMRI study by Pletzer et al. (2015). Pletzer and
colleagues found when participants compared numerical magnitudes, low-math anxious

13
individuals deactivated (or inhibited) brain areas associated with introspection and emotion
processing. High-math anxious individuals however, did not demonstrate inhibition in these
areas. Hence, working memory needs to be considered when evaluating the relationship
between math anxiety and math performance.
In the expanded Pathways model (Sowinski et al., 2015), three working memory
measures were assessed and reduced to capture the spatial/attentional pathway: forward digit
span, backward digit span, and spatial span. This expanded pathway was renamed the
working memory pathway. Consistent with Baddeley and Hitch’s model of working memory
(described in Baddeley et al., 2009), forward digit span tapped the phonological loop,
backward digit span tapped the phonological loop and the central executive, and spatial span
tapped the visual-spatial sketchpad. Given the findings supporting a relationship between
working memory, math performance and math anxiety, and the application of these three
working memory measures in the Pathways model, these measures were used in the current
study.
Spatial factors. Spatial abilities are related to early math learning, later math
achievement (Mix & Cheng, 2012), and to participation and success in science- and
engineering-related fields (Wai et al., 2009). The correlation between spatial and
mathematical skills among children is well established (e.g. Gunderson, Ramirez, Beilock, &
Levine, 2012; Rotzer et al., 2009). For example, in a study of 157 children in grades two and
three, LeFevre et al. (2013) found positive correlations between spatial span measures,
arithmetic skills, and number system knowledge. The Pathways model (LeFevre et al., 2010)
further supports the role of spatial processing as a cognitive foundation of math learning.
Because of this strong relation between spatial processing and math performance, spatial
14
processing should be considered a potential influence on the relations between math anxiety
and math performance.
Spatial abilities are not clearly delineated in the literature. Wai et al. (2009) have
identified them as, “reasoning with figures and shapes”. This definition however, covers a
broad range of skills. Classifying the distinct factors or subcomponents related to spatial
abilities has been the approach of most researchers (Mix & Cheng, 2012; Uttal et al., 2012).
Uttal (2012) distinguishes between intrinsic and extrinsic spatial information. Intrinsic
information specifies the “parts and relations between the parts that define a particular
object.” Extrinsic information refers to “the relation among objects in a group, relative to
one another or to an overall framework.” These distinctions correspond to Hegarty’s (2006)
categorization of spatial abilities as small- and large-scale skills, where small scale refers to
single objects that require a mental transformation such as a mental rotation or shape
manipulation (intrinsic) and large scale refers to relations among objects and navigation
through space such as map reading or perspective taking (extrinsic). I discuss the current
research on the relations among spatial processing, math performance, and math anxiety
using Hegarty’s categorization as a framework.
Small-scale spatial processing skills linked to math development and performance
includes a) spatial visualization, b) mental rotation, and c) disembedding (Mix & Cheng,
2012). Spatial visualization involves mental transformations of 2-dimensional and 3-
dimensional objects and disembedding refers to finding figures in distracting backgrounds.
Large-scale spatial skills such as map reading and perspective taking have not been linked to
math performance but have been assessed in terms of math anxiety so are discussed.
15
a) Small-scale processing: Spatial visualization. Miller and Bichsel (2004) were the
first to examine a link between spatial visualization and math anxiety. In their study,
participants looked at an image of a piece of paper on a computer screen. The paper had
been folded either 1, 2, or 3 times and then punched with a hole-punch. Participants had to
determine how the paper would look unfolded. This task correlated with performance on
basic (r=33) and applied (r= .27) math and was a significant predictor of both mathematical
measures, independent of verbal working memory and math anxiety. Math-anxious adults
also performed significantly worse on this spatial visualization task than non-anxious adults
whereas they showed no significant performance differences on a verbal working memory
measure. Miller and Bichsel concluded that math anxiety was primarily linked to spatial
working memory resources 2
(indexed by the paper-folding task), compared to verbal
working memory resources.
Maloney et al. (2012) also considered the relation between spatial imagery and math
anxiety. In two experiments, Maloney et al. surveyed approximately 370 adults on their math
anxiety levels and self-reported spatial imagery skills and interests. Math anxiety was
negatively related to self-reported spatial imagery skills and interests (Experiment 1, (118)
= -.45; Experiment 2, (249) = -.38). Further, self-reported spatial skills mediated the
relation between gender and math anxiety. Based on these findings, they posited that spatial
processing was a potential risk factor for math anxiety and that poor spatial skills accounted,
in part, for gender differences in math anxiety because women generally have poorer spatial
skills than men (Uttal et al., 2012; Voyer et al., 1995). Maloney et al. also hypothesized that
2 Miller and Bichsel (2004) identified this task as a visual spatial working memory task.
Subsequent research into categorizing spatial abilities defined the paper folding task as a
spatial visualization task (Mix & Cheng, 2012)
16
math performance in adults would mediate the relation between gender and math anxiety,
although this hypothesis was not tested. I would not anticipate mediation in this direction
because a considerable body of research finds that gender and math performance are
unrelated (Hembree, 1990). Thus, although women are more likely to be math anxious than
men (at least under some conditions), math performance is typically not related to gender and
so it could not function as a mediator.
b) Small scale spatial processing: Mental rotation. Ferguson, Maloney, Fugelsang,
and Risko (2015) conducted four different experiments in which they assessed relations
between spatial processing and math anxiety. Mental rotation skills (a spatial skill related to
math performance) were measured using the Visualization of Rotations Section of the Revised
Purdue Spatial Visualization Test. In this computerized task, participants are shown two
images of a 3-dimensional object: the second image is a rotated version of the first image
(e.g., a 90o rotation).
The task is to mentally rotate a different 3-dimensional object to the
same degree (e.g., 90o) and choose the image that corresponds to the rotation of this different
object. Participants were given 5 rotated images to choose from. Mental rotation correlated
weakly but significantly with math anxiety in Experiment 3 (r=-.22) and Experiment 4 (r=-
.18). Mental rotation mediated the relation between the effects of large-scale spatial
predictors in Experiment 4 (e.g., self-reported sense of direction and the money test of
directional sense) and math anxiety. This pattern supports Maloney’s hypothesis that there is
a relation between math anxiety and spatial processing.
Maloney et al. (2012) found that self-reported spatial skills fully mediated the gender
and math anxiety relationship. In two experiments trying to replicate this work using a
mental rotation task as opposed to self-reports as the measure of spatial abilities, gender was
17
not consistently correlated with math anxiety (supporting the inconsistent gender effect
referred to earlier) thus limiting the possibility for mediation. Ferguson et al. therefore
combined results of these two experiments (thus obtaining a significant correlation between
gender and mental rotation) and reported a partial mediation of mental rotation of the gender
and math anxiety relationship. Interestingly, full mediation occurred when self-reported
spatial anxiety was entered into the model. This pattern suggests that it is self-reporting of
spatial skills and spatial anxiety that is most strongly linked with the gender and math anxiety
relationship, not actual spatial abilities. These inconsistencies support the use of multiple
behavioral measures of small-scale spatial processing to cover a broader range of the
spatial/math anxiety relationship.
c) Small-scale spatial processing: Disembedding. A moderate correlation between
performance on disembedding tasks such as the hidden figures task, and math scores has
been observed in children in kindergarten and grade two (Mazzocco & Myers, 2003; Vaidya
& Chansky, 1980) and children in grades 5 and 6 (Guay & McDaniel, 1977). There is
currently no published work, to my knowledge, on disembedding and math anxiety. In the
current study, the hidden figures task was included as a measure of disembedding to broaden
the range of small-scale processing measures.
Large scale spatial processing: Map reading and sense of direction. Ferguson et al.
(2014) examined the relation between large-scale spatial processing and math anxiety using
two large-scale spatial processing measures, a sense-of direction survey and the money test.
The money test is an online task (adapted by Ferguson et al.) where participants were shown
a street map with paths labeled either L for left, or R for right. Some turns were labeled
incorrectly. The participants imagine they are walking the path and note if the turn is labeled
18
correctly or incorrectly. Although Ferguson et al. reported weak correlations between math
anxiety and self-reported sense-of-direction (i.e., Experiment 1, r (2057) = -.21, Experiment
2, r (251) = - .17, and Experiment 4, r (255) =-.17), self-reported sense of direction was not
predictive of math anxiety when gender and general anxiety were control variables.
Similarly, the money test weakly correlated with math anxiety (Experiment 3, r=-.13;
Experiment 4, r=-.19) but was not predictive of math anxiety when gender and general
anxiety were control variables. If spatial processing is related to math anxiety, it is expected
that the spatial skills that relate to math performance, such as small-scale spatial processes
(e.g. mental rotation task, disembedding), would be the spatial skills related to math anxiety.
Because Mix and Cheng (2012) noted a lack of relation between map reading and
mathematics, I would not anticipate a relation between Ferguson et al.’s map reading related
tasks and math anxiety and thus did not assess large-scale spatial skills in the present
research.
There are a number of limitations in the existing research that links spatial processing
and math anxiety. First, in Maloney et al. (2012), spatial processing was not measured
directly -- only self-reported spatial abilities were assessed. This limitation was addressed in
Ferguson et al. (2015). Second, in Ferguson et al., results were not consistent across the four
experiments. Third, math performance was not measured in either Maloney et al. or Ferguson
et al. and so any hypothesis about relations to math performance were untested. Accordingly,
to better understand the role of spatial processing in math anxiety, we must consider the
aspects of spatial processing related to math performance.
Quantitative factors. Foundational quantity knowledge includes an understanding of
absolute and relative magnitude. Quantity can be represented either concretely, that is, non-
19
symbolically (e.g. dots, shapes, objects) or symbolically (Arabic digits). Quantitative
processing of non-symbolic numbers starts early: Five-month-old infants can differentiate
non-symbolic quantities such as two and three items (Starkey & Cooper, 1980). Infants can
also recognize when small quantities do not add up. For example, if the infant is shown two
items and then one more is added, they are surprised if the total number of items is not three
(Wynn, 1992). This early recognition of non-symbolic quantity is thought to scaffold the
understanding of digits and the quantity they represent. (e.g., 3 mapped to ***) (for
discussion see Ansari, 2008). Although the non-symbolic quantity may initially be mapped
to symbolic number knowledge and thus show mutual facilitation, beyond kindergarten,
research has shown that it is children's knowledge and performance in symbolic processing
tasks that accounts for the majority of variance in their arithmetic abilities (Holloway &
Ansari, 2009; Lyons et al., 2014). I will therefore focus my analysis on symbolic quantity
processing.
The quantitative precursors in the Pathways Model (LeFevre et al., 2010; Sowinski et
al., 2015) included measures of subitizing, counting, and symbolic magnitude comparison.
All three of these quantitative precursors have been assessed in current math anxiety research
and correlations between math anxiety and both counting and symbolic magnitude
comparison have been found (Maloney et al., 2010; 2011). In the current research, measures
involving counting and symbolic magnitude comparison were included. I will now review
Geary’s view of the structure of quantity knowledge to organize additional quantitative
precursor skills. I will then use this organization to review the literature on these symbolic
quantity measures and their relation to math performance and then discuss how these
measures have been used in math anxiety research.
20
Geary (2013) identifies four aspects of quantity knowledge that relate to early
learning: (a) a sense of magnitude, (b) an understanding of the logical relation among
quantities, (c) fluent mapping of quantities and digits and (d) the ability to operate on
symbols. Although these aspects are not totally distinct, to differentiate widely used symbolic
quantity measures, I have organized them based on Geary’s four classifications.
Symbolic quantity measures and math performance.
a) Magnitude comparison tasks require individuals to discern which quantity is larger
(e.g., 6 or 9). In symbolic magnitude comparison tasks, participants are typically rated on
their speed and accuracy of response (e.g., DeSmedt et al., 2009; Sasanguie et al., 2011).
Symbolic magnitude comparison tasks predict later math performance in young children
(e.g., DeSmedt et al., 2009; Lyons et al., 2014) and correlate with current math performance
in children and adults (Fazio et al., 2014; Holloway & Ansari, 2009; Nosworthy et al., 2013;
Vanbinst et al., 2012). These tasks target knowledge of magnitude through comparison.
b) The ability to order relative magnitudes indicates an understanding of the relation
among quantities (Geary, 2013). Order judgment tasks involve looking at a sequence of
numbers and quickly and accurately judging if the sequence is ordered (e.g. 4 5 7 or 7 5 4) or
unordered (e.g. 4 7 5 or 7 4 5). In a pivotal paper outlining the relative contribution of
various quantitative tasks in predicting arithmetic performance, Lyons et al. (2014) found
that as children get older, ordinal tasks become a stronger predictor of performance than
magnitude comparison tasks. This ability to quickly judge whether a set of digits is ordered is
thought to be an important precursor or building block for complex arithmetic (Lyons &
Beilock, 2011). These tasks are a measure of quantity knowledge that relies on participants'
order judgments.
21
c) and d) The number sets task was designed to capture both mapping skills and the
ability to operate with digits thus including competencies in counting and simple arithmetic
(Geary, 2007). This task was developed as a potential screening tool for identifying children
at risk for mathematical learning disability. It has not, until now, been used as a measure in
math anxiety research. It may however be a useful tool as competencies in simple arithmetic
and counting have been correlated with math anxiety. For example, Faust, Ashcraft and
Fleck (1996) found differences in judging simple addition problems between high- and low-
math-anxious participants, and Maloney et al. (2010) found high-math-anxious adults were
slower enumerating quantities than low-math-anxious adults.
Symbolic quantity measures and math anxiety. Faust et al. (1996) were the first to
propose a link between symbolic quantity processing and math anxiety. In a study on
addition and math anxiety, young adults were asked to verify the solution of simple (e.g.,
7+9=15) and complex addition problems (e.g., 35+26). High math anxious participants were
slower at reporting false responses and became less accurate in their judgments as the
solutions became less plausible (e.g., 7+9=39). Faust et al. suggested this reflected a deficit
in basic quantity representation.
Maloney et al. (2010; 2011) extended this research by looking specifically at
performance on counting and magnitude comparison tasks in math-anxious adults.
In Maloney et al. (2010), participants were shown a computer screen with anywhere from 1
to 9 boxes. They responded by stating the number of boxes displayed. High math anxious
adults were slower enumerating increasing quantities in the counting range (5–9) than low
math anxious adults whereas there was no difference in the subitizing range (1-4). According
to Maloney, this slower response time in the counting range indicates math anxiety is related
22
to a low level deficit in counting, an index of quantity processing. The small effect size
(ɲ2=0.10) however suggests that additional factors account for the majority of the variance in
counting performance.
In magnitude comparison tasks, high math-anxious participants demonstrated a larger
numerical distance effect than low math-anxious participants (Maloney et al., 2011). The
numerical distance effect is that people are slower to make magnitude judgments when
numbers are close (e.g., 4 vs. 5, or 4 vs. 6) than when they are farther apart (e.g., 4 vs. 7 or 4
vs. 8; Dehaene et al., 1990; Holloway & Ansari, 2009). The distance effect has been
attributed to overlapping representations of closer quantities. For example, 3 and 4 have a
more similar mental representation than 3 and 9 (Holloway & Ansari, 2009). An increased
distance effect for math-anxious participants was observed under two experimental
conditions; identifying if a target number was greater or less than five (Experiment 1) and
comparing two digits and identifying the larger digit (Experiment 2). Maloney et al.
concluded that math anxious participants have a less precise numerical representation as
evidenced by performance differences in magnitude comparison tasks. Nunez-Pena and
Suarez-Pellicioni (2014) replicated this result, finding a marginally larger distance effect in
high- versus low-math-anxious participants but again, the effect size was small (ɲp2=.07).
Maloney and colleagues interpreted these studies as evidence that deficits in quantity
processing may be a risk factor in math anxiety. There are however some limitations that
temper this conclusion. First, in the counting study (Maloney et al., 2010), the high math
anxious group also performed worse on a verbal working memory task than the low anxious
group. When working memory was controlled, there was no effect of math anxiety on
enumeration of sets. This pattern supports the hypothesis that working memory capacity

23
mediates the relation between math anxiety and enumeration. However, because working
memory was not assessed in the magnitude comparison studies (Maloney et al., 2011; 2012),
the hypothesis that the relations between quantity processing and math anxiety are mediated
by working memory was not tested. More generally, results of each study are based on only
one quantity measure, either counting or magnitude comparison. Multiple measures of
quantity would better index quantity processing. These limitations were addressed in the
current research.
Limitations in the research on cognitive foundations and math anxiety. To integrate
the research on foundational factors related to math anxiety, limitations in the existing
research must be addressed. One of the biggest limitations is that the foundational predictors
(spatial processing and quantity processing) have been studied independently with respect to
math anxiety. The Pathways model (LeFevre et al., 2010; Sowinski et al., 2015) supports a
shared influence between spatial/attentional and quantity processing and math performance
As these processes are likely related, they should be considered together so any relation
between the two processes can be examined. To address this limitation, attentional factors,
spatial factors, and quantity factors were assessed in the current research.
Another limitation was the use of single measures to capture processing skills. For
example, spatial skills were measured with either a survey or mental rotation task and
quantitative skills were measured either by counting or symbolic magnitude comparisons.
This assumes that spatial processes and quantitative processes can be captured by a single
task. The current research uses multiple measures to index each of attentional, spatial, and
quantity processing. Two measures were also used to assess math anxiety.
24
A final aspect to consider is the interpretation of results. To test the hypothesis that
deficits in foundational processes relate to poor performance, and as such, are a risk factor
for math anxiety, longitudinal research is necessary. However, in the absence of longitudinal
data, research that measures all of the factors that have been proposed as potential mediators
of the relations between math anxiety and performance, that is, foundational factors, spatial
abilities, math anxiety and math performance will provide additional information on the
relationship between these predictors and outcomes. The current research included multiple
measures of math performance.
The Current Study
The goal of the present study was to develop a clearer understanding of the risk
factors associated with math anxiety by linking the research on foundational mathematical
processing with the math attitudes and performance observed in math-anxious adults. Target
risk factors included perceived competence, gender, attentional factors, spatial processing
and symbolic quantity processing. Gaps in the existing research and untested hypotheses
were identified and assessed. The primary aims were to address the questions of whether
math anxiety was related to basic quantitative deficits in foundational math processing and
the extent to which the relation between foundational skills and performance is mediated by
math anxiety.
Before specifically addressing these gaps and untested hypotheses, I will briefly
summarize the test measures that have been included in the present study. Math attitudes
were assessed with two math anxiety surveys and a survey on perceived math competence.
The primary math anxiety survey used in the data analysis was the abbreviated math anxiety
survey (AMAS) developed by Hopko et al. (2003). The AMAS has been used extensively in
25
math anxiety research and was the measure used by Maloney et al. (2010; 2011; 2012) thus it
allowed me to captured the same elements of math anxiety as in these previous studies.
Foundational mathematical processing included attentional factors, and spatial and
symbolic quantity processing. Multiple measures were used in each of these areas; working
memory/attention was assessed using the forward digit span, backward digit span, and spatial
span. Spatial processing was measured with a mental rotation task and the hidden figures
task. Symbolic quantity processing included magnitude comparison, number-ordering
judgments, and the number sets task. Math performance was tested with three measures,
simple fluency (e.g., 3+6), complex fluency (e.g., 37-18) and procedural arithmetic (e.g., 8¼
- 5⅔). These measures are discussed in greater depth in the methods section however the
measurement of anxiety is discussed below.
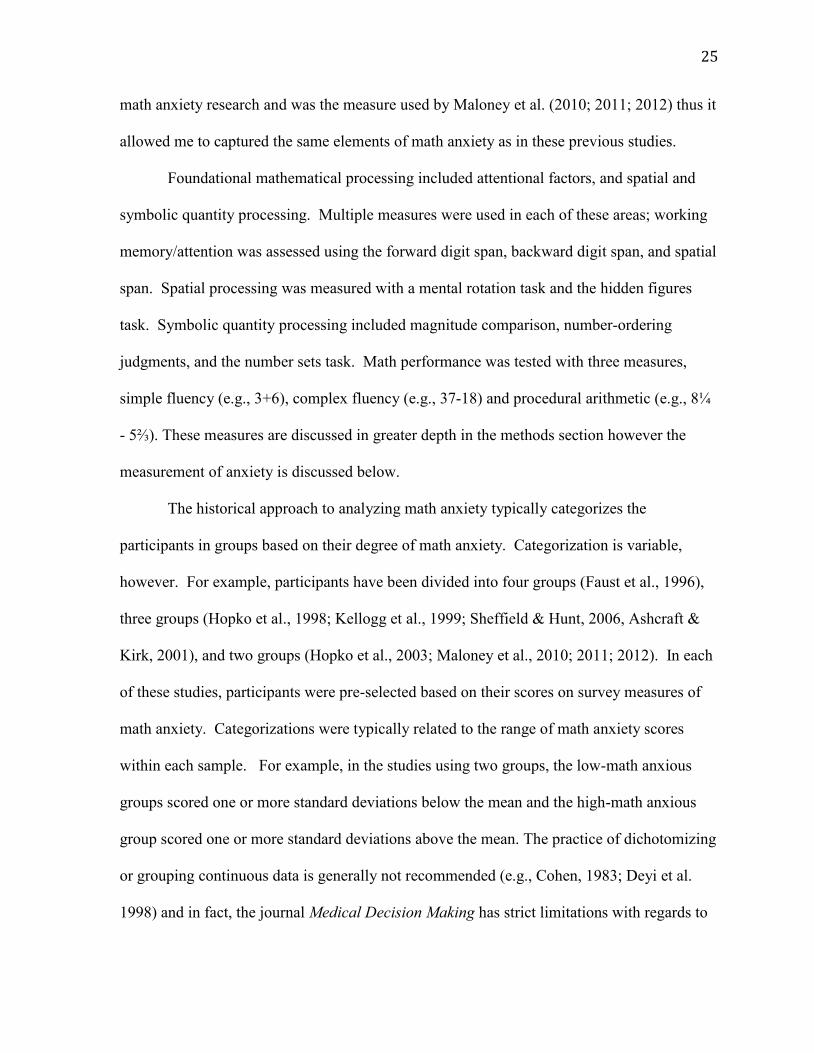
The historical approach to analyzing math anxiety typically categorizes the
participants in groups based on their degree of math anxiety. Categorization is variable,
however. For example, participants have been divided into four groups (Faust et al., 1996),
three groups (Hopko et al., 1998; Kellogg et al., 1999; Sheffield & Hunt, 2006, Ashcraft &
Kirk, 2001), and two groups (Hopko et al., 2003; Maloney et al., 2010; 2011; 2012). In each
of these studies, participants were pre-selected based on their scores on survey measures of
math anxiety. Categorizations were typically related to the range of math anxiety scores
within each sample. For example, in the studies using two groups, the low-math anxious
groups scored one or more standard deviations below the mean and the high-math anxious
group scored one or more standard deviations above the mean. The practice of dichotomizing
or grouping continuous data is generally not recommended (e.g., Cohen, 1983; Deyi et al.
1998) and in fact, the journal Medical Decision Making has strict limitations with regards to
26
publishing articles that partition continuous variables (Dawson & Weiss, 2012). Partitioning
or dichotomizing data results in a “loss of information about individual differences”
(MacCallum, Zhang, Preacher, & Rucker, 2002). Effect size and power are generally
reduced however a higher correlation may be observed if there are sampling errors, a small
sample size, or a small sample correlation (Cohen, 1983; MacCallum et al., 2002). To avoid
these potential misrepresentations, math anxiety was analyzed as a continuous variable in the
present study.
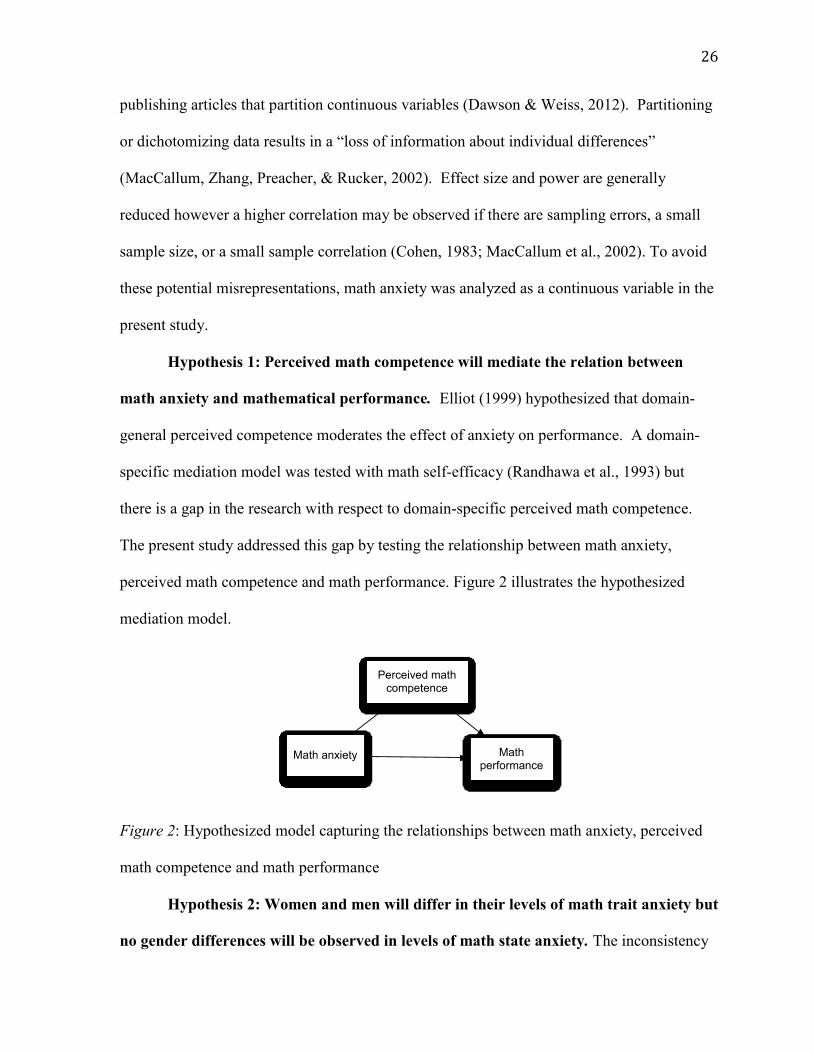
Hypothesis 1: Perceived math competence will mediate the relation between
math anxiety and mathematical performance. Elliot (1999) hypothesized that domain-
general perceived competence moderates the effect of anxiety on performance. A domain-
specific mediation model was tested with math self-efficacy (Randhawa et al., 1993) but
there is a gap in the research with respect to domain-specific perceived math competence.
The present study addressed this gap by testing the relationship between math anxiety,
perceived math competence and math performance. Figure 2 illustrates the hypothesized
mediation model.
Figure 2: Hypothesized model capturing the relationships between math anxiety, perceived
math competence and math performance
Hypothesis 2: Women and men will differ in their levels of math trait anxiety but
no gender differences will be observed in levels of math state anxiety. The inconsistency
Perceived math competence
Math anxiety Math performance
27
of gender differences and reported math anxiety was addressed using Goetz’s (2013)
hypothesis. Goetz et al. initially tested this hypothesis using a limited and inconsistent
measure to compare math trait and math state anxiety. For example, state anxiety was
measured with a one-question survey. The current study addressed this limitation by
employing the Abbreviated Math Anxiety Survey (AMAS), a reliable and consistent measure
of math anxiety. The AMAS was administered such that half of the participants completed
the survey prior to any testing (thus capturing trait anxiety) and the other half completed the
survey immediately following a challenging math assessment (capturing state anxiety). I
predicted an interaction between gender and test timing anticipating women would report
more anxiety than men in the trait (early) anxiety condition and comparable math anxiety in
the state (later) anxiety condition.
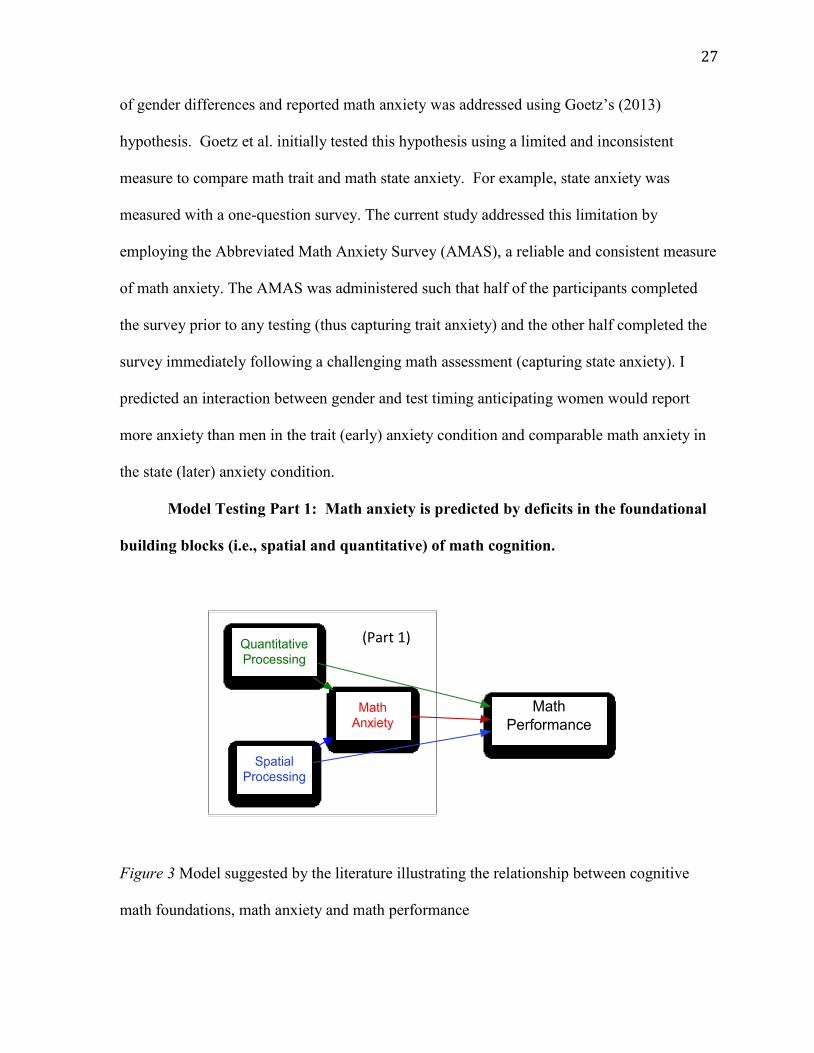
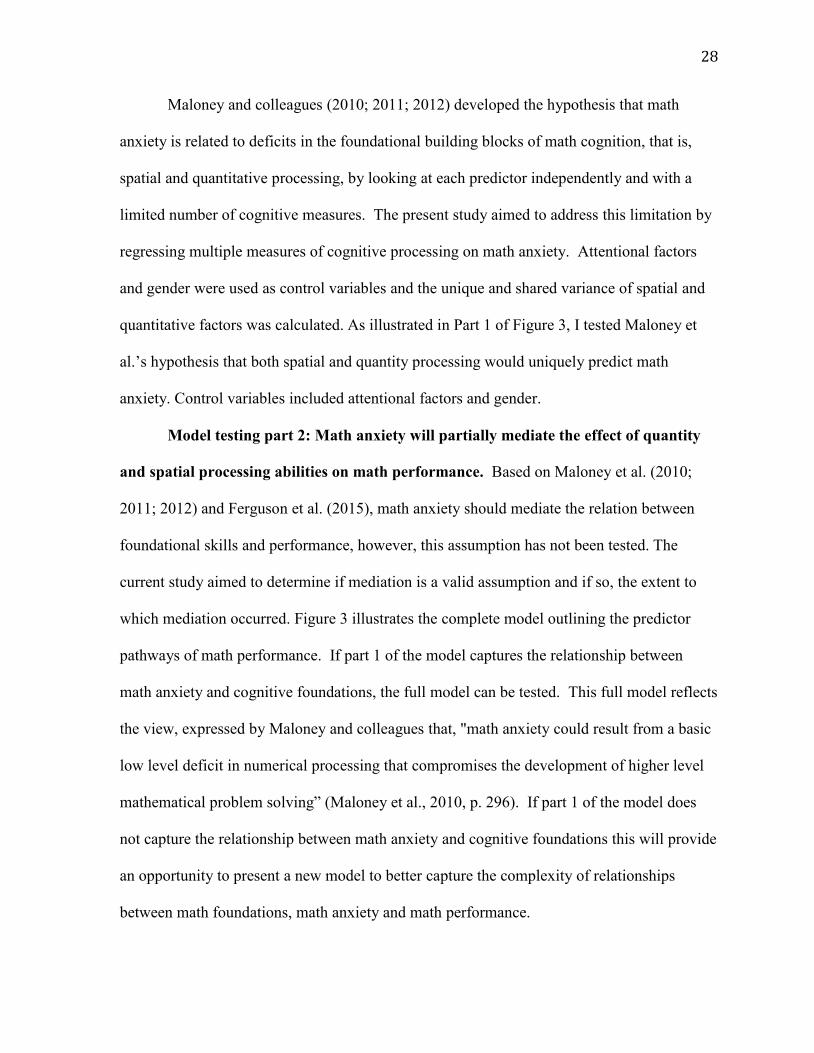
Model Testing Part 1: Math anxiety is predicted by deficits in the foundational
building blocks (i.e., spatial and quantitative) of math cognition.
Figure 3 Model suggested by the literature illustrating the relationship between cognitive
math foundations, math anxiety and math performance
Math
Performance
Math Anxiety
Quantitative Processing
Spatial Processing
(Part 1)
28
Maloney and colleagues (2010; 2011; 2012) developed the hypothesis that math
anxiety is related to deficits in the foundational building blocks of math cognition, that is,
spatial and quantitative processing, by looking at each predictor independently and with a
limited number of cognitive measures. The present study aimed to address this limitation by
regressing multiple measures of cognitive processing on math anxiety. Attentional factors
and gender were used as control variables and the unique and shared variance of spatial and
quantitative factors was calculated. As illustrated in Part 1 of Figure 3, I tested Maloney et
al.’s hypothesis that both spatial and quantity processing would uniquely predict math
anxiety. Control variables included attentional factors and gender.
Model testing part 2: Math anxiety will partially mediate the effect of quantity
and spatial processing abilities on math performance. Based on Maloney et al. (2010;
2011; 2012) and Ferguson et al. (2015), math anxiety should mediate the relation between
foundational skills and performance, however, this assumption has not been tested. The
current study aimed to determine if mediation is a valid assumption and if so, the extent to
which mediation occurred. Figure 3 illustrates the complete model outlining the predictor
pathways of math performance. If part 1 of the model captures the relationship between
math anxiety and cognitive foundations, the full model can be tested. This full model reflects
the view, expressed by Maloney and colleagues that, "math anxiety could result from a basic
low level deficit in numerical processing that compromises the development of higher level
mathematical problem solving” (Maloney et al., 2010, p. 296). If part 1 of the model does
not capture the relationship between math anxiety and cognitive foundations this will provide
an opportunity to present a new model to better capture the complexity of relationships
between math foundations, math anxiety and math performance.
29
Chapter 2: Method
Participants
A total of 74 young adults were recruited from Carleton University and the
surrounding area (Mean age = 20.0, Median age = 20.0 years; range from 16 to 32; 66%
female). Participants received either $15 (n = 41) or course credit for participating in the
study. All participants spoke fluent English. For 70% of the participants, English was their
first language. The most frequent alternatives were Chinese (15%), Arabic (4%) and French
(3%). Approximately half of the population (n=33) were pursuing degrees in the sciences.
The majority of participants were undergraduate students (83%). Grade 12 students
(16%) and graduate students (1%) made up the remainder of the population. Of the total,
most students were in first (34%) and second (22%) year of university. The primary areas of
study included science (36%), arts (12%), and education (12%).
Materials and Procedures
Participants were tested in a quiet space either individually or in pairs. Table 2
outlines the duration and order of the test methods used. Total testing took approximately
one hour. Ordering of the tests was designed to provide a mix of short and simple tasks with
the more complex and time-demanding tasks. All participants completed the math
background and interests questionnaire first, followed by the perceived competence measure.
Subsequently, half of the participants completed the adult version of the child’s math affect
survey (CMAS-A) at the start of the testing and the abbreviated math anxiety questionnaire
(AMAS) at the end of the testing. The other half completed the AMAS first and the CMAS-

30
A last. The intervening tasks were all administered in the same order, as indicated in Table
1, between the two math anxiety measures.
Table 1: Testing Order and Estimated Test Duration
Testing
order
Test Description Estimated Max.
Time (min)
Affective Measures
1 Math Behavior and Interests Questionnaire 3
2 Perceived math competence (PALS) 3
3 / 14 Abbreviated Math Anxiety Scale (AMAS) 3
14 / 3 Math Affect Survey (CMAS-A) 3
Cognitive Measures
Working Memory
4 Forward and backward digit span 2
5 Spatial span 4
Quantitative
6 Magnitude comparison 2
8 Numerical ordering 3
9 Number sets task 4
Spatial
7 Mental rotation 7
10 Hidden figures 8
Performance Measures
11 Simple fluency 1
12 Complex fluency (CFT) 4
13 Procedural arithmetic (BMA-3) 5
Measures: Mathematical Affect
The math background and interest questionnaire (MBIQ) is a brief survey
of math background and interests made available through Survey Monkey (see
31
Appendix 2). The survey was completed on the iPad using participant codes. No
names are associated with the data.
The perceived math competence scale (Kaplan & Midgley, 1997) was
adapted from the Patterns of Adaptive Learning Survey (Midgley, Maehr, & Urdan,
1993). In this iPad-based questionnaire, participants rate how closely a given math-
related statement describes them (see Table 2). A 5-point Likert scale ranging from 1
representing “not at all true of me” to 5 indicating, “very true of me” is used. Scoring
ranges from 7-35 with negatively focused items reverse-scored. A higher score
indicates a higher level of perceived math competence. Measured internal consistency
of the scale with this test population was high (α = .90).
The child’s math affect survey – adult version (CMAS-A) is a 14-question
abbreviated and modified version of the Scale for Early Mathematics Anxiety
(SEMA) survey (Wu et al., 2013) developed by the author. In this pencil and paper
survey, participants rated their anxiety on a pictorial scale ranging from high
confidence (1) to high anxiety (5). Questions related to situations involving both math
and language learning and performance. This survey is discussed in detail in
Appendix 1.
The abbreviated math anxiety scale (AMAS) is a nine-question survey used
extensively to measure math anxiety in adults. Hopko et al. report excellent test-retest
reliability (r =. 85; 2003) and internal consistency was high with this test population
(α = .93). In this survey, participants are asked to rate their anxiety during a specified
task such as, “Listening to a lecture in math class.” The response scale ranges from 1
for low anxiety to 5 representing high anxiety with total scoring ranges from 9-45.
32
This survey was completed on the iPad. As this measure is used extensively in math
anxiety research, it will be the primary math anxiety measure used in subsequent
analyses.
Cognitive Measures
Participants completed a number of working memory/attentional, quantitative,
and spatial measures.
Working memory/attentional Two verbal memory assessments were
administered; forward digit span and backward digit span. The forward span is
primarily a measure of short-term auditory memory and the backward span taps into
verbal and central executive working memory capacity.
Forward span. In the forward span, the tester reads a sequence of numbers.
The “span” refers to the number of digits in the sequence. The tester begins with a
sequence of three digits. The participant repeats that sequence in order. There are two
trials for each digit span (e.g. for the 3-digit span; 3-8-6 and 6-1-2). If one of the two
trials is recalled correctly, the tester will increase the span size by one digit. Testing
continues until the participant is unable to recall both trials for a given span size.
Scoring is the maximum sequence length with just one trial correct.
Backward span. In the backward span, the experimenter recites a list of
numbers (e.g. 2-7-4). The participant then repeats the numbers in reverse order,
starting from the last number and ending with the first number recited (e.g. 4-7-2).
The task begins with two trials of 2 digits. The same procedure as the forward digit
span was used to determine when the test was terminated and test scoring. Reliability
measures of .70 to .90 are based on Conway et al. (2005).
33
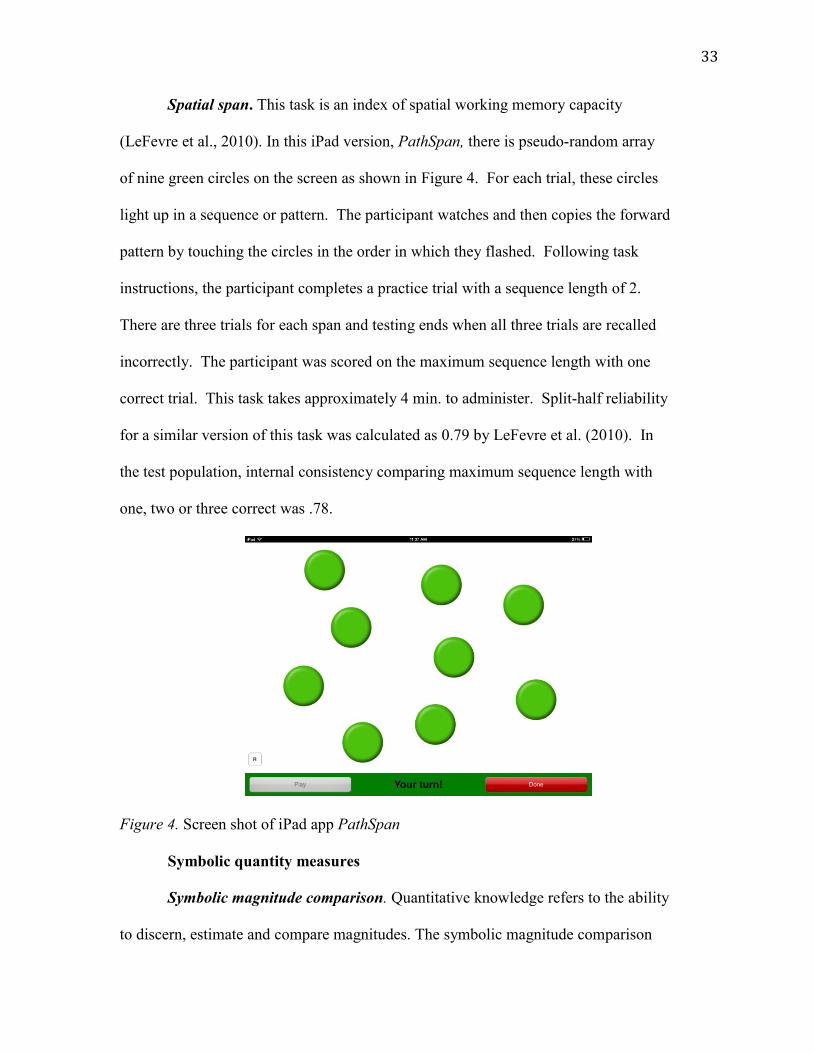
Spatial span. This task is an index of spatial working memory capacity
(LeFevre et al., 2010). In this iPad version, PathSpan, there is pseudo-random array
of nine green circles on the screen as shown in Figure 4. For each trial, these circles
light up in a sequence or pattern. The participant watches and then copies the forward
pattern by touching the circles in the order in which they flashed. Following task
instructions, the participant completes a practice trial with a sequence length of 2.
There are three trials for each span and testing ends when all three trials are recalled
incorrectly. The participant was scored on the maximum sequence length with one
correct trial. This task takes approximately 4 min. to administer. Split-half reliability
for a similar version of this task was calculated as 0.79 by LeFevre et al. (2010). In
the test population, internal consistency comparing maximum sequence length with
one, two or three correct was .78.
Figure 4. Screen shot of iPad app PathSpan
Symbolic quantity measures
Symbolic magnitude comparison. Quantitative knowledge refers to the ability
to discern, estimate and compare magnitudes. The symbolic magnitude comparison
34
assesses understanding of quantity involving Arabic digits. In this timed paper and
pencil task, participants compare single digit pairs where digits range from 1 to 9.
Participants cross out the larger of the two digits and are timed as they complete the
task. To ensure understanding, the tester demonstrates a practice trial with three
sample items. The participant then independently completes nine practice items. The
test consists of 2 pages (forms a and b), each with 15 items. The participant is
instructed to complete the page as quickly and accurately as possible. Each page is
completed separately. Scoring was based on the number of correct items completed
per second and averaged between the 2 pages. Placement of the larger digit is
counterbalanced in this version. The measure is based on the design by Nosworthy
and colleagues (2013) and adapted by Sowinski. See Appendix 3 for a copy of the
task. Reliability comparing forms A and B was very high (α = .96).
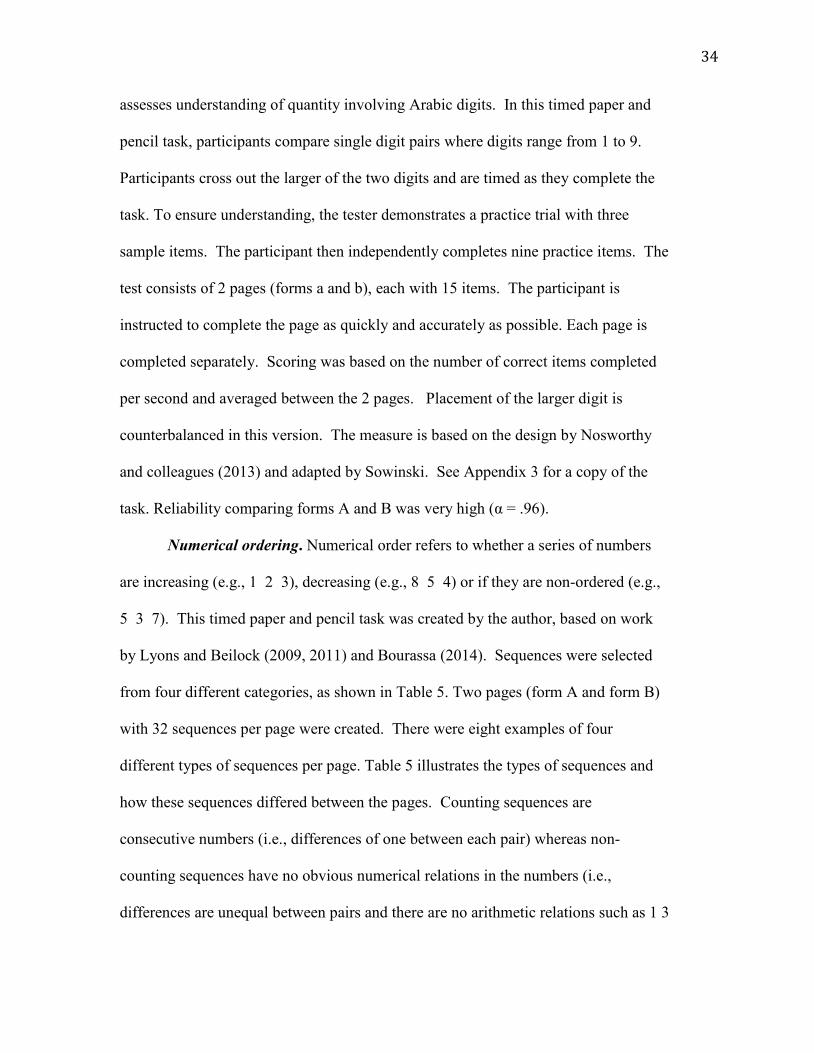
Numerical ordering. Numerical order refers to whether a series of numbers
are increasing (e.g., 1 2 3), decreasing (e.g., 8 5 4) or if they are non-ordered (e.g.,
5 3 7). This timed paper and pencil task was created by the author, based on work
by Lyons and Beilock (2009, 2011) and Bourassa (2014). Sequences were selected
from four different categories, as shown in Table 5. Two pages (form A and form B)
with 32 sequences per page were created. There were eight examples of four
different types of sequences per page. Table 5 illustrates the types of sequences and
how these sequences differed between the pages. Counting sequences are
consecutive numbers (i.e., differences of one between each pair) whereas non-
counting sequences have no obvious numerical relations in the numbers (i.e.,
differences are unequal between pairs and there are no arithmetic relations such as 1 3
35
4). Half of the ordered sequences were ascending and half were descending. The
number stimuli were the same for both pages but the ordering was alternated. For
example, an ascending sequence became a descending sequence and an unordered
sequence where the first two digits increased, became an un-ordered sequence where
the first two digits decreased and vice versa. Reliability comparing Forms A and B
was very high (α=. 95).
Table 2: Numerical Ordering Sequences - Descriptions and Sample Stimuli
Sequence description Sample sequence
Form A Form B
Ordered counting 2 3 4 4 3 2
Unordered counting 9 7 8 8 9 7
Ordered non-counting 7 6 3 3 6 7
Un-ordered non-counting 1 7 4 4 1 7
Participants were instructed that they would see sequences of three digits that
ranged from 1 to 9. If the digits are ordered they should place a check mark beside
the sequence. If the digits are non-ordered, they should place an X beside the
sequence. The researcher demonstrated the task with three practice sequences. The
participant then completed a practice trial of 6 sequences. The researcher reviewed
the results to ensure understanding of the task. The participant is instructed to
complete the task as quickly and accurately as possible. Scoring followed the same
procedure as the magnitude comparison task, number correct per second.
36
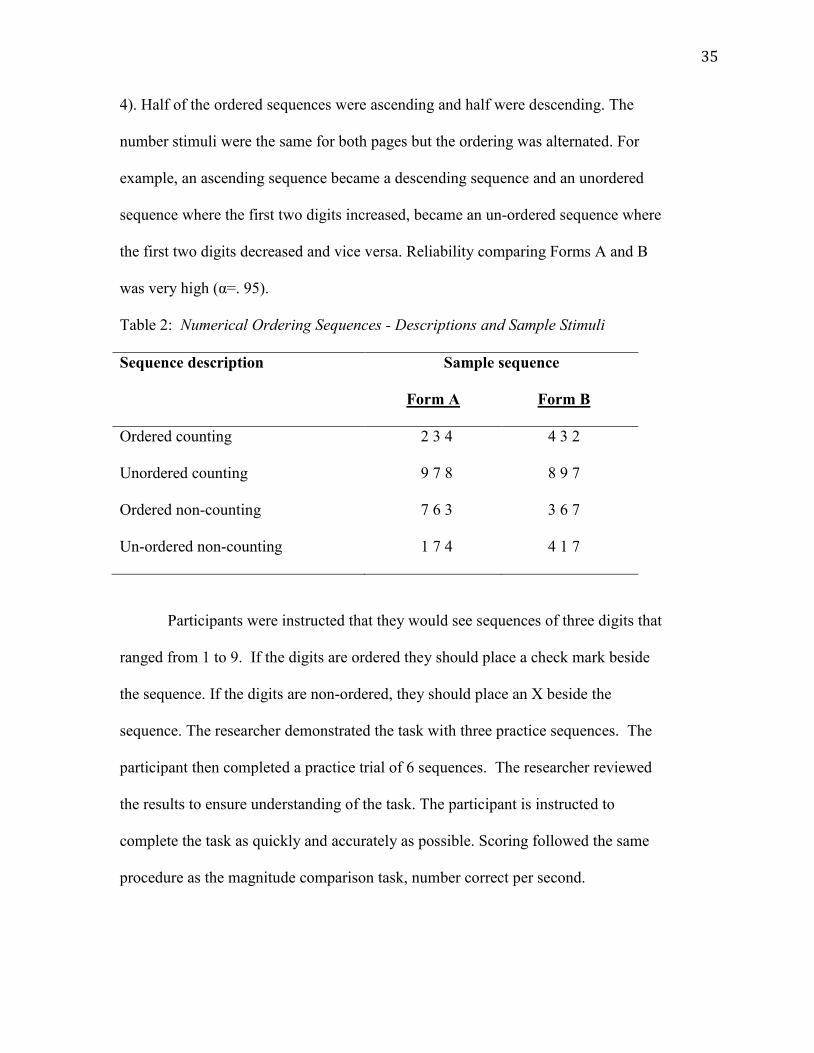
Number sets. Participants competed the number sets task developed by Geary
et al. (2009). In this timed pencil and paper task, participants map digits onto picture
representations and perform simple addition with these mappings. They look at sets
of digits, objects (e.g. dots, diamonds or stars), or a combination of the two and
determine if their combined magnitude matches a target number. The set stimuli are
presented as either 2 or 3-squared dominoes with a digit, a set of shapes or a blank in
the domino squares. Participants looked at the set stimuli and circled the
combinations that added up to the target number. Figure 5 shows sample stimuli for
the target number 5.
Figure 5. Sample stimuli from the number sets task. Target number is 5.
The participant completed a practice trial for the target number of 3. The
participant then completed two pages with a target number of 5 and two pages with a
target number of 9. Each page had 18 test items and is completed separately and
timed. The participant is instructed to complete the page as quickly and accurately as
possible. Scoring is based on a sensitivity measure (d’) - the number of correct
responses minus the false alarms where false alarms are circled number sets that do
not add up to the target number. This measure is then divided by the time required to
complete the page. Reliability comparing the four pages was very high (α=. 91).
37
Spatial Processing
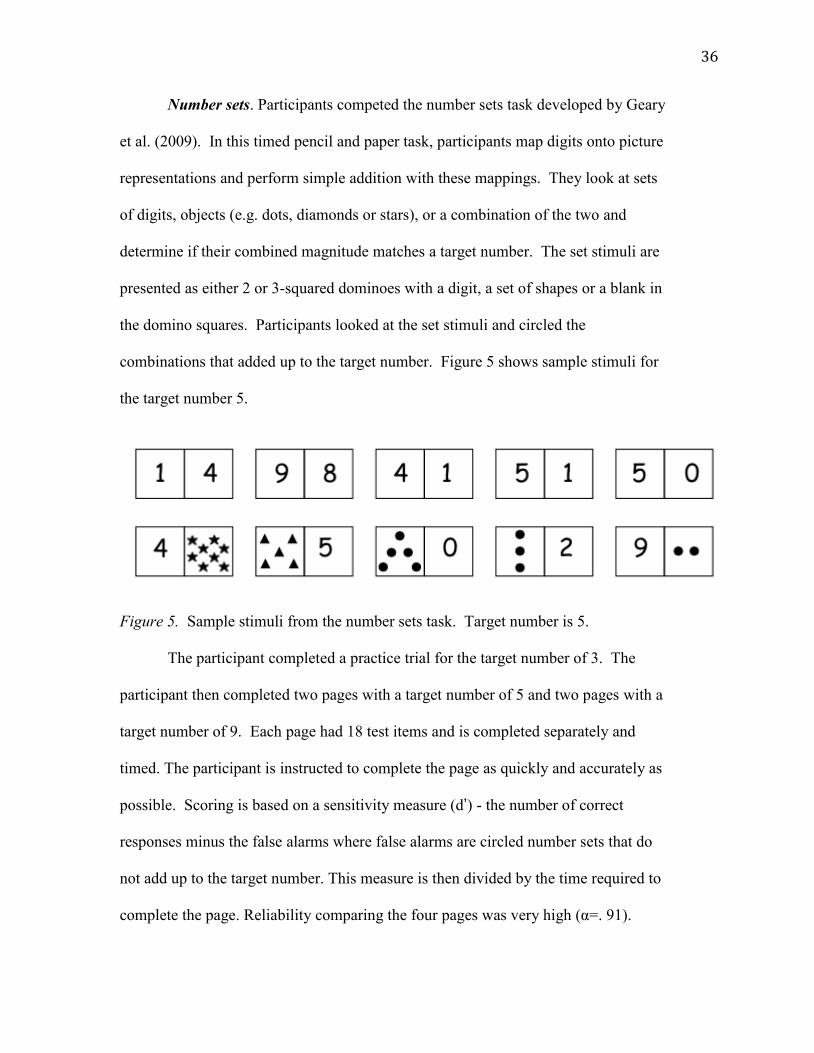
Mental rotation. Shepard and Metzler first used the mental rotation task in
1971. I administered the redrawn version created by Peters (1995). In this task,
participants view four test figures and one target figure and are expected to mentally
rotate the four test figures and choose two out of the four that match the target figure
on the left. Figure 6 shows a practice item from the task. The researcher guided the
participants through four practice items. Participants were then given seven minutes
to complete as many questions as they could. There are a total of 24 questions.
Participants were scored correctly only if the two matched test figures were correctly
identified. This test has both strong internal consistency (KR-20 = .88) and test-retest
reliability (r = .83) as reported in Peters (1995).
Figure 6. Mental rotation task practice item from Peters (1995).
Hidden figures. In the Hidden Figures test (Eckstrom et al., 1976) participants are
asked to identify which of five simple geometric figures is embedded within a complex
figure (see Figure 7). Test-retest reliability is high (.78 to.92; Kepner & Neimark, 1984) in a
group-administered version of the task. Participants were guided through 2 practice
questions. They were then given eight minutes to complete the 16 questions. Participants
were scored on the number of questions attempted and the number correct.
38
Figure 7. Practice task from the hidden figures test. Hidden figures have been
outlined.
Mathematical Performance Measures
Simple arithmetic fluency. Fluency of single-digit addition with sums less
than or equal to nine was measured using an iPad app (MadMinute) developed for the
Math Lab at Carleton. In this task, participants completed a practice trial consisting
of two questions prior to completing the 1-minute timed task. Scoring was based on
the number of correct sums completed per minute. Similar paper and pencil fluency
assessments, such as the Woodcock and Johnson III, report reliabilities of .80 to .90
(Woodcock et al., 2001). See Appendix 4 for a screen shot of this app.
Complex arithmetic fluency. Fluency of multi-digit arithmetic was
measured using the Calculation Fluency Test (CFT) developed by the Math Lab at
Carleton (Sowinski et al., 2014). This pencil and paper test consists of one page each
of double-digit addition (e.g. 28 + 13), double-digit subtraction (e.g. 89 - 60) and
multiplication (e.g. 16 x 8). Participants first complete two practice questions for
each operation and may ask the experimenter for help. Following this, they are given
one minute per page to quickly and accurately complete as many questions as they
39
can. Scoring is based on the total number correct. Cronbach’s alpha was .90
comparing results on the three operations.
Procedural arithmetic. The Brief Math Assessment 3 was developed by
Steiner and Ashcraft (2012) based on the Wide Range Achievement Test: Third
Edition (WRAT3). In this un-timed paper and pencil test, participants complete ten
progressively more difficult questions ranging from whole number addition and
subtraction to fractions, decimals and algebra. The test takes approximately six
minutes to administer. Scoring is based on the total number correct. Steiner and
Ashcraft report a Cronbach’s alpha of .69 based on 11-point scoring of the 9 items.
See Appendix 5 for the complete test.
40
Chapter 3 – Results
I begin the analysis by examining performance on the individual measures, that is,
presenting the descriptive statistics, addressing any discrepancies in the data, and reporting
on data reduction. Subsequently, the hypotheses and models outlined in the introduction were
tested to examine the relations among foundational spatial and quantitative processes, math
anxiety, and performance.
Descriptives: Affective Measures
The Abbreviated Math Anxiety Scale (AMAS). The AMAS was used as the main
math anxiety measure as it has been used extensively in other math anxiety studies. To
evaluate the test population, I compared their performance on the AMAS to performance
reported in the literature. Questions and average ratings to the questions on the survey are
shown in Table 3. The overall mean score for the AMAS (M=23.0, SD = 8.5) and range of
mean scores (9 – 45) correspond closely to results reported by Hopko et al. (2003; M= 21.1,
SD = 7.0) for a large group of undergraduate students (N= 1,239). The distribution of scores
for the test population had a slight positive skew (0.64, p<05) with no outliers.
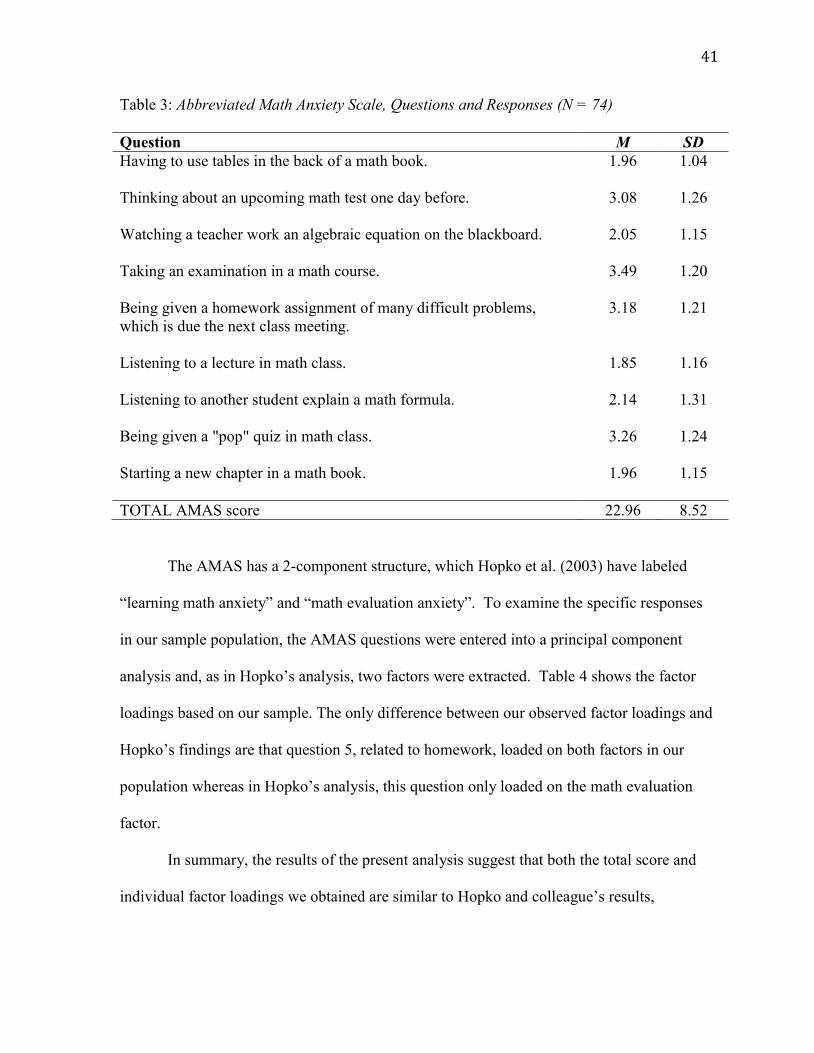
41
Table 3: Abbreviated Math Anxiety Scale, Questions and Responses (N = 74)
Question M SD
Having to use tables in the back of a math book.
1.96 1.04
Thinking about an upcoming math test one day before.
3.08 1.26
Watching a teacher work an algebraic equation on the blackboard.
2.05 1.15
Taking an examination in a math course.
3.49 1.20
Being given a homework assignment of many difficult problems,
which is due the next class meeting.
3.18 1.21
Listening to a lecture in math class.
1.85 1.16
Listening to another student explain a math formula.
2.14 1.31
Being given a "pop" quiz in math class.
3.26 1.24
Starting a new chapter in a math book.
1.96 1.15
TOTAL AMAS score 22.96 8.52
The AMAS has a 2-component structure, which Hopko et al. (2003) have labeled
“learning math anxiety” and “math evaluation anxiety”. To examine the specific responses
in our sample population, the AMAS questions were entered into a principal component
analysis and, as in Hopko’s analysis, two factors were extracted. Table 4 shows the factor
loadings based on our sample. The only difference between our observed factor loadings and
Hopko’s findings are that question 5, related to homework, loaded on both factors in our
population whereas in Hopko’s analysis, this question only loaded on the math evaluation
factor.
In summary, the results of the present analysis suggest that both the total score and
individual factor loadings we obtained are similar to Hopko and colleague’s results,
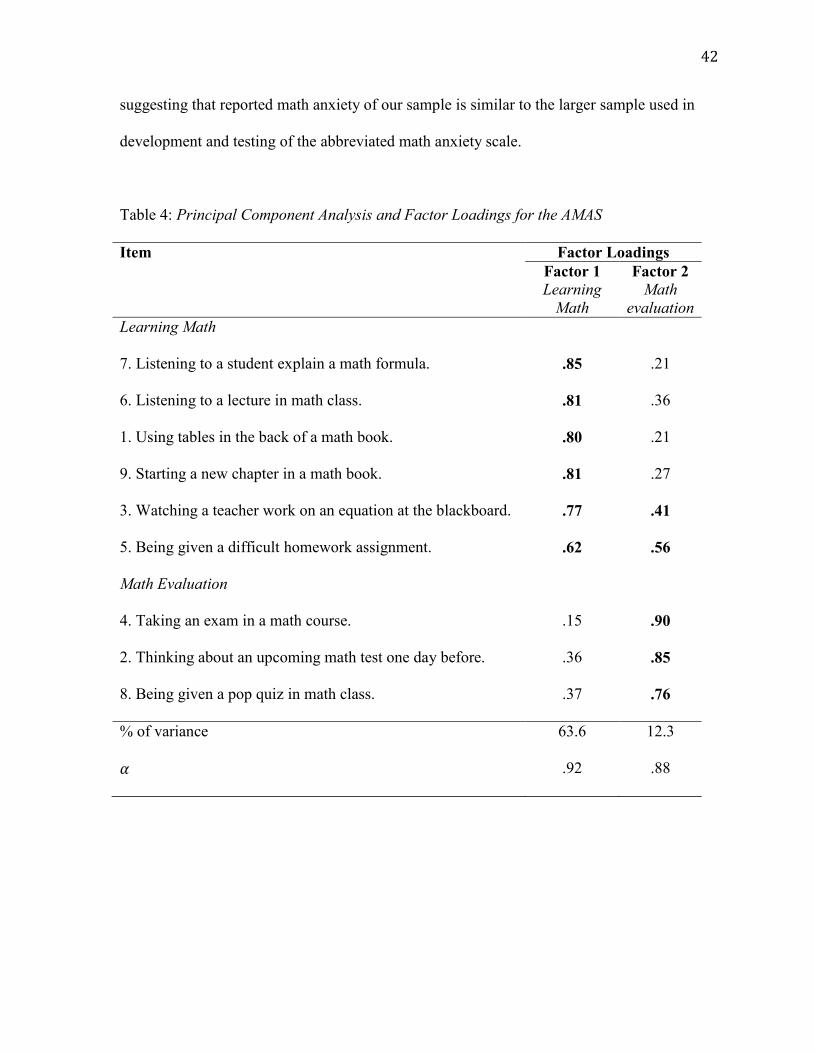
42
suggesting that reported math anxiety of our sample is similar to the larger sample used in
development and testing of the abbreviated math anxiety scale.
Table 4: Principal Component Analysis and Factor Loadings for the AMAS
Item Factor Loadings
Factor 1
Learning
Math
Factor 2
Math
evaluation
Learning Math
7. Listening to a student explain a math formula. .85 .21
6. Listening to a lecture in math class. .81 .36
1. Using tables in the back of a math book. .80 .21
9. Starting a new chapter in a math book. .81 .27
3. Watching a teacher work on an equation at the blackboard. .77 .41
5. Being given a difficult homework assignment. .62 .56
Math Evaluation
4. Taking an exam in a math course. .15 .90
2. Thinking about an upcoming math test one day before. .36 .85
8. Being given a pop quiz in math class. .37 .76
% of variance 63.6 12.3
.92 .88
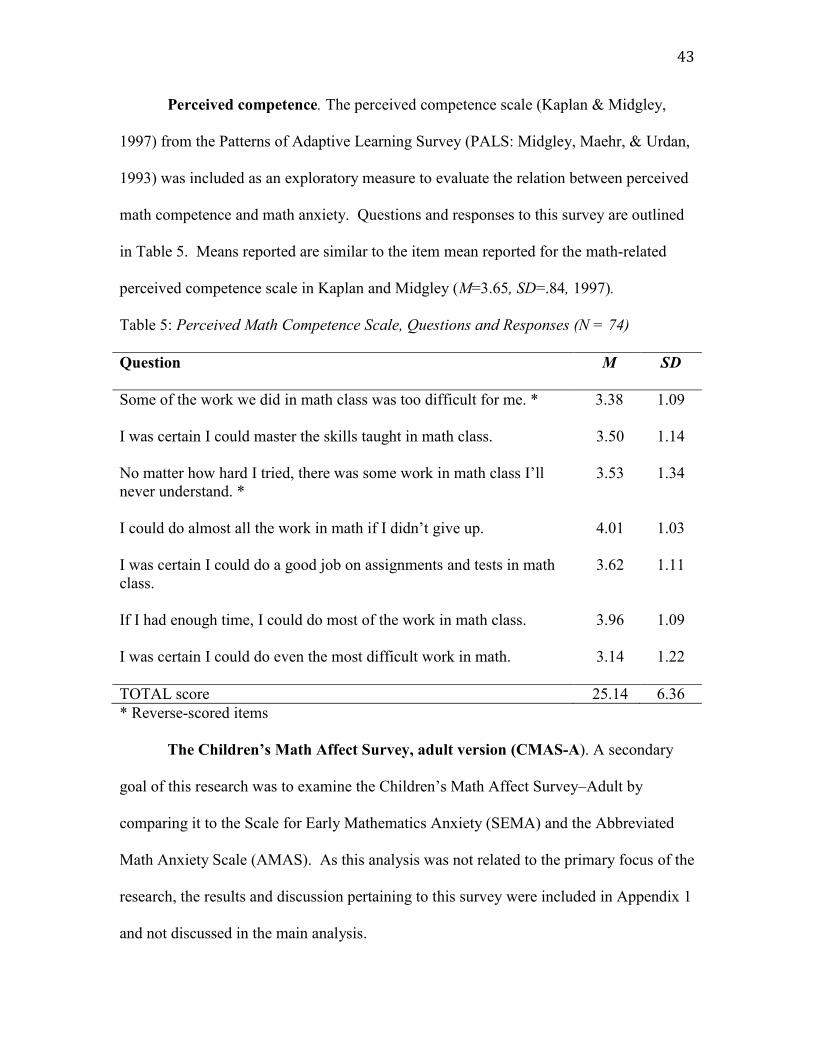
43
Perceived competence. The perceived competence scale (Kaplan & Midgley,
1997) from the Patterns of Adaptive Learning Survey (PALS: Midgley, Maehr, & Urdan,
1993) was included as an exploratory measure to evaluate the relation between perceived
math competence and math anxiety. Questions and responses to this survey are outlined
in Table 5. Means reported are similar to the item mean reported for the math-related
perceived competence scale in Kaplan and Midgley (M=3.65, SD=.84, 1997).
Table 5: Perceived Math Competence Scale, Questions and Responses (N = 74)
Question M
SD
Some of the work we did in math class was too difficult for me. *
3.38 1.09
I was certain I could master the skills taught in math class.
3.50 1.14
No matter how hard I tried, there was some work in math class I’ll
never understand. *
3.53 1.34
I could do almost all the work in math if I didn’t give up.
4.01 1.03
I was certain I could do a good job on assignments and tests in math
class.
3.62 1.11
If I had enough time, I could do most of the work in math class.
3.96 1.09
I was certain I could do even the most difficult work in math.
3.14 1.22
TOTAL score 25.14 6.36
* Reverse-scored items
The Children’s Math Affect Survey, adult version (CMAS-A). A secondary
goal of this research was to examine the Children’s Math Affect Survey–Adult by
comparing it to the Scale for Early Mathematics Anxiety (SEMA) and the Abbreviated
Math Anxiety Scale (AMAS). As this analysis was not related to the primary focus of the
research, the results and discussion pertaining to this survey were included in Appendix 1
and not discussed in the main analysis.
44
Descriptives: Cognitive Processing
Descriptive statistics for the cognitive measures are shown in Table 6 and
discussed under their respective headings.
Working memory. Mean digit spans were typical of those reported by other
researchers. For example, forward digit span is typically six or seven (Baddeley,
Eysenck & Anderson; 2009, p. 20). The current sample had a forward digit span of
M=6.8. Backward digit span is typically smaller: In a small-scale meta-analysis,
Babcock and Salthouse (1990) reported an average backward digit span of 5.75 (based on
14 studies with measured backward digit spans ranging from 4.6 to 7.4) for young adults.
The mean backward span in this study (M=4.9) is within that range of measured spans.
The spatial span performance with the PathSpan app has not previously been reported for
adult populations, thus the mean spatial span length of 7.7 (based on the maximum span
with one correct trial) may provide a baseline for further analysis using this test with
adult populations. The range of performance on the spatial span (4-10) included two
participants with spans of 4 whereas no participants had spans of 5. These individuals
were included in the analyses. In summary, performance on working memory measures
for this sample appears similar to those in other studies with undergraduates.
Quantitative processing. Three quantitative measures were administered;
magnitude comparison, numerical ordering, and the number sets task. In all tasks, there
was a wide range in performance levels. Scores for the magnitude comparison and
numerical ordering tasks were based on the average number of correct responses per
second. The average score for magnitude comparison ranged from .84 to 2.5 correctly
45
identified items per second, for numerical ordering the range was from .25 to 1.04 items
per second. For the number sets task, the score was based on the number of correct
responses less false alarms (i.e. circled dominoes that did not add up to the target
number). This score was then divided by the time taken to complete the task thus
providing a score per second. The range of scores per second (1.04 - 2.81) was also
relatively wide. In all cases, scores were normally distributed. There were two outliers
with scores more than three standard deviations above the mean, one who outperformed
in the magnitude comparison task, and one in the number sets task. Both outliers were
included in the subsequent analysis as their scores did not adversely influence the
reported means.
Spatial processing. Mean number correct and standard deviations on the mental
rotation task (M=9.8, SD=4.6) was similar to reported results by Peters et al. (1995;
M=10.8, SD=5.0) for the same version of the task used in the present study.
Scores on the hidden figures task ranged from 0-13. The distribution was
positively skewed (.76, p<.01) with one outlier at the upper end. This task was
challenging for many participants and three participants scored zero. The mean of 4.3
(SD = 2.9) is similar to those reported by Miyake et al., (range of means = 4-5, 2001) in
multiple tests involving the hidden figures task. Performance on both spatial tasks
appears reasonable for the population tested.
Descriptive Analyses – Math Performance
Performance on the simple fluency and procedural arithmetic tests (brief math
assessment-3) was normally distributed. The calculation fluency task however, had a
wide range of performance (11-88) and was positively skewed (.86, p<01).
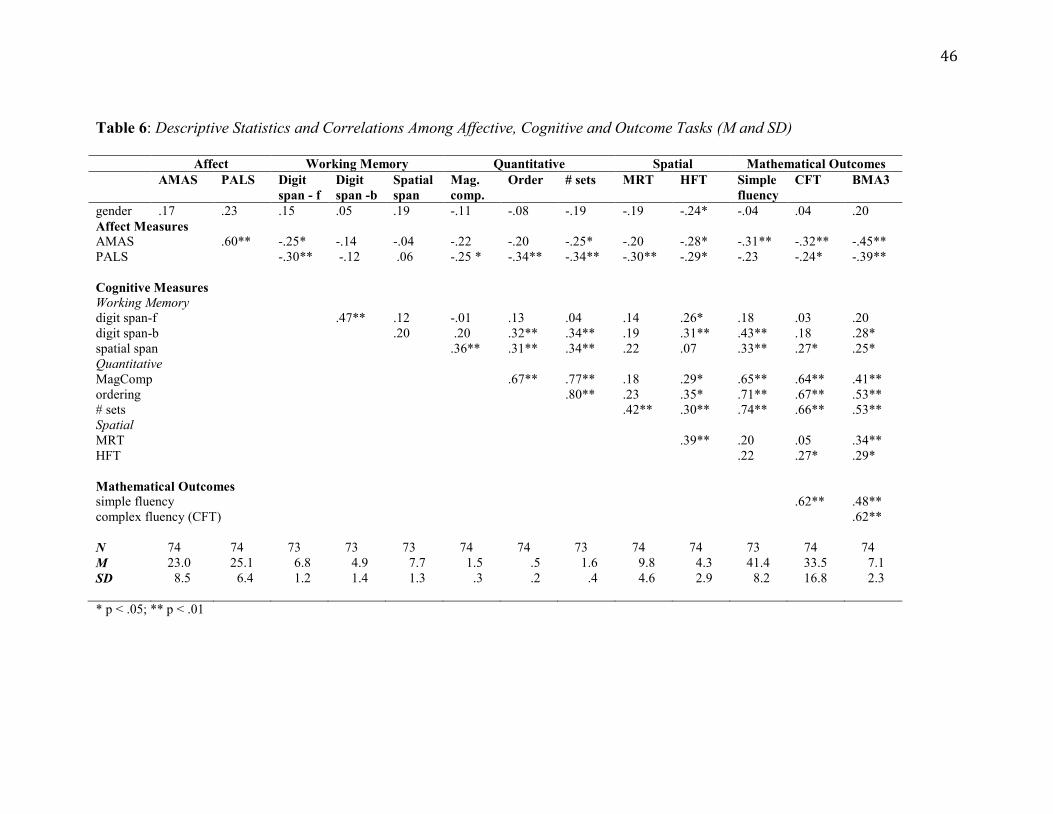
46
Table 6: Descriptive Statistics and Correlations Among Affective, Cognitive and Outcome Tasks (M and SD)
Affect Working Memory Quantitative Spatial Mathematical Outcomes
AMAS PALS Digit
span - f
Digit
span -b
Spatial
span
Mag.
comp.
Order # sets MRT HFT Simple
fluency
CFT BMA3
gender .17 .23 .15 .05 .19 -.11 -.08 -.19 -.19 -.24* -.04 .04 .20
Affect Measures
AMAS .60** -.25* -.14 -.04 -.22 -.20 -.25* -.20 -.28* -.31** -.32** -.45**
PALS -.30** -.12 .06 -.25 * -.34** -.34** -.30** -.29* -.23 -.24* -.39**
Cognitive Measures
Working Memory
digit span-f .47** .12 -.01 .13 .04 .14 .26* .18 .03 .20
digit span-b .20 .20 .32** .34** .19 .31** .43** .18 .28*
spatial span .36** .31** .34** .22 .07 .33** .27* .25*
Quantitative
MagComp .67** .77** .18 .29* .65** .64** .41**
ordering .80** .23 .35* .71** .67** .53**
# sets .42** .30** .74** .66** .53**
Spatial
MRT .39** .20 .05 .34**
HFT .22 .27* .29*
Mathematical Outcomes
simple fluency .62** .48**
complex fluency (CFT) .62**
N 74 74 73 73 73 74 74 73 74 74 73 74 74
M 23.0 25.1 6.8 4.9 7.7 1.5 .5 1.6 9.8 4.3 41.4 33.5 7.1
SD 8.5 6.4 1.2 1.4 1.3 .3 .2 .4 4.6 2.9 8.2 16.8 2.3
* p < .05; ** p < .01
47
Data Reduction: Cognitive Processing
Working memory. My initial plan was to calculate a composite memory score.
The span tasks (digits forward, digits backward and spatial span) were entered into a
principal component analysis (PCA). One factor emerged that accounted for 52% of the
variance. The factor loadings were .80 (digits forward), .84 (digits backward) and .47 for
the spatial span. The low factor loading on the spatial span along with the low common
variance led me to rethink this memory variable. In spite of the fact that the two digit
spans loaded similarly on the PCA, they appear to be measuring different aspects of
working memory as shown by the correlational data between these two span tasks and
our other measures (see Table 6). The forward digit span, a measure of verbal short term
memory, did not correlate with any of our mathematical performance tasks or our
quantitative tasks whereas the backwards span (a measure of verbal working memory)
significantly correlated with the ordering task, number sets task, simple fluency and
procedural arithmetic. Thus I considered these two measures independently. Spatial
span, a spatial working memory task (LeFevre et al., 2010) correlated with all quantity
measures but did not correlate with the backwards span thus it is capturing a different,
presumably spatial, aspect of the quantity processing. It was also considered
independently.
Quantity processing. To provide a single measure of symbolic quantitative
processing, I conducted a principle components analysis on the three quantitative tests
(magnitude comparison, numerical ordering and the number sets task). The analysis
supported a one-factor structure that accounted for 83% of the variance. Factor loadings
were .89, .90 and .94 respectively. The high factor loadings and large degree of variance
48
suggested that there was a robust common element in all three measures. This factor was
named quantitative processing and was used in further analyses.
Spatial processing. Hegarty and colleagues (2006) divide spatial processing into
two categories, large and small-scale spatial skills; categories that Uttal et al. (2012)
defines as extrinsic and intrinsic. Large-scale or extrinsic spatial skills are related to the
external environment and involve tasks such as learning and remembering layouts and
navigating. Small-scale spatial skills as defined by Hegarty (p. 151) represent the ability
to “inspect, imagine or mentally transform small shapes or manipulable objects.” Small-
scale spatial skills are typically measured with paper and pencil tasks such as mental
rotation (MRT), and hidden figures (HFT). In this study, I measured small-scale spatial
processing using the MRT and the HFT. The two small-scale spatial measures (mental
rotation and hidden figures) were significantly correlated (r = .39, p =.00).
To extract the common element, small-scale spatial processing, the hidden figures
and mental rotation scores were entered into a principal component analysis (PCA). One
factor emerged that accounted for 70% of the variance; factor loadings were .83 for both
independent measures. This factor score from the PCA was labeled spatial processing and
used in further analysis.
Correlational Analyses of Affect, Cognition, and Performance
Affect was assessed using the AMAS and the perceived competence scale of the
PALS survey. The perceived competence scale of the PALS survey was used specifically
to explore the relationship between anxiety and perceived competence. As shown in
Table 6, the correlations among the affect measures are fairly strong and the moderate
correlations between the affect and cognitive and performance measures show similar
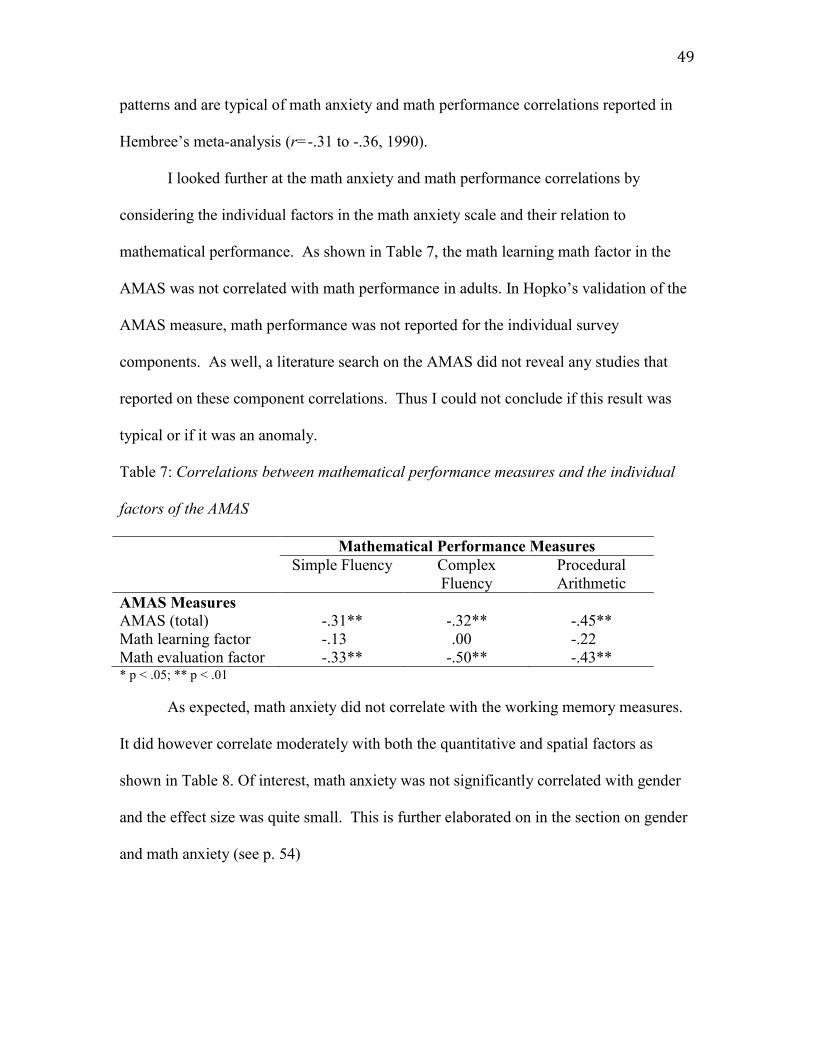
49
patterns and are typical of math anxiety and math performance correlations reported in
Hembree’s meta-analysis (r=-.31 to -.36, 1990).
I looked further at the math anxiety and math performance correlations by
considering the individual factors in the math anxiety scale and their relation to
mathematical performance. As shown in Table 7, the math learning math factor in the
AMAS was not correlated with math performance in adults. In Hopko’s validation of the
AMAS measure, math performance was not reported for the individual survey
components. As well, a literature search on the AMAS did not reveal any studies that
reported on these component correlations. Thus I could not conclude if this result was
typical or if it was an anomaly.
Table 7: Correlations between mathematical performance measures and the individual
factors of the AMAS
Mathematical Performance Measures
Simple Fluency Complex
Fluency
Procedural
Arithmetic
AMAS Measures
AMAS (total) -.31** -.32** -.45**
Math learning factor -.13 .00 -.22
Math evaluation factor -.33** -.50** -.43** * p < .05; ** p < .01
As expected, math anxiety did not correlate with the working memory measures.
It did however correlate moderately with both the quantitative and spatial factors as
shown in Table 8. Of interest, math anxiety was not significantly correlated with gender
and the effect size was quite small. This is further elaborated on in the section on gender
and math anxiety (see p. 54)
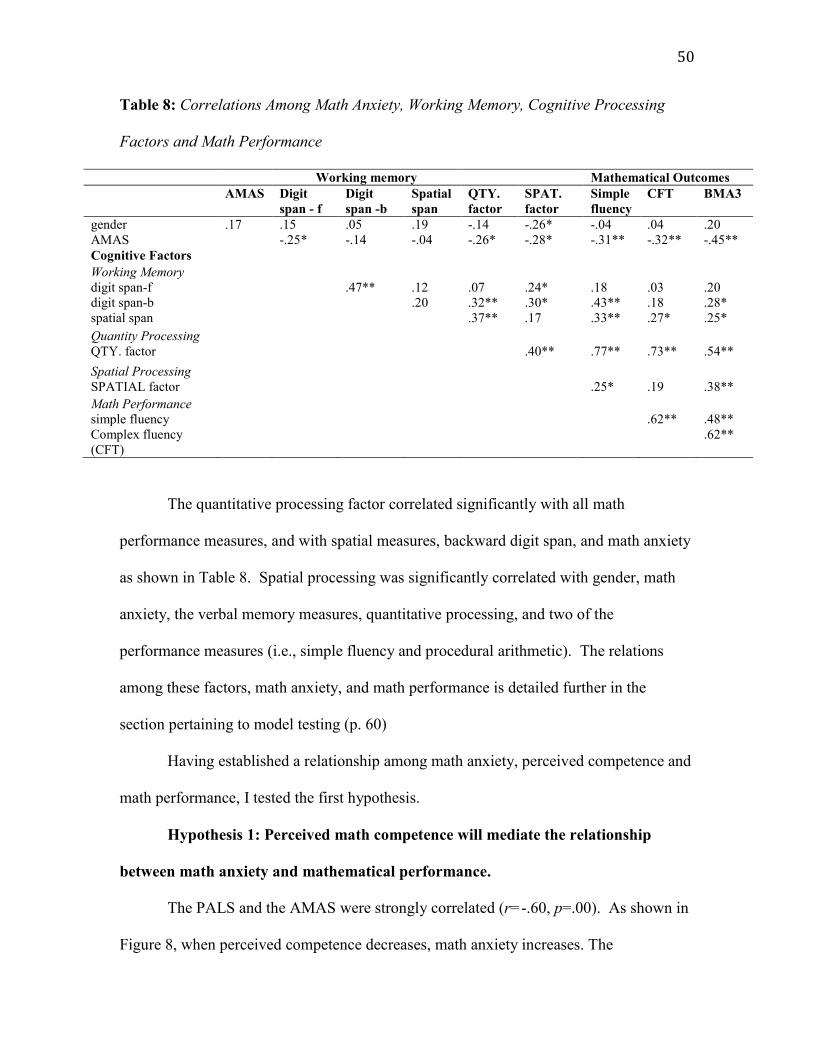
50
Table 8: Correlations Among Math Anxiety, Working Memory, Cognitive Processing
Factors and Math Performance
Working memory Mathematical Outcomes
AMAS Digit
span - f
Digit
span -b
Spatial
span
QTY.
factor
SPAT.
factor
Simple
fluency
CFT BMA3
gender .17 .15 .05 .19 -.14 -.26* -.04 .04 .20
AMAS -.25* -.14 -.04 -.26* -.28* -.31** -.32** -.45**
Cognitive Factors
Working Memory
digit span-f .47** .12 .07 .24* .18 .03 .20
digit span-b .20 .32** .30* .43** .18 .28*
spatial span .37** .17 .33** .27* .25*
Quantity Processing
QTY. factor .40** .77** .73** .54**
Spatial Processing
SPATIAL factor .25* .19 .38**
Math Performance
simple fluency .62** .48**
Complex fluency
(CFT)
.62**
The quantitative processing factor correlated significantly with all math
performance measures, and with spatial measures, backward digit span, and math anxiety
as shown in Table 8. Spatial processing was significantly correlated with gender, math
anxiety, the verbal memory measures, quantitative processing, and two of the
performance measures (i.e., simple fluency and procedural arithmetic). The relations
among these factors, math anxiety, and math performance is detailed further in the
section pertaining to model testing (p. 60)
Having established a relationship among math anxiety, perceived competence and
math performance, I tested the first hypothesis.
Hypothesis 1: Perceived math competence will mediate the relationship
between math anxiety and mathematical performance.
The PALS and the AMAS were strongly correlated (r=-.60, p=.00). As shown in
Figure 8, when perceived competence decreases, math anxiety increases. The
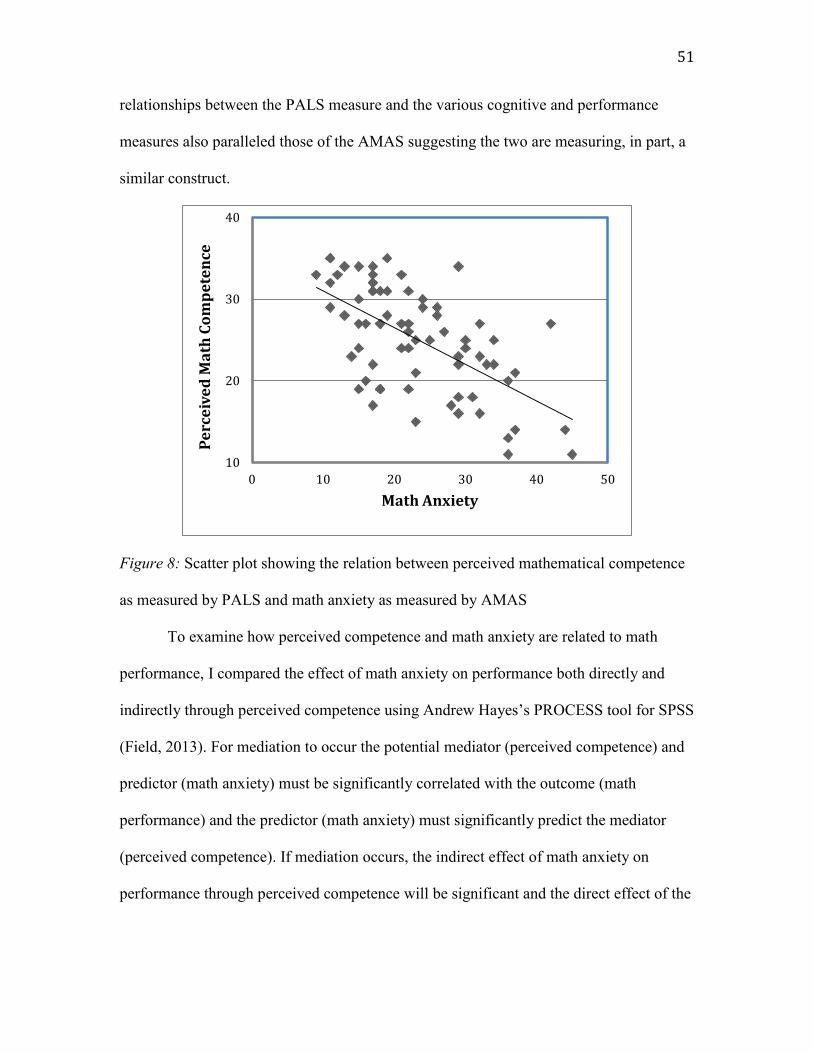
51
relationships between the PALS measure and the various cognitive and performance
measures also paralleled those of the AMAS suggesting the two are measuring, in part, a
similar construct.
Figure 8: Scatter plot showing the relation between perceived mathematical competence
as measured by PALS and math anxiety as measured by AMAS
To examine how perceived competence and math anxiety are related to math
performance, I compared the effect of math anxiety on performance both directly and
indirectly through perceived competence using Andrew Hayes’s PROCESS tool for SPSS
(Field, 2013). For mediation to occur the potential mediator (perceived competence) and
predictor (math anxiety) must be significantly correlated with the outcome (math
performance) and the predictor (math anxiety) must significantly predict the mediator
(perceived competence). If mediation occurs, the indirect effect of math anxiety on
performance through perceived competence will be significant and the direct effect of the
10
20
30
40
0 10 20 30 40 50
Pe
rce
ive
d M
ath
Co
mp
ete
nce
Math Anxiety
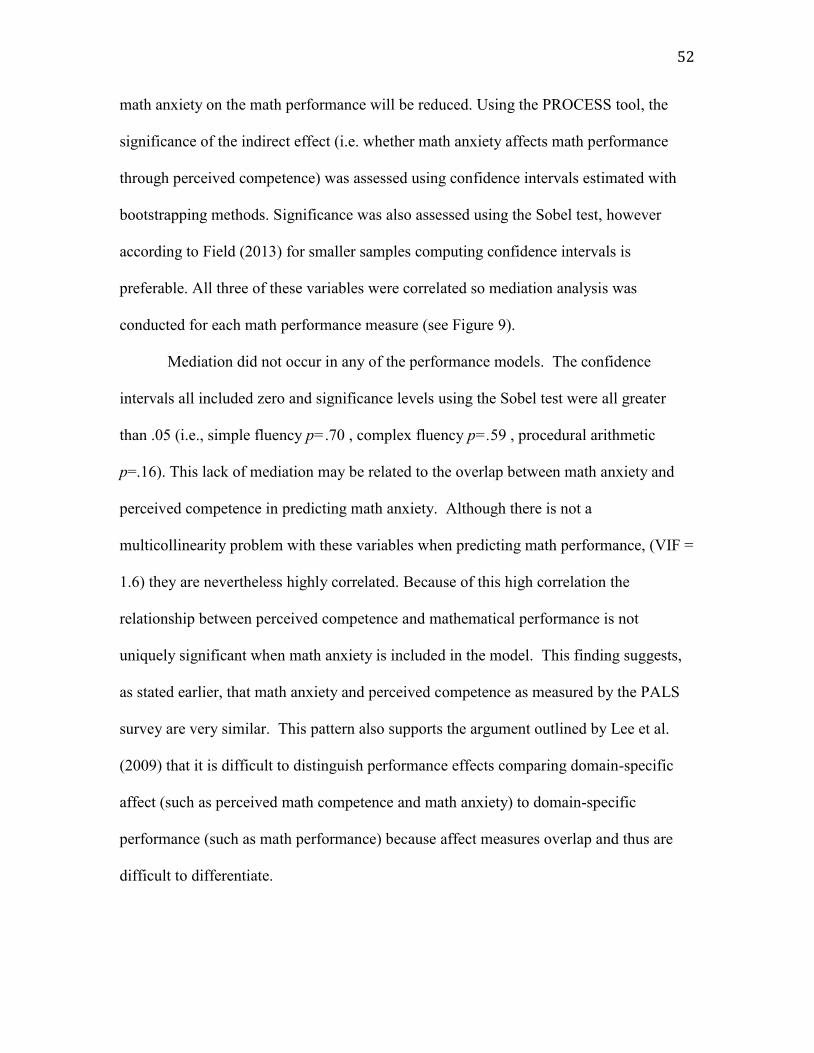
52
math anxiety on the math performance will be reduced. Using the PROCESS tool, the
significance of the indirect effect (i.e. whether math anxiety affects math performance
through perceived competence) was assessed using confidence intervals estimated with
bootstrapping methods. Significance was also assessed using the Sobel test, however
according to Field (2013) for smaller samples computing confidence intervals is
preferable. All three of these variables were correlated so mediation analysis was
conducted for each math performance measure (see Figure 9).
Mediation did not occur in any of the performance models. The confidence
intervals all included zero and significance levels using the Sobel test were all greater
than .05 (i.e., simple fluency p=.70 , complex fluency p=.59 , procedural arithmetic
p=.16). This lack of mediation may be related to the overlap between math anxiety and
perceived competence in predicting math anxiety. Although there is not a
multicollinearity problem with these variables when predicting math performance, (VIF =
1.6) they are nevertheless highly correlated. Because of this high correlation the
relationship between perceived competence and mathematical performance is not
uniquely significant when math anxiety is included in the model. This finding suggests,
as stated earlier, that math anxiety and perceived competence as measured by the PALS
survey are very similar. This pattern also supports the argument outlined by Lee et al.
(2009) that it is difficult to distinguish performance effects comparing domain-specific
affect (such as perceived math competence and math anxiety) to domain-specific
performance (such as math performance) because affect measures overlap and thus are
difficult to differentiate.
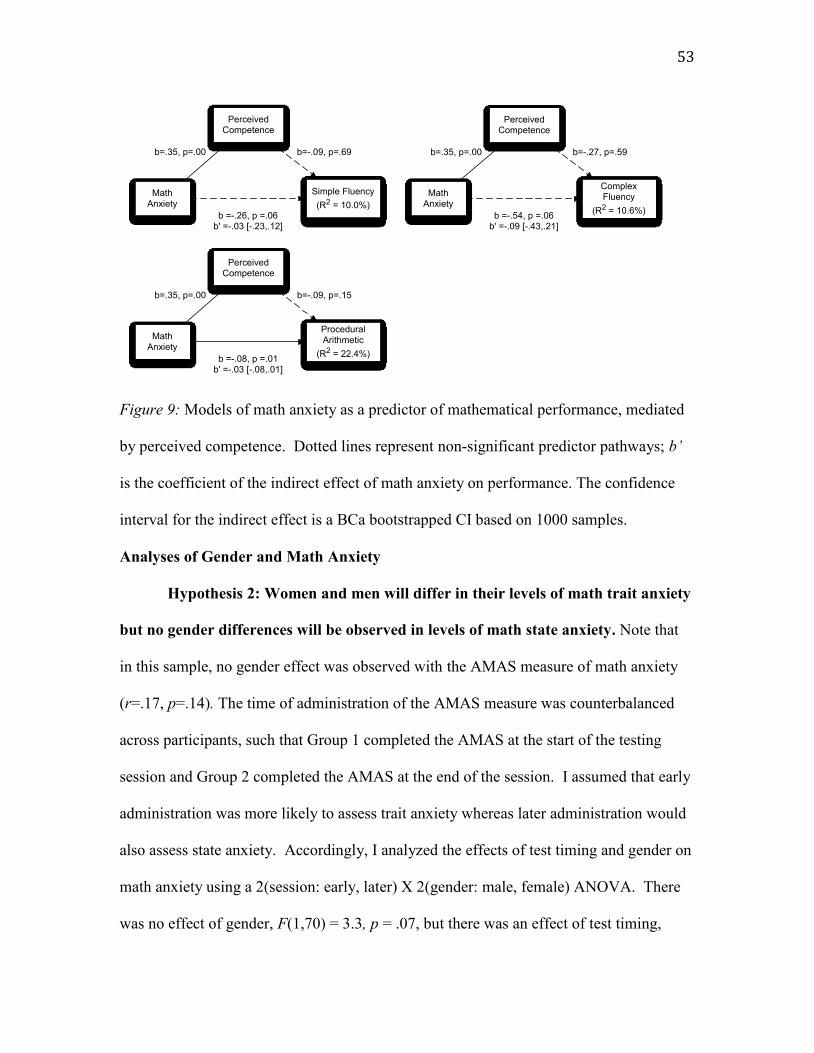
53
Figure 9: Models of math anxiety as a predictor of mathematical performance, mediated
by perceived competence. Dotted lines represent non-significant predictor pathways; b’
is the coefficient of the indirect effect of math anxiety on performance. The confidence
interval for the indirect effect is a BCa bootstrapped CI based on 1000 samples.
Analyses of Gender and Math Anxiety
Hypothesis 2: Women and men will differ in their levels of math trait anxiety
but no gender differences will be observed in levels of math state anxiety. Note that
in this sample, no gender effect was observed with the AMAS measure of math anxiety
(r=.17, p=.14). The time of administration of the AMAS measure was counterbalanced
across participants, such that Group 1 completed the AMAS at the start of the testing
session and Group 2 completed the AMAS at the end of the session. I assumed that early
administration was more likely to assess trait anxiety whereas later administration would
also assess state anxiety. Accordingly, I analyzed the effects of test timing and gender on
math anxiety using a 2(session: early, later) X 2(gender: male, female) ANOVA. There
was no effect of gender, F(1,70) = 3.3, p = .07, but there was an effect of test timing,
Math Anxiety
Perceived Competence
Simple Fluency
(R2 = 10.0%)b =-.26, p =.06
b' =-.03 [-.23,.12]
b=.35, p=.00 b=-.09, p=.69
Math Anxiety
Perceived Competence
Complex Fluency
(R2 = 10.6%)b =-.54, p =.06
b' =-.09 [-.43,.21]
b=.35, p=.00 b=-.27, p=.59
Math Anxiety
Perceived Competence
Procedural Arithmetic
(R2 = 22.4%)b =-.08, p =.01
b' =-.03 [-.08,.01]
b=.35, p=.00 b=-.09, p=.15
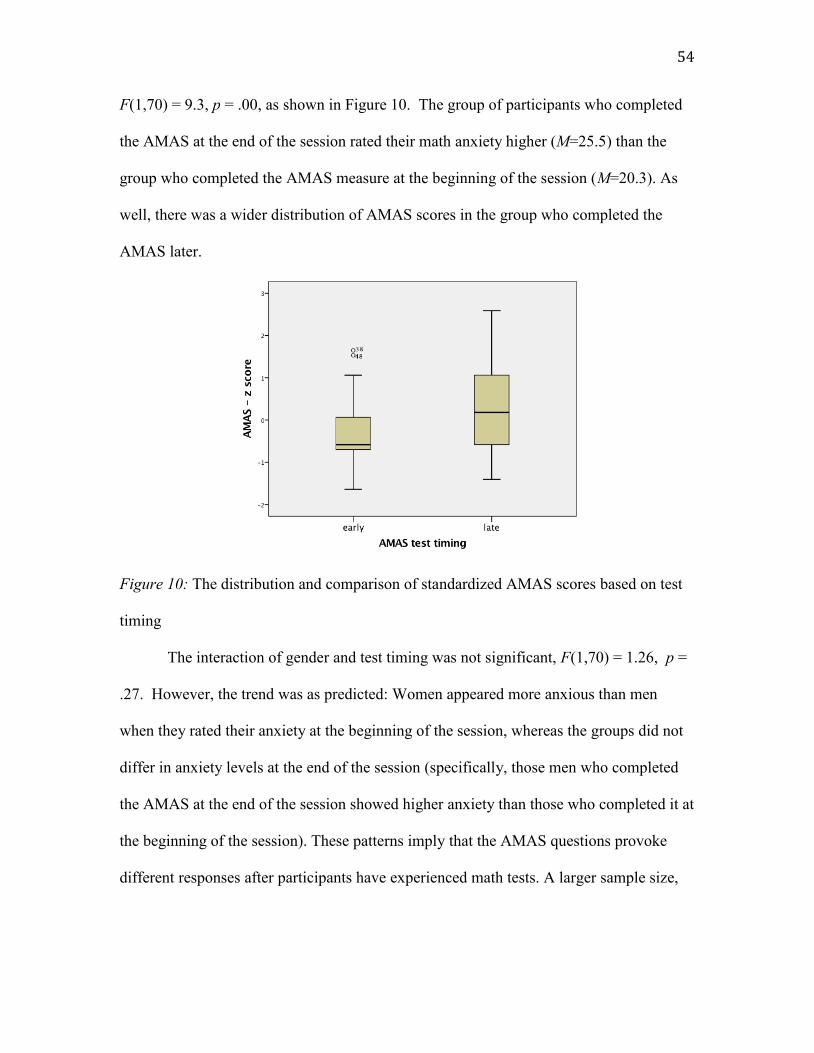
54
F(1,70) = 9.3, p = .00, as shown in Figure 10. The group of participants who completed
the AMAS at the end of the session rated their math anxiety higher (M=25.5) than the
group who completed the AMAS measure at the beginning of the session (M=20.3). As
well, there was a wider distribution of AMAS scores in the group who completed the
AMAS later.
Figure 10: The distribution and comparison of standardized AMAS scores based on test
timing
The interaction of gender and test timing was not significant, F(1,70) = 1.26, p =
.27. However, the trend was as predicted: Women appeared more anxious than men
when they rated their anxiety at the beginning of the session, whereas the groups did not
differ in anxiety levels at the end of the session (specifically, those men who completed
the AMAS at the end of the session showed higher anxiety than those who completed it at
the beginning of the session). These patterns imply that the AMAS questions provoke
different responses after participants have experienced math tests. A larger sample size,
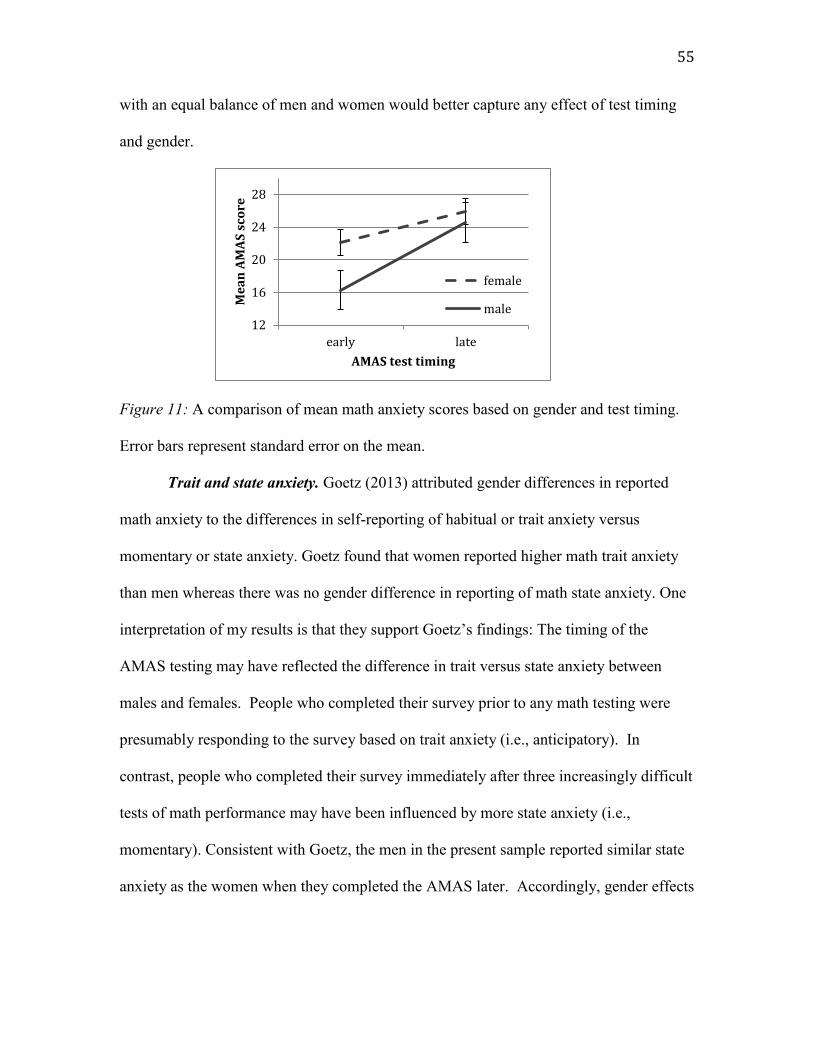
55
with an equal balance of men and women would better capture any effect of test timing
and gender.
Figure 11: A comparison of mean math anxiety scores based on gender and test timing.
Error bars represent standard error on the mean.
Trait and state anxiety. Goetz (2013) attributed gender differences in reported
math anxiety to the differences in self-reporting of habitual or trait anxiety versus
momentary or state anxiety. Goetz found that women reported higher math trait anxiety
than men whereas there was no gender difference in reporting of math state anxiety. One
interpretation of my results is that they support Goetz’s findings: The timing of the
AMAS testing may have reflected the difference in trait versus state anxiety between
males and females. People who completed their survey prior to any math testing were
presumably responding to the survey based on trait anxiety (i.e., anticipatory). In
contrast, people who completed their survey immediately after three increasingly difficult
tests of math performance may have been influenced by more state anxiety (i.e.,
momentary). Consistent with Goetz, the men in the present sample reported similar state
anxiety as the women when they completed the AMAS later. Accordingly, gender effects
12
16
20
24
28
early late
Me
an
AM
AS
sco
re
AMAS test timing
female
male
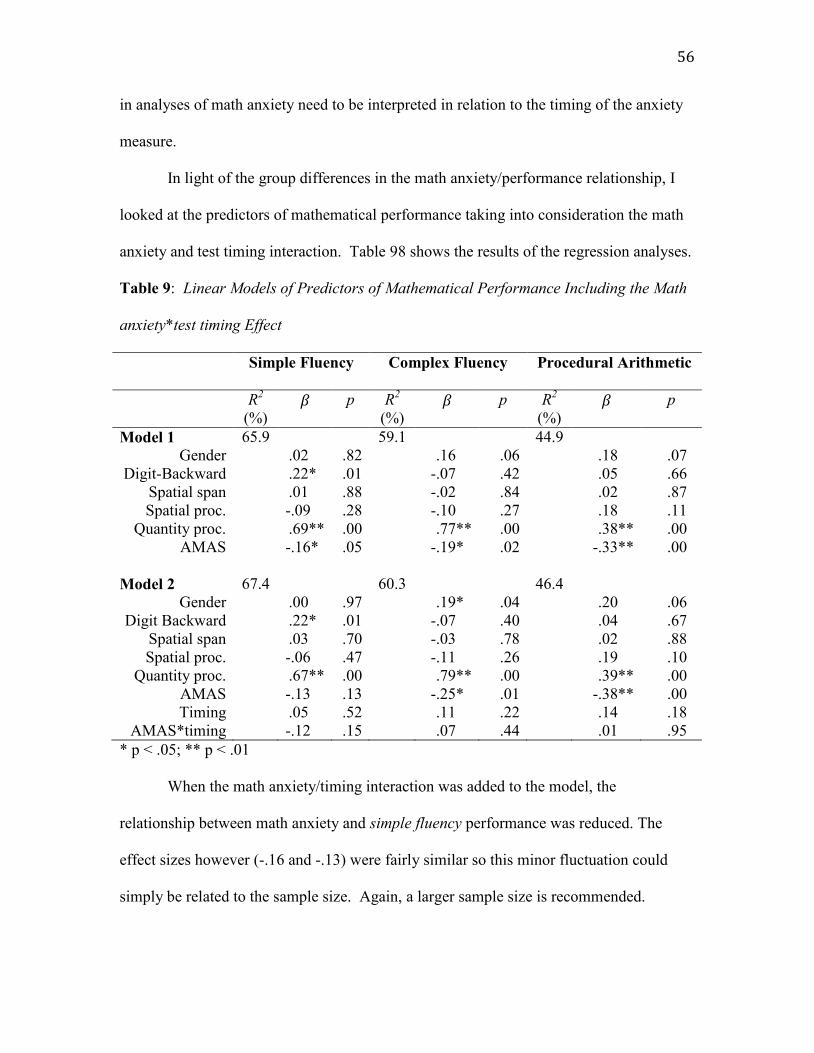
56
in analyses of math anxiety need to be interpreted in relation to the timing of the anxiety
measure.
In light of the group differences in the math anxiety/performance relationship, I
looked at the predictors of mathematical performance taking into consideration the math
anxiety and test timing interaction. Table 98 shows the results of the regression analyses.
Table 9: Linear Models of Predictors of Mathematical Performance Including the Math
anxiety*test timing Effect
Simple Fluency Complex Fluency Procedural Arithmetic
R2
(%)
p R2
(%) p R
2
(%) p
Model 1 65.9 59.1 44.9
Gender .02 .82 .16 .06 .18 .07
Digit-Backward .22* .01 -.07 .42 .05 .66
Spatial span .01 .88 -.02 .84 .02 .87
Spatial proc. -.09 .28 -.10 .27 .18 .11
Quantity proc. .69** .00 .77** .00 .38** .00
AMAS -.16* .05 -.19* .02 -.33** .00
Model 2 67.4 60.3 46.4
Gender .00 .97 .19* .04 .20 .06
Digit Backward .22* .01 -.07 .40 .04 .67
Spatial span .03 .70 -.03 .78 .02 .88
Spatial proc. -.06 .47 -.11 .26 .19 .10
Quantity proc. .67** .00 .79** .00 .39** .00
AMAS -.13 .13 -.25* .01 -.38** .00
Timing .05 .52 .11 .22 .14 .18
AMAS*timing -.12 .15 .07 .44 .01 .95
* p < .05; ** p < .01
When the math anxiety/timing interaction was added to the model, the
relationship between math anxiety and simple fluency performance was reduced. The
effect sizes however (-.16 and -.13) were fairly similar so this minor fluctuation could
simply be related to the sample size. Again, a larger sample size is recommended.
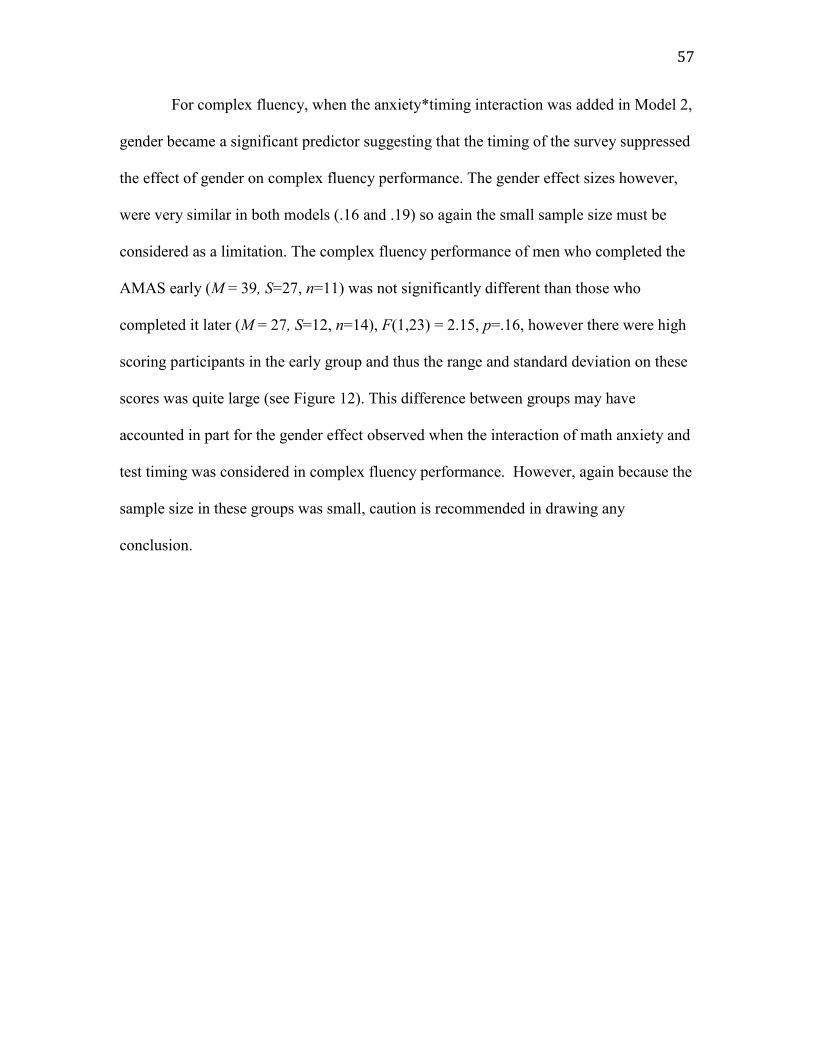
57
For complex fluency, when the anxiety*timing interaction was added in Model 2,
gender became a significant predictor suggesting that the timing of the survey suppressed
the effect of gender on complex fluency performance. The gender effect sizes however,
were very similar in both models (.16 and .19) so again the small sample size must be
considered as a limitation. The complex fluency performance of men who completed the
AMAS early (M = 39, S=27, n=11) was not significantly different than those who
completed it later (M = 27, S=12, n=14), F(1,23) = 2.15, p=.16, however there were high
scoring participants in the early group and thus the range and standard deviation on these
scores was quite large (see Figure 12). This difference between groups may have
accounted in part for the gender effect observed when the interaction of math anxiety and
test timing was considered in complex fluency performance. However, again because the
sample size in these groups was small, caution is recommended in drawing any
conclusion.
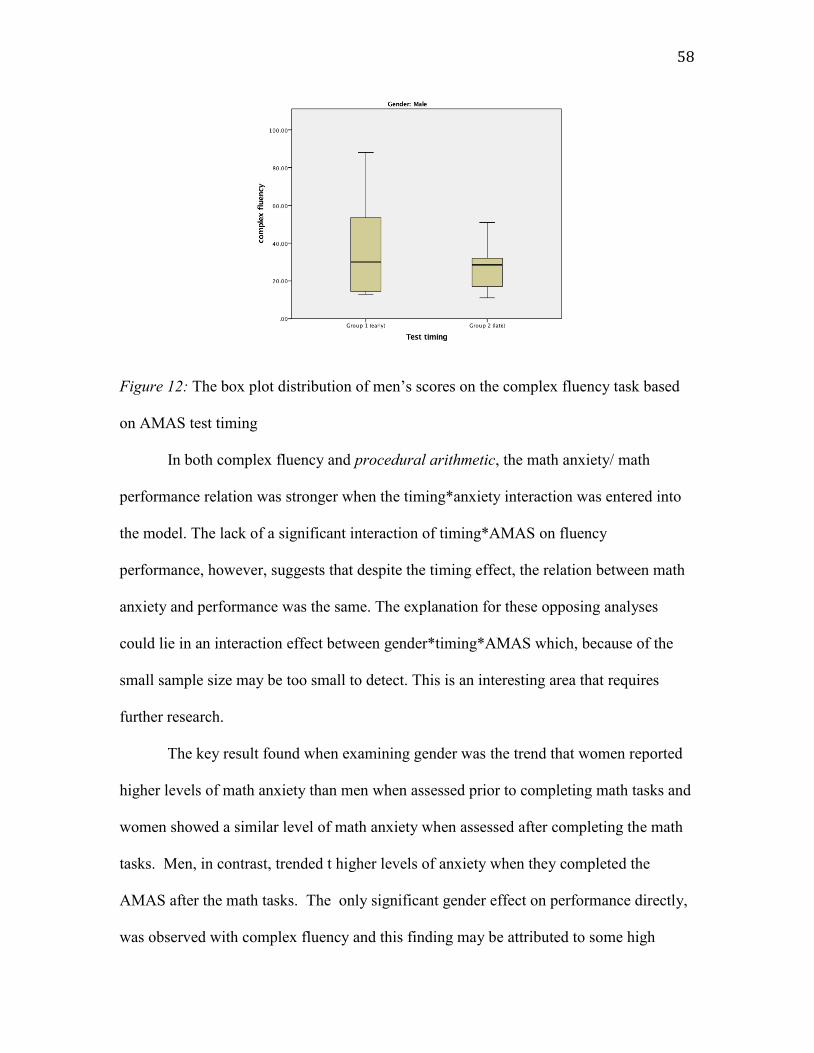
58
Figure 12: The box plot distribution of men’s scores on the complex fluency task based
on AMAS test timing
In both complex fluency and procedural arithmetic, the math anxiety/ math
performance relation was stronger when the timing*anxiety interaction was entered into
the model. The lack of a significant interaction of timing*AMAS on fluency
performance, however, suggests that despite the timing effect, the relation between math
anxiety and performance was the same. The explanation for these opposing analyses
could lie in an interaction effect between gender*timing*AMAS which, because of the
small sample size may be too small to detect. This is an interesting area that requires
further research.
The key result found when examining gender was the trend that women reported
higher levels of math anxiety than men when assessed prior to completing math tasks and
women showed a similar level of math anxiety when assessed after completing the math
tasks. Men, in contrast, trended t higher levels of anxiety when they completed the
AMAS after the math tasks. The only significant gender effect on performance directly,
was observed with complex fluency and this finding may be attributed to some high
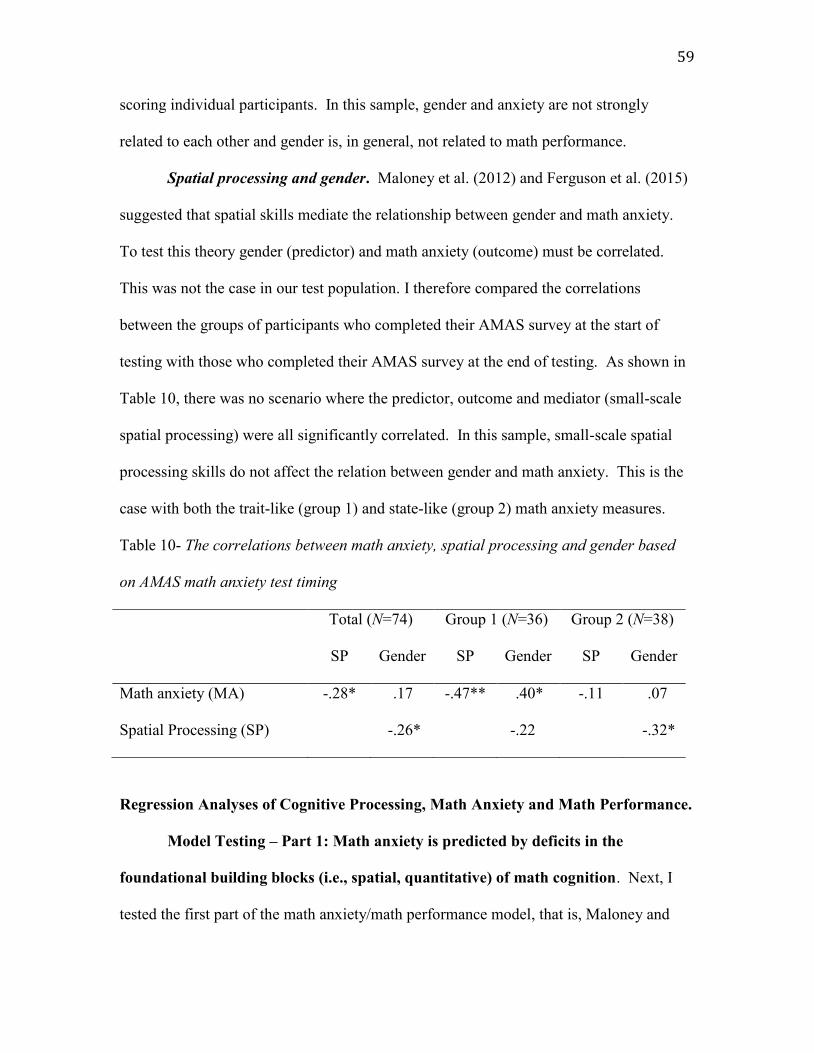
59
scoring individual participants. In this sample, gender and anxiety are not strongly
related to each other and gender is, in general, not related to math performance.
Spatial processing and gender. Maloney et al. (2012) and Ferguson et al. (2015)
suggested that spatial skills mediate the relationship between gender and math anxiety.
To test this theory gender (predictor) and math anxiety (outcome) must be correlated.
This was not the case in our test population. I therefore compared the correlations
between the groups of participants who completed their AMAS survey at the start of
testing with those who completed their AMAS survey at the end of testing. As shown in
Table 10, there was no scenario where the predictor, outcome and mediator (small-scale
spatial processing) were all significantly correlated. In this sample, small-scale spatial
processing skills do not affect the relation between gender and math anxiety. This is the
case with both the trait-like (group 1) and state-like (group 2) math anxiety measures.
Table 10- The correlations between math anxiety, spatial processing and gender based
on AMAS math anxiety test timing
Total (N=74) Group 1 (N=36) Group 2 (N=38)
SP Gender SP Gender SP Gender
Math anxiety (MA) -.28* .17 -.47** .40* -.11 .07
Spatial Processing (SP) -.26* -.22 -.32*
Regression Analyses of Cognitive Processing, Math Anxiety and Math Performance.
Model Testing – Part 1: Math anxiety is predicted by deficits in the
foundational building blocks (i.e., spatial, quantitative) of math cognition. Next, I
tested the first part of the math anxiety/math performance model, that is, Maloney and
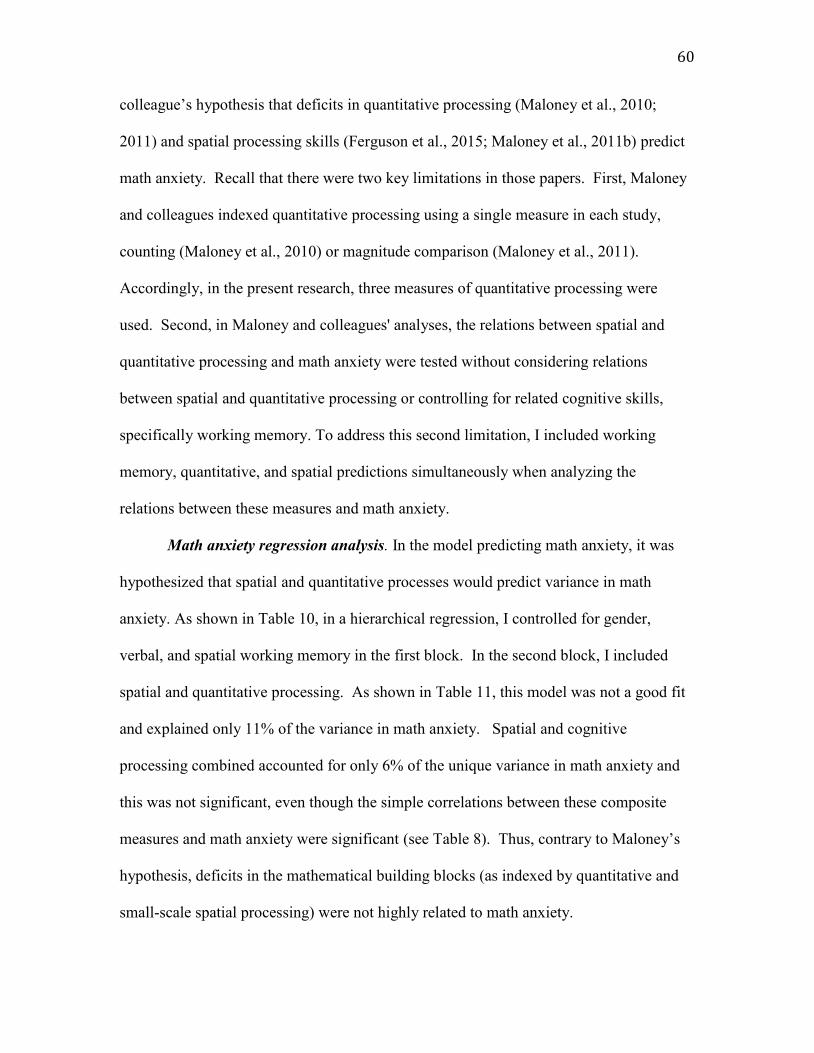
60
colleague’s hypothesis that deficits in quantitative processing (Maloney et al., 2010;
2011) and spatial processing skills (Ferguson et al., 2015; Maloney et al., 2011b) predict
math anxiety. Recall that there were two key limitations in those papers. First, Maloney
and colleagues indexed quantitative processing using a single measure in each study,
counting (Maloney et al., 2010) or magnitude comparison (Maloney et al., 2011).
Accordingly, in the present research, three measures of quantitative processing were
used. Second, in Maloney and colleagues' analyses, the relations between spatial and
quantitative processing and math anxiety were tested without considering relations
between spatial and quantitative processing or controlling for related cognitive skills,
specifically working memory. To address this second limitation, I included working
memory, quantitative, and spatial predictions simultaneously when analyzing the
relations between these measures and math anxiety.
Math anxiety regression analysis. In the model predicting math anxiety, it was
hypothesized that spatial and quantitative processes would predict variance in math
anxiety. As shown in Table 10, in a hierarchical regression, I controlled for gender,
verbal, and spatial working memory in the first block. In the second block, I included
spatial and quantitative processing. As shown in Table 11, this model was not a good fit
and explained only 11% of the variance in math anxiety. Spatial and cognitive
processing combined accounted for only 6% of the unique variance in math anxiety and
this was not significant, even though the simple correlations between these composite
measures and math anxiety were significant (see Table 8). Thus, contrary to Maloney’s
hypothesis, deficits in the mathematical building blocks (as indexed by quantitative and
small-scale spatial processing) were not highly related to math anxiety.
61
Table 11: Linear Model of Predictors for Math Anxiety
R2(%) R
2 p
Model 1 4.9 4.9
Gender .17 .17
Digits Backwards -.14 .25
Spatial Span -.05 .67
Model 2 10.8 5.9
Gender .08 .51
Digit Backwards -.05 .70
Spatial Span .04 .76
Spatial processing -.17 .22
Quantity processing -.18 .21
As an additional analysis, to better understand the correlation between math
anxiety and quantity processing, I looked at the shared variance between math anxiety,
quantity processing and working memory. The relation between math anxiety and
quantity processing was partially accounted for by working memory as shown in Table
12. As math anxiety was not directly related to working memory capacity, this suggests
that on-line working memory (that is the working memory available during task
performance) may account for some of the relation between math anxiety and quantity
processing. This corresponds to theories that anxiety reactions can lead to reductions in
on-line working memory capacity (Ashcraft & Krause, 2007; Ashcraft & Moore, 2009;
Beilock, 2008; Beilock & DeCaro, 2007; Hopko et al., 2002; Lyons & Beilock; 2012).
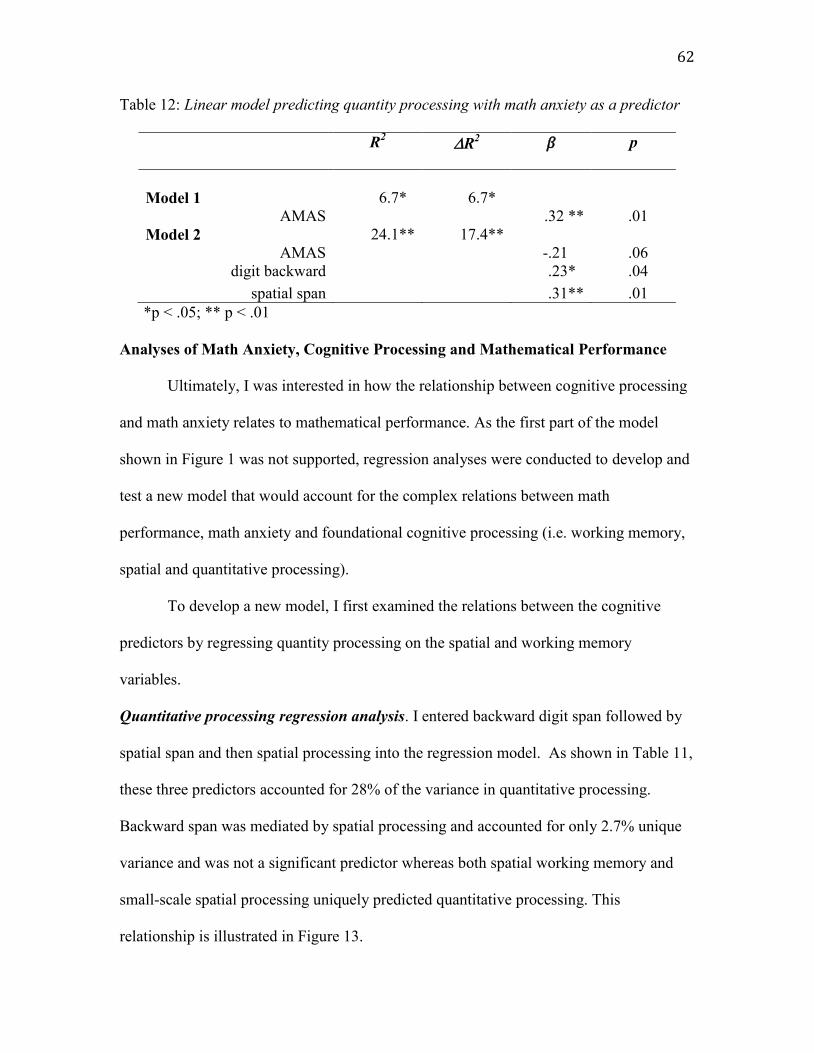
62
Table 12: Linear model predicting quantity processing with math anxiety as a predictor
R2
R2 p
Model 1 6.7* 6.7*
AMAS .32 ** .01
Model 2 24.1** 17.4**
AMAS -.21 .06
digit backward .23* .04
spatial span .31** .01
*p < .05; ** p < .01
Analyses of Math Anxiety, Cognitive Processing and Mathematical Performance
Ultimately, I was interested in how the relationship between cognitive processing
and math anxiety relates to mathematical performance. As the first part of the model
shown in Figure 1 was not supported, regression analyses were conducted to develop and
test a new model that would account for the complex relations between math
performance, math anxiety and foundational cognitive processing (i.e. working memory,
spatial and quantitative processing).
To develop a new model, I first examined the relations between the cognitive
predictors by regressing quantity processing on the spatial and working memory
variables.
Quantitative processing regression analysis. I entered backward digit span followed by
spatial span and then spatial processing into the regression model. As shown in Table 11,
these three predictors accounted for 28% of the variance in quantitative processing.
Backward span was mediated by spatial processing and accounted for only 2.7% unique
variance and was not a significant predictor whereas both spatial working memory and
small-scale spatial processing uniquely predicted quantitative processing. This
relationship is illustrated in Figure 13.
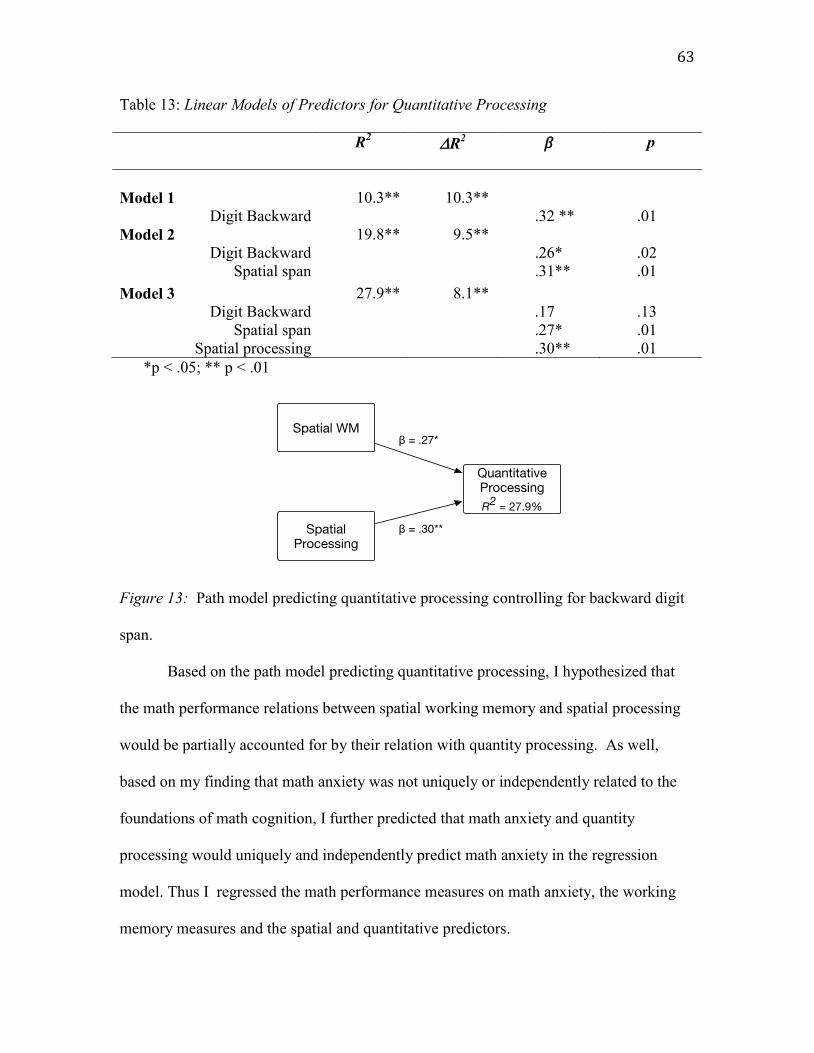
63
Table 13: Linear Models of Predictors for Quantitative Processing
R2
R2 p
Model 1 10.3** 10.3**
Digit Backward .32 ** .01
Model 2 19.8** 9.5**
Digit Backward .26* .02
Spatial span .31** .01
Model 3 27.9** 8.1**
Digit Backward .17 .13
Spatial span .27* .01
Spatial processing .30** .01
*p < .05; ** p < .01
Figure 13: Path model predicting quantitative processing controlling for backward digit
span.
Based on the path model predicting quantitative processing, I hypothesized that
the math performance relations between spatial working memory and spatial processing
would be partially accounted for by their relation with quantity processing. As well,
based on my finding that math anxiety was not uniquely or independently related to the
foundations of math cognition, I further predicted that math anxiety and quantity
processing would uniquely and independently predict math anxiety in the regression
model. Thus I regressed the math performance measures on math anxiety, the working
memory measures and the spatial and quantitative predictors.
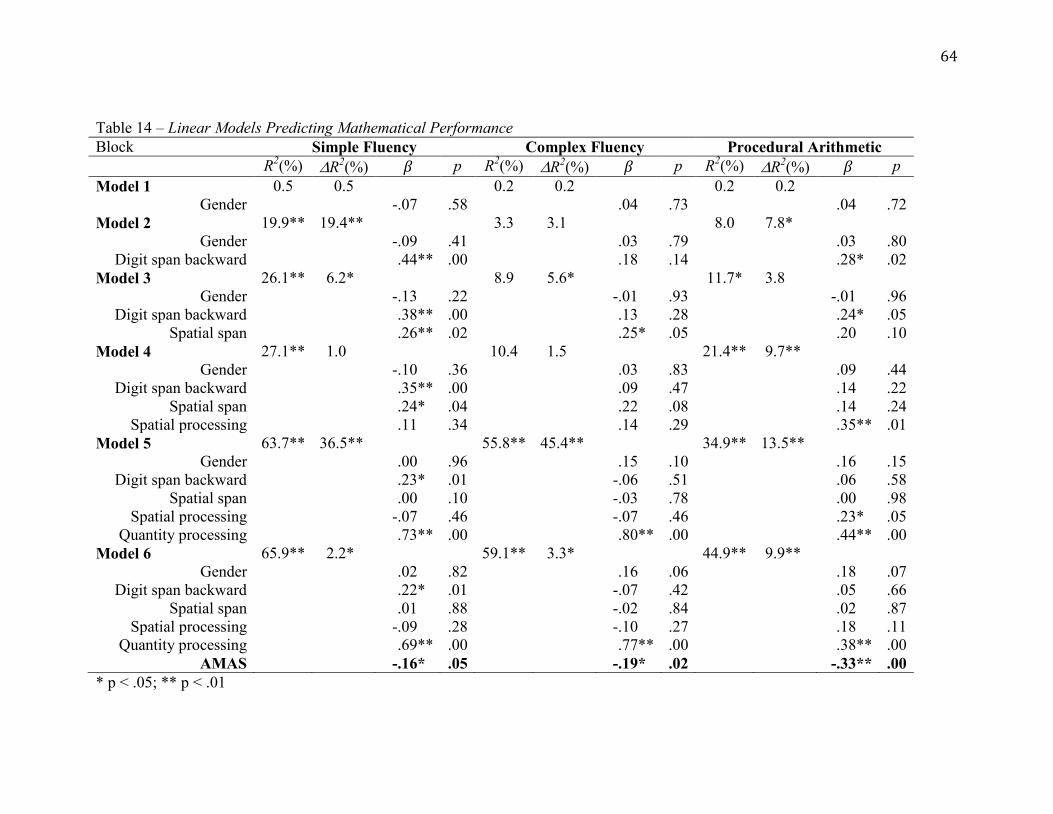
64
Table 14 – Linear Models Predicting Mathematical Performance
Block Simple Fluency Complex Fluency Procedural Arithmetic
R2(%) R
2(%) p R
2(%) R
2(%) p R
2(%) R
2(%) p
Model 1 0.5 0.5 0.2 0.2 0.2 0.2
Gender -.07 .58 .04 .73 .04 .72
Model 2 19.9** 19.4** 3.3 3.1 8.0 7.8*
Gender -.09 .41 .03 .79 .03 .80
Digit span backward .44** .00 .18 .14 .28* .02
Model 3 26.1** 6.2* 8.9 5.6* 11.7* 3.8
Gender -.13 .22 -.01 .93 -.01 .96
Digit span backward .38** .00 .13 .28 .24* .05
Spatial span .26** .02 .25* .05 .20 .10
Model 4 27.1** 1.0 10.4 1.5 21.4** 9.7**
Gender -.10 .36 .03 .83 .09 .44
Digit span backward .35** .00 .09 .47 .14 .22
Spatial span .24* .04 .22 .08 .14 .24
Spatial processing .11 .34 .14 .29 .35** .01
Model 5 63.7** 36.5** 55.8** 45.4** 34.9** 13.5**
Gender .00 .96 .15 .10 .16 .15
Digit span backward .23* .01 -.06 .51 .06 .58
Spatial span .00 .10 -.03 .78 .00 .98
Spatial processing -.07 .46 -.07 .46 .23* .05
Quantity processing .73** .00 .80** .00 .44** .00
Model 6 65.9** 2.2* 59.1** 3.3* 44.9** 9.9**
Gender .02 .82 .16 .06 .18 .07
Digit span backward .22* .01 -.07 .42 .05 .66
Spatial span .01 .88 -.02 .84 .02 .87
Spatial processing -.09 .28 -.10 .27 .18 .11
Quantity processing .69** .00 .77** .00 .38** .00
AMAS -.16* .05 -.19* .02 -.33** .00
* p < .05; ** p < .01
65
As shown in Table 14, in the first block of the hierarchical regression, I controlled for
gender. Digit span backward was entered into the second block. In this block (Model 2) the
backward digit span was significantly related to both the simple fluency and procedural
arithmetic measures. This was expected as discussed previously, these measures are
correlated. In the third block, spatial span was entered and it was significantly related to both
the simple and complex fluency measures. In block four, the spatial processing factor was
entered. The relation between spatial span and all performance measures was marginally
reduced when spatial processing was entered into the regression. This suggests spatial
processing and spatial span share some overlap when predicting variance in math
performance. In block four spatial processing was significantly related to performance in
procedural arithmetic. As well, the relation between backward digit span and procedural
arithmetic was no longer significant. Thus spatial processing is accounting for some of the
relation between the backward digit span and procedural arithmetic. This result is not
surprising as spatial processing also mediated the relation between backward digit span and
quantity processing as shown in Table 11.
In the fifth block, quantity processing was entered into the regression. Quantity
processing was a significant predictor of performance for all math outcomes. As well, the
strength of relations for all previously entered predictors (i.e. digit span backwards, spatial
span and spatial processing) and math performance was reduced. This was evidenced by the
reduction in effect size as indicated by the decrease in beta values and the increase in p
values. Again, this result was expected as spatial span and spatial processing are uniquely
and independently related to quantity processing as shown in Table 11.
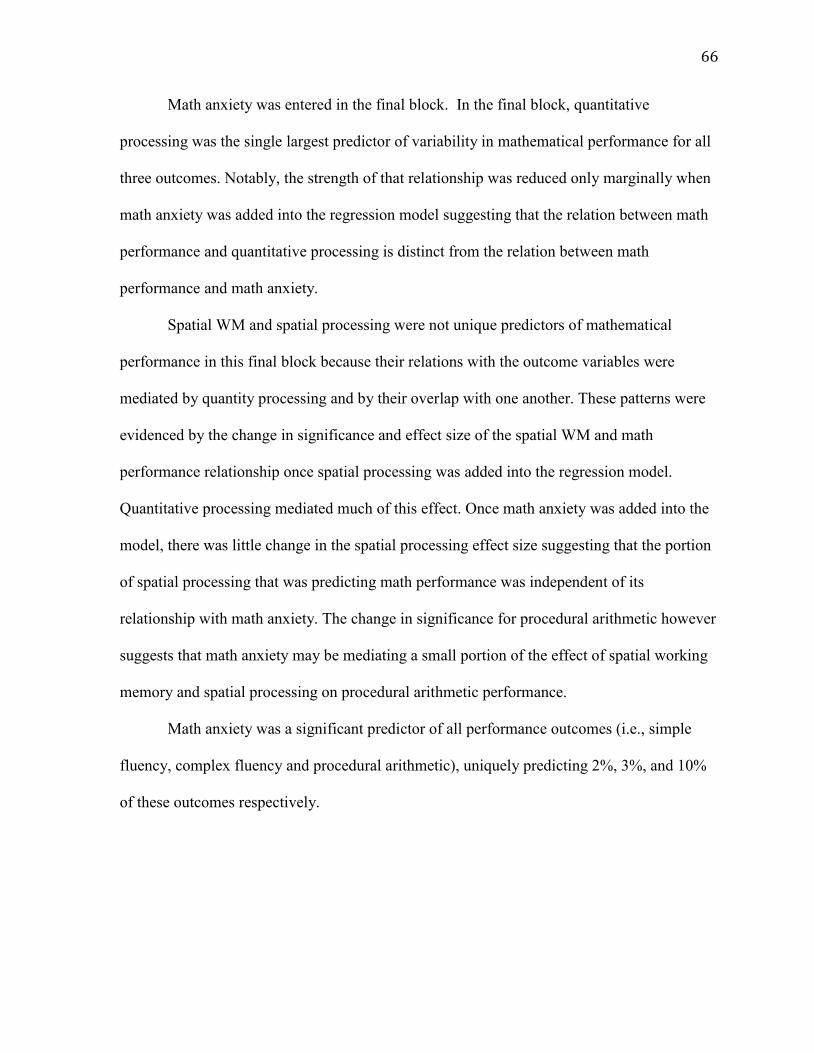
66
Math anxiety was entered in the final block. In the final block, quantitative
processing was the single largest predictor of variability in mathematical performance for all
three outcomes. Notably, the strength of that relationship was reduced only marginally when
math anxiety was added into the regression model suggesting that the relation between math
performance and quantitative processing is distinct from the relation between math
performance and math anxiety.
Spatial WM and spatial processing were not unique predictors of mathematical
performance in this final block because their relations with the outcome variables were
mediated by quantity processing and by their overlap with one another. These patterns were
evidenced by the change in significance and effect size of the spatial WM and math
performance relationship once spatial processing was added into the regression model.
Quantitative processing mediated much of this effect. Once math anxiety was added into the
model, there was little change in the spatial processing effect size suggesting that the portion
of spatial processing that was predicting math performance was independent of its
relationship with math anxiety. The change in significance for procedural arithmetic however
suggests that math anxiety may be mediating a small portion of the effect of spatial working
memory and spatial processing on procedural arithmetic performance.
Math anxiety was a significant predictor of all performance outcomes (i.e., simple
fluency, complex fluency and procedural arithmetic), uniquely predicting 2%, 3%, and 10%
of these outcomes respectively.
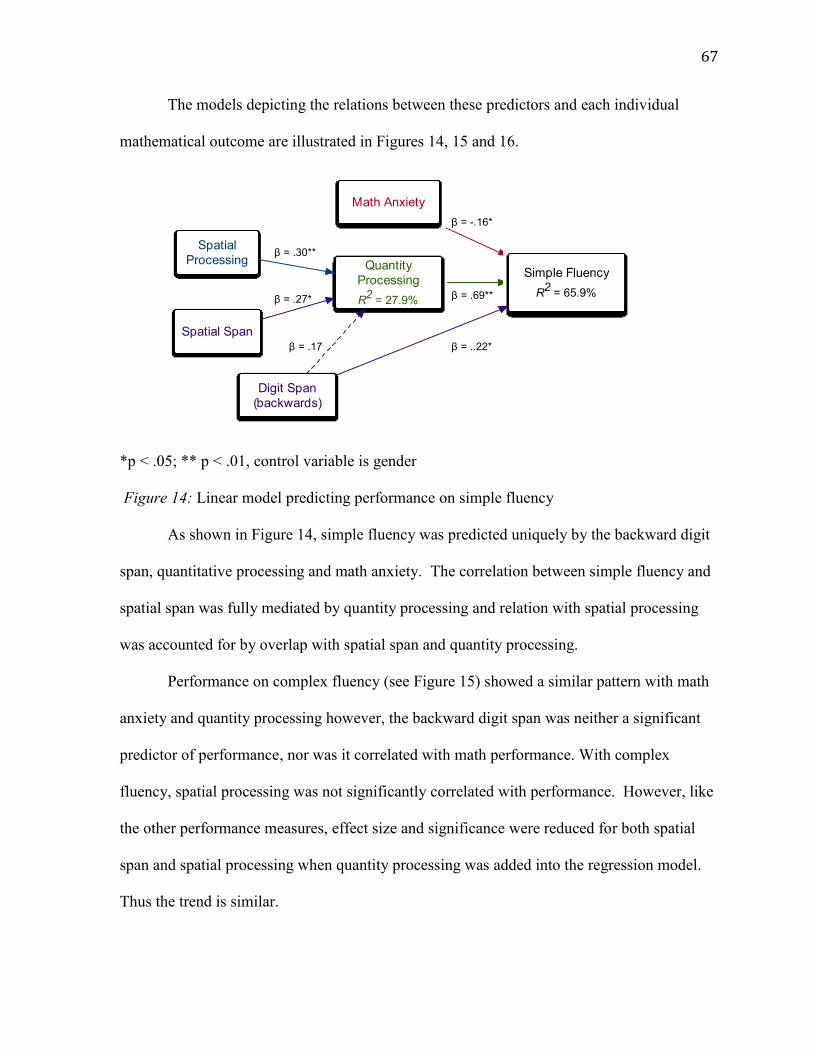
67
The models depicting the relations between these predictors and each individual
mathematical outcome are illustrated in Figures 14, 15 and 16.
*p < .05; ** p < .01, control variable is gender
Figure 14: Linear model predicting performance on simple fluency
As shown in Figure 14, simple fluency was predicted uniquely by the backward digit
span, quantitative processing and math anxiety. The correlation between simple fluency and
spatial span was fully mediated by quantity processing and relation with spatial processing
was accounted for by overlap with spatial span and quantity processing.
Performance on complex fluency (see Figure 15) showed a similar pattern with math
anxiety and quantity processing however, the backward digit span was neither a significant
predictor of performance, nor was it correlated with math performance. With complex
fluency, spatial processing was not significantly correlated with performance. However, like
the other performance measures, effect size and significance were reduced for both spatial
span and spatial processing when quantity processing was added into the regression model.
Thus the trend is similar.
Simple Fluency
R2 = 65.9%
Math Anxiety
Quantity
Processing
R2
= 27.9%
Digit Span
(backwards)
Spatial
Processing
Spatial Span
β = .30**
β = .27*
β = .17
β = -.16*
β = .69**
β = ..22*
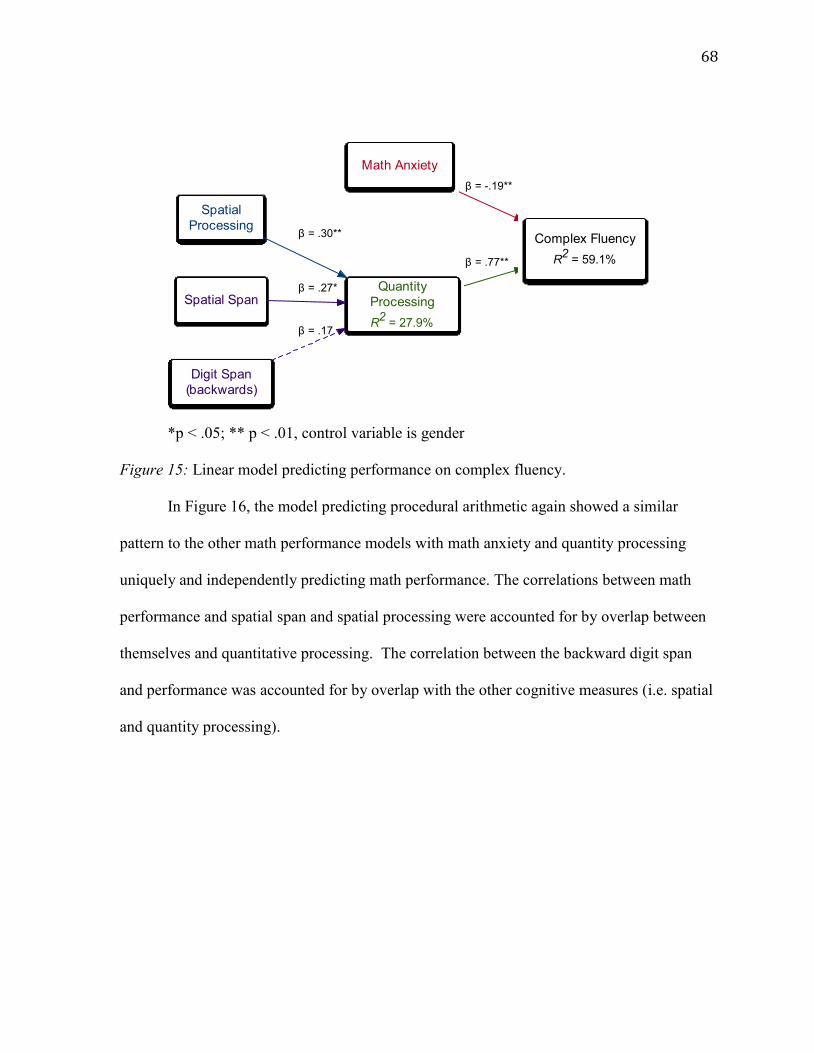
68
*p < .05; ** p < .01, control variable is gender
Figure 15: Linear model predicting performance on complex fluency.
In Figure 16, the model predicting procedural arithmetic again showed a similar
pattern to the other math performance models with math anxiety and quantity processing
uniquely and independently predicting math performance. The correlations between math
performance and spatial span and spatial processing were accounted for by overlap between
themselves and quantitative processing. The correlation between the backward digit span
and performance was accounted for by overlap with the other cognitive measures (i.e. spatial
and quantity processing).
Complex Fluency
R2 = 59.1%
Math Anxiety
Quantity
Processing
R2
= 27.9%
Digit Span
(backwards)
Spatial
Processing
Spatial Span
β = .30**
β = .27*
β = .17
β = -.19**
β = .77**
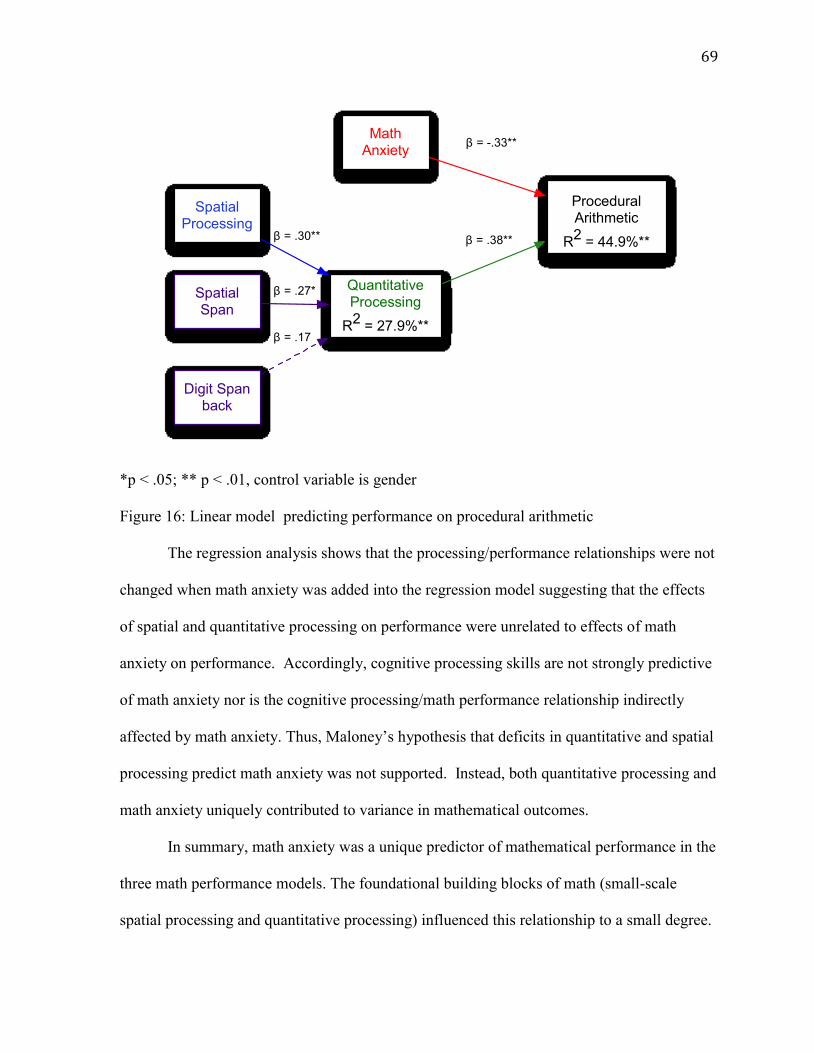
69
*p < .05; ** p < .01, control variable is gender
Figure 16: Linear model predicting performance on procedural arithmetic
The regression analysis shows that the processing/performance relationships were not
changed when math anxiety was added into the regression model suggesting that the effects
of spatial and quantitative processing on performance were unrelated to effects of math
anxiety on performance. Accordingly, cognitive processing skills are not strongly predictive
of math anxiety nor is the cognitive processing/math performance relationship indirectly
affected by math anxiety. Thus, Maloney’s hypothesis that deficits in quantitative and spatial
processing predict math anxiety was not supported. Instead, both quantitative processing and
math anxiety uniquely contributed to variance in mathematical outcomes.
In summary, math anxiety was a unique predictor of mathematical performance in the
three math performance models. The foundational building blocks of math (small-scale
spatial processing and quantitative processing) influenced this relationship to a small degree.
Procedural Arithmetic
R2 = 44.9%**
Math Anxiety
Quantitative Processing
R2 = 27.9%**
Spatial Processing
Digit Span back
β = .38**
β = -.33**
Spatial Span
β = .30**
β = .27*
β = .17

70
This suggests that math anxiety is an acquired or learned condition related to experiences in
learning mathematics, not a condition attributed to low-level cognitive deficits in
mathematical processing.
71
Chapter 4: Discussion
In the present study, I focused on developing a clearer understanding of the risk
factors associated with math anxiety by linking the research on foundational mathematical
processing with the math attitudes and performance observed in math- anxious adults. The
goal was to address gaps in the existing research and evaluate untested hypotheses. Personal
and cognitive influences included math competence, gender, attentional processes, spatial
skills, and symbolic quantity processing. I will address the two hypotheses and the model
proposed in the introduction, discuss the limitations of this work, and propose future research
to extend our understanding of math anxiety.
The first research question related to perceived math competence. Elliot (1999)
hypothesized that perceived competence would influence the relation between anxiety and
performance. In the current study, this relationship was extended to include math-specific
anxiety and performance. My results showed that perceived math competence did not
mediate the relationship between math anxiety and performance. This result suggests that
math anxiety was too strongly related to perceived math competence to distinguish any
independent effects on mathematical performance.
The second research question related to math anxiety levels by gender. Some
researchers report that women have higher levels of math anxiety than men whereas other
researchers do not find a difference. In the current study, I examined two potential
explanations for this inconsistency: first, reporting differences in state versus trait anxiety
(Goetz, 2013) and second, poor spatial skills in women (Maloney et al., 2012; Ferguson et
al., 2015).
72
Goetz observed that girls reported higher levels of math trait anxiety than boys but
levels of math state anxiety were comparable for both genders. I observed a similar trend in
adults with women reporting higher anticipatory math (trait) anxiety than men prior to any
testing. Immediately after testing, however, math (state) anxiety measures were the same for
both men and women. This result supported Goetz’s hypothesis however, my result was not
statistically significant thus further testing is suggested.
Maloney et al. concluded that self-reported spatial skills fully accounted for the
differences in reported math anxiety levels between men and women. Ferguson et al.
extended this research to include a behavioral measure, mental rotation. They found mental
rotation partially mediated the gender and math anxiety relation. This finding was not
replicated in the current research. As in Ferguson et al.'s study (i.e., Experiment 4), math
anxiety levels did not differ significantly between men and women in this sample and thus
there was no opportunity for spatial skills to mediate the (non) relation. The inconsistent
results with gender and math anxiety are problematic when drawing conclusions about
gender effects. Presumably if a gender effect is observed, it will be a small effect. Thus it
may be more easily detected in a larger sample. For example, Ferguson et al. detected a
gender effect when combining data from two experiments (one with a large gender effect,
and one with a small non-significant gender effect), thus doubling their sample size to 497.
The current research did not support Maloney’s explanation that gender differences in math
anxiety are accounted for by differences in spatial processing abilities.
The first part of the model predicting the relations between math anxiety, cognitive
processing and math performance, tested Maloney et al.’s (2010; 2011; 2012) hypothesis that
low-level deficits in the foundational building blocks of math cognition are risk factors for
73
math anxiety. Consistent with the findings of Maloney and colleagues, I found correlations
between math anxiety and both spatial and symbolic quantity processing. However, these
foundational processes were also related to each other. Further, my results indicated that
working memory (backward digit span, spatial span) and spatial processing accounted for
substantial variance in quantitative processing (R2=27.9%). In contrast to the correlational
support, when math anxiety was regressed on gender, working memory and both spatial and
quantitative processing, spatial and quantity processing accounted for a non-significant 6% of
the variance in math anxiety. Thus, although spatial and quantity processing correlated
moderately with math anxiety (r=-.28 and r=-.26 respectively), they did not contribute
significantly to the variance in math anxiety when considered either independently or
together.
A plausible explanation for this discrepancy lies in the relations of both quantitative
and spatial processes with working memory. In this study, symbolic quantity processing was
indexed with timed tasks that consume working memory resources (i.e. counting and
sequencing). Presumably, the tasks themselves could provoke an anxiety response, thus
depleting working memory resources and compromising performance. Did I truly measure
foundational quantity knowledge or did I measure the effect of anxiety on foundational
quantity knowledge? To answer this question, I regressed math anxiety and working
memory on symbolic quantity processing. Because math anxiety did not correlate with
working memory, if there was an effect of working memory on the relation between math
anxiety and quantity processing, one explanation is an on-line reduction in working memory
related to math anxiety. Regressing math anxiety and working memory on symbolic quantity
processing, the relation between math anxiety and quantity processing was no longer
74
significant when working memory was controlled. Thus, contrary to Maloney’s prediction
that math anxiety is related to low-level deficits in foundational spatial and quantity
processing, my results support the explanation that for math-anxious adults, deficits in
foundational spatial and quantity processing are related to an on-line reduction in working
memory, not to skill deficits. Hence, my results were not consistent with the theory that math
anxiety mediates the relation between foundational skills and performance. Presumably,
other untested variables (e.g., parental influences, school influences, previous math
performance, test anxiety) play a more significant role in predicting math anxiety.
In the current study, quantitative processing was the single largest predictor of
mathematical performance compared with measures of working memory, spatial processing,
and math anxiety. The strength of the relation between quantity processing and math
performance was reduced only marginally when math anxiety was added into the regression
model. This finding suggests that the relation between math performance and quantitative
processing is distinct from the relation between math performance and math anxiety. This
pattern was found with simple fluency, complex fluency and procedural arithmetic.
Spatial span and spatial processing were not unique predictors of mathematical
performance because their relation with mathematical performance was mediated by quantity
processing and by their overlap with one another. Math anxiety did not mediate this relation
suggesting that effects of spatial processing on performance were also unrelated to effects of
math anxiety on performance.
Accordingly, cognitive processing skills did not strongly predict math anxiety in
adults. Nor is the cognitive processing and math performance relationship indirectly affected
by math anxiety. Thus, Maloney’s hypothesis that deficits in quantity and spatial processing
75
are risk factors for math anxiety was not supported. Instead, both quantitative and anxiety
predictors uniquely contributed to variance in mathematical outcomes.
Limitations
Several limitations of the current study should be noted. The first limitation relates to
the sample population. The sample population consisted of young adults, mostly
undergraduate students. Although this is typical in math anxiety research, a sample from a
more diverse population may yield different results. For example, previous research suggests
that math anxious students take fewer math classes and avoid career choices that involve
math prerequisites (Ashcraft, 2002). Based on this finding, I would expect to see a larger
effect of math anxiety on math performance in those who avoid higher level math courses.
Over 85% of our test population took either grade 12 or grade 13 math. In the wider
population, I would expect this proportion would be lower thus I would expect a larger effect
of math anxiety on performance. I do not however anticipate differences in the patterns of
relationships. In measuring gender effects, the sample was not evenly split between men and
women; only one third of the sample was men. This is typical in math anxiety research
because most samples come from populations of university students, however; it limits the
ability to adequately assess gender effects. Borderline effects would be more easily detected
in a larger, gender-balanced sample allowing us for example, to detect potential gender
differences in anxiety based on test timing.
Second, the PALS survey used to assess perceived math competence did not
effectively differentiate this construct from math anxiety. Exploring math anxiety with
domain-general personal measures such as perseverance, self-efficacy, or motivation may
have provided more meaningful information for analysis.
76
Third, the hypotheses linking cognitive foundations, math anxiety, and math
performance suggested that early foundational math abilities relate to later anxiety and later
performance. However, we cannot assume that performance results obtained for adults
signify low-level performance deficits in children. To adequately test whether early
foundational math processes influence the development of math anxiety, longitudinal studies
involving children are necessary. Longitudinal research would help researchers understand if
and when these foundational skills influence math anxiety. It is reasonable to assume that
there may be an effect of foundational processes on math anxiety in the early grades as
children are learning basic math skills and beginning to experience some math-related
anxiety (Harari et al., 2013; Jameson, 2013; Ramirez et al., 2013; Vukovic et al., 2012; Wu et
al., 2012). However, performance in these foundational processes does improve as children
develop (e.g. Lyons et al., 2014) thus it is difficult to extrapolate back from findings in adults
to suggest a relation in children.
Finally, math anxiety is related to other types of anxiety such as test anxiety and
general anxiety (Hembree, 1990, Ma, 1999). Yet there is support for the view that math
anxiety is a unique construct. For example, Ashcraft and Moore (2009) noted the moderate
correlations between math anxiety and general, trait, and state anxiety, suggesting that it is
related to more general forms of anxiety but also separable from these constructs. In
contrast, the high correlation with test anxiety suggests the two constructs are more closely
linked. Other researchers (e.g. Faust, 1992; Ashcraft, 1995) found that participants showed
physiological reactions when they were performing difficult math tasks as compared to when
they performed difficult verbal tasks, further supporting that math anxiety is a construct
uniquely related to math performance. As well, using fMRI analysis, Young et al. (2012)
77
reported that anxiety reactions related to math problem solving were related to math anxiety
levels but not to trait and state anxiety levels. Finally, in the current research, math anxiety
was shown to be distinct from language-related anxiety (see CMAS-A summary Appendix
1). So, although math anxiety is indeed a unique domain-specific construct, including some
measure of test anxiety would help clarify and quantify the unique relation between math
anxiety and math performance.
It would be interesting to look back at Stephanie in grade 2. Her report cards do not
indicate poor math performance and yet, she developed math anxiety. Our predictors of math
anxiety (gender, working memory, spatial processing and quantity processing) did not
adequately model individual differences in math anxiety. In fact, they only accounted for a
small portion of the variance in math anxiety. This is a further limitation of the study.
Including additional social and genetic influences would help create a model that better
captures relationships of key influences on math anxiety. For example, considering the role
of the classroom environment: teaching practices, timed testing, teacher attitudes, student
engagement, attitudes of peers; the role of the home environment: parent engagement, parent
and sibling attitudes, access to resources; the role of personal factors: perseverance, self-
efficacy; and considering genetic factors such as predisposition to anxiety. These may better
address what risk factors, or groups of risk factors played a role in Stephanie’s math anxiety.
Future research
The results of the present study suggested there might be a relation between gender
and reported levels of anxiety when timing of the math anxiety survey is varied (i.e.,
comparing anticipatory math anxiety levels with anxiety levels reported after a challenging
math test). Due to the small number of men in the current study however, no conclusions
78
could be drawn. Further research using a larger gender-balanced sample is recommended to
clarify if indeed gender differences in math anxiety are related to test timing. As well,
including physiological measures of anxiety such as cortisol levels and skin conductance
could provide additional information to better characterize gender-related differences in math
anxiety.
Elliot’s (1999) hypothesis that perceived competence influences the relationship
between anxiety and performance was theoretically based on distinctions between approach
and avoidance motivation. This is an area of opportunity. Future research with personal
factors more easily distinguished from math anxiety (e.g. perseverance, self-efficacy) may
help extend our understanding of social risk factors and their influence on math anxiety.
Further, methodologies that consider behavioral approaches to anxiety such as measuring
avoidance behaviors may extend our theoretical understanding of the mechanisms through
which these social factors impact behaviors in math anxious adults.
In examining the math anxiety and math performance relationship, the finding that
the math evaluation factor correlated with math performance and the math learning factor did
not was an unanticipated result and one that should be examined further. As I was unable to
find previous literature exploring the component relations of the math anxiety scale, further
testing with a larger sample may provide insights. Alternatively, approaching other
researchers and breaking down and analyzing their results in a meta-analysis may yield
useful results. For example, if the math evaluation factor is accounting for most of the
performance relation, strategies targeted at reducing test-related anxiety may prove fruitful.
Past research found correlations between math anxiety and spatial processes
(Maloney et al., 2012; Miller & Bischel, 2004; Ferguson et al., 2015) and quantity processes
79
(Maloney et al., 2010, 2011; Nunez-Pena & Suarez-Pellicioni, 2014). However, the
correlational data did not tell the whole story. As shown in this study, these predictors did not
significantly predict math anxiety in regression models that included standard control
measures. To effectively model math anxiety, a more complete battery of potential risk
factors should be tested. Including predictors such as trait anxiety, test anxiety, self-efficacy
and other environmental factors would better capture the relative contributions of these
predictors for a more useful model of math anxiety. This in fact, is one of the difficulties in
math anxiety research. Typically, predictors are analyzed in isolation. Understanding which
are the “key” players could help researchers develop more targeted interventions to alleviate
math anxiety.
In the current study, math anxiety and foundational quantity processes were
independent predictors of math performance in young adults. Thus the possibility of a link
between early foundational math processing and math anxiety in children, as suggested by
Maloney and colleagues, was not directly addressed. Future research should focus on the
changing relations between risk factors, math anxiety and math performance. Longitudinal
studies with young children could help researchers map a developmental trajectory for math
anxiety.
Implications
Understanding the risk factors associated with math anxiety and how they contribute
to math performance is an important step in developing interventions to alleviate the effects
of math anxiety on performance. The results from the present study indicate that deficits in
early foundational skills are not strongly related to math anxiety in adults nor do they
influence the relations between math anxiety and performance, thus remediation that focuses
80
on math skills should be secondary and emphasize gaps in understanding that may be related
to avoidance behaviors such as missed classes, unfinished homework or insufficient practice
for example. These results suggest that the primary focus in remediation should be on
strategies to manage the anxiety. Developing strategies that are focused on inhibiting
anxiety-related thoughts and ruminations may prove beneficial for math-anxious students.
Because research suggests that math anxiety is present in young children,
incorporating anxiety-management strategies (e.g., relaxation, breathing techniques,
expressive writing) within the school environment may be a first step in reducing math
anxiety and thus lessening its impact on math performance and math avoidance.
Unrelated to math anxiety, the current study also demonstrated that foundational
quantity processes are strongly linked to math performance in adults, suggesting that
emphasis on fundamental math skills in early learning may lead to better math performance
in adulthood.
Conclusion
The purpose of the present study was to explore personal and cognitive influences on
math anxiety and math performance. Young adults completed measures of math anxiety,
perceived competence, working memory, quantitative and spatial processing and three
different assessments of math performance. Results did not show gender-based differences
in math anxiety; however, results did suggest women may report higher anticipatory math
anxiety than men. The results also showed that deficits in foundational math processes,
although moderately related to math anxiety, did not significantly predict math anxiety. As
well, math anxiety and quantity processing were both unique predictors of math performance.
These results indicate that the effect of math anxiety on math performance is not related to

81
deficits in foundational quantitative or spatial processes. I therefore conclude that it is the
anxiety, not the math that triggers performance deficits in math-anxious adults.
82
References
Ahmed, W., Minnaert, A., Kuyper, H., & van der Werf, G. (2012). Reciprocal relationships
between math self-concept and math anxiety. Learning and Individual Differences, 22(3),
385–389. http://doi.org/10.1016/j.lindif.2011.12.004
Ansari, D. (2008). Effects of development and enculturation on number representation in the
brain. Nature Reviews Neuroscience, 9(4), 278-291.
Arnold, D. H., Fisher, P. H., Doctoroff, G. L., & Dobbs, J. (2002). Accelerating math
development in Head Start classrooms. Journal of Educational Psychology, 94(4), 762–770.
http://doi.org/10.1037/0022-0663.94.4.762
Ashcraft, M. H. (2002). Math anxiety: Personal, educational, and cognitive consequences. Current
directions in psychological science, 11(5), 181-185.
Ashcraft, M. H. (1995). Cognitive psychology and simple arithmetic: A review and summary of
new directions. Mathematical cognition, 1(1), 3-34.
Ashcraft, M. H., & Faust, M. W. (1994). Mathematics anxiety and mental arithmetic performance:
An exploratory investigation. Cognition & Emotion, 8(2), 97–125.
Ashcraft, M. H., & Kirk, E. P. (2001). The relationships among working memory, math anxiety,
and performance. Journal of Experimental Psychology: General, 130(2), 224–237.
http://doi.org/10.1037/0096-3445.130.2.224
Ashcraft, M. H., & Krause, J. A. (2007). Working memory, math performance, and math anxiety.
Psychonomic Bulletin & Review, 14(2), 243–248. http://doi.org/10.3758/BF03194059
Ashcraft, M. H., Krause, J. A., & Hopko, D. R. (2007). Is math anxiety a mathematical learning
disability. Why is math so hard for some children, 329-348.
83
Ashcraft, M. H., & Moore, A. M. (2009). Mathematics anxiety and the affective drop in
performance. Journal of Psychoeducational Assessment, 27(3), 197–205.
http://doi.org/10.1177/0734282908330580
Ashcraft, M. H., & Ridley, K. S. (2005). Math anxiety and its cognitive consequences: A tutorial
review. In J. I. D. Campbell (Ed.) Handbook of Mathematical Cognition (pp. 315-327).
New York: Psychology Press.
Babcock, R. L., & Salthouse, T. A. (1990). Effects of increased processing demands on age
differences in working memory. Psychology and Aging, 5(3), 421-428.
doi:http://dx.doi.org/10.1037/0882-7974.5.3.421
Baddeley, A., Eysenck, M. W., & Anderson, M. C. (2009). Memory. New York, NY, US:
Psychology Press, New York, NY.
Bandura, A. (1989). Human agency in social cognitive theory. American Psychologist,
44(9), 1175.
Bandura, A. (1993). Perceived self-efficacy in cognitive development and functioning.
Educational Psychologist, 28(2), 117-148.
Bandura, A., Barbaranelli, C., Caprara, G. V., & Pastorelli, C. (2001). Self‐ efficacy beliefs as
shapers of children's aspirations and career trajectories. Child Development, 72(1),
187-206.
Beilock, S. L. (2008). Math performance in stressful situations. Current Directions in
Psychological Science, 17(5), 339–343.
Beilock, S. L., & DeCaro, M. S. (2007). From poor performance to success under stress:
working memory, strategy selection, and mathematical problem solving under
84
pressure. Journal of Experimental Psychology: Learning, Memory, and Cognition,
33(6), 983.
Beilock, S. L., Gunderson, E. A., Ramirez, G., & Levine, S. C. (2010). Female teachers’ math
anxiety affects girls’ math achievement. Proceedings of the National Academy of
Sciences, 107(5), 1860-1863.
Beilock, S. L., Kulp, C. A., Holt, L. E., & Carr, T. H. (2004). More on the fragility of
performance: choking under pressure in mathematical problem solving. Journal of
Experimental Psychology: General, 133(4), 584.
Beilock, S. L., Rydell, R. J., & McConnell, A. R. (2007). Stereotype threat and working
memory: mechanisms, alleviation, and spillover. Journal of Experimental Psychology:
General, 136(2), 256.
Bjorklund, D. F., Hubertz, M. J., & Reubens, A. C. (2004). Young children’s arithmetic
strategies in social context: How parents contribute to children’s strategy
development while playing games. International Journal of Behavioral Development,
28(4), 347-357.
Bong, M., & Skaalvik, E. M. (2003). Academic Self-Concept and Self-Efficacy: How Different
Are They Really? Educational Psychology Review, 15(1), 1–40
Bourassa, A. (2014). Numerical Sequence Recognition: Is Familiarity or Ordinality the Primary
Factor in Performance? (Doctoral dissertation, Carleton University Ottawa).
Butterworth, B. (2008). Developmental dyscalculia. Child neuropsychology: Concepts, theory,
and practice, 455-467.
Cohen J. (1983). The cost of dichotomization. Applied Psychological Measurement.; 7:249–53.
85
Conway, A. R., Kane, M. J., Bunting, M. F., Hambrick, D. Z., Wilhelm, O., & Engle, R. W.
(2005). Working memory span tasks: A methodological review and user’s guide.
Psychonomic Bulletin & Review, 12(5), 769-786.
Dawson, N. V., & Weiss, R. (2012). Dichotomizing Continuous Variables in Statistical Analysis
A Practice to Avoid. Medical Decision Making, 32(2), 225-226.
Dehaene, S., Dupoux, E., & Mehler, J. (1990). Is numerical comparison digital? Analogical and
symbolic effects in two-digit number comparison. Journal of Experimental Psychology:
Human Perception and Performance, 16(3), 626.Dehaene 1990 number distance effect
De Smedt, B., Janssen, R., Bouwens, K., Verschaffel, L., Boets, B., & Ghesquière, P. (2009).
Working memory and individual differences in mathematics achievement: A longitudinal
study from first grade to second grade. Journal of Experimental Child Psychology, 103(2),
186-201. doi:http://dx.doi.org.proxy.library.carleton.ca/10.1016/j.jecp.2009.01.004
De Smedt, B., Verschaffel, L., & Ghesquière, P. (2009). The predictive value of numerical
magnitude comparison for individual differences in mathematics achievement. Journal of
Experimental Child Psychology, 103(4), 469-479.
doi:http://dx.doi.org.proxy.library.carleton.ca/10.1016/j.jecp.2009.01.010
DeStefano, D., & LeFevre, J.-A. (2004). The role of working memory in mental arithmetic.
European Journal of Cognitive Psychology, 16(3), 353–386.
http://doi.org/10.1080/09541440244000328
Deyi, B. A., Kosinski, A. S., & Snapinn, S. M. (1998). Power considerations when a continuous
outcome variable is dichotomized. Journal of biopharmaceutical statistics, 8(2), 337-352.
86
Devine, A., Fawcett, K., Szucs, D., & Dowker, A. (2012). Gender differences in mathematics
anxiety and the relation to mathematics performance while controlling for test anxiety.
Behavioral and Brain Functions, 8(33), 2-9.
Duncan, G. J., Dowsett, C. J., Claessens, A., Magnuson, K., Huston, A. C., Klebanov, P., . . .
Brooks-Gunn, J. (2007). School readiness and later achievement. Developmental Psychology,
43(6), 1428.
Eccles, J. S., Barber, B. L., Updegraff, K., & O’Brien, K. M. (1998). An expectancy-value model
of achievement choices: The role of ability self-concepts, perceived task utility and interest in
predicting activity choice and course enrollment. Interest and learning, 267-280.
Ekstrom, R.B., French, J.W., Harman, H.H., & Der- men, D. (1976). Kit of factor-referenced
cognitive tests. Princeton, NJ: Educational Testing Service.
Elliot, A. J. (1999). Approach and avoidance motivation and achievement goals. Educational
psychologist, 34(3), 169-189.
Elliot, A. J., & McGregor, H. A. (1999). Test anxiety and the hierarchical model of approach and
avoidance achievement motivation. Journal of Personality and social Psychology, 76(4),
628.
Faust, M. W. (1996). Mathematics anxiety effects in simple and complex addition. Mathematical
Cognition, 2(1), 25-62.
Fazio, L. K., Bailey, D. H., Thompson, C. A., & Siegler, R. S. (2014). Relations of different types
of numerical magnitude representations to each other and to mathematics achievement.
Journal of experimental child psychology, 123, 53-72.
87
Ferguson, A. M., Maloney, E. A., Fugelsang, J., & Risko, E. F. (2015). On the relation between
math and spatial ability: The case of math anxiety. Learning and Individual Differences, 39,
1-12.
Field, A. (2013). Discovering statistics using IBM SPSS statistics. 4th
Edition, Sage Publications
Field, T., Ironson, G., Scafidi, F., Nawrocki, T., Goncalves, A., Burman, I., ... & Kuhn, C. (1996).
Massage therapy reduces anxiety and enhances EEG pattern of alertness and math
computations. International Journal of Neuroscience, 86(3-4), 197-205.
Geary, D. C. (2013). Early foundations for mathematics learning and their relations to learning
disabilities. Current Directions in Psychological Science, 22(1), 23–27.
Geary, D. C., Bailey, D. H., & Hoard, M. K. (2009). Predicting mathematical achievement and
mathematical learning disability with a simple screening tool: The number sets test. Journal
of Psychoeducational Assessment, 27(3), 265-279.
doi:http://dx.doi.org.proxy.library.carleton.ca/10.1177/0734282908330592
Geist, E. (2010). The anti-anxiety curriculum: Combating math anxiety in the classroom. Journal
of Instructional Psychology, 37(1), 24–31.
Goetz, T., Bieg, M., Ludtke, O., Pekrun, R., & Hall, N. C. (2013). Do girls really experience more
anxiety in mathematics? Psychological Science, 24(10), 2079–2087.
http://doi.org/10.1177/0956797613486989;
Grusec, J. E. (1992). Social learning theory and developmental psychology: The legacies of
Robert Sears and Albert Bandura. Developmental Psychology, 28(5), 776.
Guay, R. B., & McDaniel, E. D. (1977). The relationship between mathematics achievement and
spatial abilities among elementary school children. Journal for Research in Mathematics
Education, 211-215.
88
Gunderson, E. A., Ramirez, G., Beilock, S. L., & Levine, S. C. (2012). The relation between
spatial skill and early number knowledge: The role of the linear number line. Developmental
Psychology, 48(5), 1229-1241.
doi:http://dx.doi.org.proxy.library.carleton.ca/10.1037/a0027433
Hackett, G., & Betz, N. E. (1989). An exploration of the mathematics self-efficacy/mathematics
performance correspondence. Journal for Research in Mathematics Education, 261-273.
Harari, R. R., Vukovic, R. K., & Bailey, S. P. (2013). Mathematics anxiety in young children: An
exploratory study. The Journal of Experimental Education, 81(4), 538-555.
Hegarty, M., Montello, D. R., Richardson, A. E., Ishikawa, T., & Lovelace, K. (2006). Spatial
abilities at different scales: Individual differences in aptitude-test performance and spatial-
layout learning. Intelligence, 34(2), 151-176.
Hembree, R. (1990). The nature, effects, and relief of mathematics anxiety. Journal for Research
in Mathematics Education, 21(1), 33-46.
doi:http://dx.doi.org.proxy.library.carleton.ca/10.2307/749455
Ho, H.-Z., Senturk, D., Lam, A. G., Zimmer, J. M., Hong, S., Okamoto, Y., Chiu, S-Y, Nakazawa,
Y, Wang, C.-P. (2000). The affective and cognitive dimensions of math anxiety: A cross-
national study. Journal for Research in Mathematics Education, 31(3), 362–379.
Holloway, I. D., & Ansari, D. (2009). Mapping numerical magnitudes onto symbols: The
numerical distance effect and individual differences in children’s mathematics achievement.
Journal of Experimental Child Psychology, 103(1), 17-29.
Hoover-Dempsey, K., & Sander, H. (1995). Parental involvement in children's education: Why
does it make a difference. The Teachers College Record, 97(2), 310-331.
89
Hopko, D. R., Ashcraft, M. H., Gute, J., Ruggiero, K. J., & Lewis, C. (1998). Mathematics anxiety
and working memory: Support for the existence of a deficient inhibition mechanism. Journal
of Anxiety Disorders, 12(4), 343–355.
Hopko, D. R., Crittendon, J. A., Grant, E., & Wilson, S. A. (2005). The impact of anxiety on
performance IQ. Anxiety, Stress & Coping, 18(1), 17-35.
Hopko, D. R., Mahadevan, R., Bare, R. L., & Hunt, M. K. (2003). The abbreviated math anxiety
scale (AMAS) construction, validity, and reliability. Assessment, 10(2), 178–182.
Hopko, D. R., McNeil, D. W., Lejuez, C. W., Ashcraft, M. H., Eifert, G. H., & Riel, J. (2003). The
effects of anxious responding on mental arithmetic and lexical decision task performance.
Journal of Anxiety Disorders, 17(6), 647-665.
Jameson, M. M. (2013). Contextual factors related to math anxiety in second-grade children. The
Journal of Experimental Education, 82(4), 518-536.
Jansen, B. R., Louwerse, J., Straatemeier, M., Van der Ven, S. H., Klinkenberg, S., & Van der
Maas, H. L. (2013). The Influence of Experiencing Success in Math on Math Anxiety,
Perceived Math Competence, and Math Performance. Learning and Individual Differences,
24, 190–197.
Kaplan, A., & Midgley, C. (1997). The effect of achievement goals: does level of perceived
academic competence make a difference? Contemporary Educational Psychology, 22(4),
415-435.
Kellogg, J. S., Hopko, D. R., & Ashcraft, M. H. (1999). The effects of time pressure on arithmetic
performance. Journal of Anxiety Disorders, 13(6), 591-600.
90
Kepner, M. D., & Neimark, E. D. (1984). Test–retest reliability and differential patterns of score
change on the Group Embedded Figures Test. Journal of Personality and Social Psychology,
46(6), 1405.
Lee, J. (2009). Universals and specifics of math self-concept, math self-efficacy, and math anxiety
across 41 PISA 2003 participating countries. Learning and Individual Differences, 19(3),
355-365.
LeFevre, J.-A., Berrigan, L., Vendetti, C., Kamawar, D., Bisanz, J., Skwarchuk, S.-L., & Smith-
Chant, B. L. (2013). The Role of Executive Attention in the Acquisition of Mathematical
Skills for Children in Grades 2 through 4. Journal of Experimental Child Psychology, 114(2),
243–261.
LeFevre, J., DeStefano, D., Coleman, B., & Shanahan, T. (2005). Mathematical cognition and
working memory. In J. I. D. Campbell (Ed.) Handbook of Mathematical Cognition (pp. 361-
377). New York: Psychology Press.
LeFevre, J.-A., Fast, L., Skwarchuk, S.-L., Smith-Chant, B. L., Bisanz, J., Kamawar, D., &
Penner-Wilger, M. (2010). Pathways to Mathematics: Longitudinal Predictors of
Performance. Child Development, 81(6), 1753–1767.
LeFevre, J., Polyzoi, E., Skwarchuk, S., Fast, L., & Sowinski, C. (2010). Do home numeracy and
literacy practices of greek and canadian parents predict the numeracy skills of kindergarten
children? International Journal of Early Years Education, 18(1), 55-70.
LeFevre, J., Skwarchuk, S., Smith-Chant, B. L., Fast, L., Kamawar, D., & Bisanz, J. (2009).
Home numeracy experiences and children’s math performance in the early school years.
Canadian Journal of Behavioural Science/Revue Canadienne Des Sciences Du
Comportement, 41(2), 55.
91
Lyons, I. M., & Beilock, S. L. (2011). Numerical ordering ability mediates the relation between
number-sense and arithmetic competence. Cognition, 121(2), 256–261.
Lyons, I. M., & Beilock, S. L. (2012). Mathematics anxiety: separating the math from the anxiety.
Cerebral Cortex, 22(9), 2102-2110.
Lyons, I. M., Price, G. R., Vaessen, A., Blomert, L., & Ansari, D. (2014). Numerical predictors of
arithmetic success in grades 1–6. Developmental Science, 17(5), 714-726.
Ma, X. (1999). A meta-analysis of the relationship between anxiety toward mathematics and
achievement in mathematics. Journal for Research in Mathematics Education, 520-540.
Ma, X., & Xu, J. (2004). The causal ordering of mathematics anxiety and mathematics
achievement: a longitudinal panel analysis. Journal of Adolescence, 27(2), 165–179.
MacCallum, R. C., Zhang, S., Preacher, K. J., & Rucker, D. D. (2002). On the practice of
dichotomization of quantitative variables. Psychological methods, 7(1), 19.
Maloney, E. A., Ansari, D., & Fugelsang, J. A. (2011). The effect of mathematics anxiety on the
processing of numerical magnitude. The Quarterly Journal of Experimental Psychology,
64(1), 10-16. doi:http://dx.doi.org.proxy.library.carleton.ca/10.1080/17470218.2010.533278
Maloney, E. A., Risko, E. F., Ansari, D., & Fugelsang, J. (2010). Mathematics anxiety affects
counting but not subitizing during visual enumeration. Cognition, 114(2), 293-297.
doi:http://dx.doi.org.proxy.library.carleton.ca/10.1016/j.cognition.2009.09.013
Maloney, E. A., Waechter, S., Risko, E. F., & Fugelsang, J. A. (2012). Reducing the sex
difference in math anxiety: The role of spatial processing ability. Learning and Individual
Differences, 22(3), 380-384. doi:http://dx.doi.org/10.1016/j.lindif.2012.01.001
Mazzocco, M. M., & Myers, G. F. (2003). Complexities in identifying and defining mathematics
learning disability in the primary school-age years. Annals of dyslexia, 53(1), 218-253.
92
Meece, J. L., Wigfield, A., & Eccles, J. S. (1990). Predictors of math anxiety and its influence on
young adolescents’ course enrollment intentions and performance in mathematics. Journal of
Educational Psychology, 82(1), 60.
Midgley, C., Maehr, M. L., & Urdan, T. (1993). Patterns of adaptive learning survey (PALS).
University of Michigan.
Miller, H., & Bichsel, J. (2004). Anxiety, working memory, gender, and math performance.
Personality and Individual Differences, 37(3), 591-606.
doi:http://dx.doi.org.proxy.library.carleton.ca/10.1016/j.paid.2003.09.029
Mix, K. S., & Cheng, Y. L. (2012). The relation between space and math: developmental and
educational implications. Advances in Child Development and Behavior, 42(Journal Article),
197–243.
Miyake, A., Witzki, A. H., & Emerson, M. J. (2001). Field dependence–independence from a
working memory perspective: A dual-task investigation of the hidden figures test. Memory,
9(4-6), 445-457.
Nosworthy, N., Bugden, S., Archibald, L., Evans, B., & Ansari, D. (2013). A Two-Minute Paper-
and-Pencil Test of Symbolic and Nonsymbolic Numerical Magnitude Processing Explains
Variability in Primary School Children’s Arithmetic Competence. PloS One, 8(7), e67918.
Núñez-Peña, M. I., & Suárez-Pellicioni, M. (2014). Less precise representation of numerical
magnitude in high math-anxious individuals: An ERP study of the size and distance effects.
Biological Psychology, 103, 176-183.
Pajares, F. (1996). Self-efficacy beliefs in academic settings. Review of Educational Research,
66(4), 543-578.
93
Pajares, F., & Kranzler, J. (1995). Self-efficacy beliefs and general mental ability in mathematical
problem-solving. Contemporary Educational Psychology, 20(4), 426-443.
Pajares, F., & Miller, M. D. (1994). Role of self-efficacy and self-concept beliefs in mathematical
problem solving: A path analysis. Journal of Educational Psychology, 86(2), 193.
Pajares, F., & Schunk, D. (2001). The development of academic self-efficacy. In A. Wigfield &
J.Eccles (Eds.) Development of Achievement Motivation. United States: John Wiley & Sons
Inc.
Park, D., Ramirez, G., & Beilock, S. L. (2014). The role of expressive writing in math anxiety.
Journal of Experimental Psychology: Applied., Vol 20(2), 103–111.
http://doi.org/10.1037/xap0000013
Peters, M., Laeng, B., Latham, K., Jackson, M., Zaiyouna, R., & Richardson, C. (1995). A
redrawn Vandenberg and Kuse mental rotations test-different versions and factors that affect
performance. Brain and Cognition, 28(1), 39-58.
Preacher, K. J., Rucker, D. D., MacCallum, R. C., & Nicewander, W. A. (2005). Use of the
extreme groups approach: A critical reexamination and new recommendations. Psychological
Methods, 10(2), 178-192. doi:http://dx.doi.org/10.1037/1082-989X.10.2.178
Raghubar, K. P., Barnes, M. A., & Hecht, S. A. (2010). Working memory and mathematics: A
review of developmental, individual difference, and cognitive approaches. Learning and
Individual Differences; Perspectives on Math Difficulty and Disability in Children, 20(2),
110–122. http://doi.org/10.1016/j.lindif.2009.10.005
Ramirez, G., Gunderson, E. A., Levine, S. C., & Beilock, S. L. (2013). Math anxiety, working
memory, and math achievement in early elementary school. Journal of Cognition and
Development, 14(2), 187-202.
94
Ramirez, G., Gunderson, E. A., Levine, S. C., & Beilock, S. L. (2012). Spatial anxiety relates to
spatial abilities as a function of working memory in children. The Quarterly Journal of
Experimental Psychology, 65(3), 474-487.
doi:http://dx.doi.org.proxy.library.carleton.ca/10.1080/17470218.2011.616214
Ramirez, G., & Beilock, S. L. (2011). Writing about testing worries boosts exam performance in
the classroom. Science, 331(6014), 211-213.
Randhawa, B. S., Beamer, J. E., & Lundberg, I. (1993). Role of mathematics self-efficacy in the
structural model of mathematics achievement. Journal of Educational Psychology, 85(1), 41.
Rayner, V., Pitsolantis, N., & Osana, H. (2009). Mathematics anxiety in preservice teachers: Its
relationship to their conceptual and procedural knowledge of fractions. Mathematics
Education Research Journal, 21(3), 60-85.
Richardson, F. C., & Suinn, R. M. (1972). The Mathematics Anxiety Rating Scale: Psychometric
data. Journal of counseling Psychology, 19(6), 551.
Rotzer, S., Loenneker, T., Kucian, K., Martin, E., Klaver, P., & von Aster, M. (2009).
Dysfunctional neural network of spatial working memory contributes to developmental
dyscalculia. Neuropsychologia, 47(13), 2859-2865.
doi:http://dx.doi.org.proxy.library.carleton.ca/10.1016/j.neuropsychologia.2009.06.009
Rubinsten O., & Tannock R. (2010) Mathematics anxiety in children with developmental
dyscalculia. Behavioral and Brain Functions,6 (1), 46.
Sasanguie, D., De Smedt, B., Defever, E., & Reynvoet, B. (2012). Association between basic
numerical abilities and mathematics achievement. British Journal of Developmental
Psychology, 30(2), 344-357.
95
Scarpello, G. (2007). Helping Students Get Past Math Anxiety. Techniques: Connecting
Education and Careers (J1), 82(6), 34-35.
Sheffield, D., & Hunt, T. (2006). How does anxiety influence maths performance and what can
we do about it?. MSOR Connections, 6(4), 19-23.
Skwarchuk, S., Sowinski, C., & LeFevre, J. (2014). Formal and informal home learning activities
in relation to children’s early numeracy and literacy skills: The development of a home
numeracy model. Journal of Experimental Child Psychology, 121, 63-84.
Sowinski, C., Dunbar, K., & LeFevre, J. (2014). Calculation Fluency Test, unpublished technical
report, Math Lab, Carleton University, Ottawa, Canada.
Sowinski, C., LeFevre, J. A., Skwarchuk, S. L., Kamawar, D., Bisanz, J., & Smith-Chant, B.
(2015). Refining the quantitative pathway of the Pathways to Mathematics model. Journal of
Experimental Child Psychology, 131, 73-93.
Starkey, P., & Cooper, R. G.,Jr. (1980). Perception of numbers by human infants. Science, 210,
1033-1035.
Steiner, E. T., & Ashcraft, M. H. (2012). Three brief assessments of math achievement. Behavior
research methods, 44(4), 1101-1107.
Taylor, L. C., Clayton, J. D., & Rowley, S. J. (2004). Academic Socialization: Understanding
Parental Influences on Children’s School-Related Development in the Early Years. Review of
General Psychology, 8(3), 163.
Turner, J. C., Midgley, C., Meyer, D. K., Gheen, M., Anderman, E. M., Kang, Y., & Patrick, H.
(2002). The classroom environment and students' reports of avoidance strategies in
mathematics: A multimethod study. Journal of Educational Psychology, 94(1), 88.
96
Uttal, D. H., Meadow, N. G., Tipton, E., Hand, L. L., Alden, A. R., Warren, C., & Newcombe, N.
S. (2013). The malleability of spatial skills: a meta-analysis of training studies. Psychological
bulletin, 139(2), 352.
Vanbinst, K., Ghesquiere, P., & De Smedt, B. (2012). Numerical magnitude representations and
individual differences in children’s arithmetic strategy use. Mind, Brain, and Education, 6(3),
129–136.
Vandenberg, S. G., & Kuse, A. R. (1978). Mental rotations, a group test of three-dimensional
spatial visualization. Perceptual and Motor Skills, 47(2), 599-604.
Vaidya, S., & Chansky, N. M. (1980). Cognitive development and cognitive style as factors in
mathematics achievement. Journal of Educational Psychology, 72(3), 326.
Voyer, D., Voyer, S., & Bryden, M. P. (1995). Magnitude of sex differences in spatial abilities: a
meta-analysis and consideration of critical variables. Psychological Bulletin, 117(2), 250.
Vukovic, R. K., Kieffer, M. J., Bailey, S. P., & Harari, R. R. (2013). Mathematics anxiety in
young children: Concurrent and longitudinal associations with mathematical performance.
Contemporary Educational Psychology, 38(1), 1-10.
doi:http://dx.doi.org.proxy.library.carleton.ca/10.1016/j.cedpsych.2012.09.001
Vukovic, R. K., Roberts, S. O., & Green Wright, L. (2013). From parental involvement to
children's mathematical performance: The role of mathematics anxiety. Early Education &
Development, 24(4), 446-467. doi:10.1080/10409289.2012.693430
Wai, J., Lubinski, D., & Benbow, C. P. (2009). Spatial ability for STEM domains: aligning over
50 years of cumulative psychological knowledge solidifies its importance. Journal of
Educational Psychology, 101(4), 817.
97
Wang, Z., Hart, S. A., Kovas, Y., Lukowski, S., Soden, B., Thompson, L. A., ... & Petrill, S. A.
(2014). Who is afraid of math? Two sources of genetic variance for mathematical anxiety.
Journal of Child Psychology and Psychiatry, 55(9), 1056-1064.
Wigfield, A., & Meece, J. L. (1988). Math anxiety in elementary and secondary school students.
Journal of Educational Psychology, 80(2), 210.
Woodcock, R. W., McGrew, K. S., & Mather, N. (2001). Woodcock-Johnson® III NU Tests of
Achievement.
Wu, S. S., Barth, M., Amin, H., Malcarne, V., & Menon, V. (2012). Math anxiety in second and
third graders and its relation to mathematics achievement. Frontiers in Psychology,3(162).
doi:http://dx.doi.org.proxy.library.carleton.ca/10.3389/fpsyg.2012.00162
Wynn, K. (1992). Addition and subtraction by human infants. Nature, 358(6389), 749-750.
Xu, F., & Arriaga, R. I. (2007). Number discrimination in 10‐ month‐ old infants. British Journal
of Developmental Psychology, 25(1), 103-108.
Young, C. B., Wu, S. S., & Menon, V. (2012). The neurodevelopmental basis of math anxiety.
Psychological Science, 23(5), 492-501.
Zakaria, E., & Nordin, N. M. (2008). The effects of mathematics anxiety on matriculation students
as related to motivation and achievement. Eurasia Journal of Mathematics, Science &
Technology Education, 4(1), 27-30.
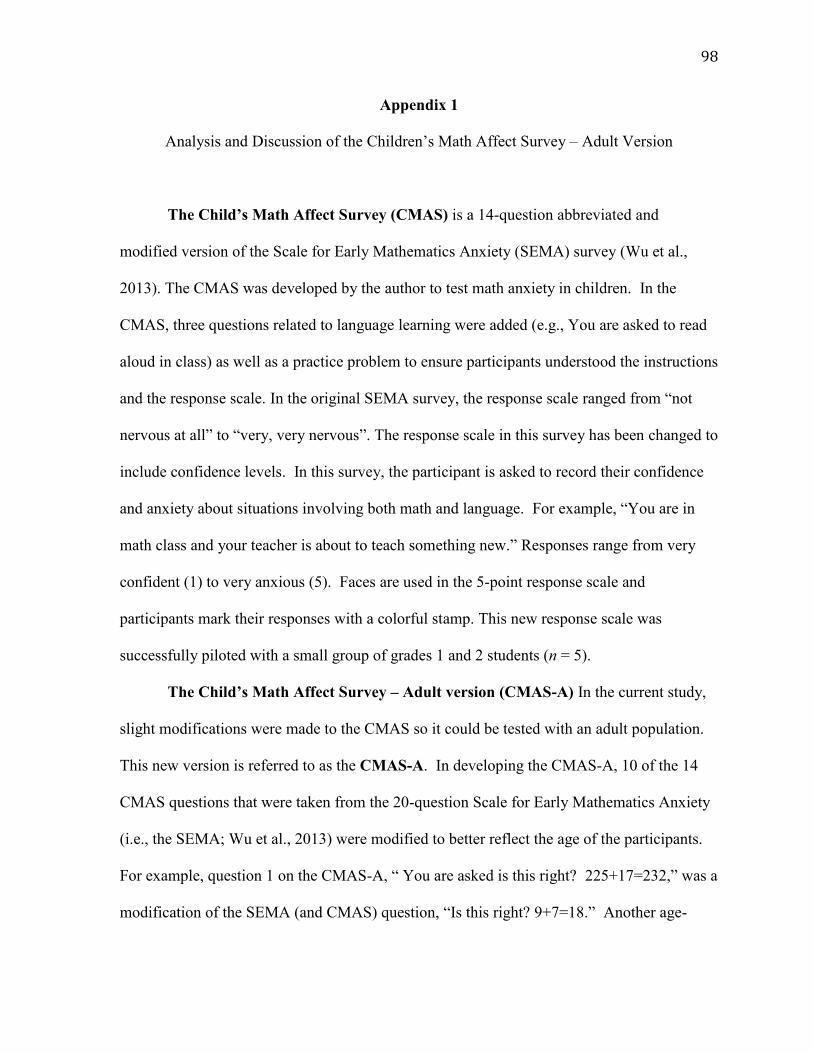
98
Appendix 1
Analysis and Discussion of the Children’s Math Affect Survey – Adult Version
The Child’s Math Affect Survey (CMAS) is a 14-question abbreviated and
modified version of the Scale for Early Mathematics Anxiety (SEMA) survey (Wu et al.,
2013). The CMAS was developed by the author to test math anxiety in children. In the
CMAS, three questions related to language learning were added (e.g., You are asked to read
aloud in class) as well as a practice problem to ensure participants understood the instructions
and the response scale. In the original SEMA survey, the response scale ranged from “not
nervous at all” to “very, very nervous”. The response scale in this survey has been changed to
include confidence levels. In this survey, the participant is asked to record their confidence
and anxiety about situations involving both math and language. For example, “You are in
math class and your teacher is about to teach something new.” Responses range from very
confident (1) to very anxious (5). Faces are used in the 5-point response scale and
participants mark their responses with a colorful stamp. This new response scale was
successfully piloted with a small group of grades 1 and 2 students (n = 5).
The Child’s Math Affect Survey – Adult version (CMAS-A) In the current study,
slight modifications were made to the CMAS so it could be tested with an adult population.
This new version is referred to as the CMAS-A. In developing the CMAS-A, 10 of the 14
CMAS questions that were taken from the 20-question Scale for Early Mathematics Anxiety
(i.e., the SEMA; Wu et al., 2013) were modified to better reflect the age of the participants.
For example, question 1 on the CMAS-A, “ You are asked is this right? 225+17=232,” was a
modification of the SEMA (and CMAS) question, “Is this right? 9+7=18.” Another age-

99
appropriate modification led to the language learning question “You are asked to write an
essay.” The response scale with the faces was used. The SEMA has reported strong internal
consistency (α = .87). This modified adult version also has relatively strong internal
consistency (α =. 75). Questions and associated responses are shown in Table 15.
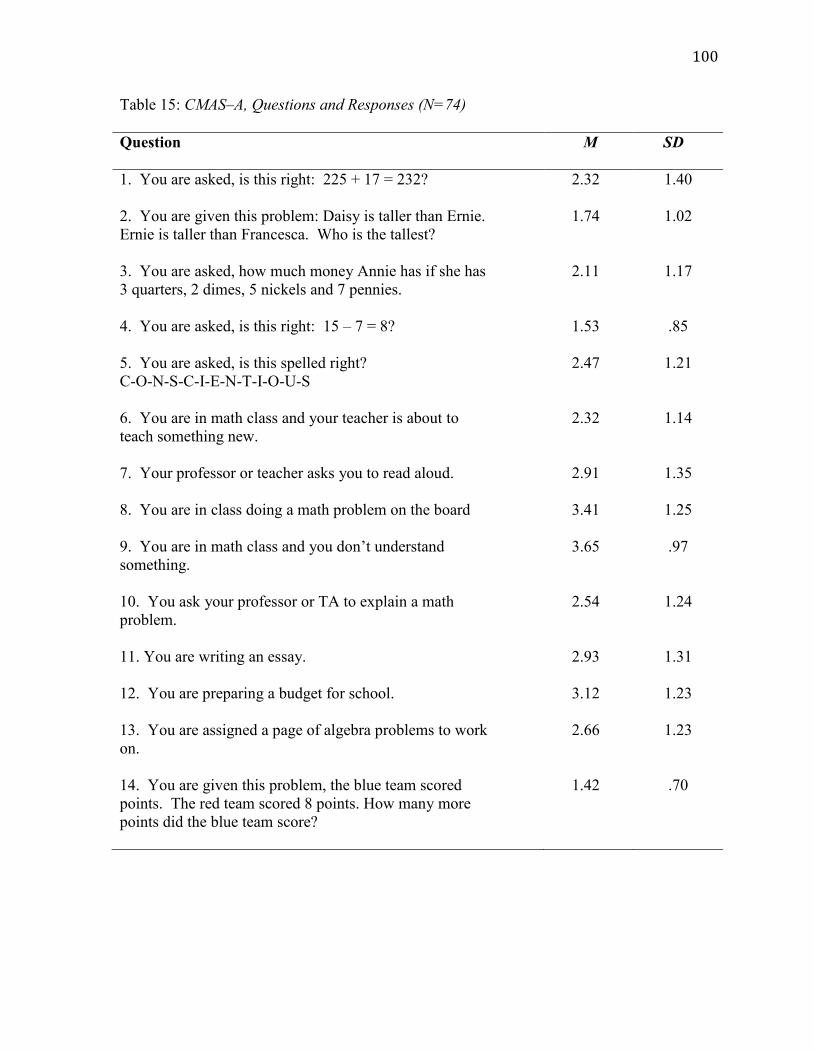
100
Table 15: CMAS–A, Questions and Responses (N=74)
Question
M SD
1. You are asked, is this right: 225 + 17 = 232?
2.32 1.40
2. You are given this problem: Daisy is taller than Ernie.
Ernie is taller than Francesca. Who is the tallest?
1.74 1.02
3. You are asked, how much money Annie has if she has
3 quarters, 2 dimes, 5 nickels and 7 pennies.
2.11 1.17
4. You are asked, is this right: 15 – 7 = 8?
1.53 .85
5. You are asked, is this spelled right?
C-O-N-S-C-I-E-N-T-I-O-U-S
2.47 1.21
6. You are in math class and your teacher is about to
teach something new.
2.32 1.14
7. Your professor or teacher asks you to read aloud.
2.91 1.35
8. You are in class doing a math problem on the board
3.41 1.25
9. You are in math class and you don’t understand
something.
3.65 .97
10. You ask your professor or TA to explain a math
problem.
2.54 1.24
11. You are writing an essay.
2.93 1.31
12. You are preparing a budget for school.
3.12 1.23
13. You are assigned a page of algebra problems to work
on.
2.66 1.23
14. You are given this problem, the blue team scored
points. The red team scored 8 points. How many more
points did the blue team score?
1.42 .70
101
The CMAS-A was modified, so that it would be as similar as possible to the CMAS,
but appropriate for adults. If the CMAS-A and AMAS provide comparable responses, the
CMAS and CMAS-A may be useful tools to compare and contrast adult and child math
anxiety and potentially provide researchers with one tool for testing and following a range of
age groups over time.
To compare the structure of the CMAS-A to the SEMA, I conducted an exploratory
factor analysis on the 14 CMAS-A items. All questions were entered into a principal factor
analysis and a varimax rotation extracted 4 factors after 6 rotations (see Table16). These 4
factors explained 60.2% of the variance.
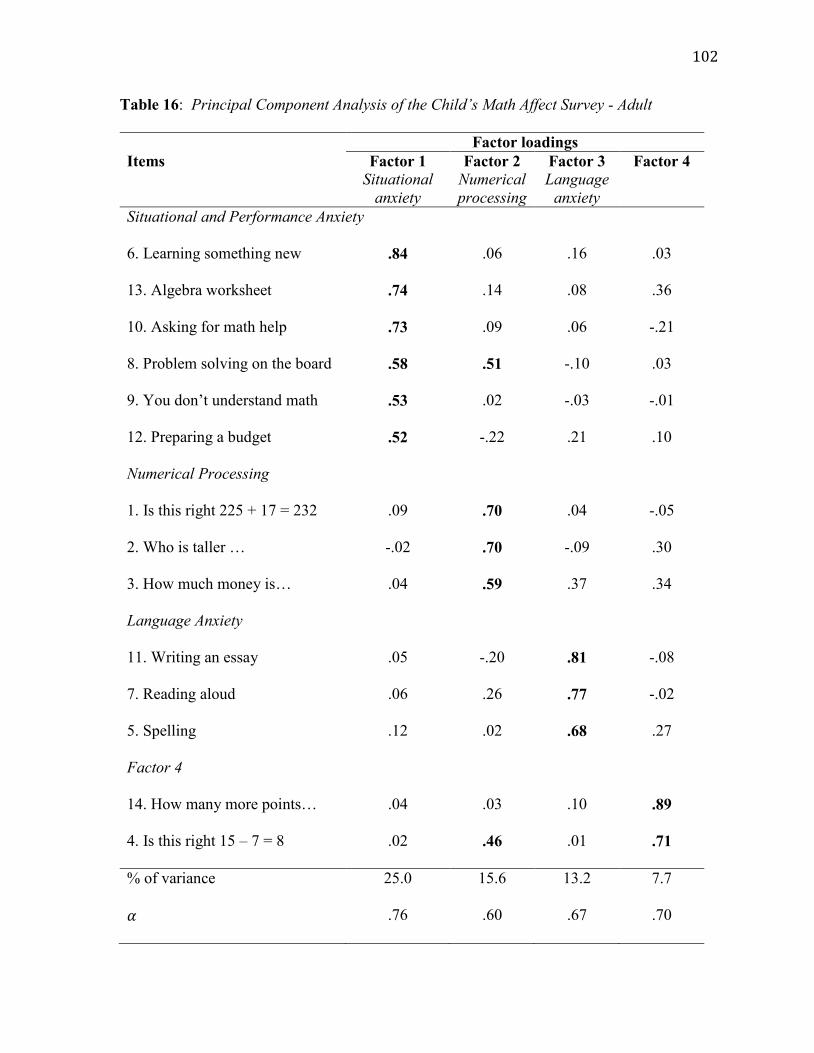
102
Table 16: Principal Component Analysis of the Child’s Math Affect Survey - Adult
Factor loadings
Items Factor 1
Situational
anxiety
Factor 2
Numerical
processing
Factor 3
Language
anxiety
Factor 4
Situational and Performance Anxiety
6. Learning something new .84 .06 .16 .03
13. Algebra worksheet .74 .14 .08 .36
10. Asking for math help .73 .09 .06 -.21
8. Problem solving on the board .58 .51 -.10 .03
9. You don’t understand math .53 .02 -.03 -.01
12. Preparing a budget .52 -.22 .21 .10
Numerical Processing
1. Is this right 225 + 17 = 232 .09 .70 .04 -.05
2. Who is taller … -.02 .70 -.09 .30
3. How much money is… .04 .59 .37 .34
Language Anxiety
11. Writing an essay .05 -.20 .81 -.08
7. Reading aloud .06 .26 .77 -.02
5. Spelling .12 .02 .68 .27
Factor 4
14. How many more points… .04 .03 .10 .89
4. Is this right 15 – 7 = 8 .02 .46 .01 .71
% of variance 25.0 15.6 13.2 7.7
.76 .60 .67 .70
103
The first two factors align with the factor structure of the SEMA identified and
labeled by Wu et al. (2013) as situational and performance anxiety, and numerical
processing, respectively. This close correspondence between the SEMA and CMAS-A was
expected, because these questions are all based on the SEMA questions with slight
modifications to better reflect the age of the participants. The third factor was labeled
language anxiety. Questions 4 and 14 (both related to subtraction) were the only two
questions clustering on factor 4.
Despite the overall similarity between the two surveys, there were also some
differences. The main difference between the CMAS-A and the SEMA was the inclusion of
language-based questions and hence the language anxiety factor. The rationale for adding
language questions to the CMAS was to determine whether young children who felt anxious
about math also felt anxious about other school subjects. These questions were not expected
to align with the SEMA structure but they did form a separate factor, supporting the widely-
held assumption that math anxiety is specific to math activities. Thus, this factor serves as a
validity check for the math-specificity of the CMAS-A items.
Another difference between the surveys occurred for Question 13 “You are assigned a
page of algebra problems to work on” which was a modified version of the SEMA question,
“Your teacher gives you a bunch of subtraction/addition problems to work on”. The CMAS-
A version loaded on the situational/performance anxiety factor whereas the similarly worded
SEMA question loaded on the numerical processing factor. The algebra focus in this
question represents more challenging math for older participants than basic numerical
processing in the SEMA version, thus participants may perceive the question differently.
104
The third question that did not fit the SEMA structure was question 14, “The blue
team scored 15 points. The red team scored 8 points. How many more points did the blue
team score?” This novel question was added to provide a subtraction-based word problem to
complement the addition-based items. It was expected to load on the numerical processing
factor. This question however, loaded uniquely on factor 4. The questions loading on the
numerical processing factor were all related to simple addition. Our participants may relate
to subtraction differently than addition explaining why this question loaded differently. This
theory is supported by the fact that the question, “Is this right, 15 – 8 = 7?” also loaded
strongly on factor 4. Without the new questions (language anxiety and the subtraction word
problem) the factor structure of the CMAS was comparable to the factor structure of the
SEMA, that is, showing two math anxiety factors.
Next, I will compare the CMAS-A to the AMAS. I will look at the individual factors
in each survey, how they related to each other and how they related to mathematical
performance.
There are three key differences between the CMAS-A and AMAS. First, the CMAS-
A did not include questions related to math evaluation because it was initially developed for
grade 1 and 2 students. These students typically do not have math tests. Thus, in comparing
the responses of the two surveys, I looked at the total score of the whole survey (all math
items from the CMAS-A) as well as the individual factors in relation to CMAS-A scores. As
shown in Table 17, the AMAS and CMAS-A total scores were highly correlated. The
situational and performance anxiety factor for the CMAS-A was most strongly related to the
AMAS factors, correlating significantly with the total AMAS and the two extracted factors of

105
the AMAS. Factor 4 in the CMAS-A had a moderate but significant relation to the math
evaluation factor of the AMAS but was not significantly related to the total AMAS score.
Interestingly, the numerical processing factor of the CMAS-A was not correlated with
math performance in these adults. This finding with adults is contrary to Wu et al.’s (2013)
finding with children that both factors (performance/situational and numerical processing
anxiety) were significantly correlated with composite math performance scores, suggesting
that the numerical processing factor of the CMAS-A may be capturing a math anxiety
element specific to children. As the CMAS-A numerical processing questions are related to
simple addition-based mathematical problems reworking them to include more complex math
such as fractions or algebra may better capture a numerical processing anxiety in adults.
The other surprising result was that the learning math factor in the AMAS was not
correlated with math performance in adults. In Hopko’s validation of the AMAS measure,
math performance was not reported for the individual survey components thus we couldn’t
draw the conclusion that this result is an anomaly. Additional testing examining the
individual AMAS factors and math performance is suggested.
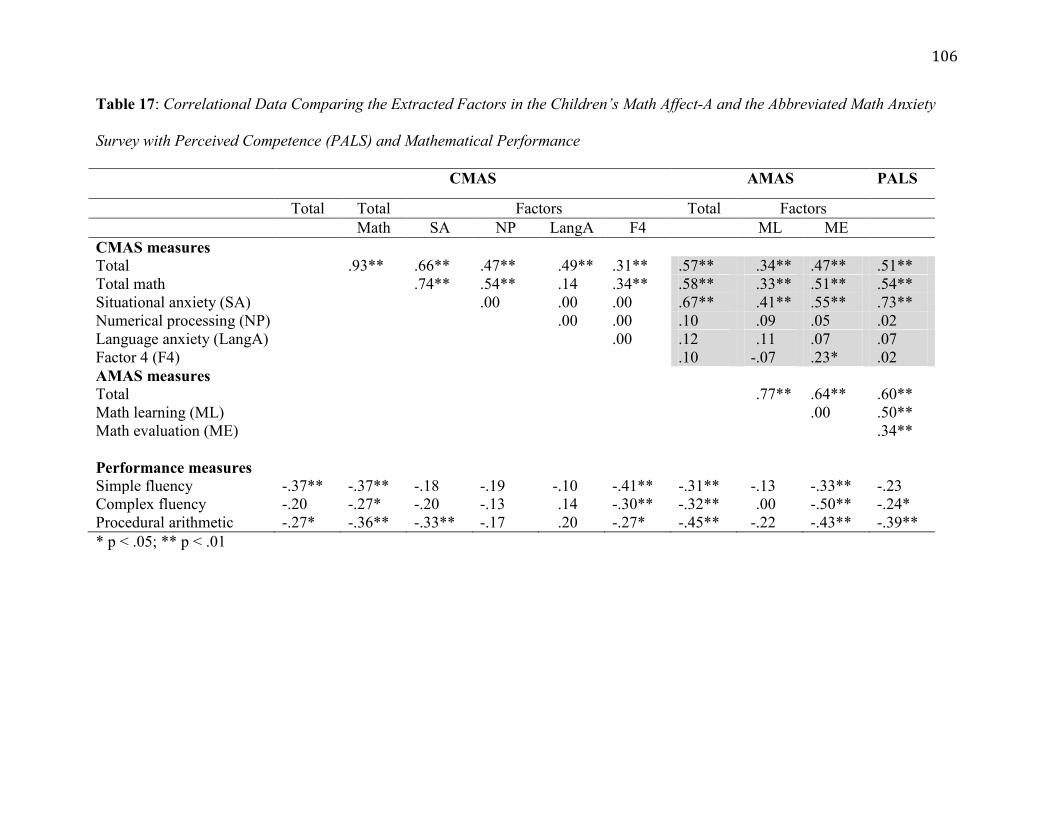
106
Table 17: Correlational Data Comparing the Extracted Factors in the Children’s Math Affect-A and the Abbreviated Math Anxiety
Survey with Perceived Competence (PALS) and Mathematical Performance
CMAS AMAS PALS
Total Total Factors Total Factors
Math SA NP LangA F4 ML ME
CMAS measures
Total .93** .66** .47** .49** .31** .57** .34** .47** .51**
Total math .74** .54** .14 .34** .58** .33** .51** .54**
Situational anxiety (SA) .00 .00 .00 .67** .41** .55** .73**
Numerical processing (NP) .00 .00 .10 .09 .05 .02
Language anxiety (LangA) .00 .12 .11 .07 .07
Factor 4 (F4) .10 -.07 .23* .02
AMAS measures
Total .77** .64** .60**
Math learning (ML) .00 .50**
Math evaluation (ME) .34**
Performance measures
Simple fluency -.37** -.37** -.18 -.19 -.10 -.41** -.31** -.13 -.33** -.23
Complex fluency -.20 -.27* -.20 -.13 .14 -.30** -.32** .00 -.50** -.24*
Procedural arithmetic -.27* -.36** -.33** -.17 .20 -.27* -.45** -.22 -.43** -.39**
* p < .05; ** p < .01
107
To determine if math anxiety measured by the CMAS-A and AMAS captured a different
relationship with math performance, I regressed the two surveys on math performance.
Controlling for gender, working memory, spatial and quantity processing, the variance in
performance accounted for by the AMAS survey was shared with the variance in
performance accounted for in the CMAS-A math component of the survey, specifically,
the CMAS-A did not account for unique variance in math performance. The AMAS
however, did account for unique variance in math performance for procedural arithmetic
as shown in Model 3B of Table 18. Thus the two surveys both capture a similar element
of the math anxiety and math performance relationship however, the AMAS captures
additional variance in performance on procedural arithmetic.
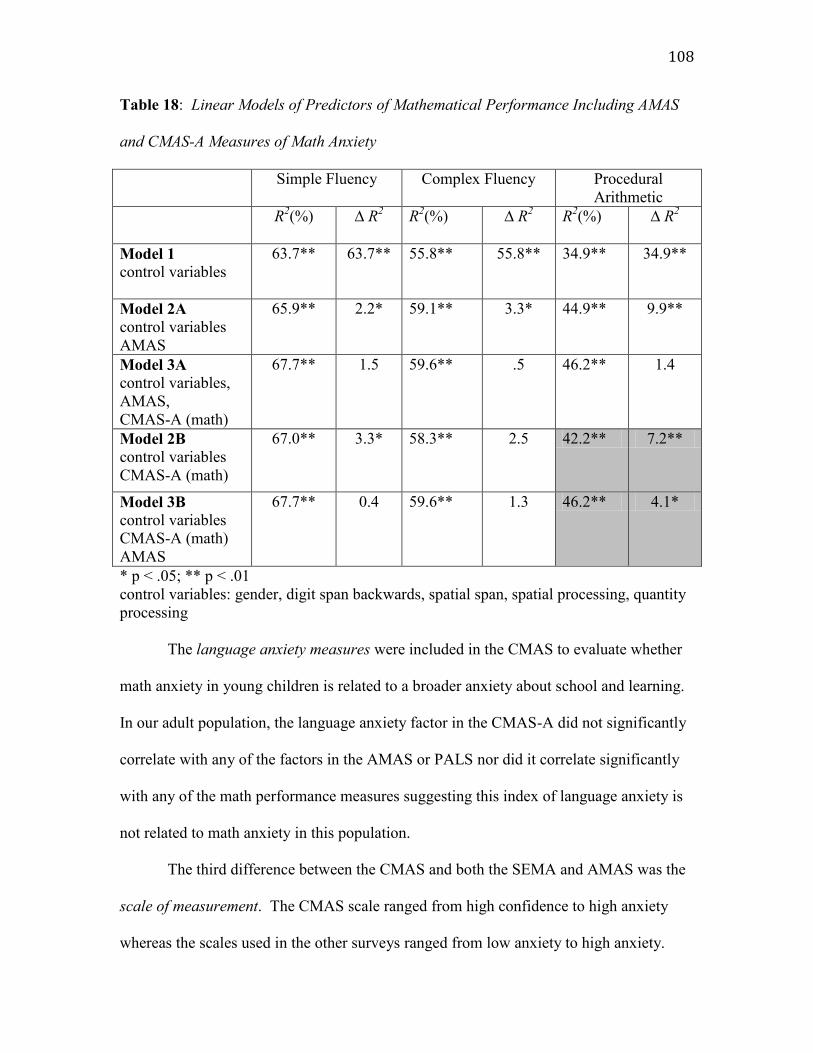
108
Table 18: Linear Models of Predictors of Mathematical Performance Including AMAS
and CMAS-A Measures of Math Anxiety
Simple Fluency Complex Fluency Procedural
Arithmetic
R2(%)
∆ R
2 R
2(%) ∆ R
2 R
2(%) ∆ R
2
Model 1
control variables
63.7** 63.7** 55.8** 55.8** 34.9** 34.9**
Model 2A
control variables
AMAS
65.9** 2.2* 59.1** 3.3* 44.9** 9.9**
Model 3A
control variables,
AMAS,
CMAS-A (math)
67.7** 1.5 59.6** .5 46.2** 1.4
Model 2B
control variables
CMAS-A (math)
67.0** 3.3* 58.3** 2.5 42.2** 7.2**
Model 3B
control variables
CMAS-A (math)
AMAS
67.7** 0.4 59.6** 1.3 46.2** 4.1*
* p < .05; ** p < .01
control variables: gender, digit span backwards, spatial span, spatial processing, quantity
processing
The language anxiety measures were included in the CMAS to evaluate whether
math anxiety in young children is related to a broader anxiety about school and learning.
In our adult population, the language anxiety factor in the CMAS-A did not significantly
correlate with any of the factors in the AMAS or PALS nor did it correlate significantly
with any of the math performance measures suggesting this index of language anxiety is
not related to math anxiety in this population.
The third difference between the CMAS and both the SEMA and AMAS was the
scale of measurement. The CMAS scale ranged from high confidence to high anxiety
whereas the scales used in the other surveys ranged from low anxiety to high anxiety.
109
This full-spectrum alternative scale was used to provide an opportunity for participants to
express math confidence. There was a strong correlation between the two math anxiety
measures as shown in Table 3 suggesting that participants were able to differentiate their
anxiety/confidence levels using this alternative scale and were likely using the scale
similarly to the AMAS scale. As well, the scores were similarly distributed as shown in
Figure 9. One advantage of using an anxiety/confidence scale is that avoiding negatively-
loaded language (anxiety only) may help children more fully express their math affect
and provide a clearer distinction between positive (high confidence) and negative (high
anxiety) valence responses. This untested hypothesis but may be of interest for further
research.
In summary, the CMAS-A could be used as an alternative to the AMAS for
following participants over time. The two surveys correlate similarly with math
performance and both account for the same variance in math performance. Some
refinements are suggested to better characterize the changes in numerical processing
anxiety from children through adults. The advantage in using the CMAS-A however, will
depend on how well the CMAS captures math anxiety in children. Testing of the CMAS
with children is suggested to determine if the new scale does provide advantages in
measuring mathematical affect.

110
Appendix 2 – The Math Behaviours and Interest Questionairre
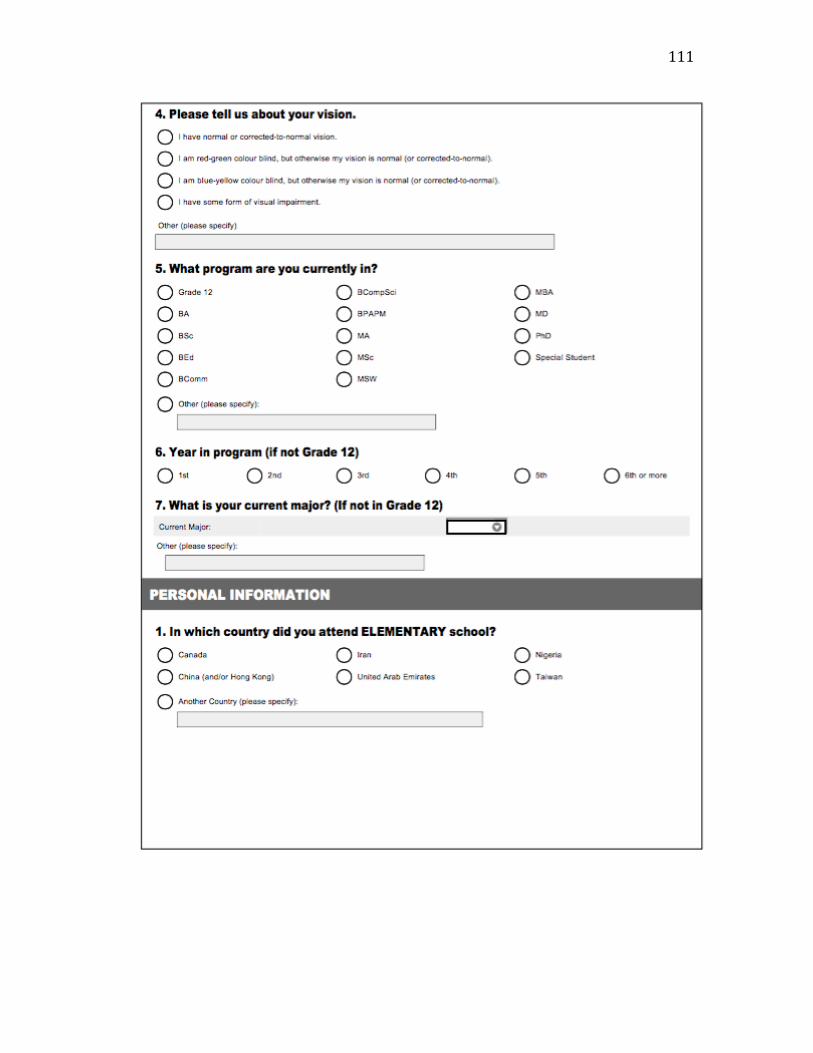
111
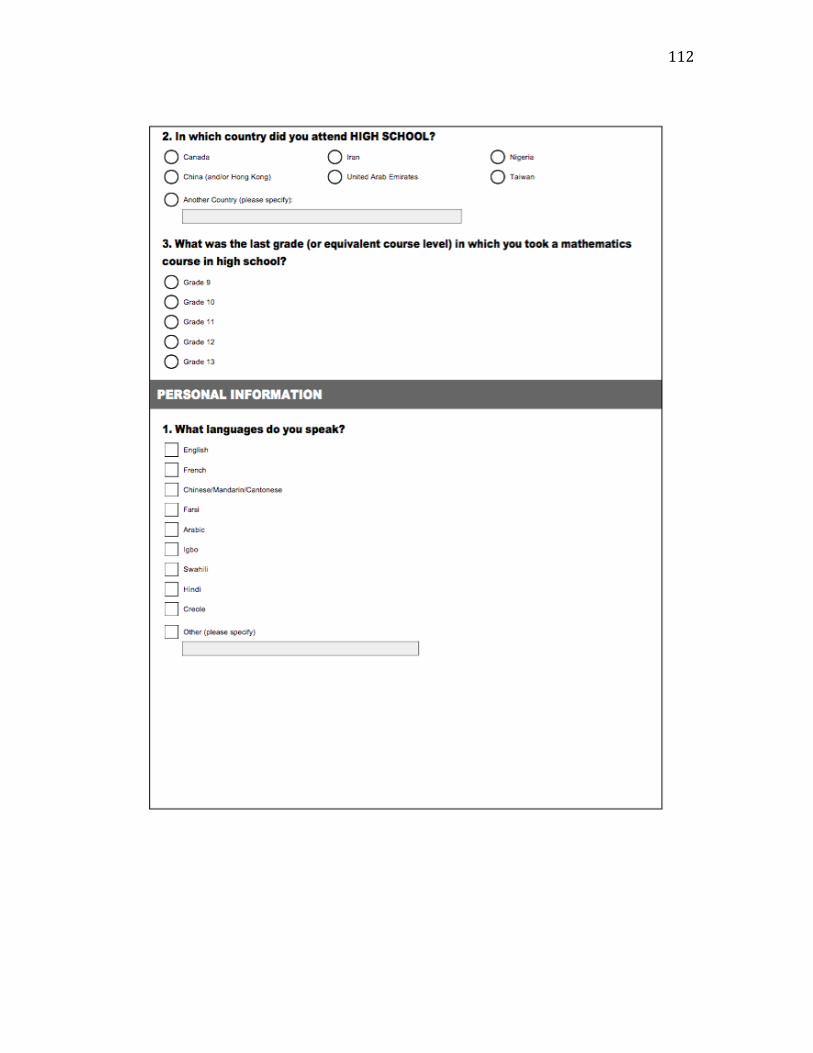
112
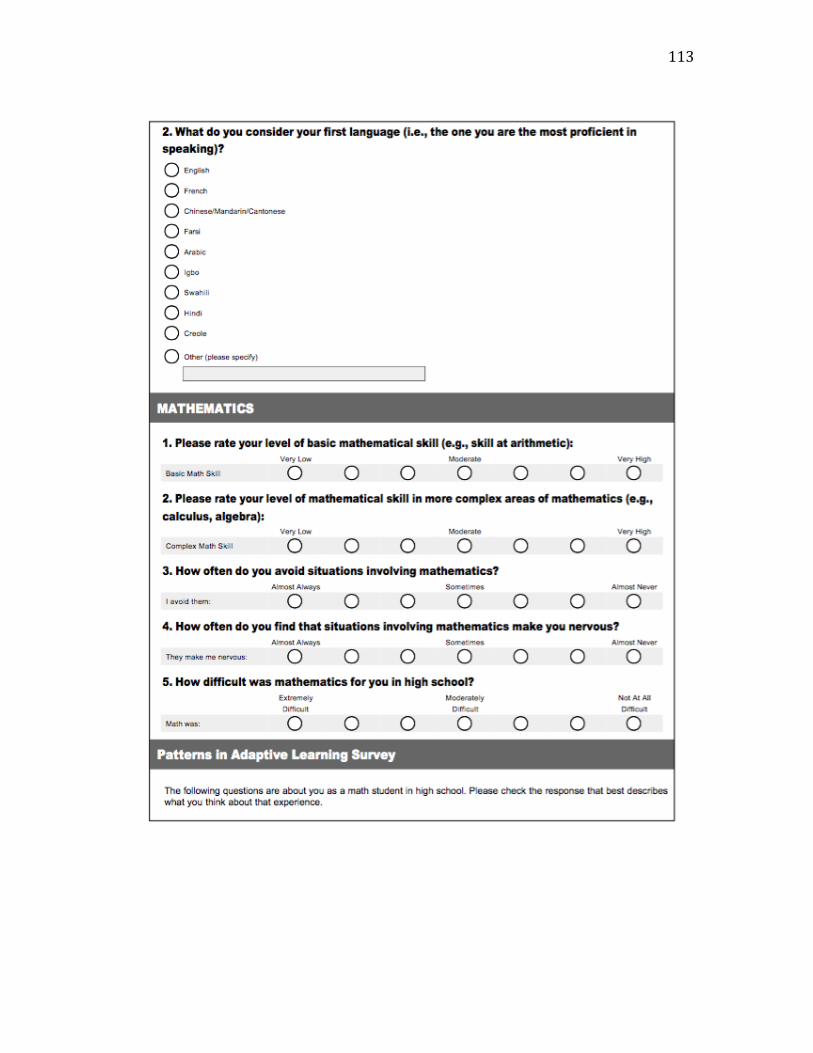
113

114
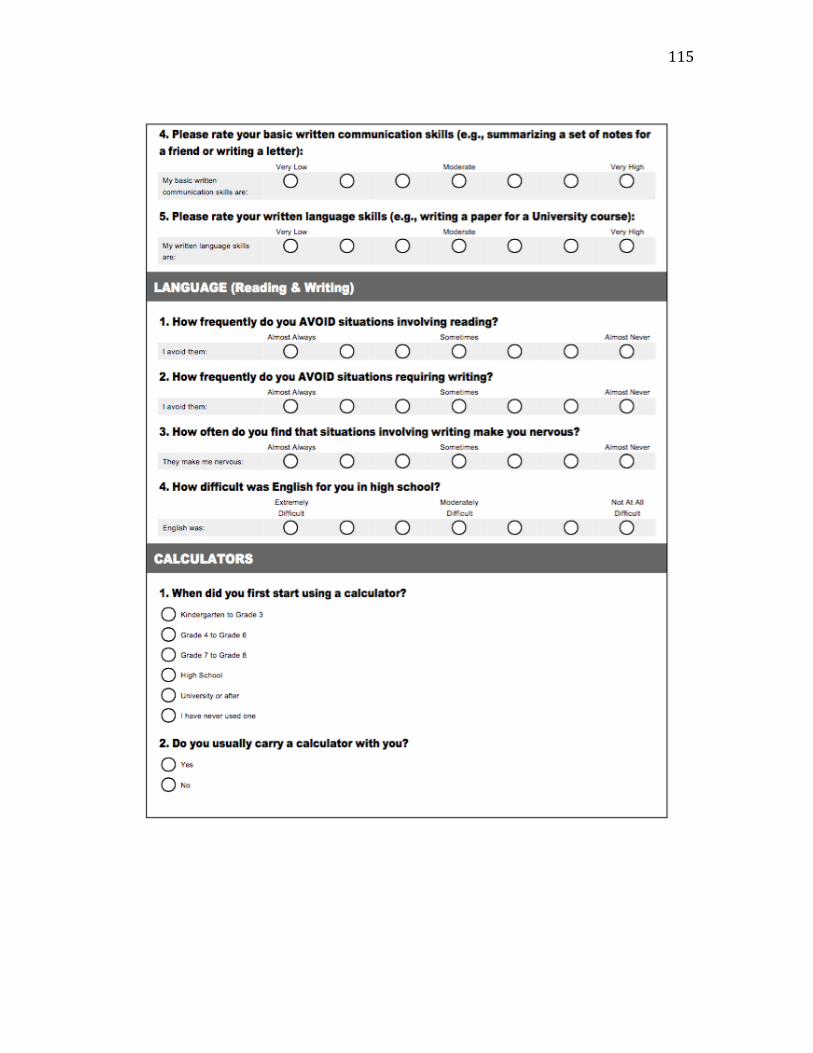
115
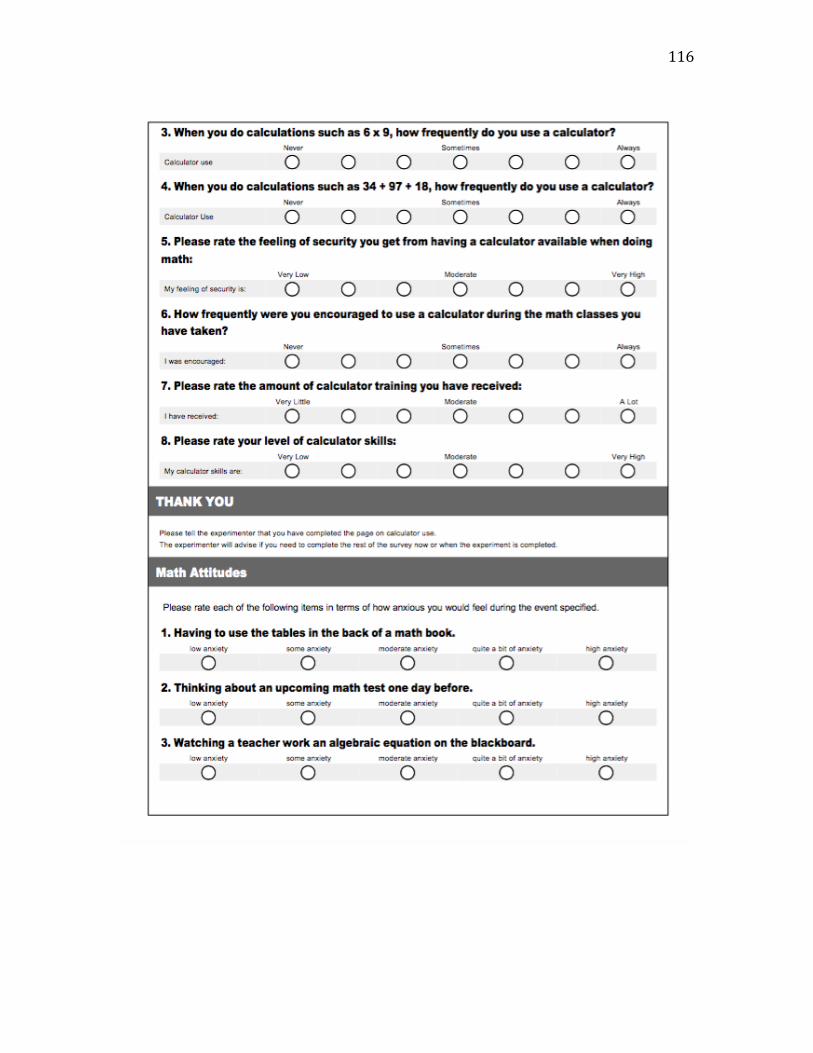
116
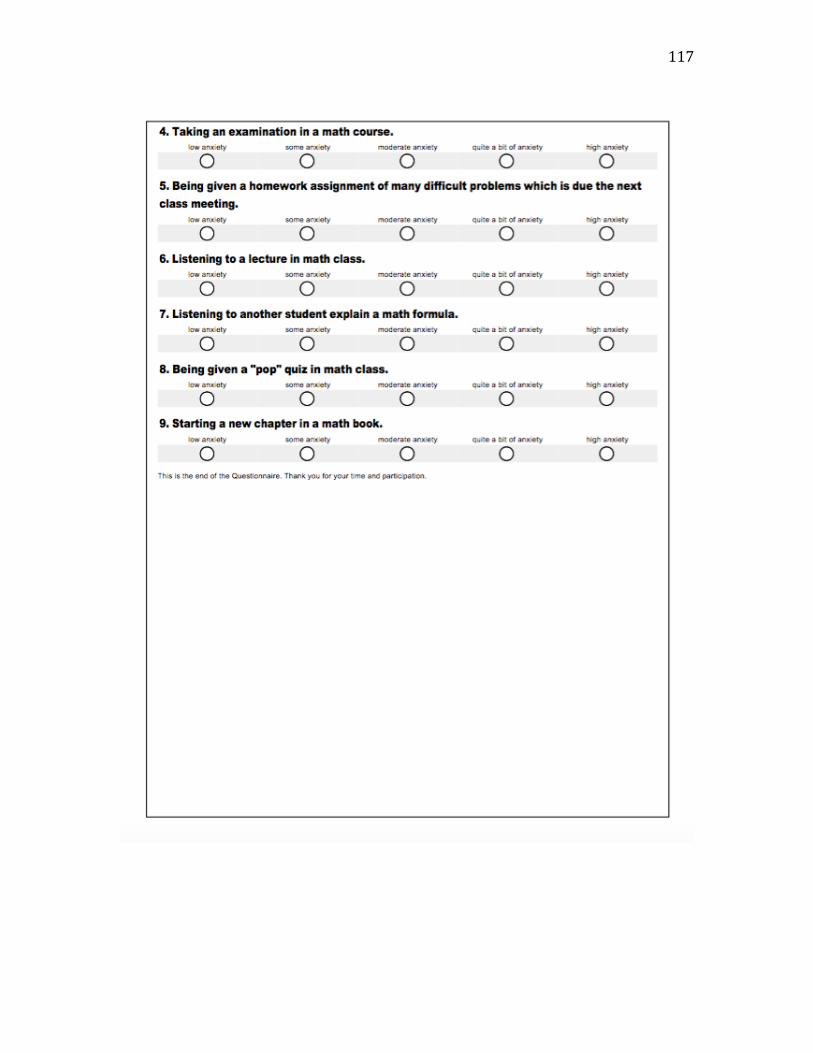
117
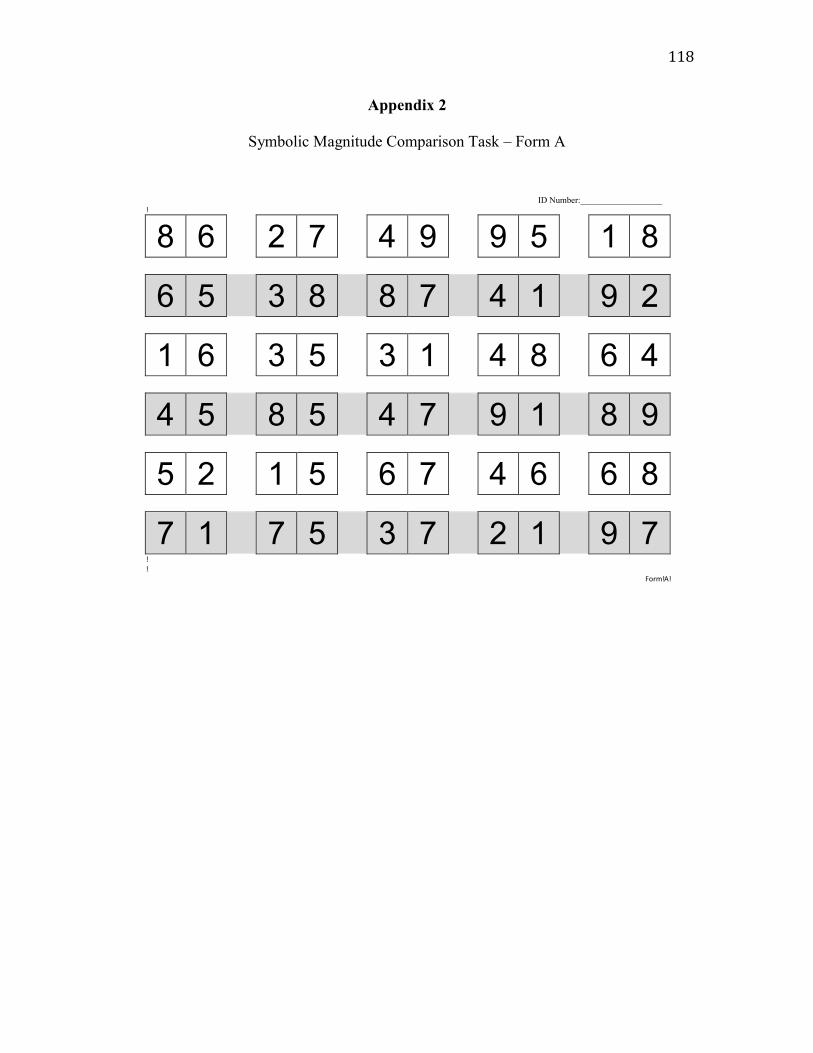
118
Appendix 2
Symbolic Magnitude Comparison Task – Form A
ID Number:___________________ !
8 6 2 7 4 9 9 5 1 8
6 5 3 8 8 7 4 1 9 2
1 6 3 5 3 1 4 8 6 4
4 5 8 5 4 7 9 1 8 9
5 2 1 5 6 7 4 6 6 8
7 1 7 5 3 7 2 1 9 7 !!
Form!A!
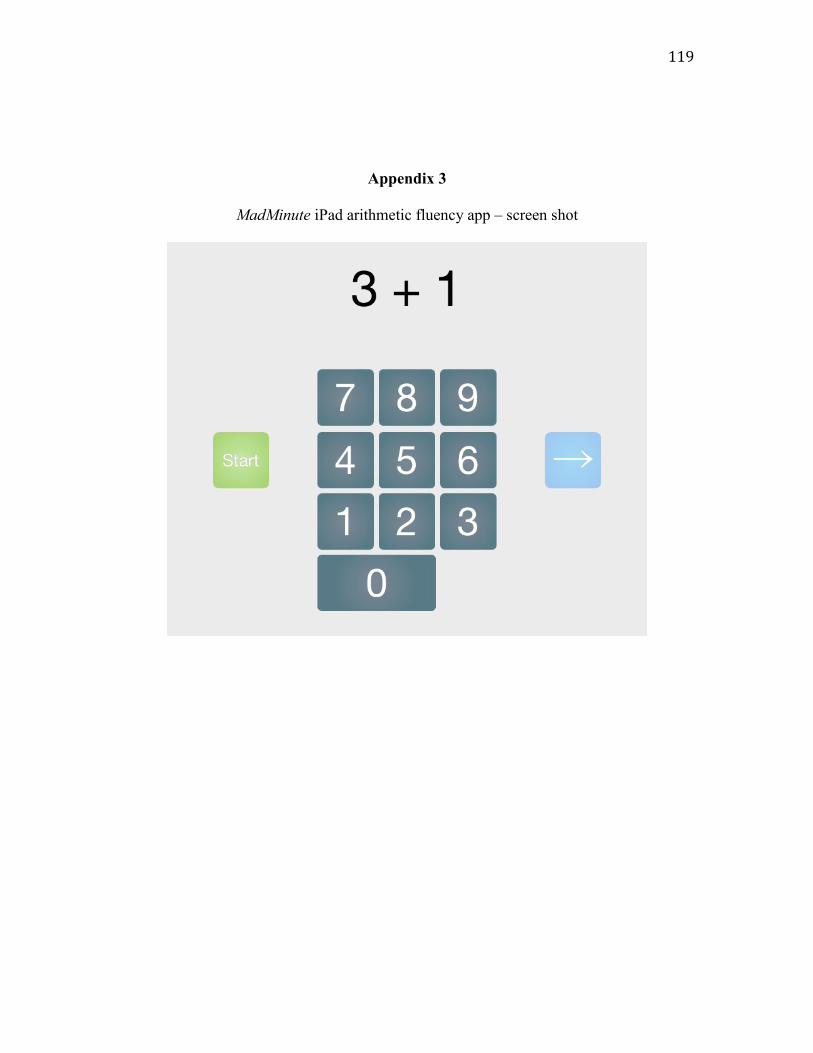
119
Appendix 3
MadMinute iPad arithmetic fluency app – screen shot
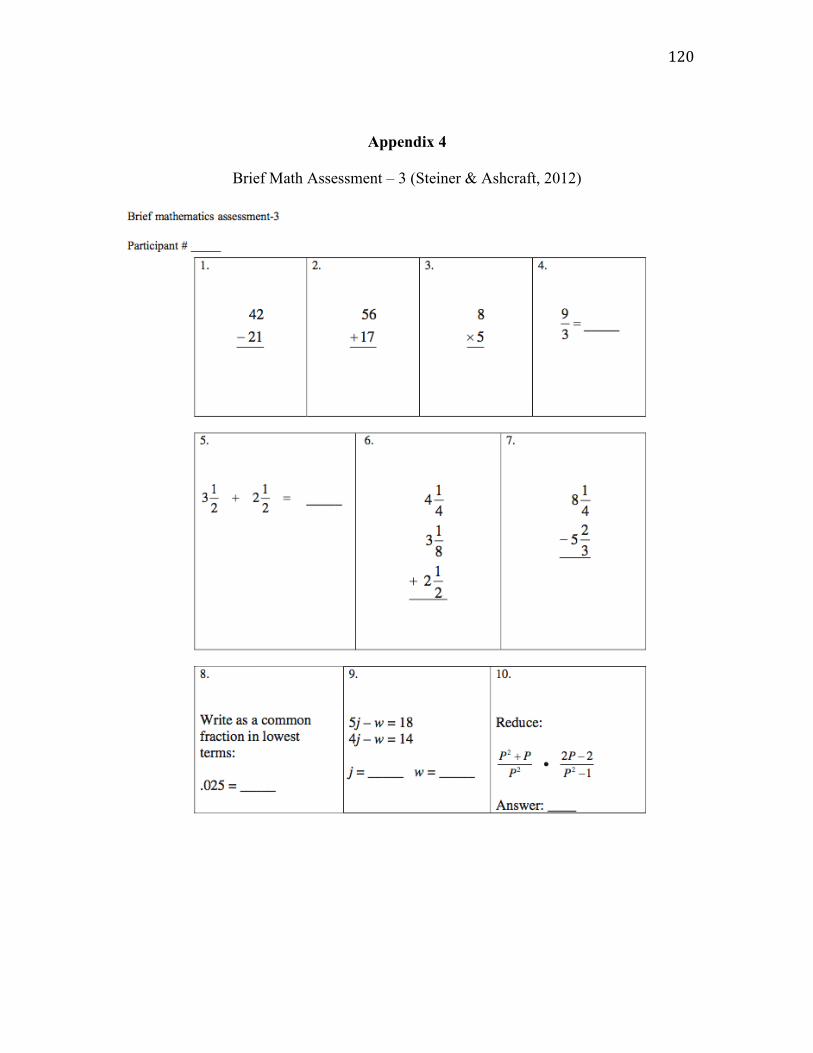
120
Appendix 4
Brief Math Assessment – 3 (Steiner & Ashcraft, 2012)