Embed Size (px)
Citation preview
Math 8C Unit 3 – Statistics
Unit 3 – Day 1 (U3D1)
• Standards Addressed:
– Create a scatter plot and label any trends and clustering.
– Explain why a linear model may fit a scatter plot and create a line of best fit for the data.
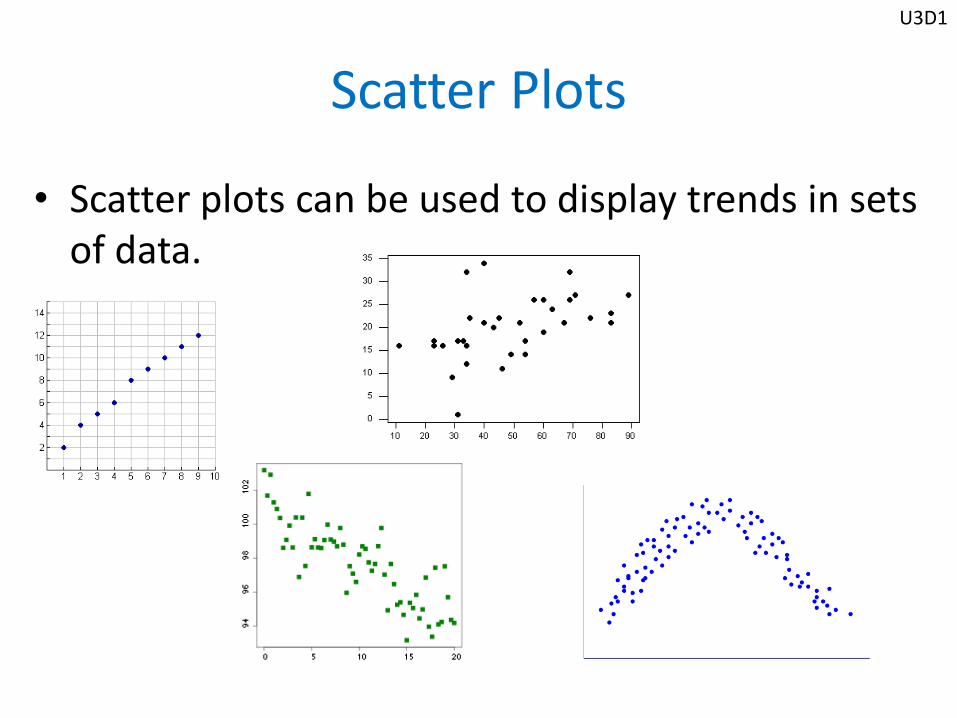
Scatter Plots
• Scatter plots can be used to display trends in sets of data.
U3D1

Vocabulary
• A scatter plot is a graph that shows the relationship between data sets using ordered pairs in a coordinate plane.
U3D1
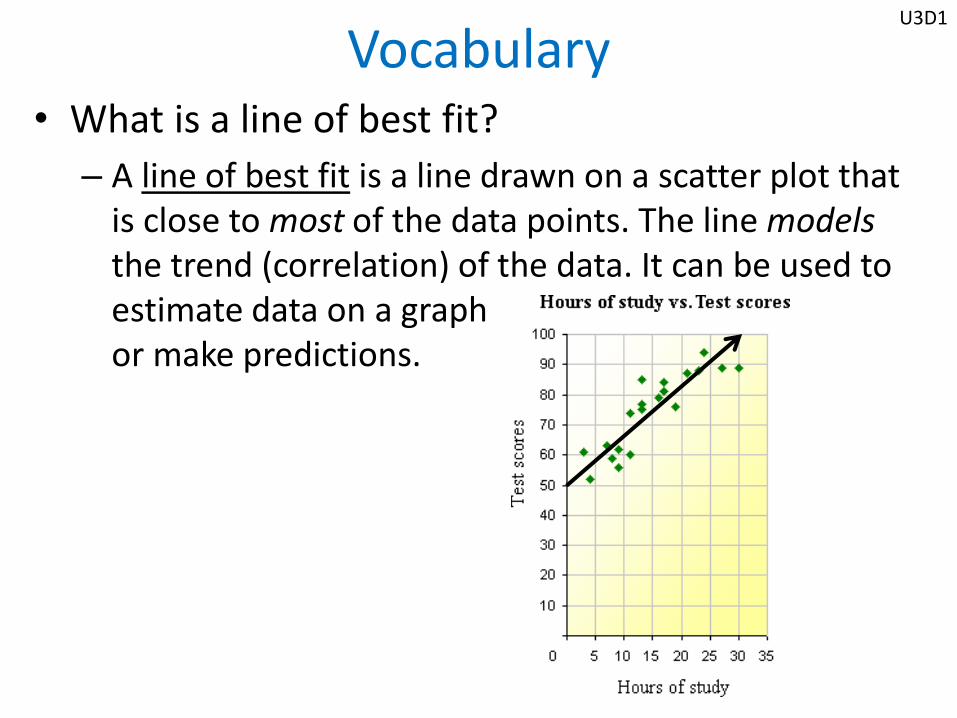
Vocabulary • What is a line of best fit?
– A line of best fit is a line drawn on a scatter plot that is close to most of the data points. The line models the trend (correlation) of the data. It can be used to estimate data on a graph or make predictions.
U3D1
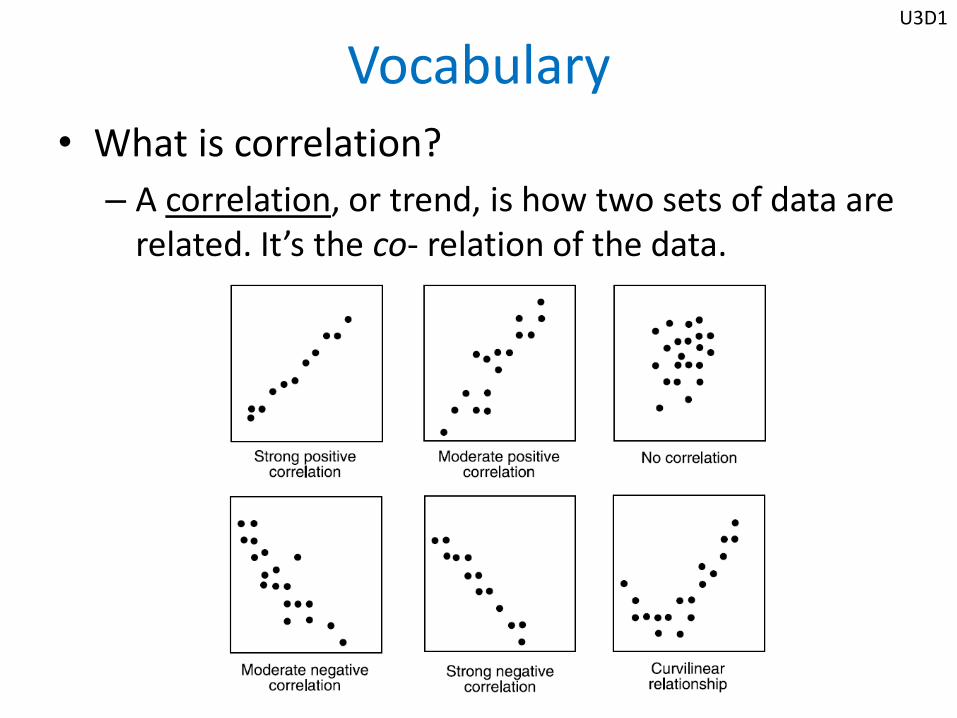
Vocabulary • What is correlation?
– A correlation, or trend, is how two sets of data are related. It’s the co- relation of the data.
U3D1
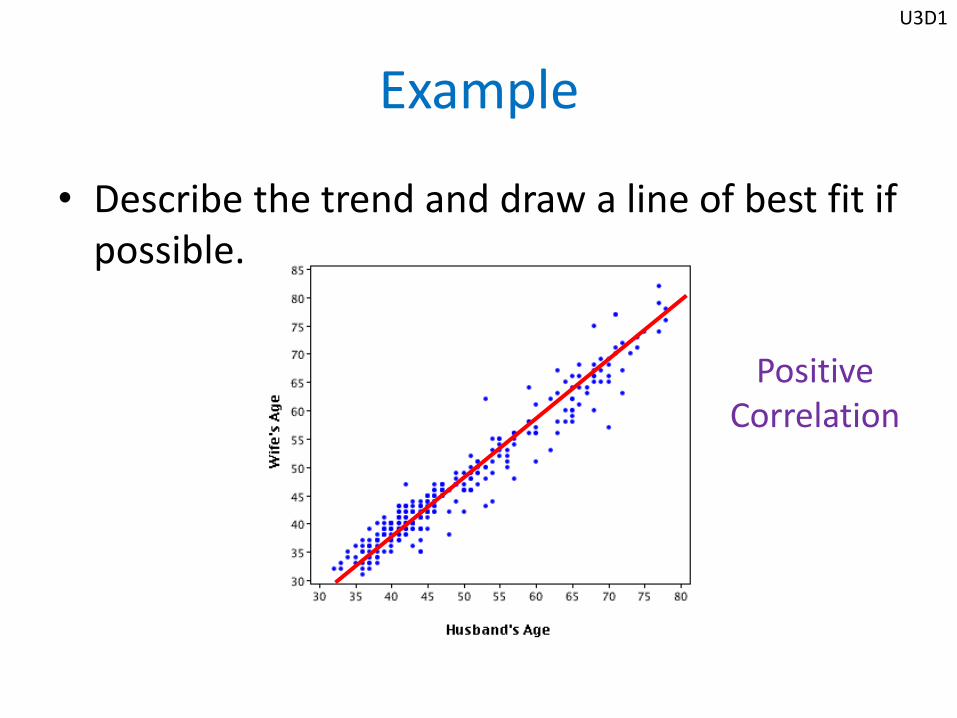
Example
• Describe the trend and draw a line of best fit if possible.
U3D1
Positive Correlation
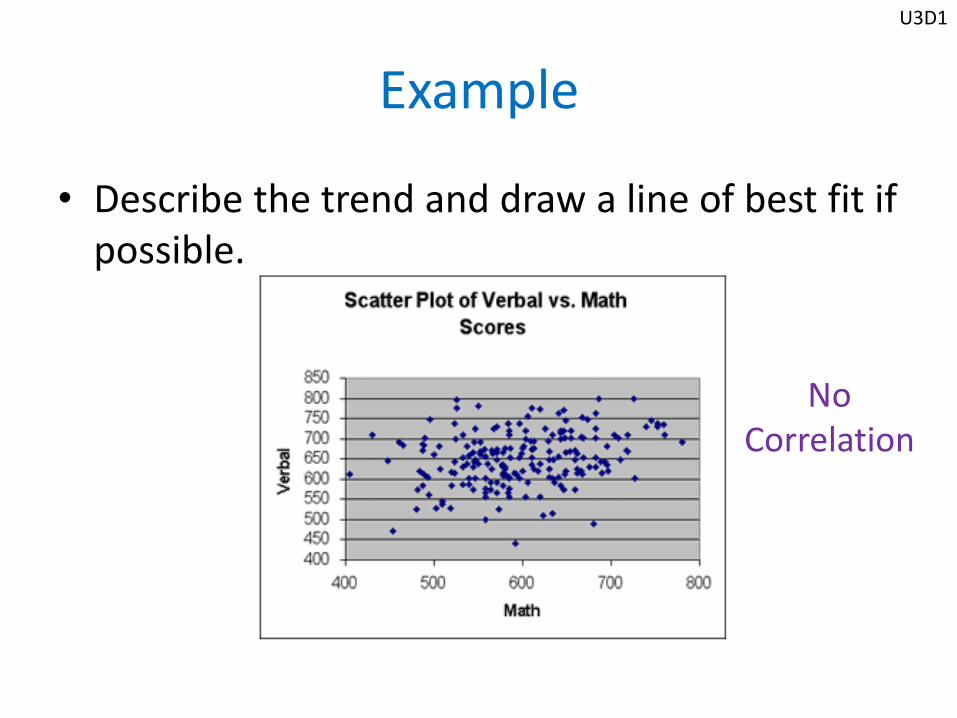
Example
• Describe the trend and draw a line of best fit if possible.
U3D1
No Correlation

Example
• Describe the trend and draw a line of best fit if possible.
U3D1
Negative Correlation
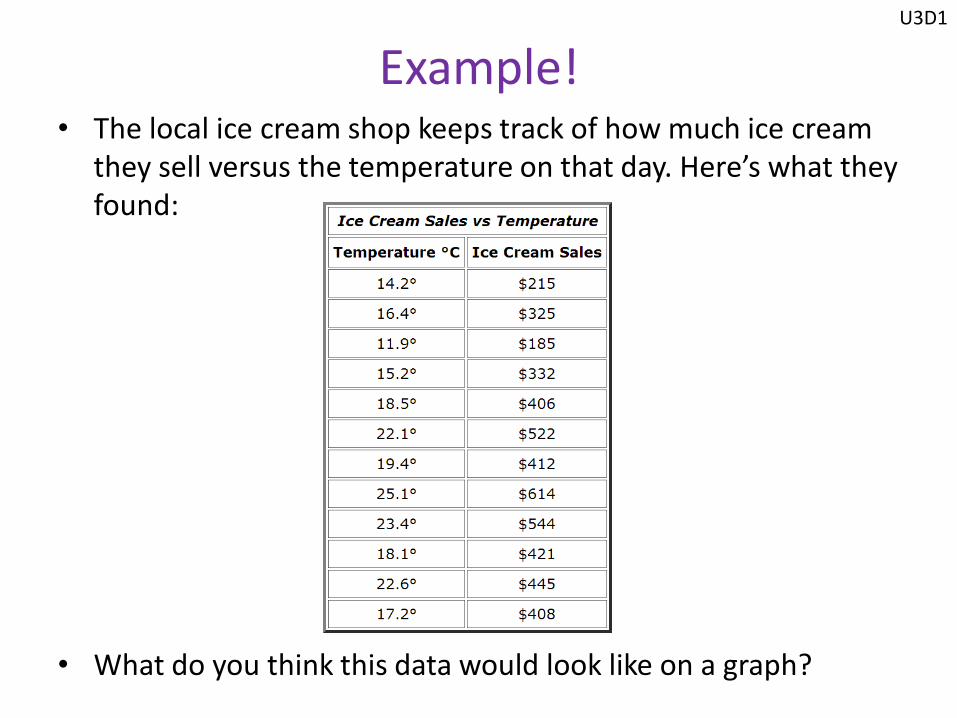
Example! • The local ice cream shop keeps track of how much ice cream
they sell versus the temperature on that day. Here’s what they found:
• What do you think this data would look like on a graph?
U3D1
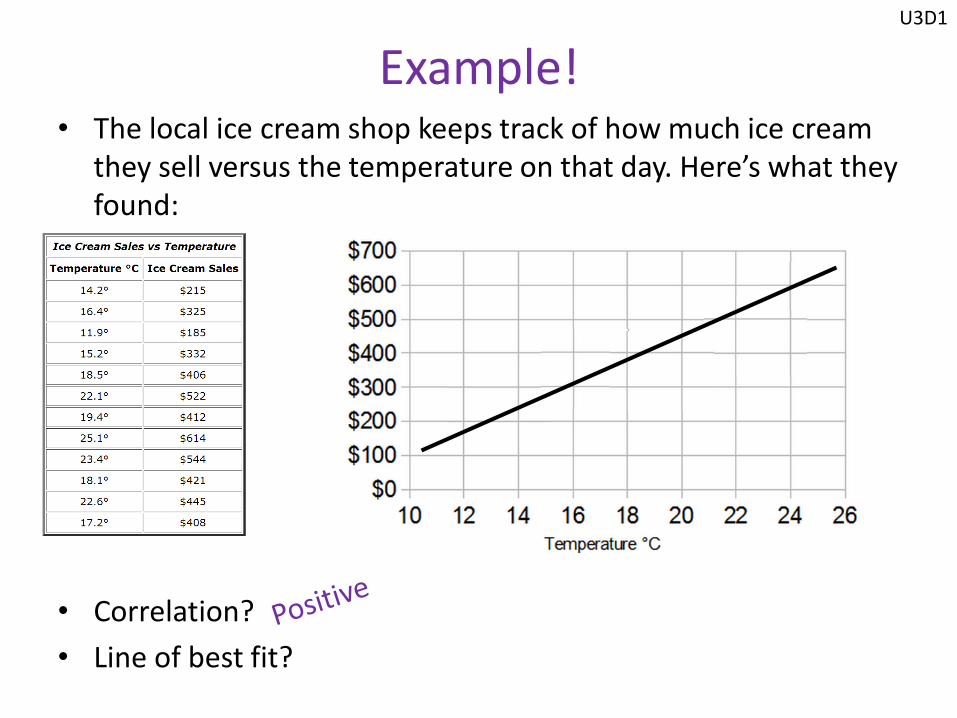
Example! • The local ice cream shop keeps track of how much ice cream
they sell versus the temperature on that day. Here’s what they found:
•
• Correlation?
• Line of best fit?
U3D1

In Class Practice
U3D1 - ICP
Unit 3 – Day 2
Standards Addressed:
Create a scatter plot and describe any trends.
Explain why a linear model may fit a scatter plot and create a line of best
fit for the data
Determine the equation of the line of best fit.

• You have been working on a science project for 8 months. Each month you have measured and recorded the length of a baby alligator in a table.
• The table below shows your measurements.
U3D2
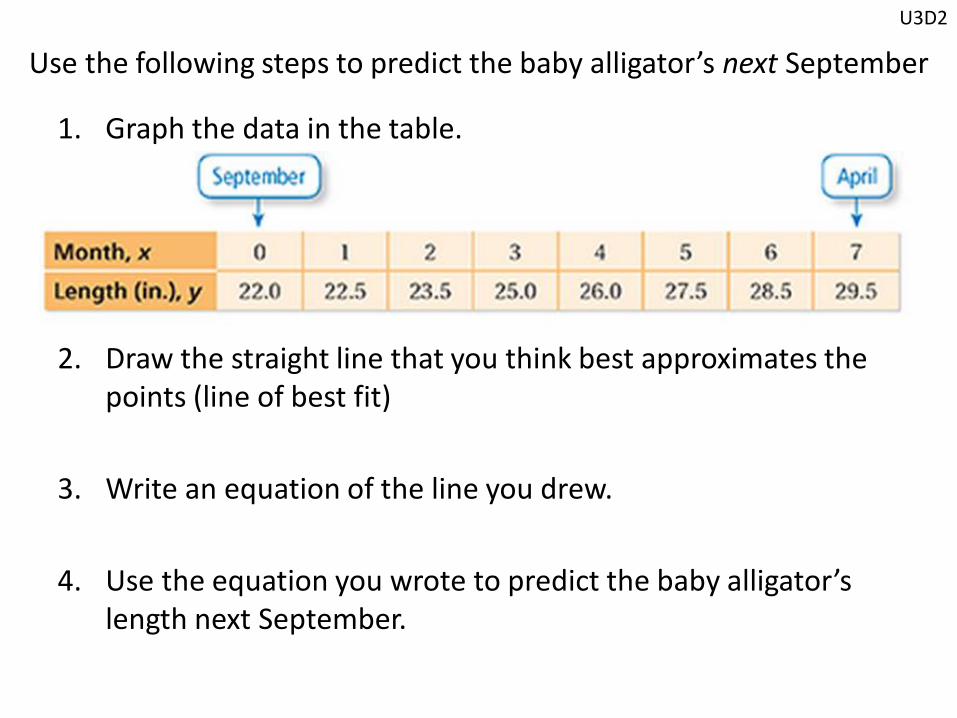
Use the following steps to predict the baby alligator’s next September
1. Graph the data in the table.
2. Draw the straight line that you think best approximates the points (line of best fit)
3. Write an equation of the line you drew.
4. Use the equation you wrote to predict the baby alligator’s length next September.
U3D2
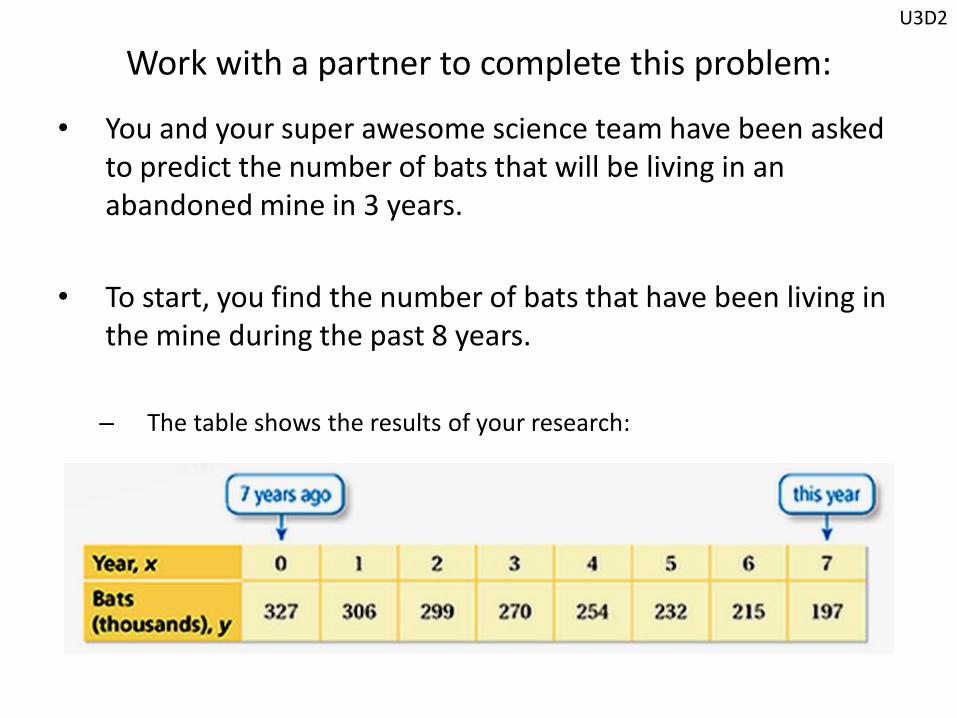
Work with a partner to complete this problem:
• You and your super awesome science team have been asked to predict the number of bats that will be living in an abandoned mine in 3 years.
• To start, you find the number of bats that have been living in the mine during the past 8 years.
– The table shows the results of your research:
U3D2

Use the following steps to predict the number of bats living in the mine after 3 years
1. Graph the data in the table.
2. Draw the straight line you think best approximates the data.
3. Write the equation of the line you drew.
4. Use the equation to predict the number of bats in three years.
U3D2
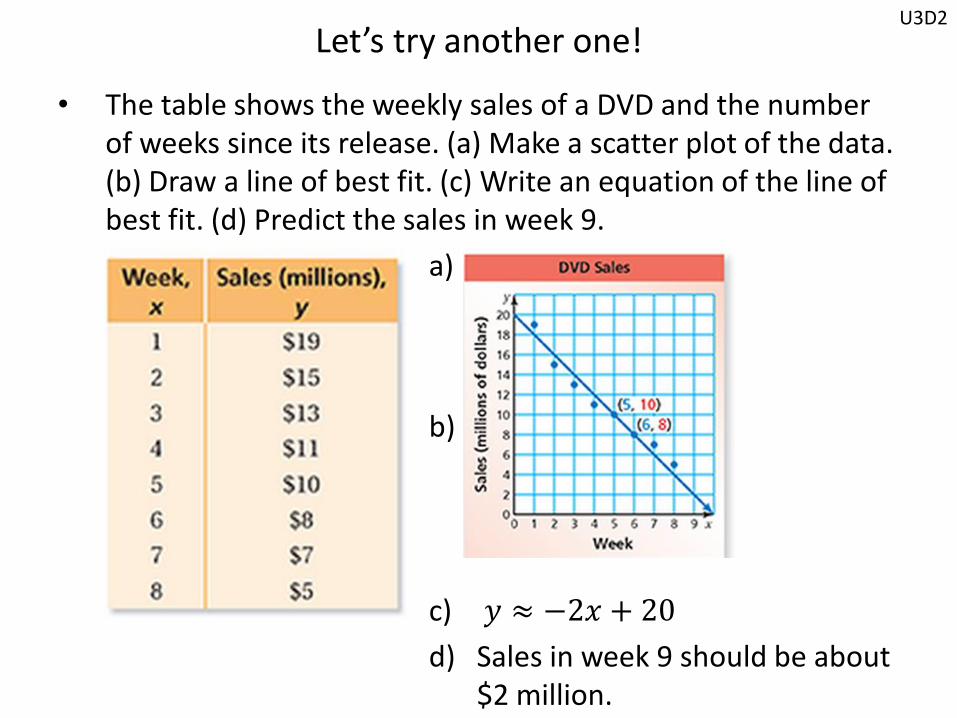
Let’s try another one!
• The table shows the weekly sales of a DVD and the number of weeks since its release. (a) Make a scatter plot of the data. (b) Draw a line of best fit. (c) Write an equation of the line of best fit. (d) Predict the sales in week 9.
a)
b)
c) 𝑦 ≈ −2𝑥 + 20
d) Sales in week 9 should be about $2 million.
U3D2

In Class Practice
U3D2 – ICP
U3D2