Embed Size (px)
Citation preview
Indicator Manual
1
MATERNAL HEALTH INDICATORS
Indicator MH 1: Antenatal care first visit coverage rate
A: ANC – First Visit
B: ANC First Visit in first trimester
C: ANC registered under JSY
Definition Percentage of pregnant women who used Antenatal
Care (ANC) provided by skilled health personnel, for
reasons related to pregnancy, registered in first trimester of
pregnancy
N.B - This indicator is also known as “ Any Antenatal care
visit”
Numerator: A: New Registered/first ANC visit of a pregnant woman
B: Pregnant women registered within first trimester
C: New women registered under JSY
Denominator A:Total expected pregnancies
B,C: Total number of ANC registered
Rationale • This first visit should be a "registration" visit where all initial procedures relating to assessing/preparing a woman for
pregnancy and delivery. This should include history,
examination, initial blood tests and immunisation.
• Antenatal care coverage is an indicator of access and use of health care during pregnancy. All women should
have at least three antenatal visits during a pregnancy.
• ANC should start as early in pregnancy as possible.
• % ANC registration in first trimester shows early care and
level of awareness
• % of women registered under JSY shows: number of
women entitled to benefits under JSY. This is include : a)
all women in EAG and NE states b) only BPL & SC/ST
women in HPS states
• % of pregnant women receiving any ANC is a sensitive
indicator of outreach
Data Source • Antenatal / pregnancy registers; Maternal health cards
• Household surveys • Population data - an estimate of the number of
pregnant women is close to the number of children born
(2.2-3.2% of population)
Suggested
level of use
National, state, district/ block and sub-centre
Other Useful • Risk and continuity indicators are important in ANC
Indicator Manual
2
Indicators • VDRL (syphilis) and HIV testing coverage shows quality of care. This should be done in first ANC visit
• Haemoglobin testing and anaemia management rates
• ANC referrals shows risk detection (and transport
availability).
• % women getting third ANC shows continuity of care,
which is often related to perceived quality.
Common
Problems
• Attendance for pregnancy test or simple registration
without history and examination do NOT constitute
antenatal care.
• Women who have started ANC elsewhere, but who
come to your facility for follow up should be counted as
follow up ANC and not first ANC
Actions to
Consider
Low coverage means either the strategy for providing
ANC needs to be reviewed to increase access, or the
community should be approached to increase
awareness through ASHA,VHSC,BCC etc
Indicator MH 2: ANC third visit coverage rate
Definition Percentage of women who used antenatal care
provided by skilled health personnel for reasons related to
pregnancy at least 3 times during pregnancy
Numerator ANC third visit
Denominator A. Expected pregnancies B. ANC any visit
Rationale • Antenatal care third coverage is an indicator of continuity and use of health care during pregnancy
and also of access
• Poor quality ANC could also be a reason that women
come once and then stop
Data Source ANC Register maintained by health workers
Other Useful
Indicators
• Drop-out rate first to third ANC
• Comparison of third ANC to delivery rates
• %ANC with full blood tests (Hb, HIV, VDRL)
Suggested
level of use
State, District, Block and sub-centre
Common
Problems
• When ANC has been done in different facilities
• High coverage may mean problems with your choice
of denominator, or double counting
Actions to
Consider
• Low coverage means either the strategy for providing
ANC needs to be reviewed to increase access, or the
Indicator Manual
3
community should be approached to increase
awareness through ASHA,VHSC,BCC
• Improved quality of care in earlier visits
• Ensure that first ANC are not done through sporadic
camps or MMU approaches
Indicator MH 3:
a. % ANC TT-1 coverage rate
b. % ANC TT2 and TT booster coverage rate
c. ANC 100 IFA coverage rate
Definition Percentage of pregnant women who used antenatal
care and were given TT1,TT2 or TT booster vaccine
Numerator A Antenatal care given TT-1
B. Antenatal care given TT2 or TT booster
C. Antenatal care given 100 IFA Tablets
Denominator Total ANC registered (ANC first visit)
Rationale • Antenatal care 100 IFA coverage is an indicator of
quality of ANC
• Antenatal care TT-1, TT-2 / Booster coverage is an
indicator of quality of ANC
• It is also an indicator for availability of the basic
immunisation of ANC
• All pregnant women are recommended 100 IFA Tablets
• Woman in her First pregnancy needs TWO TT
immunisations; subsequent pregnancies she needs only
a booster
Data Source Registers maintained by health workers; Household
surveys
Other Useful
Indicators
• TT protected at birth rate measures % of newborns
protected from tetanus by their mother being fully
immunised for TT
• Neonatal Tetanus rate measures cases of Neonatal
tetanus- a failure of our ANC TT immunisation program
• Anaemia rate
Suggested
level of use
State, District, Block, sub centre
Common
Problems
• IFA tablets given may not be consumed
Actions to
Consider
• Addresses supply side issues • Ensure quality of ANC
Indicator Manual
4
• Awareness generation among mothers on availing
complete ANC services
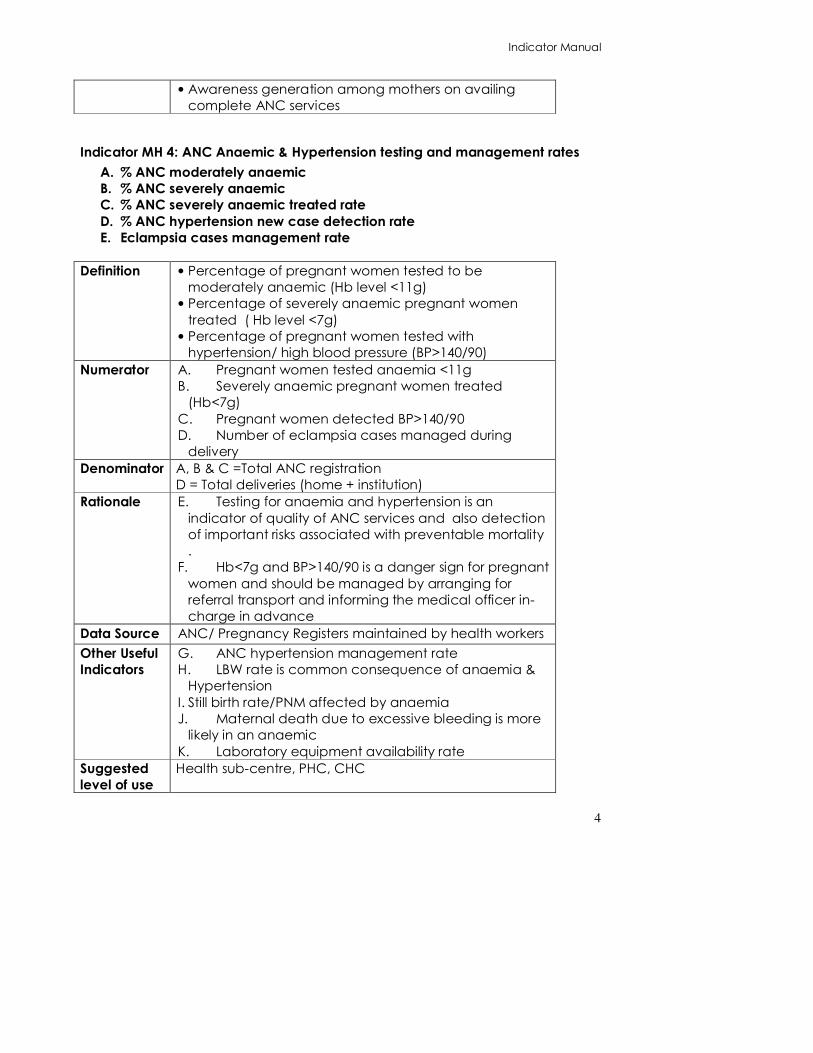
Indicator MH 4: ANC Anaemic & Hypertension testing and management rates
A. % ANC moderately anaemic
B. % ANC severely anaemic
C. % ANC severely anaemic treated rate
D. % ANC hypertension new case detection rate
E. Eclampsia cases management rate
Definition • Percentage of pregnant women tested to be
moderately anaemic (Hb level <11g)
• Percentage of severely anaemic pregnant women
treated ( Hb level <7g)
• Percentage of pregnant women tested with
hypertension/ high blood pressure (BP>140/90)
Numerator A. Pregnant women tested anaemia <11g
B. Severely anaemic pregnant women treated
(Hb<7g)
C. Pregnant women detected BP>140/90
D. Number of eclampsia cases managed during
delivery
Denominator A, B & C =Total ANC registration
D = Total deliveries (home + institution)
Rationale E. Testing for anaemia and hypertension is an
indicator of quality of ANC services and also detection
of important risks associated with preventable mortality
.
F. Hb<7g and BP>140/90 is a danger sign for pregnant
women and should be managed by arranging for
referral transport and informing the medical officer in-
charge in advance
Data Source ANC/ Pregnancy Registers maintained by health workers
Other Useful
Indicators
G. ANC hypertension management rate
H. LBW rate is common consequence of anaemia &
Hypertension
I. Still birth rate/PNM affected by anaemia
J. Maternal death due to excessive bleeding is more
likely in an anaemic
K. Laboratory equipment availability rate
Suggested
level of use
Health sub-centre, PHC, CHC

Indicator Manual
5
Common
Problems
L. BP is often not taken and Hb testing is not done M. Health sub-centres do not have BP apparatus and
Hb kits
N. Sufficient stock of IFA tablets
Actions to
Consider
O. Address supply side issues
P. Ensure quality of ANC
Q. Awareness generation among mothers to avail
complete and quality ANC services
Indicator MH 5: Skilled Birth Attendant (SBA) delivery rate
Definition Proportion of total deliveries assisted by a Skilled Birth
Attendant (at home and at institutions)
Skilled Birth
Attendant
definition
A skilled birth attendant is an accredited health
professional - such as a midwife, doctor or nurse - who
has been educated and trained to proficiency in the
skills needed to manage normal (uncomplicated)
pregnancies, childbirth and the immediate postnatal
period, and in the identification, management and
referral of complications in women and newborns
Numerator Deliveries by SBA (SBA Home + all Institutional deliveries)
Denominator A. Expected numbers of deliveries
B. Total recorded deliveries Rationale • Attendance of deliveries by skilled birth attendants is
the single most important factor in reducing maternal
mortality, and is a MDG indicator.
• There is increasing evidence that the SBA is most
effective when delivering in institutions, rather than at
home.
Data Source Labour records and maternity registers maintained at
facilities and by health workers; Household surveys
Other Useful
Indicators
• SBA deliveries as proportion of ANC first visit
• SBA deliveries as proportion of reported deliveries
• SBA deliveries at institutions and at home;
• Peri-natal mortality from SBA deliveries
Suggested
level of use
District, Block
Common
Problems
• The definition of SBA excludes Traditional birth
attendants, even if they have been trained. Even
professional staff that have had training, lose their
delivery skills if they do not use them.
Indicator Manual
6
• Even ANMs only have a minimal amount of delivery
training and most of their skills are learned through
experience, not formal training. For the purpose of
measurability, all nurses and ANMs are counted,
which leads to an overestimation of those who are
skilled.
• Since deliveries in private sector and underserved
areas are unreported, the use of expected number
of deliveries may lead to an underestimation of SBA
deliveries, hence the need to use reported deliveries
as denominator
Actions to
Consider
• Include private sector deliveries
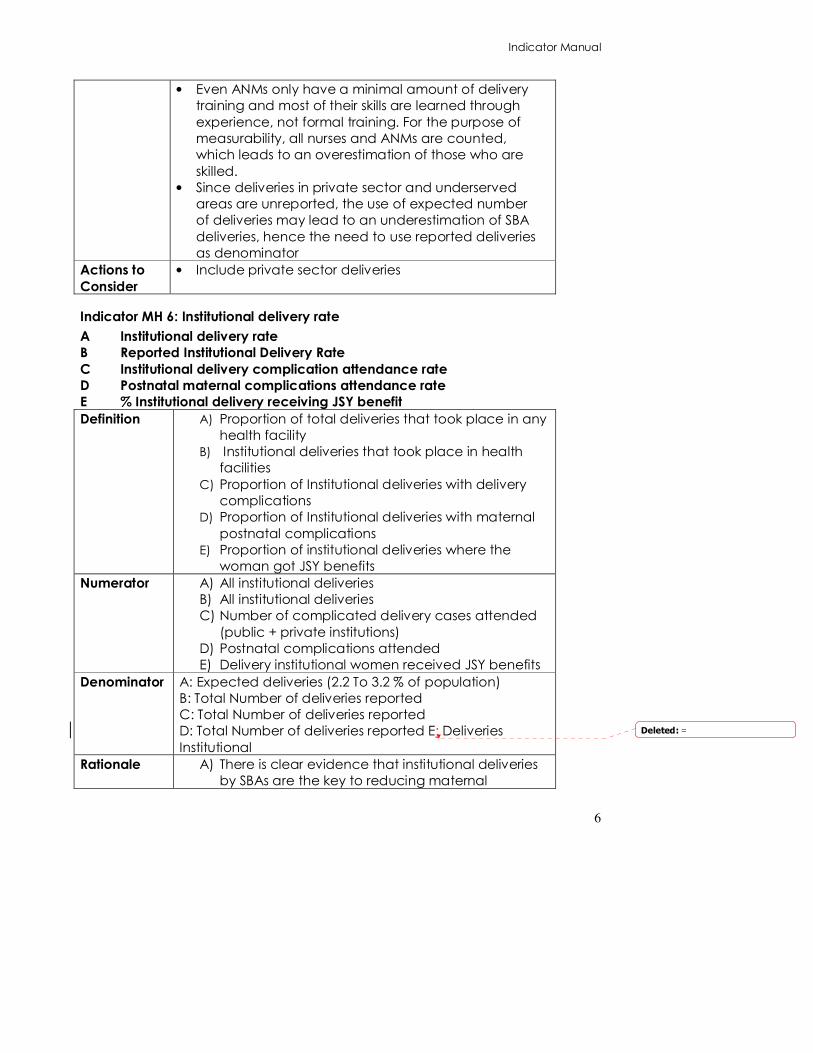
Indicator MH 6: Institutional delivery rate
A Institutional delivery rate
B Reported Institutional Delivery Rate
C Institutional delivery complication attendance rate
D Postnatal maternal complications attendance rate
E % Institutional delivery receiving JSY benefit
Definition A) Proportion of total deliveries that took place in any
health facility
B) Institutional deliveries that took place in health
facilities
C) Proportion of Institutional deliveries with delivery
complications
D) Proportion of Institutional deliveries with maternal
postnatal complications
E) Proportion of institutional deliveries where the
woman got JSY benefits
Numerator A) All institutional deliveries B) All institutional deliveries C) Number of complicated delivery cases attended
(public + private institutions)
D) Postnatal complications attended
E) Delivery institutional women received JSY benefits
Denominator A: Expected deliveries (2.2 To 3.2 % of population)
B: Total Number of deliveries reported
C: Total Number of deliveries reported
D: Total Number of deliveries reported E: Deliveries
Institutional
Rationale A) There is clear evidence that institutional deliveries by SBAs are the key to reducing maternal
Deleted: =

Indicator Manual
7
mortality, due to improved emergency
infrastructure, access to transport and referral
facilities and a number of other factors.
B) In absence of complete estimated population
figures in states, the institutional delivery
performance can also be calculated by total
reported delivery figures. This can supplement the
overall understanding of the institutional delivery in
the state
C) Postnatal complications shows the rate of
identification of postnatal complications at PNC
visits
D) JSY benefits are given to encourage women to
come for institutional deliveries, thus reducing
maternal mortality.
Data Source Maternity registers maintained by health workers at
health facilities; Household surveys
Other Useful
Indicators
• Institutional deliveries can be broken down by type of
institution – SC, PHC, CHC, hospital etc
• Institutional Perinatal mortality rate is a good indicator
of quality of care;
• % deliveries by SBAs should be assessed where not all
nurses at institutions are trained SBAs,
Suggested
level of use
National and below
Common
Problems
Actions to
Consider
Indicator MH 7: Home delivery rate
A Home delivery rate
B Reported home delivery rate
C Home delivery by Skilled birth attendant (SBA) rate
D Home delivery by Non Skilled birth attendant rate
E % Home delivery receiving JSY benefit
Definition A) Percentage of total deliveries that took place at
home
B) Reported home delivery rate
C) Home deliveries attended by SBA
D) Home deliveries attended by Non-SBA
E) Home deliveries receiving JSY benefit
Indicator Manual
8
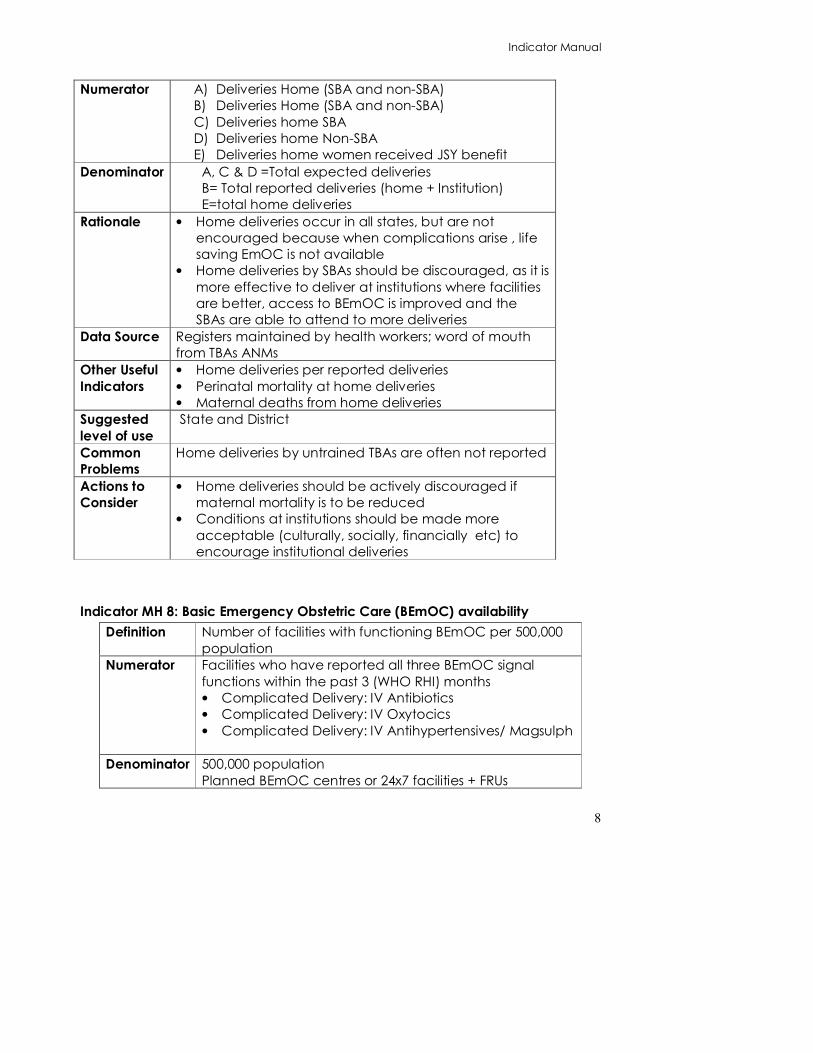
Numerator A) Deliveries Home (SBA and non-SBA)
B) Deliveries Home (SBA and non-SBA)
C) Deliveries home SBA
D) Deliveries home Non-SBA
E) Deliveries home women received JSY benefit
Denominator A, C & D =Total expected deliveries
B= Total reported deliveries (home + Institution)
E=total home deliveries
Rationale • Home deliveries occur in all states, but are not
encouraged because when complications arise , life
saving EmOC is not available
• Home deliveries by SBAs should be discouraged, as it is
more effective to deliver at institutions where facilities
are better, access to BEmOC is improved and the
SBAs are able to attend to more deliveries
Data Source Registers maintained by health workers; word of mouth
from TBAs ANMs
Other Useful
Indicators
• Home deliveries per reported deliveries
• Perinatal mortality at home deliveries
• Maternal deaths from home deliveries
Suggested
level of use
State and District
Common
Problems
Home deliveries by untrained TBAs are often not reported
Actions to
Consider
• Home deliveries should be actively discouraged if
maternal mortality is to be reduced
• Conditions at institutions should be made more
acceptable (culturally, socially, financially etc) to
encourage institutional deliveries
Indicator MH 8: Basic Emergency Obstetric Care (BEmOC) availability
Definition Number of facilities with functioning BEmOC per 500,000
population
Numerator Facilities who have reported all three BEmOC signal
functions within the past 3 (WHO RHI) months
• Complicated Delivery: IV Antibiotics
• Complicated Delivery: IV Oxytocics
• Complicated Delivery: IV Antihypertensives/ Magsulph
Denominator 500,000 population
Planned BEmOC centres or 24x7 facilities + FRUs
Indicator Manual
9
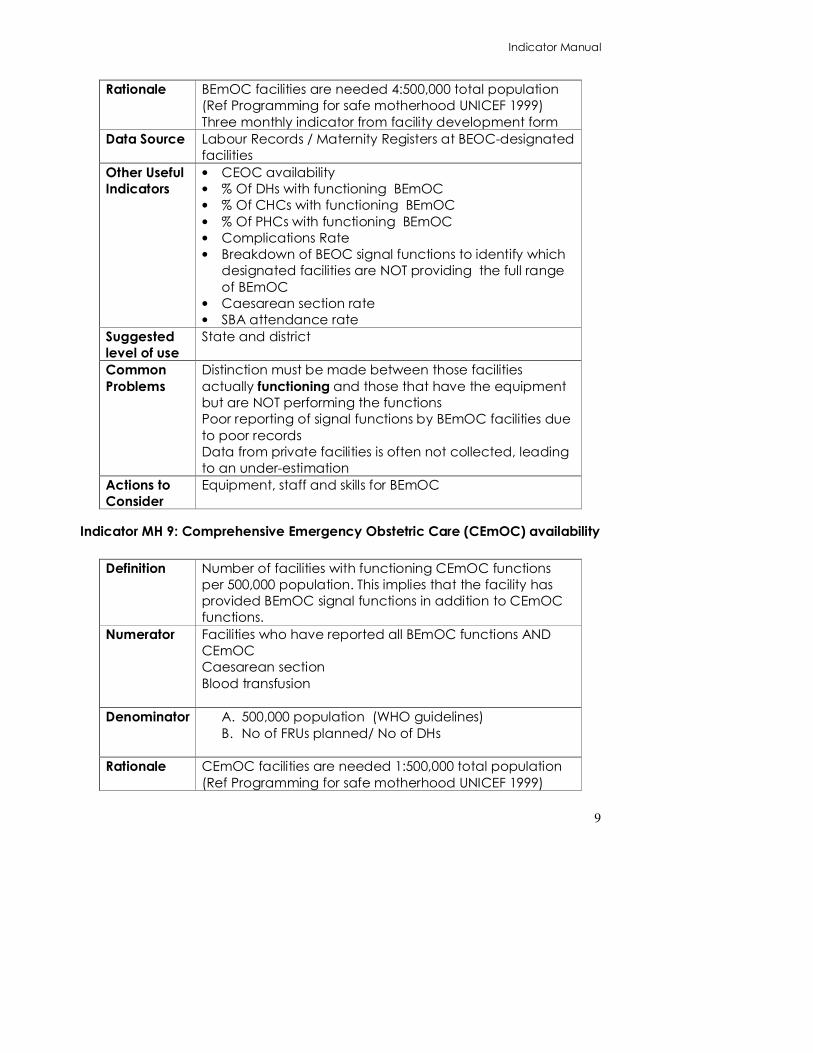
Rationale BEmOC facilities are needed 4:500,000 total population
(Ref Programming for safe motherhood UNICEF 1999)
Three monthly indicator from facility development form
Data Source Labour Records / Maternity Registers at BEOC-designated
facilities
Other Useful
Indicators
• CEOC availability
• % Of DHs with functioning BEmOC
• % Of CHCs with functioning BEmOC
• % Of PHCs with functioning BEmOC
• Complications Rate
• Breakdown of BEOC signal functions to identify which
designated facilities are NOT providing the full range
of BEmOC
• Caesarean section rate
• SBA attendance rate
Suggested
level of use
State and district
Common
Problems
Distinction must be made between those facilities
actually functioning and those that have the equipment
but are NOT performing the functions
Poor reporting of signal functions by BEmOC facilities due
to poor records
Data from private facilities is often not collected, leading
to an under-estimation
Actions to
Consider
Equipment, staff and skills for BEmOC
Indicator MH 9: Comprehensive Emergency Obstetric Care (CEmOC) availability
Definition Number of facilities with functioning CEmOC functions
per 500,000 population. This implies that the facility has
provided BEmOC signal functions in addition to CEmOC
functions.
Numerator Facilities who have reported all BEmOC functions AND
CEmOC
Caesarean section
Blood transfusion
Denominator A. 500,000 population (WHO guidelines)
B. No of FRUs planned/ No of DHs
Rationale CEmOC facilities are needed 1:500,000 total population
(Ref Programming for safe motherhood UNICEF 1999)

Indicator Manual
10
This is a monthly indicator from facility development form
Data Source Theatre Records / Maternity Registers at CEmOC-
designated facilities
Blood transfusion records
Other Useful
Indicators
Caesarean Section rate shows only surgical interventions,
without other CEmOC functions. This should be 5-15 %
% of DHs with CEmOC functions
% of CHCs with CEmOC functions
Blood transfusion rate will show blood transfusions for
CEmOC and other non-obstetric emergencies
Suggested
level of use
State and district
Common
Problems
Many facilities provide caesarean sections WITHOUT the
full package of BEmOC interventions. This should be
actively discouraged by a system of accreditation and
licensing.
Many private institutions do not report caesarean
sections, and it is often these instiutions that provide
C/sections without adequate indications
Actions to
Consider
Include private facilities in reporting maternal health
indicators
Indicator MH 10: Admission duration after delivery
Definition Percentage of women who were discharged in less than
48 hrs of delivery
Numerator Institutional delivery discharged up to 48 hrs of delivery
Denominator Deliveries Institutional
Rationale Postnatal care
All women should be kept in hospital for at least 48 hours
risk of postnatal complications and maternal mortality is
highest during this period
Data Source Maternity Registers maintained by the health workers and
health facilities
Other Useful
Indicators
• Causes of PNC complications
Suggested
level of use
District
Common
Problems
Many women want to go home early, but this prevents
adequate PNC
Actions to
Consider
Indicator Manual
11
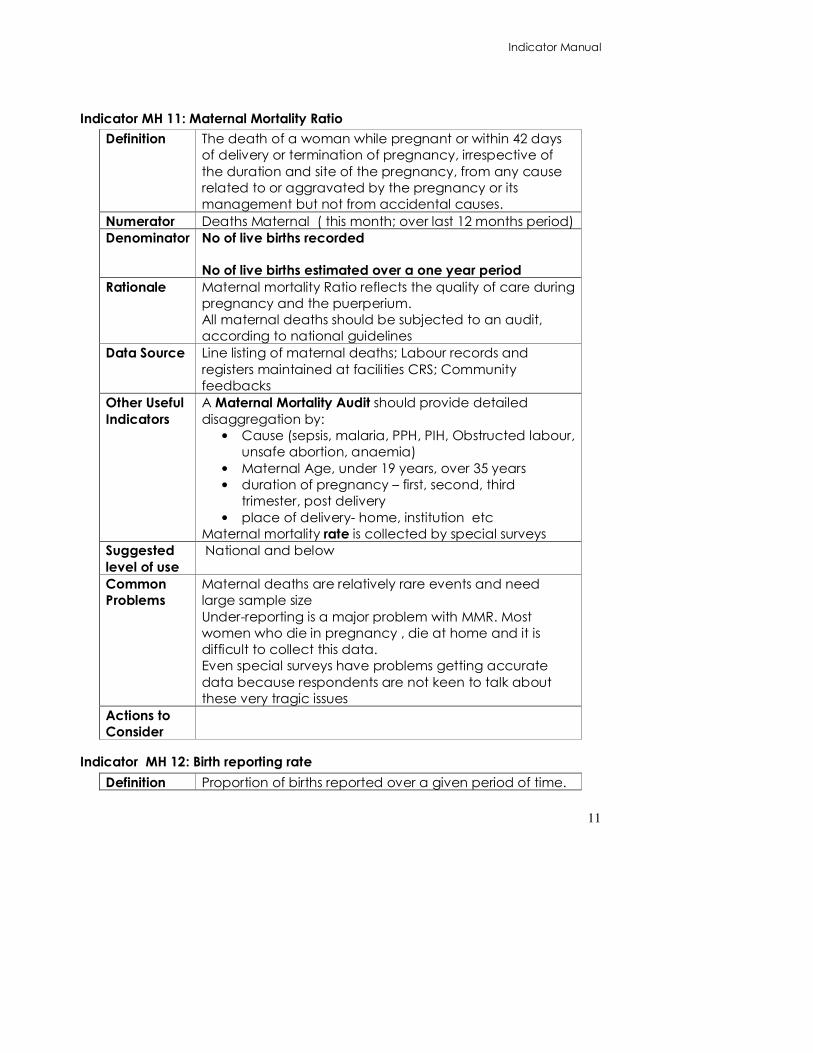
Indicator MH 11: Maternal Mortality Ratio
Definition The death of a woman while pregnant or within 42 days
of delivery or termination of pregnancy, irrespective of
the duration and site of the pregnancy, from any cause
related to or aggravated by the pregnancy or its
management but not from accidental causes.
Numerator Deaths Maternal ( this month; over last 12 months period)
Denominator No of live births recorded
No of live births estimated over a one year period
Rationale Maternal mortality Ratio reflects the quality of care during
pregnancy and the puerperium.
All maternal deaths should be subjected to an audit,
according to national guidelines
Data Source Line listing of maternal deaths; Labour records and
registers maintained at facilities CRS; Community
feedbacks
Other Useful
Indicators
A Maternal Mortality Audit should provide detailed
disaggregation by:
• Cause (sepsis, malaria, PPH, PIH, Obstructed labour,
unsafe abortion, anaemia)
• Maternal Age, under 19 years, over 35 years
• duration of pregnancy – first, second, third
trimester, post delivery
• place of delivery- home, institution etc
Maternal mortality rate is collected by special surveys
Suggested
level of use
National and below
Common
Problems
Maternal deaths are relatively rare events and need
large sample size
Under-reporting is a major problem with MMR. Most
women who die in pregnancy , die at home and it is
difficult to collect this data.
Even special surveys have problems getting accurate
data because respondents are not keen to talk about
these very tragic issues
Actions to
Consider
Indicator MH 12: Birth reporting rate
Definition Proportion of births reported over a given period of time.

Indicator Manual
12
Numerator Births reported
Denominator Estimated births of population
Rationale This indicator assesses the proportion of births reported by
the health services in order to assess overall coverage of
safe deliveries by health workers.
Data Source Line listing of births; maternity registers and household
surveys etc
Other Useful
Indicators
Comparison to CRS reports
Suggested
level of use
National, State, District and Block
Common
Problems
Actions to
Consider
Indicator MH 13: Postnatal care
Definition Percentage of women who used postnatal care
provided by skilled health personnel
Numerator Postnatal mother/baby visits
Denominator Total Deliveries (Institutional + Home)
Rationale • Postnatal care (PNC) is an essential component
of both maternal and neonatal care, to detect
complications so that they can be treated early.
The postnatal check-up should follow national
protocols.
• PNC coverage is an indicator of access and use
of health care after delivery.
• The numerator should include mothers of babies
born at home and coming to health services
within 48 hours.
• Women should receive at least 2 postnatal care
check-ups, to avoid and treat any complication.
Ideally 3 PNC check-ups are required, 3rd after 42
days
Data Source Registers maintained by health workers; Household
surveys
Other Useful
Indicators
• Length of stay after delivery shows whether
mothers and babies are retained long enough to
receive adequate PNC
• Postnatal care at 7 and 28 days are also
measured , but these have minimal impact on
maternal and neonatal mortality

Indicator Manual
13
• Perinatal mortality rate
• SBA delivery rate
Suggested
level of use
National and below
Common
Problems
Actions to
Consider
Indicator Manual
14
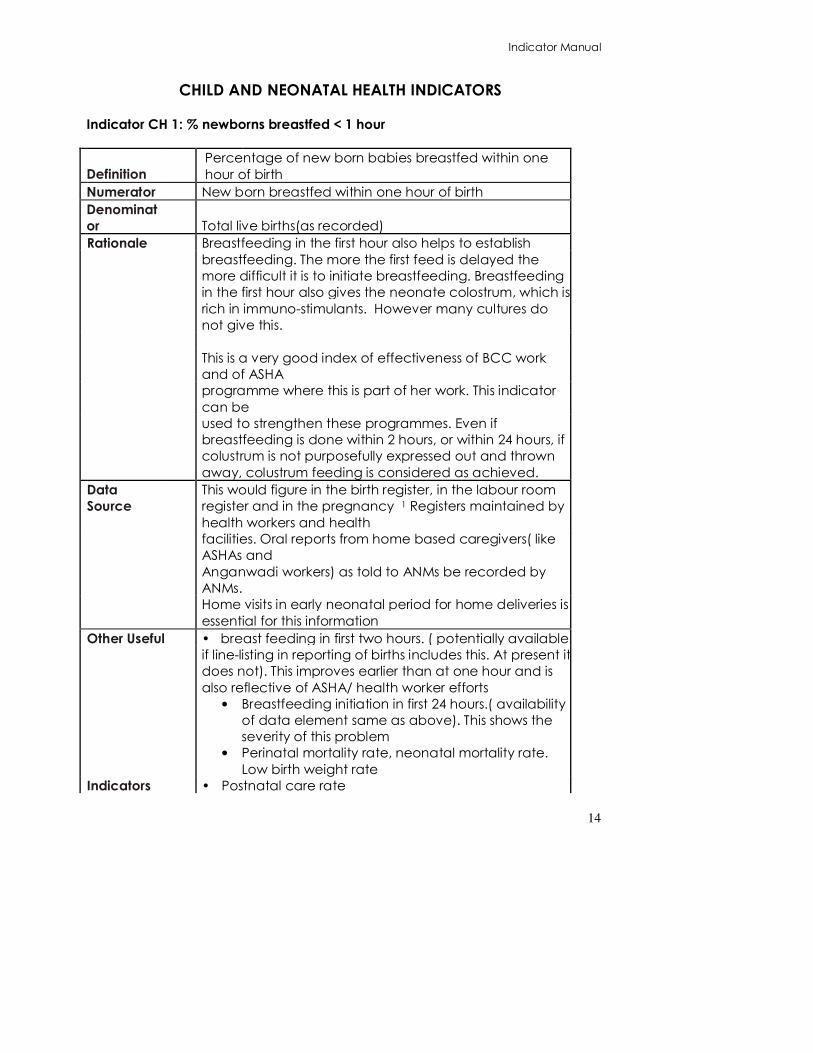
CHILD AND NEONATAL HEALTH INDICATORS
Indicator CH 1: % newborns breastfed < 1 hour
Definition
Percentage of new born babies breastfed within one
hour of birth
Numerator New born breastfed within one hour of birth
Denominat
or Total live births(as recorded)
Rationale
Breastfeeding in the first hour also helps to establish
breastfeeding. The more the first feed is delayed the
more difficult it is to initiate breastfeeding. Breastfeeding
in the first hour also gives the neonate colostrum, which is
rich in immuno-stimulants. However many cultures do
not give this.
This is a very good index of effectiveness of BCC work
and of ASHA
programme where this is part of her work. This indicator
can be
used to strengthen these programmes. Even if
breastfeeding is done within 2 hours, or within 24 hours, if
colustrum is not purposefully expressed out and thrown
away, colustrum feeding is considered as achieved.
Data
Source
This would figure in the birth register, in the labour room
register and in the pregnancy 1 Registers maintained by
health workers and health
facilities. Oral reports from home based caregivers( like
ASHAs and
Anganwadi workers) as told to ANMs be recorded by
ANMs.
Home visits in early neonatal period for home deliveries is
essential for this information
Other Useful
• breast feeding in first two hours. ( potentially available
if line-listing in reporting of births includes this. At present it
does not). This improves earlier than at one hour and is
also reflective of ASHA/ health worker efforts
• Breastfeeding initiation in first 24 hours.( availability
of data element same as above). This shows the
severity of this problem
• Perinatal mortality rate, neonatal mortality rate.
Low birth weight rate
Indicators • Postnatal care rate
Indicator Manual
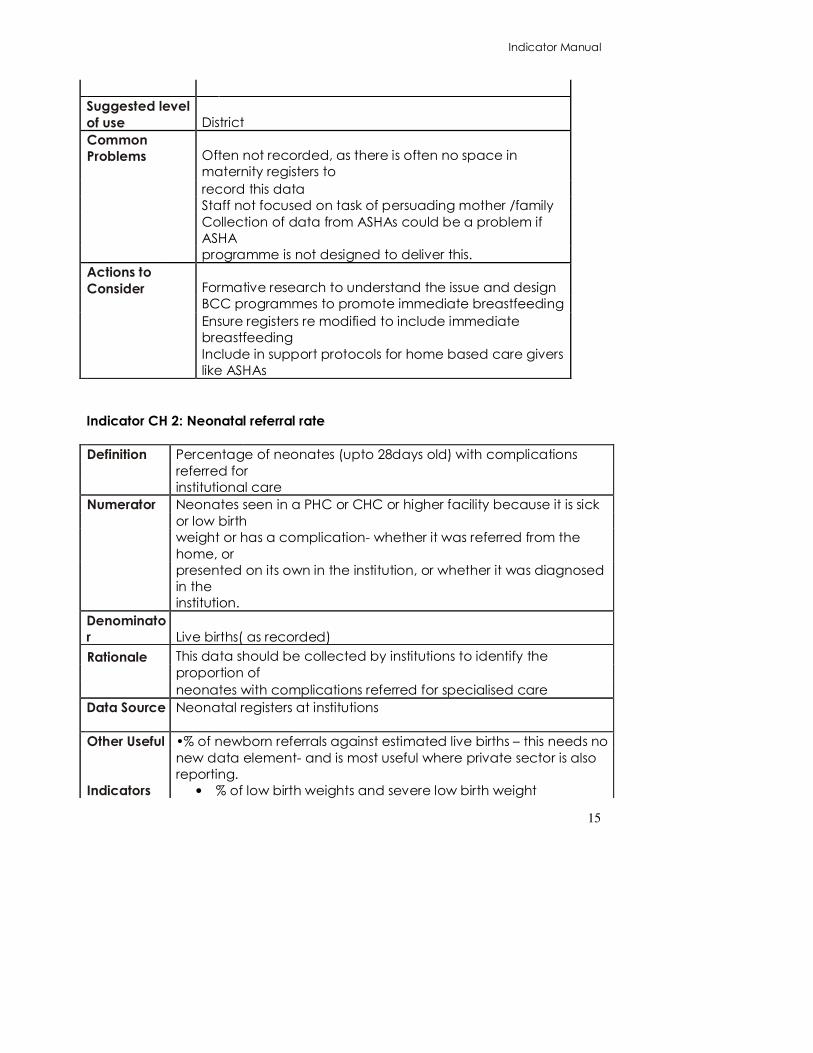
15
Suggested level
of use District
Common
Problems
Often not recorded, as there is often no space in
maternity registers to
record this data
Staff not focused on task of persuading mother /family
Collection of data from ASHAs could be a problem if
ASHA
programme is not designed to deliver this.
Actions to
Consider
Formative research to understand the issue and design
BCC programmes to promote immediate breastfeeding
Ensure registers re modified to include immediate
breastfeeding
Include in support protocols for home based care givers
like ASHAs
Indicator CH 2: Neonatal referral rate
Definition
Percentage of neonates (upto 28days old) with complications
referred for
institutional care
Numerator
Neonates seen in a PHC or CHC or higher facility because it is sick
or low birth
weight or has a complication- whether it was referred from the
home, or
presented on its own in the institution, or whether it was diagnosed
in the
institution.
Denominato
r Live births( as recorded)
Rationale
This data should be collected by institutions to identify the
proportion of
neonates with complications referred for specialised care
Data Source Neonatal registers at institutions
Other Useful
Indicators
•% of newborn referrals against estimated live births – this needs no
new data element- and is most useful where private sector is also
reporting.
• % of low birth weights and severe low birth weight

Indicator Manual
16
• % Newborn referrals successfully treated( if appropriate data
element is added)
Suggested
level
District
of use
Common • The number of families advised a referral is NOT being taken as it
is difficult to estimate how seriously referral advice was taken up by
Problems
family. Therefore only those referral that were received by
institution are measured, even
if some are self-referred.
• Referrals to Private hospitals will not be picked up and this may
account for the majority
• No specific place of recording
in facility registers
• Skills to detect a sick new born lacking amongst health workers
and
hence both referral from below and identification in the
institution could
be poor.
Best calculated with at least
3000 births.
Actions to • If rate is low find out whether it is due to lack of newborn visits
and newborn referrals or due to poor transport or due to poor care
and credibility at the facility. To Build up credibility and quality of
care giving institutions
Consider
• Ensure private sector also
reports
Indicator CH 3: Sex ratio at birth
Definition Number of females born per 1000 males born in a give time period
Numerator Live Births females x 1000
Denominat
or Live Births males
Rationale
Declining sex ratio is an important public health concerns and sex
ratio at births
is one of most precise indicators of this. Note that the usual sex ratio
at birth where there is no active discrimination is about 950 females
per 1000 males( this is due to a slightly greater loss of male fetuses).
Deleted: .

Indicator Manual
17
Due to a slightly greater mortality of male children in next five
years, it becomes an equal or female preponderant ratio for sex
ratio in the 0 to 6 age group. However with optimum care these
slightly increased loss before and after birth may decline. Therefore
figures in this 950 range need to be interpreted with caution. Below
this figure there a gender discrimination factor becomes likely.
Data
Source
Line listing of births maintained by health workers; delivery registers
Other Useful • Sex ratio in 0-5 age group
Indicators
• Sex ratio in population
Suggested
level National and below, particularly district as there is no other source
of data at district level.
of use
Calculate only when you have at least 3,000 births, otherwise
fluctuations will
be too high.
Common • Completeness of birth reporting is an issue
Problems
Actions to • Strengthen implementation of PNDT act
Consider
• Social mobilisation to combat “son preference”
Indicator CH 3A: Recorded Birth rate
Definition • Live births per 1000 population
Numerator:
• All recorded live births in that facility’s service
area/block/district in the last 12 months
Denominator: • Population of that facility’s service area/ block/district
Rationale
• This is the crude indicator of fertility in that population. Also by
comparing the recorded birth rate with the estimated birth rate
or external survey based birth rates one can arrive at a picture
of how many children in that area are being missed out and
this is useful to keep in mind while reading and interpreting all
other child health indicators.
Data Source •
Birth and death register
Maternity registers of Sub-Centres, PHC and CHCs.
• Household surveys

Indicator Manual
18
Other useful • Total fertility rate
indicators •
Normal
Ranges
•
The states birth rate is available from the SRS. The goal is to
reach a birth rate of less than 21 per 1000 population.
Normally it should be 100%
Common
•
Many births that take place in private sector or at home get
missed. Since much of the reporting could be based on
hearsay- there is loss of accuracy. There could be double
counting
Problems
The indicator is an estimate. For many reasons the
denominator could be wrong or the birth rate could be
more or less that expected.
The numerator should be for a full year. This means adding
the livebirths of the last 12 months- and then plotting this
indicator on a graph so as to see trends. Monthly use of this
indicator has little role. Also take a unit which has more than
3000 births in that period ( a number of areas taken
together, or a number of months taken together ) to be able
to cast a meaningful indicator.
•
If the indicator is low, check whether all births are being
recorded or some areas are getting missed out/ poor quality
of recording or whether it is because there has been a
change in the denominator or due to declining fertility.
Actions to •
If indicator is higher than expected and sustained it may be
a major movement of the population in or increase of fertility
rates
consider •
•
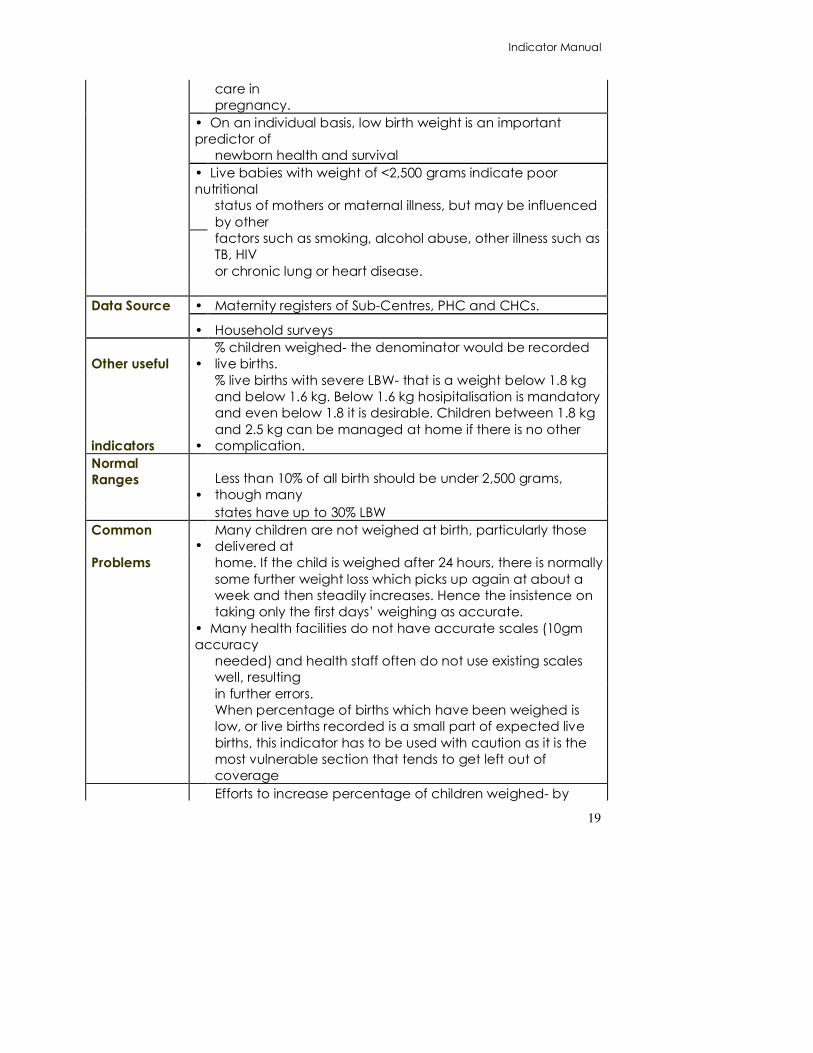
Indicator CH 4: Low birth weight rate
Definition
• Percentage of live born infants with a Birth weight under
2,500 grams
Numerator: • Live births with a birth weight < 2500g.
Denominator: • Live births weighed
Rationale
• At the population level, the low birth weight (LBW) rate is an
indicator
of a multifaceted public-health problem that includes long-
term
maternal malnutrition, ill health, hard work and poor health
Indicator Manual
19
care in
pregnancy.
• On an individual basis, low birth weight is an important
predictor of
newborn health and survival
• Live babies with weight of <2,500 grams indicate poor
nutritional
status of mothers or maternal illness, but may be influenced
by other
factors such as smoking, alcohol abuse, other illness such as
TB, HIV
or chronic lung or heart disease.
Data Source • Maternity registers of Sub-Centres, PHC and CHCs.
• Household surveys
Other useful •
% children weighed- the denominator would be recorded
live births.
indicators •
% live births with severe LBW- that is a weight below 1.8 kg
and below 1.6 kg. Below 1.6 kg hosipitalisation is mandatory
and even below 1.8 it is desirable. Children between 1.8 kg
and 2.5 kg can be managed at home if there is no other
complication.
Normal
Ranges
•
Less than 10% of all birth should be under 2,500 grams,
though many
states have up to 30% LBW
Common •
Many children are not weighed at birth, particularly those
delivered at
Problems
home. If the child is weighed after 24 hours, there is normally
some further weight loss which picks up again at about a
week and then steadily increases. Hence the insistence on
taking only the first days’ weighing as accurate.
• Many health facilities do not have accurate scales (10gm
accuracy
needed) and health staff often do not use existing scales
well, resulting
in further errors.
When percentage of births which have been weighed is
low, or live births recorded is a small part of expected live
births, this indicator has to be used with caution as it is the
most vulnerable section that tends to get left out of
coverage
Efforts to increase percentage of children weighed- by

Indicator Manual
20
studying who is getting missed out and why.
• Improved quality of ANC
Actions to •
BCC regarding nutrition, smoking and drinking during
pregnancy
consider • Attention to adolescent anaemia and malnutrition
• Assistance to secure food entitlements during maternity
Improve institutional new born care and referral
arrangement where severe low birth weight is high
Indicator CH 5: Neonatal mortality rate
Definition
Neonatal mortality rate (NNMR) measures the number of live-born
babies
dying within 28 completed days of life per 1,000 live births.
Numerator Deaths in first 28 days
Denominat
or 1000 live births
Rationale
Neonatal mortality (particularly early mortality) is affected by
quality of care
for the neonate. This is a significant proportion of IMR
Direct Causes are asphyxia , sepsis, hypothermia and neonatal
tetanus. Indirect
causes are low birth weight, prematurity, birth injuries and
congenital anomalies
Data
Source
Line listing in the birth and death register and Institutional records
Registrar of births and deaths- compulsory registration system,
Household surveys
Other Useful • NNMR can be divided into early (0-7 days) and late (8-28 days).
This information is potentially available in the line list- but currently
not being aggregated.
Indicators
• NNMR can be disaggregated by gender
Suggested
level State and district. Calculate only when you have at least 3,000
births, otherwise
of use
fluctuations will be too high.If we are plotting the monthly trend
that either it is for a large area or we are taking the cumulative
total of a a number of months or even a year.
Common
Problems
• Underreporting and misclassifications ( as still births )are
common, particularly for deaths. Cultural reluctance to reporting
early neonatal deaths- which only good training and supervision
Indicator Manual
21
and community dialogue can overcomes
occurring early in life (particularly first hour).
Actions to • Staff training and health facility equipment for a functional
newborn care
Consider
unit
• Appropriate home based neonatal health care providers to be
trained
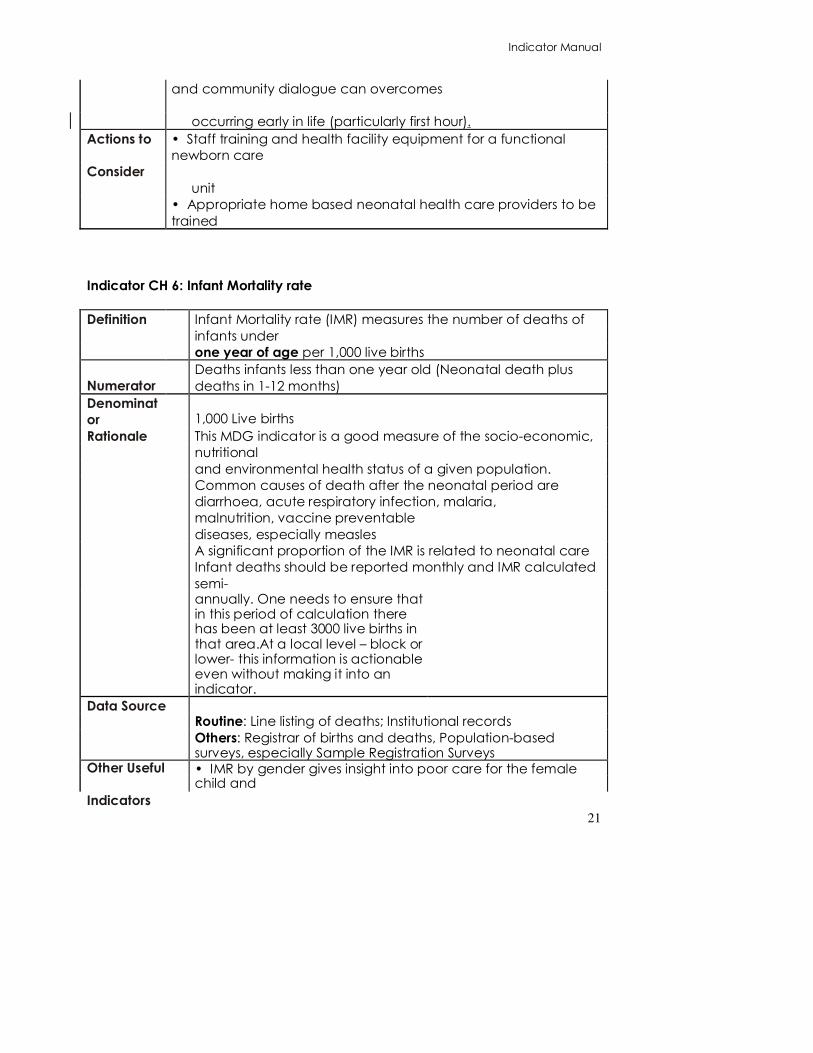
Indicator CH 6: Infant Mortality rate
Definition
Infant Mortality rate (IMR) measures the number of deaths of
infants under
one year of age per 1,000 live births
Numerator
Deaths infants less than one year old (Neonatal death plus
deaths in 1-12 months)
Denominat
or 1,000 Live births
Rationale
This MDG indicator is a good measure of the socio-economic,
nutritional
and environmental health status of a given population.
Common causes of death after the neonatal period are
diarrhoea, acute respiratory infection, malaria,
malnutrition, vaccine preventable
diseases, especially measles
A significant proportion of the IMR is related to neonatal care
Infant deaths should be reported monthly and IMR calculated
semi-
annually. One needs to ensure that in this period of calculation there has been at least 3000 live births in that area.At a local level – block or lower- this information is actionable even without making it into an indicator.
Data Source
Routine: Line listing of deaths; Institutional records
Others: Registrar of births and deaths, Population-based surveys, especially Sample Registration Surveys
Other Useful
Indicators
• IMR by gender gives insight into poor care for the female child and

Indicator Manual
22
female infanticide
• Perinatal and neonatal death rates measure quality of care
at birth
• Disease specific death rates due to diarrhoea, malaria, ARI
etc provide clues for immediate action
• IMR can be disaggregated by social class, residence,
income etc
• Underweight rate under one year measures nutritional status.
This acts as a risk factor, increasing the likelihood of death from
any of the above causes. Suggested level of
National, state and district. Below
district even the data element by
itself provides actionable
information.
use
Common
Problems
• IMR from routine data can be inaccurate because of
unreported deaths
occurring in the home, particularly amongst poor and
disadvantaged
communities not reached by health services. Cultural reluctance to report neonatal deaths.
• Tendency to underreport due to threat of reprimand from
above
Deaths before the first birthday are all included in this.
Actions to
Consider
• Improved notification through line listing by health workers,
• Community notification of deaths- to VHSCs, PRIs, NGOs etc - a form of community monitoring to uncover unreported deaths.
• Ensure that truthful reporting of higher deaths that expected is not met with reprimands but with assistance.
Indicator CH 7: Under 5 mortality rate
Definition Under-five mortality rate measures the number of children who

Indicator Manual
23
die before their
fifth birthday per 1000 children under five years
Numerator Deaths Neonatal + Deaths infant + Deaths 1-5 years
Denominator 1,000 children under five years
Rationale
Under-five mortality rate is a general indicator of the level of
child health,
It measures more the socio-economic, environmental and
nutrition status of
children, rather than direct health care delivery.
Data Source Line listing of deaths at Sub Centre; Institutional records
Vital registration- registrar of births and deaths; Population census; Population-based surveys, such as DHS.
Other Useful • U5MR can be disaggregated by gender, social class,
residence, income etc
Indicators • See infant mortality rate indicators
Suggested
level of National and below. Calculate only when you have at least
3,000 births,
use
otherwise fluctuations will be too
high.
Common
Problems
• Poor reporting of child deaths, particularly in hard-to-reach
and poor
communities
Actions to
Consider
• Improved notification through line listing by health workers,
• Community notification of
deaths- improve recording of
unreported deaths and increases
community action to prevent
deaths
•
Improved quality of care for children through health workers
at home
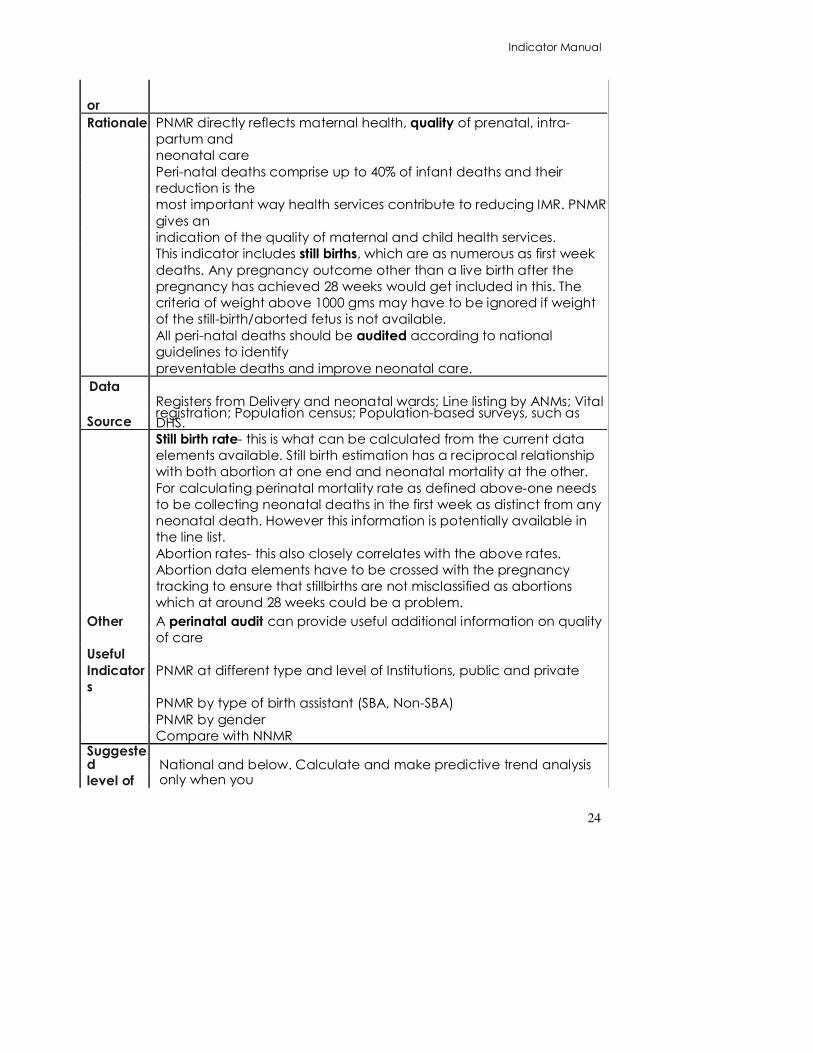
Definition Peri-natal deaths comprise still births (gestation over 228 weeks / >1000 grams
weight) plus early neonatal deaths (infants dying within 7 days). Numerator Deaths Peri-natal (still births plus early neonatal in first week)
Denomin
at 1000 live Births.
Indicator Manual
24
or
Rationale
PNMR directly reflects maternal health, quality of prenatal, intra-
partum and
neonatal care
Peri-natal deaths comprise up to 40% of infant deaths and their
reduction is the
most important way health services contribute to reducing IMR. PNMR
gives an
indication of the quality of maternal and child health services.
This indicator includes still births, which are as numerous as first week
deaths. Any pregnancy outcome other than a live birth after the
pregnancy has achieved 28 weeks would get included in this. The
criteria of weight above 1000 gms may have to be ignored if weight
of the still-birth/aborted fetus is not available.
All peri-natal deaths should be audited according to national
guidelines to identify
preventable deaths and improve neonatal care.
Data Registers from Delivery and neonatal wards; Line listing by ANMs; Vital
Source registration; Population census; Population-based surveys, such as DHS.
Still birth rate- this is what can be calculated from the current data
elements available. Still birth estimation has a reciprocal relationship
with both abortion at one end and neonatal mortality at the other.
For calculating perinatal mortality rate as defined above-one needs
to be collecting neonatal deaths in the first week as distinct from any
neonatal death. However this information is potentially available in
the line list.
Abortion rates- this also closely correlates with the above rates.
Abortion data elements have to be crossed with the pregnancy
tracking to ensure that stillbirths are not misclassified as abortions
which at around 28 weeks could be a problem.
Other A perinatal audit can provide useful additional information on quality
of care
Useful
PNMR at different type and level of Institutions, public and private Indicator
s
PNMR by type of birth assistant (SBA, Non-SBA)
PNMR by gender
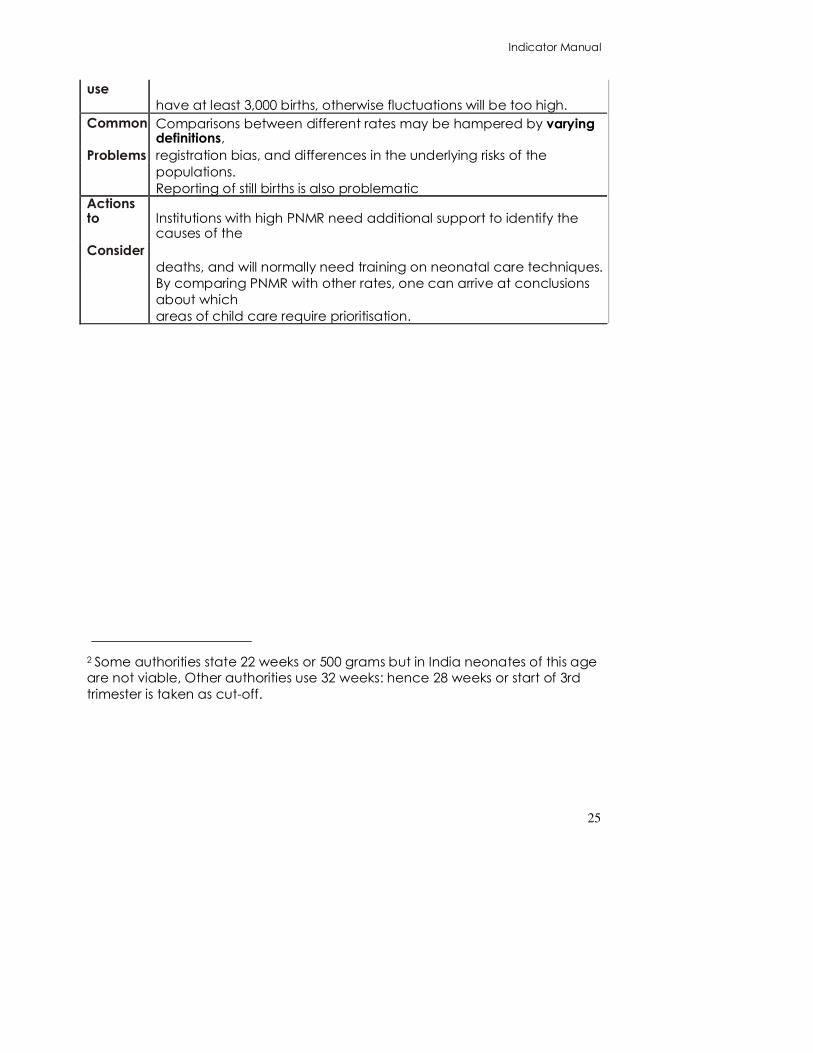
Compare with NNMR Suggested
level of National and below. Calculate and make predictive trend analysis only when you
Indicator Manual
25
use
have at least 3,000 births, otherwise fluctuations will be too high.
Common Comparisons between different rates may be hampered by varying definitions,
Problems
registration bias, and differences in the underlying risks of the
populations.
Reporting of still births is also problematic Actions to Institutions with high PNMR need additional support to identify the
causes of the
Consider
deaths, and will normally need training on neonatal care techniques.
By comparing PNMR with other rates, one can arrive at conclusions
about which
areas of child care require prioritisation. 2 Some authorities state 22 weeks or 500 grams but in India neonates of this age are not viable, Other authorities use 32 weeks: hence 28 weeks or start of 3rd
trimester is taken as cut-off.
Indicator Manual
26
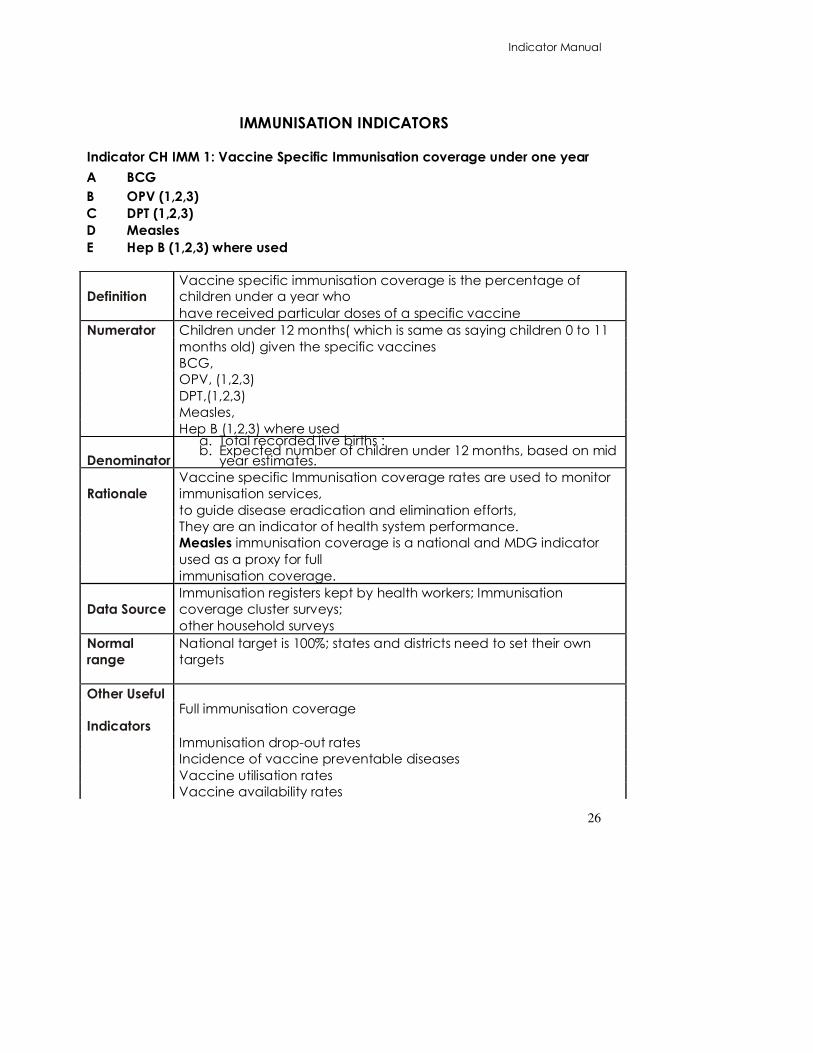
IMMUNISATION INDICATORS
Indicator CH IMM 1: Vaccine Specific Immunisation coverage under one year A BCG B OPV (1,2,3) C DPT (1,2,3) D Measles E Hep B (1,2,3) where used
Definition Vaccine specific immunisation coverage is the percentage of children under a year who
have received particular doses of a specific vaccine
Numerator
Children under 12 months( which is same as saying children 0 to 11
months old) given the specific vaccines
BCG,
OPV, (1,2,3)
DPT,(1,2,3)
Measles,
Hep B (1,2,3) where used
Denominator
a. Total recorded live births : b. Expected number of children under 12 months, based on mid
year estimates.
Rationale
Vaccine specific Immunisation coverage rates are used to monitor
immunisation services,
to guide disease eradication and elimination efforts,
They are an indicator of health system performance.
Measles immunisation coverage is a national and MDG indicator
used as a proxy for full
immunisation coverage.
Data Source
Immunisation registers kept by health workers; Immunisation
coverage cluster surveys;
other household surveys
Normal
range
National target is 100%; states and districts need to set their own
targets
Other Useful Full immunisation coverage
Indicators
Immunisation drop-out rates
Incidence of vaccine preventable diseases
Vaccine utilisation rates
Vaccine availability rates

Indicator Manual
27
Cold Chain function indicators Suggested level
National for Measles; State and district for others
of use
Common No vaccinations given to children over one year should be included in this
Problems Indicator.
Actions to Low immunisation coverage needs urgent action by health services
and
Consider
communities. It may indicate poor planning, supply side problems
e.g. out of
stock or need for vaccine transport
Improve local planning and community involvement
Rates over 100% mean denominator problems or double counting
Indicator CH IMM2: Full Immunisation coverage
Definition
Full Immunisation coverage is the percentage of one-year-old
children who have received
all required vaccines.
Numerator
Number of children 9 to 12 months who completed their
immunisation schedule (BCG, OPV3 and DPT3 and measles) in the
past year
Number of children 12 to 23 months who had already complete immunization or completed their immunization schedule during the past year
Denominator
Expected number of 0 to 12 months children based on mid year estimates. Actual number of 0 to 12 months children based on live births during this year Expected number of 12 to 23 months children based on mid-year estimates Actual number of 12 to 23 months children based on household survey done at year beginning.
Rationale
Full Immunisation coverage is the “pinnacle” indicator for
immunisation coverage and
means that the child should be fully protected against the six
vaccine preventable
diseases, and is a valuable way to reduce
infant mortality.
Data Source
Immunisation registers kept by health workers ;
There needs to be a separate column in this
register where the age of child in months when
given the last immunization needed for full
Indicator Manual
28
immunization status is recorded
EPI cluster surveys; Other household surveys
Other Useful • Full immunisation coverage by gender – male and female
Indicators
•
Vaccine-specific vaccination coverage
rates
• Full immunisation coverage rates from cluster
surveys
• Vaccine preventable disease incidence rates
• Vaccine utilisation and availability rates
• Cold chain function indicators Suggested level
National, State, District, Block
of use
Common • This data is hard to keep accurately routinely with current tools
Problems
• Routine data should be cross-checked by EPI cluster surveys (see
WHO mid level
manager cluster survey manual) and other household surveys such as DHS. Surveys usually use a 12 to 23 month denominator.
Actions to • Children need an immunisation card to track that all doses have been given. The register also needs provision for child tracking.
Consider
• Vaccine register should show children who completed
immunisation
schedule in a separate column
• by comparing full and individual immunisation coverage, catch
up
campaigns to be instituted to provide individual vaccines in specific areas
Indicator CH IMM 3: Immunisation adverse reactions
Definition
An adverse immunisation reaction is an unwanted or harmful
reaction
experienced following administration of a vaccine
It can be described as a medical event that takes place after an
immunisation
that causes concern and is believed to be caused by
immunisation
(Immunisation handbook for health workers GoI 2007)
Numerator
Adverse reactions –
A) Abscesses
B) Deaths
Indicator Manual
29
C) Others
Denominator Total number of immunisations given
Rationale
Adverse effects are a sensitive indicator of quality of immunisation
Adverse reactions can be grouped into reactions inherent to
immunisation
(pain, swelling, redness or general reactions), due to faulty
techniques,
hypersensitivity, neurological involvement, provocative reactions
Under RIMS, three kinds of reaction are identified – Abscess,
Deaths and
Others e.g. allergy, anaphylaxis, hypotensive /hypo responsive
episodes, BCG
lymphadenitis, etc
Data Source
Immunisation registers, facility data collection forms, IDSP death
reports
Other Useful • Drop out rates show perceived quality by the mother Suggested level
State and below
of use
Common • Non-reporting;
Problems
• “Others” is a large category
• Death of the child upto 6 days after the immunization is to
be reported- unless it is due to accident. Many of these
deaths may have other causes- but that is to be validated
by medical officers separately – these deaths are only
presumptively vaccine related- the point is to have a high
index of suspicion so as not to miss cases.
• Delayed reactions are difficult to collect
Actions to
•
Investigate all adverse reactions to identify the cause and
advise peripheral workers to take appropriate action for
abscesses and other complications. Check on supply .For
deaths it needs to be reported to state and national level and
separate report filed with vaccine batch details etc.
Consider
Indicator CH IMM 4: % of planned immunisation sessions held
Definition Percentage of total planned immunisation sessions held
Indicator Manual
30
Numerator Number of immunisation sessions held
Denominator Total number of immunisation sessions planned
Rationale
For a given population with a known number of health
facilities and staff and outreach points( eg anganwadi
centers)
the number of immunisation sessions to cover the population
is pre-
determined. It is important to see what percentage of this
needed
coverage is achieved.
Immunisation needs careful planning and this indicator
measures
implementation of the plan. Poor planning leads to poor
implementation
of immunisation
Lack of transport is a common reason for cancellation of
sessions; Non availability of the ANM due to sickness or other personal causes, lack of vaccine supplies etc are also other causes. Need to ensure adequate transport for vaccines and transport for the ANM where this is the constraint.
Data Source
Registers maintained by health workers and health facilities
Denominator from district immunisation office Suggested level of
District, Block
use
Common • Reliability of reporting of immunisation sessions held is low because
Problems
worker is directly accountable for the failure.
• Detailed micro planning exercise often not carried out. The
number of sessions planned itself may be faulty.
Actions to • Strengthen planning process and implementation through improved
Consider
supervision
• Involve communities in planning of immunisations at sites
and time
convenient to them and reporting sessions NOT held Indicator CH IMM 5: Vitamin A coverage rate Definition Percentage of children who have received all required vitamin A
Indicator Manual
31
doses. (One
dose for a child under one and five doses for a child under three years)
Numerator
Children who received Vitamin A
A) 1 dose under one year
B) 5 doses under three years
C) 9 doses under 5 years
Denominator Expected number of children based on mid year estimates.
Rationale
• Vitamin A supplements given between six and 72 months is
stated to reduce
mortality by 23%, where vitamin A deficiency exists.
• Vitamin A supplements as part of measles case management
can reduce the case
fatality rate by more than 50%.
Data Source
Immunisation register and Reports of Vitamin A by service
providers
Other Useful • Measles case fatality rates
Indicators
• Vaccine-specific coverage rates to compare to vitamin A
coverage rates Suggested level
State and District
of use
Common • Difficult to report multiple doses at different ages
Problems
No age estimates of 3 year old children available
Unless children have a vitamin A/immunization tracking card which goes upto 5 years- it would be difficult to estimate who has achieved the 5th, dose, 9th dose etc. It is not advised to make bulky registers that list all children upto 5 years and track them all along for each dose.
Actions to • Identify areas with low coverage and ensure supplies and promotion
Consider
Activity. Indicator CH IMM 6: Immunisation drop out rate
Definition
Comparison of the number of children who start receiving
immunisation and
the number who do not receive later doses for full immunisation
Numerator Number of children starting particular dose of antigen MINUS

Indicator Manual
32
number of
children receiving later dose of antigen
Denominator Number of children starting particular dose of antigen
Rationale
This is an indicator of quality of immunisation services and allows
a view of the
trends in coverage for specific vaccines. Useful drop out rates
are
A) BCG to DPT3
B) BCG to Measles
C) DPT1 to DPT3
D) DPT1 to Measles
This is a cohort sample and periodicity should be (semi) annual,
rather than
monthly
Data Source
Facility routine data collection forms; Immunisation Registers;
Other Useful • Vaccine specific and full immunisation coverage rates
Indicators •Vaccine availability
• Vaccine preventable disease incidence
Suggested State and district
level of use
Common • A high drop out rate means that mothers have no faith in the immunisation
Problems
• A negative drop out rate can occur if there is a stock out of
the “early”
vaccines and good supply of the late vaccine
Actions to • Ensure best possible quality of immunisation
Consider
• Ensure child tracking with immunisation card
• BCC to mothers on importance of finishing immunisation
course
•Ensure constant availability of vaccine
FAMILY PLANNING INDICATORS
Indicator FP1: Couple Year Protection Rate
Definition Percentage of eligible couples in the community protected by
"modern" family planning methods for one year .
Numerator: Number of couples protected by each family planning method
Indicator Manual
33
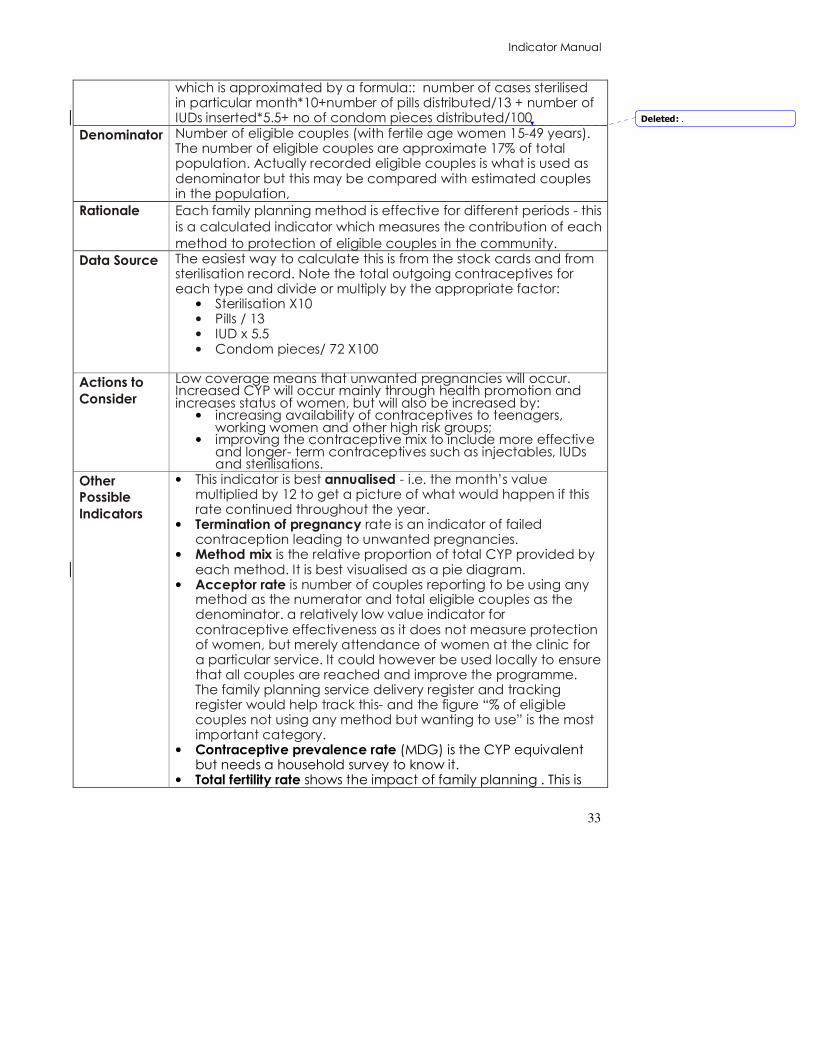
which is approximated by a formula:: number of cases sterilised in particular month*10+number of pills distributed/13 + number of IUDs inserted*5.5+ no of condom pieces distributed/100
Denominator Number of eligible couples (with fertile age women 15-49 years). The number of eligible couples are approximate 17% of total population. Actually recorded eligible couples is what is used as denominator but this may be compared with estimated couples in the population,
Rationale Each family planning method is effective for different periods - this
is a calculated indicator which measures the contribution of each
method to protection of eligible couples in the community.
Data Source The easiest way to calculate this is from the stock cards and from sterilisation record. Note the total outgoing contraceptives for each type and divide or multiply by the appropriate factor:
• Sterilisation X10 • Pills / 13 • IUD x 5.5 • Condom pieces/ 72 X100
Actions to
Consider
Low coverage means that unwanted pregnancies will occur. Increased CYP will occur mainly through health promotion and increases status of women, but will also be increased by:
• increasing availability of contraceptives to teenagers, working women and other high risk groups;
• improving the contraceptive mix to include more effective and longer- term contraceptives such as injectables, IUDs and sterilisations.
Other
Possible
Indicators
• This indicator is best annualised - i.e. the month’s value multiplied by 12 to get a picture of what would happen if this rate continued throughout the year.
• Termination of pregnancy rate is an indicator of failed contraception leading to unwanted pregnancies.
• Method mix is the relative proportion of total CYP provided by each method. It is best visualised as a pie diagram.
• Acceptor rate is number of couples reporting to be using any method as the numerator and total eligible couples as the denominator. a relatively low value indicator for contraceptive effectiveness as it does not measure protection of women, but merely attendance of women at the clinic for a particular service. It could however be used locally to ensure that all couples are reached and improve the programme. The family planning service delivery register and tracking register would help track this- and the figure “% of eligible couples not using any method but wanting to use” is the most important category.
• Contraceptive prevalence rate (MDG) is the CYP equivalent but needs a household survey to know it.
• Total fertility rate shows the impact of family planning . This is
Deleted: .

Indicator Manual
34
got from NHFS and SRS data- but would only have state figures.
• Birth rates- • % of births which were third and above; % of second or further
births which had less than three years gap with earlier birth, % of births in women less than 19 years of age.( registers record the data elements needed- but this is not reported up currently)
Suggested
level of use
National
Common
problems
This is a complicated indicator, most easily calculated using a
computer
Actions to
consider
Indicator FP 2: Family Planning Coverage rate by method
Definition The coverage contribution of each contraceptive method to
the overall family planning program
Numerator Total number of units of each type of contraceptive
distributed
A) Oral Contraceptive cycles
B) Condoms
C) IUD insertion D) Centchroman (weekly) pills
E) Emergency Contraceptive pills
Denominator Eligible couples
Rationale The indicator provides a profile of the relative level of use of
different contraceptive methods. This also suggests that the
population has access to a range of different contraceptive
methods
Data Source Family Planning Registers maintained by health workers and
health facilities; Household surveys
Other Useful
Indicators
Method Mix
Suggested
level of use
District
Common
Problems
Exact number of OCPs or condoms distributed- are difficult to
estimate since these are usually given out by depot holders
and ANMs only know the stock refill they provide to the
depots. Also distribution does not mean use.
Actions to
Consider

Indicator Manual
35
Indicator Manual
36
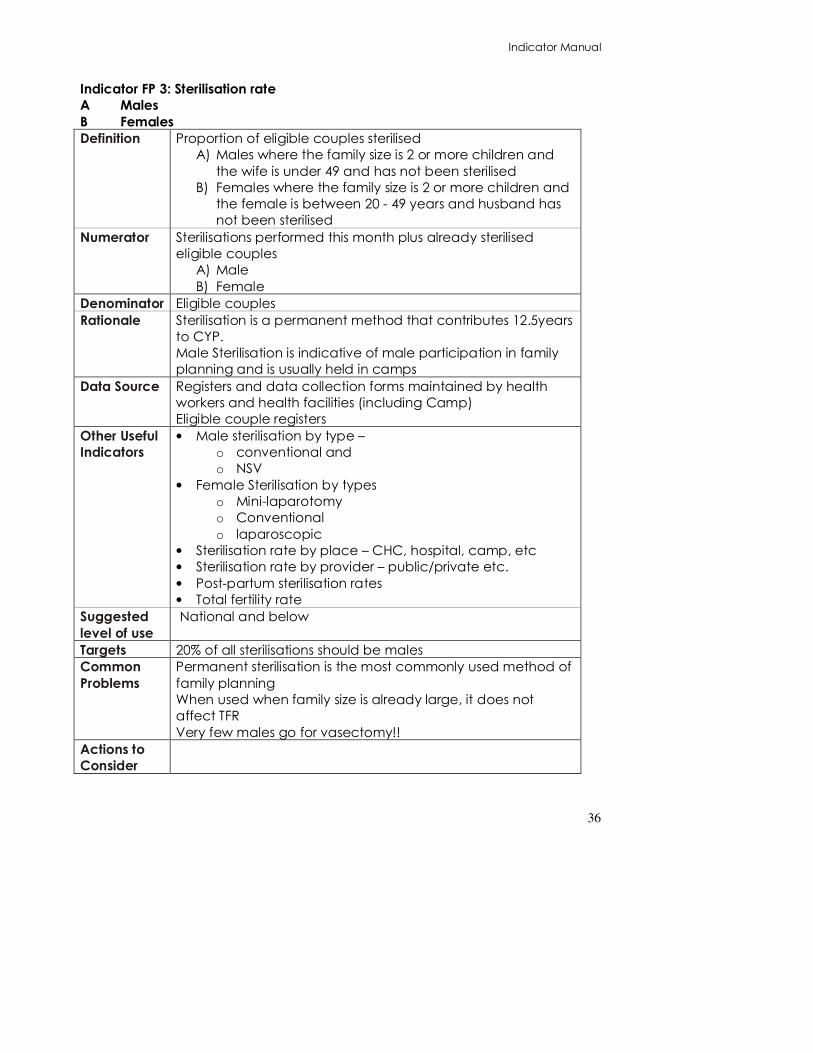
Indicator FP 3: Sterilisation rate
A Males
B Females
Definition Proportion of eligible couples sterilised
A) Males where the family size is 2 or more children and
the wife is under 49 and has not been sterilised
B) Females where the family size is 2 or more children and
the female is between 20 - 49 years and husband has
not been sterilised
Numerator Sterilisations performed this month plus already sterilised
eligible couples
A) Male
B) Female
Denominator Eligible couples
Rationale Sterilisation is a permanent method that contributes 12.5years
to CYP.
Male Sterilisation is indicative of male participation in family
planning and is usually held in camps
Data Source Registers and data collection forms maintained by health
workers and health facilities (including Camp)
Eligible couple registers
Other Useful
Indicators
• Male sterilisation by type –
o conventional and
o NSV
• Female Sterilisation by types
o Mini-laparotomy
o Conventional
o laparoscopic
• Sterilisation rate by place – CHC, hospital, camp, etc
• Sterilisation rate by provider – public/private etc.
• Post-partum sterilisation rates
• Total fertility rate
Suggested
level of use
National and below
Targets 20% of all sterilisations should be males
Common
Problems
Permanent sterilisation is the most commonly used method of
family planning
When used when family size is already large, it does not
affect TFR
Very few males go for vasectomy!!
Actions to
Consider

Indicator Manual
37


![Trends in Maternal Health Indicators in Sierra Leone, 2008-2013 [FA97] · DHS Further Analysis Reports No. 97 Trends in Maternal Health Indicators in Sierra Leone, 2008-2013 Shireen](https://img.pdfslide.us/doc/110x75/60c497182c4bca4edf79c63e/trends-in-maternal-health-indicators-in-sierra-leone-2008-2013-fa97-dhs-further.jpg)