Embed Size (px)
Citation preview
MATERNAL BODY COMPOSITION LATE IN PREGNANCY
AND INFANT BODY COMPOSITION AT BIRTH
By
Shengqi Li,
M.S., University of Kansas Medical Center, 2010
Submitted to the graduate degree program in Medical
Nutrition Science and the Graduate Faculty of the
University of Kansas Medical Center in partial fulfill of
the requirement for the degree of Doctor of Philosophy.
Co-chairperson: Holly R. Hull, PhD
Co-chairperson: Susan E. Carlson, PhD
Debra K. Sullivan, PhD, RD
Kathleen M. Gustafson, PhD
Christie A. Befort, PhD
Jo Wick, PhD
Date defended: 10/25/13
II
The Dissertation Committee for Shengqi Li certifies that
this is the approved version of the following dissertation:
MATERNAL BODY COMPOSITION LATE IN PREGNANCY
AND INFANT BODY COMPOSITION AT BIRTH
Co-chairperson: Holly R. Hull, PhD
Co-chairperson: Susan E. Carlson, PhD
Date approved: 11/7/13
III
ABSTRACT
Background: Fat mass (FM) is significantly higher in neonates born to overweight and obese
women, while no difference is found in fat free mass (FFM). Higher gestational weight gain
(GWG) is also related to a greater neonatal birth weight and FM gain. However, no study has
reported the relationship between maternal body composition during gestation and neonatal body
composition at birth.
Objectives: The primary aim of this study was to evaluate the relationship between maternal
body composition late in pregnancy and neonatal body composition at birth. The secondary aim
of this study was to investigate the association between maternal trimester-specific GWG and
neonatal body composition at birth.
Methods: Healthy pregnant women with a pre-pregnancy body mass index (BMI) between 18.5
to 39.99 kg/m2 were recruited. Maternal body composition (percentage body fat (% fat), FM,
FFM, and total body water (TBW)) was measured using the four-compartment model during 34
to 39 weeks gestation and infant body composition (% fat, FM, and FFM) was measured using
air-displacement plethysmography (ADP) within 72h after birth. Maternal GWG during the 1st (0
to 13 weeks), 2nd
(14 to 28 weeks) and 3rd
(29 weeks to delivery) trimesters were calculated using
extracted body weight from medical records minus their self-reported pre-pregnancy weight.
Multiple linear regression models were used to determine the relationship between maternal
factors and neonatal body composition. Neonatal % fat, FM, and FFM were used as dependent
variables. Maternal % fat, FM, FFM and TBW were used as independent variables for the
primary aim and the 1st, 2
nd, and 3
rd trimester gestational weight gains were used as independent
variables for the secondary aim. Maternal age, neonatal age at test, gender and gestational age
were controlled in the models for the primary aim and maternal pre-pregnancy BMI, neonatal age
at test, gender and gestational age were controlled in the models for the secondary aim.
IV
Results: Forty women completed visits for the primary aim and forty-five women completed
visits for the secondary aim. Maternal body FFM and TBW were related to neonatal birth weight
(r2 = 0.280, p = 0.011; r
2 = 0.330, p = 0.007, respectively) and FFM (r
2 = 0.521, p = 0.011; r
2 =
0.519, p = 0.011, respectively). A trend of significance was found between maternal FM and
neonatal birth weight (r2 = 0.224; p = 0.053) and FM (r
2 = 0.052; p = 0.085). The relationship
between trimester-specific GWG and neonatal body composition varied by maternal pre-
pregnancy BMI category.
Conclusions: Maternal body composition was related to neonatal birth weight, while maternal
FFM and TBW were related to neonatal FFM but not FM at birth. The relationship between
maternal GWG and neonatal body fat at birth was dependent on maternal pre-pregnancy BMI.

V
ACKNOWLEDGEMENTS
I would like to first and foremost thank Dr. Holly Hull for her continual support and
advice through the 3 year study. I am grateful for everything you have taught me and every
opportunity you have given to me. These 3 years have been incredible enjoyable and a wonderful
learning experience.
I would like to thank the rest of my committee, Dr. Susan Carlson, Dr. Debra Sullivan,
Dr. Kathleen Gustafson, Dr. Christie Befort and Dr. Jo Wick, for their time and expertise. I would
especially like to thank Dr. Susan Carlson for serving as my co-mentor and Dr. Jo Wick for her
statistical assistance.
I would like to thank the Department of Dietetics and Nutrition and faculty as well as the
students for their support and encouragement. I must especially thank Marlies Ozias for her help
and support by working together on this dissertation project. Her support was invaluable and I
greatly appreciate it. This project would not be where it is without her effort.
This research would not be possible without the support of all individuals who
participated in this project. I thank them for taking the time to participate and having an interest in
this project.
I must also thank my parents, who instilled me a love of learning. Despite being thousand
miles away, inspiration and continual encouragement was always given from them. I also would
like to thank the rest of my family and friends for their support and encouragement during all
these years. This would never been accomplished without your support.
VI
LIST OF ABBREVIATIONS
% fat: percentage body fat
ADP: air-displacement plethysmography
AGA: appropriate for gestational age
BIA: bioelectrical impedance analysis
BMI: body mass index
DXA: dual-energy x-ray absorptiometry
FFM: fat free mass
FM: fat mass
GDM: gestational diabetes mellitus
GWG: gestational weight gain
IOM: Institute of Medicine
LGA: lager for gestational age
MRI: magnetic resonance imaging
NO: nitric oxide
OR: odds ratio
RR: relative risk
SDS: standard deviation score
SGA: small for gestational age
TBK: total body potassium
TBW: total body water
TGV: thoracic gas volume
TOBEC: total body electrical conductivity
VII
TABLE OF CONTENTS ACCEPTANCE PAGE ................................................................................................................. II
ABSTRACT ................................................................................................................................. III
ACKNOWLEDGEMENT ............................................................................................................ V
LIST OF ABBREVIATIONS ..................................................................................................... VI
TABLE OF CONTENTS ........................................................................................................... VII
LIST OF FIGURES ..................................................................................................................... IX
LIST OF TABLES ......................................................................................................................... X
CHAPTER 1 INTRODUCTION................................................................................................... 1
1.1. Maternal obesity and obesity development in offspring ........................................................ 2
1.2. Metabolic and hormonal occurrences and disturbances during pregnancy ............................ 3
1.3. The “fetal origins of adult disease” hypothesis ..................................................................... 4
1.3.1. Programming of vascular disease ................................................................................ 5
1.3.2. Programming of obesity .............................................................................................. 6
1.4. Birth weight as a marker of disease ....................................................................................... 7
1.4.1. Low birth weight and later disease .............................................................................. 7
1.4.2. High birth weight and development of diseases .......................................................... 9
1.5. Birth weight and later BMI .................................................................................................. 11
1.5.1. Birth weight and later BMI in adulthood ................................................................... 11
1.5.2. Birth weight and later BMI in childhood ................................................................... 13
1.6. Assessment of neonatal body composition .......................................................................... 16
1.7. Assessment of maternal body composition .......................................................................... 17
1.7.1. Total body water ........................................................................................................ 18
1.7.2. Body density .............................................................................................................. 19
1.8. Maternal BMI and infant birth weight ................................................................................. 20
1.9. Maternal BMI and infant body composition ........................................................................ 23
1.10. Maternal GWG and infant birth weight............................................................................. 25
1.11. Maternal GWG and infant body composition ................................................................... 29
1.12. Maternal body composition and infant birth weight ......................................................... 31
1.13. Maternal body composition and infant body composition ................................................ 32
CHAPTER 2 METHODS ............................................................................................................ 35
2.1. Study Population ................................................................................................................ 36
2.1.1. Inclusion/exclusion criteria .......................................................................................... 36
2.1.2. Subject recruitment ...................................................................................................... 36
2.2. Research design .................................................................................................................. 37
2.2.1. Study visits ................................................................................................................... 37
2.2.2. Measurement of maternal body composition ............................................................... 37
2.2.2.1. Body volume .......................................................................................................... 37
2.2.2.2. Total body water .................................................................................................... 38
2.2.2.3. Bone mineral mass ................................................................................................. 38
2.2.3. Measurement of maternal anthropometry .................................................................... 39
2.2.4. Neonatal adiposity and anthropometry ......................................................................... 39
2.2.5. Measurement of GWG ................................................................................................. 40
2.3. Statistical analyses .............................................................................................................. 40
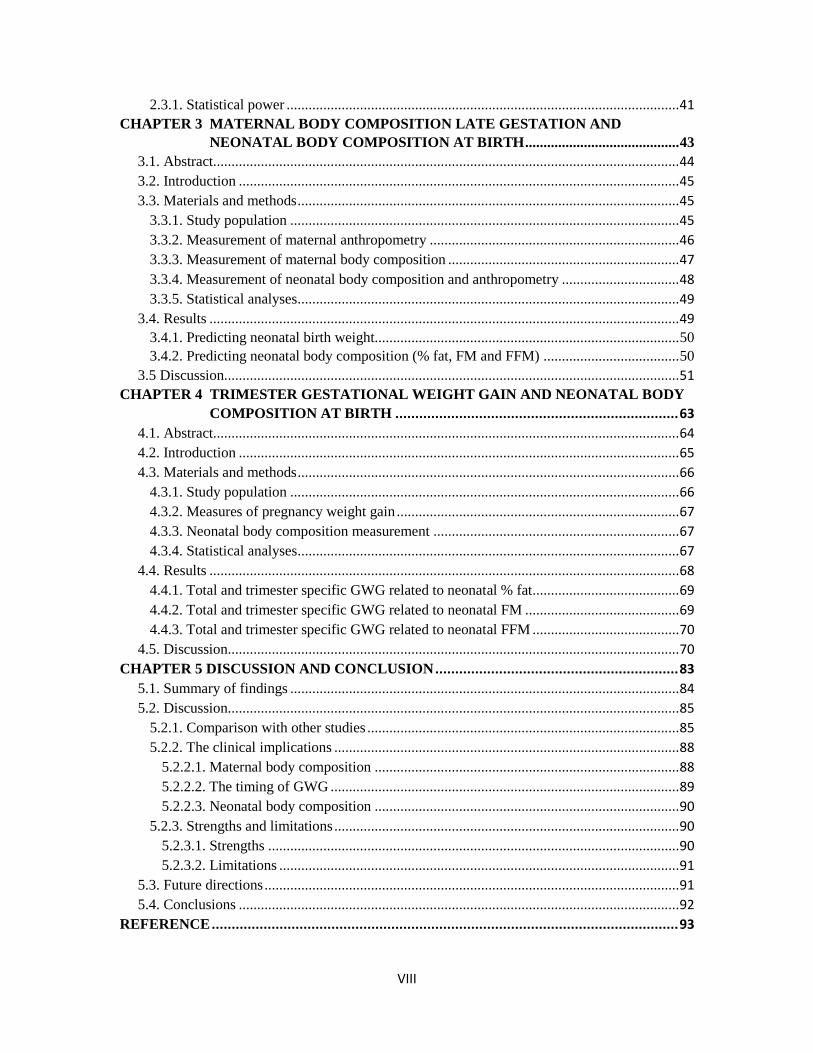
VIII
2.3.1. Statistical power ........................................................................................................... 41
CHAPTER 3 MATERNAL BODY COMPOSITION LATE GESTATION AND
NEONATAL BODY COMPOSITION AT BIRTH .......................................... 43
3.1. Abstract............................................................................................................................... 44
3.2. Introduction ........................................................................................................................ 45
3.3. Materials and methods ........................................................................................................ 45
3.3.1. Study population .......................................................................................................... 45
3.3.2. Measurement of maternal anthropometry .................................................................... 46
3.3.3. Measurement of maternal body composition ............................................................... 47
3.3.4. Measurement of neonatal body composition and anthropometry ................................ 48
3.3.5. Statistical analyses ........................................................................................................ 49
3.4. Results ................................................................................................................................ 49
3.4.1. Predicting neonatal birth weight................................................................................... 50
3.4.2. Predicting neonatal body composition (% fat, FM and FFM) ..................................... 50
3.5 Discussion............................................................................................................................ 51
CHAPTER 4 TRIMESTER GESTATIONAL WEIGHT GAIN AND NEONATAL BODY
COMPOSITION AT BIRTH ....................................................................... 63
4.1. Abstract............................................................................................................................... 64
4.2. Introduction ........................................................................................................................ 65
4.3. Materials and methods ........................................................................................................ 66
4.3.1. Study population .......................................................................................................... 66
4.3.2. Measures of pregnancy weight gain ............................................................................. 67
4.3.3. Neonatal body composition measurement ................................................................... 67
4.3.4. Statistical analyses ........................................................................................................ 67
4.4. Results ................................................................................................................................ 68
4.4.1. Total and trimester specific GWG related to neonatal % fat ........................................ 69
4.4.2. Total and trimester specific GWG related to neonatal FM .......................................... 69
4.4.3. Total and trimester specific GWG related to neonatal FFM ........................................ 70
4.5. Discussion........................................................................................................................... 70
CHAPTER 5 DISCUSSION AND CONCLUSION ............................................................. 83
5.1. Summary of findings .......................................................................................................... 84
5.2. Discussion........................................................................................................................... 85
5.2.1. Comparison with other studies ..................................................................................... 85
5.2.2. The clinical implications .............................................................................................. 88
5.2.2.1. Maternal body composition ................................................................................... 88
5.2.2.2. The timing of GWG ............................................................................................... 89
5.2.2.3. Neonatal body composition ................................................................................... 90
5.2.3. Strengths and limitations .............................................................................................. 90
5.2.3.1. Strengths ................................................................................................................ 90
5.2.3.2. Limitations ............................................................................................................. 91
5.3. Future directions ................................................................................................................. 91
5.4. Conclusions ........................................................................................................................ 92
REFERENCE ..................................................................................................................... 93
IX
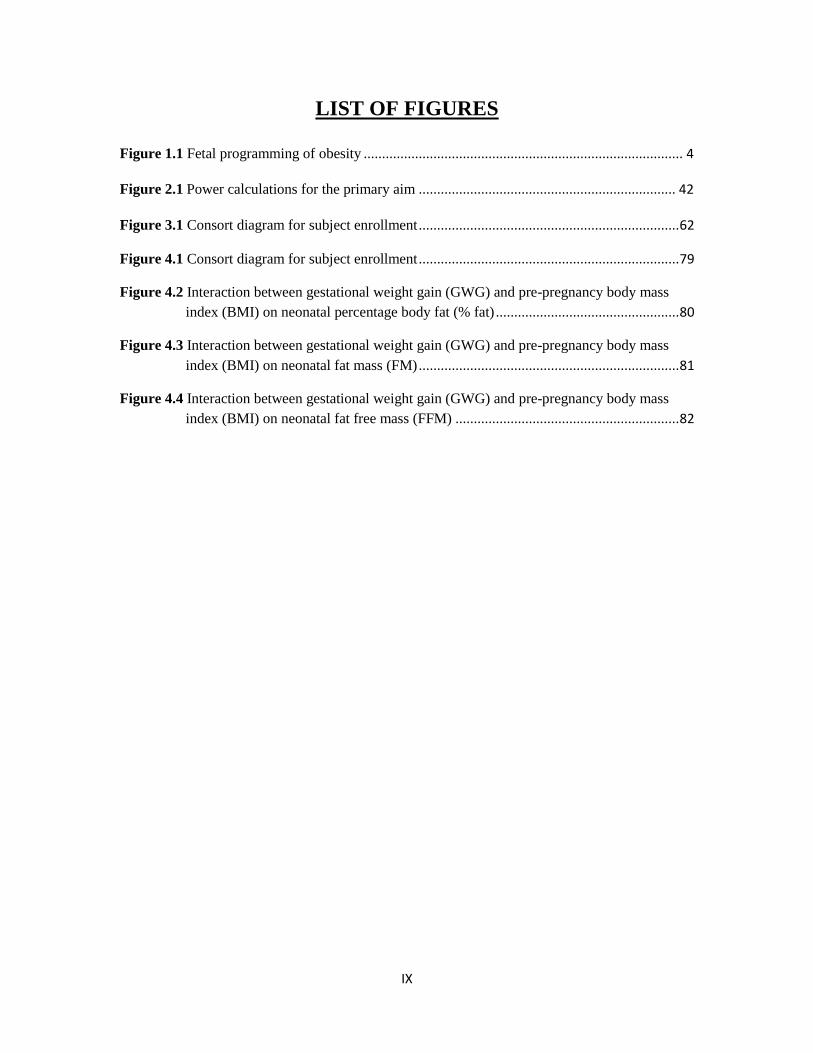
LIST OF FIGURES
Figure 1.1 Fetal programming of obesity ....................................................................................... 4
Figure 2.1 Power calculations for the primary aim ...................................................................... 42
Figure 3.1 Consort diagram for subject enrollment ....................................................................... 62
Figure 4.1 Consort diagram for subject enrollment ....................................................................... 79
Figure 4.2 Interaction between gestational weight gain (GWG) and pre-pregnancy body mass
index (BMI) on neonatal percentage body fat (% fat) .................................................. 80
Figure 4.3 Interaction between gestational weight gain (GWG) and pre-pregnancy body mass
index (BMI) on neonatal fat mass (FM) ....................................................................... 81
Figure 4.4 Interaction between gestational weight gain (GWG) and pre-pregnancy body mass
index (BMI) on neonatal fat free mass (FFM) ............................................................. 82
X
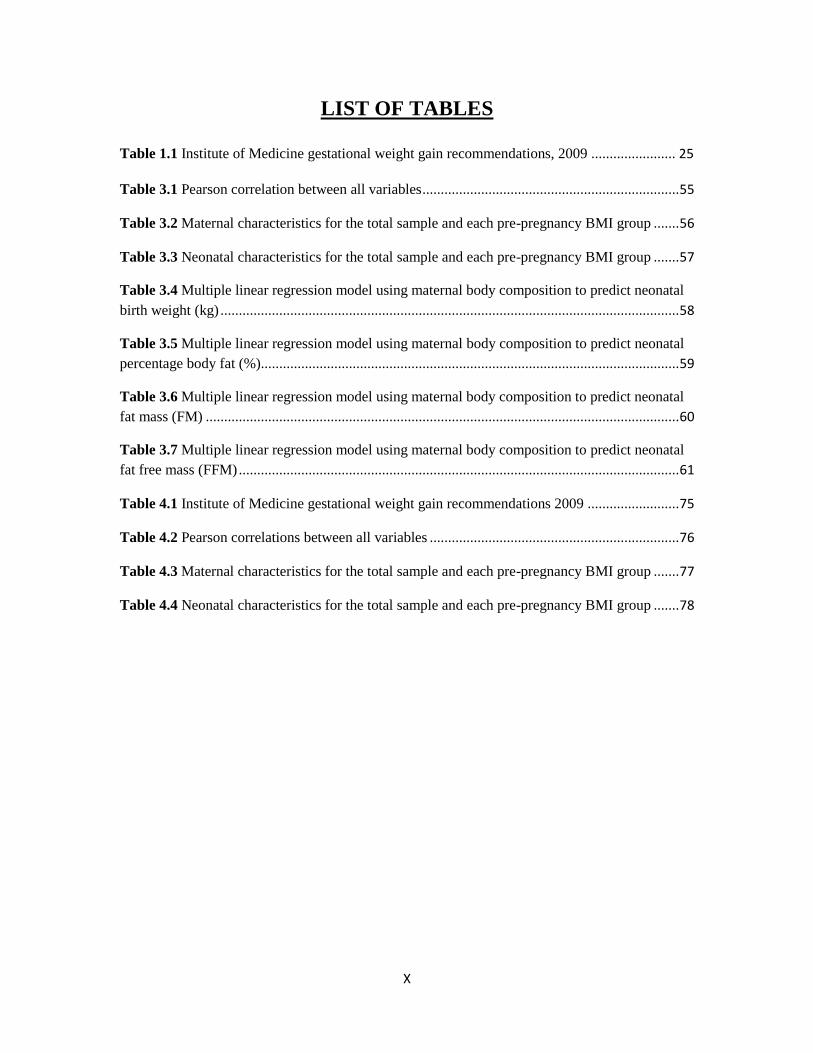
LIST OF TABLES
Table 1.1 Institute of Medicine gestational weight gain recommendations, 2009 ....................... 25
Table 3.1 Pearson correlation between all variables ...................................................................... 55
Table 3.2 Maternal characteristics for the total sample and each pre-pregnancy BMI group ....... 56
Table 3.3 Neonatal characteristics for the total sample and each pre-pregnancy BMI group ....... 57
Table 3.4 Multiple linear regression model using maternal body composition to predict neonatal
birth weight (kg) ............................................................................................................................. 58
Table 3.5 Multiple linear regression model using maternal body composition to predict neonatal
percentage body fat (%).................................................................................................................. 59
Table 3.6 Multiple linear regression model using maternal body composition to predict neonatal
fat mass (FM) ................................................................................................................................. 60
Table 3.7 Multiple linear regression model using maternal body composition to predict neonatal
fat free mass (FFM) ........................................................................................................................ 61
Table 4.1 Institute of Medicine gestational weight gain recommendations 2009 ......................... 75
Table 4.2 Pearson correlations between all variables .................................................................... 76
Table 4.3 Maternal characteristics for the total sample and each pre-pregnancy BMI group ....... 77
Table 4.4 Neonatal characteristics for the total sample and each pre-pregnancy BMI group ....... 78

1
CHAPTER 1
INTRODUCTION
2
The intention of this study was to observe the relationship between the maternal
environment and infant body composition. The primary purpose of this study was to determine
the relationship between maternal body composition late in pregnancy and infant body
composition at birth.
1.1. Maternal obesity and obesity development in offspring
Obesity is an epidemic in the industrialized world as economies have matured. The
obesity prevalence in the US is 36.3% (1), and about one-third of females enter pregnancy obese
(2). Obesity in women of childbearing age is a serious public health problem. From 1991 to 2001,
the incidence of women being obese before pregnancy increased from 25% to 35% (3), and in
2008, the prevalence of pre-pregnancy obesity in the US increased to 28.5% based on the data
from the Pregnancy Nutrition Surveillance System (4).
The time period surrounding pregnancy presents a critical window related to the
immediate and future health of the mother and child. An obese pregnancy is associated with a
heightened risk of pregnancy complications such as preeclampsia (5-7), gestational diabetes
mellitus (GDM) (8), miscarriage (9), as well as the future development of chronic disease in
mother (10). Maternal pre-pregnancy obesity presents a potential modifiable risk factor to avoid
adverse outcomes for both mother and baby.
An obese maternal environment also impacts the health of the offspring. Negative
offspring health effects stemming from maternal obesity include increased risk of childhood
obesity (11) and type 2 diabetes (12). Maternal obesity is strongly related to offspring obesity (13,
14), creating a viscious cycle for the perpetuation of obesity from generation to generation.
Epidemiologic data have shown that the prevalence of obesity is highest among children from
obese parents (11), and children who have obese mothers are more at risk of being overweight or
obese than those who have obese fathers (15). For women with a body mass index (BMI) of over
30, the prevalence of childhood obesity in their offspring at ages 2, 3 and 4 was 15%, 21% and 25%
3
respectively. This was 2.4 to 2.7 times the prevalence of obesity observed in children of mothers
whose BMI was in the normal range (11).
1.2. Metabolic and hormonal occurrences and disturbances during pregnancy
During a healthy pregnancy, several hormonal and metabolic adaptations occur in order
to support fetal growth and development. Pregnancy is characterized by increases in blood
glucose levels, insulin resistance and circulating lipids, which make energy available to the fetus
(16). However these adaptations appear to go away in maternal obesity. In maternal obesity, there
is an exaggerated lipid response, which leads to lipotoxicity (17) and an even greater degree of
insulin resistance (17). Jarvie et al. (18) proposed that lipotoxicity, which influences placental
metabolism and function, is the pathological link between maternal obesity and adverse
pregnancy outcomes leading to offspring obesity. Lipotoxicity is a metabolic syndrome that
results from the accumulation of lipids, particularly fatty acids, in non-adipose tissue, leading to
cellular dysfunction and death. The lipid abnormalities arising from excessive free fatty acids
may be responsible for the observed endothelial dysfunction and placental complications of obese
pregnancy.
Catalano et al. (17) found a decrease in maternal insulin sensitivity. Obese women were
less insulin sensitive than lean women. Exposure to elevated or frequently fluctuating glucose
concentrations may cause embryonic developmental abnormalities. Maternal pre-pregnancy
insulin sensitivity has the strongest relationship with infant fat mass (FM) at birth (17). Catalano
et al. (17) speculated that decreased insulin sensitivity and increased beta cell response affect
early placenta development and function, and these changes relate to up-regulated lipid and
cytokine gene expression, which in later pregnancy affect both maternal lipid metabolism and
placental transport of nutrients. In the hyperlipidemic states of controlled type 1 diabetes and
GDM, placental expression of genes coding for the transport and activation of fatty acids are up-
4
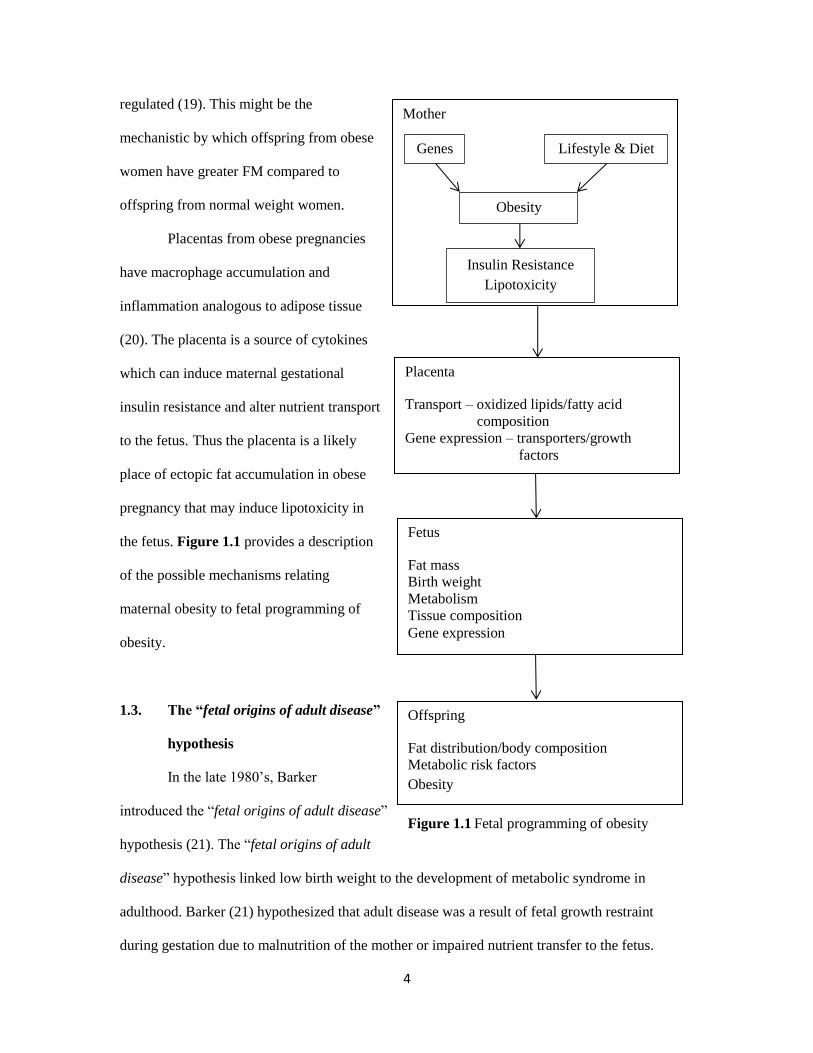
regulated (19). This might be the
mechanistic by which offspring from obese
women have greater FM compared to
offspring from normal weight women.
Placentas from obese pregnancies
have macrophage accumulation and
inflammation analogous to adipose tissue
(20). The placenta is a source of cytokines
which can induce maternal gestational
insulin resistance and alter nutrient transport
to the fetus. Thus the placenta is a likely
place of ectopic fat accumulation in obese
pregnancy that may induce lipotoxicity in
the fetus. Figure 1.1 provides a description
of the possible mechanisms relating
maternal obesity to fetal programming of
obesity.
1.3. The “fetal origins of adult disease”
hypothesis
In the late 1980’s, Barker
introduced the “fetal origins of adult disease”
hypothesis (21). The “fetal origins of adult
disease” hypothesis linked low birth weight to the development of metabolic syndrome in
adulthood. Barker (21) hypothesized that adult disease was a result of fetal growth restraint
during gestation due to malnutrition of the mother or impaired nutrient transfer to the fetus.
Mother
Genes Lifestyle & Diet
Obesity
Insulin Resistance
Lipotoxicity
Placenta
Transport – oxidized lipids/fatty acid
composition
Gene expression – transporters/growth
factors
Fetus
Fat mass
Birth weight
Metabolism
Tissue composition
Gene expression
Offspring
Fat distribution/body composition
Metabolic risk factors
Obesity
Figure 1.1 Fetal programming of obesity
5
Undernutrition was thought to cause an insult during a critical period of early life to the fetus that
led to impaired fetal organ development with permanent or long term effects on organ structure or
function (21). Barker proposed that fetal exposure to undernutrition caused a physiological
adaptation to ensure survival, which resulted in preserving the development of critical organs
such as brain, over the development of less critical organs such as kidneys, pancreas, liver and
muscle. The altered growth changed the metabolism, perfusion and innervation of organs
initiating long lasting consequences to organ function that made the fetus more susceptible to
developing chronic diseases later in life (21).
Fetal malnutrition is related to impaired development and function of critical organs such
as the liver, kidneys and pancreas, which are important for metabolic balance and circulatory
system function involved in blood pressure control (22). This phenotype persists beyond the
prenatal period and is associated with increased central adiposity in childhood, increasing the risk
of hypertension and cardiovascular disease in adulthood (23). For example, suboptimal nutrition
during pregnancy may damage the beta cells of the pancreas, giving rise to defects in the structure
and function of the pancreas, resulting in insufficient insulin release and hyperglycemia. Impaired
pancreatic function predisposes the individual to type 2 diabetes development, and pancreatic
damage is exacerbated by age and a natural decline in organ function (24).
1.3.1. Programming of vascular disease
Martyn et al. (25) proposed that the programming of vascular disease occurs early in life.
He hypothesized fetal undernutrition causes impairment of kidney function through nephron
damage and impaired elastin in the blood vessel walls. These pathologies lead to an inability to
regulate blood pressure resulting in the development of hypertension. Low birth weight is related
to the development of hypertension in adulthood (26-28). Blood pressure is regulated by
vasodilation of blood vessels. Vasodilation is mediated by endothelial secreted nitric oxide (NO).
NO is a potent vasodilator of smooth muscle. NO mediated endothelial vasodilation is impaired
in low birth weight infants (26, 27), suggesting a higher risk of developing hypertension in future
6
life. The sympathic nervous system is up-regulated in low birth weight infants (29).
Overstimulation of the sympathetic nervous system leads to higher plasma levels of
catecholamines, dopamine, norepinephrine and epinephrine. Catecholamines are
neuromodulators that cause vasoconstriction of smooth muscle therefore causing an increase in
blood pressure (30). High levels of catecholamines in the blood cause biochemical abnormalities
that lead to hypertension.
1.3.2. Programming of obesity
Abnormal environmental factors during pregnancy may lead to extremes of fetal growth
that can induce developmental programming, which leads to metabolic imprinting for energy
homeostasis (31). Animal studies indicate that an obese phenotype is influenced by the in utero
environment (31-33), which indicated the importance of embryonic environment because
impaired in utero environment may program obesity on the next generation.
There is a U shaped relationship between birth weight and adult BMI (34). Individuals
with a birth weight at either the low end (< 5 lbs) or at the high end (> 7 lbs) of the birth weight
distribution have a higher risk of later obesity (34, 35). Many studies have established a link
between low birth weight and adult disease development (21, 36-38). However, only 5% of
neonates in the US are born with a low birth weight (< 2500g) (39). Overnutrition is much more
prevalent. Catalano et al. (40) found a mean increase of 116 g in term singleton birth weight over
the past 30 years. The increase in maternal pre-pregnancy weight was the factor most strongly
correlated with the increase in birth weight.
A positive relationship is found between maternal BMI and neonatal birth weight (41-45).
A birth weight ≥ 90th percentile increases the risk for obesity in adolescents as well as adults (46-
52). Obese women tend to have heavier infants with a birth weight ≥ 4000 g (macrosomic) or
classified as large for gestational age (LGA). These infants have an increased risk for
development of obesity (13, 14), hypertension (34), and diabetes (35) later in life.
7
Over the next several sections, studies will be discussed and data will be presented to
support a relationship for fetal programming of later obesity.
1.4. Birth weight as a marker of disease
When trying to discern the pathways for programming of adult disease, birth weight is
often used as a marker of the in utero experience (53). A low birth weight is suggestive of poor
nutrient transfer to the fetus and therefore poor growth while a high birth weight is suggestive of
fetal overnutrition (53). Both low and high birth weight relate to later disease development (53).
1.4.1. Low birth weight and later disease
Low birth weight is defined as a weight at delivery less than 2500 g (54). Term infants
with a low birth weight is related to decreased muscle mass, altered adipocyte differentiation and
accelerated postnatal growth (55).
Term infants with a low birth weight have decreased muscle mass and a high fat
preservation in adulthood (56, 57). Yliharsila et al. (57) showed a strong correlation between
birth weight and adult lean body mass after adjusting for adult age and BMI (β = 1.89, p < 0.001;
β = 1.97, p < 0.001 for men and women, respectively), and higher percentage body fat (% fat)
was predicted by low birth weight in a BMI-adjusted model (β = -1.38, p < 0.001; β = -1.36, p <
0.001 for men and women, respectively). The authors hypothesized that this was due to a lower
amount of muscle mass accretion during fetal development that persisted into childhood. There is
little cell replication in muscle after approximated 1 year of age, thus relatively speaking, the
number of muscle fibers accumulated during infancy would be reflective of the number of muscle
fibers attained in adulthood. In utero, muscle fibers are staring formed between 6 to 8 weeks
during gestation and completed by 18 weeks (58). Inadequate energy intake by pregnant women
in this window has been shown to decrease the number of fetal muscle fibers (59, 60). This may
contribute to hyperglycemia and insulin resistance since skeletal muscle is important for glucose
disposal (58). Eriksson et al. (61) found insulin resistance in adults was associated with low birth
weight (p = 0.02). They suggested that altered sensitivity of the muscle to insulin might be the
8
explanation that underlies the association between low birth weight and insulin resistance during
adult life.
Undernutrition during pregnancy also affects adipocyte differentiation. Low energy
intake in the first and second trimesters may increase adipocyte differentiation and low energy
intake in the third trimester may decrease adipocyte differentiation (62). Permanent alteration in
the number of adipocytes would affect adipocyte secreted hormones, such as leptin. Leptin binds
to sites both centrally in the brain and peripherally to decrease food consumption and increase
energy utilization (58). Therefore, maternal undernutrition during early gestation could result in
greater secretion of leptin and maternal undernutrition late in pregnancy could result in lower
secretion of leptin in the offspring. High amounts of leptin have been found in adult obesity and
may cause an inhibition of insulin secretion and stimulate adipogenesis (63). Research suggests a
link between birth size and leptin (64). Cord blood leptin is positively related to birth weight and
body fat of infants. The correlation was stronger in infants exposed to hyperinsulinemia and
hyperglycemia in utero (62). Low birth weight is also associated with higher levels of plasma
leptin in adulthood (65). Phillips et al. (65) found adults with a lower birth weight had higher
leptin concentration than those with a higher birth weight even after adjusting for adult BMI (p =
0.02). These results suggested that low birth weight is associated with higher leptin that may
correlate to some leptin resistance, which is related to overweight or obese phenotype.
Undernutrition during early fetal development is typically followed by improved or
adequate postnatal nutrition. Postnatal accelerated or compensatory growth often occurs in
infants born with a low birth weight or born prematurely (66). Undernutrition during gestation
and small size at birth followed by rapid childhood weight gain is linked to cardiovascular disease
and type 2 diabetes in adulthood (67, 68). Rapid growth and associated hormonal and metabolic
changes may disrupt cell function and impose excessive metabolic demand on organs that are
underdeveloped or small due to undernutrition during gestation and slow fetal growth (69). For
example, low birth weight infants have limited pancreatic beta cell numbers; however, the
9
glucose induced insulin response is increased in infants with compensatory growth (70).
Therefore, these infants could be at increased risk of developing insulin resistance in adulthood.
In conclusion, low birth weight is association with a reduction of muscle fibers, more
adipocytes, higher leptin levels, and accelerated postnatal growth. Malnutrition related low birth
weight is not a common problem in developed countries. Overnutrition during pregnancy is more
common and is related to a high birth weight. In a similar manner as low birth weight relates to
later disease, a high birth weight is also related to abnormal development and later adverse health.
1.4.2. High birth weight and development of diseases
The health consequences related to a low birth weight are serious (21, 36-38); however, a
high birth weight is also a concern. High birth weight is related to increased risk of obesity
development, type 2 diabetes and metabolic syndrome later in life (71). High birth weight is
defined as a birth weight > 4000 g and LGA is defined as birth weight > 90th percentile for
gestational age. Rates for high birth weight and LGA were 9.2% and 10%, respectively (72-74).
Obese females are more likely to deliver an LGA infant compared to normal weight women (75,
76). Epidemiological data suggests a relationship between the occurrence of LGA and adult
disease (77-79). Both human and animal studies show increased adipocyte differentiation and
fetal metabolism when exposed to maternal overnutrition (62, 80-84).
Hediger et al. (77) showed that children who were born LGA were prone to increased fat
accumulation and remained heavier through at least 47 months of age. This suggested a
relationship between intrauterine growth and risk of obesity in early childhood. Boney et al. (78)
evaluated the major components of metabolic syndrome in a longitudinal cohort study of children
aged 6, 7, 9 and 11 years old who were born LGA or appropriate for gestational age (AGA). They
found children who were LGA at birth had a trend toward (p = 0.08) higher incidence of insulin
resistance and a 2-fold increased risk of developing metabolic syndrome at 11 years old compared
to children who were AGA at birth. Wang et al. (79) also found the prevalence of metabolic
syndrome was significantly higher in obese children born LGA compared to obese children born
10
AGA. The prevalence of hypertension, hypertriglyceridemia and hypercholesterolemia was
significantly different between LGA-obese children and AGA-obese children (adjusted odds ratio
(OR) = 2.77, 2.32 and 3.11, respectively).
Maternal overnutrition late in pregnancy may change fetal adipose tissue differentiation
and promote offspring obesity development (62). Infant fat accumulation mainly occurs during
the third trimester and increased maternal food intake during this time increases fetal adipose
tissue deposition (85). Maternal overnutrition late in gestation could increase maternal leptin
levels in serum, which plays a key role in the regulation of neonatal body FM and body weight
(80). Kiess et al. (81) showed leptin levels in cord blood were positively correlated with birth
weight (r = 0.57; p = 0.03). Neonatal weight and skinfold thickness accounted for about 35% to
70% of the variance of leptin levels in cord blood. Increased leptin levels resulting from maternal
overnutrition during late gestation may lead to higher fetal fat deposition and higher birth weight.
Animal studies have shown that maternal overnutrition causes detrimental infant health
effects that impact offspring health (86-92). Increased adiposity was found in offspring born to
dams fed a high fat diet (45% fat) throughout pregnancy (82). Another study in non-human
primates showed that a maternal high fat diet (35% fat compared to 15% fat in the control diet)
during pregnancy led to significant increases in plasma free fatty acid levels and liver
triglycerides content in the fetus (83). Higher plasma free fatty acid levels in the fetus could lead
to later insulin resistance (84). These results suggest diet impacts offspring phenotype and
maternal overnutrition during pregnancy can program the offspring.
There are many similar effects between offspring exposed to either maternal under- or
overnutrition. Growing evidence is suggesting programming during fetal life because of maternal
malnutrition (over or undernutrition) at specific stages of gestation may result in permanent
adaptive responses that lead to physiological changes and subsequent development of offspring
hypertension, insulin resistance and hypertriglyceridemia. However, more research is needed to
clarify the relationships between maternal nutrition and offspring health.
11
1.5. Birth weight and later BMI
1.5.1. Birth weight and BMI in adulthood
Studies have reported a direct relationship between birth weight and adult BMI (14, 34,
35, 46-49, 93, 94). Many are large longitudinal cohort studies or reports using census or registry
data to analyze the relationship between birth weight and BMI in adulthood.
Rasmussen and Johansson (46) analyzed the relationship between birth weight and later
BMI in 165,109 males born from 1973 to 1976. Birth weight was obtained from the Swedish
Medical Birth Registry and weight and height at 18 years old were obtained from the Military
Service Conscription Registry. A direct relationship was found between weight for gestational
age and BMI at the age of 18 years old. A high birth weight was related to a higher risk of
overweight at 18 years old after adjusting for the living area, maternal age, educational level and
maternal parity. Those with a birth weight between the 95th and 99
th percentile had an OR for
overweight in adulthood of 1.50 and those with a birth weight over 99th percentile had an OR for
overweight in adulthood of 1.67 when using birth weight between 25th and 50
th percentile as the
reference.
Sorensen et al. (47) identified 4300 births using the Danish Medical Birth Registry for
men born after 1972. Their birth weight, height and weight at between 18 to 26 years old was
recorded by the Danish draft board. They found a relationship between birth weight and later
BMI and a continuous increase in young adulthood BMI with increasing birth weight after
controlling for maternal age, marital status and occupation. The prevalence of obesity in this
population from 18 to 26 years old was 3.5% for the group with a birth weight ≤ 2500g and 11.4%
for the group with a birth weight ≥ 4500g.
Similar studies were conducted in Norway and Sweden. Eide et al. (48) collected the
birth weight of 348,706 males using the Medical Birth Registry of Norway and the height and
weight in adulthood from information collected during the military draft. A positive association
was found between birth weight and adult BMI for birth weight > 2500g. In Sweden, Tuvemo et
12
al. (49) collected the birth weight of 39,901 males using the Swedish birth registry and the weight
and height in adulthood were collected using draft from the Swedish conscript registry. The group
with a birth weight < 2500g had a mean adult BMI of 21.93 kg/m2 while the group with a birth
weight ≥ 4500g had a mean adult BMI of 23.02 kg/m2. Men with a high ponderal index (birth
weight (g)/length (cm)3) had an OR for obesity as 1.8 when using men with a low ponderal index
as reference.
Seidman et al. (93) used data from the Israeli draft medical exam to identify 33,413
infants of both genders born between 1964 and 1971 and followed until 17 years old. A positive
association was found between birth weight and BMI during adolescence. The OR for being
overweight at 17 years old was 2.16 for males and 2.95 for females with a birth weight > 4500g
compared to a normal birth weight (3000 to 3500g). This is the first study that included females
when analyzing the relationship between birth weight and BMI in adulthood.
In the US, Curhan et al. (34, 35) did two large scale studies in males and females that
provided information related to birth weight and adult BMI. They obtained information for
51,289 men using data from the Health Professional Follow-up Study and for 164,040 women
using data from the Nurses’ Health Study I and II. In the Health Professional Study, those with a
birth weight over 4.5 kg had a higher risk of having a BMI over 28.2 kg/m2 in adulthood (OR =
2.08) as well as those with a birth weight between 3.86 and 4.5 kg (OR = 1.50) compared to those
with a birth weight between 3.2 to 3.8 kg (35). In the Nurses’ Health Study I and II, the OR of
being in the highest BMI quintile (BMI > 29.2 kg/m2) were 1.19 and 1.62 for women born with a
birth weight 3.86 to 4.5 kg and over 4.5 kg, respectively (34).
Parson et al. (14) reported that infant birth weight was independently related to adult
BMI based on a study of 10,683 infant males and females born in 1958 in Scotland, England and
Wales. They found a J shape relationship between birth weight and later BMI. Infants who had a
birth weight in the heaviest quintile had a high BMI in adulthood regardless of childhood growth.
This relationship was largely predicted by maternal pre-pregnancy BMI and independent of
13
paternal height, socioeconomic status or maternal smoking habits. Fall et al. (94) also found a J
relationship between birth weight and adult BMI in a group of 297 women born between 1923
and 1930. They found BMI in these women rose with increasing birth weight (p = 0.05).
In summary, birth weight is positively related to BMI in adulthood. This suggests that the
maternal environment has the potential to substantially increase the risk of offspring obesity later
in life.
1.5.2. Birth weight and later BMI in childhood
Studies have assessed birth weight as a predictor of being an overweight and obese child
(95-103). Epidemiological studies show that childhood obesity is related to adulthood obesity. A
child who is obese as an adolescent has an 80% chance of being obese as an adult (103, 104).
Fisch et al. (95) collected data prospectively in 1,786 Minnesota children and related
birth weight to obesity at ages 4 and 7. An infant was classified as obese if his/her birth weight
was at or above the 95th percentile. Obesity at birth was positively related to weight/ height index
(weight (kg) /height (cm)) at both 4 and 7 years old. Another prospective longitudinal study was
done in Australia. Mothers were interviewed pre-delivery and children were followed for visits
immediately after delivery, at 6 months and 5 years. Complete data were collected on 4,602
mother-child pairs. Moderate obesity was defined as a BMI between the 85th and 95
th percentile
while severe obesity was defined as BMI > 95th percentile. Birth weight was an independent
predictor of both moderate and severe obesity. The OR of severe obesity was 1.8 for a birth
weight ≥ 95th percentile (96). These results were consistent with another more recent study done
in Denmark. Lausten-Thomsen et al. (97) found birth weight was a predictor of severe childhood
obesity in 1,171 obese children aged 3 to 18 years old in Denmark. They defined childhood
obesity as BMI above 95th percentile for age and gender according to Danish BMI charts. Weight
and height were collected at clinic visit in the Children’s Obesity Clinic at Copenhagen
University Hospital Holbaek in Denmark from 3 to 18 years old. Childhood BMI-standard
derivation scores (SDS) were calculated according to Danish BMI charts. Birth weight was
14
collected from the hospital record and ponderal index was calculated. In a generalized linear
model adjusted for socioeconomic status, a significant correlation between BMI-SDS at the time
of enrollment and birth weight (p < 0.0001) was found. They also found BMI-SDS at the time of
enrollment correlated with birth weight for gestational age (p < 0.0001) and infant ponderal index
(p = 0.020) after adjusting for socioeconomic status and breastfeeding duration. Instead of a U-
shape relationship, their data supported a linear association between birth weight and childhood
BMI. They also found that birth weight was a better predictor for childhood obesity than ponderal
index and suggested that the trend of increasing birth weight might underlie the increasing
childhood obesity incidence.
Some studies used large data registries to analyze the association between birth weight
and child’s BMI. Binkin et al. (98) used birth certificates of participant’s from the Women, Infant
and Children special supplement food program for low income families in Tennessee to obtain
infant birth weight. Birth weight was stratified in 500 g increased from 1000 to 4999 g. Higher
birth weight was directly related to a greater risk of obesity development at 3 years old. Only one
percent of children were obese at 36 to 41 months old if they had a birth weight between 1000
and 1499 g while 8.7% children were obese at the same age if they had a birth weight between
4500 and 4999 g. Zive et al. (99) used data from the Study of Children’s Activity and Nutrition
Project to examine the relationship between birth weight and child’s BMI at the age of 4 in 331
Anglo- and Mexican-Americans. Birth weight correlated with child’s BMI (r = 0.28. p < 0.001)
and the sum of skinfold thickness (r = 0.16, p < 0.01). Hui et al. (100) collected birth weight data
of 6496 full term infants from a Hong Kong birth cohort in 1997. Weight and height of these
children were measured by the Department of Student’s Health Service when children were 7
years old. Overweight and obesity were defined as BMI ≥ 25 and 30 kg/m2, respectively.
Children with a higher birth weight and a faster growth rate had a greater risk for being
overweight at 7 years old for both genders, especially for the first 3 months. The OR for infants in
15
the highest birth weight tertile (mean birth weight = 3.6 kg) to be overweight at 7 years of age
was 2.00 for girls and 2.31 for boys compared to low birth weight girls.
Some population-based studies showed an association between macrosomia and
childhood overweight. Rugholm et al. (102) studied 124,615 girls and 128,346 boys born
between 1936 and 1983. Overweight was defined by BMI in relation to internationally accepted
criteria. Compared to children with a birth weight of 3.0 to 3.5 kg, the risk of overweight
increased consistently with each increase in birth weight category among girls and boys and at all
ages between 6 and 13 years old. Furthermore, the association between birth weight and increased
risk of overweight in childhood remained stable across a 48-year period. Kromeyer-Hauschild et
al. (103) studied 1,901 German boys and girls aged 7 to 14 years old using cross sectional
surveys completed in 1975, 1985 and 1995. They found a significant relationship between
childhood overweight (BMI > 90th percentile) and birth weight in boys (p = 0.04) and girls (p =
0.035), when controlling for socioeconomic status. Another population-based study done by He
et al. (101) examined 748 preschool boys and 574 preschool girls in China aged from 0 to 7 years
old. Birth weight ≥ 4000 g was identified as a major risk factor for obesity development (p <
0.05).
Birth weight has been shown to be related to both adult and childhood BMI and it is also
one of the most common characteristics used to evaluate fetal growth, which links maternal
environment to offspring’s long-term health. However, standard weight and length measurements
provide only estimates of infant adiposity but fail to quantify what comprises infant body mass.
Moulton et al. (105) demonstrated that the variability in birth weight within mammalian species
was explained by the amount of adipose tissue whereas the amount of lean body mass was
relatively constant and changed in a consistent manner over time. Catalano et al. (106) found FM
in term neonates accounted for only 14% of birth weight but explained 46% of the variance in
birth weight. For those reasons, neonatal body composition may be a better way to assess fetal
growth instead of birth weight. Recent advancement has allowed for the assessment of neonatal
16
body composition (107-109). Analyses of neonatal body composition will be beneficial to explore
the relationships between the maternal and the fetal environment.
1.6. Assessment of neonatal body composition
The available methods to assess body fat indirectly are based on theoretical models (110).
The accuracy of these techniques depends on the model and the associated assumptions. Neonates
violate the underlying assumption of a constant hydration of fat free mass (FFM) because they
have a higher body water content and a lower density in body FFM. During the initial days of life,
the hydration level of the body fluctuates as the newborn adapts to life outside the intrauterine
environment (111). This must be taken into account when the assessment is conducted. The Pea
Pod® software takes into account the fluctuations of neonatal hydration when determining FFM
during the first few days of life. The Pea Pod® uses age and gender-specific equations to
calculate neonatal body density based on results obtained from multi-compartment models (112,
113).
Various methods are used to assess neonatal body composition including anthropometry
(114-119), magnetic resonance imaging (MRI) (120), total body water (TBW) (112, 120-122),
total body potassium (TBK) (112, 121), total body electrical conductivity (TOBEC) (116, 121-
125), dual energy x-ray absorptiometry (DXA) (114, 117, 118, 121, 126-128) and densitometry
using air-displacement plethysmography (ADP) (107-109, 129-132). Densitometry is a safe,
quick and easy method to assess neonatal body composition (129). The Pea Pod® is the only
technology currently available to assess neonatal body composition and it assesses densitometry
using ADP (129). Measurement of neonatal body composition involves assessment of body mass
and body volume.
Several studies of neonates have been done using ADP since the Pea Pod® was
introduced in 2003(107-109, 129-132). Sainz and Urlando (107) used 24 phantoms made from
pig muscle and fat to assess the precision and accuracy of the Pea Pod® compared with chemical
17
analysis and hydrostatic weighing. No differences were found between the Pea Pod® and
chemical analysis. Yao and colleagues (108, 109) assessed within and between day reliability of
the Pea Pod® in 17 neonates on two consecutive days. The study showed no between or within
day difference for percent fat. In addition, the investigator compared the body fat measures from
Pea Pod® and from TBW using deuterium and no differences for % fat were found between these
two techniques.
Most studies that assessed neonatal body composition examined maternal anthropometric
variables as predictors. Typically these include pre-pregnancy weight, pre-pregnancy BMI, and
gestational weight gain (GWG). Anthropometrics do not take into account the composition (FM
or FFM) of body weight. Quantification of maternal body fat may be a better predictor because it
provides more detailed information that describes the underlying relationships between the
maternal and intrauterine environment.
1.7. Assessment of maternal body composition
Assessment of body composition during pregnancy is complicated because the
composition of lean tissue changes during pregnancy. The hydration of FFM changes during
pregnancy due to the increase of plasma volume (133) and the increase in amniotic fluid volume
(134) to support fetal growth. Plasma volume increases by 1.2 to 1.5 L by 34 weeks of gestation
(133) and the mean amniotic fluid volume from 22 to 39 weeks is about 0.8 L (134). Water gain
is the largest component (average around 70% at 38 weeks (135, 136)) of maternal weight gain.
The amount of water in FFM in pregnant women varies between 72.5% and 76.2% (137)
compared with 73.8% in non-pregnant women (138), because of the increase in maternal body
water.
The two-compartment model is the most common model used to measure body
composition in non-pregnant population. It divides the body into FM and FFM. The two-
compartment model estimates the body fat based on the assumption that the densities of FM and
18
FFM are 0.900 g/cm3 and 1.10 g/cm
3, respectively. Increases in FFM (mainly TBW) during
pregnancy lower the density of FFM compared with non-pregnancy status and invalidate the
standard two-compartment model conversion factors complicating body composition assessment
during pregnancy. Kopp-Hoolihan et al. (138) and Hopkins et al. (139) found that the two-
compartment model of assessing body composition was not valid during pregnancy, even when
correcting for altered hydration status that occurs in normal pregnancy.
Multi-compartment models give reliable and valid estimates of body fat in studies of
subjects with varied body composition during pregnancy (140, 141). The four-compartment
model measures water, fat, mineral lean and protein independently. This direct approach does not
rely on assumptions about the fractional contributions of body water and bone mineral mass to
FFM, nor about the density of the FFM. Such models provide more accurate estimates of FM for
pregnant women. Lederman et al. (142) reported the first study using the four-compartment
model to determine longitudinal changes in body composition occurring during pregnancy in the
early 1990s. They measured body weight, total body water and body density at 14 weeks and
again at 37 weeks during gestation. Bone mineral was measured at 3 weeks postpartum to avoid
radiation exposure during pregnancy.
1.7.1. Total body water
TBW is measured using stable radiolabeled isotope, either deuterated water (D2O) or
oxygen-18, and measuring its dilution. The hydration of FFM is estimated as 73% in non-
pregnant women however there is wide variation during pregnancy (137, 143, 144). Two early
studies (143, 144) estimated the amount and composition of tissues gained to calculate changes in
FFM hydration in pregnant women using Hytten’s equation (145). Both of the studies found the
TBW did not change before week 10 and rose gradually to 76% at 40 weeks (143, 144).
Hopkinson (139) and Paxton and colleagues (146) measured TBW as part of four-compartment
model during pregnancy and both reported a hydration of 76% at 36 weeks. Forsum et al. (147)
showed FFM hydration was 73.2% at 16 to18 weeks and rose to 74.8% at 30 and 36 weeks
19
gestation, which is within the range reported by van Raaij et al. (144) The hydration of FFM
dropped back to 73.2% at 2 or 6 months postpartum (147).The results of these studies show
similar values and agreement among the different theoretical hydration estimates. Women with
different pre-pregnancy FFM would have different hydration of the FFM even if they gain the
same FFM during pregnancy (144). Thus, large and small pregnant women classified by pre-
pregnancy BMI may not have the same change in hydration with a given FFM increment.
Depending on the women’s pre-pregnancy FFM and whether she develops edema, FFM at term
could range from 74.6% to 77.1%. (144).
1.7.2. Body density
Body density is measured by hydrodensitometry (commonly referred to as underwater
weighing) and ADP. In a two-compartment model, body fat is estimated by measuring body
volume and using the densities of fat (0.900 g/cm3) and FFM (1.10 g/cm
3) to derive body
composition. The change in hydration during pregnancy invalidates the body density measure
because if hydration of FFM changes, then a FFM density of 1.10 g/cm3 is not correct. Lederman
et al. (142) showed the mean density of the FFM for pregnant women was 1.099 g/cm3 at 14
weeks and 1.089 g/cm3 at 37 weeks. As a result, a single method using an assumed density of
FFM would not reflect the changes in the density of FFM across pregnancy. Therefore FFM
would be underestimated during pregnancy resulting in an overestimation of FM using two-
compartment model.
Adjusted equations correcting for altered values in pregnancy could provide more
accurate values for body composition changes during pregnancy. For example, average values
for fetal, placental and amniotic fluid weight and composition have been used to correct the mean
density of FFM during pregnancy (143, 144); however, many other variables that may influence
body composition during pregnancy are still not clear. The pre-pregnancy FFM and degree of
edema during pregnancy could be other factors that affect the density of FFM during pregnancy.
Van Raaij et al. (144) showed the density of the total FFM at term would range from 1.0895 to
20
1.0850 g/cm3 in women who did not developed edema during pregnancy; however, the range
would be 1.0830 to 1.0785 g/cm3 for women who did develop generalized edema. The FFM gain
during pregnancy represented 16.6% to 25% of the pre-pregnancy FFM.
Multi-compartment models are particularly useful in measuring body composition during
pregnancy because they can improve the accuracy of each subject’s measurements and decrease
the number of subjects needed. It is a challenge to use the four-compartment model in pregnant
women because hydrodensitometry is difficult for many women to successfully complete near
term. ADP rather than water displacement to measure body volume is a useful alternative and has
a wider application than hydrodensitometry. Notably, there have been no data published using
ADP in a multi-component model to assess maternal body composition to date. This is the first
study that will use ADP to measure maternal body volume in a four-compartment model.
1.8. Maternal BMI and infant birth weight
Maternal pre-pregnancy BMI is directly related to the risk of developing a series of
pregnancy related complications and macrosomia (17). Maternal pre-pregnancy BMI is
frequently used as an indicator of the conditions experienced in utero and it has an impact on
infant birth weight (148-153).
Koepp et al. (148) examined the relationship between maternal pre-pregnancy BMI and
offspring birth weight in 58,383 Norwegian women. Maternal pre-pregnancy weight and height
were self-reported and infant birth weight was obtained from the medical records. They found the
birth weight of offspring increased with increasing maternal pre-pregnancy BMI. For every unit
increase in maternal pre-pregnancy BMI (1 kg/m2) infant birth weight increased by 25.9 g (95%
CI: 25.0, 26.9). Kalk et al. (149) conducted a similar study in 2,049 German mother-infant pairs.
Maternal pre-pregnancy BMI was calculated based on self-reported body weight before
pregnancy and maternal height was extracted from medical records. The results showed an
increased risk of having a macrosomic (OR: 1.5 to 2) or LGA infant (OR: 1.6 to 2.5) in
21
overweight and obese women. This association was independent of child gender and gestational
age.
These results are consistent with another large epidemiological study of 325,395 pregnant
women in London conducted by Sebire et al. (150). Maternal pre-pregnancy BMI was calculated
using weight and height measured at the first antenatal visit and infant birth weight was expressed
as the number of standard deviations by which the measured birth weight differed from the
expected mean for gender and gestational age. Infant birth weight was positively associated with
increasing maternal pre-pregnancy BMI and the mean birth weight was significantly increased in
offspring from overweight (t = 39.2, p < 0.0001) and obese women (t = 53.1, p < 0.0001)
compared to offspring born to normal weight women. The prevalence of LGA infants was almost
twice as high in offspring born to obese women compared to offspring born to normal weight
women (OR: 2.36; 99% CI: 2.23, 2.50).
Frederick et al. (151) suggested an independent role of pre-pregnancy BMI as a
determinant of infant birth weight, as well as complex relationships between pre-pregnancy BMI,
GWG, and other maternal factors with fetal growth, as measured by size at birth. They analyzed
the impact of pre-pregnancy BMI on infant birth weight in 2,670 women in the US. Pre-
pregnancy weight and height were self-reported and confirmed with medical records and infant
birth weight was obtained from the infants’ medical records. In this study, the quadratic term of
pre-pregnancy BMI (pre-pregnancy BMI2) accounted for 27.3% of the variation in infant birth
weight (adjusted R2 = 0.273). Both pre-pregnancy BMI and pre-pregnancy BMI
2 were
significantly associated with birth weight (pre-pregnancy BMI, β = 44.67, p = 0.001; pre-
pregnancy BMI2, β = - 0.51, p = 0.029). When using a women with a normal pre-pregnancy BMI
as a reference, underweight women had a 50% reduced risk of delivering a macrosomic infant
(adjusted relative risk (RR): 0.50; 95% CI: 0.35, 0.71) but obese women had a 1.65-fold increased
risk of delivering a macrosomic infant (adjusted RR = 1.65; 95% CI 1.29, 2.11).
22
Neggers et al. (152) did a prospective study to determine whether maternal
anthropometric measurements during pregnancy as well as pre-pregnancy weight and pre-
pregnancy BMI predicted newborn measures at birth. They studied 1,205 low income African-
American women and their babies in Alabama. Maternal pre-pregnancy weight was self-reported
and height was measured at the first prenatal visit. Body weight and skinfold thickness of the
infant were measured within 24 hours after birth. Maternal pre-pregnancy weight had the greatest
relationship to infant birth weight. A difference in maternal pre-pregnancy weight from the 10th to
90th percentile resulted in a 295 g increase in adjusted infant birth weight. However, in a
regression model of infant body fat estimated by skinfold thickness, maternal pre-pregnancy BMI
was the strongest predictor. A difference in maternal pre-pregnancy BMI from the 10th to 90
th
percentile resulted in a 12 to 15% increase in infant skinfold thickness. Multiple linear regression
showed a 1 kg increase in maternal pre-pregnancy weight was associated with a 7.3 g increase in
birth weight after adjusting for maternal GWG.
Yu et al. (153) did a meta-analysis systematic review to examine the relationship between
maternal pre-pregnancy BMI and infant birth weight. Thirty-four of the 45 analyzed articles
investigated the association between maternal pre-pregnancy BMI and infant birth weight.
Sixteen studies assessed the association between pre-pregnancy BMI and a prevalence of small-
for-gestational-age (SGA) and low birth weight. They found women who were underweight
before pregnancy classified by BMI had a higher risk of having an SGA infant (OR: 1.81; 95% CI:
1.76–1.87; p < 0.001) compared to women who were normal weight before pregnancy. In
contrast, an overweight or obese pre-pregnancy BMI decreased the risk of low birth weight (OR:
0.83; 95% CI: 0.81–0.84; and OR: 0.81; 95% CI: 0.80–0.83; respectively p < 0.001). Twenty-two
studies assessed the association between pre-pregnancy BMI and high birth weight and
macrosomia. When compared to women with a normal pre-pregnancy BMI, women who were
overweight or obese before pregnancy had an increased risk of having either a high birth weight
23
(OR: 1.53; 95% CI: 1.44–1.63; and OR: 2.00; 95% CI: 1.84–2.18; p < 0.001) or macrosomic
infant (OR: 1.67; 95% CI: 1.42–1.97; and OR: 3.23; 95% CI: 2.39–4.37; p < 0.001).
In summary, maternal pre-pregnancy BMI is directly related to infant birth weight.
Women who were overweight or obese before pregnancy have a higher risk of delivering an
infant with a high birth weight or delivering an infant classified as macrosomic.
1.9. Maternal BMI and infant body composition
Birth weight is not a precise indicator of fetal nutritional status (58), though birth weight
provides a crude estimate of the intrauterine environment. Infant body composition may be a
better biomarker reflecting or mediating the development of disease later in life. Neonatal body
composition correlates with childhood body composition (128). Crozier et al. (128) show
moderate correlations between neonatal FM and childhood FM at ages 4 and 6 years old. Stronger
correlations were found between neonatal FFM and childhood FFM at ages 4 and 6 years old.
Neonatal body composition may reflect or mediate the development of disease later in life.
A few studies have assessed neonatal body composition in relation to maternal factors
(125, 131, 132, 154, 155). FM is significantly higher in neonates born to overweight and obese
women, while no difference is found in FFM (125, 131). Sewell et al. (125) compared body
composition of neonates using TOBEC from pre-pregnant normal weight and overweight/obese
women. Neonates born to pre-pregnant overweight or obese women had greater birth weight
(3436g vs. 3284g; p = 0.051), body fat (11.6% fat vs. 9.7% fat; p = 0.03), and FM (420g vs. 380g;
p = 0.01) compared with neonates from normal weight women. Sewell et al. (125) showed the
differences of birth weight were attributed to increased FM but not FFM. This was the first study
to investigate the relationship between maternal pre-pregnancy BMI and neonatal body
composition. Hull et al. (131) compared pre-pregnancy BMI and neonatal body composition
using ADP in a total of 72 neonates (33 from normal weight women and 39 from
overweight/obese women). Significant differences in body fat (12.5% vs. 13.6%; p ≤ 0.0001) and
24
FM (414.1g vs. 448.3g; p ≤ 0.05) were found between neonates from normal weight women and
overweight/obese women. However, no significant differences were found in birth weight
between groups in this study. More recently, Andres et al. (155) measured body composition
using ADP in 65 infants at 2 weeks of age (46 born to normal weight women and 19 born to
overweight women). They found infant % fat and absolute FM were significantly higher in
infants born to normal weight women compared to infants born to overweight women at 2 weeks
of age (11.9% vs. 15.3%, p = 0.01; 0.44 vs. 0.61 kg; p = 0.005). The effects on FFM were not
described in this study. All of these studies showed a positive relationship between maternal pre-
pregnancy BMI and neonatal % fat and FM (125, 131, 155).
One study found an interaction of maternal pre-pregnancy BMI and GWG on neonatal
body composition. Hull et al. (132) compared GWG in normal, overweight and obese women and
neonatal body fat using ADP in 306 neonates. More than 70% of overweight and obese women
gained an excessive amount of weight whereas just 40% normal weight women gained excessive
weight. Neonatal body fat differed depending on whether overweight women gained an
appropriate or excessive amount of weight during pregnancy. Neonates born to overweight
women who gained excessively had similar body fat when compared to neonates born to obese
women regardless of weight gain. However, a neonate born to an overweight woman who gained
an appropriate amount of weight had similar body fat to a neonate born to a normal weight
woman. Regardless of appropriate or excessive gains, neonates born to normal weight women
had the lowest body fat while neonates born to obese women had the highest.
Maternal pre-pregnancy BMI is associated with neonatal body composition. If a woman
has an overweight or obese BMI before pregnancy, her neonate is more likely to have higher %fat
and FM compared to neonates born to normal weight women. However, none of these studies
analyzed maternal body composition during pregnancy and how that related to neonatal body fat.
Currently, we do not know if either maternal FM or FFM influences neonatal body fat at birth.
25
1.10. Maternal GWG and infant birth weight
Previous studies associate maternal genetic, socio-culture, demographic and behavior
factors with infant birth weight (156-158). For example, maternal pre-pregnancy BMI and GWG
influence infant birth weight and play significant roles in pregnancy outcomes. Low GWG is
associated with SGA (159) and preterm birth (160) whereas high GWG is associated with risk of
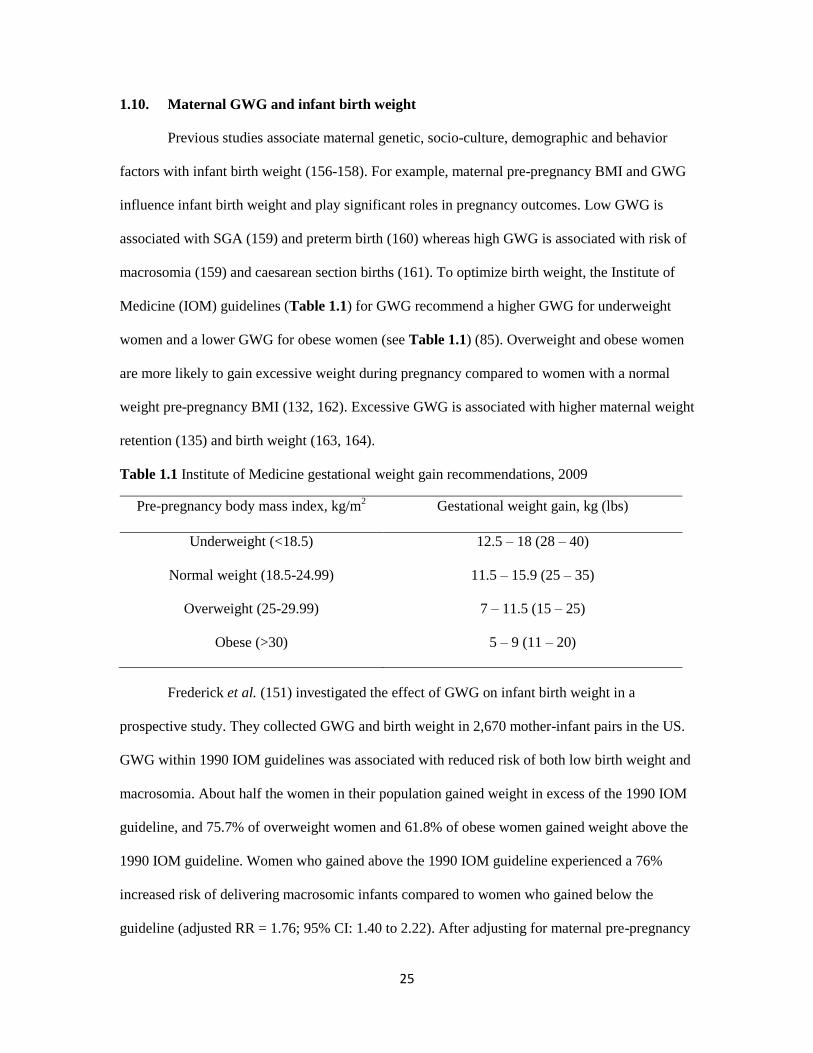
macrosomia (159) and caesarean section births (161). To optimize birth weight, the Institute of
Medicine (IOM) guidelines (Table 1.1) for GWG recommend a higher GWG for underweight
women and a lower GWG for obese women (see Table 1.1) (85). Overweight and obese women
are more likely to gain excessive weight during pregnancy compared to women with a normal
weight pre-pregnancy BMI (132, 162). Excessive GWG is associated with higher maternal weight
retention (135) and birth weight (163, 164).
Table 1.1 Institute of Medicine gestational weight gain recommendations, 2009
Pre-pregnancy body mass index, kg/m2 Gestational weight gain, kg (lbs)
Underweight (<18.5) 12.5 – 18 (28 – 40)
Normal weight (18.5-24.99) 11.5 – 15.9 (25 – 35)
Overweight (25-29.99) 7 – 11.5 (15 – 25)
Obese (>30) 5 – 9 (11 – 20)
Frederick et al. (151) investigated the effect of GWG on infant birth weight in a
prospective study. They collected GWG and birth weight in 2,670 mother-infant pairs in the US.
GWG within 1990 IOM guidelines was associated with reduced risk of both low birth weight and
macrosomia. About half the women in their population gained weight in excess of the 1990 IOM
guideline, and 75.7% of overweight women and 61.8% of obese women gained weight above the
1990 IOM guideline. Women who gained above the 1990 IOM guideline experienced a 76%
increased risk of delivering macrosomic infants compared to women who gained below the
guideline (adjusted RR = 1.76; 95% CI: 1.40 to 2.22). After adjusting for maternal pre-pregnancy
26
BMI, race, and complications during pregnancy, GWG below 15.9 kg was associated with a 51%
lower risk of delivering macrosomic infants (adjusted RR = 0.49; 95% CI: 0.40 to 0.60).
Liu et al. (165) investigated the combined association of pre-pregnancy BMI and GWG
on infant birth weight in 292,568 Chinese women. All information was obtained from a
population-based Perinatal Health Care Surveillance Survey. GWG was defined as the weight
difference between the last prenatal visit and the first prenatal visit. GWG was categorized based
on 2009 IOM GWG guidelines. With increasing GWG, the risk of delivering a low birth weight
or SGA infant decreased and the risk of delivering a macrosomic or LGA infant increased.
Weight gain above 2009 IOM recommendations was associated with an increased risk of LGA
(OR: 1.9; 95% CI: 1.8 to 1.9) and macrosomia (OR: 2.0; 95% CI: 1.9 to 2.1). A statistically
significant interaction was found between pre-pregnancy BMI and GWG for the outcomes of low
birth weight, SGA, macrosomia and LGA (p < 0.01), but not for other outcomes. Mamun et al.
(166) analyzed GWG based on 2009 IOM guidelines and birth weight in 6,632 women
participating in the Mater-University Study of Pregnancy in Australia. Compared to women who
gained adequate weight, women who gained inadequate weight delivered a 190.63 g (95% CI: -
221.05 to -161.20) lighter baby, while women who gained excessive weight delivered a 206.45 g
(95% CI: 178.82 to 234.08) heavier baby. For 0.1 kg/week increase of GWG, each woman
delivered an 81.51 g heavier baby.
Several studies analyzed the effects of GWG on birth weight in different pre-pregnancy
BMI categories (167-169). Thorsdottir et al. (167) identified the effects of different GWG among
women of normal pre-pregnancy BMI on infant birth weight in 200 women. They found high
weight gain during pregnancy resulted in greater birth weight. Infants born to women who gained
18 to 24 kg during pregnancy weighed 286 ± 66 g more than infants born to women who gained 9
to 15 kg during pregnancy (p < 0.001). Sixty-two percent of women who gained 9 to 15 kg during
pregnancy had an infant greater than 3500 g while 80% of women who gained 18 to 24 kg during
pregnancy had an infant greater than 3500 g. They also found GWG to be related to birth weight
27
when a woman’s weight gain was between 9 and 15 kg (r = 0.19, p < 0.001) but not if a woman’s
weight gain was over 18 kg (r = 0.01, p > 0.05). Net GWG and birth weight were also correlated
(r = 0.18, p < 0.001).
Langford et al. (168) analyzed the association between GWG and infant outcomes in
35,576 overweight women (pre-pregnancy BMI: 26 to 29 kg/m2) using Missouri birth certificate
data from 1990 to 2004. They found only 21% women met 1990 IOM recommendations for
GWG and 74% exceeded the recommendations. The cumulative incidences of preeclampsia (RR:
1.71; 95% CI: 1.54 to 1.89), cesarean section (RR: 1.30; 95% CI: 1.24 to 1.36) and macrosomia
(RR: 2.13; 95% CI: 1.94 to 2.33) were higher among women who gained more than
recommended compared to women who gained less or within the recommendations. Jensen et al.
(169) analyzed GWG and pregnancy outcomes in 481 glucose-tolerant obese women in Denmark.
They divided women into 4 groups according to their GWG (< 5.0 kg, 5.0 to 9.9 kg, 10.0 to 14.9
kg, and > 15kg). They found infant birth weight increased significantly across the groups (p <
0.001). The risk of LGA and macrosomia also increased with GWG (p = 0.001) while the risk of
SGA was similar across the groups (p = 0.63).
Several studies have assessed the association between trimester-specific weight gain and
birth weight (170-172). Abrams et al. (170) investigated the maternal weight gain pattern and
birth weight in 2,994 non-obese Caucasian women. They found each kg of maternal gain in the
first, second, and third trimesters to be associated with increases in birth weight of 18.0, 32.8, and
17.0 g, respectively. When compared to weight gain that was adequate in all trimesters,
inadequate weight gain in the first and second trimesters was associated with a significant
decrease in birth weight of 133.0 g and inadequate weight gain in the second and third trimesters
was associated with a significant decrease in birth weight of 88.5 g. Brown et al. (171) examined
389 women and their infants and found each kg of weight gain was related to 20 g increase in
birth weight (p < 0.0001). In the first and second trimester, each kg of weight gained by the
woman predicted a 31 g and 26 g increase in newborn weight, respectively. Maternal weight gain
28
of 0 to 4 kg in the first trimester and 4 to 10 kg in the second trimester was strongly and
positively related to newborn weight. Weight gain in the third trimester was not predictive of
infant birth weight.
A recent study (Child Health and the Development Study) in the US (172) found women
with a lower pre-pregnancy BMI had a higher weight gain during the second and third trimesters
but lower weight gain during first trimester. However women with a higher pre-pregnancy BMI
had a lower weight gain throughout the pregnancy. They found that each kg of GWG was
associated with an increase in birth weight percentile of 1.60 (95% CI: 1.39 to 1.82), a significant
decrease in OR of SGA of 0.89 (95% CI: 0.86 to 0.91), and a significant increase in OR of LGA
of 1.13 (95% CI: 1.10 to 1.17). GWG across all trimesters was significantly and independently
associated with a lower OR of SGA and a higher OR of LGA. Each kg of first trimester weight
gain was associated with an increase in birth weight percentile by 1.94 (95% CI: 0.70 to 3.19) for
women with underweight pre-pregnancy BMI, 1.59 (95% CI: 1.28 to 1.90) for women with
normal pre-pregnancy BMI, and 0.92 (95% CI: 0.43 to 1.40) for women with overweight/obese
pre-pregnancy BMI. No interactions were found between maternal pre-pregnancy BMI and GWG
in the second and third trimesters. Each kg of second trimester GWG was associated with an
increase in birth weight percentile by 1.99 (95% CI: 1.61 to 2.37), and each kg of third trimester
GWG was associated with an increase in birth weight percentile by 1.55 (95% CI: 1.18 to 1.93).
Second trimester GWG was associated with a larger difference in OR for LGA and SGA than the
first and third trimester GWG.
In summary, an independent effect of GWG and a combined effect of pre-pregnancy BMI
and GWG on infant birth weight are found. Increased GWG is associated with an increased infant
birth weight. The effects of the timing of GWG on infant birth weight were not consistent. This
may be due partly to differences between study designs and study populations.
29
1.11. Maternal GWG and infant body composition
Maternal GWG is positively related to neonatal birth weight (151, 163-172). However,
few studies have investigated the changes in the compartments of body weight (amount of FM
and FFM) and no previous study has assessed the relationship between the changes in the
compartments of maternal body weight and neonatal body composition at birth. Two studies
analyzed the association between GWG and maternal body composition (135, 173) and two
studies assessed the relationship between GWG and neonatal body fat (128, 132).
Butte et al. (135) assessed body composition in 63 women using a multi-compartment
model. The compartments measured included TBW by deuterium dilution, body volume by
hydrodensitometry at 9, 22 and 36 weeks and bone mineral content by DXA before or after
pregnancy. GWG was positively correlated with gains in TBW (r = 0.39; p = 0.003), FFM (r =
0.50; p = 0.001) and FM (r = 0.76; p = 0.001). FM gain was the highest in the high BMI group
(BMI 28.8 ± 2.6 kg/m2) compared to the normal BMI group (22.1 ± 1.5 kg/m
2). Birth weight was
positively correlated with changes in TBW (r = 0.37; p = 0.006) and FFM (r = 0.39; p = 0.003)
but not FM (r = 0.05; p = 0.74). Lederman et al. (173) also measured body composition in 200
pregnant women using a four-compartment model. Body density was measured by
hydrodensitometry and TBW was measured by deuterium dilution during pregnancy at weeks 14
and 37. Total bone mineral was measured at 2-4 weeks postpartum by DXA. Women were
divided into 4 groups: underweight (BMI < 19.8 kg/m2; n=21), normal weight (BMI 19.8-26
kg/m2; n=118), overweight (BMI 26-29 kg/m
2; n=29) and obese (BMI > 29 kg/m
2; n=28) by their
pre-pregnancy BMI. Lederman et al. (173) found fat gain between gestational week 14 to 37 was
correlated negatively with pre-pregnancy body weight (r = -0.25; p < 0.0005) and positively
correlated with pregnancy weight gain (r = 0.81; p < 0.0001). A smaller change in FM was found
in the obese group compared to all other groups. Both of these studies reported the composition
of weight gain during pregnancy along with maternal pre-pregnancy BMI. Butte et al. (135)
30
investigated the relationship between GWG and neonatal body composition measured by DXA at
2 weeks after birth, but did not find any relationship.
Two recent studies have shown direct relationship between excessive GWG and neonatal
body fat (128, 132). Crozier et al. (128) reported an association between neonatal and childhood
FM and GWG in a sample of 566 children from the Southampton Women’s Survey. In this study,
about one-half of the women gained excessive weight during pregnancy based on IOM
recommendations (see Table 1.1). Offspring born to women who gained excessive weight during
pregnancy had a greater FM at birth (SD: 0.17; p = 0.03), at 4 years old (SD: 0.17; p = 0.05), and
at 6 years old (SD: 0.30; p = 0.002) compared with offspring born to women with appropriate
GWG. Hull et al. (132) examined the interactive effects of GWG and maternal pre-pregnancy
BMI on neonatal body composition in 306 neonates. About 2/3 of overweight and obese women
gained excessive weight while only 1/3 of normal weight women gained excessively. Regardless
of the GWG, neonates born to obese women had the greatest body fat when compared to
offspring born to normal weight and overweight women. An interaction between GWG and pre-
pregnancy BMI for neonatal body fat was detected in offspring from overweight women. If an
overweight woman gained excessively, her neonate had body fat similar to a neonate born to an
obese woman. This study suggests a relationship between neonatal body fat and GWG with the
relationships varying by maternal pre-pregnancy BMI. Both of the studies showed a positive
relationship between GWG and neonatal body fat, but none of the studies related the maternal
weight gain to maternal body composition (FM, FFM, and TBW) during late pregnancy.
Maternal GWG influences maternal fat retention, neonatal birth weight and neonatal
body composition. The TBW gain is positively related to neonatal birth weight (135). Higher
GWG is related to a greater neonatal birth weight (135) and FM gain (132), which may relate to
childhood body composition (128). However, the relationship between trimester-specific GWG
and infant body composition has not been reported and more studies are needed to elucidate the
association between the timing of GWG and infant body composition.
31
1.12. Maternal body composition and infant birth weight
Studies have related maternal body composition to neonatal birth weight (135, 174-181)
though the results are inconsistent. Lederman et al. (174) measured maternal body weight and
body composition in early (14 weeks) and late (37 weeks) pregnancy in 200 women to examine
the relationship between maternal body fat and TBW in relation to neonatal birth weight. The
results indicate maternal weight and body water at term are significantly associated with neonatal
birth weight, but maternal body fat at term is not. Butte et al. (135) show maternal FFM gains in
the first, second and third trimesters contributed independently to birth weight. Changes in
maternal TBW were independent predictors of birth weight during the second and third trimesters.
However, the gains in maternal FM were not correlated with birth weight.
Other studies have used less sophisticated techniques or techniques that have
questionable validity during pregnancy to explore the relationship between maternal and infant
outcomes. Mardones-Santander et al. (175) measured maternal body composition at 36 weeks in
224 women using deuterium dilution technique and found TBW was the major maternal body
component associated with birth weight. Larciprete et al. (176) examined the link between
maternal body composition and newborn birth weight using bioimpedance analysis (BIA) in 29
women at 36 weeks of gestation. Farah et al. (177) conducted a similar study in 184 non-diabetic
pregnant Caucasian women. These 2 studies were consistent with the results shown by Lederman
et al. (174) and Mardones-Santander et al. (175), i.e., TBW but not FM is the main maternal body
component associated with the newborn weight at term.
Forsum et al. (178) measured maternal body composition in 19 women using the two-
compartment model based on TBW and related maternal body composition to neonatal birth
weight. Neonatal birth weight was positively correlated with maternal total body fat content
before pregnancy and at gestational week 32. In addition, Villar et al. (179) found a significant
association between maternal fat gain early in pregnancy and neonatal birth weight. In this study,
maternal body composition was evaluated 8 times during gestation using anthropometric methods
32
and BIA. Body fat and FFM were calculated with equations specific for pregnant women. Gale et
al. (180) and Ogbonna et al. (181) found a trend of association between maternal fat gain
estimated by the mid-upper arm circumference and neonatal birth weight.
In summary, the results of studies comparing maternal body composition to neonatal
birth weight are inconsistent. Some report a positive relationship between maternal fat free mass
and neonatal birth weight (135, 174-177) while others report a positive relationship between
maternal fat mass and neonatal birth weight (178-181). However, except for the studies by
Lederman et al. (174) and Butte et al. (135), who used a multi-compartment model, all other
studies were based on a two-compartment model, which has been shown to not be valid during
pregnancy. Based on the two studies that used the multi-compartment model to assess maternal
body composition, TBW gain is related to neonatal birth weight (135, 174).
1.13. Maternal body composition and infant body composition
Neonatal body fat is related to childhood body fat (128), which in turn relates to the
development of a variety of health outcomes (182). The majority of research relating maternal
and neonatal body composition has relied on maternal BMI as a marker of adiposity. Body mass
index does not take into account the composition of an individual’s body weight. Forsum et al.
(178) assessed maternal body composition in 23 women before pregnancy, at 32 weeks and 2
weeks postpartum using a two-compartment model based on TBW to assess maternal body
composition. FFM was calculated from TBW using the hydration factors 0.718, 0.747, 0.734
before pregnancy, at 32 weeks and 2 weeks postpartum, respectively. FM was body weight minus
FFM. The average skinfold thickness from 10 sites was used as a surrogate marker of FM in the
neonates. The study found neonatal birth weight was explained by maternal body fat at 32 weeks
and the average of the 10 neonatal skinfold thickness. Neonatal body composition was not
measured.
33
One published study investigated the relationship between maternal body composition
and neonatal body composition. Butte et al. (135) assessed the body composition of 63 women (n
= 17; low weight, n = 34; normal weight and n = 12 as high) using the four-compartment model.
Neonatal body composition was assessed at 2 and 27 weeks of age by DXA. Neonatal body
composition at 2 and 27 weeks of age did not differ among BMI groups. Neonatal body
composition (FM, FFM, %fat) at 2 weeks of age was not correlated with maternal body
composition before, during and after pregnancy. A potential reason for no relationship found may
be due to the BMI groups. The BMI groups and mean ranges Butte et al. (135) used were: low
(18.9 ± 0.8 kg/m2), normal (22.1 ± 1.5 kg/m
2) and high (28.8 ± 2.6 kg/m
2). Therefore the low
group was more closely represented by an underweight BMI, the normal was very lean and the
high was mainly comprised of overweight subjects and a few in the obese BMI range. Likely
Butte’s study was not powered to show a difference or possible relationships that are present in an
obese population. A second potential problem is that Butte et al. (135) measured neonatal body
composition 2 weeks after birth. Neonatal body weight fluctuates after the neonate is born with
gains of about 6 g/per day of fat during the first month of life (113). Many factors influence
neonatal body composition after birth, such as the feeding method. These factors will confound
the evaluation of the relationship between maternal and neonatal body composition. As a result,
measurement of neonatal body composition at birth is most accurate to elucidate the relationship
between maternal and neonatal body composition than measurement at 2 weeks or later after
birth. No study has reported the relationship between maternal body composition and neonatal
body composition at birth. The influence of maternal adipose tissue on neonatal body
composition has yet to be elucidated.
In summary, the maternal environment is very important for fetal growth. Because both
under- and overnutrition during gestation are linked to “metabolic programming” of the fetus,
which may relate to the offspring’s long-term health. Birth weight is the most common outcome
34
measure reflecting fetal experience and maternal anthropometrics such as pre-pregnancy BMI and
GWG reflect maternal energy status. Assessments of maternal and infant body composition are
more sensitive indicators of the maternal and in utero environment. These assessments can
provide more detailed information to clarify how the maternal environment influences fetal
growth and contribute to elucidating the pathways for programming of adult disease.

35
CHAPTER 2
METHODS
36
2.1. Study population
The study population included pregnant women (18-45 years old) without known
infectious disease or illness (e.g. autoimmune disease) regardless of their ethnic and racial
background. The subjects included women who were normal weight (BMI 18.5-24.99 kg/m2)
overweight (BMI 25-29.99 kg/m2) and obese (BMI 30-40 kg/m
2) before pregnancy. The pre-
pregnancy BMI was calculated using self-reported maternal pre-pregnancy body weight and
measured height at the study visit. We recruited 80 women in the study. Forty women (n=22
normal weight, n=10 overweight and n=8 obese) completed all assessments for the primary aim
and 45 women (n=27 normal weight, n=8 overweight and n=10 obese) completed all assessments
for the secondary aim.
2.1.1. Inclusion/exclusion criteria
Women with a pre-pregnancy BMI from 18.5 to 40 kg/m2, carrying a singleton
pregnancy and planned delivery at KU Hospital were recruited. Women with an underweight pre-
pregnancy BMI (< 18.5 kg/m2) or a pre-pregnancy BMI over 40 kg/m
2 were excluded from the
study, as well as women whom were diagnosed with preeclampsia or GDM. Women who
reported smoking, illicit drug use during their pregnancy or who could not communicate in
English were excluded.
2.1.2. Subject recruitment
Women were identified at 28-39 weeks gestation using the IDXterm software by trained
study coordinators. Charts were screened for medically related inclusion and exclusion criteria
under a waiver approved by the Human Subjects Committee at the University of Kansas Medical
Center in Kansas City, KS (KUMC) (#12793). The study coordinators approached eligible
women in the clinic of the Department of Obstetrics and Gynecology at KUMC. If they were
interested, the study was explained and the informed consent obtained. Women completed a
general questionnaire about their health throughout the pregnancy.
37
2.2. Research design
This was an observational study. The primary aim was to identify the relationship
between maternal body composition (FM, FFM and TBW) in late pregnancy and neonatal body
fat at birth. The secondary aim of this study was to determine the relationship between GWG
during the different trimesters and neonatal body composition at birth.
2.2.1. Study visits
There were three planned contacts for this study. The first contact occurred between 34
and 39 weeks gestation when maternal body composition was measured. All of the subjects fasted
at least 1 hour before the visit. TBW and body volume were measured during that visit. The
second contact occurred after delivery when the subject was discharged from the hospital.
Neonatal body composition was measured at this visit (within 24-72 hours after delivery). The
last study visit occurred 2-6 weeks postpartum. Bone mineral content was measured by DXA at
the last study visit.
2.2.2. Measurement of maternal body composition
Maternal body composition was estimated using the four-compartment model of Selinger
(183). The four-compartment model uses the deuterated water technique, a DXA scan, and the
Bod Pod® to quantify water, mineral lean, and body volume, respectively. All subjects had their
FM measured using the four-compartment model late in pregnancy (34 to 39 weeks). The
equation is: % fat = (2.747/BD – 0.714*W/BW + 1.129*B/BW – 2.037)*100 (173); where BD is
body density in g/ml measured by the Bod Pod® using ADP, W is the volume of total body water
in liters measured by deuterium dilution, BW is body weight in kilograms and B is bone mineral
in kilograms measured by DXA. This method is accurate for measuring body composition in
women during pregnancy (173).
2.2.2.1. Body volume
Body volume was measured by the Bod Pod® (CosMed, Concord, CA). Subjects wore
minimal tight fitting clothing (e.g. one-piece swimsuit) and a fitted hat (Allentown Scientific
38
Associates, Inc., Allentown, PA). Body weight was obtained to the nearest 0.01 kg using the Bod
Pod® system’s electronic scale (Tanita, Tokyo, Japan). Body volume was corrected for thoracic
gas volume (TGV), surface area artifact (183) and body density calculated as BD = body mass/
body volume (184). The coefficient of variation for the Bod Pod® is about 0.07-0.22% and has
been validated in adults (185). Measurement of body volume using the Bod Pod® occurred in the
Department of Dietetics and Nutrition Clinical Laboratory at KUMC.
2.2.2.2. Total body water
Deuterium oxide (D2O) was used to assess TBW. Blood samples were collected at
baseline and three hours after oral administration of the D2O between 34 and 39 weeks. TBW was
calculated from D2O by correcting for proton exchange (186). Each subject was given an oral
dose of D2O (ICON, Summit, NJ) at 0.1 g per kg of body weight, weighed in a dose cup (accurate
to ± 0.002 g). At this dose, the D2O concentration is at equilibrium at <0.03 % of body water
(187). The concentration of D2O was measured after lyophilization using a single frequency
infrared-spectrophotometer (Nicolet 380; Thermo Electron, Madison, WI). Total body water
volume was calculated by dividing the dose by net D2O concentration in the specimen. The
typical precision for the TBW measurement is ± 1.0 % (188). The deuterated water method is not
associated with increased risk to the pregnant woman. There is a no observed adverse effect level
of 14 mg/m3, and the deuterium given in this study was much lower than that value. The blood
was processed immediately after collection and plasma was stored at -80ºC for analysis. The
plasma was sent as a batch of all samples by overnight FedEx on dry ice for analysis at St. Luke’s
Hospital in New York City.
2.2.2.3. Bone mineral mass
Bone mineral mass were measured by iDXA (GE Healthcare, Madison, WI) with encore
software (Version 13.50). iDXA simultaneously measures the mass of lean (bone and non-bone
lean tissue) and fat tissue (189) and provides information on bone mineral content and soft tissue
content of the total body and of its regions, such as arms, legs and trunk. Bone and soft tissue
39
composition is determined by variations in the attenuation of the x-ray beam. A total body scan
was used to assess the bone mineral mass of each subject. Because the DXA uses x-ray
technology, subjects were exposed to a radiation during the whole body scan. The dose of the
radiation is 0.004 mSv (189), which is comparable to taking a flight from Los Angeles to New
York City and considered to be well within safe limits. The DXA scans of women took place in
the Division of Endocrinology, Metabolism and Genetics at KUMC in 2 to 6 weeks following
delivery.
2.2.3. Measurement of maternal anthropometry
The height of all women was measured in centimeters using a wall stadiometer (Health o
meter®, Bradford, MA). The participant stood with their back to the stadiometer shoeless, heels
together, back straight, heels, buttocks, shoulders, and head touching the wall and looking straight
ahead. Body weight was measured using the Bod Pod® system’s electronic scale (Tanita, Tokyo,
Japan). The participant was measured with minimal clothing and no shoes. BMI (kg/m2) was
calculated. All of the anthropometry measurements of the pregnant women occurred at late
pregnancy (34 to 39 weeks) in the Department of Dietetics and Nutrition Clinical Laboratory at
KUMC.
2.2.4. Neonatal adiposity and anthropometry
Neonatal crown to heel length was measured to the nearest 0.1 cm using a neonatal Shorr
board (Shorr Productions, Olney, MD) and neonatal body weight was measured during the
measurement of body composition using the Pea Pod® neonatal scale to the nearest 0.01 kg.
Neonatal body composition was measured within 24-72 hours following birth. The Pea Pod®
Body Composition System (CosMed, Concord, CA) was used to assess body volume and to
calculate body density. All clothing and the diaper were removed during the body volume
measurement. Direct measurement of thoracic gas volume (TGV) is not feasible in neonates so it
is estimated (190, 191). Neonatal body composition measurements with the Pea Pod® have been
validated (108, 192). Once a volume measure is obtained, body density is calculated and
40
converted to % fat by the equation %fat = (FM/BM)*100% (193) (BM is body weight). FM is
calculated by the equation BM/BD = FM/Dfm + FFM/Dffm (194) (BD is body density, Dfm is FM
density, and Dffm is FFM density). Dfm is constant throughout life as 0.9007 g/ml (194). Dffm
changes during growth (195) so age and gender specific Dffm values are used in calculating %fat
(112). All of these tests were conducted by trained staff when the mother is discharged from the
hospital in Department of Dietetics and Nutrition Clinical Laboratory at KUMC.
2.2.5. Measurement of GWG
GWG was calculated from self-reported pre-pregnancy weight and the delivery weight
from the medical record. Good agreement has been reported between maternal recall of pre-
pregnancy weight and medical records for pre-pregnancy weight (196, 197). Self-reported pre-
pregnancy weight is considered a satisfactory substitute when medical chart extraction is
unavailable (197). Maternal GWG during the 1st (0 to 13 weeks), 2
nd (14 to 28 weeks) and 3
rd (29
weeks to delivery) trimesters was calculated using data from the medical records minus their pre-
pregnancy weight. Since the time between body weight measures varied, the absolute weight gain
within each trimester was divided by the weeks within that period to derive a weight gain/week
for each trimester.
2.3. Statistical analyses
Linear regression modeling was used to explore the relationships between the maternal
and infant variables. The specific analysis for each aim is described below. To determine which
maternal and infant confounding variables to include in the models, bivariate correlations were
performed between infant body composition (%fat, FM, FFM) and the following maternal and
infant variables known to be related to infant body composition: maternal age, pre-pregnancy
BMI, maternal ethnicity, parity, smoking history, neonatal age at test, gender and gestational age.
Once the significant variables were identified, correlations between the confounding variables
were performed to identify any inter-relationships between confounding variables (collinearity).
41
Once the final model was identified, stepwise hierarchical regression was performed to find and
remove the least significant variable. Only statistically significant variables were retained in the
final model. Significance level was p ≤ 0.05 and analyses were performed using SPSS v20.0
(SPSS Inc., Chicago, IL).
Aim 1: Determine the relationship between maternal body composition (FM, FFM and TBW)
and neonatal body fat at birth.
Multiple linear regression analysis was used to determine which maternal factors were
related to neonatal outcome variables. The dependent variable in the model was neonatal body
composition (% fat, FM, FFM). The independent variables were maternal FM, FFM and TBW.
The following variables were included as covariables in the final models: maternal age, neonatal
age at test, gender, and gestational age.
Aim 2: Examine the relationship between maternal GWG during each trimester and neonatal
body composition at birth.
Multiple linear regression modeling was used to examine the relationship between GWG
during the 1st, 2
nd and 3
rd trimesters and neonatal body composition (FM, FFM, and %fat).
Neonatal FM, FFM and %fat were the dependent variables. The independent variables were
maternal GWG in 1st, 2
nd, and 3
rd trimester. The following variables were included as covariables
in the final models: maternal pre-pregnancy BMI, neonatal age at test, gender and gestational age.
Maternal pre-BMI was explored as a continuous variable and categorized as normal weight,
overweight and obese. Interaction between trimester-specific GWG and each maternal pre-
pregnancy BMI category were also explored. Simple linear regression models were used when
assessing the interaction since our sample is small, no covariables was included in the models.
2.3.1. Statistical power
The primary aim of this study was to determine the relationship between maternal body
composition and neonatal body composition. Power calculations were based on prior research
examining the impact of maternal pre-pregnancy BMI on the offspring’s adiposity (131). The
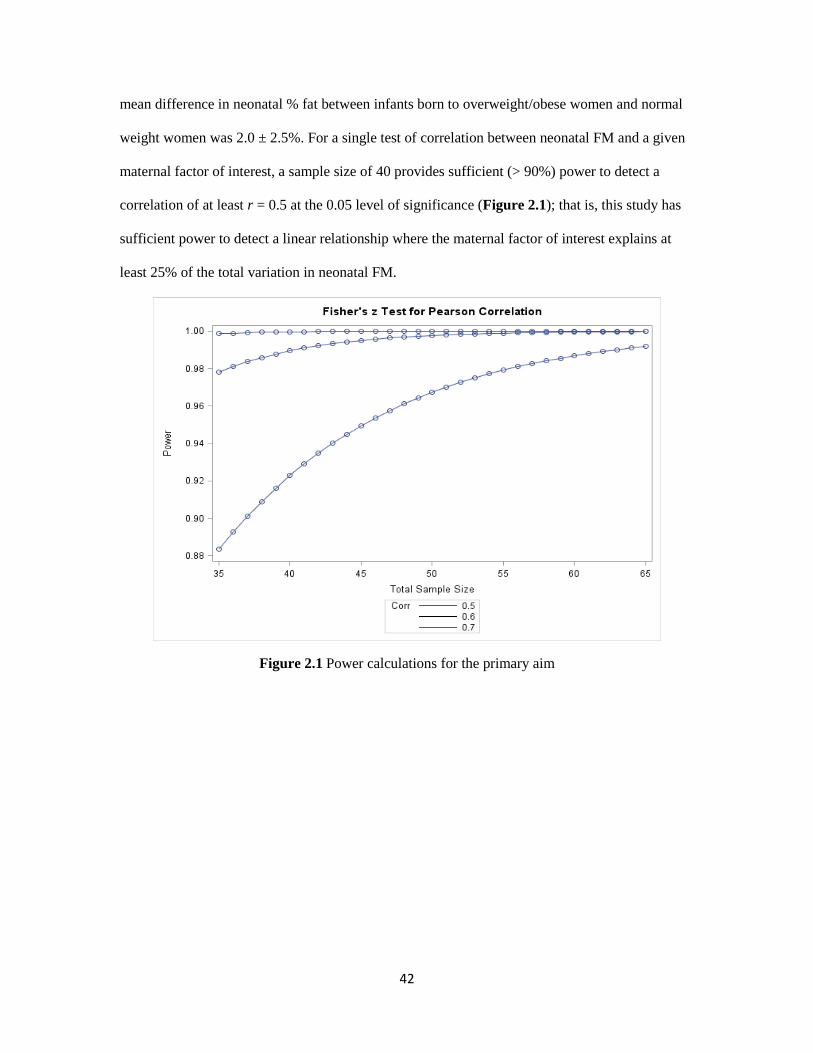
42
mean difference in neonatal % fat between infants born to overweight/obese women and normal
weight women was 2.0 ± 2.5%. For a single test of correlation between neonatal FM and a given
maternal factor of interest, a sample size of 40 provides sufficient (> 90%) power to detect a
correlation of at least r = 0.5 at the 0.05 level of significance (Figure 2.1); that is, this study has
sufficient power to detect a linear relationship where the maternal factor of interest explains at
least 25% of the total variation in neonatal FM.
Figure 2.1 Power calculations for the primary aim
43
CHAPTER 3
MATERNAL BODY COMPOSITION LATE GESTATION
AND NEONATAL BODY COMPOSITION AT BIRTH
44
3.1. Abstract
Background: Infant birth weight and body composition is directly related to maternal pre-
pregnancy BMI but it is unknown how infant body composition measured at birth relates to
maternal body composition.
Objective: To evaluate how maternal body composition late in pregnancy relates to neonatal
body composition at birth.
Methods: Healthy pregnant women with a pre-pregnancy BMI between 18.5 and 39.99 kg/m2
were enrolled in the study at 28 to 39 weeks gestation. Maternal body composition was measured
using the four-compartment model between 34 to 39 weeks gestation. Neonatal body composition
was measured using air displacement plethysmography (Pea Pod®) within 1-3 days after birth.
Multiple linear regression models were used to assess the relationship between maternal body
composition and neonatal body composition. Neonatal body composition measures (fat mass
(FM), fat free mass (FFM), and percentage body fat (% fat)) were the dependent variables and
maternal body composition measures (FM, FFM, total body water (TBW) and % fat) were the
independent variables. Maternal age, neonatal age at test, gender and gestational age were used as
cofounding variables in this model. The level of statistical significance was set at p ≤ 0.05.
Results: We measured the body composition of 40 mother-infant pairs. Maternal FFM predicted
neonatal birth weight (r2 = 0.280, p = 0.011) and neonatal FFM (r
2 = 0.521, p = 0.011). Maternal
TBW also predicted neonatal birth weight (r2 = 0.330, p = 0.007) and neonatal FFM (r
2 = 0.519, p
= 0.011). A nonsignificant trend was found between maternal FM and neonatal birth weight (r2 =
0.224; p = 0.053) and neonatal FM (r2 = 0.052; p = 0.085).
Conclusion: Maternal FFM and TBW are related to neonatal FFM but not FM.
45
3.2. Introduction
Suboptimal intrauterine environment affects the fetal development. Baker et al. (21) have
proposed that fetal growth altered by maternal factors may be in part responsible for long-term
ramifications such as obesity (198), cardiovascular diseases (23) and type 2 diabetes (199). The
intrauterine environment is crudely assessed by neonatal birth weight, which could also be used
as a marker for future diseases development. It is known that Individuals with a birth weight at
either the low end (< 5 lbs) or at the high end (> 7 lbs) of the birth weight distribution have a
higher risk of later obesity (34, 35).
Studies have related maternal body composition to neonatal birth weight (135, 174, 177).
Maternal total body water (TBW) late in gestation (at 37 weeks) but not fat mass (FM) has been
shown positively related to infant birth weight (174). However, birth weight does not quantify
what comprises neonatal body mass: FM and fat free mass (FFM). Catalano et al. (106) found
FM in term neonates accounted for only 14% of birth weight but explained 46% of the variance
in birth weight. For those reasons, infant body composition may be a better marker to assess fetal
growth compared to birth weight.
Recent advancements have allowed for the assessment of neonatal body composition
(107-109). Understanding maternal factors that influence the amount of adiposity at birth is
critical as neonatal FM is related to childhood levels of FM (128). Evidence suggests a direct
relationship between maternal pre-pregnancy body mass index (BMI) and neonatal FM at birth
(125, 131). Infants born to overweight and obese women before pregnancy have higher body fat
compared to infants born to normal weight women (125, 131). However, standard weight and
height measurements provide only estimates of maternal adiposity but do not quantify maternal
body composition (FM and FFM). Variance in the composition of pregnant women’s body may
be crucial in determining the relationship between maternal environment and fetal growth. It is
not clear whether maternal fat or water contributes to infant body fat at birth. Only one study
evaluated the association between maternal and infant body composition (135) and no
46
relationship was found between maternal and infant body composition; however, infant body
composition was measured at 2 weeks of age, which could be influence by ex utero environment.
No study has related maternal body composition during pregnancy to neonatal body composition
when measured at birth.
The objective of this study was to relate maternal body composition measured late in
pregnancy and body composition of their neonates at 1-3 days following birth and to evaluate the
relationship between maternal environment and neonate body fat at birth.
3.3. Materials and Methods
3.3.1. Study population
Pregnant women (18-45 years old) without known infectious disease or illness (e.g.
autoimmune disease) were recruited from 28 to 39 weeks gestation regardless their ethnic and
racial background. Exclusion criteria included: Women with a pre-pregnancy BMI < 18.5 kg/m2
or ≥ 40 kg/m2 , women who had multiple gestation (twins or triplets), women who were
diagnosed with preeclampsia or gestational diabetes mellitus (GDM), self-reported smoking and
illicit drug use during their pregnancy and women who did not speak English. Women were
recruited between January 2012 and March 2013 at their prenatal care visits to clinics of
University of Kansas Hospital in Kansas City. The study was approved by the University of
Kansas Medical Center (KUMC) Institutional Review Board (IRB) (#12793), and all subjects
provided written informed consent. A questionnaire was distributed at enrollment to collect
women’s demographic and baseline information. Pre-pregnancy BMI was calculated using self-
reported maternal pre-pregnancy body weight and measured height at the study visit.
3.3.2. Measurement of maternal anthropometry
Height was measured in centimeters using a wall stadiometer (Health o meter®, Bradford,
MA). The participants stood with their backs to the stadiometer shoeless, heels together, back
straight, heels, buttocks, shoulders, and head touching the wall and looking straight ahead. Body
47
weight was measured during the measurement of body composition using the Bod Pod® system’s
electronic scale (Tanita, Tokyo, Japan). The participant was measured with minimal tight fitting
clothing (e.g. one-piece swimming suit) and no shoes.
3.3.3. Measurement of maternal body composition
Maternal body composition was measured between 34 and 39 weeks gestation using the
four-compartment model of Selinger (183). The four-compartment model measures TBW, bone
mineral content (BMC), and body volume using the deuterated water technique, dual x-ray
absorptiometry (DXA), and the Bod Pod®, respectively. All subjects had their FM measured
using the four-compartment model late in pregnancy (34 to 39 weeks). To determine the % fat we
used the equation (2.747/BD – 0.714*W/BW + 1.129*B/BW – 2.037)*100 (173); where BD is
body density in kg/L determined by the equation BW (kg)/body volume (L), W is TBW in liters,
BW is body weight in kilograms measured by an electronic scale (Tanita, Tokyo, Japan) and B is
BMC in kilograms. This method is a valid measure of body composition during pregnancy (173).
Body volume was measured by the Bod Pod® (CosMed, Concord, CA). Subjects wore
minimal tight fitting clothing (e.g. one-piece swimsuit) and a fitted hat (Allentown Scientific
Associates, Inc., Allentown, PA). Body weight was obtained to the nearest 0.01 kg using an
electronic scale (Tanita, Tokyo, Japan). Body volume was corrected for thoracic gas volume and
surface area artifact (183). Body density was calculated as BD = body mass/body volume (184).
The coefficient of variation for the Bod Pod® is about 0.07-0.22% and has been validated in
adults (185).
To determine TBW, blood samples were collected at baseline and three hours after oral
administration of 10g D2O (ICON, Summit, NJ) that weighed in a dose cup (accurate to ± 0.002
g). At this dose, the D2O concentration is at equilibrium at <0.03% of body water (187).The blood
was processed immediately after collection and plasma was preserved at -80ºC for analysis. TBW
was calculated from D2O by correcting for proton exchange (186). The concentration of D2O was
measured after lyophilization using a single frequency infrared-spectrophotometer (Nicolet 380;
48
Thermo Electron, Madison, WI). TBW volume was calculated by dividing the dose by net D2O
concentration in the specimen. Typical precision for the TBW measurement is ± 1.0% (188). The
deuterated water method is not associated with increased risk to the pregnant woman. The no
observed adverse effect level is 14 mg/m3, and the deuterium given in this study was much lower.
BMC was measured by iDXA (GE Healthcare, Madison, WI) with encore software
(Version 13.50). iDXA simultaneously measures the mass of lean (bone and non-bone lean tissue)
and fat (189) and provides information on both BMC and soft tissue content of the total body and
of its regions, such as arms, legs and trunk. Bone and soft tissue composition are determined by
variations in the attenuation of the x-ray beam. A total body scan was used to assess the bone
mineral mass of each subject at 2 weeks following delivery.
3.3.4. Measurement of neonatal body composition and anthropometry
Neonatal crown to heel length was measured to the nearest 0.1 cm using a calibrated
length board (Shorr Productions, Olney, MD) and neonatal body weight was measured using the
Pea Pod® neonatal scale to the nearest 0.01 kg. Neonatal body composition was measured within
1-3 days following birth. The Pea Pod® Body Composition System (CosMed, Concord, CA)
(ADP) was used to measure body volume and to calculate body density. All clothing and the
diaper were removed during body volume measurement. Direct measurement of thoracic gas
volume is not feasible in neonates so it was estimated (190, 191). Neonatal body composition
measurements with the Pea Pod® have been validated (108, 192). Once a volume measure was
obtained, body density was calculated and converted to % fat = (FM/BM)*100% (193) (BM is
body weight). FM was calculated by the equation BM/BD = FM/Dfm + FFM/Dffm (194) (BD is
body density, Dfm is FM density, and Dffm is FFM density). Dfm = 0.9007 g/mL and is constant
(194). Dffm changes during growth and differs in male and female (195) therefore age and gender
specific Dffm values were used to calculate % fat (112). The neonatal body composition and
anthropometrics were obtained at the time of hospital discharge.
49
3.3.5. Statistical analyses
Multiple linear regression analyses were used to determine which neonatal body
composition variables were related to maternal factors. The independent variables were maternal %
fat, FM, FFM and TBW. The dependent variables in the model were neonatal % fat, FM, and
FFM. Bivariate correlations were performed between infant body composition (%fat, FM, FFM)
and the following maternal and infant variables previously related to infant body composition:
maternal age, pre-pregnancy BMI, maternal ethnicity, parity, smoking history, neonatal age at test,
gender and gestational age. The following variables were included as covariables in the final
models: maternal age, neonatal age at test, gender, and gestational age. Correlations between the
confounding variables were performed to identify any inter-relationships between confounding
variables (collinearity). Pearson correlations between all variables were shown in Table 3.1.
Stepwise hierarchical regression was performed in the final model and the least significant
variable was removed. Only significant variables were retained in the final model. Descriptive
statistics and analysis of variance were used to determine if differences between pre-pregnancy
BMI groups existed for the maternal and neonatal baseline characteristics. Tukey’s post hoc
pairwise comparisons between BMI groups were performed. Significance level was p ≤ 0.05 and
analyses were performed using SPSS v20.0 (SPSS Inc., Chicago, IL).
3.4. Results
Eighty pregnant women were enrolled in the study and forty mother-infant pairs
completed the study (Figure 3.1). Maternal characteristics are presented in Table 3.2. Maternal
age, smoking history, parity, gestational age at test, height and gestational weight gain (GWG)
were not different between the normal weight and overweight/obese groups classified by maternal
pre-pregnancy BMI. Maternal ethnicity was not balanced between groups. Most of the African-
American women in this study were classified as overweight/obese before pregnancy and most of
the Caucasian women in this study were classified as normal weight before pregnancy.
50
Overweight/obese group had higher maternal % fat (p < 0.001), FM (p < 0.001), FFM (p = 0.001)
and TBW (p = 0.003) when compared to the normal weight group. Maternal BMC was not
different between the groups.
Neonatal characteristics are presented in Table 3.3. Infants born to overweight/obese
women were older at test compared to infants born to normal weight women (p = 0.041).
Between the normal weight and overweight/obese groups, unadjusted neonatal gestational age,
birth weight, birth length, FM, FFM and % fat did not differ.
3.4.1. Predicting neonatal birth weight
Maternal FFM (r2 = 0.280; p = 0.011) and TBW (r
2 = 0.330; p = 0.007) were correlated
with neonatal birth weight after adjusting for neonatal gestational age. When neonatal gestational
age was held constant, a unit increase of maternal FFM and TBW led to an increase in birth
weight by 21g and 29g, respectively. The relationship between maternal FM and infant birth
weight approached significance (r2 = 0.224; p = 0.053). Maternal % fat and BMC did not
correlate with neonatal birth weight (Table 3.4).
3.4.2. Predicting neonatal body composition (%fat, FM and FFM)
Relationships between maternal body composition and neonatal % fat, FM, and FFM are
presented in Tables 3.5, 3.6 and 3.7, respectively. Maternal FFM and TBW were related to
neonatal FFM (r2 = 0.521, p = 0.011; r
2 = 0.519, p = 0.011, respectively) after adjusting for
neonatal gestational age and gender. When neonatal gestational age and gender held constant, a
unit increase of maternal FFM and TBW led to an increase in neonatal FFM by 12g and 16g,
respectively. Several relationships between maternal body composition and neonatal body fat
showed a nonsignificant trend: maternal TBW and neonatal % fat (r2 = 0.146; p = 0.097),
maternal FM and neonatal FM (r2 = 0.052; p = 0.085) and maternal FM and neonatal FFM (r
2 =
0.466; p = 0.098). Maternal BMC did not relate to neonatal body composition.
51
3.5. Discussion
This is the first study to show a relationship between maternal body composition late in
pregnancy and neonatal body composition at birth. Maternal FFM and TBW were directly related
to neonatal FFM. However, maternal %fat and FM were not related to neonatal body composition.
The relationship between maternal FM and neonatal FM approached significance. We found that
maternal FFM and TBW but not FM was associated with higher neonatal birth weight.
Reports regarding the relationship between maternal body composition and infant birth
weight are conflicting. Lederman et al. (174) investigated maternal body composition changes
between 14 to 37 weeks gestation using the four-compartment model and found maternal weight
and TBW, but not maternal FM at 37 weeks was directly related to birth weight. Likewise, Butte
et al. (135) measured maternal body composition changes from pre-pregnancy to 36 weeks of
gestation using the four-compartment model and found birth weight was positively correlated to
the total gain in TBW, and FFM, but not FM. Mardones-Santander et al. (175) measured maternal
body composition at 36 weeks of gestation using deuterium dilution and found that both maternal
FFM and FM were related to infant birth weight. The correlation was greater for FFM compared
to FM. In our study, we showed that FFM and TBW were the most important maternal body
composition compartments that influenced birth weight followed by FM, which was partly
consistent with Lederman and Butte’s reports. However, both Lederman and Butte captured the
changes of maternal body composition and our study was a cross-sectional study that measured
maternal body composition late in pregnancy which combined the pre-pregnancy body fat and fat
gain during gestation together. It could be the pre-pregnancy body fat but not fat gain during
pregnancy that is the important factor predicting neonatal birth weight since we found
overweight/obese women had higher body fat and FFM compared to normal weight women.
Neonatal body composition compared to birth weight reflects gestational fetal growth.
We found no difference in neonatal body composition among maternal normal weight and
overweight/obese pre-pregnancy BMI groups. However, Sewell et al. (125) showed maternal
52
pre-pregnancy BMI was positively associated to neonatal FM but not FFM while Hull et al. (131)
showed neonates born to overweight/obese women had significantly higher FM but lower FFM
compared to neonate born to normal weight women. Small numbers in overweight/obese group
might be the reason that we had different results compared to earlier reports. Our study was not
powered to find group differences by pre-pregnancy BMI but instead powered to detect a
relationship between variables.
Only one previous study assessed the relationship between maternal body composition
and neonatal body composition (135). Butte et al. (135) reported that maternal body composition
before pregnancy and at 2 weeks after delivery did not correlate with neonatal body composition
(FFM, FM, % fat, BMC and bone mineral density) at 2 weeks of age in 63 mother-infant pairs.
Neither did maternal GWG or TBW, FFM and FM gains during pregnancy related to neonatal
body composition at 2 weeks of age. However, during the first 2 weeks of life, infant body weight
fluctuated and this fluctuation could be influenced by the postnatal environment, such as feeding
patterns. Assessing neonatal body composition at 2 weeks introduces error that may have masked
the effect of maternal environment on fetal growth which assessed by neonatal body composition.
Our study is the first study linked maternal body composition late in pregnancy to neonatal body
composition at birth.
The mechanism underlying the relationship between maternal TBW and neonatal FFM is
not clear. One hypothesis we propose is that higher maternal TBW is related to a higher level of
inflammation and lower level of maternal adiponectin, which increases the placental
transportation of amino acids to fetus. Jansson et al. (200) found protein expression of the sodium
dependent neutral amino acid transporter 2, which is a system A amino acid transport isoform,
was positively related to maternal early pregnancy BMI and birth weight. Jones et al. (201)
showed maternal adiponectin attenuates insulin signaling in primary human trophoblast cells and
inhibits insulin-stimulated placental amino acid transport. It is known that overweight/obese
women have lower adiponectin levels when compared to lean women. In our study,
53
overweight/obese women had higher TBW during the third trimester compared to normal weight
women. We also found a negative trend (p = 0.079) between maternal TBW and total serum
adiponectin level after controlling for the pre-pregnancy BMI (data not shown). As a result, the
relationship between maternal adiponectin level and placental amino acid transportation could be
an explanation for the association between maternal TBW and neonatal FFM. The association
among maternal TBW, adiponectin level and placental transportation of amino acids may have
important implications for placental nutrient transport and fetal growth in pregnancy
complications.
Maternal hormone changes during pregnancy might be another reason underlying the
relationship between maternal and infant body composition. It has been shown that maternal
insulin resistance and glucose production rate are associated with fetal growth (202, 203).
Research has shown that maternal glucose production explains 31% of the variance in estimating
fetal weight (204). Ahlsson et al. (204) found maternal insulin resistance and glucose production
were positively related to maternal pre-pregnancy BMI in nondiabetic pregnant women. Since
glucose is considered to be the most important fuel for the fetus, the positive association found
between maternal glucose production and the fact that insulin is increased with maternal pre-
pregnancy BMI may explain the relationship between maternal body composition and infant body
composition. However, in our study, we did not measure maternal glucose levels to prove this
potential mechanism. Further studies are needed to demonstrate this mechanism.
A strength of our study was that we used four-compartment model to measure maternal
body composition during pregnancy. Assessment of maternal body composition during pregnancy
is complicated because the composition of lean tissue changes during pregnancy. The hydration
of FFM changes during pregnancy due to the increase of plasma volume (133) and the amniotic
fluid volume (134). Lederman et al. (174) showed the major increase in maternal nonfat tissue
during pregnancy is the increase of 6 to 7 liters of water, little or no increase in bone or
carbohydrate, and less than 1 kg increase in protein. Thus the common two-compartment model
54
of assessing body composition is not valid during pregnancy. A second strength of our study was
that we assessed neonatal body composition soon after birth using ADP, which avoided the
potential influence of the postnatal environment on neonatal body composition, such as feeding
patterns.
There are also limitations to our study. First, we had a small sample size (n=40). Second,
this was a cross-sectional study. We did not have repeated measures on maternal body
composition and did not capture the changes in maternal body composition during pregnancy so
we could not investigate if the components of body weight or the components of GWG relate
differently to neonatal body composition. Future studies are needed to clarify these relationships.
Third, because of our sample size, we correlated each of our dependent and independent variables
in separate models. We ran 20 regression models in total using the same data, which increased
our type I error probability.
In conclusion, this is the first study to assess the relationship between maternal body
composition during pregnancy and neonatal body composition soon after birth. Maternal body
composition late in pregnancy was related to neonatal body composition at birth. Maternal FFM
and TBW were related to neonatal birth weight and FFM. Maternal FM was not significantly
related to neonatal FM but at a borderline significance. Studies with larger sample size across
BMI ranges are needed to validate our results and to clarify the relationships between component
of GWG and neonatal body composition.

55
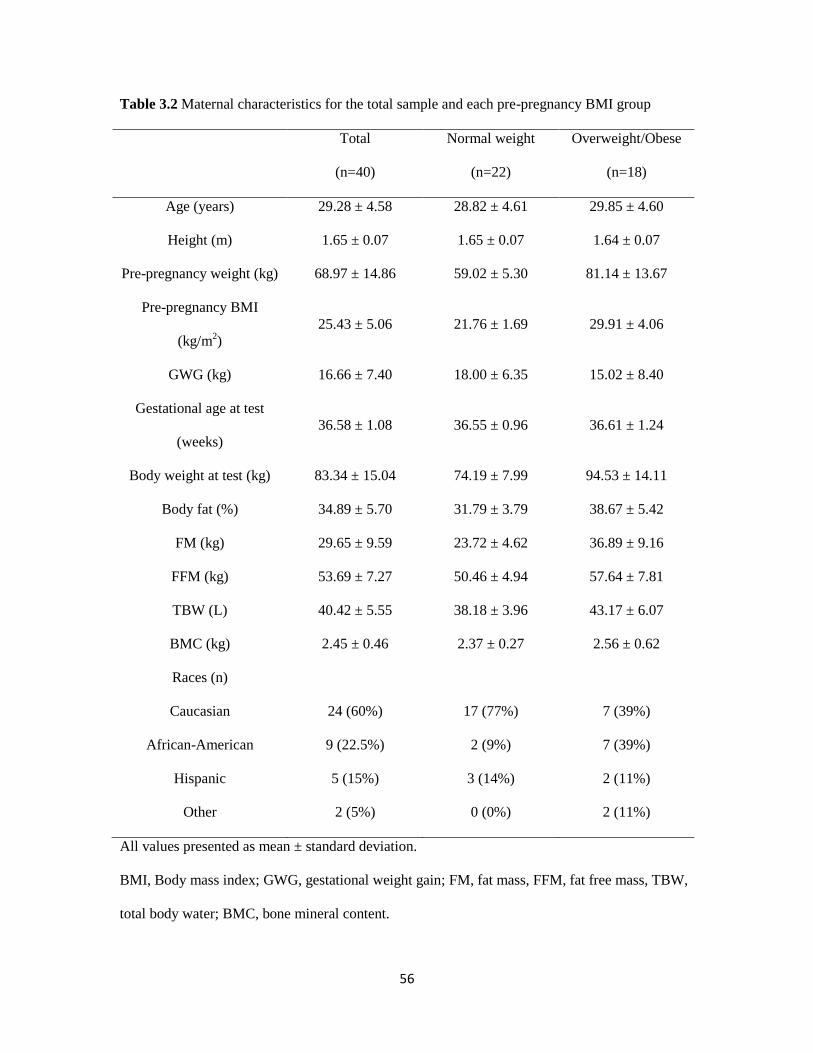
56
Table 3.2 Maternal characteristics for the total sample and each pre-pregnancy BMI group
Total
(n=40)
Normal weight
(n=22)
Overweight/Obese
(n=18)
Age (years) 29.28 ± 4.58 28.82 ± 4.61 29.85 ± 4.60
Height (m) 1.65 ± 0.07 1.65 ± 0.07 1.64 ± 0.07
Pre-pregnancy weight (kg) 68.97 ± 14.86 59.02 ± 5.30 81.14 ± 13.67
Pre-pregnancy BMI
(kg/m2)
25.43 ± 5.06 21.76 ± 1.69 29.91 ± 4.06
GWG (kg) 16.66 ± 7.40 18.00 ± 6.35 15.02 ± 8.40
Gestational age at test
(weeks)
36.58 ± 1.08 36.55 ± 0.96 36.61 ± 1.24
Body weight at test (kg) 83.34 ± 15.04 74.19 ± 7.99 94.53 ± 14.11
Body fat (%) 34.89 ± 5.70 31.79 ± 3.79 38.67 ± 5.42
FM (kg) 29.65 ± 9.59 23.72 ± 4.62 36.89 ± 9.16
FFM (kg) 53.69 ± 7.27 50.46 ± 4.94 57.64 ± 7.81
TBW (L) 40.42 ± 5.55 38.18 ± 3.96 43.17 ± 6.07
BMC (kg) 2.45 ± 0.46 2.37 ± 0.27 2.56 ± 0.62
Races (n)
Caucasian 24 (60%) 17 (77%) 7 (39%)
African-American 9 (22.5%) 2 (9%) 7 (39%)
Hispanic 5 (15%) 3 (14%) 2 (11%)
Other 2 (5%) 0 (0%) 2 (11%)
All values presented as mean ± standard deviation.
BMI, Body mass index; GWG, gestational weight gain; FM, fat mass, FFM, fat free mass, TBW,
total body water; BMC, bone mineral content.
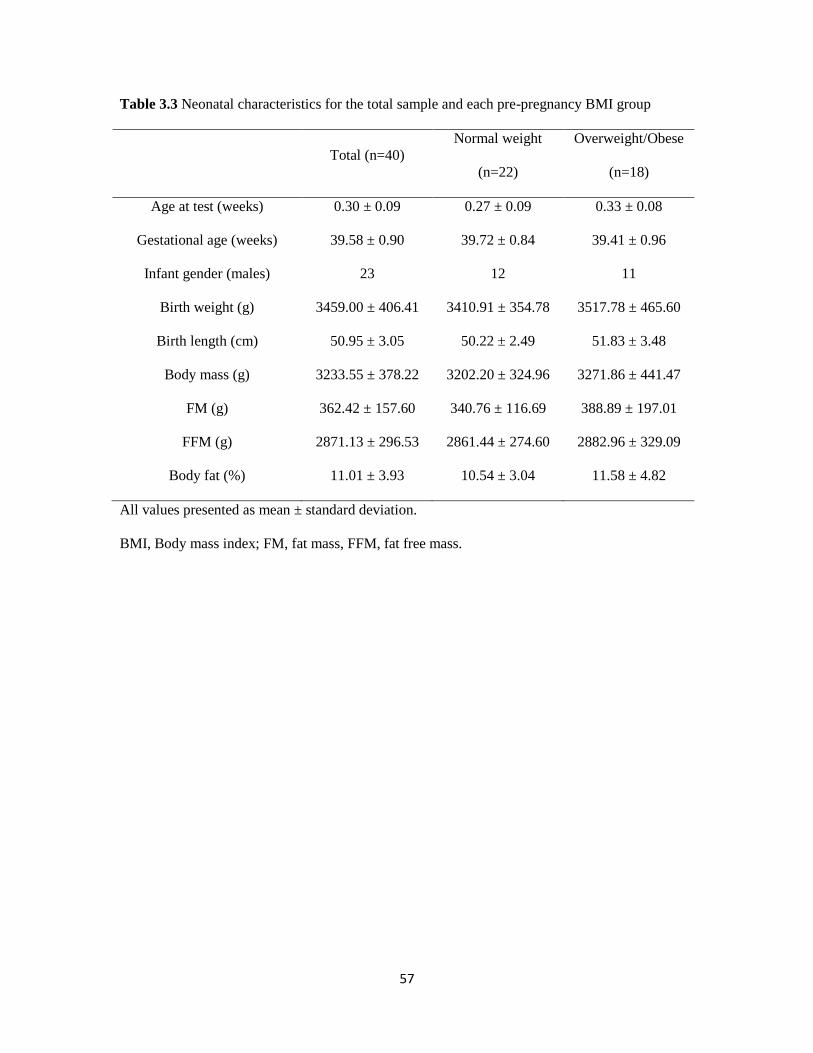
57
Table 3.3 Neonatal characteristics for the total sample and each pre-pregnancy BMI group
Total (n=40)
Normal weight
(n=22)
Overweight/Obese
(n=18)
Age at test (weeks) 0.30 ± 0.09 0.27 ± 0.09 0.33 ± 0.08
Gestational age (weeks) 39.58 ± 0.90 39.72 ± 0.84 39.41 ± 0.96
Infant gender (males) 23 12 11
Birth weight (g) 3459.00 ± 406.41 3410.91 ± 354.78 3517.78 ± 465.60
Birth length (cm) 50.95 ± 3.05 50.22 ± 2.49 51.83 ± 3.48
Body mass (g) 3233.55 ± 378.22 3202.20 ± 324.96 3271.86 ± 441.47
FM (g) 362.42 ± 157.60 340.76 ± 116.69 388.89 ± 197.01
FFM (g) 2871.13 ± 296.53 2861.44 ± 274.60 2882.96 ± 329.09
Body fat (%) 11.01 ± 3.93 10.54 ± 3.04 11.58 ± 4.82
All values presented as mean ± standard deviation.
BMI, Body mass index; FM, fat mass, FFM, fat free mass.
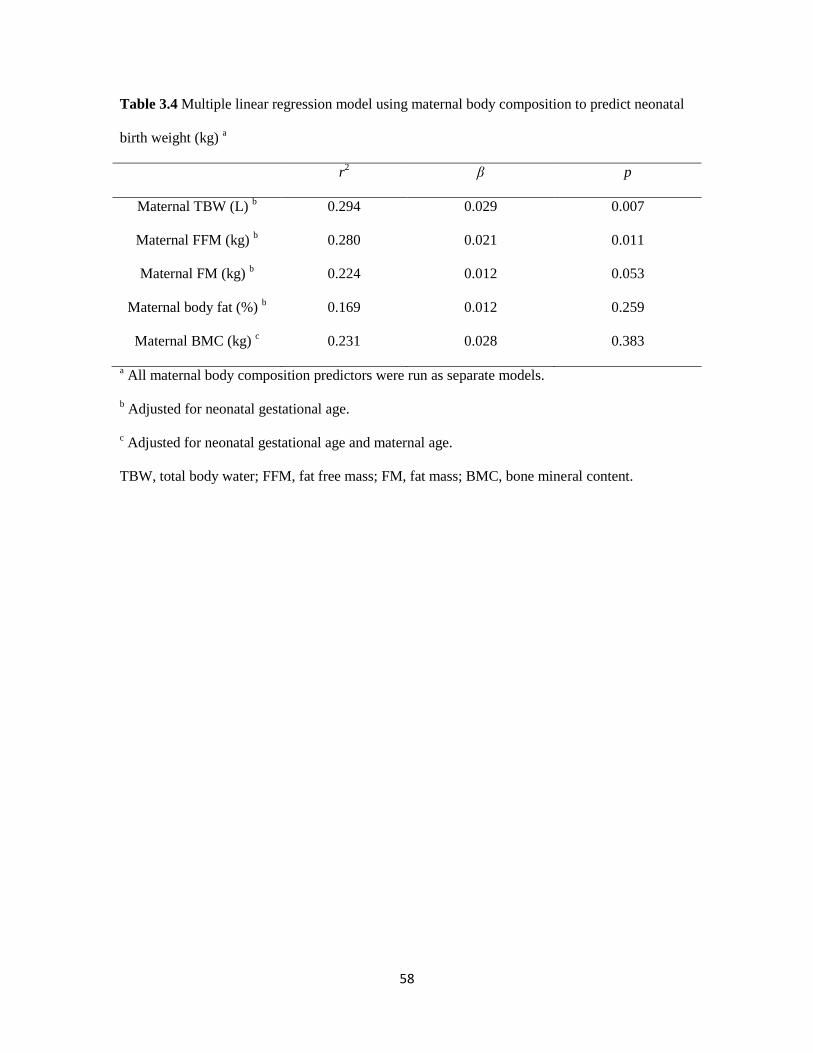
58
Table 3.4 Multiple linear regression model using maternal body composition to predict neonatal
birth weight (kg) a
r2 β p
Maternal TBW (L) b 0.294 0.029 0.007
Maternal FFM (kg) b 0.280 0.021 0.011
Maternal FM (kg) b 0.224 0.012 0.053
Maternal body fat (%) b 0.169 0.012 0.259
Maternal BMC (kg) c 0.231 0.028 0.383
a All maternal body composition predictors were run as separate models.
b Adjusted for neonatal gestational age.
c Adjusted for neonatal gestational age and maternal age.
TBW, total body water; FFM, fat free mass; FM, fat mass; BMC, bone mineral content.
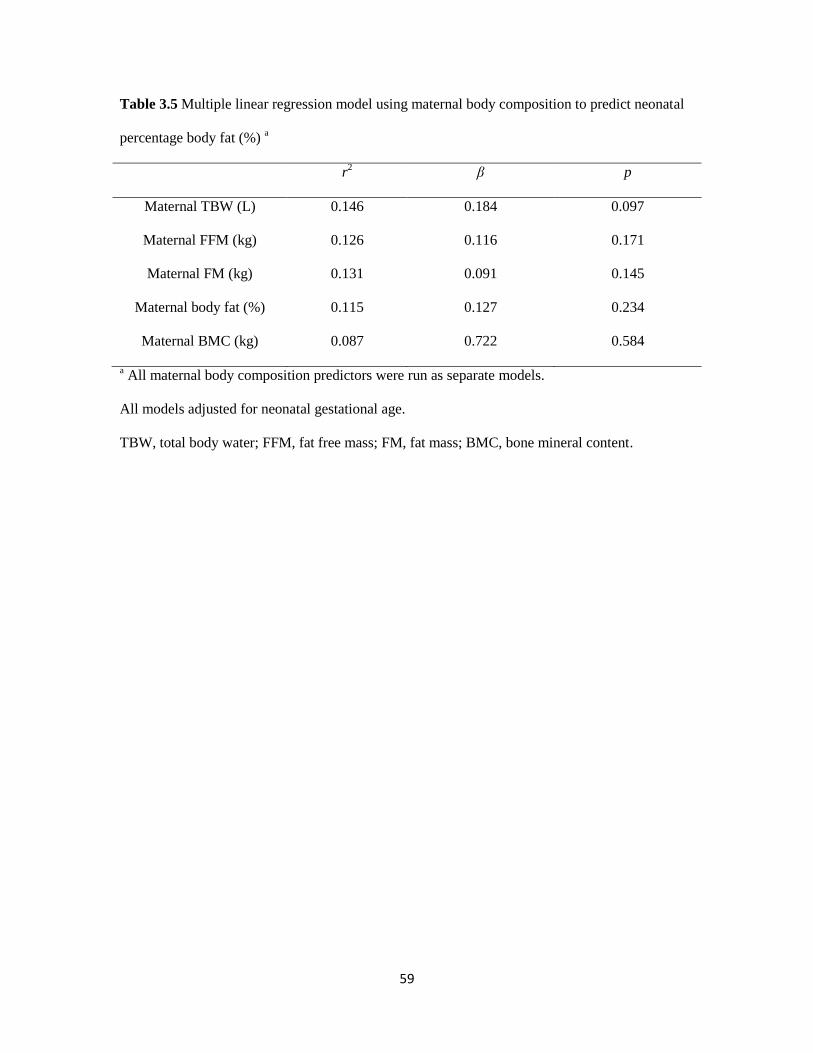
59
Table 3.5 Multiple linear regression model using maternal body composition to predict neonatal
percentage body fat (%) a
r2 β p
Maternal TBW (L) 0.146 0.184 0.097
Maternal FFM (kg) 0.126 0.116 0.171
Maternal FM (kg) 0.131 0.091 0.145
Maternal body fat (%) 0.115 0.127 0.234
Maternal BMC (kg) 0.087 0.722 0.584
a All maternal body composition predictors were run as separate models.
All models adjusted for neonatal gestational age.
TBW, total body water; FFM, fat free mass; FM, fat mass; BMC, bone mineral content.
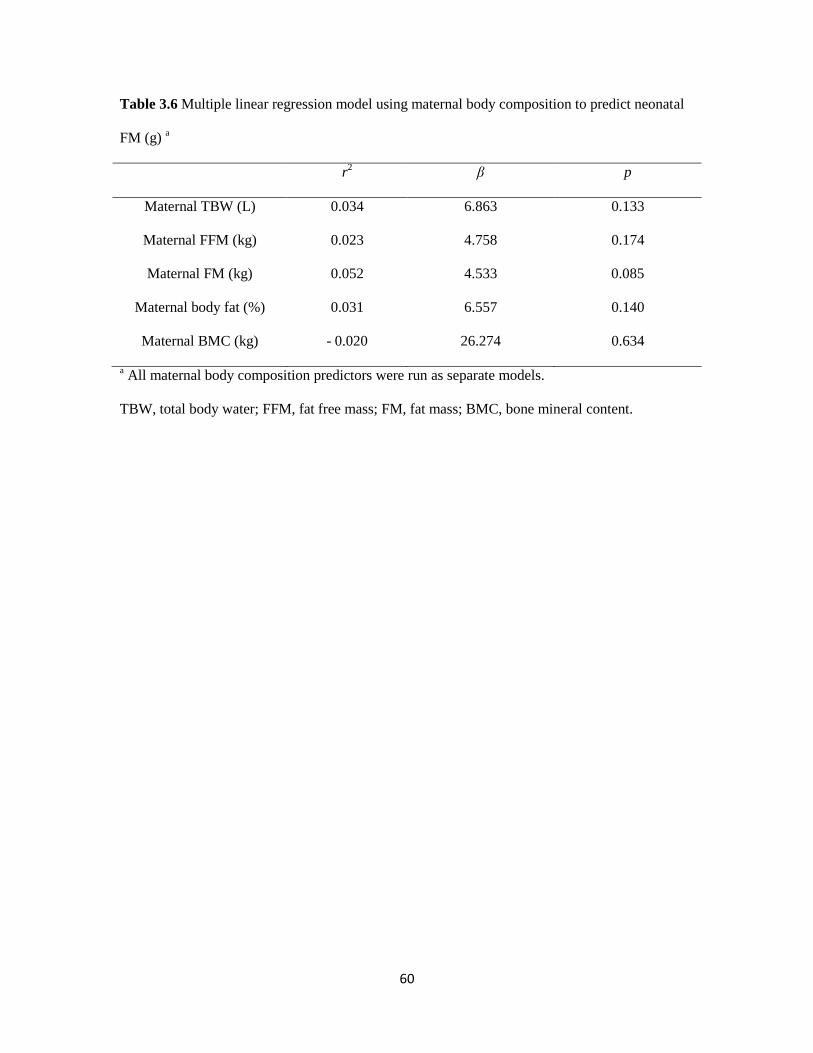
60
Table 3.6 Multiple linear regression model using maternal body composition to predict neonatal
FM (g) a
r2 β p
Maternal TBW (L) 0.034 6.863 0.133
Maternal FFM (kg) 0.023 4.758 0.174
Maternal FM (kg) 0.052 4.533 0.085
Maternal body fat (%) 0.031 6.557 0.140
Maternal BMC (kg) - 0.020 26.274 0.634
a All maternal body composition predictors were run as separate models.
TBW, total body water; FFM, fat free mass; FM, fat mass; BMC, bone mineral content.
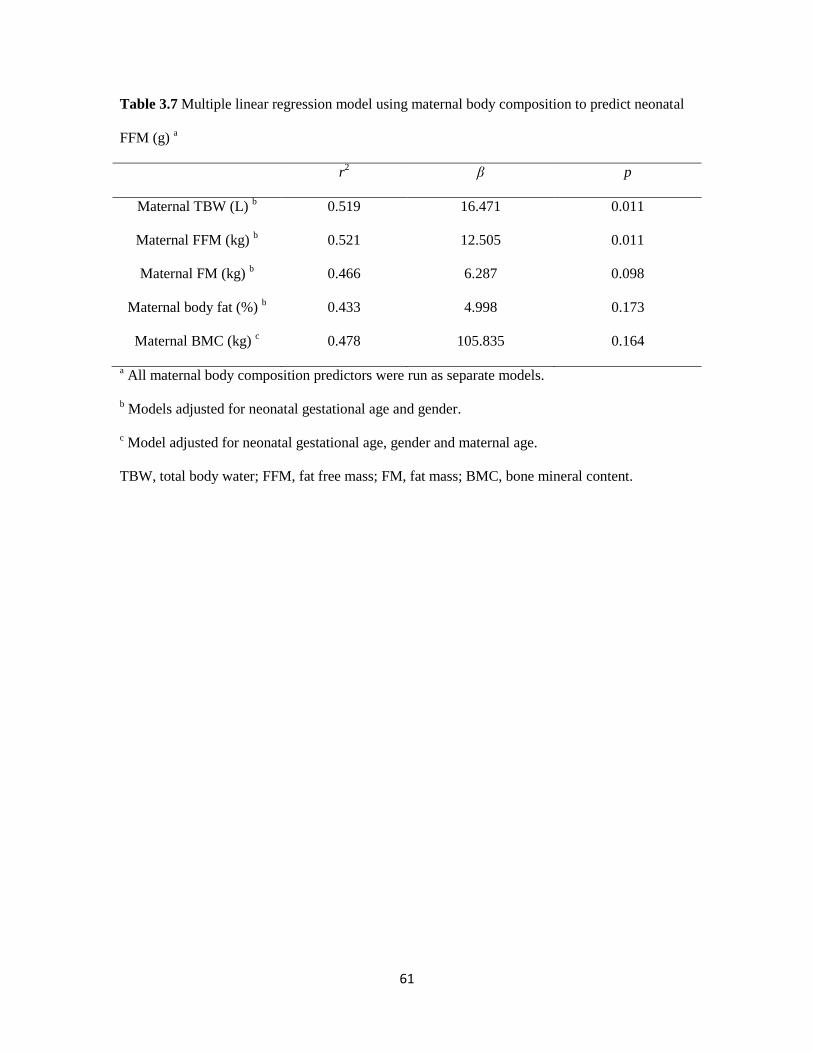
61
Table 3.7 Multiple linear regression model using maternal body composition to predict neonatal
FFM (g) a
r2 β p
Maternal TBW (L) b 0.519 16.471 0.011
Maternal FFM (kg) b 0.521 12.505 0.011
Maternal FM (kg) b 0.466 6.287 0.098
Maternal body fat (%) b 0.433 4.998 0.173
Maternal BMC (kg) c 0.478 105.835 0.164
a All maternal body composition predictors were run as separate models.
b Models adjusted for neonatal gestational age and gender.
c Model adjusted for neonatal gestational age, gender and maternal age.
TBW, total body water; FFM, fat free mass; FM, fat mass; BMC, bone mineral content.
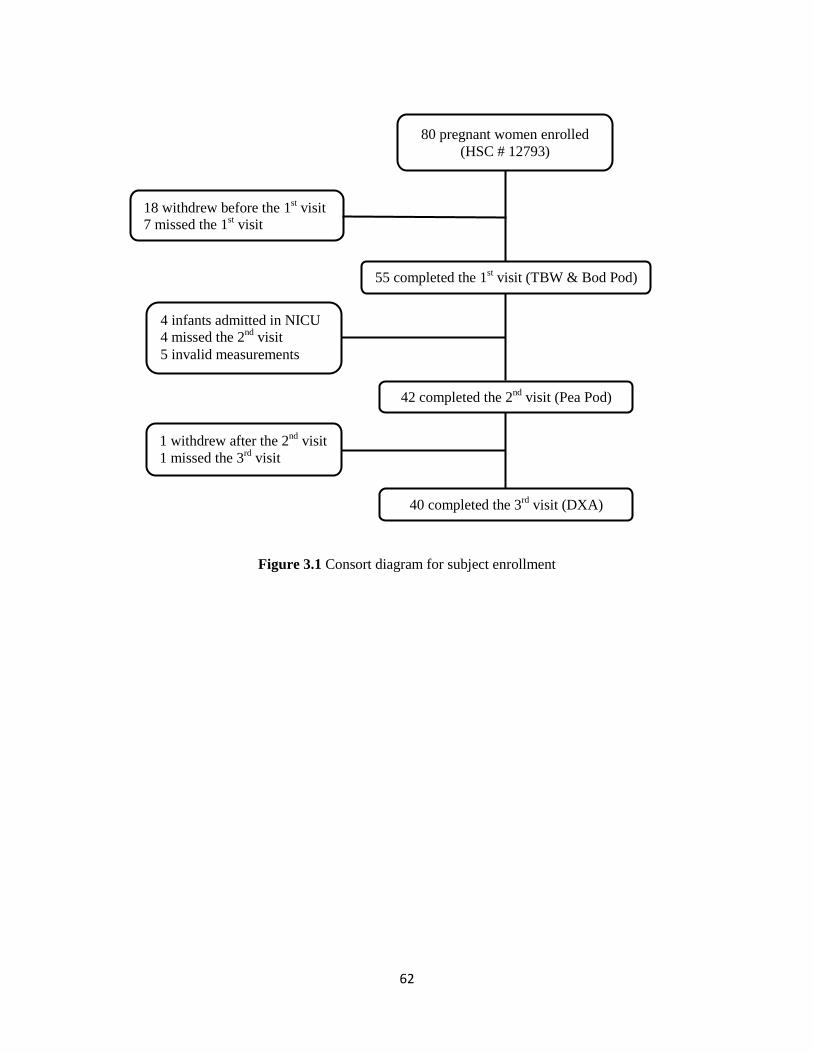
62
Figure 3.1 Consort diagram for subject enrollment
80 pregnant women enrolled
(HSC # 12793)
18 withdrew before the 1st visit
7 missed the 1st visit
55 completed the 1st visit (TBW & Bod Pod)
4 infants admitted in NICU
4 missed the 2nd
visit
5 invalid measurements
42 completed the 2nd
visit (Pea Pod)
40 completed the 3rd
visit (DXA)
1 withdrew after the 2nd
visit
1 missed the 3rd
visit
63
CHAPTER 4
TRIMESTER GESTATIONAL WEIGHT GAIN AND
NEONATAL BODY COMPOSITION AT BIRTH
64
4.1. Abstract
Background: The relationship between the timing of gestational weight gain (GWG) and
neonatal body fat is not clear.
Objective: To explore the association between timing of maternal GWG and neonatal percentage
of body fat (%fat), fat mass (FM) and fat free mass (FFM) at birth.
Methods: Maternal trimester-specific GWG was calculated as the 1st (0 to 13 weeks), 2
nd (14 to
28 weeks) and 3rd
(29 weeks to delivery) trimester using extracted weights from medical records
and self-reported pre-pregnancy weight from 48 mother-infant pairs. Neonatal body composition
(% fat, absolute weight (g) of FM, and FFM) were measured using air displacement
plethysmography (Pea Pod®) within 72 hours after birth. Multiple linear regression models that
adjusted for the influential variables (maternal pre-pregnancy BMI, neonatal age at test, gender
and gestational age) were used to assess the relationship between maternal GWG in each
trimester and neonatal body composition. The interaction between trimester GWG and maternal
pre-pregnancy BMI was explored using simple linear regression models. The significance level
was p ≤ 0.05.
Results: Total GWG was related to neonatal % fat (r2 = 0.182, p = 0.006) and FM (r
2 = 0.172, p
=0.007). In women had an obese BMI before pregnancy, GWG in the 1st and 2
nd trimesters was
related to neonatal FM (r2 = 0.443, p = 0.021; r
2 = 0.352, p = 0.041) and % fat (r
2 = 0.398, p =
0.030; r2 = 0.384, p = 0.033). In women had an overweight BMI, trimester GWG was not related
to neonatal % fat, FM or FFM. In women had a normal weight pre-pregnancy BMI, GWG in the
3rd
trimester was related to neonatal FM (r2 = 0.167, p = 0.020) and % fat (r
2 = 0.203, p = 0.011).
Trimester GWG was not related to neonatal FFM.
Conclusions: Total GWG and GWG in different trimester of pregnancy related to neonatal body
fatness.
65
4.2. Introduction
The Institute of Medicine (IOM) has long recognized the importance of maternal weight
gain during pregnancy in relation to fetal growth and development. Maternal inadequate
gestational weight gain (GWG) is associated with stillbirth (205), preterm birth (206), infant
mortality (205) and a low birth weight (159) while excessive maternal GWG is associated with
higher risk of cesarean section delivery (161) and a high birth weight (159). Without intervention,
about 50% of women gain more than recommended, with about 70% of overweight and obese
women gaining excessively. In 2009, the IOM updated the GWG guidelines (Table 4.1) (207).
Pregnancy is recognized as an ideal time to intervene. Behavioral interventions have shown
success in getting women to gain appropriately (208).
One noticeable outcome of the 2009 IOM report was the dearth of information regarding
how the maternal environment influences neonatal body composition (207). There is a direct link
between the level of fatness at birth to the level of fatness later in life. Research have shown a
weak but direct relationship between neonatal body fat and childhood body fat (128). Children
who are obese at age 5 are more likely to be an obese adult (55, 209) with the associated
comorbid conditions (55, 210). Therefore, determining maternal factors that influence or program
body composition at birth is of great interest.
Both maternal pre-pregnancy body mass index (BMI) and GWG are related to infant
body composition (125, 128, 131, 132, 155). A positive relationship between maternal pre-
pregnancy BMI and infant FM has been shown (125, 131, 155). Infants born to obese women
have greater body fat when compared to infants born to normal weight women (125, 131).
Further, maternal GWG is directly related to infant fat mass (FM) at birth (128, 132) and child
FM at 6 years old (128). Women who gain excessively or outside of the IOM GWG
recommendations have infants with greater FM (128) and this relationship varies by pre-
pregnancy BMI category (132). Hull et al. (132) found offspring born to overweight women who
gained in excess of the IOM recommendation had greater FM than offspring born to overweight
66
woman who gained appropriately. This difference was not found in women who were normal
weight or obese at the start of pregnancy.
Several studies (170, 171, 211-214) have shown trimester-specific GWG relates to
neonatal birth weight. GWG in the second trimester was more strongly associated to infant birth
weight than GWG in the first and third trimesters. Only one study investigated the effect of the
timing of GWG on infant fatness (215); however, GWG was divided as early or late weight gain
by 20 weeks of gestation. No study has investigated trimester-specific GWG in relation to
neonatal body fatness. And no study has correlated weight status at pregnancy and trimester
specific GWG to neonatal body composition at birth. The aim of this study was to describe the
relationship between total and trimester-specific GWG and neonatal body composition at birth in
women by pre-pregnancy weight status.
4.3. Material and Methods
4.3.1. Study population
Pregnant women (18-45 years old) without known infectious disease or illness (e.g.
autoimmune disease) were recruited between 28 and 39 weeks gestation. The subjects included
women who were normal weight (BMI 18.5-24.99 kg/m2) overweight (BMI 25-29.99 kg/m
2) and
obese (BMI 30-40 kg/m2) before pregnancy. The pre-pregnancy BMI was calculated using self-
reported maternal pre-pregnancy body weight and measured height at the study visit. Women
with an underweight pre-pregnancy BMI (< 18.5 kg/m2) or a pre-pregnancy BMI over 40 kg/m
2
were excluded. Women who were diagnosed with preeclampsia or GDM, self-reported smoking
and illicit drug use during their pregnancy and women who do not speak English were also
excluded. Women’s demographics and baseline information were obtained at enrollment. Women
were recruited between January 2012 and March 2013 at their prenatal care visits to the clinics of
University of Kansas Hospital in Kansas City from 2 study cohorts. All subjects provided written
67
informed consent. Both studies were approved by the University of Kansas Medical Center
(KUMC) Institutional Review Board (IRB) (#12793 and # 13126).
4.3.2. Measures of pregnancy weight gain
Maternal weight was obtained at each scheduled clinic visits. Total maternal GWG was
the difference between weight at delivery and pre-pregnancy weight. Maternal trimester-specific
GWG was calculated for the 1st (0 to 13 weeks), 2
nd (14 to 28 weeks) and 3
rd (29 weeks to
delivery) trimesters. Because not all women were weighed in the same gestational week within
each trimester, the recorded weight gain within each trimester was divided by the weeks within
each trimester to calculate a weekly weight gain for each trimester.
4.3.3. Neonatal body composition measurement
Neonatal body composition was measured with 72 h following birth. The Pea Pod® Body
Composition System (ADP) (CosMed, Concord, CA) assessed body volume which was used to
calculate body density by equation: body weight (kg)/body volume (L). The infant was naked
during body volume measurement. Neonatal crown to heel length was measured to the nearest 0.1
cm using a calibrated length board (Shorr Productions, Olney, MD) and neonatal body weight
was measured to the nearest 0.01 kg using the Pea Pod® neonatal scale. The Pea Pod software
estimates thoracic gas volume for neonates (190, 191). FM was calculated by the equation
BM/BD = FM/Dfm + FFM/Dffm (194) (BM is body weight, BD is body density, Dfm is FM density,
and Dffm is fat free mass (FFM) density). Dfm is constant throughout life as 0.9007 g/ml (194).
Dffm changes during growth (195) so age and gender specific Dffm values are used in calculating
percentage of body fat (% fat) (112).Infant % fat was calculated by equation: (FM/BM)*100%
(193).
4.3.4. Statistical analyses
Multiple linear regression models were used to assess the relationship between maternal
GWG during each trimester and neonatal body composition. To determine which maternal and
68
infant confounding variables to include in the regression models, bivariate correlations were
performed between infant body composition (%fat, FM, FFM) and the following maternal and
infant variables known in literature to be related to infant body composition: maternal age, pre-
pregnancy BMI, maternal ethnicity, parity, smoking history, neonatal age at test, gender and
gestational age. Correlations between variables that were significant were identified as collineated.
Pearson correlations between all variables were shown in Table 4.2. Stepwise hierarchical
regression was performed to remove the least significant collineated variable. The final models
included maternal pre-pregnancy BMI, neonatal age at test, gender and gestational age as
covariables. We also analyzed the interaction between trimester-specific GWG and each maternal
pre-pregnancy BMI category. Since our sample was small, no covariates were included in the
models that assessed interactions. Analyses were performed using SPSS v20.0 (SPSS Inc.,
Chicago, IL). P ≤ 0.05 was considered statistically significant.
4.4. Results
Eighty women were enrolled in the study and 45 mother-infant pairs were completed the
study (Figure 4.1). Maternal characteristics are presented in Table 4.3, and infant characteristics
are presented in Table 4.4.
Women who were overweight before pregnancy gained the most weight during gestation
and women who were obese before pregnancy gained the least during gestation. Total GWG for
overweight women was significantly higher compared to the total GWG for normal weight (p =
0.042) or obese women (p = 0.005). The total weight gain for normal weight and obese women
was not different. For trimester GWG, GWG during the 1st and 3
rd trimesters were not different
among pre-pregnancy BMI groups (p = 0.252 and p = 0.176, respectively). The weight gain
during the 2nd
trimester for overweight women was significantly higher than weight gain for
obese women (p = 0.015). GWG during the 2nd
trimester between normal weight women and
obese women (p = 0.101) and normal weight and overweight women (p = 0.295) were not
69
different (p = 0.236) (Table 4.3). Infant gestational age, birth weight, and body composition (FM,
FFM, % fat) were not different among groups (Table 4.4).
4.4.1. Trimester specific GWG related to neonatal %fat
In the group as whole, maternal total GWG was correlated to neonatal % fat (r2 = 0.182,
p = 0.006). When trimester-specific GWG was determined for each maternal pre-pregnancy BMI
category, an interaction was found between trimester-specific GWG and neonatal % fat (Figure
4.2). GWG during the 1st (r
2 = 0.398, β = 16.862, p = 0.030) and 2
nd (r
2 = 0.384, β = 18.052, p =
0.033) trimesters was positively related to neonatal % fat in the obese group, and GWG during
the 3rd
trimester was positively related to neonatal % fat in normal weight group (r2 = 0.203, β =
9.415, p = 0.011). No relationship was found between trimester-specific GWG and neonatal % fat
in the overweight group. Because we found interactions between maternal pre-pregnancy BMI
and GWG on neonatal % fat, main effect of trimester GWG on neonatal % fat was not reported.
4.4.2. Total and trimester specific GWG related to neonatal FM
In the group as a whole, maternal total GWG was positively related to neonatal FM (r2 =
0.172, p = 0.007). When trimester-specific GWG was determined for each maternal pre-
pregnancy BMI category, an interaction was found relating the trimester-specific GWG to
neonatal FM (Figure 4.3). GWG during the 1st trimester had a positive relationship with neonatal
FM in the obese group (r2 = 0.443, β = 807.644, p = 0.021) and the relationship between GWG
during the 1st trimester and neonatal FM in overweight group approached significance (r
2 = 0.363,
β = - 682.776, p = 0.067). GWG during the 2nd
trimester was positively related to neonatal FM in
obese group (r2 = 0.352, β = 803.540, p = 0.041). GWG during the 3
rd trimester was positively
related to neonatal FM in normal weight group (r2 = 0.167, β = 331.613, p = 0.020). Because we
found interactions between maternal pre-pregnancy BMI and GWG on neonatal FM, main effect
of trimester GWG on neonatal FM was not reported.
70
4.4.3. Total and trimester specific GWG related to neonatal FFM
No significant relationship was found between either maternal total GWG or trimester-
specific GWG and neonatal FFM in the group as a whole. When trimester-specific GWG was
determined for each maternal pre-pregnancy BMI category, the interaction between trimester-
specific GWG and neonatal FFM was not significant (Figure 4.4).
4.5. Discussion
This is the first study to assess the relationship between trimester-specific GWG and
neonatal body composition. We found significant relationships between maternal total GWG as
well as trimester-specific GWG and neonatal body fat (% fat and FM). Neonatal % fat and FM
were related to maternal GWG during the 2nd
and 3rd
trimesters but not the 1st trimester. Neonatal
FFM was not related to either total GWG or GWG during any trimester.
We also explored if the timing of GWG when predicting neonatal body composition
differed by pre-pregnancy BMI category. Late weight gain (3rd
trimester) in normal weight group
predicted infant body fat, while early weight gain (1st and 2
nd trimesters) predicted infant body fat
in the obese group.
Our data are consistent with published research exploring total GWG and infant body
composition. Crozier et al. (128) reported a positive association between weight gain during
pregnancy and neonatal FM measured at one month (β = 0.10, p = 0.0004) using a cohort of 566
mother-infant pairs in Southhampton Women’s Survey Study. They suggested that excessive
GWG predicted a higher infant body fat. Hull et al. (132) expanded this work in 306 mother-
infant pairs and found the effect of excessive GWG on infant body fat varied by pre-pregnancy
BMI category. Infants born to overweight women that gained excessively had greater body fat
than offspring born overweight woman that gained appropriately (13.7% vs. 9.2%, p = 0.001).
This difference was not found in any other pre-pregnancy BMI group. However, neither of these
studies investigated how the timing of weight gain or trimester-specific GWG related to neonatal
71
body composition, which was reported by our study. We also found an interaction between
trimester-specific GWG and maternal pre-pregnancy BMI category when predicting neonatal
body fat.
One study assessed relationship between timing of excessive GWG and neonatal
adiposity (215). Davenport et al. reported neonates born to women gained excessive weight
during the first half of gestation (16–20 weeks) had higher body fat (17.5 ± 3.1%) compared to
neonates born to women gained appropriate weight during pregnancy (13.2 ± 4.1%, p < 0.01) or
excessive weight late in gestation (14.7 ± 3.3%, p < 0.01). They also indicated that neonates born
to women who gained excessive weight during first half of pregnancy had an increased risk of
elevated body fat at birth (odds ratio (OR) = 2.64, 95% CI: 1.35–5.17) compared to neonates born
to women had total excessive weight gain during the pregnancy (OR = 1.49, 95% CI: 0.80–2.79).
These results were inconsistent with our results since we found maternal weight gain later in
pregnancy (14 to 28 weeks and 29 to delivery) was related to neonatal body fat at birth. When
divided our samples by maternal pre-pregnancy BMI category, only results for obese group were
consistent with findings reported by Davenport et al. However, they did not examine the
interaction between GWG and maternal pre-pregnancy BMI category and they only separated the
weight gain as early and late in pregnancy and neonatal body fat was estimated by skinfold
thickness. Our study builds on the findings by Davenport et al. and reported the relationship
between trimester-specific GWG and neonatal body composition at birth measured by air-
displacement, which is a more accurate way to measure neonatal body composition. But we did
not compare the body composition of infant born to women who gained appropriate weight
during gestation to infant born to women who gained excessive weight according to the IOM
recommendations because our small sample size. Most of our subjects, especially those who were
overweight or obese before pregnancy, gained in excess of weight according to the 2009 IOM
recommendations of GWG.
72
The potential mechanism underlying the interactive effects between GWG and pre-
pregnancy BMI category has not yet been elucidated. Weight gain during different windows
during pregnancy may have different outcomes. Data suggests that weight gain during early
pregnancy reflects an accumulation of maternal fat stores and weight gained late in pregnancy
reflects fetal growth (85). The Dutch Hunger Famine Studies showed altered nutrition during
critical period in pregnancy had different influences on offspring birth weight (62, 216). Our
overall results were consistent with this theory. However, when our sample was divided by pre-
pregnancy BMI category, only normal weight women were following this pattern. In the
overweight and obese women, weight gain during earlier pregnancy was related to neonatal body
fat accumulation.
The changes in the compartments of GWG might be one reason to explain the interaction
between the trimester-specific GWG and pre-pregnancy BMI on neonatal body composition. To
our knowledge, only a few studies have investigated the changes in the compartments of GWG.
Lederman et al. (173) assessed the changes of maternal weight gain in different pre-pregnancy
BMI categories in 196 women using the four-compartment model during gestation at 14 and 37
weeks. They found maternal fat gain between 14 to 37 weeks was negatively correlated with pre-
pregnancy BMI category (r = - 0.25, p < 0.0005) and positively correlated with GWG (r = 0.81, p
< 0.0001). Women with an obese pre-pregnancy BMI had a smaller change in FM than women in
other pre-pregnancy BMI categories. They also found women who gained above the amount
recommended by IOM (1990) had the highest fat gain. In contrast to Lederman et al. (173), Butte
et al. (135) reported a higher FM gain in high BMI group (pre-pregnancy BMI > 26 kg/m2).
However, all of the women in her high BMI group gained above the recommendations (IOM
1990), which might lead to a higher fat gain. Butte et al. (135) reported the changes in maternal
body composition for each trimester for different pre-pregnancy BMI categories. Changes in
maternal TBW, protein and FFM (p = 0.001) were found differed by trimester but not by pre-
pregnancy BMI category, while trimester changes in maternal FM differed by pre-pregnancy
73
BMI category (p = 0.01). In our study, we did not evaluated the changes of compartments of
GWG but most of our participants gained excessive weight during gestation according to 2009
IOM guidelines so they may have higher fat gain based on Lederman et al. (173). Because
maternal fat gain was varied by pre-pregnancy BMI according to Butte et al. (135), this may
underlie the interaction between trimester-specific GWG and pre-pregnancy BMI on neonatal
body composition. Future study is needed to clarify this relationship.
Our study has several strengths. First, we assessed neonatal body composition in a few
days after birth using air-displacement techniques, which avoided the potential influence of
postnatal environment on neonatal body composition, such as feeding patterns. Second, we
analyzed maternal weight gain using a trimester-specific model and related that to neonatal body
composition at birth, which has never been done. We found the relationships of GWG during
each trimester to neonatal body composition was different and these relationships varied by pre-
pregnancy BMI category. This suggests that the best windows to intervene pregnant women on
weight gain were different depend on their pre-pregnancy BMI to get most beneficial outcomes in
offspring. For normal weight women, the best window might be late in pregnancy while for
overweight and obese women, intervening during earlier pregnancy might be better.
Our study also has limitations. First, our sample size is small, we only have 45 mother-
infant pairs in the study and most of them were in normal weight pre-pregnancy BMI category.
The sample size in overweight and obese groups is small. However, for GWG during each
trimester, a sample size of 40 provides sufficient power to detect a correlation of at least r = 0.5 at
the 0.05 level of significance. But we do not have enough power to adjust for any covariates
when we analyzed the interaction between GWG and pre-BMI category. Further, we cannot
assess if excessive weight gain during each trimester acted differently compared to appropriate
weight gain on neonatal body composition and if this varied by pre-pregnancy BMI group. Future
studies with larger sample sizes are needed to answer these questions. At last, we correlated each
74
of our dependent and independent variables in separate models. We ran 12 models using the same
data for this study, which increased our type I error probability.
In conclusion, we found a significant relationship between total GWG and GWG in the
various trimesters and neonatal body composition. GWG during the 2nd
and 3rd
trimesters were
positively related to neonatal body fat. Neonatal FFM was not correlated with either total or
trimester-specific GWG. The relationship between GWG and neonatal body composition varied
by maternal pre-pregnancy BMI category. In normal weight group, neonatal % fat and FM were
associated with late GWG, while in obese group, neonatal % fat and FM were associated with
GWG during the 1st and 2
nd trimesters. Future studies are need in a larger sample size to clarify
these relationships.
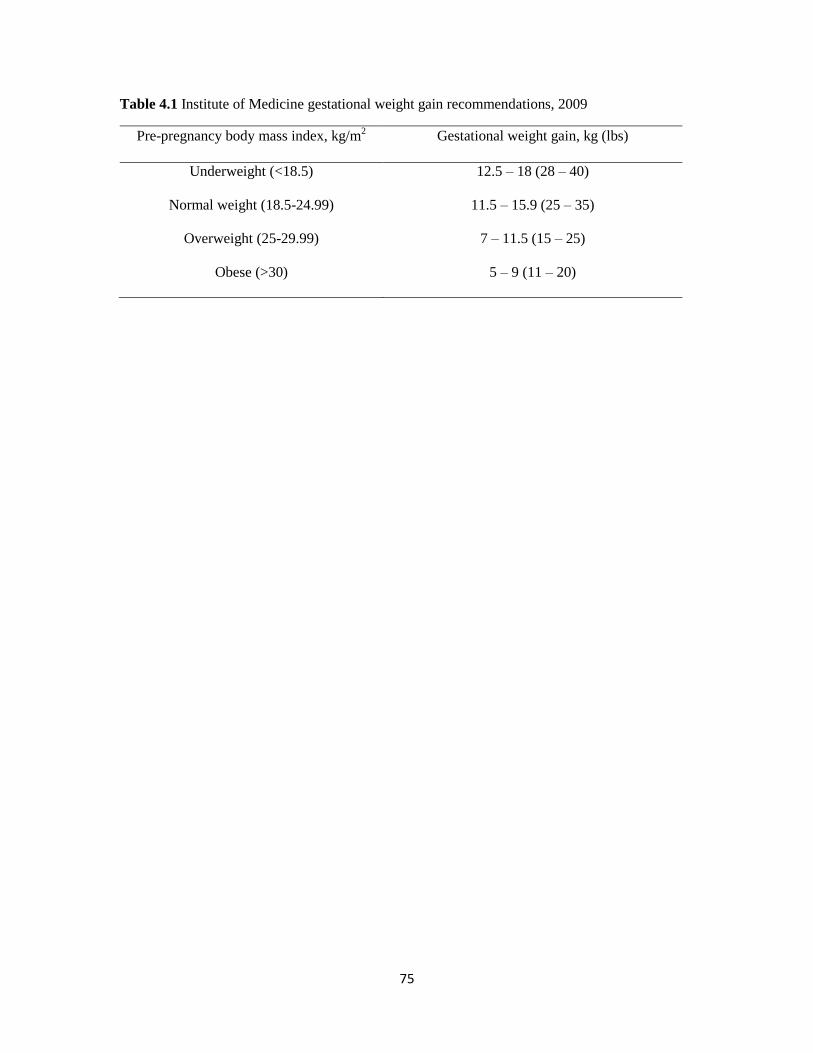
75
Table 4.1 Institute of Medicine gestational weight gain recommendations, 2009
Pre-pregnancy body mass index, kg/m2 Gestational weight gain, kg (lbs)
Underweight (<18.5) 12.5 – 18 (28 – 40)
Normal weight (18.5-24.99) 11.5 – 15.9 (25 – 35)
Overweight (25-29.99) 7 – 11.5 (15 – 25)
Obese (>30) 5 – 9 (11 – 20)

76
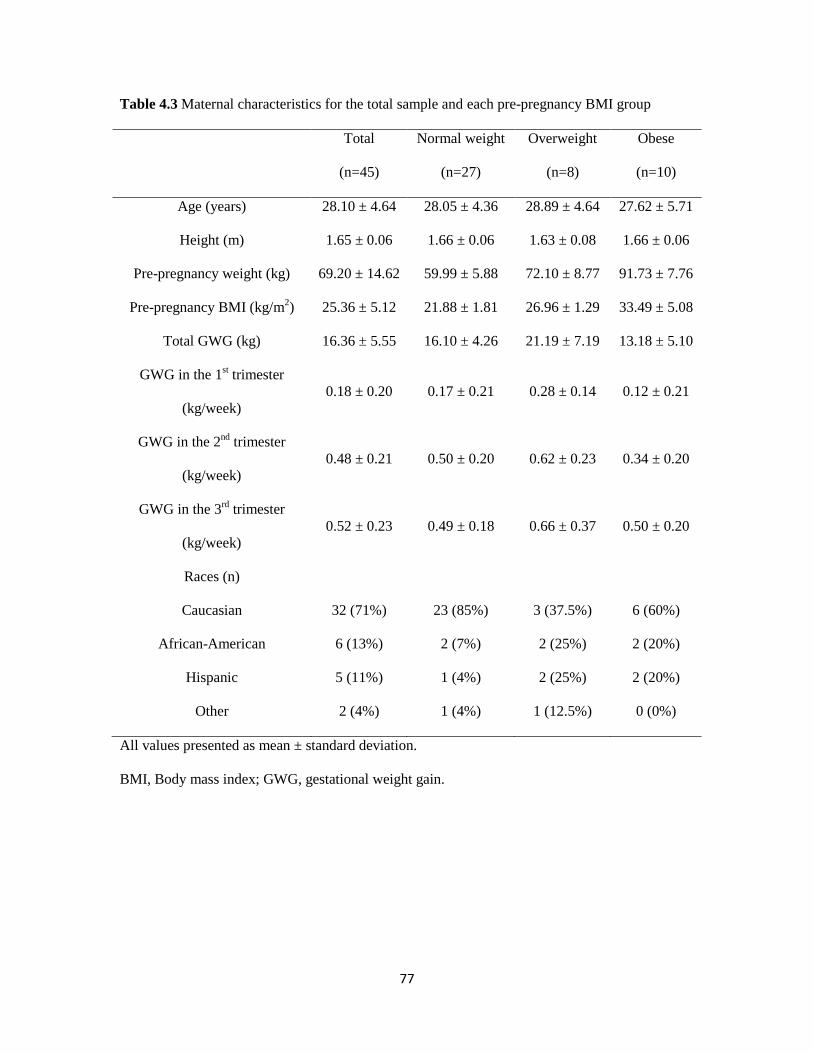
77
Table 4.3 Maternal characteristics for the total sample and each pre-pregnancy BMI group
Total
(n=45)
Normal weight
(n=27)
Overweight
(n=8)
Obese
(n=10)
Age (years) 28.10 ± 4.64 28.05 ± 4.36 28.89 ± 4.64 27.62 ± 5.71
Height (m) 1.65 ± 0.06 1.66 ± 0.06 1.63 ± 0.08 1.66 ± 0.06
Pre-pregnancy weight (kg) 69.20 ± 14.62 59.99 ± 5.88 72.10 ± 8.77 91.73 ± 7.76
Pre-pregnancy BMI (kg/m2) 25.36 ± 5.12 21.88 ± 1.81 26.96 ± 1.29 33.49 ± 5.08
Total GWG (kg) 16.36 ± 5.55 16.10 ± 4.26 21.19 ± 7.19 13.18 ± 5.10
GWG in the 1st trimester
(kg/week)
0.18 ± 0.20 0.17 ± 0.21 0.28 ± 0.14 0.12 ± 0.21
GWG in the 2nd
trimester
(kg/week)
0.48 ± 0.21 0.50 ± 0.20 0.62 ± 0.23 0.34 ± 0.20
GWG in the 3rd
trimester
(kg/week)
0.52 ± 0.23 0.49 ± 0.18 0.66 ± 0.37 0.50 ± 0.20
Races (n)
Caucasian 32 (71%) 23 (85%) 3 (37.5%) 6 (60%)
African-American 6 (13%) 2 (7%) 2 (25%) 2 (20%)
Hispanic 5 (11%) 1 (4%) 2 (25%) 2 (20%)
Other 2 (4%) 1 (4%) 1 (12.5%) 0 (0%)
All values presented as mean ± standard deviation.
BMI, Body mass index; GWG, gestational weight gain.
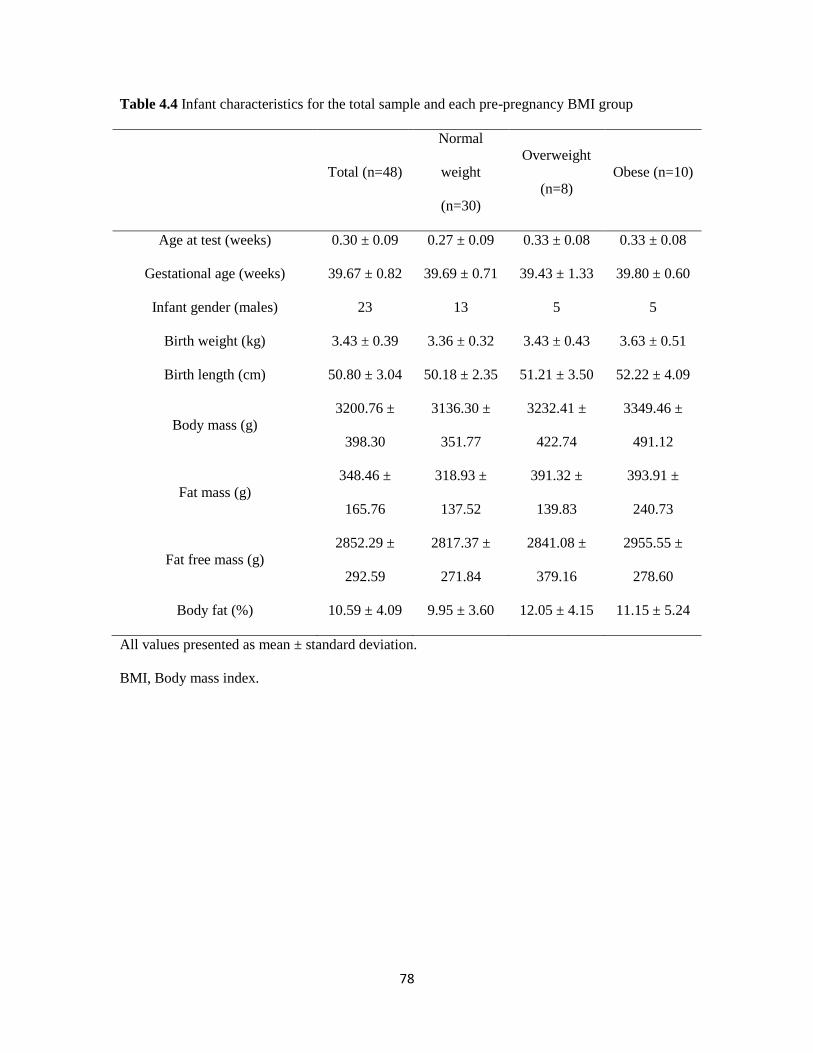
78
Table 4.4 Infant characteristics for the total sample and each pre-pregnancy BMI group
Total (n=48)
Normal
weight
(n=30)
Overweight
(n=8)
Obese (n=10)
Age at test (weeks) 0.30 ± 0.09 0.27 ± 0.09 0.33 ± 0.08 0.33 ± 0.08
Gestational age (weeks) 39.67 ± 0.82 39.69 ± 0.71 39.43 ± 1.33 39.80 ± 0.60
Infant gender (males) 23 13 5 5
Birth weight (kg) 3.43 ± 0.39 3.36 ± 0.32 3.43 ± 0.43 3.63 ± 0.51
Birth length (cm) 50.80 ± 3.04 50.18 ± 2.35 51.21 ± 3.50 52.22 ± 4.09
Body mass (g)
3200.76 ±
398.30
3136.30 ±
351.77
3232.41 ±
422.74
3349.46 ±
491.12
Fat mass (g)
348.46 ±
165.76
318.93 ±
137.52
391.32 ±
139.83
393.91 ±
240.73
Fat free mass (g)
2852.29 ±
292.59
2817.37 ±
271.84
2841.08 ±
379.16
2955.55 ±
278.60
Body fat (%) 10.59 ± 4.09 9.95 ± 3.60 12.05 ± 4.15 11.15 ± 5.24
All values presented as mean ± standard deviation.
BMI, Body mass index.
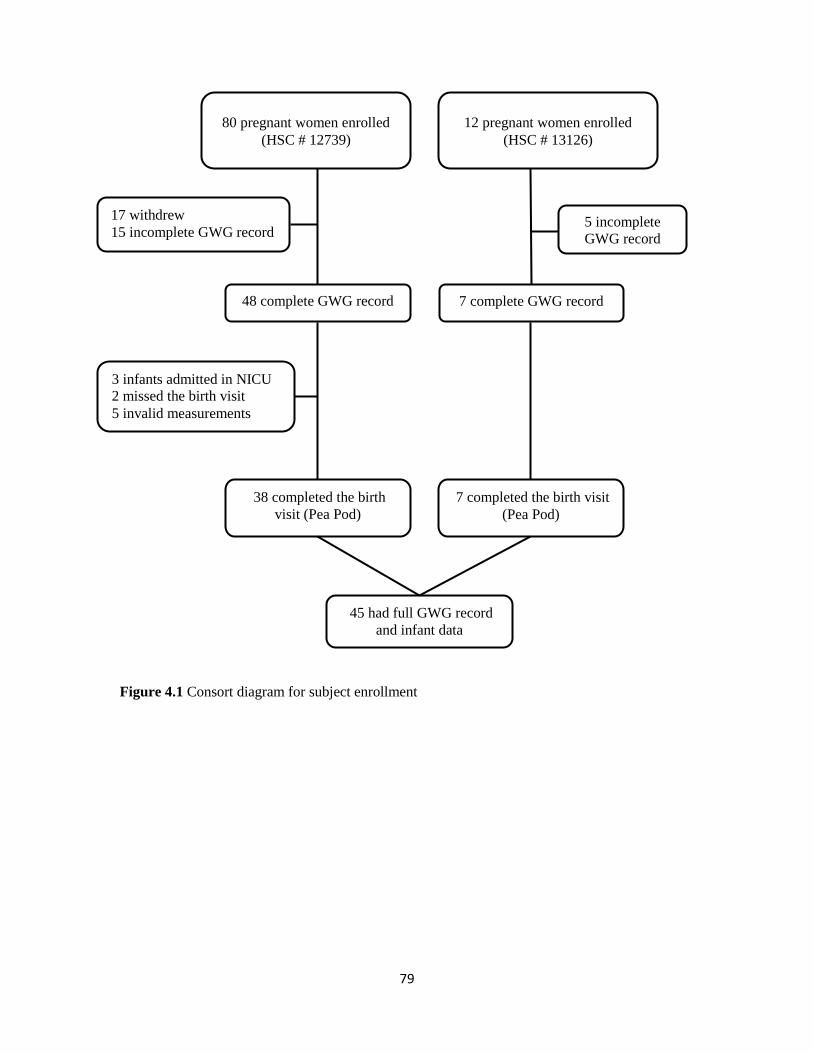
79
Figure 4.1 Consort diagram for subject enrollment
80 pregnant women enrolled
(HSC # 12739)
17 withdrew
15 incomplete GWG record
48 complete GWG record
3 infants admitted in NICU
2 missed the birth visit
5 invalid measurements
38 completed the birth
visit (Pea Pod)
12 pregnant women enrolled
(HSC # 13126)
5 incomplete
GWG record
7 complete GWG record
7 completed the birth visit
(Pea Pod)
45 had full GWG record
and infant data
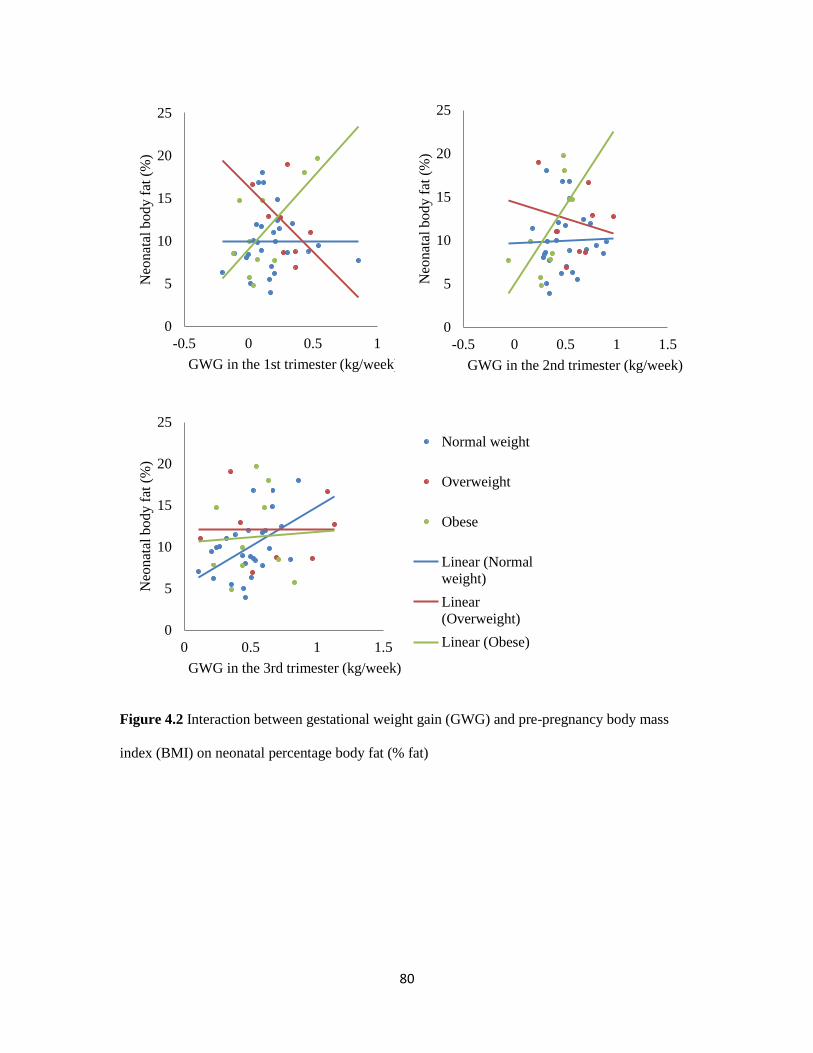
80
Figure 4.2 Interaction between gestational weight gain (GWG) and pre-pregnancy body mass
index (BMI) on neonatal percentage body fat (% fat)
0
5
10
15
20
25
-0.5 0 0.5 1
Neo
nat
al b
od
y f
at (
%)
GWG in the 1st trimester (kg/week)
0
5
10
15
20
25
-0.5 0 0.5 1 1.5
Neo
nat
al b
ody f
at (
%)
GWG in the 2nd trimester (kg/week)
0
5
10
15
20
25
0 0.5 1 1.5
Neo
nat
al b
ody f
at (
%)
GWG in the 3rd trimester (kg/week)
Normal weight
Overweight
Obese
Linear (Normal
weight)
Linear
(Overweight)
Linear (Obese)
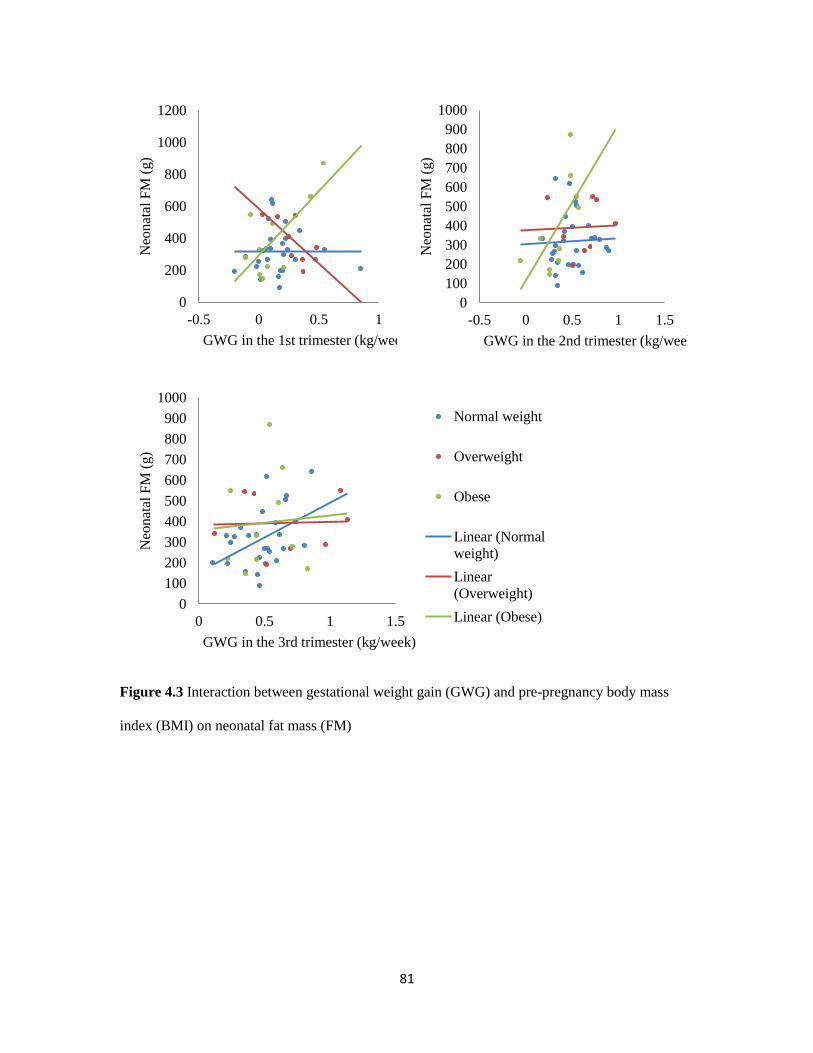
81
Figure 4.3 Interaction between gestational weight gain (GWG) and pre-pregnancy body mass
index (BMI) on neonatal fat mass (FM)
0
200
400
600
800
1000
1200
-0.5 0 0.5 1
Neo
nat
al F
M (
g)
GWG in the 1st trimester (kg/week)
0
100
200
300
400
500
600
700
800
900
1000
-0.5 0 0.5 1 1.5
Neo
nat
al F
M (
g)
GWG in the 2nd trimester (kg/week)
0
100
200
300
400
500
600
700
800
900
1000
0 0.5 1 1.5
Neo
nat
al F
M (
g)
GWG in the 3rd trimester (kg/week)
Normal weight
Overweight
Obese
Linear (Normal
weight)
Linear
(Overweight)
Linear (Obese)
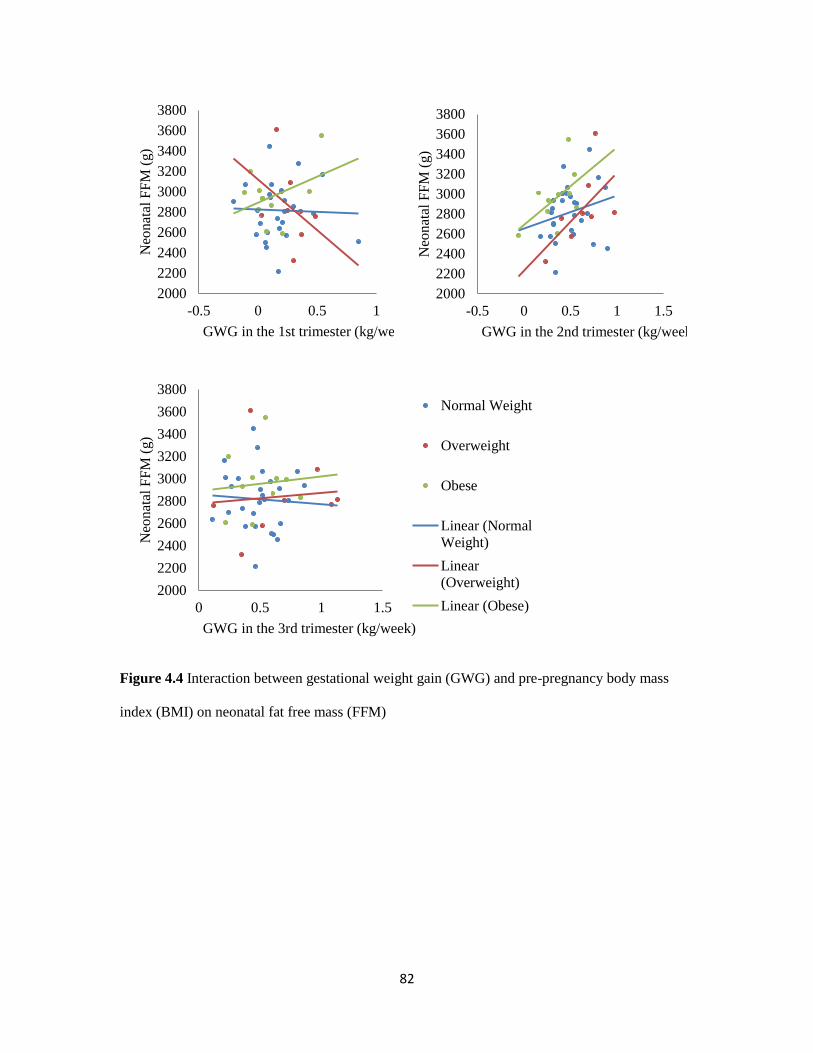
82
Figure 4.4 Interaction between gestational weight gain (GWG) and pre-pregnancy body mass
index (BMI) on neonatal fat free mass (FFM)
2000
2200
2400
2600
2800
3000
3200
3400
3600
3800
-0.5 0 0.5 1
Neo
nat
al F
FM
(g)
GWG in the 1st trimester (kg/week)
2000
2200
2400
2600
2800
3000
3200
3400
3600
3800
-0.5 0 0.5 1 1.5
Neo
nat
al F
FM
(g)
GWG in the 2nd trimester (kg/week)
2000
2200
2400
2600
2800
3000
3200
3400
3600
3800
0 0.5 1 1.5
Neo
nat
al F
FM
(g)
GWG in the 3rd trimester (kg/week)
Normal Weight
Overweight
Obese
Linear (Normal
Weight)
Linear
(Overweight)
Linear (Obese)

83
CHAPTER 5
DISCUSSION AND CONCLUSION
84
5.1. Summary of findings
This is the first study to relate maternal body composition during pregnancy to neonatal
body composition at birth. This research extends the literature relating maternal factors to
neonatal body composition (125, 128, 131, 132, 155, 217, 218). Overall, the presented study
provides evidence that maternal body composition and GWG were related to neonatal body
composition. The findings aided in our comprehension of how maternal adiposity relates to fetal
growth which may relate to the future health of the offspring. The results of this study also added
to the body of knowledge on the relationship between maternal body composition, GWG and
neonatal body composition. Such results are expected to have an important positive impact,
because understanding the factors that influence the development of neonatal body fat are critical
as this may relate to later offspring health and identify time periods for intervention.
Chapter 3 Maternal body composition late in pregnancy and neonatal body composition at birth
The purpose of this study was to measure maternal body composition late in pregnancy
and offspring body composition 1-3 days following birth to determine how they were related. Our
results demonstrated a relationship between maternal body composition and neonatal birth weight
and body composition. Maternal FFM and TBW were significantly related to birth weight and
maternal TBW and FFM were significantly related to neonatal FFM. Although no significant
relationships were found between maternal FM and neonatal FM, the relationship between
maternal FM and neonatal FM approached significance. The trend of this relationship indicated a
larger sample size may be needed in future studies to clarify the association between these
variables.
85
Chapter 4 Relationship between timing of maternal gestational weight gain and neonatal body
composition at birth
While many studies have demonstrated a relationship between total GWG and neonatal
birth weight and body composition (128, 132, 151, 165-172, 218), no study has assessed how
GWG during different trimesters relates to neonatal body composition at birth. The purpose of
this chapter was to describe the relationship between both total and trimester-specific GWG and
neonatal body composition at birth using a prospective pregnant cohort. The results of this study
provided evidence that the timing of GWG was related to neonatal body composition at birth. A
significant interaction was found between maternal pre-pregnancy BMI and GWG on neonatal
body fat. Early weight gain (1st and 2
nd trimesters) was positively related to neonatal body fat in
obese women while late weight gain (3rd
trimester) was positively related to neonatal body fat in
normal weight women. Main effect between maternal trimester GWG and infant body
composition at birth was not reported because we found significant interaction between maternal
pre-pregnancy BMI and GWG on neonatal body composition.
5.2. Discussion
5.2.1. Comparison with other studies
Chapter 3 Maternal body composition late in pregnancy and neonatal body composition at birth
Several studies have assessed the relationship between maternal factors and neonatal
body composition (125, 131, 155, 217); however, all of these studies used maternal
anthropometrics such as maternal pre-pregnancy BMI as variables to predict neonatal body
composition. In our study, we used maternal body composition measured by the four-
compartment model as a predictor for neonatal body composition at birth. Measuring body
composition quantifies fat and lean body mass while BMI is simply a surrogate marker of
adiposity that is correlated with FM.
86
Four previous studies investigated the relationship between maternal pre-pregnancy BMI
and infant body composition up to 1 month of age (125, 131, 155, 217). Two studies measured
infant body composition using ADP (Pea Pod®) at 2 weeks of age (131, 155), one study used
TOBEC (125) within 72 h after birth and one study used MRI (217) from 1 to 28 days of age to
assess infant body composition. All studies found positive relationship between maternal pre-
pregnancy BMI and infant body fat (125, 131, 155, 217). However, results on FFM were not
consistent. Sewell et al. (125) found maternal pre-pregnancy BMI did not affect infant FFM while
Hull et al. (131) found infants born to overweight/obese women had lower FFM compared to
infants born to normal weight women. Timing of neonatal body composition assessment might be
the reason for the discrepancy. We observed that neither infant FM nor FFM were related to
maternal pre-pregnancy BMI. Different findings may be due to our smaller sample size (n = 43)
and we separated the overweight and obese groups instead of collapsing the overweight/obese
groups together.
We also evaluated the correlation between maternal body composition late in pregnancy
to neonatal birth weight. Two studies that analyzed maternal body composition during pregnancy
using four-compartment model related that to birth weight (135, 174). Our results partly
confirmed their results that maternal TBW and FFM were related to birth weight. However, we
found maternal FM was associated with birth weight as well which was inconsistent with earlier
studies. Our results indicated that maternal FM may also influence neonatal birth weight,
especially in a higher BMI population.
Only one study used a multi-compartment model to measure maternal body composition
during pregnancy and related that to infant body composition (135). Infant body composition was
measured at 2 weeks of age using DXA. No relationship was found between maternal body
composition at 36 weeks and infant body composition at 2 weeks of age. In contrast, we found a
positive association between maternal FFM and TBW and neonatal FFM. Maternal FM was
related to neonatal FM with a borderline significance. The difference between our results and an
87
earlier study by Butte et al. (135) may due to the timing of infant body composition measurement.
We conducted our measurement within 1-3 days after birth while Butte et al. (135) did their
measurement at 2 weeks of age. A later infant body composition measurement may be influenced
by ex utero factors including the infant feeding pattern. This is the first study that related maternal
body composition during pregnancy measured by a multi-compartment model to neonatal body
composition at birth.
Chapter 4 Relationship between timing of maternal gestational weight gain and neonatal body
composition at birth
Three studies explored how total GWG affected neonatal body composition (128, 132,
218). All of the studies categorized weight gain using the 2009 IOM guidelines for GWG (see
Table 1). One study measured neonatal body composition using DXA at 1 month (128), one
study used ADP (Pea Pod®) within 3 days after birth (132), and the other study used skinfold
thickness within 1-3 days after birth (218). All of the studies found excessive weight gain during
pregnancy related to a greater neonatal body fat at birth. However, when data were analyzed by
maternal pre-pregnancy BMI groups, only one study found higher body fat in offspring from the
normal weight group when the mother gained excessive weight. This relationship was not found
in offspring from the overweight and obese groups (218). Other results found a significant
interaction between GWG and maternal pre-pregnancy BMI on neonatal body composition. The
effect of excessive GWG on neonatal body fat was greatest in overweight women (132). In our
study, we observed an association between total GWG and neonatal body fat but not FFM at birth.
However, we were unpowered to detect if excessive weight gain affects neonatal body
composition since this study was not designed for that aim. Future studies are needed to further
illuminate the details between GWG and neonatal body composition.
Studies have investigated how GWG during different trimesters affects birth weight (170-
172) but only one study has evaluated the effects of the timing of GWG on neonatal adiposity
88
(215). GWG during the 1st and 2
nd trimesters, especially the 2
nd trimester, was more significantly
related to birth weight when compared to the 3rd
trimester (170-172). For infant adiposity,
Davenport et al. (215) found if women gained excessive GWG during the first half of gestation
(16 to 20 weeks), their infants would have greater body fat compared to infants born to women
who gained appropriate GWG or when compared to infants born to women who gained
excessive weight late in gestation. Our results were inconsistent with the observations reported.
We found a significant relationship between late GWG (2nd
and 3rd
trimesters) and neonatal body
fat. In addition, we found interaction between maternal pre-pregnancy BMI and GWG during the
different trimesters on neonatal body fat. Weight gain late in gestation in normal weight women
was associated with a greater infant body fat. However in overweight and obese women, weight
gained earlier during gestation was associated with greater infant body fat. The interaction might
be the reason for the difference between our results and the Davenport et al. study. We had 30
normal weight 8 overweight and 10 obese women in our study. This may pull the association
between weight gain and neonatal body fat into later gestation.
5.2.2. The clinical implications
5.2.2.1. Maternal body composition
It is known that adequate GWG together with maternal pre-pregnancy BMI are important
for optimal pregnancy and infant outcomes. However, the effects of specific components of
maternal body weight and weight gain during pregnancy on fetal growth are not delineated
clearly. As pregnancy progresses, water, protein, fat and minerals are accreted in the fetus,
placenta, and maternal lean and adipose tissues. Variations in the composition of the mother’s
body may be crucial in determining the association between the maternal environment and infant
outcomes. Measuring body composition during pregnancy is difficult because the basic
assumptions used for common two-compartment models are not valid in this population. Multi-
compartment models are needed to measure body composition during gestation accurately. Our
study showed a relationship between maternal FFM and TBW late in pregnancy to neonatal FFM,
89
as well as a trend for an association between maternal and neonatal body fat. Although the
mechanisms underlying these results are not clear yet, placental transportation of protein relating
to maternal adiponectin level and maternal glucose production rate during gestation may be
involved in explaining the effects of maternal body water or body composition on fetal
development. These results are critical because it provides clues for future recommendations for
GWG to achieve full benefit with less fat gain.
5.2.2.2. The timing of GWG
The intrauterine environment is essential for fetal growth and thought to affect many
aspects of human health throughout the life course. Gestational weight gain may alter the
intrauterine environment and inappropriate weight gain could impede fetal growth. Gestational
weight gain is associated with both infant birth weight and body composition. However, the
timing of overnutrition and resulting excessive GWG on neonatal outcomes at birth is not clear.
Current GWG guidelines developed by the IOM provide recommended total and trimester GWG
guidelines to prevent adverse maternal and neonatal outcomes based on pre-pregnancy BMI. For
weight gain in different trimesters, all women are recommended to gain 0.5-2.0 kg during the 1st
trimester and a weekly weight gain during the 2nd
and 3rd
trimesters was recommended by pre-
pregnancy BMI (207).
Weight gain during different trimesters could have different effects on neonatal outcomes.
Specific windows to intervene in pregnant women to have the greatest beneficial impact on
offspring body composition are unknown. Our data suggest the critical window to intervene
varied by pre-pregnancy BMI. For normal weight women, the critical window would be late in
pregnancy to promote a healthy weight gain during the 3rd
trimester. For overweight and obese
women, the critical window would be earlier during gestation to promote a healthy weight gain.
The excessive weight gain in our overweight and obese women highlights the need for focused
nutritional advice and care during pregnancy to promote appropriate weight gain, which may lead
to less body fat in their offspring.
90
5.2.2.3. Neonatal body composition
Accurate measurement of neonatal body fat is important because it is related to childhood
body fat (128). Greater body fat in childhood is related to obesity development in adulthood along
with the associated comorbid conditions. Barker et al. proposed that an infant phenotype with a
high body fat and low muscle mass persists into childhood (55). Many studies used infant birth
weight as a surrogate marker of infant adiposity; however, birth weight does not account for the
compartment of body weight that is fat or lean body mass. Some studies used skinfold thickness
to estimate infant body fat; however, the accuracy of body fat estimated by skinfold thickness
depends on the skill and experience of operators. Our study used ADP (Pea Pod®) to measure
neonatal body composition, which measured infant body weight and body volume and used a
gender and age-specific equation to calculate neonatal body fat. It is an accurate, easy, quick and
safe way to assess neonatal body composition. The evaluation of maternal factors related to
neonatal body composition may shed light on the issue of fetal programming or the “fetal origins
of adult disease” hypothesis.
5.2.3. Strengths and limitations
5.2.3.1. Strengths
There are several strengths of our study. First, we measured maternal body composition
during pregnancy using a multi-compartment model, which is the only validated method to assess
maternal body composition during pregnancy. We measured the components of maternal body
weight (FM and FFM) during gestation which reflects the in utero environment and is related that
to neonatal outcomes. Second, we measured neonatal body composition in a few days after birth
to avoid the potential influence of ex utero environment, such as mode of feeding (breastfeed vs.
formula). Third, we tracked all of our participants’ weight records throughout gestation and
calculated their weight gain rate (kg/week) during different trimesters.
91
5.2.3.2. Limitations
Our study has limitations as well. First, our sample size is small (n = 43 for Chapter 3 and
n = 48 for Chapter 4). The small sample we had limited our statistical analysis when we want to
control for potential confounding variables. Second, this is a cross-sectional study; we did not
monitor the changes of maternal body composition from pre-pregnancy to delivery. We don’t
know if the changes of maternal body composition relate to neonatal outcomes or if these changes
have any interaction with pre-pregnancy BMI on neonatal body composition. At last, because of
our small sample size, we correlated each dependent variable and independent variable in
separated regression models. In total, we ran 20 regression models for Chapter 3 and 12
regression models for Chapter 4 using the same cohort, which increased the type I error
probability for our study.
5.3. Future Directions
Future studies are needed to validate our results. First, studies with larger sample size are
needed to evaluate if the relationship between maternal and neonatal body composition varies by
pre-pregnancy BMI. Second, repeated measures of maternal body composition during pregnancy
are needed to see whether the changes of maternal fat and lean body mass influence neonatal
body composition at birth. Third, our study only recruited healthy pregnant women and pregnant
women with complications such as gestational diabetes mellitus and preeclampsia need to be
studied since those complications might have different effects on neonatal body composition
compared to healthy women. Fourth, growth rate and follow up measurements in offspring are
needed to observe how neonatal body fat at birth related to long-term health. Last, most of the
studies assessed the effects of maternal factors on neonatal outcomes were observational studies,
behavior interventions are needed to validate the effects of maternal environment on neonatal
outcomes.
92
5.4. Conclusions
This study is innovative because we related neonatal body composition to maternal body
composition using the four-compartment model in wide a range of pre-pregnancy BMI. Maternal
body volume was measured using ADP late in pregnancy and this has never been published
before. Neonatal FM was measured by ADP at birth, which has never been related to maternal
body composition before.
We found a relationship between maternal body composition late in pregnancy and
neonatal body composition at birth. A positive relationship was found between maternal TBW
and FFM and neonatal FFM. The relationship between maternal FM and neonatal FM approached
significance. Maternal GWG during the 2nd
and 3rd
trimesters was related to neonatal body fat.
The effects of trimester-specific GWG on neonatal body fat varied by maternal pre-pregnancy
BMI. Neonates born to normal weight women had more body fat if women gained weight late in
pregnancy, while neonates born to overweight and obese women had more body fat if women
gained weight during early gestation.
Future studies are needed to verify our results in a larger sample size with more obese women and
to clarify the effects of changes in maternal body composition during gestation on neonatal body
composition.
93
REFERENCE
1. Flegal KM, Carroll MD, Ogden CL, Curtin LR. Prevalence and trends in obesity among
US adults, 1999-2008. JAMA : the journal of the American Medical Association
2010;303(3):235-41. doi: 10.1001/jama.2009.2014.
2. Ehrenberg HM, Dierker L, Milluzzi C, Mercer BM. Prevalence of maternal obesity in an
urban center. American journal of obstetrics and gynecology 2002;187(5):1189-93.
3. LaCoursiere DY, Bloebaum L, Duncan JD, Varner MW. Population-based trends and
correlates of maternal overweight and obesity, Utah 1991-2001. Am J Obstet Gynecol
2005;192(3):832-9. doi: 10.1016/j.ajog.2004.11.034.
4. Hinkle SN, Sharma AJ, Kim SY, et al. Prepregnancy obesity trends among low-income
women, United States, 1999-2008. Matern Child Health J 2012;16(7):1339-48. doi:
10.1007/s10995-011-0898-2.
5. Sibai BM, Ewell M, Levine RJ, et al. Risk factors associated with preeclampsia in
healthy nulliparous women. The Calcium for Preeclampsia Prevention (CPEP) Study
Group. American journal of obstetrics and gynecology 1997;177(5):1003-10.
6. Sibai BM, Gordon T, Thom E, et al. Risk factors for preeclampsia in healthy nulliparous
women: a prospective multicenter study. The National Institute of Child Health and
Human Development Network of Maternal-Fetal Medicine Units. American journal of
obstetrics and gynecology 1995;172(2 Pt 1):642-8.
7. Bodnar LM, Ness RB, Markovic N, Roberts JM. The risk of preeclampsia rises with
increasing prepregnancy body mass index. Annals of epidemiology 2005;15(7):475-82.
doi: 10.1016/j.annepidem.2004.12.008.
8. Weiss JL, Malone FD, Emig D, et al. Obesity, obstetric complications and cesarean
delivery rate--a population-based screening study. American journal of obstetrics and
gynecology 2004;190(4):1091-7. doi: 10.1016/j.ajog.2003.09.058.
94
9. Hamilton-Fairley D, Kiddy D, Watson H, Paterson C, Franks S. Association of moderate
obesity with a poor pregnancy outcome in women with polycystic ovary syndrome
treated with low dose gonadotrophin. British journal of obstetrics and gynaecology
1992;99(2):128-31.
10. Chambers JC, Eda S, Bassett P, et al. C-reactive protein, insulin resistance, central
obesity, and coronary heart disease risk in Indian Asians from the United Kingdom
compared with European whites. Circulation 2001;104(2):145-50.
11. Whitaker RC. Predicting preschooler obesity at birth: the role of maternal obesity in early
pregnancy. Pediatrics 2004;114(1):e29-36.
12. Mokdad AH, Ford ES, Bowman BA, et al. Diabetes trends in the U.S.: 1990-1998.
Diabetes care 2000;23(9):1278-83.
13. Reilly JJ, Armstrong J, Dorosty AR, et al. Early life risk factors for obesity in childhood:
cohort study. BMJ 2005;330(7504):1357. doi: 10.1136/bmj.38470.670903.E0.
14. Parsons TJ, Power C, Manor O. Fetal and early life growth and body mass index from
birth to early adulthood in 1958 British cohort: longitudinal study. BMJ
2001;323(7325):1331-5.
15. Catalano PM, Farrell K, Thomas A, et al. Perinatal risk factors for childhood obesity and
metabolic dysregulation. Am J Clin Nutr 2009;90(5):1303-13. doi:
10.3945/ajcn.2008.27416.
16. Berne RM. Physiology. 5th ed. St. Louis: Mosby, 2004.
17. Catalano PM, Ehrenberg HM. The short- and long-term implications of maternal obesity
on the mother and her offspring. BJOG : an international journal of obstetrics and
gynaecology 2006;113(10):1126-33. doi: 10.1111/j.1471-0528.2006.00989.x.
18. Jarvie E, Hauguel-de-Mouzon S, Nelson SM, Sattar N, Catalano PM, Freeman DJ.
Lipotoxicity in obese pregnancy and its potential role in adverse pregnancy outcome and
obesity in the offspring. Clin Sci (Lond) 2010;119(3):123-9. doi: 10.1042/CS20090640.
95
19. Radaelli T, Lepercq J, Varastehpour A, Basu S, Catalano PM, Hauguel-De Mouzon S.
Differential regulation of genes for fetoplacental lipid pathways in pregnancy with
gestational and type 1 diabetes mellitus. American journal of obstetrics and gynecology
2009;201(2):209 e1- e10. doi: 10.1016/j.ajog.2009.04.019.
20. Challier JC, Basu S, Bintein T, et al. Obesity in pregnancy stimulates macrophage
accumulation and inflammation in the placenta. Placenta 2008;29(3):274-81. doi:
10.1016/j.placenta.2007.12.010.
21. Barker DJ, Winter PD, Osmond C, Margetts B, Simmonds SJ. Weight in infancy and
death from ischaemic heart disease. Lancet 1989;2(8663):577-80.
22. Kajantie E. Fetal origins of stress-related adult disease. Annals of the New York
Academy of Sciences 2006;1083:11-27. doi: 10.1196/annals.1367.026.
23. Barker DJ. The intrauterine environment and adult cardiovascular disease. Ciba
Foundation symposium 1991;156:3-10; discussion -6.
24. Hales CN, Barker DJ. Type 2 (non-insulin-dependent) diabetes mellitus: the thrifty
phenotype hypothesis. Diabetologia 1992;35(7):595-601.
25. Martyn CN, Greenwald SE. A hypothesis about a mechanism for the programming of
blood pressure and vascular disease in early life. Clinical and experimental pharmacology
& physiology 2001;28(11):948-51.
26. Martin H, Gazelius B, Norman M. Impaired acetylcholine-induced vascular relaxation in
low birth weight infants: implications for adult hypertension? Pediatric research
2000;47(4 Pt 1):457-62.
27. Martin H, Hu J, Gennser G, Norman M. Impaired endothelial function and increased
carotid stiffness in 9-year-old children with low birthweight. Circulation
2000;102(22):2739-44.
28. Phillips DI, Barker DJ. Association between low birthweight and high resting pulse in
adult life: is the sympathetic nervous system involved in programming the insulin
96
resistance syndrome? Diabetic medicine : a journal of the British Diabetic Association
1997;14(8):673-7. doi: 10.1002/(SICI)1096-9136(199708)14:8<673::AID-
DIA458>3.0.CO;2-9.
29. Johansson S, Norman M, Legnevall L, Dalmaz Y, Lagercrantz H, Vanpee M. Increased
catecholamines and heart rate in children with low birth weight: perinatal contributions to
sympathoadrenal overactivity. Journal of internal medicine 2007;261(5):480-7. doi:
10.1111/j.1365-2796.2007.01776.x.
30. Joh TH, Hwang O. Dopamine beta-hydroxylase: biochemistry and molecular biology.
Annals of the New York Academy of Sciences 1987;493:342-50.
31. Dabelea D, Crume T. Maternal environment and the transgenerational cycle of obesity
and diabetes. Diabetes 2011;60(7):1849-55. doi: 10.2337/db11-0400.
32. Bouchard L, Thibault S, Guay SP, et al. Leptin gene epigenetic adaptation to impaired
glucose metabolism during pregnancy. Diabetes care 2010;33(11):2436-41. doi:
10.2337/dc10-1024.
33. Waterland RA, Travisano M, Tahiliani KG. Diet-induced hypermethylation at agouti
viable yellow is not inherited transgenerationally through the female. The FASEB
journal : official publication of the Federation of American Societies for Experimental
Biology 2007;21(12):3380-5. doi: 10.1096/fj.07-8229com.
34. Curhan GC, Chertow GM, Willett WC, et al. Birth weight and adult hypertension and
obesity in women. Circulation 1996;94(6):1310-5.
35. Curhan GC, Willett WC, Rimm EB, Spiegelman D, Ascherio AL, Stampfer MJ. Birth
weight and adult hypertension, diabetes mellitus, and obesity in US men. Circulation
1996;94(12):3246-50.
36. Barker DJ, Martyn CN, Osmond C, Hales CN, Fall CH. Growth in utero and serum
cholesterol concentrations in adult life. BMJ 1993;307(6918):1524-7.
97
37. Hales CN, Barker DJ, Clark PM, et al. Fetal and infant growth and impaired glucose
tolerance at age 64. BMJ 1991;303(6809):1019-22.
38. Stanner SA, Bulmer K, Andres C, et al. Does malnutrition in utero determine diabetes
and coronary heart disease in adulthood? Results from the Leningrad siege study, a cross
sectional study. BMJ 1997;315(7119):1342-8.
39. Marsal K. Intrauterine growth restriction. Current opinion in obstetrics & gynecology
2002;14(2):127-35.
40. Catalano P, Ashmead GG, Huston-Presley L, Amini SB. The obesity cycle comes full
circle: increasing trends in birth weight. Diabetes in Pregnancy Study Group 37th Annual
Meeting. Myconos, Greece, 2005.
41. Ehrenberg HM, Durnwald CP, Catalano P, Mercer BM. The influence of obesity and
diabetes on the risk of cesarean delivery. American journal of obstetrics and gynecology
2004;191(3):969-74. doi: 10.1016/j.ajog.2004.06.057.
42. Szostak-Wegierek D, Szamotulska K, Szponar L. [Influence of maternal nutrition on
infant birthweight]. Ginekologia polska 2004;75(9):692-8.
43. Shapiro C, Sutija VG, Bush J. Effect of maternal weight gain on infant birth weight.
Journal of perinatal medicine 2000;28(6):428-31. doi: 10.1515/JPM.2000.056.
44. Kirchengast S, Hartmann B. Maternal prepregnancy weight status and pregnancy weight
gain as major determinants for newborn weight and size. Annals of human biology
1998;25(1):17-28.
45. Frisancho AR. Prenatal compared with parental origins of adolescent fatness. The
American journal of clinical nutrition 2000;72(5):1186-90.
46. Rasmussen F, Johansson M. The relation of weight, length and ponderal index at birth to
body mass index and overweight among 18-year-old males in Sweden. European journal
of epidemiology 1998;14(4):373-80.
98
47. Sorensen HT, Sabroe S, Rothman KJ, Gillman M, Fischer P, Sorensen TI. Relation
between weight and length at birth and body mass index in young adulthood: cohort
study. BMJ 1997;315(7116):1137.
48. Eide MG, Oyen N, Skjaerven R, Nilsen ST, Bjerkedal T, Tell GS. Size at birth and
gestational age as predictors of adult height and weight. Epidemiology 2005;16(2):175-
81.
49. Tuvemo T, Cnattingius S, Jonsson B. Prediction of male adult stature using
anthropometric data at birth: a nationwide population-based study. Pediatric research
1999;46(5):491-5.
50. Oken E, Gillman MW. Fetal origins of obesity. Obesity research 2003;11(4):496-506. doi:
10.1038/oby.2003.69.
51. Garn SM, Clark DC. Trends in fatness and the origins of obesity Ad Hoc Committee to
Review the Ten-State Nutrition Survey. Pediatrics 1976;57(4):443-56.
52. Garn SM, Cole PE, Bailey SM. Living together as a factor in family-line resemblances.
Human biology 1979;51(4):565-87.
53. Rasmussen KM. The "fetal origins" hypothesis: challenges and opportunities for maternal
and child nutrition. Annual review of nutrition 2001;21:73-95. doi:
10.1146/annurev.nutr.21.1.73.
54. WHO Expert Committee on Physical Status: the Use and Interpretation of
Anthropometry. Physical status : the use and interpretation of anthropometry : report of a
WHO Expert Committee. Geneva: World Health Organization, 1995.
55. Barker DJ, Osmond C, Kajantie E, Eriksson JG. Growth and chronic disease: findings in
the Helsinki Birth Cohort. Annals of human biology 2009;36(5):445-58. doi:
10.1080/03014460902980295.
99
56. Yliharsila H, Kajantie E, Osmond C, Forsen T, Barker DJ, Eriksson JG. Body mass index
during childhood and adult body composition in men and women aged 56-70 y. The
American journal of clinical nutrition 2008;87(6):1769-75.
57. Yliharsila H, Kajantie E, Osmond C, Forsen T, Barker DJ, Eriksson JG. Birth size, adult
body composition and muscle strength in later life. Int J Obes (Lond) 2007;31(9):1392-9.
doi: 10.1038/sj.ijo.0803612.
58. McMillen IC, Robinson JS. Developmental origins of the metabolic syndrome: prediction,
plasticity, and programming. Physiological reviews 2005;85(2):571-633. doi:
10.1152/physrev.00053.2003.
59. Wilson SJ, Ross JJ, Harris AJ. A critical period for formation of secondary myotubes
defined by prenatal undernourishment in rats. Development 1988;102(4):815-21.
60. Dwyer CM, Stickland NC. Does the anatomical location of a muscle affect the influence
of undernutrition on muscle fibre number? Journal of anatomy 1992;181 ( Pt 2):373-6.
61. Eriksson JG, Forsen T, Tuomilehto J, Jaddoe VW, Osmond C, Barker DJ. Effects of size
at birth and childhood growth on the insulin resistance syndrome in elderly individuals.
Diabetologia 2002;45(3):342-8. doi: 10.1007/s00125-001-0757-6.
62. Ravelli GP, Stein ZA, Susser MW. Obesity in young men after famine exposure in utero
and early infancy. The New England journal of medicine 1976;295(7):349-53. doi:
10.1056/NEJM197608122950701.
63. Ahima RS. Adipose tissue as an endocrine organ. Obesity (Silver Spring) 2006;14 Suppl
5:242S-9S. doi: 10.1038/oby.2006.317.
64. Matsuda J, Yokota I, Iida M, et al. Serum leptin concentration in cord blood: relationship
to birth weight and gender. The Journal of clinical endocrinology and metabolism
1997;82(5):1642-4.
65. Phillips DI, Fall CH, Cooper C, Norman RJ, Robinson JS, Owens PC. Size at birth and
plasma leptin concentrations in adult life. International journal of obesity and related
100
metabolic disorders : journal of the International Association for the Study of Obesity
1999;23(10):1025-9.
66. Metcalfe NB, Monaghan P. Compensation for a bad start: grow now, pay later? Trends in
ecology & evolution 2001;16(5):254-60.
67. Eriksson JG, Forsen T, Tuomilehto J, Osmond C, Barker DJ. Early growth and coronary
heart disease in later life: longitudinal study. BMJ 2001;322(7292):949-53.
68. Forsen T, Eriksson J, Tuomilehto J, Reunanen A, Osmond C, Barker D. The fetal and
childhood growth of persons who develop type 2 diabetes. Annals of internal medicine
2000;133(3):176-82.
69. Forsen T, Eriksson JG, Tuomilehto J, Osmond C, Barker DJ. Growth in utero and during
childhood among women who develop coronary heart disease: longitudinal study. BMJ
1999;319(7222):1403-7.
70. Colle E, Schiff D, Andrew G, Bauer CB, Fitzhardinge P. Insulin responses during catch-
up growth of infants who were small for gestational age. Pediatrics 1976;57(3):363-71.
71. Dietz WH. Critical periods in childhood for the development of obesity. The American
journal of clinical nutrition 1994;59(5):955-9.
72. Chauhan SP, Grobman WA, Gherman RA, et al. Suspicion and treatment of the
macrosomic fetus: a review. American journal of obstetrics and gynecology
2005;193(2):332-46. doi: 10.1016/j.ajog.2004.12.020.
73. Ananth CV, Wen SW. Trends in fetal growth among singleton gestations in the United
States and Canada, 1985 through 1998. Seminars in perinatology 2002;26(4):260-7.
74. Hediger ML, Overpeck MD, Maurer KR, Kuczmarski RJ, McGlynn A, Davis WW.
Growth of infants and young children born small or large for gestational age: findings
from the Third National Health and Nutrition Examination Survey. Archives of pediatrics
& adolescent medicine 1998;152(12):1225-31.
101
75. Castro LC, Avina RL. Maternal obesity and pregnancy outcomes. Current opinion in
obstetrics & gynecology 2002;14(6):601-6. doi: 10.1097/01.gco.0000045486.15021.C9.
76. Galtier-Dereure F, Boegner C, Bringer J. Obesity and pregnancy: complications and cost.
The American journal of clinical nutrition 2000;71(5 Suppl):1242S-8S.
77. Hediger ML, Overpeck MD, McGlynn A, Kuczmarski RJ, Maurer KR, Davis WW.
Growth and fatness at three to six years of age of children born small- or large-for-
gestational age. Pediatrics 1999;104(3):e33.
78. Boney CM, Verma A, Tucker R, Vohr BR. Metabolic syndrome in childhood: association
with birth weight, maternal obesity, and gestational diabetes mellitus. Pediatrics
2005;115(3):e290-6. doi: 10.1542/peds.2004-1808.
79. Wang X, Liang L, Junfen FU, Lizhong DU. Metabolic syndrome in obese children born
large for gestational age. Indian journal of pediatrics 2007;74(6):561-5.
80. Schubring C, Englaro P, Siebler T, et al. Longitudinal analysis of maternal serum leptin
levels during pregnancy, at birth and up to six weeks after birth: relation to body mass
index, skinfolds, sex steroids and umbilical cord blood leptin levels. Hormone research
1998;50(5):276-83.
81. Kiess W, Petzold S, Topfer M, et al. Adipocytes and adipose tissue. Best practice &
research Clinical endocrinology & metabolism 2008;22(1):135-53. doi:
10.1016/j.beem.2007.10.002.
82. Howie GJ, Sloboda DM, Kamal T, Vickers MH. Maternal nutritional history predicts
obesity in adult offspring independent of postnatal diet. The Journal of physiology
2009;587(Pt 4):905-15. doi: 10.1113/jphysiol.2008.163477.
83. McCurdy CE, Bishop JM, Williams SM, et al. Maternal high-fat diet triggers lipotoxicity
in the fetal livers of nonhuman primates. The Journal of clinical investigation
2009;119(2):323-35. doi: 10.1172/JCI32661.
102
84. Carmody JS, Wan P, Accili D, Zeltser LM, Leibel RL. Respective contributions of
maternal insulin resistance and diet to metabolic and hypothalamic phenotypes of
progeny. Obesity (Silver Spring) 2011;19(3):492-9. doi: 10.1038/oby.2010.245.
85. Institute of Medicine (U.S.). Subcommittee on Nutritional Status and Weight Gain during
Pregnancy., Institute of Medicine (U.S.). Subcommittee on Dietary Intake and Nutrient
Supplements during Pregnancy. Nutrition during pregnancy : part I, weight gain : part II,
nutrient supplements. Washington, D.C.: National Academy Press, 1990.
86. McMillen IC, Muhlhausler BS, Duffield JA, Yuen BS. Prenatal programming of
postnatal obesity: fetal nutrition and the regulation of leptin synthesis and secretion
before birth. The Proceedings of the Nutrition Society 2004;63(3):405-12.
87. Muhlhausler BS, Adam CL, Findlay PA, Duffield JA, McMillen IC. Increased maternal
nutrition alters development of the appetite-regulating network in the brain. The FASEB
journal : official publication of the Federation of American Societies for Experimental
Biology 2006;20(8):1257-9. doi: 10.1096/fj.05-5241fje.
88. Muhlhausler BS, Roberts CT, McFarlane JR, Kauter KG, McMillen IC. Fetal leptin is a
signal of fat mass independent of maternal nutrition in ewes fed at or above maintenance
energy requirements. Biology of reproduction 2002;67(2):493-9.
89. Muhlhausler BS, Duffield JA, McMillen IC. Increased maternal nutrition stimulates
peroxisome proliferator activated receptor-gamma, adiponectin, and leptin messenger
ribonucleic acid expression in adipose tissue before birth. Endocrinology
2007;148(2):878-85. doi: 10.1210/en.2006-1115.
90. Muhlhausler BS, Roberts CT, Yuen BS, et al. Determinants of fetal leptin synthesis, fat
mass, and circulating leptin concentrations in well-nourished ewes in late pregnancy.
Endocrinology 2003;144(11):4947-54. doi: 10.1210/en.2003-0555.
91. Kabali C, Werler MM. Pre-pregnant body mass index, weight gain and the risk of
delivering large babies among non-diabetic mothers. International journal of gynaecology
103
and obstetrics: the official organ of the International Federation of Gynaecology and
Obstetrics 2007;97(2):100-4. doi: 10.1016/j.ijgo.2007.02.001.
92. Wu G, Bazer FW, Cudd TA, Meininger CJ, Spencer TE. Maternal nutrition and fetal
development. The Journal of nutrition 2004;134(9):2169-72.
93. Seidman DS, Laor A, Gale R, Stevenson DK, Danon YL. A longitudinal study of birth
weight and being overweight in late adolescence. Am J Dis Child 1991;145(7):782-5.
94. Fall CH, Osmond C, Barker DJ, et al. Fetal and infant growth and cardiovascular risk
factors in women. BMJ 1995;310(6977):428-32.
95. Fisch RO, Bilek MK, Ulstrom R. Obesity and leanness at birth and their relationship to
body habitus in later childhood. Pediatrics 1975;56(4):521-8.
96. O'Callaghan MJ, Williams GM, Andersen MJ, Bor W, Najman JM. Obstetric and
perinatal factors as predictors of child behaviour at 5 years. Journal of paediatrics and
child health 1997;33(6):497-503.
97. Lausten-Thomsen U, Bille DS, Nasslund I, Folskov L, Larsen T, Holm JC. Neonatal
anthropometrics and correlation to childhood obesity--data from the Danish Children's
Obesity Clinic. European journal of pediatrics 2013;172(6):747-51. doi: 10.1007/s00431-
013-1949-z.
98. Binkin NJ, Yip R, Fleshood L, Trowbridge FL. Birth weight and childhood growth.
Pediatrics 1988;82(6):828-34.
99. Zive MM, McKay H, Frank-Spohrer GC, Broyles SL, Nelson JA, Nader PR. Infant-
feeding practices and adiposity in 4-y-old Anglo- and Mexican-Americans. The
American journal of clinical nutrition 1992;55(6):1104-8.
100. Hui LL, Schooling CM, Leung SS, et al. Birth weight, infant growth, and childhood body
mass index: Hong Kong's children of 1997 birth cohort. Archives of pediatrics &
adolescent medicine 2008;162(3):212-8. doi: 10.1001/archpediatrics.2007.62.
104
101. He Q, Ding ZY, Fong DY, Karlberg J. Risk factors of obesity in preschool children in
China: a population-based case--control study. International journal of obesity and related
metabolic disorders : journal of the International Association for the Study of Obesity
2000;24(11):1528-36.
102. Rugholm S, Baker JL, Olsen LW, Schack-Nielsen L, Bua J, Sorensen TI. Stability of the
association between birth weight and childhood overweight during the development of
the obesity epidemic. Obes Res 2005;13(12):2187-94. doi: 10.1038/oby.2005.271.
103. Kromeyer-Hauschild K, Zellner K, Jaeger U, Hoyer H. Prevalence of overweight and
obesity among school children in Jena (Germany). International journal of obesity and
related metabolic disorders : journal of the International Association for the Study of
Obesity 1999;23(11):1143-50.
104. Whitaker RC, Pepe MS, Wright JA, Seidel KD, Dietz WH. Early adiposity rebound and
the risk of adult obesity. Pediatrics 1998;101(3):E5.
105. Moulton CR. AGE AND CHEMICAL DEVELOPMENT IN MAMMALS. Journal of
Biological Chemistry 1923;57(1):79-97.
106. Catalano PM, Tyzbir ED, Allen SR, McBean JH, McAuliffe TL. Evaluation of fetal
growth by estimation of neonatal body composition. Obstetrics and gynecology
1992;79(1):46-50.
107. Sainz RD, Urlando A. Evaluation of a new pediatric air-displacement plethysmograph for
body-composition assessment by means of chemical analysis of bovine tissue phantoms.
The American journal of clinical nutrition 2003;77(2):364-70.
108. Ma G, Yao M, Liu Y, et al. Validation of a new pediatric air-displacement
plethysmograph for assessing body composition in infants. The American journal of
clinical nutrition 2004;79(4):653-60.
105
109. Yao M, Nommsen-Rivers L, Dewey K, Urlando A. Preliminary evaluation of a new
pediatric air displacement plethysmograph for body composition assessment in infants.
Acta diabetologica 2003;40 Suppl 1:S55-8. doi: 10.1007/s00592-003-0027-9.
110. Heymsfield S. Human body composition. 2nd ed. Champaign, IL: Human Kinetics, 2005.
111. Rodriguez G, Ventura P, Samper MP, Moreno L, Sarria A, Perez-Gonzalez JM. Changes
in body composition during the initial hours of life in breast-fed healthy term newborns.
Biology of the neonate 2000;77(1):12-6.
112. Butte NF, Hopkinson JM, Wong WW, Smith EO, Ellis KJ. Body composition during the
first 2 years of life: an updated reference. Pediatric research 2000;47(5):578-85.
113. Fomon SJ, Haschke F, Ziegler EE, Nelson SE. Body composition of reference children
from birth to age 10 years. The American journal of clinical nutrition 1982;35(5
Suppl):1169-75.
114. Schmelzle HR, Fusch C. Body fat in neonates and young infants: validation of skinfold
thickness versus dual-energy X-ray absorptiometry. The American journal of clinical
nutrition 2002;76(5):1096-100.
115. Olhager E, Forsum E. Assessment of total body fat using the skinfold technique in full-
term and preterm infants. Acta Paediatr 2006;95(1):21-8. doi:
10.1080/08035250500323731.
116. de Bruin NC, van Velthoven KA, Stijnen T, Juttmann RE, Degenhart HJ, Visser HK.
Quantitative assessment of infant body fat by anthropometry and total-body electrical
conductivity. The American journal of clinical nutrition 1995;61(2):279-86.
117. Koo WW, Walters JC, Hockman EM. Body composition in human infants at birth and
postnatally. The Journal of nutrition 2000;130(9):2188-94.
118. Koo WW, Walters JC, Hockman EM. Body composition in neonates: relationship
between measured and derived anthropometry with dual-energy X-ray absorptiometry
106
measurements. Pediatric research 2004;56(5):694-700. doi:
10.1203/01.PDR.0000142587.59238.BD.
119. Catalano PM, Thomas AJ, Avallone DA, Amini SB. Anthropometric estimation of
neonatal body composition. American journal of obstetrics and gynecology
1995;173(4):1176-81.
120. Olhager E, Flinke E, Hannerstad U, Forsum E. Studies on human body composition
during the first 4 months of life using magnetic resonance imaging and isotope dilution.
Pediatric research 2003;54(6):906-12. doi: 10.1203/01.PDR.0000088064.63106.5E.
121. Butte N, Heinz C, Hopkinson J, Wong W, Shypailo R, Ellis K. Fat mass in infants and
toddlers: comparability of total body water, total body potassium, total body electrical
conductivity, and dual-energy X-ray absorptiometry. Journal of pediatric
gastroenterology and nutrition 1999;29(2):184-9.
122. de Bruin NC, Westerterp KR, Degenhart HJ, Visser HK. Measurement of fat-free mass in
infants. Pediatric research 1995;38(3):411-7.
123. Fiorotto ML, de Bruin NC, Brans YW, Degenhart HJ, Visser HK. Total body electrical
conductivity measurements: an evaluation of current instrumentation for infants. Pediatric
research 1995;37(1):94-100.
124. de Bruin NC, van Velthoven KA, Stijnen T, Juttmann RE, Degenhart HJ, Visser HK.
Body fat and fat-free mass in infants: new and classic anthropometric indexes and
prediction equations compared with total-body electrical conductivity. The American
journal of clinical nutrition 1995;61(6):1195-205.
125. Sewell MF, Huston-Presley L, Super DM, Catalano P. Increased neonatal fat mass, not
lean body mass, is associated with maternal obesity. American journal of obstetrics and
gynecology 2006;195(4):1100-3. doi: 10.1016/j.ajog.2006.06.014.
107
126. Rigo J, Nyamugabo K, Picaud JC, Gerard P, Pieltain C, De Curtis M. Reference values of
body composition obtained by dual energy X-ray absorptiometry in preterm and term
neonates. Journal of pediatric gastroenterology and nutrition 1998;27(2):184-90.
127. Hammami M, Koo WW, Hockman EM. Body composition of neonates from fan beam
dual energy X-ray absorptiometry measurement. JPEN Journal of parenteral and enteral
nutrition 2003;27(6):423-6.
128. Crozier SR, Inskip HM, Godfrey KM, et al. Weight gain in pregnancy and childhood
body composition: findings from the Southampton Women's Survey. The American
journal of clinical nutrition 2010;91(6):1745-51. doi: 10.3945/ajcn.2009.29128.
129. Urlando A, Dempster P, Aitkens S. A new air displacement plethysmograph for the
measurement of body composition in infants. Pediatric research 2003;53(3):486-92.
130. Carberry AE, Colditz PB, Lingwood BE. Body composition from birth to 4.5 months in
infants born to non-obese women. Pediatric research 2010;68(1):84-8. doi:
10.1203/PDR.0b013e3181df5421.
131. Hull HR, Dinger MK, Knehans AW, Thompson DM, Fields DA. Impact of maternal
body mass index on neonate birthweight and body composition. American journal of
obstetrics and gynecology 2008;198(4):416 e1-6. doi: 10.1016/j.ajog.2007.10.796.
132. Hull HR, Thornton JC, Ji Y, et al. Higher infant body fat with excessive gestational
weight gain in overweight women. American journal of obstetrics and gynecology
2011;205(3):211 e1-7. doi: 10.1016/j.ajog.2011.04.004.
133. Letsky E. The hematological system. Edtion ed. In: Hytten FE, Chamberlain G, eds.
Clinical Physiology in Obstetrics. Oxford, UK: Blackwell, 1991:40-2.
134. Brace RA, Wolf EJ. Normal amniotic fluid volume changes throughout pregnancy.
American journal of obstetrics and gynecology 1989;161(2):382-8.
108
135. Butte NF, Ellis KJ, Wong WW, Hopkinson JM, Smith EO. Composition of gestational
weight gain impacts maternal fat retention and infant birth weight. American journal of
obstetrics and gynecology 2003;189(5):1423-32.
136. Hytten FE, Thomson AM, Taggart N. Total body water in normal pregnancy. The Journal
of obstetrics and gynaecology of the British Commonwealth 1966;73(4):553-61.
137. Catalano PM, Wong WW, Drago NM, Amini SB. Estimating body composition in late
gestation: a new hydration constant for body density and total body water. The American
journal of physiology 1995;268(1 Pt 1):E153-8.
138. Kopp-Hoolihan LE, van Loan MD, Wong WW, King JC. Fat mass deposition during
pregnancy using a four-component model. Journal of applied physiology 1999;87(1):196-
202.
139. Hopkinson JM, Butte NF, Ellis KJ, Wong WW, Puyau MR, Smith EO. Body fat
estimation in late pregnancy and early postpartum: comparison of two-, three-, and four-
component models. The American journal of clinical nutrition 1997;65(2):432-8.
140. Heymsfield SB, Lichtman S, Baumgartner RN, et al. Body composition of humans:
comparison of two improved four-compartment models that differ in expense, technical
complexity, and radiation exposure. The American journal of clinical nutrition
1990;52(1):52-8.
141. Friedl KE, DeLuca JP, Marchitelli LJ, Vogel JA. Reliability of body-fat estimations from
a four-compartment model by using density, body water, and bone mineral measurements.
The American journal of clinical nutrition 1992;55(4):764-70.
142. Lederman SA, Pierson RN, Jr., Wang J, et al. Body composition measurements during
pregnancy. Basic life sciences 1993;60:193-5.
143. Fidanza F. The density of fat-free body mass during pregnancy. International journal for
vitamin and nutrition research Internationale Zeitschrift fur Vitamin- und
109
Ernahrungsforschung Journal international de vitaminologie et de nutrition
1987;57(1):104.
144. van Raaij JM, Peek ME, Vermaat-Miedema SH, Schonk CM, Hautvast JG. New
equations for estimating body fat mass in pregnancy from body density or total body
water. The American journal of clinical nutrition 1988;48(1):24-9.
145. Chamberlain G, Broughton-Pipkin F. Clinical physiology in obstetrics. 3rd ed. Malden,
MA: Blackwell Science, 1998.
146. Paxton A, Lederman SA, Heymsfield SB, Wang J, Thornton JC, Pierson RN, Jr.
Anthropometric equations for studying body fat in pregnant women. The American
journal of clinical nutrition 1998;67(1):104-10.
147. Forsum E, Sadurskis A, Wager J. Estimation of body fat in healthy Swedish women
during pregnancy and lactation. The American journal of clinical nutrition
1989;50(3):465-73.
148. Stamnes Koepp UM, Frost Andersen L, Dahl-Joergensen K, Stigum H, Nass O, Nystad
W. Maternal pre-pregnant body mass index, maternal weight change and offspring
birthweight. Acta obstetricia et gynecologica Scandinavica 2012;91(2):243-9. doi:
10.1111/j.1600-0412.2011.01321.x.
149. Kalk P, Guthmann F, Krause K, et al. Impact of maternal body mass index on neonatal
outcome. European journal of medical research 2009;14(5):216-22.
150. Sebire NJ, Jolly M, Harris JP, et al. Maternal obesity and pregnancy outcome: a study of
287,213 pregnancies in London. Int J Obes Relat Metab Disord 2001;25(8):1175-82. doi:
10.1038/sj.ijo.0801670.
151. Frederick IO, Williams MA, Sales AE, Martin DP, Killien M. Pre-pregnancy body mass
index, gestational weight gain, and other maternal characteristics in relation to infant
birth weight. Maternal and child health journal 2008;12(5):557-67. doi: 10.1007/s10995-
007-0276-2.
110
152. Neggers Y, Goldenberg RL, Cliver SP, Hoffman HJ, Cutter GR. The relationship
between maternal and neonatal anthropometric measurements in term newborns.
Obstetrics and gynecology 1995;85(2):192-6. doi: 10.1016/0029-7844(94)00364-J.
153. Yu Z, Han S, Zhu J, Sun X, Ji C, Guo X. Pre-pregnancy body mass index in relation to
infant birth weight and offspring overweight/obesity: a systematic review and meta-
analysis. PloS one 2013;8(4):e61627. doi: 10.1371/journal.pone.0061627.
154. Catalano PM, Thomas A, Huston-Presley L, Amini SB. Increased fetal adiposity: a very
sensitive marker of abnormal in utero development. American journal of obstetrics and
gynecology 2003;189(6):1698-704.
155. Andres A, Shankar K, Badger TM. Body fat mass of exclusively breastfed infants born to
overweight mothers. Journal of the Academy of Nutrition and Dietetics 2012;112(7):991-
5. doi: 10.1016/j.jand.2012.03.031.
156. Boucher BJ. Determinants of size at birth. QJM : monthly journal of the Association of
Physicians 2002;95(5):331; author reply -2.
157. Emanuel I, Kimpo C, Moceri V. The association of maternal growth and socio-economic
measures with infant birthweight in four ethnic groups. International journal of
epidemiology 2004;33(6):1236-42. doi: 10.1093/ije/dyh269.
158. Thame M, Osmond C, Wilks RJ, Bennett FI, McFarlane-Anderson N, Forrester TE.
Blood pressure is related to placental volume and birth weight. Hypertension
2000;35(2):662-7.
159. Cnattingius S, Bergstrom R, Lipworth L, Kramer MS. Prepregnancy weight and the risk
of adverse pregnancy outcomes. The New England journal of medicine 1998;338(3):147-
52. doi: 10.1056/NEJM199801153380302.
160. Nohr EA, Bech BH, Vaeth M, Rasmussen KM, Henriksen TB, Olsen J. Obesity,
gestational weight gain and preterm birth: a study within the Danish National Birth
111
Cohort. Paediatric and perinatal epidemiology 2007;21(1):5-14. doi: 10.1111/j.1365-
3016.2007.00762.x.
161. Vahratian A, Siega-Riz AM, Savitz DA, Zhang J. Maternal pre-pregnancy overweight
and obesity and the risk of cesarean delivery in nulliparous women. Annals of
epidemiology 2005;15(7):467-74. doi: 10.1016/j.annepidem.2005.02.005.
162. Cogswell ME, Scanlon KS, Fein SB, Schieve LA. Medically advised, mother's personal
target, and actual weight gain during pregnancy. Obstetrics and gynecology
1999;94(4):616-22.
163. Park S, Sappenfield WM, Bish C, Salihu H, Goodman D, Bensyl DM. Assessment of the
Institute of Medicine recommendations for weight gain during pregnancy: Florida, 2004-
2007. Maternal and child health journal 2011;15(3):289-301. doi: 10.1007/s10995-010-
0596-5.
164. Kanadys WM. [Pre-pregnancy body mass, gestational weight gain and birth weight].
Ginekologia polska 1998;69(12):1223-7.
165. Liu Y, Dai W, Dai X, Li Z. Prepregnancy body mass index and gestational weight gain
with the outcome of pregnancy: a 13-year study of 292,568 cases in China. Archives of
gynecology and obstetrics 2012;286(4):905-11. doi: 10.1007/s00404-012-2403-6.
166. Mamun AA, Callaway LK, O'Callaghan MJ, et al. Associations of maternal pre-
pregnancy obesity and excess pregnancy weight gains with adverse pregnancy outcomes
and length of hospital stay. BMC pregnancy and childbirth 2011;11:62. doi:
10.1186/1471-2393-11-62.
167. Thorsdottir I, Birgisdottir BE. Different weight gain in women of normal weight before
pregnancy: postpartum weight and birth weight. Obstetrics and gynecology
1998;92(3):377-83.
112
168. Langford A, Joshu C, Chang JJ, Myles T, Leet T. Does gestational weight gain affect the
risk of adverse maternal and infant outcomes in overweight women? Maternal and child
health journal 2011;15(7):860-5. doi: 10.1007/s10995-008-0318-4.
169. Jensen DM, Ovesen P, Beck-Nielsen H, et al. Gestational weight gain and pregnancy
outcomes in 481 obese glucose-tolerant women. Diabetes care 2005;28(9):2118-22.
170. Abrams B, Selvin S. Maternal weight gain pattern and birth weight. Obstetrics and
gynecology 1995;86(2):163-9.
171. Brown JE, Murtaugh MA, Jacobs DR, Jr., Margellos HC. Variation in newborn size
according to pregnancy weight change by trimester. The American journal of clinical
nutrition 2002;76(1):205-9.
172. Margerison-Zilko CE, Shrimali BP, Eskenazi B, Lahiff M, Lindquist AR, Abrams BF.
Trimester of maternal gestational weight gain and offspring body weight at birth and age
five. Maternal and child health journal 2012;16(6):1215-23. doi: 10.1007/s10995-011-
0846-1.
173. Lederman SA, Paxton A, Heymsfield SB, Wang J, Thornton J, Pierson RN, Jr. Body fat
and water changes during pregnancy in women with different body weight and weight
gain. Obstetrics and gynecology 1997;90(4 Pt 1):483-8.
174. Lederman SA, Paxton A, Heymsfield SB, Wang J, Thornton J, Pierson RN, Jr. Maternal
body fat and water during pregnancy: do they raise infant birth weight? American journal
of obstetrics and gynecology 1999;180(1 Pt 1):235-40.
175. Mardones-Santander F, Salazar G, Rosso P, Villarroel L. Maternal body composition
near term and birth weight. Obstetrics and gynecology 1998;91(6):873-7.
176. Larciprete G, Valensise H, Vasapollo B, et al. Maternal body composition at term
gestation and birth weight: is there a link? Acta diabetologica 2003;40 Suppl 1:S222-4.
doi: 10.1007/s00592-003-0071-5.
113
177. Farah N, Stuart B, Donnelly V, Kennelly MM, Turner MJ. The influence of maternal
body composition on birth weight. European journal of obstetrics, gynecology, and
reproductive biology 2011;157(1):14-7. doi: 10.1016/j.ejogrb.2010.12.047.
178. Forsum E, Lof M, Olausson H, Olhager E. Maternal body composition in relation to
infant birth weight and subcutaneous adipose tissue. The British journal of nutrition
2006;96(2):408-14.
179. Villar J, Cogswell M, Kestler E, Castillo P, Menendez R, Repke JT. Effect of fat and fat-
free mass deposition during pregnancy on birth weight. American journal of obstetrics
and gynecology 1992;167(5):1344-52.
180. Gale CR, Javaid MK, Robinson SM, Law CM, Godfrey KM, Cooper C. Maternal size in
pregnancy and body composition in children. The Journal of clinical endocrinology and
metabolism 2007;92(10):3904-11. doi: 10.1210/jc.2007-0088.
181. Ogbonna C, Woelk GB, Ning Y, Mudzamiri S, Mahomed K, Williams MA. Maternal
mid-arm circumference and other anthropometric measures of adiposity in relation to
infant birth size among Zimbabwean women. Acta obstetricia et gynecologica
Scandinavica 2007;86(1):26-32. doi: 10.1080/00016340600935664.
182. Wells JC, Chomtho S, Fewtrell MS. Programming of body composition by early growth
and nutrition. The Proceedings of the Nutrition Society 2007;66(3):423-34. doi:
10.1017/S0029665107005691.
183. Selinger A. The body as a three component system. Ann Arbor, Michigan: University of
Illinois at Urbana, 1977.
184. Going SB. Hydrodensitometry and Air Displacement Plethysmography. Edtion ed. In:
Heymsfield SB, ed. Human Body Composition Champaign,IL: Human Kinetics,
1996:17-33.
185. Collins AL, Saunders S, McCarthy HD, Williams JE, Fuller NJ. Within- and between-
laboratory precision in the measurement of body volume using air displacement
114
plethysmography and its effect on body composition assessment. International journal of
obesity and related metabolic disorders : journal of the International Association for the
Study of Obesity 2004;28(1):80-90. doi: 10.1038/sj.ijo.0802466.
186. Wilmore JH. A simplified method for determination of residual lung volumes. Journal of
applied physiology 1969;27(1):96-100.
187. Schoeller D. Hydrometry. Edtion ed. In: Heymsfield SB, ed. Human Body Composition.
Champaign, IL: Human Kinetics, 1996:25-44.
188. Yu W, Faruque O, Gallagher D, et al. An easy and inexpensive phantom for calibrating
longitudinal water measurements by tracer dilution. The FASEB journal : official
publication of the Federation of American Societies for Experimental Biology
2005;19:A66.
189. Hull H, He Q, Thornton J, et al. iDXA, Prodigy, and DPXL dual-energy X-ray
absorptiometry whole-body scans: a cross-calibration study. Journal of clinical
densitometry : the official journal of the International Society for Clinical Densitometry
2009;12(1):95-102. doi: 10.1016/j.jocd.2008.09.004.
190. Stock J, Marchard F, Kraemer R, Gutkowski P, Yishay FB, Godfrey S. Plethysmographic
assessment of Functional Residual Capacity and Airway Resistance. Edtion ed. In: Stock
J, Sly PD, Tepper RS, Morgan WJ, eds. Infant respiratory function testing. New York:
Wiley-Liss, 1996:191-239.
191. Stick S. Measurement during tidal breathing. Edtion ed. In: Stock J, Sly PD, Tepper RS,
Morgan WJ, eds. Infant respiratory function testing. New York: Wiley-Liss, 1996:117-38.
192. Ellis KJ, Yao M, Shypailo RJ, Urlando A, Wong WW, Heird WC. Body-composition
assessment in infancy: air-displacement plethysmography compared with a reference 4-
compartment model. The American journal of clinical nutrition 2007;85(1):90-5.
193. Koo WW. Body composition measurements during infancy. Annals of the New York
Academy of Sciences 2000;904:383-92.
115
194. Ellis KJ. Human body composition: in vivo methods. Physiological reviews
2000;80(2):649-80.
195. Sheng H-P, Dang T, Adolph AL, Schanler RJ, Garza C. Infant body volume
measurement by acoustic plethysmography. Edtion ed. In: Ellis KJ, Yasumura S, Morgan
WD, eds. In Vivo Body Composition Studies. London: The Institute of Physical Sciences
and Medicine, 1987:415-20.
196. Tomeo CA, Rich-Edwards JW, Michels KB, et al. Reproducibility and validity of
maternal recall of pregnancy-related events. Epidemiology 1999;10(6):774-7.
197. Lederman SA, Paxton A. Maternal reporting of prepregnancy weight and birth outcome:
consistency and completeness compared with the clinical record. Maternal and child
health journal 1998;2(2):123-6.
198. Barker M, Robinson S, Osmond C, Barker DJ. Birth weight and body fat distribution in
adolescent girls. Archives of disease in childhood 1997;77(5):381-3.
199. Barker DJ, Hales CN, Fall CH, Osmond C, Phipps K, Clark PM. Type 2 (non-insulin-
dependent) diabetes mellitus, hypertension and hyperlipidaemia (syndrome X): relation to
reduced fetal growth. Diabetologia 1993;36(1):62-7.
200. Jansson N, Rosario FJ, Gaccioli F, et al. Activation of placental mTOR signaling and
amino acid transporters in obese women giving birth to large babies. The Journal of
clinical endocrinology and metabolism 2013;98(1):105-13. doi: 10.1210/jc.2012-2667.
201. Jones HN, Jansson T, Powell TL. Full-length adiponectin attenuates insulin signaling and
inhibits insulin-stimulated amino Acid transport in human primary trophoblast cells.
Diabetes 2010;59(5):1161-70. doi: 10.2337/db09-0824.
202. Catalano PM, Drago NM, Amini SB. Maternal carbohydrate metabolism and its
relationship to fetal growth and body composition. American journal of obstetrics and
gynecology 1995;172(5):1464-70.
116
203. Rohl J, Huston-Presley L, Amini S, Stepanchak B, Catalano P. Factors associated with
fetal growth and body composition as measured by ultrasound. American journal of
obstetrics and gynecology 2001;185(6):1416-20. doi: 10.1067/mob.2001.118846.
204. Ahlsson F, Diderholm B, Jonsson B, et al. Insulin resistance, a link between maternal
overweight and fetal macrosomia in nondiabetic pregnancies. Hormone research in
paediatrics 2010;74(4):267-74. doi: 10.1159/000295710.
205. Bracero LA, Byrne DW. Optimal maternal weight gain during singleton pregnancy.
Gynecologic and obstetric investigation 1998;46(1):9-16.
206. Hediger ML, Scholl TO, Belsky DH, Ances IG, Salmon RW. Patterns of weight gain in
adolescent pregnancy: effects on birth weight and preterm delivery. Obstetrics and
gynecology 1989;74(1):6-12.
207. Institute of Medicine (US) and National Research Council (US) Committee to Reexamine
IOM Pregnancy Weight Guidelines. Weight Gain During Pregnancy: Reexamining the
Guidelines. Washington DC: National Academy of Sciences, 2009.
208. Hill B, Skouteris H, Fuller-Tyszkiewicz M. Interventions designed to limit gestational
weight gain: a systematic review of theory and meta-analysis of intervention components.
Obesity reviews : an official journal of the International Association for the Study of
Obesity 2013;14(6):435-50. doi: 10.1111/obr.12022.
209. Park MH, Falconer C, Viner RM, Kinra S. The impact of childhood obesity on morbidity
and mortality in adulthood: a systematic review. Obesity reviews : an official journal of
the International Association for the Study of Obesity 2012;13(11):985-1000. doi:
10.1111/j.1467-789X.2012.01015.x.
210. Barker DJ, Osmond C, Forsen TJ, Kajantie E, Eriksson JG. Trajectories of growth among
children who have coronary events as adults. The New England journal of medicine
2005;353(17):1802-9. doi: 10.1056/NEJMoa044160.
117
211. Hickey CA, Cliver SP, McNeal SF, Hoffman HJ, Goldenberg RL. Prenatal weight gain
patterns and birth weight among nonobese black and white women. Obstetrics and
gynecology 1996;88(4 Pt 1):490-6.
212. Neufeld LM, Haas JD, Grajeda R, Martorell R. Changes in maternal weight from the first
to second trimester of pregnancy are associated with fetal growth and infant length at
birth. The American journal of clinical nutrition 2004;79(4):646-52.
213. Sekiya N, Anai T, Matsubara M, Miyazaki F. Maternal weight gain rate in the second
trimester are associated with birth weight and length of gestation. Gynecologic and
obstetric investigation 2007;63(1):45-8. doi: 10.1159/000095286.
214. Strauss RS, Dietz WH. Low maternal weight gain in the second or third trimester
increases the risk for intrauterine growth retardation. The Journal of nutrition
1999;129(5):988-93.
215. Davenport MH, Ruchat SM, Giroux I, Sopper MM, Mottola MF. Timing of Excessive
Pregnancy-Related Weight Gain and Offspring Adiposity at Birth. Obstetrics and
gynecology 2013;122(2, PART 1):255-61. doi: 10.1097/AOG.0b013e31829a3b86.
216. Ravelli AC, van Der Meulen JH, Osmond C, Barker DJ, Bleker OP. Obesity at the age of
50 y in men and women exposed to famine prenatally. The American journal of clinical
nutrition 1999;70(5):811-6.
217. Modi N, Murgasova D, Ruager-Martin R, et al. The influence of maternal body mass
index on infant adiposity and hepatic lipid content. Pediatric research 2011;70(3):287-91.
doi: 10.1038/pr.2011.512, 10.1203/PDR.0b013e318225f9b1.
218. Waters TP, Huston-Presley L, Catalano PM. Neonatal body composition according to the
revised institute of medicine recommendations for maternal weight gain. The Journal of
clinical endocrinology and metabolism 2012;97(10):3648-54. doi: 10.1210/jc.2012-1781.