Embed Size (px)
Citation preview
Maternal and Child Health | 133
MATERNAL AND CHILD HEALTH 9
Ann Phoya and Sophie Kang’oma
This chapter presents the 2004 MDHS findings on maternal and child health in Malawi. Topics discussed include the utilisation of maternal and child health services; maternal and childhood immunisations; common childhood illnesses and their treatment; barriers to obtaining health care; ability to negotiate sex; and attitudes towards family violence. Combined with information on childhood mortality, this information can be used to identify women and children who are at risk because of nonuse of health services and to provide information that would assist in planning interventions to improve maternal and child health. The results presented in the following sections are based on data collected from mothers on all live births that occurred in the five years preceding the survey.
9.1 ANTENATAL CARE
Table 9.1 shows the percent distribution of women who had a live birth in the five years preceding the survey and used antenatal care (ANC) services. Overall, there has been no change in the coverage of ANC from a medical professional since 2000 (93 percent). Most women receive ANC from a nurse or a midwife (82 percent); 10 percent of pregnant women went to see a doctor for ANC.
Maternal age at birth and the birth order of the child are not strongly related to the practice of ANC. Urban women are more likely to have seen a health professional for antenatal services than women living in rural areas, though rural women are slightly more likely to have seen a doctor. The use of antenatal services is strongly associated with level of education and wealth. While 8 percent of women with no education had no antenatal care, the proportion among women with some secondary or higher education is only 2 percent. However, women with no education are slightly more likely than women with secondary education to receive antenatal care from a doctor/clinical officer (10 percent compared with 8 percent). This is the reverse of the situation observed in the 2000 DHS, where women with secondary or higher education are slightly more likely than women with less education to receive care from a doctor/clinical officer (10 percent compared with 9 percent).
Use of antenatal services varies among districts. Women receive ANC from health care providers most commonly in Mzimba, Blantyre, Salima, and Zomba (96 to 98 percent). However, lack of any antenatal care is as high as 6 to 7 percent in Lilongwe and Mangochi. The high level of nonuse of antenatal services in Lilongwe is also recorded in the 2000 MDHS (7 percent). Variations in the utilisation of doctors for antenatal care continue to persist among districts. As reported in the 2000 MDHS, women in Salima are more likely to go to a doctor for antenatal care than women in other districts (28 percent). However, this observation should be viewed with caution because the definition among respondents of what constitutes a “doctor” is loose and may vary by locality.
Benefits of antenatal care in influencing outcomes of pregnancy depend to a large extent on the timing of the antenatal care as well as the content and quality of the services provided. In

134 | Maternal and Child Health
Malawi, women are advised to have a minimum of four ANC visits spread throughout the pregnancy, with the first visit in the first trimester.
Table 9.1 Antenatal care
Percent distribution of women who had a live birth in the five years preceding the survey by antenatal care (ANC) provider during preg-nancy for the most recent birth, according to background characteristics, Malawi 2004
Background characteristic
Doctor/ clinical officer
Nurse/ midwife
Patient attendant
Traditional birth
attendant/ other No one Missing Total
Number of
women
Age at birth <20 10.0 82.5 0.9 2.3 4.3 0.1 100.0 1,293 20-34 10.0 82.4 1.0 1.8 4.6 0.2 100.0 4,979 35-49 8.8 81.9 1.2 2.4 5.5 0.2 100.0 1,000
Birth order 1 10.1 83.7 0.5 1.8 3.9 0.0 100.0 1,518 2-3 9.8 83.1 1.1 1.8 4.0 0.3 100.0 2,659 4-5 10.0 81.7 1.1 1.9 5.0 0.2 100.0 1,622 6+ 9.5 80.3 1.1 2.8 6.1 0.2 100.0 1,473
Residence Urban 6.8 90.8 0.3 0.1 1.9 0.1 100.0 1,041 Rural 10.3 80.9 1.1 2.3 5.1 0.2 100.0 6,231
Region Northern 8.3 87.1 0.4 0.6 3.5 0.1 100.0 924 Central 11.4 79.5 0.5 1.7 6.6 0.3 100.0 2,959 Southern 8.9 83.5 1.6 2.6 3.2 0.1 100.0 3,389
District Blantyre 5.1 92.2 0.2 1.4 1.1 0.0 100.0 520 Kasungu 18.2 72.4 0.7 3.8 4.8 0.1 100.0 330 Machinga 4.7 81.1 7.6 4.0 2.3 0.3 100.0 284 Mangochi 17.9 73.3 1.1 1.8 6.0 0.0 100.0 411 Mzimba 5.8 91.0 0.4 0.2 2.5 0.1 100.0 464 Salima 28.1 68.4 0.0 0.8 2.5 0.2 100.0 199 Thyolo 10.0 80.9 0.2 5.2 3.4 0.3 100.0 386 Zomba 6.0 89.7 1.4 2.2 0.6 0.2 100.0 389 Lilongwe 3.4 88.3 0.0 1.4 6.5 0.5 100.0 1,013 Mulanje 10.4 79.0 1.1 7.0 1.9 0.8 100.0 296 Other districts 11.1 80.2 1.0 1.4 6.1 0.1 100.0 2,981
Education No education 10.3 76.2 1.6 3.2 8.4 0.2 100.0 1,885 Primary 1-4 11.0 80.2 0.9 2.8 4.8 0.3 100.0 2,021 Primary 5-8 9.1 86.3 0.7 1.0 2.7 0.2 100.0 2,485 Secondary+ 8.1 89.3 0.5 0.3 1.7 0.2 100.0 880
Wealth quintile Lowest 10.6 78.1 1.0 2.5 7.4 0.4 100.0 1,380 Second 11.0 78.8 1.6 2.7 5.5 0.3 100.0 1,579 Middle 10.4 80.7 1.0 2.6 5.0 0.2 100.0 1,610 Fourth 9.0 85.9 0.7 1.2 3.1 0.0 100.0 1,432 Highest 7.7 89.5 0.3 0.7 1.8 0.1 100.0 1,271
Total 9.8 82.3 1.0 2.0 4.6 0.2 100.0 7,271
Note: If more than one source of ANC was mentioned, only the provider with the highest qualifications is considered in this tabulation.

Maternal and Child Health | 135
Table 9.2 presents information about the number and timing of ANC visits. For 57 percent of births, mothers meet the recommended number of four or more antenatal care visits. This is the same level reported in the 2000 MDHS. Women in urban areas are more likely than rural women to go for antenatal care visits.
Messages regarding the importance of initiating antenatal care in the first trimester have not made a significant impact on the timing of antenatal care. Table 9.2 shows that only 8 percent of women initiated antenatal care before the fourth month of pregnancy, about the same as found in the 2000 MDHS (7 percent). While urban women make more frequent visits for antenatal care than rural women, they initiate the ANC visit at about the same time as their rural counterparts (5.8-5.9 months). The persistent delay in initiating antenatal care indicates that a large proportion of pregnant women in Malawi miss out on intended benefits of early antenatal care services.
Table 9.2 Number of antenatal care visits and timing of first visit
Percent distribution of women who had a live birth in the five years preceding the survey by number of antenatal care (ANC) visits for the most recent birth, and by the timing of the first visit according to residence, Malawi 2004
Residence Number and timing of ANC visits Urban Rural Total
Number of ANC visits None 1.9 5.1 4.6 1 3.4 2.3 2.5 2-3 28.7 36.2 35.2 4+ 65.2 55.7 57.1 Don't know/missing 0.9 0.6 0.7
Total 100.0 100.0 100.0
Number of months pregnant at time of first ANC visit
No antenatal care 1.9 5.1 4.6 <4 9.4 7.4 7.7 4-5 46.3 43.0 43.5 6-7 39.3 41.5 41.2 8+ 3.1 2.7 2.8 Don't know/missing 0.0 0.3 0.3
Total 100.0 100.0 100.0
Median months pregnant at first visit (for those with ANC) 5.8 5.9 5.9
Number of women 1,041 6,231 7,271
In addition to the number and timing of ANC visits, another important aspect of antenatal
care is the content and quality of services. Women who received antenatal care in the five years preceding the survey were asked what services they received. The limited content of antenatal care services in Malawi indicates that women are not getting the care that would assist in the identification and management of complications that can have a negative impact on the mother and her baby.
Table 9.3 shows that seven in ten women report that they were told about pregnancy complications and where to go in case of problems during pregnancy. The most frequent checks for

136 | Maternal and Child Health
Table 9.3 Components of antenatal care
Percentage of women with a live birth in the five years preceding the survey who received antenatal care for the most recent birth, by content of antenatal care, and percentage of women with a live birth in the five years preceding the survey who received iron tablets or syrup or antimalarial drugs for the most recent birth, according to background characteristics, Malawi 2004
Among women who received antenatal care
Background characteristic
Informed of signs of pregnancy complica-
tions
Informed where to go with
complica-tions
Weight measured
Height measured
Blood pressure
measured
Urine sample taken
Blood sample taken
Heart beat
Eye exam
Number of
women
Received iron
tablets or syrup
Received anti-
malarial drugs
Number of
women
Age at birth <20 64.1 61.1 94.7 40.9 70.6 17.4 33.9 90.2 60.1 1,237 80.5 75.2 1,293 20-34 71.5 68.4 94.8 40.4 78.9 21.4 36.1 90.8 66.2 4,750 79.5 82.8 4,979 35-49 72.5 69.6 95.0 44.6 82.4 21.1 37.2 89.8 69.6 943 77.3 77.1 1,000
Birth order 1 67.5 64.4 95.1 41.9 73.7 22.3 37.9 92.1 60.7 1,458 82.4 77.5 1,518 2-3 70.4 67.5 94.8 41.8 78.3 20.9 35.2 90.0 65.6 2,552 80.7 82.4 2,659 4-5 70.0 67.0 94.8 39.9 79.5 20.8 35.0 89.6 65.7 1,537 77.0 81.8 1,622 6+ 73.4 70.1 94.5 40.0 80.0 18.5 35.8 91.0 70.4 1,383 76.4 79.4 1,473
Residence Urban 71.1 68.8 96.5 57.6 89.3 39.7 57.4 94.1 73.9 1,021 83.4 86.7 1,041 Rural 70.2 67.0 94.5 38.2 75.9 17.4 32.1 89.9 64.1 5,909 78.7 79.6 6,231
Region Northern 76.1 74.2 93.4 37.5 85.7 23.1 47.2 86.1 58.6 891 91.2 86.6 924 Central 66.6 63.5 94.5 32.6 78.8 22.4 32.0 88.9 65.4 2,763 75.9 77.9 2,959 Southern 71.8 68.5 95.5 49.1 75.0 18.6 36.0 93.1 67.5 3,276 79.2 81.4 3,389
District Blantyre 73.4 66.7 96.8 58.0 78.3 16.7 33.3 94.2 73.8 514 78.1 87.0 520 Kasungu 67.6 65.7 94.9 23.4 76.2 7.2 14.1 85.6 71.6 314 84.1 78.2 330 Machinga 67.7 65.2 96.0 50.5 62.6 15.3 20.3 88.6 70.1 277 72.7 79.6 284 Mangochi 66.6 63.3 94.5 46.6 75.1 22.0 29.0 85.0 65.5 386 70.6 67.2 411 Mzimba 79.7 77.5 93.0 40.9 90.5 23.1 44.1 79.4 58.4 452 91.5 88.9 464 Salima 77.4 73.6 97.4 44.6 87.1 18.0 28.8 88.7 62.9 193 74.0 87.1 199 Thyolo 84.4 82.4 93.1 47.2 74.6 24.1 38.0 94.7 73.5 372 84.9 81.2 386 Zomba 77.7 74.3 97.1 62.0 84.6 34.2 58.4 97.1 62.2 386 84.4 88.5 389 Lilongwe 61.9 60.1 96.1 38.5 86.1 37.1 44.9 91.2 65.9 947 72.2 76.8 1,013 Mulanje 68.8 66.6 91.4 45.0 68.1 7.6 15.9 94.9 58.1 290 82.3 82.1 296 Other districts 68.9 65.7 94.3 34.7 75.0 16.6 36.0 91.2 64.3 2,799 80.2 80.1 2,981
Education No education 64.9 60.8 93.4 39.9 75.4 18.1 32.2 88.0 62.8 1,725 72.2 70.8 1,885 Primary 1-4 66.4 63.4 94.4 39.4 74.6 18.1 31.3 91.4 66.4 1,923 78.3 78.0 2,021 Primary 5-8 73.5 71.1 95.2 40.7 79.8 19.9 36.9 90.6 65.9 2,416 83.5 86.7 2,485 Secondary+ 80.5 78.3 97.4 47.8 84.9 33.9 50.1 93.6 68.1 864 85.6 90.8 880
Wealth quintile Lowest 64.8 61.3 92.9 35.9 73.5 15.7 30.2 89.2 67.2 1,278 77.2 77.0 1,380 Second 67.0 64.0 92.8 37.6 73.8 17.5 31.3 89.2 62.6 1,491 75.7 75.4 1,579 Middle 72.1 68.9 94.8 39.8 76.1 16.1 31.1 90.8 61.6 1,526 79.2 78.0 1,610 Fourth 72.4 69.7 96.5 39.6 79.4 20.1 37.5 91.0 63.9 1,386 81.5 84.6 1,432 Highest 75.2 72.7 97.2 53.6 87.8 35.9 51.1 92.8 73.9 1,248 84.2 90.0 1,271
Total 70.3 67.3 94.8 41.1 77.9 20.7 35.9 90.6 65.5 6,930 79.4 80.7 7,271
pregnant women during an antenatal visit are measuring weight (95 percent) and blood pressure (78 percent). Blood samples were taken from 36 percent of women, and a urine sample was collected from 21 percent of pregnant women. For nine in ten women, the baby’s heartbeat was checked; for two in three women, their eyes were examined during an antenatal visit for their most recent birth. These figures, as well as the coverage of iron supplementation and antimalarial treatments, are similar to those found in the 2000 MDHS, suggesting that there is no improvement in the utilisation of health services for expectant mothers.

Maternal and Child Health | 137
There are variations in the provision of services during antenatal visits across subgroups of women. In general, women in urban areas, in the Northern Region, more educated women and women in the highest wealth quintile are more likely than other women to receive quality care during pregnancy. At the district level, the content of antenatal care varies widely. Blood pressure measurements were taken for only 63 percent of women in Machinga. The collection of blood and urine samples is even less common. The collection of blood samples ranges from 14 percent of women in Kasungu to 58 percent in Zomba. Women in Zomba seem to get the best antenatal care services based on the types of checks during pregnancy.
Table 9.4 shows that 85 percent of women who had a birth in the five years preceding the survey report that they received at least one tetanus toxoid injection during the pregnancy. The coverage of tetanus toxoid injection has not changed since 1992 (85-86 percent). Table 9.4 also shows that only 66 percent of women had two or more tetanus toxoid injections. This figure is lower than that reported in the 1992 MDHS (73 percent).
Younger women, women pregnant with their first child, and women who live in urban areas are more likely to have received two or more doses of tetanus toxoid injections. Women with secondary or higher education and women in the highest wealth quintile are also more likely than other women to have two or more tetanus toxoid injections. Across districts, coverage of two or more doses of tetanus toxoid is 59 to 60 percent in Mulanje, Kasungu, and Thyolo and 74 to 75 percent in Mangochi and Salima.
Table 9.4 Tetanus toxoid injections
Percent distribution of women who had a live birth in the five years preceding the sur-vey by number of tetanus toxoid injections received during pregnancy for the most recent birth, according to background characteristics, Malawi 2004
Background characteristic None
One injection
Two or more
injections
Don't know/ missing Total
Numberof
women
Age at birth <20 12.2 16.5 70.7 0.6 100.0 1,293 20-34 14.8 19.3 65.4 0.6 100.0 4,979 35-49 18.3 16.4 64.7 0.7 100.0 1,000
Birth order 1 11.1 15.6 72.8 0.5 100.0 1,518 2-3 12.7 19.6 66.8 0.8 100.0 2,659 4-5 17.5 20.2 62.1 0.1 100.0 1,622 6+ 19.4 17.0 62.8 0.8 100.0 1,473
Residence Urban 9.6 18.5 71.5 0.4 100.0 1,041 Rural 15.7 18.4 65.3 0.6 100.0 6,231
Region Northern 14.2 18.3 67.2 0.3 100.0 924 Central 15.2 16.5 67.6 0.6 100.0 2,959 Southern 14.6 20.0 64.7 0.6 100.0 3,389
District Blantyre 15.0 16.4 67.7 0.8 100.0 520 Kasungu 20.9 17.5 60.4 1.2 100.0 330 Machinga 17.4 20.2 62.2 0.2 100.0 284 Mangochi 9.0 16.1 74.2 0.7 100.0 411 Mzimba 14.8 16.6 68.4 0.2 100.0 464 Salima 7.7 16.8 75.2 0.4 100.0 199 Thyolo 19.0 20.7 60.1 0.2 100.0 386 Zomba 11.2 21.7 66.5 0.6 100.0 389 Lilongwe 14.5 16.4 68.9 0.2 100.0 1,013 Mulanje 16.2 24.2 59.2 0.4 100.0 296 Other districts 15.0 18.7 65.5 0.8 100.0 2,981
Education No education 18.6 16.0 64.7 0.6 100.0 1,885 Primary 1-4 14.9 19.2 65.3 0.6 100.0 2,021 Primary 5-8 13.8 20.0 65.8 0.4 100.0 2,485 Secondary+ 9.3 17.0 72.7 1.1 100.0 880
Wealth quintile Lowest 15.7 19.8 64.2 0.3 100.0 1,380 Second 16.6 16.8 65.7 0.8 100.0 1,579 Middle 14.8 18.6 66.1 0.4 100.0 1,610 Fourth 14.8 17.5 67.2 0.5 100.0 1,432 Highest 11.5 19.6 68.0 0.9 100.0 1,271
Total 14.8 18.4 66.2 0.6 100.0 7,271

138 | Maternal and Child Health
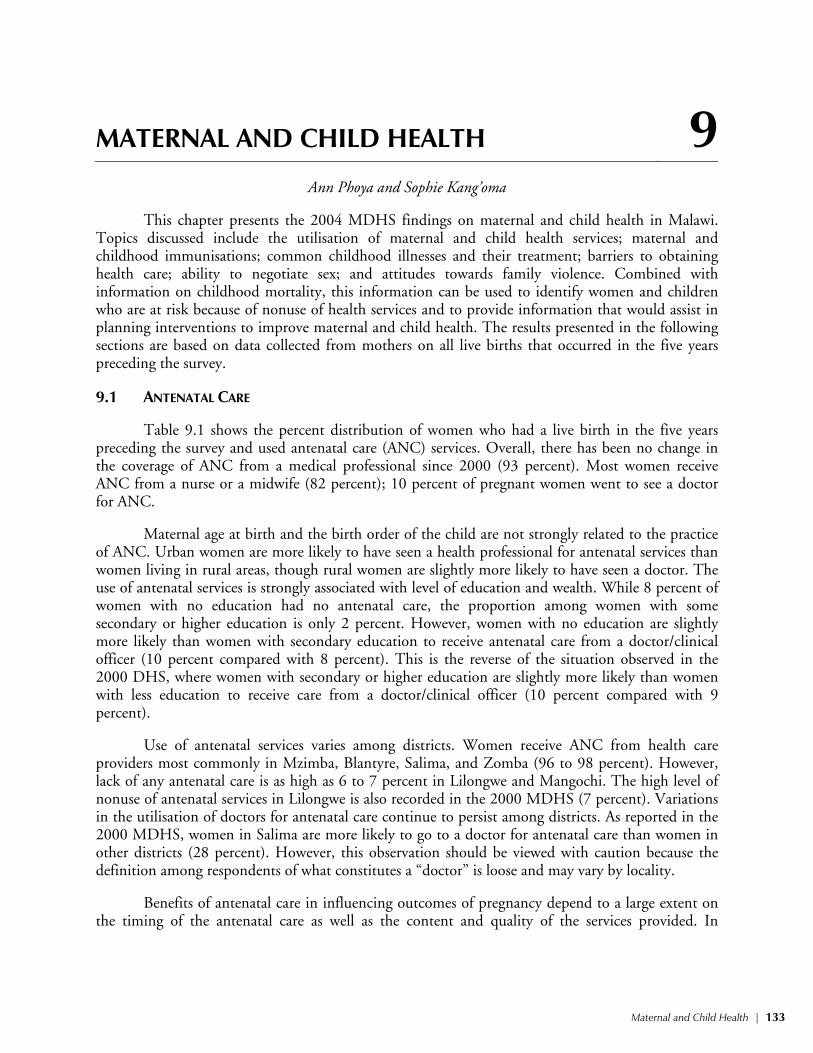
The aim of antenatal care is to minimise adverse maternal and fetal outcomes of pregnancy. Data in Table 9.5 and Figure 9.1 show that common complications among women are high blood pressure (14 percent) and swollen feet (13 percent), both indications of pre-eclampsia. Anaemia is reported by 12 percent of women, and 6 percent of women report experiencing bleeding during pregnancy. It is important to note that the data show self-reported complications as opposed to medically documented problems.
Table 9.5 Complications during pregnancy
Among women who had a birth in the five years preceding the survey, percentage who had specific com-plications associated with the pregnancy leading to the most recent birth, by background characteristics, Malawi 2004
Background characteristic
High blood pressure
Swollen feet Anaemia Bleeding
Number of women
Number of ANC visits None na na na na 337 1-3 13.9 12.7 12.1 5.7 3,703 4+ 15.5 15.2 13.2 6.1 3,184
Age at birth <20 13.9 10.7 12.9 5.4 1,293 20-34 13.8 12.8 12.0 5.2 4,979 35-49 15.3 18.2 11.1 7.8 1,000
Birth order 1 14.1 12.9 13.6 5.5 1,518 2-3 13.5 10.9 11.1 4.6 2,659 4-5 13.5 13.4 12.6 6.0 1,622 6+ 15.5 17.3 11.5 7.0 1,473
Residence Urban 11.9 12.4 7.7 4.2 1,041 Rural 14.4 13.3 12.8 5.8 6,231
Region Northern 11.9 11.9 11.2 4.4 924 Central 16.6 15.6 14.8 6.2 2,959 Southern 12.3 11.4 9.9 5.4 3,389
District Blantyre 15.8 13.1 10.6 10.9 520 Kasungu 18.9 18.1 20.7 7.1 330 Machinga 8.4 8.4 7.4 2.8 284 Mangochi 16.4 15.7 12.7 5.2 411 Mzimba 12.1 12.6 13.6 5.1 464 Salima 17.7 15.5 15.4 5.7 199 Thyolo 14.0 8.9 10.9 5.7 386 Zomba 13.6 13.7 8.3 4.9 389 Lilongwe 12.3 13.1 10.5 3.3 1,013 Mulanje 9.2 9.0 7.7 3.8 296 Other districts 14.6 13.6 12.8 5.9 2,981
Education No education 13.3 13.5 12.4 6.6 1,885 Primary 1-4 15.6 12.1 13.3 6.3 2,021 Primary 5-8 13.5 12.7 11.3 5.0 2,485 Secondary+ 13.5 16.3 10.8 3.2 880
Wealth quintile Lowest 13.4 11.0 13.0 6.0 1,380 Second 14.8 13.1 13.5 6.2 1,579 Middle 15.2 14.1 13.1 6.3 1,610 Fourth 12.9 12.2 11.4 4.5 1,432 Highest 13.5 15.6 8.8 4.8 1,271
Total 14.0 13.2 12.1 5.6 7,271
Note: Total includes 53 cases with number of ANC visits missing. na = Not applicable
Maternal and Child Health | 139
These problems are slightly more prevalent in older women and women with higher order
births. Women in rural areas and those living in the Central Region are also more likely to report having problems during pregnancy. In general, a woman’s education and wealth status have no association with the likelihood of having pregnancy complications. Across districts, however, there are wide variations. Women in Kasungu are most likely to report problems during pregnancy, while women in Machinga are the least likely to do so.
Table 9.6 shows places where women sought advice and care for complications experienced in pregnancy. The 2004 MDHS did not explore the quality or effect of care received from these facilities. For any complication, the most common source of treatment is a public health facility (44 to 57 percent). About one in five women went to a private health facility for assistance with pregnancy complications. While 85 percent of pregnant women sought treatment for anaemia, one in three women with high blood pressure, swollen feet, and bleeding left the problem untreated.
Figure 9.1 Complications During Pregnancy
1413
12
6
0
2
4
6
8
10
12
14
16
High blood pressure Swollen feet Anaemia Bleeding
Type of complication
Perc
ent
MDHS 2004

140 | Maternal and Child Health
Table 9.6 Treatment for complications during pregnancy
Among women with a birth in the five years preceding the survey who had complications associated with the most recent pregnancy, percentage who sought advice or treatment, by type of complication, Malawi 2004
Health facility
Type of complication
Public sector
Private sector Home
Traditional birth
attendant Other Not
treated
Number of women with complications
High blood pressure 47.0 17.5 0.9 3.1 2.2 30.7 1,019
Swollen feet 44.5 17.4 1.1 2.6 2.0 33.5 958
Anaemia 56.9 20.1 1.1 3.7 5.4 15.5 877
Bleeding 43.7 18.1 0.5 5.3 4.3 31.9 406
9.2 ASSISTANCE AND MEDICAL CARE AT DELIVERY
An important component in the effort to reduce the health risks of mothers and children is to increase the proportion of babies that are delivered in facilities where skilled attendance is available. Services in a health facility include trained health workers, appropriate supplies, equipment to identify and manage complications in a timely manner, and maintenance of hygienic conditions to prevent infections. The 2004 MDHS respondents were asked to report the place of birth of all children born in the five years before the survey. Table 9.7 shows that 57 percent of births took place in a health facility. This figure shows that there has been no notable improvement from the 1992 and 2000 MDHS surveys (both 55 percent). Government-run health facilities were used for 42 percent of the births, while private facilities managed 15 percent of births. A considerable proportion of births took place at home, either in the respondent’s home (29 percent) or the traditional birth attendant (TBA)’s home (12 percent).
Children born to women less than 34 years of age and first-order births are more likely to be delivered in a heath facility than other children. Similarly, the majority of births in urban areas, births to women with secondary or higher education, and to women in the highest wealth quintile occurred in a health facility. The proportion of births delivered in a health facility varies from less than 50 percent in Kasungu and Salima (43 percent and 46 percent, respectively) to 79 percent in Blantyre. The assistance of a TBA during delivery is most common in Salima (23 percent) and least common in Mangochi (4 percent).

Maternal and Child Health | 141
Table 9.7 Place of delivery
Percent distribution of live births in the five years preceding the survey by place of delivery, according to background characteristics, Malawi 2004
Health facility
Background characteristic
Public sector
Private sector Home
Traditional birth
attendant Other Missing Total
Number of
births
Mother's age at birth <20 43.3 13.6 29.7 12.3 1.0 0.1 100.0 2,205 20-34 42.3 16.0 28.3 12.2 1.2 0.1 100.0 7,321 35-49 37.2 14.7 35.1 11.7 1.1 0.2 100.0 1,246
Birth order 1 47.6 15.8 24.2 11.4 0.8 0.2 100.0 2,530 2-3 42.3 15.6 28.7 11.9 1.3 0.2 100.0 3,945 4-5 39.8 15.1 32.2 11.7 1.1 0.0 100.0 2,308 6+ 36.4 14.4 33.9 13.9 1.3 0.1 100.0 1,989
Residence Urban 66.4 17.9 12.3 2.7 0.6 0.1 100.0 1,425 Rural 38.2 14.9 32.0 13.6 1.2 0.1 100.0 9,347
Region Northern 46.9 20.0 23.2 8.7 1.1 0.1 100.0 1,345 Central 37.2 15.3 31.9 14.3 1.2 0.2 100.0 4,494 Southern 44.8 14.1 28.7 11.1 1.1 0.1 100.0 4,933
District Blantyre 70.0 8.6 14.1 5.7 1.7 0.0 100.0 724 Kasungu 36.0 7.4 36.9 18.9 0.9 0.0 100.0 525 Machinga 42.0 13.4 33.7 10.0 0.7 0.1 100.0 441 Mangochi 38.4 12.5 44.9 3.6 0.6 0.0 100.0 636 Mzimba 40.6 25.4 25.2 7.5 1.2 0.1 100.0 676 Salima 38.7 7.7 29.5 23.3 0.7 0.1 100.0 312 Thyolo 37.9 13.5 27.1 19.3 2.2 0.0 100.0 575 Zomba 47.7 18.0 22.9 11.0 0.5 0.0 100.0 544 Lilongwe 37.9 17.0 32.4 12.4 0.1 0.1 100.0 1,489 Mulanje 38.7 20.8 22.7 16.6 1.0 0.1 100.0 437 Other districts 40.4 15.8 29.7 12.4 1.5 0.2 100.0 4,414
Education No education 32.2 10.7 41.9 13.9 1.2 0.1 100.0 2,903 Primary 1-4 39.3 12.7 32.3 14.3 1.0 0.3 100.0 3,102 Primary 5-8 47.1 17.9 22.6 10.9 1.4 0.1 100.0 3,637 Secondary+ 57.2 26.1 10.6 5.8 0.3 0.0 100.0 1,127
Antenatal care visits1 None 19.2 6.3 58.2 14.9 1.3 0.0 100.0 337 1-3 38.0 13.8 34.1 12.6 1.4 0.0 100.0 2,738 4+ 47.4 17.5 23.2 10.9 1.0 0.1 100.0 4,149
Wealth quintile Lowest 36.2 10.6 40.4 11.9 0.8 0.0 100.0 2,099 Second 34.6 12.0 36.1 15.6 1.4 0.4 100.0 2,426 Middle 38.9 13.3 31.9 14.1 1.7 0.1 100.0 2,446 Fourth 45.3 18.2 23.3 12.4 0.6 0.2 100.0 2,091 Highest 59.6 25.1 10.1 4.4 0.8 0.0 100.0 1,709
Total 41.9 15.3 29.4 12.1 1.1 0.1 100.0 10,771
Note: Private health facility includes Mission health facility. Total includes 53 cases with the number of antenatal care visits missing. 1 Includes only the most recent birth in the five years preceding the survey.

142 | Maternal and Child Health
The 2004 MDHS asked questions about the person who assisted with the delivery. The majority of births were attended by medical professionals, 50 percent by a nurse or midwife, 6 percent by a doctor, and 1 percent by a patient attendant. In the four years since the 2000 MDHS there has been a slight increase in the proportion of births that are attended by a doctor—from 5 to 6 percent. The role of traditional birth attendants (TBAs) in delivery assistance has also increased—from 23 to 26 percent (Table 9.8).
Table 9.8 Assistance during delivery
Percent distribution of live births in the five years preceding the survey by person providing assistance during delivery, according to background characteristics, Malawi 2004
Background characteristic
Doctor/ clinical officer
Nurse or
midwife Patient
attendant
Traditional birth
attendant
Relative/ friend/ other No one
Don't know/ missing Total
Number of
births
Mother's age at birth <20 5.3 50.9 0.5 28.4 13.6 0.8 0.5 100.0 2,205 20-34 6.3 50.6 1.1 25.2 14.4 1.9 0.4 100.0 7,321 35-49 5.8 45.4 0.6 27.7 14.1 5.2 1.1 100.0 1,246
Birth order 1 6.7 56.1 0.5 24.5 11.3 0.6 0.3 100.0 2,530 2-3 6.1 50.5 1.1 25.9 14.6 1.4 0.5 100.0 3,945 4-5 5.8 47.9 1.0 25.6 16.8 2.4 0.4 100.0 2,308 6+ 5.3 44.1 1.3 29.5 14.1 4.9 0.9 100.0 1,989
Residence Urban 8.3 74.8 0.7 8.4 6.7 0.9 0.2 100.0 1,425 Rural 5.7 46.3 1.0 28.9 15.4 2.2 0.6 100.0 9,347
Region Northern 6.1 60.2 0.3 18.8 11.4 3.0 0.1 100.0 1,345 Central 5.8 45.5 0.8 31.5 14.1 1.7 0.8 100.0 4,494 Southern 6.2 51.5 1.3 23.4 15.1 2.2 0.4 100.0 4,933
District Blantyre 8.5 69.2 0.3 14.3 5.4 1.9 0.3 100.0 724 Kasungu 8.8 33.1 1.1 38.9 13.8 3.6 0.7 100.0 525 Machinga 2.3 46.5 6.2 16.2 25.2 2.2 1.4 100.0 441 Mangochi 11.9 38.3 2.0 24.8 21.0 1.9 0.1 100.0 636 Mzimba 7.0 58.6 0.3 15.8 14.5 3.6 0.1 100.0 676 Salima 8.8 37.1 0.1 41.6 10.7 0.4 1.4 100.0 312 Thyolo 6.0 44.9 0.3 35.8 10.5 2.3 0.3 100.0 575 Zomba 7.2 57.2 1.1 19.7 11.8 2.5 0.4 100.0 544 Lilongwe 3.7 50.2 0.8 30.0 14.5 0.7 0.1 100.0 1,489 Mulanje 5.2 53.7 1.0 24.9 14.1 0.8 0.4 100.0 437 Other districts 5.2 50.1 0.6 26.7 14.5 2.3 0.7 100.0 4,414
Education No education 3.9 37.9 1.0 31.8 21.2 3.5 0.7 100.0 2,903 Primary 1-4 6.2 44.2 1.3 29.5 16.0 2.1 0.7 100.0 3,102 Primary 5-8 6.2 57.8 0.8 23.4 10.1 1.3 0.3 100.0 3,637 Secondary+ 10.1 72.8 0.5 11.7 4.5 0.4 0.1 100.0 1,127
Wealth quintile Lowest 5.5 40.4 0.7 30.5 19.9 2.3 0.7 100.0 2,099 Second 4.1 41.2 1.3 32.9 17.7 2.1 0.7 100.0 2,426 Middle 5.5 45.2 1.2 29.2 15.6 2.9 0.5 100.0 2,446 Fourth 6.4 56.2 0.6 24.0 10.8 1.7 0.4 100.0 2,091 Highest 9.5 74.2 0.9 9.8 4.5 1.0 0.1 100.0 1,709
Total 6.0 50.1 1.0 26.2 14.2 2.1 0.5 100.0 10,771
Note: If the respondent mentioned more than one attendant, only the most qualified attendant is considered in this tabulation.

Maternal and Child Health | 143
While 78 percent of births in Blantyre were assisted by a health professional, the
corresponding proportions in Kasungu and Salima are 43 and 46 percent, respectively (Figure 9.2). Delivery by a TBA is most common in Salima (42 percent) and Kasungu (39 percent), while Blantyre has the lowest level of TBA deliveries (14 percent). In rural areas 15 percent of births are attended by relatives or other persons who may not be trained in assisting deliveries, and 29 percent of the births are assisted by TBAs. With poor quality and inadequate antenatal care, as well as limited access to skilled attendance at delivery, the concept of safe pregnancy and child birth may not be realised by some Malawian women, especially those residing in rural areas.
One outcome of pregnancy assessed during the survey was assisted operative delivery such as
caesarean section (C-section). This operation is one of the emergency obstetric care functions recommended for addressing some complications that contribute to high maternal mortality. According to the survey data, 3 percent of births in the five years preceding the survey were delivered by C-section. This rate is similar to that recorded in the 2000 MDHS. The stagnation in the C-section rate since 1992 in Malawi suggests that emergency obstetric care is limited to a small proportion of women.
Table 9.9 shows that C-section deliveries are more common among births to younger women, for the first child, births to women with higher education, and women residing in urban areas. In four districts, Blantyre, Mzimba, Thyolo, and Zomba, the proportion of births delivered by C-section is slightly higher (4 to 5 percent) than the national average of 3 percent. The higher proportion of C-section operations in Blantyre and Zomba was also reported in the 2000 MDHS.
Figure 9.2 Assistance at Delivery from a Health Professional, by Residence and District
8453
7843
5552
6646
5166
5560
56
0 10 20 30 40 50 60 70 80 90
RESIDENCEUrbanRural
DISTRICTBlantyreKasungu
MachingaMangochi
MzimbaSalimaThyoloZomba
LilongweMulanje
Other districts
Percent
MDHS 2004
144 | Maternal and Child Health
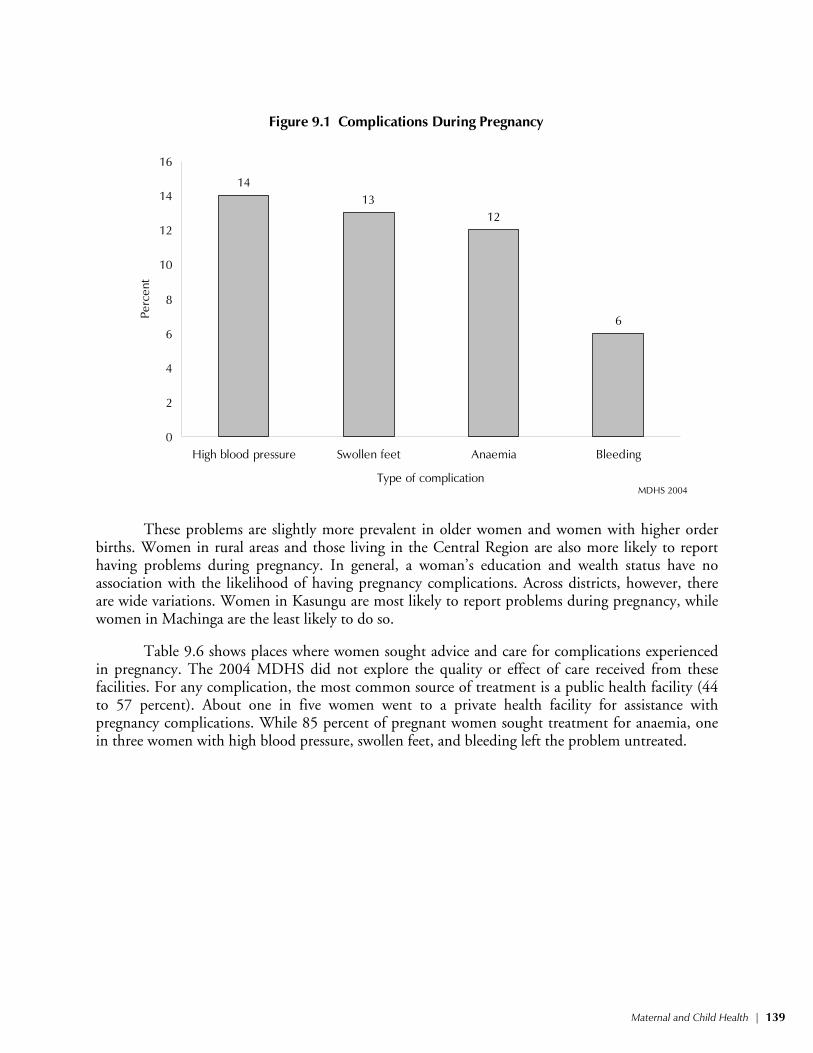
Table 9.9 Delivery characteristics
Percentage of live births in the five years preceding the survey delivered by caesarean section, and percent distribution by birth weight and by mother's estimate of baby's size at birth, according to background characteristics, Malawi 2004
Birth weight Size of child at birth
Background characteristic
Delivery by C-
section
Less than
2.5 kg
2.5 kg or
more
Don't know/ missing Total
Very small
Smaller than
average
Average or
larger
Don't know/ missing Total
Number of
births
Mother's age at birth <20 3.9 6.5 40.0 53.5 100.0 4.3 15.4 77.4 3.0 100.0 2,205 20-34 3.0 5.2 45.1 49.7 100.0 3.6 10.9 83.2 2.3 100.0 7,321 35-49 2.0 4.2 39.1 56.7 100.0 4.2 10.4 83.0 2.4 100.0 1,246
Birth order 1 4.7 6.7 45.2 48.1 100.0 4.2 14.0 78.9 2.9 100.0 2,530 2-3 3.1 5.0 45.2 49.8 100.0 3.3 10.9 83.4 2.4 100.0 3,945 4-5 2.5 5.0 43.3 51.7 100.0 3.5 11.0 82.9 2.6 100.0 2,308 6+ 1.8 4.7 37.4 57.9 100.0 4.9 11.4 82.0 1.8 100.0 1,989
Residence Urban 4.4 6.1 67.5 26.3 100.0 2.4 7.7 88.8 1.0 100.0 1,425 Rural 2.9 5.2 39.7 55.1 100.0 4.0 12.3 80.9 2.7 100.0 9,347
Region Northern 4.6 7.5 63.0 29.5 100.0 2.9 7.3 88.4 1.4 100.0 1,345 Central 2.8 4.8 36.7 58.5 100.0 4.8 13.7 79.5 2.0 100.0 4,494 Southern 2.9 5.2 44.1 50.7 100.0 3.2 11.1 82.5 3.2 100.0 4,933
District Blantyre 3.5 7.5 62.3 30.1 100.0 3.2 9.6 85.2 2.0 100.0 724 Kasungu 1.9 7.3 44.0 48.7 100.0 6.7 14.8 77.5 1.0 100.0 525 Machinga 1.3 7.1 29.4 63.4 100.0 4.9 11.9 82.0 1.2 100.0 441 Mangochi 2.5 4.3 37.7 58.0 100.0 1.8 15.1 81.4 1.7 100.0 636 Mzimba 5.2 7.9 61.7 30.4 100.0 3.1 11.4 84.4 1.1 100.0 676 Salima 2.5 3.5 26.3 70.2 100.0 5.6 13.1 73.0 8.3 100.0 312 Thyolo 4.2 4.9 41.6 53.5 100.0 3.6 9.8 78.4 8.3 100.0 575 Zomba 3.5 6.3 56.1 37.6 100.0 5.0 12.0 79.6 3.4 100.0 544 Lilongwe 2.6 5.1 41.2 53.6 100.0 6.4 12.4 80.2 1.0 100.0 1,489 Mulanje 2.6 5.8 45.8 48.3 100.0 2.5 8.2 85.6 3.7 100.0 437 Other districts 3.2 4.4 39.9 55.7 100.0 3.0 11.5 83.3 2.2 100.0 4,414
Education No education 1.9 4.7 27.4 67.9 100.0 4.5 14.1 78.3 3.0 100.0 2,903 Primary 1-4 2.9 3.9 36.4 59.7 100.0 4.1 12.9 79.9 3.2 100.0 3,102 Primary 5-8 3.2 6.4 52.1 41.5 100.0 3.1 10.4 84.6 1.9 100.0 3,637 Secondary+ 6.3 7.5 75.3 17.2 100.0 3.8 6.6 88.9 0.7 100.0 1,127
Wealth quintile Lowest 3.4 4.5 31.6 64.0 100.0 4.3 14.1 78.4 3.2 100.0 2,099 Second 2.5 5.1 33.4 61.5 100.0 4.7 13.4 78.5 3.3 100.0 2,426 Middle 2.2 5.0 39.4 55.6 100.0 3.7 12.0 81.7 2.6 100.0 2,446 Fourth 3.3 5.8 48.6 45.6 100.0 3.4 10.1 84.8 1.7 100.0 2,091 Highest 4.5 6.8 71.2 22.0 100.0 2.6 8.0 88.3 1.1 100.0 1,709
Total 3.1 5.3 43.4 51.3 100.0 3.8 11.7 82.0 2.5 100.0 10,771
Women who gave birth in the five years before the survey were asked whether their baby was
weighed at birth and, if so, what the baby’s weight was. Interviewers were instructed to use any written record of birth weight available. In addition, because many women do not deliver at a health facility, and hence the baby was not weighed, all respondents were asked for their own subjective assessment of their child’s size. Table 9.9 also provides information on the birth weights according to the background characteristics of the mother. Birth weight was reported for slightly less than one-

Maternal and Child Health | 145
half of the births. Forty-three percent of all births (or 89 percent of those with a birth weight reported) were reported to be of 2.5 kilograms or more. Five percent of births (11 percent of those with a birth weight) were less than 2.5 kilograms, the cutoff point below which a baby is considered to have low birth weight. The proportion of low birth weight babies is 7 percent or higher in Blantyre, Kasungu, Machinga, and Mzimba.
Regarding the size of the child at birth, 82 percent of births were reported by the mother as being average or larger than average in size. For 16 percent of births, mothers said that their child was smaller than average (12 percent) or very small (4 percent); in the 2000 MDHS, 17 percent of births were reported as smaller than average or very small. District estimates of low birth weight, using subjective assessment, vary from a low of 11 percent in Mulanje to 22 percent in Kasungu.
9.3 POSTNATAL CARE
Postnatal care is an important component of obstetric and neonatal care aimed at preventing and managing any complications that may endanger the survival of the mother and the baby. Postnatal care is therefore recommended immediately after the birth of the baby and placenta to 42 days after delivery. Respondents who gave birth in a health facility are assumed to have received a postnatal check during their stay in the health facility. Those who gave birth outside a health facility were asked whether someone checked on their health following the delivery. Table 9.10 shows that 31 percent of women received postnatal care, and 21 percent of these women reported receiving care within two days of delivery. Few women had a checkup 3 to 6 days after delivery, and 8 percent received care between the first and sixth week after delivery. Table 9.10 further shows that postnatal care is more common for older women, women residing in urban areas, more educated women, and women in the highest wealth quintile. Women who live in Blantyre and Thyolo are the most likely to have had a postnatal checkup, whereas three in four women in Salima and Lilongwe did not receive postnatal care.
The low utilisation of health facilities for delivery as well as nonutilisation of postnatal care services shows that most women do not get skilled care during delivery and the postpartum period. Strategies for improving maternal health should therefore focus on pull factors for health facility care or bringing the skilled care to the home.

146 | Maternal and Child Health
Table 9.10 Postnatal care
Among women who gave birth in the five years preceding the survey, the percent distribution by timing of postnatal checkup, according to background characteristics, Malawi 2004
Timing of first postnatal checkup
Background characteristic
Within 2 days of delivery
3-6 days after
delivery
7-41 days after
delivery Don't know/
missing
Did not receive
postnatal checkup1 Total
Number of
women
Age at birth <20 19.9 2.0 6.5 0.2 71.3 100.0 1,293 20-34 19.9 3.1 8.3 0.1 68.5 100.0 4,979 35-49 24.4 2.6 6.6 0.3 66.0 100.0 1,000
Birth order 1 21.8 2.8 8.7 0.2 66.5 100.0 1,518 2-3 19.8 3.1 8.3 0.2 68.6 100.0 2,659 4-5 18.1 2.9 8.4 0.2 70.4 100.0 1,622 6+ 23.3 2.3 5.3 0.2 68.9 100.0 1,473
Residence Urban 27.2 2.6 12.1 0.1 57.9 100.0 1,041 Rural 19.4 2.9 7.0 0.2 70.4 100.0 6,231
Region Northern 25.0 3.6 5.8 0.3 65.3 100.0 924 Central 17.6 2.3 6.7 0.0 73.4 100.0 2,959 Southern 21.9 3.1 9.3 0.3 65.4 100.0 3,389
District Blantyre 22.8 3.8 18.4 0.2 54.7 100.0 520 Kasungu 25.9 1.1 5.0 0.0 68.0 100.0 330 Machinga 22.2 2.5 3.2 0.5 71.6 100.0 284 Mangochi 28.0 4.3 7.4 0.5 59.8 100.0 411 Mzimba 22.9 3.3 7.0 0.3 66.5 100.0 464 Salima 11.6 3.8 9.8 0.2 74.5 100.0 199 Thyolo 29.8 2.6 11.6 0.2 55.8 100.0 386 Zomba 20.6 2.9 7.3 0.0 69.2 100.0 389 Lilongwe 17.3 2.3 5.7 0.0 74.7 100.0 1,013 Mulanje 16.9 4.8 13.3 0.7 64.2 100.0 296 Other districts 18.9 2.5 6.4 0.1 72.0 100.0 2,981
Education No education 16.8 2.4 4.6 0.1 76.1 100.0 1,885 Primary 1-4 19.2 3.0 6.7 0.2 70.9 100.0 2,021 Primary 5-8 22.6 2.7 8.2 0.3 66.2 100.0 2,485 Secondary+ 25.7 3.8 15.9 0.2 54.4 100.0 880
Wealth quintile Lowest 16.9 1.9 5.3 0.2 75.7 100.0 1,380 Second 18.8 2.4 6.2 0.3 72.3 100.0 1,579 Middle 18.4 3.5 6.7 0.1 71.3 100.0 1,610 Fourth 23.0 2.5 7.9 0.3 66.3 100.0 1,432 Highest 26.8 3.9 13.6 0.0 55.7 100.0 1,271
Total 20.6 2.8 7.8 0.2 68.6 100.0 7,271
Note: If a woman had more than one live birth outside a health facility, only the most recent birth is considered. 1Includes women who received the first postnatal checkup after 41 days

Maternal and Child Health | 147
Women who gave birth in the five years preceding the survey were asked to report any problems, such as heavy bleeding, high blood pressure, stroke or convulsions, infection or fever, postpartum depression, and leakage of urine or stools from the vagina (probable fistula) post partum for their most recent birth. Table 9.11 shows that heavy bleeding is the most often reported problem (7 percent), followed by infection and high blood pressure (3 percent each). Probable fistula, postpartum depression, and stroke/convulsions were each reported by two percent of women.
Table 9.11 Complications after delivery
Percentage of last births in the five years preceding the survey for which the mother had complications associated with the pregnancy, by type of complications, according to background characteristics, Malawi 2004
Background characteristic
Heavy bleeding
High blood
pressureStroke/
convulsions Infection/
fever
Leakage of urine or
stool from vagina
Postpartum depression/
blues
Number of
women
Number of ANC visits None 3.0 2.2 1.6 3.0 3.0 2.1 337 1-3 6.7 2.7 1.5 2.7 1.6 1.7 3,703 4+ 7.2 3.3 1.4 4.1 1.5 1.6 3,184
Age at birth <20 6.8 2.8 1.5 2.3 2.7 1.7 1,293 20-34 6.5 2.6 1.3 3.2 1.3 1.8 4,979 35-49 7.6 4.7 1.9 4.9 1.5 1.0 1,000
Birth order 1 6.6 1.8 1.5 2.8 2.3 1.6 1,518 2-3 6.5 3.1 1.3 2.8 1.5 1.4 2,659 4-5 6.5 2.4 1.1 3.8 1.6 2.4 1,622 6+ 7.4 4.4 2.0 4.1 1.0 1.5 1,473
Residence Urban 6.1 2.2 0.7 2.3 1.6 1.5 1,041 Rural 6.8 3.0 1.6 3.5 1.6 1.7 6,231
Region Northern 6.8 2.4 1.8 2.9 1.3 1.4 924 Central 6.4 2.6 1.8 3.6 1.4 1.3 2,959 Southern 6.9 3.4 1.1 3.1 1.9 2.1 3,389
District Blantyre 8.7 4.5 0.9 4.1 4.0 3.3 520 Kasungu 8.4 4.0 3.8 3.8 2.1 1.3 330 Machinga 5.9 3.7 0.9 2.0 1.4 0.8 284 Mangochi 8.7 6.2 3.0 6.3 2.7 3.5 411 Mzimba 7.0 3.4 2.9 3.0 1.3 2.3 464 Salima 4.9 1.4 2.3 2.4 1.1 1.6 199 Thyolo 7.6 4.4 1.6 3.9 2.3 1.3 386 Zomba 6.5 2.9 1.5 3.3 1.8 1.2 389 Lilongwe 5.3 1.3 0.9 3.2 1.7 1.7 1,013 Mulanje 5.9 3.3 0.5 1.5 1.1 1.5 296 Other districts 6.5 2.4 1.1 3.1 1.0 1.3 2,981
Education No education 5.5 2.5 1.5 3.0 1.4 1.4 1,885 Primary 1-4 6.9 4.0 1.5 2.9 1.6 2.0 2,021 Primary 5-8 8.1 2.9 1.5 3.9 1.9 1.8 2,485 Secondary+ 5.1 1.5 0.9 3.3 1.0 1.4 880
Wealth quintile Lowest 5.4 3.1 1.7 2.4 1.4 1.4 1,380 Second 6.4 3.1 1.7 3.4 1.8 1.4 1,579 Middle 6.4 2.8 1.3 3.3 2.0 1.4 1,610 Fourth 8.6 3.4 1.3 3.0 1.3 2.1 1,432 Highest 6.8 2.1 1.2 4.4 1.3 2.2 1,271
Total 6.7 2.9 1.5 3.3 1.6 1.7 7,271
Note: Total includes 53 cases with the number of antenatal care visits missing.

148 | Maternal and Child Health
9.4 WOMEN’S PARTICIPATION IN DECISIONMAKING
Health-seeking behaviour is influenced by a number of factors, including the ability to make decisions regarding one’s health or to have control over family income. Lack of these abilities has been cited as a barrier for proper utilisation of maternal and child health services. Women who had a live birth in the five years preceding the survey were asked whether they participated in making decisions about their own health care, making large household purchases, purchasing daily household needs, visiting family members or relatives, and determining what food to cook each day. Women were also asked about their attitude towards a wife’s ability to negotiate sex with her husband, as well as their perceptions about wife beating (see Chapter 3).
Data in Table 9.12 indicate that women who were more empowered were generally somewhat more likely to receive health care during pregnancy, delivery, and the postpartum period. For example, the proportion of women who received antenatal care increases from 91 percent among women who have no final say in decisionmaking to 93 percent or higher for women who participated in one or more decisions. Similarly, the percentage of women who received delivery care from a health professional declines from 60 percent among women who do not think there was any reason for a husband to beat his wife to 52 percent or lower for women who think that a husband is justified in beating his wife.
Table 9.12 Reproductive health care by women's status
Percentage of women with a live birth in the five years preceding the survey who received antenatal and postnatal care from a health professional for the most recent birth, and percentage of births in the five years preceding the survey for which mothers received professional delivery care, by women's status indicators, Malawi 2004
Percentage of women who:
Women’s status indicator
Received antenatal care from a doctor, clinical officer,
nurse, midwife, or
patient attendant
Received postnatal care within the first
two days of delivery1
Number of
women
Percentage of births assisted by a doctor,
clinical officer, nurse/
midwife/ patient
attendant
Number of
births
Number of decisions in which woman has final say2
0 91.4 59.6 1,264 55.2 1,911 1-2 93.1 58.8 3,227 54.9 4,880 3-4 94.8 63.8 1,476 61.7 2,184 5 93.0 64.0 1,305 59.2 1,797
Number of reasons to refuse sex with husband
0 91.1 59.9 753 54.1 1,130 1-2 92.1 58.2 1,362 55.2 2,028 3-4 93.8 61.7 5,157 58.0 7,614
Number of reasons wife beating is justified
0 93.4 63.1 5,159 59.9 7,628 1-2 92.5 56.1 1,245 52.2 1,840 3-4 93.7 52.6 582 45.9 866 5 89.9 57.6 286 50.5 437
Total 93.2 60.9 7,271 57.0 10,771
1Includes mothers who delivered in a health facility 2Either by herself or jointly with others

Maternal and Child Health | 149
9.5 CHILDHOOD VACCINATIONS
Malawi’s Expanded Programme on Immunisation (EPI) follows guidelines for vaccinating children set by the World Health Organisation (WHO). A child is considered fully vaccinated if she or he has received one dose of BCG vaccine, three doses each of DPT and polio vaccine, and one dose of measles vaccine. BCG protects against tuberculosis and should be given at birth or first clinic contact. DPT protects against diphtheria, pertussis (whooping cough), and tetanus. DPT and polio vaccines are given at approximately 6, 10, and 14 weeks of age. The measles vaccine should be given at or soon after the child reaches nine months of age. The Malawi EPI recommends that children receive the complete schedule of vaccinations before 12 months of age. A dose of polio vaccine at or around birth is being promoted, although it is not yet widely practised in Malawi. To assist in the evaluation of the EPI, the 2004 MDHS survey collected information on vaccination coverage for all living children born in the five years preceding the survey.
Information on vaccination coverage was collected in two ways: from child health cards seen by the interviewer and from mothers’ verbal reports. Health cards on which vaccinations are recorded are typically provided by health centres and clinics. If a mother was able to present such a card to the interviewer, this was used as the source of information, with the interviewer recording vaccination dates directly from the card. In addition to collecting vaccination information from cards, there were two ways of collecting the information from the mother herself. If a vaccination card was presented but a vaccine was not recorded on the card as being given, the mother was asked to recall whether or not that particular vaccine had been given. If the mother was not able to provide a card for the child at all, she was asked through a series of probing questions whether or not the child had received BCG, polio, DPT (including the number of doses for each), and measles vaccinations.
Table 9.13 presents information on vaccination coverage for children age 12-23 months1 according to the source of information used to determine coverage, i.e., the child health card or mother's report. Based on information from the health card and mother’s report, 91 percent of children age 12-23 months had been vaccinated against tuberculosis, 82 percent received DPT3, 78 percent received polio3, and 79 percent received measles vaccine. Overall, 64 percent of children age 12-23 months have received all the recommended vaccines, and 4 percent of children have received none.
Vaccinations are most effective when given at the proper age. While 79 percent of children age 12-23 months have been vaccinated against measles, only 63 percent were vaccinated before their first birthday, indicating that some children were late in receiving their measles vaccination. This is important because measles at a young age is potentially life threatening, especially in malnourished children.
Figure 9.3 shows the percentage of children age 12-23 months who received the recommended six vaccines by 12 months of age. Coverage of DPT1 and polio1 is 94 percent, 90 percent for BCG, and 63 percent for measles. Another way to evaluate the success of an immunisation programme is to calculate the dropout rate for DPT and polio. The dropout rate is defined as the percentage of children who receive the first dose but do not receive the third dose of a
1 These children are supposed to have received a complete schedule of vaccinations.

150 | Maternal and Child Health
specific vaccine. Using data in Table 9.13, the dropout rate for DPT is 14 percent, and that for polio is 18 percent.
Table 9.13 Vaccinations by source of information
Percentage of children age 12-23 months who received specific vaccines at any time before the survey, by source of information (vaccination card or mother's report), and percentage vaccinated by 12 months of age, Malawi 2004
DPT Polio
Source of information BCG 1 2 3 01 1 2 3 Measles All2
No vacci-
nations
Number of
children
Vaccinated at any time before survey
Vaccination card 70.3 73.3 71.8 67.2 29.1 73.7 71.8 67.4 61.8 57.4 0.2 1,631 Mother's report 21.1 21.6 18.8 14.3 8.0 21.3 18.0 10.2 16.9 7.0 3.3 563 Either source 91.4 95.0 90.6 81.5 37.1 94.9 89.7 77.7 78.7 64.4 3.5 2,194
Vaccinated by 12 months of age3 89.7 94.0 88.4 76.1 36.8 93.9 87.7 73.2 62.7 51.1 4.3 2,194
1 Polio 0 is the polio vaccination given at birth. 2 BCG, measles, and three doses each of DPT and polio vaccine (excluding polio vaccine given at birth) 3 For children whose information was based on the mother's report, the proportion of vaccinations given during the first year of life was assumed to be the same as for children with a written record of vaccination.
Figure 9.3 Percentage of Children Age 12-23 Months Who Were Vaccinated by 12 Months of Age
7264
6358
7164
7357
69
5561
6984
0 10 20 30 40 50 60 70 80 90
BIRTH ORDER1
2-34-56+
RESIDENCEUrbanRural
REGIONNorthern
CentralSouthern
MOTHER'S EDUCATIONNo education
Primary 1-4Primary 5.8
Secondary+
MDHS 2004

Maternal and Child Health | 151
Table 9.14 shows the trends in childhood vaccination coverage reported in MDHS surveys
from 1992 to 2004. Data in the table indicate that vaccination coverage in Malawi has declined. The first indication comes from a small drop in the percentage of children with a vaccination card from 86 percent in 1992 to 81 in 2000 and to 74 percent in 2004. The decline may indicate decreased access to services. The failure of some children to complete the polio and the DPT series has resulted in a decline in polio3 coverage from 88 percent in 1992 to 80 percent in 2000 and to 78 percent in 2004. Similarly, DPT3 coverage dropped from 89 percent in 1992 to 84 percent in 2000 and to 82 percent in 2004. The percentage of children considered fully immunized declined from 82 percent in 1992 to 64 percent in 2004.
Table 9.14 Trends in vaccination coverage
Percentage of children age 12-23 months who received specific vaccines at any time before the survey, Malawi 1992-2004
DPT Polio
Source BCG 1 2 3 0 1 2 3 Measles All
No vacci-
nations
Percen-tage with
card
Number of
children
1992 MDHS 97.0 96.9 94.3 88.6 na 96.9 94.2 88.1 85.8 81.8 2.5 86.3 772
2000 MDHS 92.4 95.9 92.6 84.2 46.9 95.7 91.3 79.8 83.2 70.1 2.8 81.1 2,238
2004 MDHS 91.4 95.0 90.6 81.5 37.1 94.9 89.7 77.7 78.7 64.4 3.5 74.3 2,194
na = Not applicable
Table 9.15 presents the vaccination coverage in 2004 among children age 12-23 months by
selected background characteristics. First-born children, children in urban areas, children in the Northern Region, children born to women with secondary and higher education, and those born to women in the higher wealth quintiles are more likely than other children to be fully vaccinated. Among the oversampled districts, vaccination coverage ranges from 53 percent or lower in Kasungu, Salima, and Lilongwe to 84 percent in Blantyre. While nationally 4 percent of children age 12-23 months have never received any vaccination, the percentage varies substantially across districts. Lilongwe shows the highest percentage of children who have had no vaccinations (10 percent).

152 | Maternal and Child Health
Table 9.15 Vaccinations by background characteristics
Percentage of children age 12-23 months who received specific vaccines at any time before the survey (according to a vaccination card or the mother's report), and percentage with a vaccination card, by background characteristics, Malawi 2004
DPT Polio1
Background characteristic BCG 1 2 3 0 1 2 3 Measles All2
No vacci-
nations
Percentage with a
vaccination card
Number of
children
Sex Male 90.7 94.5 90.9 81.5 36.2 94.2 89.1 77.7 78.8 65.7 4.3 75.4 1,100 Female 92.1 95.5 90.4 81.6 38.0 95.6 90.4 77.7 78.6 63.1 2.7 73.2 1,094
Birth order 1 94.8 97.6 94.8 86.7 41.4 96.7 92.1 84.1 84.0 72.2 1.8 75.3 473 2-3 91.7 94.7 91.8 83.1 37.4 95.2 90.4 77.3 78.1 64.1 3.7 75.4 811 4-5 92.0 96.4 89.1 79.0 35.6 95.7 89.7 76.0 78.7 62.8 2.3 76.0 489 6+ 86.5 91.0 85.2 75.7 33.5 91.5 85.8 73.1 73.8 58.3 6.6 69.2 421
Residence Urban 97.2 98.5 95.1 89.8 56.5 99.3 94.0 81.7 86.8 70.7 0.7 73.7 274 Rural 90.6 94.5 90.0 80.3 34.4 94.3 89.1 77.1 77.6 63.5 3.9 74.4 1,920
Region Northern 93.9 97.2 95.0 89.7 59.6 97.3 95.0 82.4 84.9 72.5 1.5 78.8 250 Central 88.2 91.4 86.0 75.4 35.5 91.5 85.5 70.7 72.5 56.8 6.1 68.6 921 Southern 93.7 97.6 93.7 85.1 33.1 97.5 92.3 82.7 82.8 69.3 1.7 78.4 1,023
District Blantyre 95.9 100.0 99.1 95.7 55.8 100.0 97.6 92.9 93.0 83.7 0.0 78.6 147 Kasungu 84.6 89.4 81.8 75.4 36.3 89.6 81.2 72.7 64.6 53.4 9.0 74.6 116 Machinga 87.3 94.7 91.1 81.4 25.3 95.2 89.5 80.0 72.7 61.1 3.9 83.3 97 Mangochi 92.5 93.3 87.6 82.5 33.8 92.8 88.1 73.8 76.9 59.5 4.3 68.6 138 Mzimba 94.3 98.3 96.1 92.1 63.8 98.3 96.1 84.3 82.8 72.3 1.7 81.1 129 Salima 94.1 95.6 86.0 71.3 37.9 94.6 84.6 67.4 77.2 51.1 1.5 60.3 69 Thyolo 97.9 99.0 96.8 88.4 22.2 98.9 96.8 87.2 87.0 74.8 0.0 74.7 116 Zomba 93.4 98.3 97.7 91.3 30.9 98.3 93.6 88.1 84.7 72.9 1.7 81.0 108 Lilongwe 85.8 87.2 80.4 69.0 32.5 88.6 82.5 65.3 70.7 52.5 10.0 59.0 292 Mulanje 94.4 98.5 95.0 83.9 24.7 97.8 90.4 83.2 81.2 68.5 1.5 85.9 81 Other districts 91.7 95.9 91.6 80.9 37.4 95.5 90.2 77.0 79.2 64.9 2.4 76.7 901
Mother’s education
No education 89.3 93.7 86.3 74.9 29.4 92.9 85.7 68.7 72.1 54.8 4.6 70.5 586 Primary 1-4 88.0 92.3 87.5 76.4 29.9 93.0 87.9 76.1 75.7 61.2 5.1 72.2 643 Primary 5-8 93.9 97.2 94.4 87.3 44.3 97.1 92.4 82.7 81.7 68.5 2.0 77.0 729 Secondary+ 98.4 98.5 98.3 94.1 53.9 98.6 96.7 88.6 93.9 84.3 1.4 81.2 236
Wealth quintile Lowest 86.2 92.4 85.2 73.8 30.3 91.8 84.3 68.7 67.4 51.9 5.5 67.6 449 Second 90.4 93.3 87.3 77.4 30.5 94.0 87.9 73.4 76.5 58.0 4.5 69.8 519 Middle 91.9 96.3 93.3 82.6 34.7 95.7 91.1 79.4 78.9 65.5 2.2 80.6 473 Fourth 94.5 95.9 94.3 87.1 40.6 96.3 93.2 83.9 85.6 73.8 2.9 74.5 413 Highest 95.5 97.8 94.6 89.9 55.4 97.5 93.8 85.9 88.3 77.7 2.2 81.1 340
Total 91.4 95.0 90.6 81.5 37.1 94.9 89.7 77.7 78.7 64.4 3.5 74.3 2,194
1 Polio 0 is the polio vaccination given at birth. 2 BCG, measles, and three doeses of DPT and polio vaccine (excluding polio vaccine given at birth).

Maternal and Child Health | 153
9.6 ACUTE RESPIRATORY INFECTION
Pneumonia is a leading cause of death of young children in Malawi. The programme to control acute respiratory infection (ARI) aims at treating cases of ARI early, before complications develop. Early diagnosis and treatment with antibiotics can prevent a large proportion of deaths due to pneumonia. Emphasis is therefore placed on recognition of signs of impending severity, both by mothers and primary health care workers, so help can be sought. The prevalence of ARI was estimated by asking mothers whether their children under age five had been ill with cough accompanied by short, rapid breathing in the two weeks preceding the survey. These symptoms are compatible with pneumonia. It should be borne in mind that morbidity data collected in surveys are subjective (i.e., mother's perception of illness) and not validated by medical examination.
Table 9.16 shows that 19 percent of children under five years of age were ill with a cough and short, rapid breathing at some time in the two weeks preceding the survey. Using the same definition, the 2000 MDHS and 1992 MDHS survey reported that 27 percent and 15 percent of children had ARI in the previous two weeks, respectively. Prevalence of respiratory illness varies by age of the child, with the highest prevalence occurring at 6-11 months. Since 1992, symptoms of respiratory illnesses have increased among children age 6-11 months. Children in rural areas are more likely to have symptoms of ARI than their urban counterparts, and children born to women with less education are more likely to have ARI symptoms than those born to women with no education or secondary and higher education. ARI is higher among children born to women in the middle wealth quintile.
ARI is slightly higher in the Central and Southern regions (20 and 19 percent, respectively) than in the Northern Region (15 percent). District prevalence is as low as 14 percent in Blantyre and as high as 25 percent in Kasungu and Zomba. It cannot be ascertained from these data whether this wide range in ARI prevalence reflects genuine differences in morbidity or rather socio-cultural differences in the perception of disease or disease severity.
Just over one-third of children were reported to have had a fever in the two weeks preceding the survey. The percentage of children with fever is highest among children age 6-11 months (53 percent) and lowest among children age 48-49 months (21 percent). Children born to rural women, women in the Central Region, women with less education, and women living in households in the lowest wealth quintiles are more likely to have had fever than other children.
Among children with symptoms of ARI and/or fever, just 20 percent were taken to a health facility. Younger children age less than 6 months are more likely to be taken to a health facility, as are urban children, children born to women in the Southern Region, children of women with upper primary or higher education, and children of women in the highest wealth quintiles. By district, children are most likely to be taken to a health facility in Salima and Zomba districts (28 percent each) and least likely to be taken in Machinga District (13 percent).
These findings, although underscoring serious problems of access to health services, may also suggest that mothers and other household members do not always understand the importance of quick response to ARI symptoms and fever.

154 | Maternal and Child Health
Table 9.16 Prevalence and treatment of symptoms of ARI and fever
Percentage of children under five years of age who had a cough accompanied by short, rapid breathing (symptoms of ARI) and percentage of children who had fever in the two weeks preceding the survey, and percentage of chil-dren with symptoms of ARI and/or fever for whom treatment was sought from a health facility or provider, by background characteristics, Malawi 2004
Background characteristic
Percentage of children
with symptoms of ARI
Percentage of children with fever
Number of
children
Among children with symptoms of ARI and/or
fever, percentage for whom treatment was sought from a health
facility/provider1
Number of
children
Age in months <6 20.8 30.7 1,109 22.6 431 6-11 26.6 53.2 1,188 21.0 732 12-23 22.2 49.5 2,194 20.7 1,227 24-35 17.6 39.5 1,743 15.6 817 36-47 15.7 28.8 1,741 20.5 630 48-59 12.5 21.1 1,802 17.9 522
Sex Male 20.2 37.1 4,839 20.4 2,197 Female 17.5 37.2 4,938 18.8 2,163
Residence Urban 11.3 29.9 1,341 22.6 466 Rural 20.0 38.3 8,436 19.3 3,894
Region Northern 15.2 28.4 1,239 17.9 459 Central 19.6 39.9 4,071 18.2 1,925 Southern 19.1 37.1 4,468 21.4 1,976
District Blantyre 14.4 29.4 670 20.8 237 Kasungu 24.5 40.0 471 13.9 241 Machinga 16.0 35.6 405 13.0 162 Mangochi 21.5 36.8 566 20.8 259 Mzimba 17.4 28.9 630 14.7 237 Salima 18.1 42.1 281 28.2 139 Thyolo 21.9 47.3 514 23.6 281 Zomba 24.5 40.1 498 27.8 249 Lilongwe 16.0 38.3 1,376 15.5 601 Mulanje 22.2 44.3 375 21.9 184 Other districts 18.6 36.5 3,992 20.0 1,770
Mother’s education No education 17.6 37.3 2,594 17.0 1,136 Primary 1-4 20.6 40.4 2,805 16.9 1,358 Primary 5-8 19.7 35.9 3,314 22.4 1,457 Secondary+ 14.5 32.1 1,062 26.0 407
Wealth quintile Lowest 19.7 40.0 1,889 15.6 903 Second 19.9 41.2 2,170 18.3 1,042 Middle 23.4 37.6 2,206 20.2 1,044 Fourth 17.6 35.3 1,916 22.5 818 Highest 11.5 29.7 1,597 23.2 553
Total 18.8 37.1 9,777 19.6 4,360
ARI = Acute respiratory infection 1 Excludes pharmacy, shop, and traditional practitioner.

Maternal and Child Health | 155
9.7 DIARRHOEAL DISEASE
Dehydration caused by severe diarrhoea is a major cause of morbidity and mortality among young children in Malawi. Exposure to agents that cause diarrhoea is frequently related to use of contaminated water and unhygienic practices in food preparation and excreta disposal.
Table 9.17 shows the prevalence of diarrhoea in children under five years of age according to background characteristics. The results indicate that 22 percent of children had diarrhoea at some time in the two weeks preceding the survey, an increase from 18 percent reported in the 2000 MDHS survey. As reported in previous MDHS surveys, diarrhoea prevalence peaks at age 6-11 months (41 percent). The prevalence of diarrhoea varies little by the child’s sex. Children in urban areas experience a lower rate of diarrhoea than rural children. Children in the Central Region are more likely to have diarrhoea (27 percent) than children in the Southern Region (21 percent) and Northern Region (12 percent).
Diarrhoea is less prevalent among children who live in houses with piped water and children in the highest wealth quintile. Among the oversampled districts, diarrhoea is most prevalent in Salima, Kasungu, and Thyolo (27 percent or higher), and least prevalent in Blantyre and Mzimba (17 percent or lower).
Table 9.17 Prevalence of diarrhoea
Percentage of children under five years with diarrhoea in the two weeks preceding the survey, by background characteristics, Malawi 2004
Background characteristic
Diarrhoea in the two weeks
preceding the survey
Number of
children
Age in months <6 9.2 1,109 6-11 41.2 1,188 12-23 38.9 2,194 24-35 21.5 1,743 36-47 11.8 1,741 48-59 8.3 1,802
Sex Male 23.4 4,839 Female 21.1 4,938
Residence Urban 17.5 1,341 Rural 23.0 8,436
Region Northern 12.3 1,239 Central 26.6 4,071 Southern 21.1 4,468
District Blantyre 17.0 670 Kasungu 27.8 471 Machinga 19.3 405 Mangochi 25.0 566 Mzimba 15.7 630 Salima 28.8 281 Thyolo 27.4 514 Zomba 24.0 498 Lilongwe 24.4 1,376 Mulanje 22.1 375 Other districts 21.4 3,992
Mother’s education No education 21.4 2,594 Primary 1-4 25.8 2,805 Primary 5-8 20.6 3,314 Secondary+ 20.3 1,062
Source of drinking water
Piped 18.3 1,699 Protected well 22.6 4,248 Open well 24.9 2,648 Surface 21.2 1,169
Wealth quintile Lowest 26.4 1,889 Second 23.9 2,170 Middle 22.4 2,206 Fourth 19.6 1,916 Highest 18.1 1,597
Total 22.3 9,777

156 | Maternal and Child Health
A simple and effective response to a child's dehydration is a prompt increase in the intake of appropriate fluids, i.e., oral rehydration therapy (ORT), which has been promoted in Malawi since the early 1980s. ORT is promoted in three types of interventions. The first is the mixture of commercially prepared packets of oral rehydration salts (ORS) commonly known as Thanzi, and water. The other two types are facility-based provision of premixed ORS, and various home-made grain-based rehydration fluids such as rice water and maize water.
In the 2004 MDHS survey, women who had a birth in the last five years were asked questions about their knowledge of ORS packets. Table 9.18 shows that almost all women (94 percent) know of these packets. Knowledge of ORS has increased from 90 percent in 1992 and 86 percent in 2000. Knowledge of this life-saving technology is slightly higher among women in urban areas, more educated women, women in the Southern Region, and women in the highest wealth quintile. Age differences in the knowledge of ORS packets are minimal.
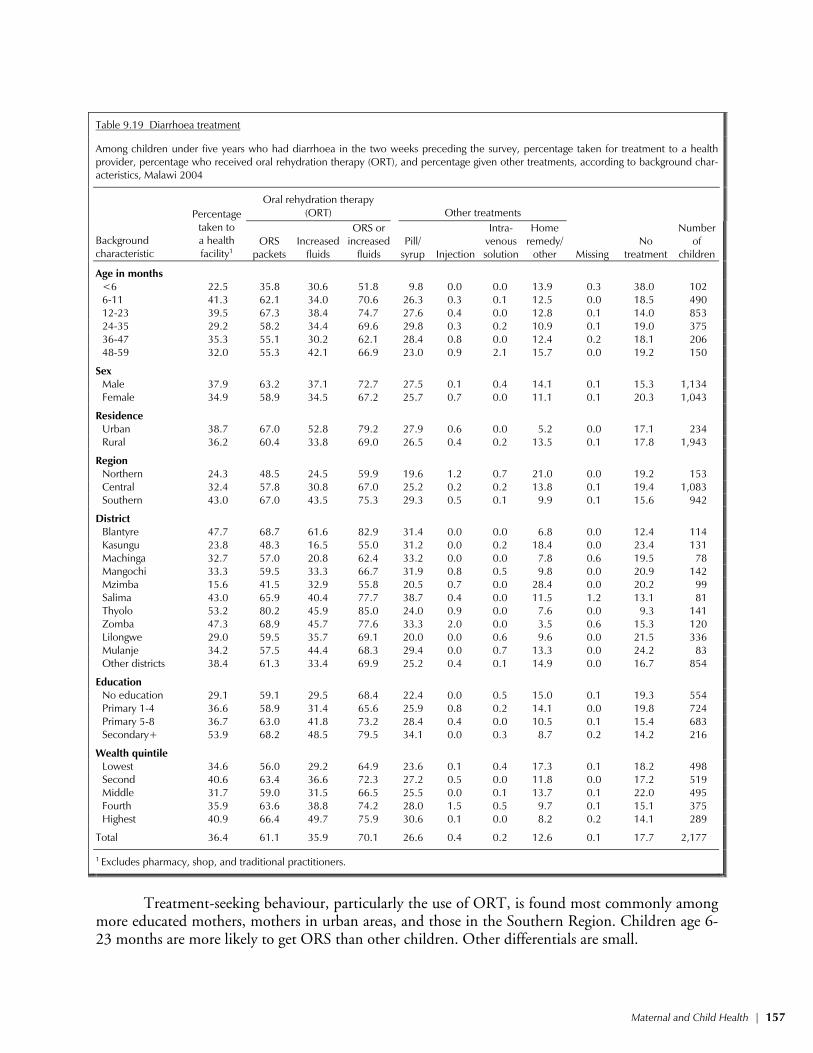
Mothers of children who were reported to have had diarrhoea in the two weeks prior to the survey were asked about their response to the illness. Treatment of children with diarrhoea has improved since 2000. While 28 percent of mothers reported that they took their child to a health facility in 2000, the proportion had increased to 36 percent in 2004. In 2000, 24 percent of children with diarrhoea received no treatment (Table 9.19). This number dropped to 18 percent in 2004. ORS was given to 61 percent of children with diarrhoea, an increase from 43 percent in the 1992 MDHS and 48 percent in the 2000 MDHS. Overall, 70 percent of children were given either ORS or increased fluids, an increase from 63 percent in the 1992 MDHS and 62 percent in 2000 MDHS.
Table 9.18 Knowledge of ORS packets
Percentage of mothers with births in the five years preceding the survey who know about ORS packets for treatment of diarrhoea, by back-ground characteristics, Malawi 2004
Background characteristic
Percentage of mothers who know about ORS packets
Number of
mothers
Age 15-19 92.2 605 20-24 94.6 2,345 25-29 95.0 1,835 30-34 92.1 1,132 35-49 93.0 1,354
Residence Urban 96.5 1,041 Rural 93.4 6,231
Region Northern 92.8 924 Central 92.9 2,959 Southern 94.9 3,389
District Blantyre 96.4 520 Kasungu 93.4 330 Machinga 91.8 284 Mangochi 87.8 411 Mzimba 94.1 464 Salima 93.4 199 Thyolo 97.9 386 Zomba 98.4 389 Lilongwe 92.0 1,013 Mulanje 96.7 296 Other districts 93.7 2,981
Education No education 88.6 1,885 Primary 1-4 93.7 2,021 Primary 5-8 96.1 2,485 Secondary+ 98.7 880
Wealth quintile Lowest 92.8 1,380 Second 93.0 1,579 Middle 92.2 1,610 Fourth 94.7 1,432 Highest 97.0 1,271
Total 93.8 7,271
Maternal and Child Health | 157
Table 9.19 Diarrhoea treatment
Among children under five years who had diarrhoea in the two weeks preceding the survey, percentage taken for treatment to a health provider, percentage who received oral rehydration therapy (ORT), and percentage given other treatments, according to background char-acteristics, Malawi 2004
Oral rehydration therapy
(ORT) Other treatments
Background characteristic
Percentage taken to a health facility1
ORS packets
Increased fluids
ORS or increased
fluids Pill/
syrup Injection
Intra- venous solution
Home remedy/
other Missing No
treatment
Number of
children
Age in months <6 22.5 35.8 30.6 51.8 9.8 0.0 0.0 13.9 0.3 38.0 102 6-11 41.3 62.1 34.0 70.6 26.3 0.3 0.1 12.5 0.0 18.5 490 12-23 39.5 67.3 38.4 74.7 27.6 0.4 0.0 12.8 0.1 14.0 853 24-35 29.2 58.2 34.4 69.6 29.8 0.3 0.2 10.9 0.1 19.0 375 36-47 35.3 55.1 30.2 62.1 28.4 0.8 0.0 12.4 0.2 18.1 206 48-59 32.0 55.3 42.1 66.9 23.0 0.9 2.1 15.7 0.0 19.2 150
Sex Male 37.9 63.2 37.1 72.7 27.5 0.1 0.4 14.1 0.1 15.3 1,134 Female 34.9 58.9 34.5 67.2 25.7 0.7 0.0 11.1 0.1 20.3 1,043
Residence Urban 38.7 67.0 52.8 79.2 27.9 0.6 0.0 5.2 0.0 17.1 234 Rural 36.2 60.4 33.8 69.0 26.5 0.4 0.2 13.5 0.1 17.8 1,943
Region Northern 24.3 48.5 24.5 59.9 19.6 1.2 0.7 21.0 0.0 19.2 153 Central 32.4 57.8 30.8 67.0 25.2 0.2 0.2 13.8 0.1 19.4 1,083 Southern 43.0 67.0 43.5 75.3 29.3 0.5 0.1 9.9 0.1 15.6 942
District Blantyre 47.7 68.7 61.6 82.9 31.4 0.0 0.0 6.8 0.0 12.4 114 Kasungu 23.8 48.3 16.5 55.0 31.2 0.0 0.2 18.4 0.0 23.4 131 Machinga 32.7 57.0 20.8 62.4 33.2 0.0 0.0 7.8 0.6 19.5 78 Mangochi 33.3 59.5 33.3 66.7 31.9 0.8 0.5 9.8 0.0 20.9 142 Mzimba 15.6 41.5 32.9 55.8 20.5 0.7 0.0 28.4 0.0 20.2 99 Salima 43.0 65.9 40.4 77.7 38.7 0.4 0.0 11.5 1.2 13.1 81 Thyolo 53.2 80.2 45.9 85.0 24.0 0.9 0.0 7.6 0.0 9.3 141 Zomba 47.3 68.9 45.7 77.6 33.3 2.0 0.0 3.5 0.6 15.3 120 Lilongwe 29.0 59.5 35.7 69.1 20.0 0.0 0.6 9.6 0.0 21.5 336 Mulanje 34.2 57.5 44.4 68.3 29.4 0.0 0.7 13.3 0.0 24.2 83 Other districts 38.4 61.3 33.4 69.9 25.2 0.4 0.1 14.9 0.0 16.7 854
Education No education 29.1 59.1 29.5 68.4 22.4 0.0 0.5 15.0 0.1 19.3 554 Primary 1-4 36.6 58.9 31.4 65.6 25.9 0.8 0.2 14.1 0.0 19.8 724 Primary 5-8 36.7 63.0 41.8 73.2 28.4 0.4 0.0 10.5 0.1 15.4 683 Secondary+ 53.9 68.2 48.5 79.5 34.1 0.0 0.3 8.7 0.2 14.2 216
Wealth quintile Lowest 34.6 56.0 29.2 64.9 23.6 0.1 0.4 17.3 0.1 18.2 498 Second 40.6 63.4 36.6 72.3 27.2 0.5 0.0 11.8 0.0 17.2 519 Middle 31.7 59.0 31.5 66.5 25.5 0.0 0.1 13.7 0.1 22.0 495 Fourth 35.9 63.6 38.8 74.2 28.0 1.5 0.5 9.7 0.1 15.1 375 Highest 40.9 66.4 49.7 75.9 30.6 0.1 0.0 8.2 0.2 14.1 289
Total 36.4 61.1 35.9 70.1 26.6 0.4 0.2 12.6 0.1 17.7 2,177
1 Excludes pharmacy, shop, and traditional practitioners.
Treatment-seeking behaviour, particularly the use of ORT, is found most commonly among
more educated mothers, mothers in urban areas, and those in the Southern Region. Children age 6-23 months are more likely to get ORS than other children. Other differentials are small.

158 | Maternal and Child Health
There are other common responses to diarrhoea; 27 percent of children were given a pill or syrup, and 13 percent were given some type of home remedy. Home remedies, including herbal medicines, are more common in rural areas and in the Northern Region, among children with less educated mothers, and children in households in the lowest wealth quintile.
All mothers of children with diarrhoea in the past two weeks were asked whether they modified the child’s feeding practices because of the illness. Table 9.20 indicates that only 36 percent of children with diarrhoea were given more to drink, the recommended action in response to diarrhoea. One in four children were given the same amount as usual, 32 percent were given less than usual, and 8 percent were given no fluids at all, which greatly increases the risks of serious complications and death. Data in Table 9.20 show that only 25 percent of children with diarrhoea received more food, 30 percent were receiving the same amount of food as usual, 35 percent received less food, and 6 percent were given no food at all. Four percent of children were never given food, presumably because they were being exclusively breastfed. These figures reflect a gap in practical knowledge among mothers about the nutritional requirements of children during episodes of diarrhoeal illness.
9.8 WOMEN’S PERCEPTIONS OF PROBLEMS IN ACCESSING
HEALTH CARE
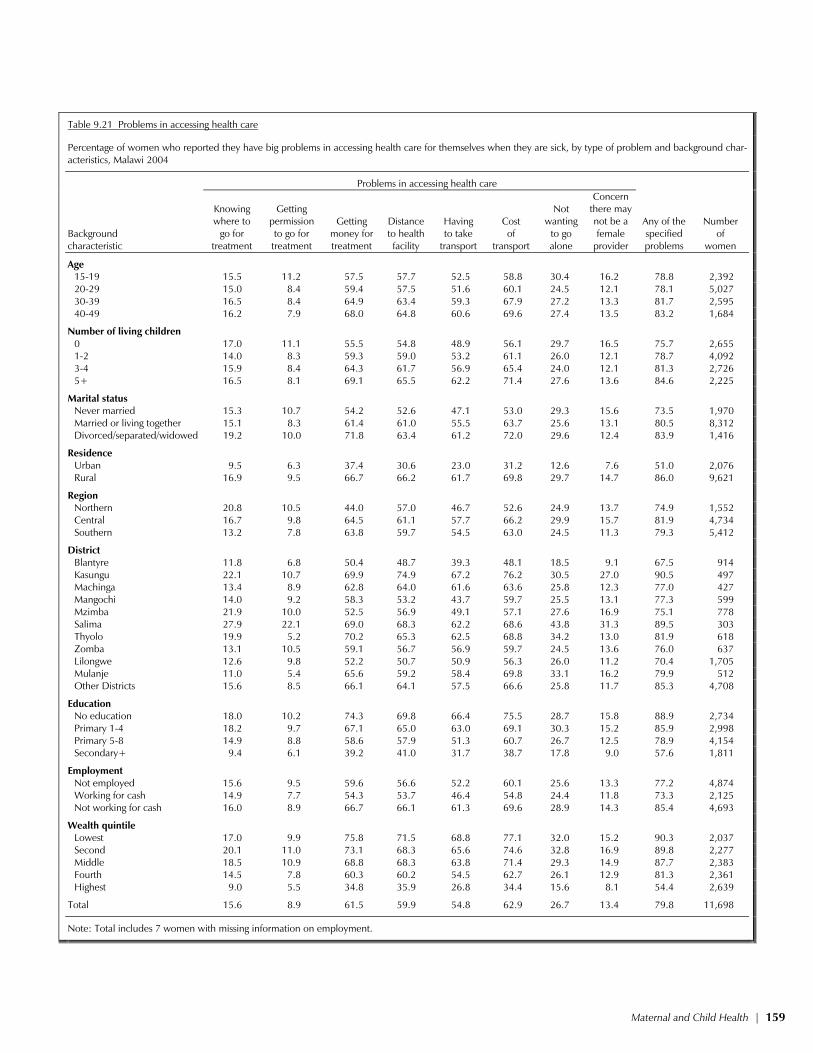
In the 2004 MDHS, all women were asked whether they thought certain issues or circumstances were “a big problem or not” when they are sick and want to get medical advice or treatment. Table 9.21 shows the percentage of women who reported that they have big problems in accessing health care for themselves when they are sick. The most often cited problems have to do with distance and cost. Overall, 63 percent of women mention the cost of transport, 62 percent mention the cost for treatment, 60 percent say that distance to a health facility is a big problem, and 55 percent say that having to take transport is a problem. Additionally, 16 percent of women say that knowledge of a source was a big problem for them in gaining access to health services. Concern that there may not be a female health provider is mentioned by only 13 percent of women (Figure 9.4). More than one-fourth of women (27 percent) say that not wanting to go alone is a big problem in accessing health care for themselves, while only 9 percent say getting permission to go for treatment is a big problem.
Table 9.20 Feeding practices during diarrhoea
Percent distribution of children under five years who had diarrhoea in the two weeks preceding the survey by amount of liquids and food offered compared with normal practice, Malawi 2004
Percent
Amount of liquids offered Same as usual 24.8 More 35.9 Somewhat less 16.6 Much less 15.1 None 7.5 Don't know/missing 0.2
Total 100.0
Amount of food offered Same as usual 30.0 More 25.1 Somewhat less 20.0 Much less 15.1 None 5.7 Never gave food 4.0 Don't know/missing 0.2
Total 100.0 Number of children 2,177
Maternal and Child Health | 159
Table 9.21 Problems in accessing health care
Percentage of women who reported they have big problems in accessing health care for themselves when they are sick, by type of problem and background char-acteristics, Malawi 2004
Problems in accessing health care
Background characteristic
Knowing where to
go for treatment
Getting permission to go for treatment
Getting money for treatment
Distance to health facility
Having to take
transport
Cost of
transport
Not wanting
to go alone
Concern there may not be a female
provider
Any of the specified problems
Number of
women
Age 15-19 15.5 11.2 57.5 57.7 52.5 58.8 30.4 16.2 78.8 2,392 20-29 15.0 8.4 59.4 57.5 51.6 60.1 24.5 12.1 78.1 5,027 30-39 16.5 8.4 64.9 63.4 59.3 67.9 27.2 13.3 81.7 2,595 40-49 16.2 7.9 68.0 64.8 60.6 69.6 27.4 13.5 83.2 1,684
Number of living children 0 17.0 11.1 55.5 54.8 48.9 56.1 29.7 16.5 75.7 2,655 1-2 14.0 8.3 59.3 59.0 53.2 61.1 26.0 12.1 78.7 4,092 3-4 15.9 8.4 64.3 61.7 56.9 65.4 24.0 12.1 81.3 2,726 5+ 16.5 8.1 69.1 65.5 62.2 71.4 27.6 13.6 84.6 2,225
Marital status Never married 15.3 10.7 54.2 52.6 47.1 53.0 29.3 15.6 73.5 1,970 Married or living together 15.1 8.3 61.4 61.0 55.5 63.7 25.6 13.1 80.5 8,312 Divorced/separated/widowed 19.2 10.0 71.8 63.4 61.2 72.0 29.6 12.4 83.9 1,416
Residence Urban 9.5 6.3 37.4 30.6 23.0 31.2 12.6 7.6 51.0 2,076 Rural 16.9 9.5 66.7 66.2 61.7 69.8 29.7 14.7 86.0 9,621
Region Northern 20.8 10.5 44.0 57.0 46.7 52.6 24.9 13.7 74.9 1,552 Central 16.7 9.8 64.5 61.1 57.7 66.2 29.9 15.7 81.9 4,734 Southern 13.2 7.8 63.8 59.7 54.5 63.0 24.5 11.3 79.3 5,412
District Blantyre 11.8 6.8 50.4 48.7 39.3 48.1 18.5 9.1 67.5 914 Kasungu 22.1 10.7 69.9 74.9 67.2 76.2 30.5 27.0 90.5 497 Machinga 13.4 8.9 62.8 64.0 61.6 63.6 25.8 12.3 77.0 427 Mangochi 14.0 9.2 58.3 53.2 43.7 59.7 25.5 13.1 77.3 599 Mzimba 21.9 10.0 52.5 56.9 49.1 57.1 27.6 16.9 75.1 778 Salima 27.9 22.1 69.0 68.3 62.2 68.6 43.8 31.3 89.5 303 Thyolo 19.9 5.2 70.2 65.3 62.5 68.8 34.2 13.0 81.9 618 Zomba 13.1 10.5 59.1 56.7 56.9 59.7 24.5 13.6 76.0 637 Lilongwe 12.6 9.8 52.2 50.7 50.9 56.3 26.0 11.2 70.4 1,705 Mulanje 11.0 5.4 65.6 59.2 58.4 69.8 33.1 16.2 79.9 512 Other Districts 15.6 8.5 66.1 64.1 57.5 66.6 25.8 11.7 85.3 4,708
Education No education 18.0 10.2 74.3 69.8 66.4 75.5 28.7 15.8 88.9 2,734 Primary 1-4 18.2 9.7 67.1 65.0 63.0 69.1 30.3 15.2 85.9 2,998 Primary 5-8 14.9 8.8 58.6 57.9 51.3 60.7 26.7 12.5 78.9 4,154 Secondary+ 9.4 6.1 39.2 41.0 31.7 38.7 17.8 9.0 57.6 1,811
Employment Not employed 15.6 9.5 59.6 56.6 52.2 60.1 25.6 13.3 77.2 4,874 Working for cash 14.9 7.7 54.3 53.7 46.4 54.8 24.4 11.8 73.3 2,125 Not working for cash 16.0 8.9 66.7 66.1 61.3 69.6 28.9 14.3 85.4 4,693
Wealth quintile Lowest 17.0 9.9 75.8 71.5 68.8 77.1 32.0 15.2 90.3 2,037 Second 20.1 11.0 73.1 68.3 65.6 74.6 32.8 16.9 89.8 2,277 Middle 18.5 10.9 68.8 68.3 63.8 71.4 29.3 14.9 87.7 2,383 Fourth 14.5 7.8 60.3 60.2 54.5 62.7 26.1 12.9 81.3 2,361 Highest 9.0 5.5 34.8 35.9 26.8 34.4 15.6 8.1 54.4 2,639
Total 15.6 8.9 61.5 59.9 54.8 62.9 26.7 13.4 79.8 11,698
Note: Total includes 7 women with missing information on employment.

160 | Maternal and Child Health
In general, older women, rural women, women in the Central Region, less-educated women, women who are not working for cash, and women in the lowest wealth quintiles are more likely than other women to mention specified problems in accessing health care.
Needing permission to obtain treatment is cited as a problem more often by younger women and women with no children. Getting money for treatment, on the other hand, is more often mentioned by older women, women with a large number of children, divorced, separated, or widowed women, rural women, and women living in households in the lowest wealth quintiles.
Not surprisingly, money and distance are the major constraints to women’s access to health services. These problems are felt most acutely by women living in remote parts of the country and women living in poorer households. Still, these findings underscore the inequities in real access to health care in the country. As an example, 76 percent of women without formal education mentioned cost of transport as a big problem in getting health services, compared with 39 percent of women with some secondary education (Figure 9.5).
Figure 9.4 Percentage of Women Who Reported They Have Big Problems in Accessing Health Care, by Type of Problem
80
13
27
63
55
60
62
9
16
0 10 20 30 40 50 60 70 80 90
Any of the specified problems
Absence of a female provider
Not wanting to go alone
Cost of transport
Availability of transport
Distance
Money for treatment
Getting permission to go
Knowing where to go
PercentMDHS 2004

Maternal and Child Health | 161
Figure 9.5 Percentage of Women Who Reported the Cost of Transport as a Big Problem in Accessing Health Care
31
70
76
69
61
39
77
75
71
63
34
0 10 20 30 40 50 60 70 80 90
RESIDENCE
Urban
Rural
EDUCATION
No education
Primary 1-4
Primary 5-8
Secondary+
WEALTH QUINTILE
Lowest
Second
Middle
Fourth
Highest
PercentMDHS 2004

![Trends in Maternal Health Indicators in Sierra Leone, 2008-2013 [FA97] · DHS Further Analysis Reports No. 97 Trends in Maternal Health Indicators in Sierra Leone, 2008-2013 Shireen](https://img.pdfslide.us/doc/110x75/60c497182c4bca4edf79c63e/trends-in-maternal-health-indicators-in-sierra-leone-2008-2013-fa97-dhs-further.jpg)