Embed Size (px)
Citation preview

Materials and Design 65 (2015) 862–868
Contents lists available at ScienceDirect
Materials and Design
journal homepage: www.elsevier .com/locate /matdes
Technical Report
Microstructure and micro-texture evolution during large straindeformation of an aluminium–copper–lithium alloy AA 2195
http://dx.doi.org/10.1016/j.matdes.2014.09.0370261-3069/� 2014 Elsevier Ltd. All rights reserved.
⇑ Corresponding author. Tel.: +91 471 256 3944; fax: +91 471 270 5048.E-mail addresses: [email protected], [email protected] (N. Nayan).
Niraj Nayan a,⇑, Nilesh P. Gurao b, S.V.S. Narayana Murty a, Abhay K. Jha a, Bhanu Pant a, S.C. Sharma a,Koshy M. George a
a Materials and Mechanical Entity, Vikram Sarabhai Space Centre, Trivandrum 695 022, Indiab Department of Materials Science and Engineering, Indian Institute of Technology, Kanpur 208 016, India
a r t i c l e i n f o a b s t r a c t
Article history:Received 12 July 2014Accepted 11 September 2014Available online 20 September 2014
A single hit, hot isothermal plane strain compression (PSC) test was used to understand the microstructuralevolution during large strain deformation of aluminium–copper–lithium alloy AA 2195. Hot isothermalPSC tests were conducted in the temperature range of 300–450 �C and at strain rates of 0.01 s�1 and1 s�1 with 75% thickness reduction. The flow curves during PSC exhibited weak softening at highertemperatures and dipping of the flow curve at a strain rate of 1 s�1. Electron backscattered diffractionanalysis (EBSD) of the PSC tested samples revealed that dynamic recrystallisation occurs in specimensdeformed at higher temperatures and lower strain rates. It is possible to control the grain size in AA2195 through the optimization of temperature and strain rate during thermo-mechanical processing.
� 2014 Elsevier Ltd. All rights reserved.
1. Introduction
Aluminium–copper–lithium alloys are being extensively usedfor aerospace applications [1] in view of their high specificstrength, high stiffness and fracture toughness combined withgood weldability. Al–Cu–Li alloys with controlled amount of alloy-ing elements and in proper temper condition achieves ultrahighstrength and good fracture toughness at RT as well as cryogenictemperatures. These alloys are candidate materials for both earthstorable and cryogenic propellants tanks of satellite launch vehi-cles [2]. These materials have been successfully used in NASA spaceshuttle, Falcon-9 [3], Air bus 380 and Boeing 777.
Aluminium–copper–lithium alloys for aerospace applicationsare required in the form of thick plates (of about 50 mm thickness)for the fabrication of propellant tanks (made by isogrid machiningthrough pocket milling), sheets for gores, forgings for propellantand manhole covers and extrusions propellant feed lines. Theseare processed through a variety of manufacturing processes. Thesealloys are usually characterized by an unrecrystallised microstruc-ture with highly elongated grains in the direction of rolling. Thestrong pancake type microstructure in aluminium–lithium alloyshave been extensively studied and reported [4–6]. Microstructureof the material is critical in determining not only the mechanicalproperties of the material, but has a strong bearing on thecorrosion and stress corrosion characteristics of the material during
service. Further, it has been reported [7,8] that materials withcoarse grains affect weldability. Since large sized space structuresare manufactured by welding, it is essential to understand themicrostructure and grain size control in the material. SinceAl–Cu–Li alloys can be tempered to very high strength levels andare intended for critical aerospace applications, microstructuralcontrol is essential to ensure quality of the products realized. Thisnecessitates detailed study on the microstructural evolution as afunction of processing parameters such as strain, strain rate andtemperature. Since the Al–Cu–Li alloys are produced from thedirect chill casting in the form of ingots/slabs, they are hot rolleddown to the required shapes such as plates/sheets/rolled rings.This thermo-mechanical processing step introduces very largestrains and the strain rates encountered are usually high toimprove the productivity. Therefore, a systematic study of theeffect of processing parameters on the microstructural evolutionin Al–Cu–Li alloy subjected to large strain deformation is essential.
Usually, high temperature deformation studies and microstruc-ture optimization are carried out on hot compression testedspecimens in a laboratory. This involves hot isothermal compressiontesting of solid cylindrical specimens deformed to 50% of theiroriginal height to obtain the stress–strain behavior under theprocessing conditions. Beyond 50% deformation, barreling ofthe cylindrical specimen takes place and therefore, large straindeformation behavior cannot be studied through hot isothermalcompression testing. Here the flow curve is limited to a true strain of0.7. However, in actual industrial thermo-mechanical processing,the strains involved are much higher. Therefore, a large strain

N. Nayan et al. / Materials and Design 65 (2015) 862–868 863
deformation technique is required to simulate the actual process-ing conditions. For this purpose, a single hit, hot isothermal planestrain compression testing has been used in the present study.
Therefore, the purpose of the present study is twofold; firstly tostudy the large strain deformation behavior by conducting hot iso-thermal single hit plane strain compression testing on Al–Cu–Lialloy AA 2195 and study the stress–strain behavior under largestrain conditions; and secondly to evaluate the microstructureand micro-texture evolution of the deformed specimens to under-stand the mechanism of deformation under plane strainconditions.
Fig. 1. Initial microstructure of the material used in the present study. The materialis in as forged condition and has elongated grains in the direction of perpendicularto the direction of forging.
2. Experimental details
A large strain single pass, simple compression techniqueextensively used by one of the co-authors [9–11] is utilized in thepresent study for conducting the large strain deformation studies.In contrast to the other large strain deformation processes wherelarge strains are imposed by multi-pass deformation processes,this technique is a single pass deformation process. Thus this tech-nique eliminates the possibility of the sample undergoing complexmicrostructural changes during static holding/reheating betweenthe processing steps or avoids the sample undergoing complexmulti-axial deformation. In the anvil compression test used inthe present study, the strain imposed gets concentrated at the cen-ter of the specimen and the strain varies in the range of 0–4 fromthe surface to the center of the specimen. This strain distributionfacilitates the observation of microstructures deformed to variousstrain levels in a single specimen. The strain distribution acrossthe specimen and the methodology of testing used in the presentstudy were discussed elsewhere in detail [9–11].
Test samples with dimensions of 15 mm � 13 mm � 12 mmwere fabricated from the hot forged plates of AA 2195 alloy. Thechemical composition of the alloy was 4.2Cu–1.1Li–0.35Mg–0.35Ag–0.15Zr–0.15Fe–0.10Si and balance-aluminium. The plateswere realized from forging of as-cast and homogenized billets castin vacuum induction melting furnace under inert atmosphere. Thedetail of the casting technique has been discussed elsewhere indetails [12–14]. The specimens were machined from the hot forgedplates in such a way that the compression axis is perpendicular tothe forging direction. The initial microstructure of the materialused in the present study is shown in Fig. 1. The material has elon-gated grains in the direction of perpendicular to the direction offorging.
Using a thermo-mechanical simulator capable of controlling thespecimen temperature, strain and strain rate, plane strain com-pression tests were performed. Fig. 2 shows the schematic of theplane strain compression test conditions employed in the presentstudy. As shown in Fig. 2, the specimens were heated to the desiredtemperature in the range of 300–450 �C. Heating of the specimenwas done at 5 K s�1 from ambient temperature to the specifiedtemperature by direct resistance and then compressed in a singlestroke after soaking at the desired temperature for 60 s. Thecompressive deformation was carried out in the time periods of1.38 s and 138 s so as to impose apparent nominal strain rates of
Table 1Variation of volume fraction of h101i fibre and different microstructural parameters dete
Sample Volume fractionof h101i
Averagemisorientation (�)
G
350 �C 10�2 s�1 36.1 35.4 1400 �C 10�2 s�1 45.6 39.0 1450 �C 10�2 s�1 16.5 40.9 1450 �C 10�1 s�1 49.7 37.3 3
1 s�1 and 0.01 s�1, respectively. Immediately after the deformation,the specimens were in-situ water quenched. Post compression,specimens were cut from the sample by a slow speed diamondsaw for optical microscopy and EBSD analysis. Fig. 2(b) showsthe schematic of the geometry of anvil compressed tested specimensand sectioning methodology adopted in the present study formicrostructural observations.
Specimens for EBSD analysis after plane strain compressiontesting were carefully polished with mechanical polishing followedby electro polishing with Struers A2 solution containing perchloricacid, ethanol, butoxy ethanol and distilled water. The electron backscattered diffraction attached with FEI Quanta scanning electronmicroscope and TSL OIM 6 data collection and analysis softwarewas used to collect and process the orientation information.
3. Results and discussion
3.1. Characteristics of flow curves
The microstructural evolution during hot deformation can bestudied through the analysis of stress–strain curves [15–17].Stress–strain curves are classified in to work-hardening type anddynamic recovery/dynamic recrystallisation type. The materialswith strain hardening type curves are characterized by monotonicincrease in flow stress with strain. The microstructures of thesematerials are characterized by deformed/compressed grains with-out any evidence of recovery/recrystallisation. On the other hand,the stress–strain curves exhibiting dynamic recovery/dynamicrecrystallisation are characterized by flow softening immediately/after initial strain hardening. Fig. 3 shows the stress–strain curvesof the samples deformed at different temperatures and strain rates.It can be noticed from Fig. 3 that as the temperature increases ande9 decrease, the flow stress decreases. This flow softening after
rmined from EBSD for differently processed AA 2195 samples.
rain size (lm) Grain orientationspread (GOS) (�)
Grain averagemisorientation (GAM) (�)
8.9 0.89 1.393.9 0.97 1.739.6 0.84 1.552 0.47 0.77
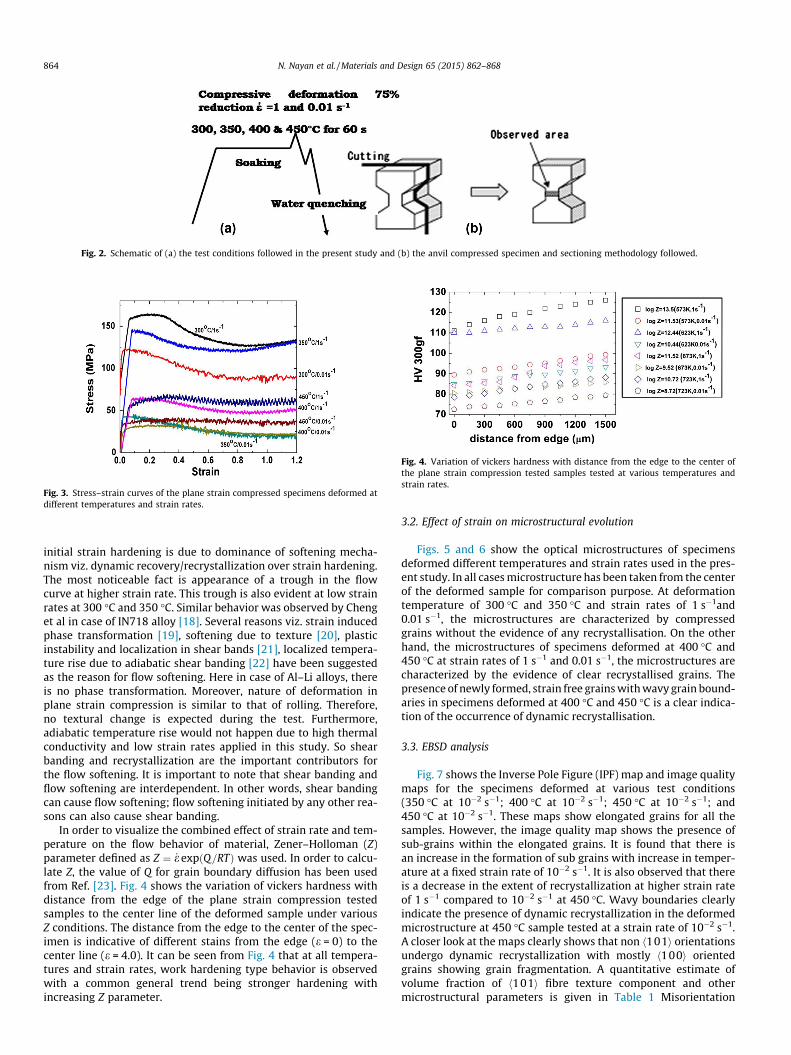
Fig. 2. Schematic of (a) the test conditions followed in the present study and (b) the anvil compressed specimen and sectioning methodology followed.
Fig. 3. Stress–strain curves of the plane strain compressed specimens deformed atdifferent temperatures and strain rates.
Fig. 4. Variation of vickers hardness with distance from the edge to the center ofthe plane strain compression tested samples tested at various temperatures andstrain rates.
864 N. Nayan et al. / Materials and Design 65 (2015) 862–868
initial strain hardening is due to dominance of softening mecha-nism viz. dynamic recovery/recrystallization over strain hardening.The most noticeable fact is appearance of a trough in the flowcurve at higher strain rate. This trough is also evident at low strainrates at 300 �C and 350 �C. Similar behavior was observed by Chenget al in case of IN718 alloy [18]. Several reasons viz. strain inducedphase transformation [19], softening due to texture [20], plasticinstability and localization in shear bands [21], localized tempera-ture rise due to adiabatic shear banding [22] have been suggestedas the reason for flow softening. Here in case of Al–Li alloys, thereis no phase transformation. Moreover, nature of deformation inplane strain compression is similar to that of rolling. Therefore,no textural change is expected during the test. Furthermore,adiabatic temperature rise would not happen due to high thermalconductivity and low strain rates applied in this study. So shearbanding and recrystallization are the important contributors forthe flow softening. It is important to note that shear banding andflow softening are interdependent. In other words, shear bandingcan cause flow softening; flow softening initiated by any other rea-sons can also cause shear banding.
In order to visualize the combined effect of strain rate and tem-perature on the flow behavior of material, Zener–Holloman (Z)parameter defined as Z ¼ _e expðQ=RTÞ was used. In order to calcu-late Z, the value of Q for grain boundary diffusion has been usedfrom Ref. [23]. Fig. 4 shows the variation of vickers hardness withdistance from the edge of the plane strain compression testedsamples to the center line of the deformed sample under variousZ conditions. The distance from the edge to the center of the spec-imen is indicative of different stains from the edge (e = 0) to thecenter line (e = 4.0). It can be seen from Fig. 4 that at all tempera-tures and strain rates, work hardening type behavior is observedwith a common general trend being stronger hardening withincreasing Z parameter.
3.2. Effect of strain on microstructural evolution
Figs. 5 and 6 show the optical microstructures of specimensdeformed different temperatures and strain rates used in the pres-ent study. In all cases microstructure has been taken from the centerof the deformed sample for comparison purpose. At deformationtemperature of 300 �C and 350 �C and strain rates of 1 s�1and0.01 s�1, the microstructures are characterized by compressedgrains without the evidence of any recrystallisation. On the otherhand, the microstructures of specimens deformed at 400 �C and450 �C at strain rates of 1 s�1 and 0.01 s�1, the microstructures arecharacterized by the evidence of clear recrystallised grains. Thepresence of newly formed, strain free grains with wavy grain bound-aries in specimens deformed at 400 �C and 450 �C is a clear indica-tion of the occurrence of dynamic recrystallisation.
3.3. EBSD analysis
Fig. 7 shows the Inverse Pole Figure (IPF) map and image qualitymaps for the specimens deformed at various test conditions(350 �C at 10�2 s�1; 400 �C at 10�2 s�1; 450 �C at 10�2 s�1; and450 �C at 10�2 s�1. These maps show elongated grains for all thesamples. However, the image quality map shows the presence ofsub-grains within the elongated grains. It is found that there isan increase in the formation of sub grains with increase in temper-ature at a fixed strain rate of 10�2 s�1. It is also observed that thereis a decrease in the extent of recrystallization at higher strain rateof 1 s�1 compared to 10�2 s�1 at 450 �C. Wavy boundaries clearlyindicate the presence of dynamic recrystallization in the deformedmicrostructure at 450 �C sample tested at a strain rate of 10�2 s�1.A closer look at the maps clearly shows that non h101i orientationsundergo dynamic recrystallization with mostly h100i orientedgrains showing grain fragmentation. A quantitative estimate ofvolume fraction of h101i fibre texture component and othermicrostructural parameters is given in Table 1 Misorientation

Fig. 5. Optical microstructures at the center of specimens deformed at (a): 300 �Cand 1 s�1; (b): 300 �C and 0.01 s�1; (c): 350 �C and 1 s�1; (d): 350 �C and 0.01 s�1.The microstructures are characterized by compressed grains without the evidenceof any recrystallisation.
Fig. 6. Optical microstructures at the center of specimens deformed at (a): 400 �Cand 1 s�1; (b): 400 �C and 0.01 s�1; (c): 450 �C and 1 s�1; (d): 450 �C and 0.01 s�1.The microstructures are characterized by the evidence of clear recrystallised grains.
N. Nayan et al. / Materials and Design 65 (2015) 862–868 865

Fig. 7. Inverse pole figure and image quality map of Al–Li alloy sample deformed at(a) 350 �C at 10�2 s�1, (b) 400 �C at 10�2 s�1, (c) 450 �C at 10�2 s�1 and (d) 450 �C at10�2 s�1.
Table 2Fraction of different type of grain boundaries in AA 2195 samples subjected todifferent modes of processing.
Sample Very low anglegrain boundary(VLAB, h = 2–5�)
Low angle grainboundary(LAGB, h = 5–15�)
High anglegrain boundary(HAGB, h > 15�)
350 �C 10�2 s�1 8.4 12.2 79.4400 �C 10�2 s�1 5.0 5.1 89.8450 �C 10�2 s�1 6.1 3.9 90.0450 �C 10�1 s�1 9.1 9.1 81.8
866 N. Nayan et al. / Materials and Design 65 (2015) 862–868
distribution in all the four samples shown in Table 2 indicate thehighest fraction of High Angle Grain Boundaries in the 450 �Csample deformed at 10�2 s�1 further substantiating dominantdynamic recrystallization. The evolution of intragranular misorien-tation parameters like Kernel Average Misorientation (KAM), whichis the average misorientation of a pixel with its neighbouring pixelsgives a direct estimate of intragranular dislocation activity., GrainAverage Misorientation and Grain Orientation Spread also indicateformation of new strain free recrystallized grains. However, due tosignificant change in grain size in the deformed samples the GAMand GOS values do not show a particular trend. However, the KAMdistribution sheds light on microstructural evolution in a lucid way.
The KAM distribution for all the samples is characterized by thepresence of one peak at low angle less than 1� and another at highmisorientation of 5� (Fig. 8a and b). It is observed that withincrease in temperature, there is a decrease in low angle misorien-tation with increase in high angle misorientation. The low anglemisorientation corresponds to the formation of dislocationsubstructure and the decrease in fraction of lower KAM valueindicates decrease in dislocation density with increase intemperature. On the other hand, the 450 �C sample tested at higherstrain rate shows an increase in the fraction of low KAM indicatingincrease in dislocation density of this sample. The aforementionedobservations clearly indicate that the extent of DRX is highest athigh temperature and low strain rate. This is further corroboratedby decrease in volume fraction of h101i fibre component for thesample tested at 450 �C 10�2 s�1. The orientation of newly formedrecrystallized grains is different from the h101i fibre orientationwhich is the stable end orientation for plane strain compressionof Al–Li alloy that deforms essentially by planar slip. A closer lookat the misorientation distribution in terms of the cumulativemisorientation distribution plot in Fig. 9 shows a higher fractionof low angle boundaries at lower temperature. Thus the processof conversion of low angle grain boundaries to high angle grainboundaries by the process of DRX is accelerated at high tempera-ture. The sample deformed at high temperature and high strainrate shows relatively lower fraction of HAGB compared to slowstrain rate deformed sample at the same temperature. Thisindicates that the process of conversion of LAGB to HAGB is notcomplete due to less time for dislocation rearrangement and inter-action. However, lower grain size obtained at higher strain rateproves that the higher fraction of HAGB in the low strain ratesample is due to grain growth. The occurrence of grain growth isconfirmed by higher grain size from the horizontal interceptcompared to the vertical intercept for the 400 �C sample tested atslow strain rate. Thus an optimum combination of high temperatureand high strain rate can be combined to obtain sub-micron grainsin Al–Li alloy. The combined effect of temperature and strain rate isexpressed in terms of the Zener–Hollomon parameter and it isobserved that the grain refinement is higher that is the grain sizeis lower for higher Zener–Hollomon parameter.
It is to be mentioned here that aluminium–lithium alloys havehistorically suffered due to poor formability. One of the reasons for

Fig. 8. Variation of KAM for the samples deformed at (a) different temperatures at agiven strain rate of 10�2 s�1 and (b) at different strain rates at a given temperatureof 450 �C.
Fig. 9. Cumulative misorientation distribution in samples plane strain compressedtested under different conditions.
Table 3Volume fraction of the important rolling/plane strain deformation components in AA2195 alloy processed by different routes.
Sample Cube Goss Cu Bs S
350 �C 10�2 s�1 0.8 0.4 2.2 26 27.9400 �C 10�2 s�1 0.4 1.8 1.4 24.1 11.8450 �C 10�2 s�1 3.1 0.4 4.3 13.6 22.6450 �C 10�1 s�1 2.7 0.5 1.1 37.8 14.2
N. Nayan et al. / Materials and Design 65 (2015) 862–868 867
the poor formability is the presence of a strong Bs {101}h121icomponent due to planar slip [24]. In order to monitor theevolution of crystallographic texture as a function of differentprocessing conditions, volume fraction of important rolling texture
components namely Cu{112}h111i, Bs {110}h112i, S {123}h364i,Cube {100}h001i and Goss {110}h001i was calculated from theEBSD scans. The volume fraction as depicted in Table 3 clearlyshow the presence of strong Bs and S component along with aweak Cu component in all the samples. However, the presence ofweak h101i texture that is manifested in terms of lower Bscomponent accompanied with significant Cube component forthe sample deformed at 450 �C at strain rate of 0.01. Thus choiceof a proper thermomechanical processing condition providingmore equiaxed and finer grain size with relatively weaker Bstexture may offer better formability.
4. Conclusions
Microstructural evolution during large strain deformation ofaluminium–copper–lithium alloy AA 2195 has been studied usinga single hit, hot isothermal plane strain compression (PSC) testingmethod in the temperature range of 300–450 �C and at strain ratesof 0.01 s�1 and 1 s�1.
(1) The flow curves during PSC exhibited weak softening athigher temperatures and dipping of the flow curve at a strainrate of 1 s�1.
(2) Optical microstructure revealed compressed type grains inthe specimens deformed at 300 �C and 350 �C, whereas clearstress free grain with wavy grain boundaries were noticed inspecimens deformed at 400 �C and 450 �C.
(3) Electron backscattered diffraction analysis (EBSD) of the PSCtested samples confirmed that dynamic recrystallisationoccurs in specimens deformed at higher temperatures andlower strain rates.
(4) Finally, it is possible to control the grain size in AA 2195through the optimization of temperature and strain rateduring thermo-mechanical processing.
Acknowledgement
The authors wish to thank Director, VSSC for granting permis-sion to publish this work.
References
[1] Dursun T, Soutis C. Recent developments in advanced aircraft aluminiumalloys. Mater Des 2014;56:862–71.
[2] Rioja RJ, Liu J. The evolution of Al–Li base products for aerospace and spaceapplications. Metall Mater Trans A 2012;43:3325–37.
[3] Zhang SF, Zeng WD, Yang WH, Shi CL, Wang HJ. Ageing response of a Al–Cu–Li2198 alloy. Mater Des 2014.
[4] Lynch S, Muddle B, Pasang T. Ductile-to-brittle fracture transitions in 8090 Al–Li alloys. Acta Mater 2001;49:2863–74.
[5] Rao KV, Yu W, Ritchie R. Cryogenic toughness of commercial aluminum–lithium alloys: role of delamination toughening. Metall Trans A1989;20:485–97.
[6] Suresh S, Vasudevan A, Tosten M, Howell P. Microscopic and macroscopicaspects of fracture in lithium-containing aluminum alloys. Acta Metall1987;35:25–46.
[7] Huang X, Richards N, Chaturvedi M. Effect of grain size on the weldability ofcast alloy 718. Mater Manuf Processes 2004;19:285–311.

868 N. Nayan et al. / Materials and Design 65 (2015) 862–868
[8] Lathabai S, Lloyd P. The effect of scandium on the microstructure, mechanicalproperties and weldability of a cast Al–Mg alloy. Acta Mater 2002;50:4275–92.
[9] Murty S, Torizuka S, Nagai K, Kitai T, Kogo Y. Dynamic recrystallization offerrite during warm deformation of ultrafine grained ultra-low carbon steel.Scripta Mater 2005;53:763–8.
[10] Narayana Murty S, Torizuka S, Nagai K. Microstructural and micro-texturalevolution during single pass high Z-large strain deformation of a 0. 15 C steel.ISIJ international. 2005;45:1651–7.
[11] Narayana Murty S, Torizuka S, Nagai K, Koseki N, Kogo Y. Classification ofmicrostructural evolution during large strain high Z deformation of a 0.15carbon steel. Scripta Mater 2005;52:713–8.
[12] Nayan N, Murty S, Jha AK, Pant B, Sharma S, George KM, et al. Processing andcharacterization of Al–Cu–Li alloy AA 2195 undergoing scale up productionthrough the vacuum induction melting technique. Mater Sci Eng A2013;576:21–8.
[13] Nayan N, Murty S, Sharma S, Sreekumar K, Sinha P. Processing andcharacterization of Al–Cu–Li alloy AA2195. Mater Sci Forum: Trans TechPubl 2012:119–24.
[14] Nayan N, Nair KS, Mittal M, Sudhakaran K. Studies on Al–Cu–Li–Mg–Ag–Zralloy processed through vacuum induction melting (VIM) technique. Mater SciEng, A 2007;454:500–7.
[15] Puchi E, Staia M. Mechanical behavior of aluminum deformed under hot-working conditions. Metall Mater Trans A 1995;26:2895–910.
[16] Puchi E, Staia M. High-temperature deformation of commercial-purityaluminum. Metall Mater Trans A 1998;29:2345–59.
[17] Schotten K, Bleck W, Dahl W. Modelling of flow curves for hot deformation.Steel Res 1998;69:193–7.
[18] Cheng L, Xue X, Tang B, Liu D, Li J, Kou H, et al. Deformation behavior of hot-rolled IN718 superalloy under plane strain compression at elevatedtemperature. Mater Sci Eng A 2014;606:24–30.
[19] Zhang X, Liu Q, Wu X, Zhu A. Work softening and annealing hardening ofdeformed nanocrystalline nickel. Appl Phys Lett 2008;93:261907.
[20] Asaro RJ, Needleman A. Overview No. 42 texture development and strainhardening in rate dependent polycrystals. Acta Metall 1985;33:923–53.
[21] Sun P, Cerreta E, Gray III G, Bingert J. The effect of grain size, strain rate, andtemperature on the mechanical behavior of commercial purity aluminum.Metall Mater Trans A 2006;37:2983–94.
[22] Semiatin S, Jonas J. Formability and workability of metals: plasticinstability and flow localization. Ohio, USA: American Society for Metals;1984.
[23] Srinivasan M, Goforth R. Studies on activation energy of superplasticdynamically recrystallized aluminum–lithium alloys. Scr Metall Mater1994;31:1151–6.
[24] Jata KV, Panchanadeeswaran S, Vasudevan AK. Evolution of texture, microstructure and mechanical property anisotropy in an Al–Li–Cu alloy. Mater SciEng A 1998;257(1):37–46.