Embed Size (px)
Citation preview


STATISTICS
A. Some Of Statistical Term B. Representing Data C. Histogram, Polygon, and Ogive

A. Some of Statistical Term
Datum : any single information gathered from a research.
Data : a set of datum.
Population : a set of entire object that addressed in our research.
Sample : a part of population.
Quantitative : data is in numerical form.
Qualitative : data is not in numerical form.

B. Representing Data
1. Representing data in a form of diagram a. Stem diagram b. Line diagram c. Circle diagram
2. Representing data in a form of table a. List of frequency distribution 1) Single data 2) Grouped data 3) Process of constructing a frequency table
b. List of cumulative frequency distribution

1. Representing data in a form of diagram a. Stem diagram
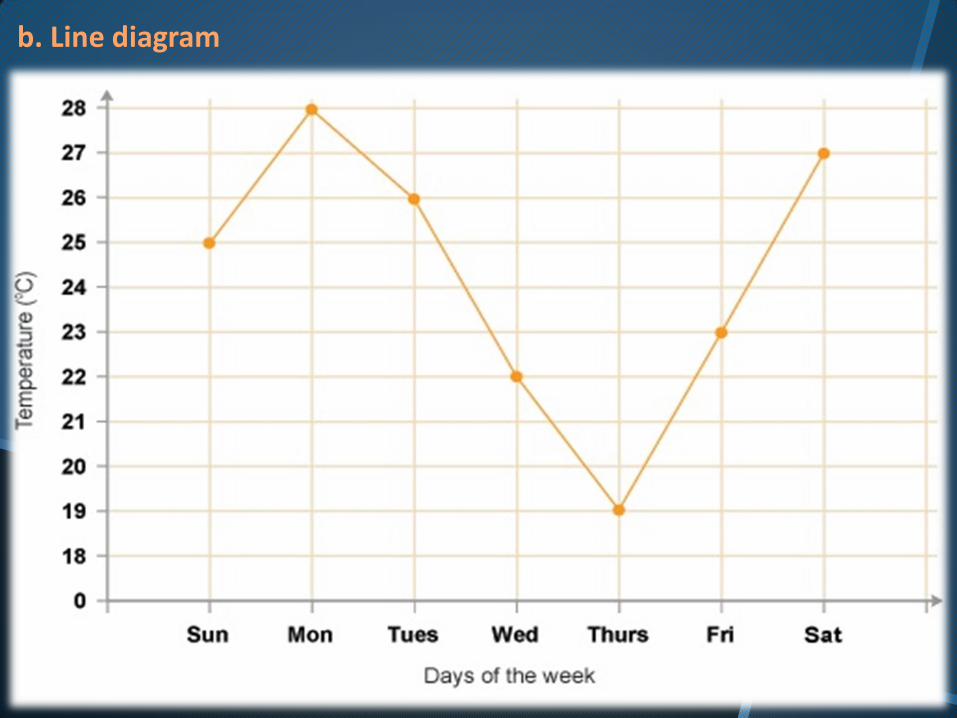
b. Line diagram

c. Circle diagram

2. Representing data in a form of table a. List of frequency distribution 1) Single data

2) Grouped data

3) Process of constructing a frequency table
Time magazine collected information on all 464 people who died from gunfire in the Philippines during one week. Here are the ages of 50 men randomly selected from that population. Construct a frequency distribution table!
19 18 30 40 41 33 73 25 27 37
23 25 21 33 65 17 20 76 23 71
47 69 20 31 18 24 35 24 25 25
17 36 65 70 22 25 65 16 75 23
24 29 42 37 26 46 27 63 27 21

From the data, we have : n = 30 Xmax = 76 Xmin = 16
Step 1 : range (J) J = Xmax – Xmin
= 76 – 16 = 60
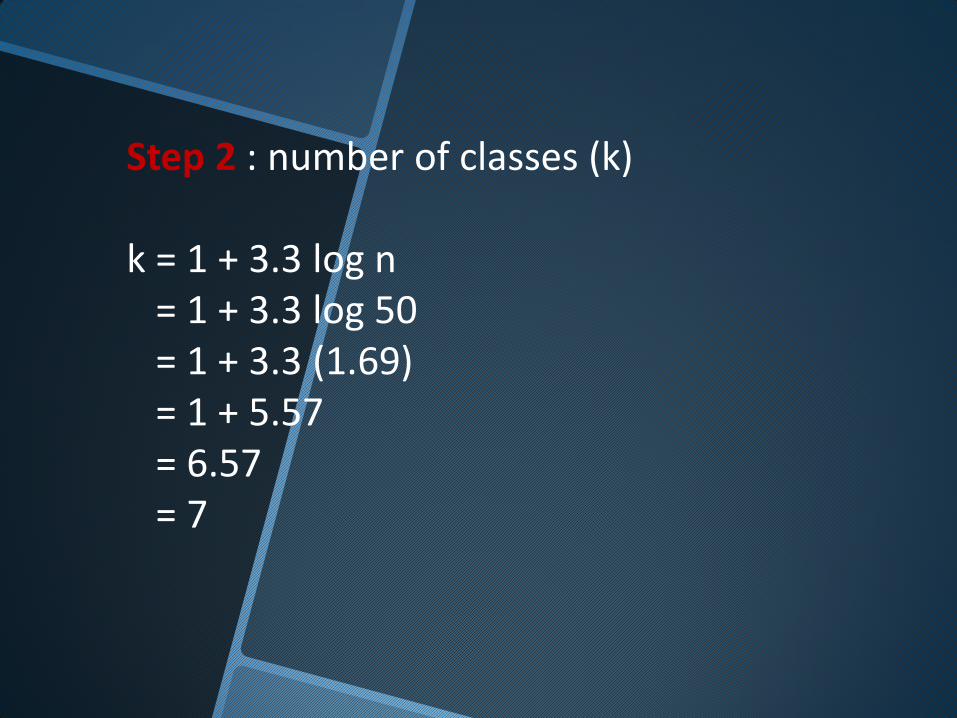
Step 2 : number of classes (k) k = 1 + 3.3 log n = 1 + 3.3 log 50 = 1 + 3.3 (1.69) = 1 + 5.57 = 6.57 = 7

Step 3 : length of class (c) c = J k = 60 7 = 8.57 = 9

Data Tally Frequency
16 – 24
25 – 33
34 – 42
43 – 51
52 – 60
61 – 69
70 – 78
/////-/////-/////-//
/////-/////-////
/////-//
//
/////
/////
17
14
7
2
0
5
5
Step 4 : make the list of frequency distribution

b. List of cumulative frequency distribution
Data fi tb ta
Cumulative Frequency
fk ≥ tb fk ≤ ta
16 – 24 25 – 33 34 – 42 43 – 51 52 – 60 61 – 69 70 – 78
17 14 7 2 0 5 5
15.5 24.5 33.5 42.5 51.5 60.5 69.5
24.5 33.5 42.5 51.5 60.5 69.5 78.5
50 33 19 12 10 10 5
17 31 38 40 40 45 50
C. Histogram, Polygon, and Ogive


THANK YOU