Embed Size (px)
Citation preview

8/7/2019 MATAGORDA COUNTY - Palacios ISD - 2010 Texas School Survey of Drug and Alcohol Use
http://slidepdf.com/reader/full/matagorda-county-palacios-isd-2010-texas-school-survey-of-drug-and-alcohol 1/90
Palacios
SPRING 2010
Texas School Survey
of Drug and Alcohol Use
2010
Palacios ISD
Part I: District Results
Secondary
©Copyright 2010, Texas A&M University
All rights reserved.
Secondary Report-Page 1 of 90

8/7/2019 MATAGORDA COUNTY - Palacios ISD - 2010 Texas School Survey of Drug and Alcohol Use
http://slidepdf.com/reader/full/matagorda-county-palacios-isd-2010-texas-school-survey-of-drug-and-alcohol 2/90
Palacios
SPRING 2010
©Copyright 2010, Texas A&M University
All rights reserved.
Secondary Report-Page 2 of 90

8/7/2019 MATAGORDA COUNTY - Palacios ISD - 2010 Texas School Survey of Drug and Alcohol Use
http://slidepdf.com/reader/full/matagorda-county-palacios-isd-2010-texas-school-survey-of-drug-and-alcohol 3/90
Palacios
SPRING 2010
Part I: District ResultsSecondary (7-12)
Table of Contents
General Substance Tables 5-40
TobaccoAlcoholDrugsInhalantsMiscellaneous
Prevalence Tables 41-70
Selected Substances:
Table B1: All StudentsTable B2: Male StudentsTable B3: Female StudentsTable B4: White StudentsTable B5: African/American StudentsTable B6: Mexican/American StudentsTable B7: Students Reporting A GradesTable B8: Students Reporting Grades Lower Than an ATable B9: Students Living With 2 ParentsTable B10: Students Not Living With 2 ParentsTable B11: Students who would seek help from adults
Table B12: Students who wouldn’t seek help from adultsTable B13 Students Living in Town More Than 3 YearsTable B14: Students Living in Town 3 Years or Less
Margin Tables 71-88
©Copyright 2010, Texas A&M University
All rights reserved.
Secondary Report-Page 3 of 90

8/7/2019 MATAGORDA COUNTY - Palacios ISD - 2010 Texas School Survey of Drug and Alcohol Use
http://slidepdf.com/reader/full/matagorda-county-palacios-isd-2010-texas-school-survey-of-drug-and-alcohol 4/90
Palacios
SPRING 2010
©Copyright 2010, Texas A&M University
All rights reserved.
Secondary Report-Page 4 of 90

8/7/2019 MATAGORDA COUNTY - Palacios ISD - 2010 Texas School Survey of Drug and Alcohol Use
http://slidepdf.com/reader/full/matagorda-county-palacios-isd-2010-texas-school-survey-of-drug-and-alcohol 5/90
Palacios
SPRING 2010
1. General Substance Tables
©Copyright 2010, Texas A&M University
All rights reserved.
Secondary Report-Page 5 of 90

8/7/2019 MATAGORDA COUNTY - Palacios ISD - 2010 Texas School Survey of Drug and Alcohol Use
http://slidepdf.com/reader/full/matagorda-county-palacios-isd-2010-texas-school-survey-of-drug-and-alcohol 6/90
Palacios
SPRING 2010
©Copyright 2010, Texas A&M University
All rights reserved.
Secondary Report-Page 6 of 90

8/7/2019 MATAGORDA COUNTY - Palacios ISD - 2010 Texas School Survey of Drug and Alcohol Use
http://slidepdf.com/reader/full/matagorda-county-palacios-isd-2010-texas-school-survey-of-drug-and-alcohol 7/90
Palacios
SPRING 2010
Table T-1: How recently, if ever, have you used ..
Past
Month
School
Year
Ever
Used
Never
Used
Any tobacco product?
All 10.3% 16.1% 30.3% 69.7%
Grade 8 8.0% 11.0% 28.0% 72.0%Grade 9 6.5% 15.0% 30.8% 69.2%
Grade 12 18.9% 24.3% 32.4% 67.6%
Cigarettes?
All 9.6% 15.1% 29.0% 71.0%
Grade 8 8.1% 10.1% 25.3% 74.7%
Grade 9 6.5% 15.0% 29.9% 70.1%
Grade 12 16.2% 21.6% 32.4% 67.6%
Smokeless tobacco?
All 4.8% 6.2% 11.3% 88.7%
Grade 8 2.1% 4.1% 9.3% 90.7%
Grade 9 2.9% 2.9% 9.6% 90.4%
Grade 12 10.8% 13.5% 16.2% 83.8%
Table T-2: How often do you normally use ..
Never
Used
Every
Day
Several
Times a
Week
Several
Times a
Month
About
Once a
Month
About
Once a
Year
Less than
Once a
Year
Any tobacco product?
All 74.3% 1.8% 1.4% 6.1% 7.0% 2.6% 6.8%
Grade 8 77.8% 1.0% 2.0% 8.1% 1.0% 1.0% 9.1%
Grade 9 74.5% 0.0% 1.9% 4.7% 7.5% 5.7% 5.7%
Grade 12 69.4% 5.6% 0.0% 5.6% 13.9% 0.0% 5.6%Cigarettes?
All 75.5% 1.1% 1.1% 5.8% 6.7% 2.6% 7.2%
Grade 8 80.8% 1.0% 2.0% 6.1% 1.0% 1.0% 8.1%
Grade 9 75.0% 0.0% 1.0% 5.8% 6.7% 5.8% 5.8%
Grade 12 69.4% 2.8% 0.0% 5.6% 13.9% 0.0% 8.3%
Smokeless tobacco?
All 88.4% 1.5% 0.7% 1.4% 1.9% 1.9% 4.1%
Grade 8 91.9% 0.0% 1.0% 2.0% 1.0% 0.0% 4.0%
Grade 9 89.3% 0.0% 1.0% 0.0% 3.9% 2.9% 2.9%
Grade 12 82.4% 5.9% 0.0% 2.9% 0.0% 2.9% 5.9%
©Copyright 2010, Texas A&M University
All rights reserved.
Secondary Report-Page 7 of 90

8/7/2019 MATAGORDA COUNTY - Palacios ISD - 2010 Texas School Survey of Drug and Alcohol Use
http://slidepdf.com/reader/full/matagorda-county-palacios-isd-2010-texas-school-survey-of-drug-and-alcohol 8/90
Palacios
SPRING 2010
Table T-3: Average age of first use of:
Grade 8 Grade 9 Grade 12
Cigarettes
10.8 12.2 14.6
Smokeless tobacco
10.7 12.5 14.2
Any Tobacco
10.8 12.2 14.2
©Copyright 2010, Texas A&M University
All rights reserved.
Secondary Report-Page 8 of 90

8/7/2019 MATAGORDA COUNTY - Palacios ISD - 2010 Texas School Survey of Drug and Alcohol Use
http://slidepdf.com/reader/full/matagorda-county-palacios-isd-2010-texas-school-survey-of-drug-and-alcohol 9/90
Palacios
SPRING 2010
Table T-4: If you wanted some, how difficult would it be to get...
Never
Heard Of Impossible
Very
Difficult
Somewhat
Difficult
Somewhat
Easy Very Easy
Any tobacco product?
All 17.3% 20.3% 5.7% 9.2% 10.7% 36.8%
Grade 8 15.3% 21.4% 10.2% 8.2% 12.2% 32.7%
Grade 9 16.0% 26.0% 4.0% 11.0% 17.0% 26.0%Grade 12 21.6% 10.8% 2.7% 8.1% 0.0% 56.8%
Cigarettes?
All 18.1% 20.7% 5.0% 10.4% 11.1% 34.6%
Grade 8 16.5% 22.7% 9.3% 8.2% 12.4% 30.9%
Grade 9 17.0% 26.0% 3.0% 14.0% 18.0% 22.0%
Grade 12 21.6% 10.8% 2.7% 8.1% 0.0% 56.8%
Smokeless Tobacco?
All 23.8% 25.7% 7.4% 9.1% 9.7% 24.3%
Grade 8 24.2% 27.4% 12.6% 7.4% 12.6% 15.8%
Grade 9 26.5% 30.6% 6.1% 11.2% 10.2% 15.3%
Grade 12 19.4% 16.7% 2.8% 8.3% 5.6% 47.2%
Table T-5: About how many of your close friends...
None A Few Some Most ALL
Use any tobacco product?
All 38.4% 33.2% 19.9% 7.0% 1.5%
Grade 8 47.4% 33.0% 14.4% 5.2% 0.0%
Grade 9 35.0% 34.0% 25.2% 5.8% 0.0%
Grade 12 32.4% 32.4% 18.9% 10.8% 5.4%
Smoke cigarettes?
All 40.7% 35.3% 17.4% 5.1% 1.5%
Grade 8 51.0% 32.3% 11.5% 5.2% 0.0%
Grade 9 37.9% 37.9% 19.4% 4.9% 0.0%
Grade 12 32.4% 35.1% 21.6% 5.4% 5.4%
Use a smokeless tobacco product?
All 59.1% 21.3% 13.9% 4.2% 1.5%
Grade 8 66.3% 22.1% 9.5% 2.1% 0.0%
Grade 9 58.6% 22.2% 14.1% 5.1% 0.0%
Grade 12 51.4% 18.9% 18.9% 5.4% 5.4%
©Copyright 2010, Texas A&M University
All rights reserved.
Secondary Report-Page 9 of 90

8/7/2019 MATAGORDA COUNTY - Palacios ISD - 2010 Texas School Survey of Drug and Alcohol Use
http://slidepdf.com/reader/full/matagorda-county-palacios-isd-2010-texas-school-survey-of-drug-and-alcohol 10/90
Palacios
SPRING 2010
Table T-6: How do your parents feel about kids your age using tobacco?
Strongly
Disapprove
Mildly
Disapprove Neither
Mildly
Approve
Strongly
Approve Don't know
All 78.8% 8.4% 4.1% 0.4% 0.4% 8.0%
Grade 8 80.4% 2.1% 3.1% 0.0% 0.0% 14.4%
Grade 9 75.2% 11.4% 3.8% 1.0% 1.0% 7.6%
Grade 12 82.4% 11.8% 5.9% 0.0% 0.0% 0.0%
Table T-7: How dangerous do you think it is for kids your age to use tobacco?
Very
Dangerous
Somewhat
Dangerous
Not very
Dangerous
Not at All
Dangerous Do Not Know
All 52.7% 26.5% 12.2% 3.4% 5.2%
Grade 8 56.3% 24.0% 13.5% 2.1% 4.2%
Grade 9 52.4% 31.1% 9.7% 1.0% 5.8%
Grade 12 48.6% 22.9% 14.3% 8.6% 5.7%
©Copyright 2010, Texas A&M University
All rights reserved.
Secondary Report-Page 10 of 90

8/7/2019 MATAGORDA COUNTY - Palacios ISD - 2010 Texas School Survey of Drug and Alcohol Use
http://slidepdf.com/reader/full/matagorda-county-palacios-isd-2010-texas-school-survey-of-drug-and-alcohol 11/90
Palacios
SPRING 2010
Table A-1: How recently, if ever, have you used...
Past
Month
School
Year
Ever
Used
Never
Used
Any alcohol product?
All 30.6% 46.4% 69.9% 30.1%
Grade 8 27.7% 37.6% 69.3% 30.7%
Grade 9 29.9% 50.5% 72.0% 28.0%Grade 12 35.1% 51.4% 67.6% 32.4%
Beer?
All 23.3% 34.9% 60.3% 39.7%
Grade 8 23.5% 33.7% 63.3% 36.7%
Grade 9 20.8% 34.0% 56.6% 43.4%
Grade 12 27.0% 37.8% 62.2% 37.8%
Wine coolers?
All 16.0% 29.3% 45.9% 54.1%
Grade 8 15.5% 22.7% 40.2% 59.8%
Grade 9 18.1% 36.2% 54.3% 45.7%
Grade 12 13.5% 27.0% 40.5% 59.5%
Wine?
All 12.6% 20.6% 37.2% 62.8%
Grade 8 9.7% 16.1% 37.6% 62.4%
Grade 9 8.0% 17.0% 37.0% 63.0%
Grade 12 22.9% 31.4% 37.1% 62.9%
Liquor?
All 17.8% 34.3% 53.0% 47.0%
Grade 8 15.0% 26.0% 40.0% 60.0%
Grade 9 13.5% 34.6% 58.7% 41.3%
Grade 12 27.8% 44.4% 61.1% 38.9%
©Copyright 2010, Texas A&M University
All rights reserved.
Secondary Report-Page 11 of 90

8/7/2019 MATAGORDA COUNTY - Palacios ISD - 2010 Texas School Survey of Drug and Alcohol Use
http://slidepdf.com/reader/full/matagorda-county-palacios-isd-2010-texas-school-survey-of-drug-and-alcohol 12/90
Palacios
SPRING 2010
Table A-2: How often do you normally use...
Never
Used
Every
Day
Several
Times a
Week
Several
Times a
Month
About
Once a
Month
About
Once a
Year
Less than
Once a
Year
Any alcohol product?
All 38.5% 0.3% 5.7% 13.7% 17.0% 15.8% 8.9%
Grade 8 41.0% 1.0% 5.0% 11.0% 14.0% 15.0% 13.0%Grade 9 30.8% 0.0% 4.7% 14.0% 23.4% 15.9% 11.2%
Grade 12 47.2% 0.0% 8.3% 16.7% 11.1% 16.7% 0.0%
Beer?
All 48.5% 0.3% 3.6% 12.4% 14.4% 12.8% 7.9%
Grade 8 48.0% 1.0% 4.1% 10.2% 11.2% 13.3% 12.2%
Grade 9 43.4% 0.0% 1.9% 9.4% 20.8% 15.1% 9.4%
Grade 12 57.1% 0.0% 5.7% 20.0% 8.6% 8.6% 0.0%
Wine coolers?
All 59.0% 0.0% 2.5% 7.1% 12.5% 14.2% 4.7%
Grade 8 65.3% 0.0% 3.1% 3.1% 10.2% 12.2% 6.1%
Grade 9 48.6% 0.0% 1.9% 9.5% 19.0% 14.3% 6.7%
Grade 12 66.7% 0.0% 2.8% 8.3% 5.6% 16.7% 0.0%
Wine?
All 62.9% 0.0% 1.8% 4.8% 7.3% 14.5% 8.6%
Grade 8 62.9% 0.0% 2.1% 3.1% 8.2% 8.2% 15.5%
Grade 9 62.1% 0.0% 1.0% 3.9% 7.8% 16.5% 8.7%
Grade 12 63.9% 0.0% 2.8% 8.3% 5.6% 19.4% 0.0%
Liquor?
All 52.0% 0.3% 4.0% 11.7% 11.2% 14.7% 6.1%
Grade 8 60.0% 1.0% 4.0% 6.0% 13.0% 8.0% 8.0%
Grade 9 42.9% 0.0% 2.9% 13.3% 15.2% 17.1% 8.6%
Grade 12 55.6% 0.0% 5.6% 16.7% 2.8% 19.4% 0.0%
©Copyright 2010, Texas A&M University
All rights reserved.
Secondary Report-Page 12 of 90

8/7/2019 MATAGORDA COUNTY - Palacios ISD - 2010 Texas School Survey of Drug and Alcohol Use
http://slidepdf.com/reader/full/matagorda-county-palacios-isd-2010-texas-school-survey-of-drug-and-alcohol 13/90
Palacios
SPRING 2010
Table A-3: When you drink the following alcoholic beverages, how many drinks doyou usually have at one time, on average?
Never Ever Used 5 or More 1 to 4 Less than 1
Beer
All 43.2% 56.8% 17.6% 26.4% 12.7%
Grade 8 41.7% 58.3% 17.7% 22.9% 17.7%
Grade 9 43.7% 56.3% 12.6% 34.0% 9.7%
Grade 12 44.4% 55.6% 25.0% 19.4% 11.1%
Wine Coolers
All 53.3% 46.7% 12.7% 27.0% 7.1%
Grade 8 62.9% 37.1% 10.3% 21.6% 5.2%
Grade 9 43.6% 56.4% 11.9% 38.6% 5.9%
Grade 12 55.6% 44.4% 16.7% 16.7% 11.1%
Wine
All 61.3% 38.7% 4.5% 22.6% 11.6%
Grade 8 62.9% 37.1% 3.1% 21.6% 12.4%
Grade 9 63.4% 36.6% 3.0% 20.8% 12.9%
Grade 12 55.9% 44.1% 8.8% 26.5% 8.8%
LiquorAll 47.2% 52.8% 15.6% 27.3% 10.0%
Grade 8 58.2% 41.8% 10.2% 23.5% 8.2%
Grade 9 39.8% 60.2% 17.5% 32.0% 10.7%
Grade 12 44.4% 55.6% 19.4% 25.0% 11.1%
Table A-4: During the past 30 days, on how many days have you had five or moredrinks of alcohol at one time?
Never/None 1 day 2 days 3 to 5 days 6 to 9 days
10 or
more days
Alcohol
All 72.8% 8.1% 5.8% 6.9% 3.4% 3.2%
Grade 8 75.5% 6.1% 6.1% 7.1% 0.0% 5.1%
Grade 9 74.5% 11.3% 3.8% 5.7% 2.8% 1.9%
Grade 12 66.7% 5.6% 8.3% 8.3% 8.3% 2.8%
Table A-5: Average age of first use of:
Grade 8 Grade 9 Grade 12
Beer
10.9 12.5 14.7Wine Coolers
10.9 12.5 14.6
Wine
11.4 12.9 14.4
Liquor
12.0 13.1 14.9
Any Alcohol
10.8 12.4 14.5
©Copyright 2010, Texas A&M University
All rights reserved.
Secondary Report-Page 13 of 90

8/7/2019 MATAGORDA COUNTY - Palacios ISD - 2010 Texas School Survey of Drug and Alcohol Use
http://slidepdf.com/reader/full/matagorda-county-palacios-isd-2010-texas-school-survey-of-drug-and-alcohol 14/90
Palacios
SPRING 2010
©Copyright 2010, Texas A&M University
All rights reserved.
Secondary Report-Page 14 of 90

8/7/2019 MATAGORDA COUNTY - Palacios ISD - 2010 Texas School Survey of Drug and Alcohol Use
http://slidepdf.com/reader/full/matagorda-county-palacios-isd-2010-texas-school-survey-of-drug-and-alcohol 15/90
Palacios
SPRING 2010
Table A-6: If you wanted some, how difficult would it be to get...
Never
Heard Of Impossible
Very
Difficult
Somewhat
Difficult
Somewhat
Easy Very Easy
Beer?
All 11.3% 16.5% 4.1% 8.9% 24.9% 34.2%
Grade 8 9.5% 15.8% 5.3% 9.5% 22.1% 37.9%
Grade 9 11.0% 19.0% 6.0% 7.0% 31.0% 26.0%Grade 12 13.9% 13.9% 0.0% 11.1% 19.4% 41.7%
Wine coolers?
All 17.2% 19.4% 5.9% 11.4% 16.0% 29.9%
Grade 8 20.4% 23.5% 7.1% 10.2% 12.2% 26.5%
Grade 9 17.2% 20.2% 7.1% 9.1% 21.2% 25.3%
Grade 12 13.5% 13.5% 2.7% 16.2% 13.5% 40.5%
Wine?
All 14.9% 17.7% 7.5% 16.3% 15.0% 28.5%
Grade 8 11.3% 20.6% 14.4% 16.5% 11.3% 25.8%
Grade 9 17.2% 18.2% 5.1% 18.2% 19.2% 22.2%
Grade 12 16.2% 13.5% 2.7% 13.5% 13.5% 40.5%
Liquor?
All 14.4% 19.5% 7.6% 10.5% 19.0% 29.0%
Grade 8 14.4% 22.7% 12.4% 5.2% 15.5% 29.9%
Grade 9 13.0% 23.0% 7.0% 11.0% 24.0% 22.0%
Grade 12 16.2% 10.8% 2.7% 16.2% 16.2% 37.8%
Any alcohol product?
All 10.3% 14.3% 3.2% 10.6% 22.6% 38.9%
Grade 8 8.1% 14.1% 7.1% 10.1% 16.2% 44.4%
Grade 9 10.0% 15.0% 2.0% 11.0% 31.0% 31.0%
Grade 12 13.5% 13.5% 0.0% 10.8% 18.9% 43.2%
©Copyright 2010, Texas A&M University
All rights reserved.
Secondary Report-Page 15 of 90

8/7/2019 MATAGORDA COUNTY - Palacios ISD - 2010 Texas School Survey of Drug and Alcohol Use
http://slidepdf.com/reader/full/matagorda-county-palacios-isd-2010-texas-school-survey-of-drug-and-alcohol 16/90
Palacios
SPRING 2010
Table A-7: Since school began in the fall, on how many days (if any) have you...
None 1-3 Times 4-9 Times 10+ Times
Attended class while drunk on alcohol?
All 95.8% 3.9% 0.0% 0.3%
Grade 8 93.0% 6.0% 0.0% 1.0%
Grade 9 97.1% 2.9% 0.0% 0.0%
Grade 12 97.2% 2.8% 0.0% 0.0%
Gotten into trouble with teachers because of your drinking?
All 99.6% 0.0% 0.0% 0.4%
Grade 8 100.0% 0.0% 0.0% 0.0%
Grade 9 99.0% 0.0% 0.0% 1.0%
Grade 12 100.0% 0.0% 0.0% 0.0%
Table A-8: School year use of alcohol by absences and conduct problems:
Average days absent due to
illness or other reasonsAlcohol Users: 3.2
Alcohol Non-use 3.1
Average days conduct problems
reported
Alcohol Users: 2.0
Alcohol Non-use 1.0
Table A-9: During the past twelve months, how many times have you...
None 1-3 Times 4-9 Times 10+ Times
Driven a car when you've had a good bit to drink?
All 91.8% 4.7% 1.2% 2.3%
Grade 9 94.2% 5.8% 0.0% 0.0%
Grade 12 87.9% 3.0% 3.0% 6.1%
Gotten into trouble with the police because of drinking?
All 96.2% 3.8% 0.0% 0.0%
Grade 8 96.8% 3.2% 0.0% 0.0%
Grade 9 99.0% 1.0% 0.0% 0.0%
Grade 12 90.9% 9.1% 0.0% 0.0%
©Copyright 2010, Texas A&M University
All rights reserved.
Secondary Report-Page 16 of 90

8/7/2019 MATAGORDA COUNTY - Palacios ISD - 2010 Texas School Survey of Drug and Alcohol Use
http://slidepdf.com/reader/full/matagorda-county-palacios-isd-2010-texas-school-survey-of-drug-and-alcohol 17/90
Palacios
SPRING 2010
Table A-10: About how many of your close friends use...
None A Few Some Most ALL
Any alcohol product?
All 18.2% 24.0% 23.1% 23.5% 11.3%
Grade 8 15.2% 30.3% 23.2% 23.2% 8.1%
Grade 9 20.2% 22.1% 22.1% 25.0% 10.6%
Grade 12 18.9% 18.9% 24.3% 21.6% 16.2%
Beer?
All 19.1% 26.2% 23.8% 21.6% 9.4%
Grade 8 16.7% 32.3% 24.0% 21.9% 5.2%
Grade 9 20.8% 25.7% 22.8% 22.8% 7.9%
Grade 12 19.4% 19.4% 25.0% 19.4% 16.7%
Wine coolers?
All 38.1% 23.3% 19.7% 14.5% 4.4%
Grade 8 46.3% 22.1% 15.8% 12.6% 3.2%
Grade 9 33.3% 23.5% 25.5% 16.7% 1.0%
Grade 12 35.1% 24.3% 16.2% 13.5% 10.8%
Wine?
All 48.7% 27.7% 14.3% 6.3% 3.0%Grade 8 48.9% 27.7% 12.8% 8.5% 2.1%
Grade 9 47.5% 29.7% 15.8% 5.0% 2.0%
Grade 12 50.0% 25.0% 13.9% 5.6% 5.6%
Liquor?
All 30.3% 23.1% 19.8% 18.0% 8.8%
Grade 8 39.6% 19.8% 18.8% 14.6% 7.3%
Grade 9 26.9% 25.0% 21.2% 20.2% 6.7%
Grade 12 24.3% 24.3% 18.9% 18.9% 13.5%
Table A-11: During the past twelve months, how many times have you...
None 1-3 Times 4-9 Times 10+ Times
Had difficulties of any kind with your friends because of your drinking?
All 90.4% 8.2% 0.7% 0.7%
Grade 8 88.7% 9.3% 1.0% 1.0%
Grade 9 93.3% 4.8% 1.0% 1.0%
Grade 12 87.9% 12.1% 0.0% 0.0%
Been criticized by someone you were dating because of drinking?
All 92.0% 6.1% 1.5% 0.4%
Grade 8 91.6% 7.4% 0.0% 1.1%
Grade 9 93.3% 6.7% 0.0% 0.0%
Grade 12 90.6% 3.1% 6.3% 0.0%
©Copyright 2010, Texas A&M University
All rights reserved.
Secondary Report-Page 17 of 90
8/7/2019 MATAGORDA COUNTY - Palacios ISD - 2010 Texas School Survey of Drug and Alcohol Use
http://slidepdf.com/reader/full/matagorda-county-palacios-isd-2010-texas-school-survey-of-drug-and-alcohol 18/90
Palacios
SPRING 2010
Table A-12: Thinking of parties you attended this school year, how often wasalcohol used?
Never Seldom
Half
the Time
Most
of the Time Always Don't know
Didn't
attend
All 33.8% 12.8% 8.3% 11.7% 18.5% 1.7% 13.2%
Grade 8 35.4% 14.1% 11.1% 14.1% 11.1% 4.0% 10.1%
Grade 9 26.7% 16.2% 7.6% 15.2% 23.8% 1.0% 9.5%Grade 12 42.9% 5.7% 5.7% 2.9% 20.0% 0.0% 22.9%
Table A-13: How often, if ever, do you get alcoholic beverages from..
Do Not Drink Never Seldom
Most of
the Time Always
At home?
All 45.4% 27.7% 22.7% 2.9% 1.4%
Grade 8 49.5% 23.7% 17.5% 5.2% 4.1%
Grade 9 36.9% 29.1% 31.1% 2.9% 0.0%
Grade 12 52.8% 30.6% 16.7% 0.0% 0.0%
From friends?
All 40.7% 12.1% 21.1% 15.9% 10.3%
Grade 8 45.4% 16.5% 14.4% 10.3% 13.4%
Grade 9 36.0% 9.0% 26.0% 24.0% 5.0%
Grade 12 41.7% 11.1% 22.2% 11.1% 13.9%
From a store?
All 41.7% 47.5% 4.5% 4.1% 2.2%
Grade 8 45.9% 48.0% 2.0% 2.0% 2.0%
Grade 9 36.3% 51.0% 7.8% 2.9% 2.0%
Grade 12 44.4% 41.7% 2.8% 8.3% 2.8%
At parties?
All 37.4% 11.1% 17.9% 13.3% 20.4%Grade 8 41.7% 7.3% 18.8% 11.5% 20.8%
Grade 9 33.0% 14.2% 17.9% 17.9% 17.0%
Grade 12 38.9% 11.1% 16.7% 8.3% 25.0%
Other source?
All 42.5% 21.9% 15.4% 8.9% 11.4%
Grade 8 46.9% 16.3% 18.4% 8.2% 10.2%
Grade 9 39.2% 22.5% 17.6% 13.7% 6.9%
Grade 12 41.7% 27.8% 8.3% 2.8% 19.4%
©Copyright 2010, Texas A&M University
All rights reserved.
Secondary Report-Page 18 of 90
8/7/2019 MATAGORDA COUNTY - Palacios ISD - 2010 Texas School Survey of Drug and Alcohol Use
http://slidepdf.com/reader/full/matagorda-county-palacios-isd-2010-texas-school-survey-of-drug-and-alcohol 19/90
Palacios
SPRING 2010
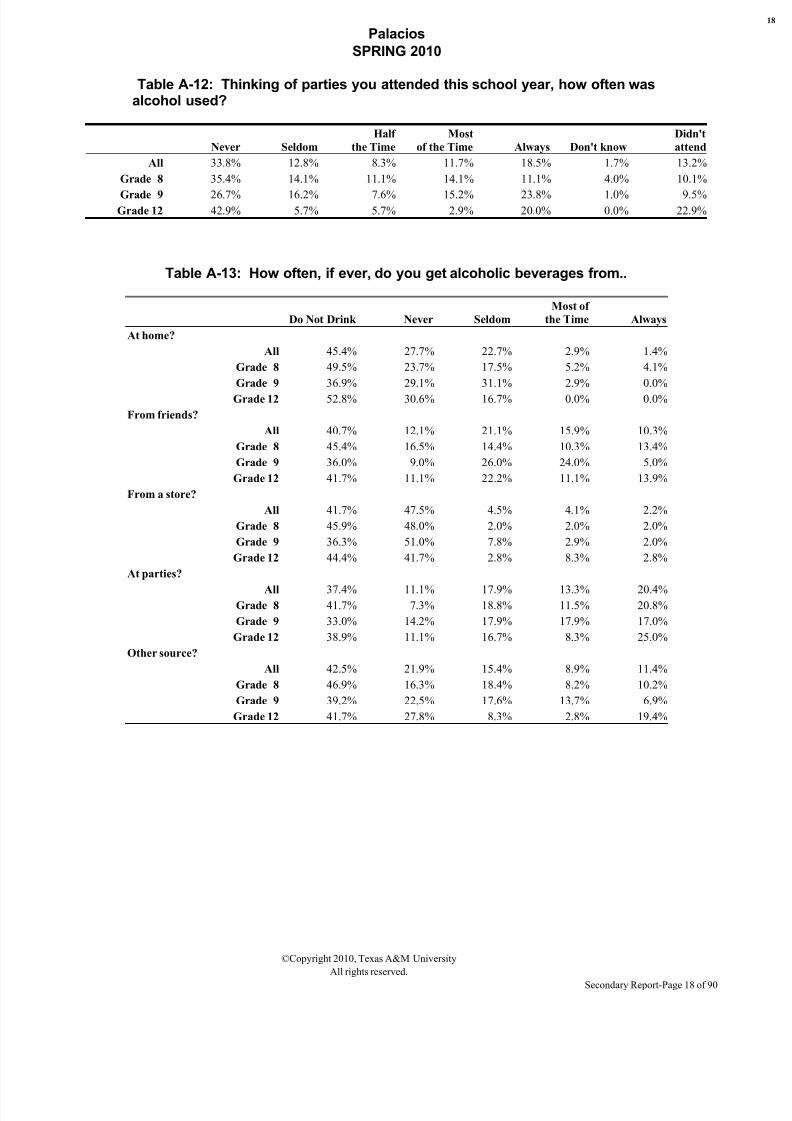
Table A-14: How do your parents feel about kids your age drinking alcohol?
Strongly
Disapprove
Mildly
Disapprove Neither
Mildly
Approve
Strongly
Approve Don't know
All 63.0% 18.1% 8.2% 2.9% 0.4% 7.3%
Grade 8 63.5% 12.5% 7.3% 4.2% 0.0% 12.5%
Grade 9 61.5% 21.2% 6.7% 1.9% 1.0% 7.7%
Grade 12 64.7% 20.6% 11.8% 2.9% 0.0% 0.0%
Table A-15: How dangerous do you think it is for kids your age to use alcohol?
Very
Dangerous
Somewhat
Dangerous
Not very
Dangerous
Not at All
Dangerous Do Not Know
All 38.7% 28.1% 24.3% 5.2% 3.8%
Grade 8 35.4% 27.1% 26.0% 8.3% 3.1%
Grade 9 37.4% 29.3% 22.2% 6.1% 5.1%
Grade 12 44.4% 27.8% 25.0% 0.0% 2.8%
©Copyright 2010, Texas A&M University
All rights reserved.
Secondary Report-Page 19 of 90
8/7/2019 MATAGORDA COUNTY - Palacios ISD - 2010 Texas School Survey of Drug and Alcohol Use
http://slidepdf.com/reader/full/matagorda-county-palacios-isd-2010-texas-school-survey-of-drug-and-alcohol 20/90
Palacios
SPRING 2010
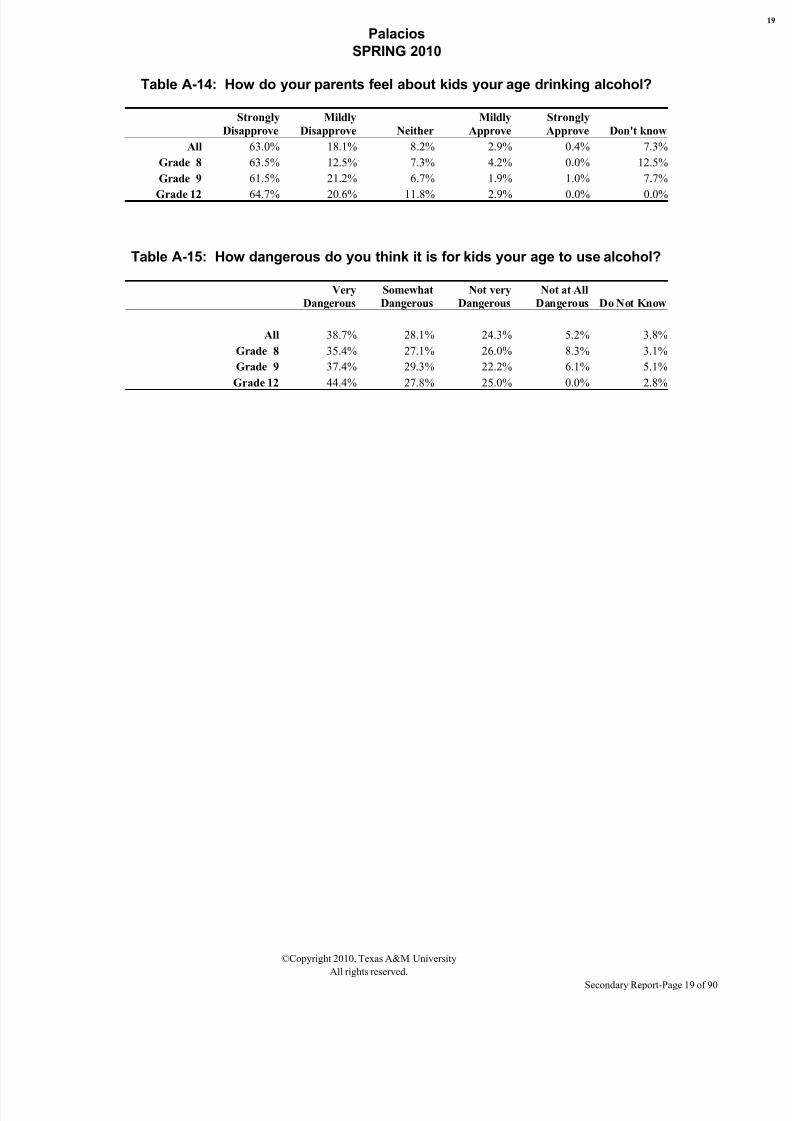
Table D-1: How recently, if ever, have you used...
Past
Month
School
Year
Ever
Used
Never
Used
Marijuana?
All 5.8% 10.9% 19.4% 80.6%
Grade 8 5.0% 10.0% 13.0% 87.0%
Grade 9 6.9% 9.8% 21.6% 78.4%Grade 12 5.4% 13.5% 24.3% 75.7%
Cocaine?
All 0.3% 0.3% 1.4% 98.6%
Grade 8 1.0% 1.3% 2.3% 97.7%
Grade 9 0.0% 1.3% 1.3% 98.7%
Grade 12 0.0% 1.3% 4.0% 96.0%
Crack?
All 0.0% 0.0% 0.3% 99.7%
Grade 8 0.0% 0.0% 1.0% 99.0%
Grade 9 0.0% 0.0% 0.0% 100.0%
Grade 12 0.0% 0.0% 0.0% 100.0%
Hallucinogens?
All 0.0% 0.7% 1.9% 98.1%
Grade 8 0.0% 1.0% 2.1% 97.9%
Grade 9 0.0% 1.0% 3.0% 97.0%
Grade 12 0.0% 0.0% 0.0% 100.0%
Uppers?
All 0.0% 0.0% 0.4% 99.6%
Grade 8 0.0% 0.0% 1.1% 98.9%
Grade 9 0.0% 0.0% 0.0% 100.0%
Grade 12 0.0% 0.0% 0.0% 100.0%
Downers?
All 1.1% 1.9% 2.2% 97.8%
Grade 8 2.1% 2.1% 3.1% 96.9%
Grade 9 1.0% 3.1% 3.1% 96.9%Grade 12 0.0% 0.0% 0.0% 100.0%
Rohypnol?
All 0.0% 0.7% 1.5% 98.5%
Grade 8 0.0% 1.0% 1.0% 99.0%
Grade 9 0.0% 1.0% 3.1% 96.9%
Grade 12 0.0% 0.0% 0.0% 100.0%
Steroids?
All 1.1% 1.1% 1.1% 98.9%
Grade 8 0.0% 1.1% 2.3% 97.7%
Grade 9 1.0% 2.1% 4.4% 95.6%
Grade 12 2.8% 4.9% 9.4% 90.6%
Ecstasy?All 1.1% 1.8% 2.6% 97.4%
Grade 8 0.0% 2.0% 2.0% 98.0%
Grade 9 1.0% 1.0% 3.0% 97.0%
Grade 12 2.8% 2.8% 2.8% 97.2%
©Copyright 2010, Texas A&M University
All rights reserved.
Secondary Report-Page 20 of 90
8/7/2019 MATAGORDA COUNTY - Palacios ISD - 2010 Texas School Survey of Drug and Alcohol Use
http://slidepdf.com/reader/full/matagorda-county-palacios-isd-2010-texas-school-survey-of-drug-and-alcohol 21/90
Palacios
SPRING 2010
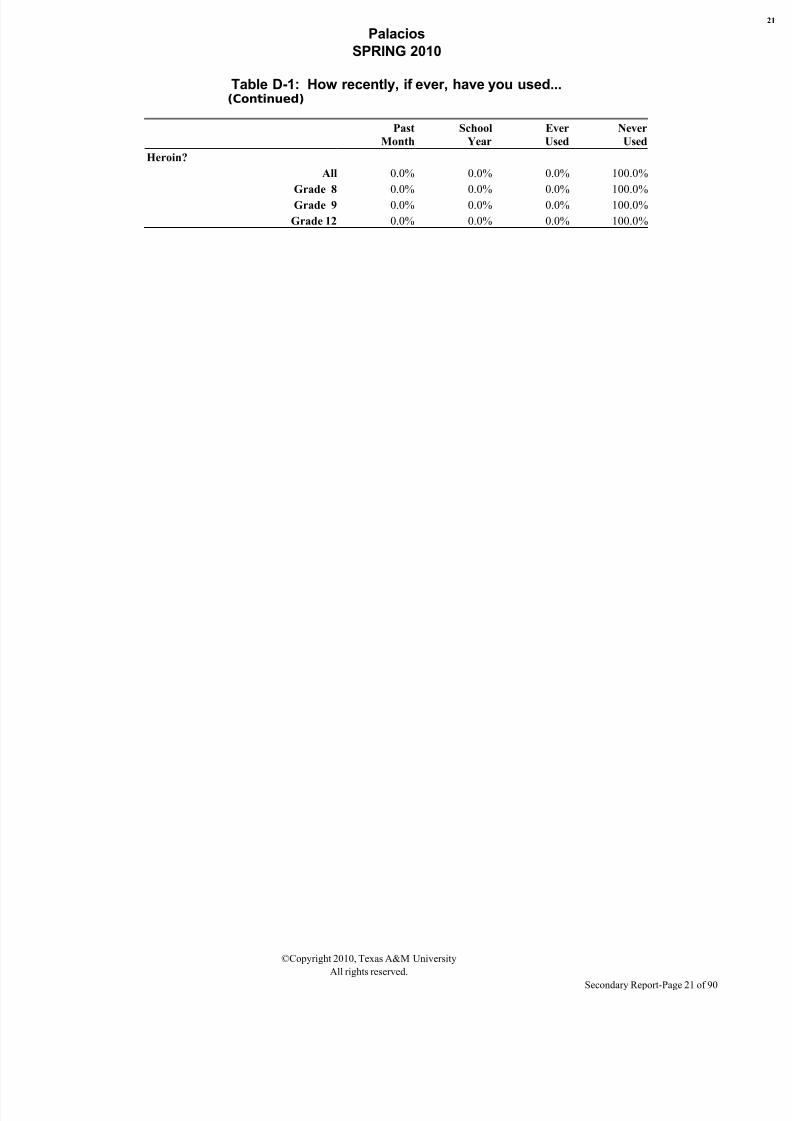
Table D-1: How recently, if ever, have you used...(Continued)
Past
Month
School
Year
Ever
Used
Never
Used
Heroin?
All 0.0% 0.0% 0.0% 100.0%
Grade 8 0.0% 0.0% 0.0% 100.0%
Grade 9 0.0% 0.0% 0.0% 100.0%
Grade 12 0.0% 0.0% 0.0% 100.0%
©Copyright 2010, Texas A&M University
All rights reserved.
Secondary Report-Page 21 of 90

8/7/2019 MATAGORDA COUNTY - Palacios ISD - 2010 Texas School Survey of Drug and Alcohol Use
http://slidepdf.com/reader/full/matagorda-county-palacios-isd-2010-texas-school-survey-of-drug-and-alcohol 22/90
Palacios
SPRING 2010
Table D-2: How often do you normally use...
Never
Used
Every
Day
Several
Times a
Week
Several
Times a
Month
About
Once a
Month
About
Once a
Year
Less than
Once a
Year
Marijuana?
All 82.4% 1.4% 1.5% 3.1% 5.6% 3.0% 2.9%
Grade 8 84.4% 4.2% 0.0% 1.0% 4.2% 2.1% 4.2%Grade 9 80.2% 0.0% 2.0% 5.0% 6.9% 4.0% 2.0%
Grade 12 83.3% 0.0% 2.8% 2.8% 5.6% 2.8% 2.8%
Cocaine?
All 98.9% 0.0% 0.0% 0.4% 0.0% 0.0% 0.7%
Grade 8 96.8% 0.0% 0.0% 1.1% 0.0% 0.0% 2.1%
Grade 9 100.0% 0.0% 0.0% 0.0% 0.0% 0.0% 0.0%
Grade 12 100.0% 0.0% 0.0% 0.0% 0.0% 0.0% 0.0%
Crack?
All 100.0% 0.0% 0.0% 0.0% 0.0% 0.0% 0.0%
Grade 8 100.0% 0.0% 0.0% 0.0% 0.0% 0.0% 0.0%
Grade 9 100.0% 0.0% 0.0% 0.0% 0.0% 0.0% 0.0%
Grade 12 100.0% 0.0% 0.0% 0.0% 0.0% 0.0% 0.0%
Hallucinogens?
All 99.2% 0.0% 0.4% 0.0% 0.0% 0.4% 0.0%
Grade 8 100.0% 0.0% 0.0% 0.0% 0.0% 0.0% 0.0%
Grade 9 97.9% 0.0% 1.0% 0.0% 0.0% 1.0% 0.0%
Grade 12 100.0% 0.0% 0.0% 0.0% 0.0% 0.0% 0.0%
Uppers?
All 98.0% 0.0% 0.0% 0.8% 0.4% 0.0% 0.8%
Grade 8 97.8% 0.0% 0.0% 1.1% 1.1% 0.0% 0.0%
Grade 9 96.9% 0.0% 0.0% 1.0% 0.0% 0.0% 2.1%
Grade 12 100.0% 0.0% 0.0% 0.0% 0.0% 0.0% 0.0%
Downers?
All 96.6% 0.0% 0.0% 0.7% 1.1% 0.4% 1.2%
Grade 8 96.9% 0.0% 0.0% 1.0% 2.0% 0.0% 0.0%Grade 9 94.1% 0.0% 0.0% 1.0% 1.0% 1.0% 3.0%
Grade 12 100.0% 0.0% 0.0% 0.0% 0.0% 0.0% 0.0%
Rohypnol?
All 98.9% 0.0% 0.4% 0.0% 0.3% 0.0% 0.4%
Grade 8 99.0% 0.0% 0.0% 0.0% 1.0% 0.0% 0.0%
Grade 9 98.0% 0.0% 1.0% 0.0% 0.0% 0.0% 1.0%
Grade 12 100.0% 0.0% 0.0% 0.0% 0.0% 0.0% 0.0%
Steroids?
All 99.6% 0.0% 0.0% 0.0% 0.0% 0.0% 0.4%
Grade 8 99.0% 0.0% 0.0% 0.0% 0.0% 0.0% 1.0%
Grade 9 100.0% 0.0% 0.0% 0.0% 0.0% 0.0% 0.0%
Grade 12 100.0% 0.0% 0.0% 0.0% 0.0% 0.0% 0.0%
Ecstasy?
All 97.4% 0.0% 0.0% 0.4% 0.7% 1.1% 0.4%
Grade 8 98.0% 0.0% 0.0% 0.0% 0.0% 2.0% 0.0%
Grade 9 97.1% 0.0% 0.0% 1.0% 0.0% 1.0% 1.0%
Grade 12 97.2% 0.0% 0.0% 0.0% 2.8% 0.0% 0.0%
©Copyright 2010, Texas A&M University
All rights reserved.
Secondary Report-Page 22 of 90

8/7/2019 MATAGORDA COUNTY - Palacios ISD - 2010 Texas School Survey of Drug and Alcohol Use
http://slidepdf.com/reader/full/matagorda-county-palacios-isd-2010-texas-school-survey-of-drug-and-alcohol 23/90
Palacios
SPRING 2010
Table D-2: How often do you normally use...(Continued)
Never
Used
Every
Day
Several
Times a
Week
Several
Times a
Month
About
Once a
Month
About
Once a
Year
Less than
Once a
Year
Heroin?
All 99.7% 0.0% 0.0% 0.0% 0.3% 0.0% 0.0%
Grade 8 99.0% 0.0% 0.0% 0.0% 1.0% 0.0% 0.0%
Grade 9 100.0% 0.0% 0.0% 0.0% 0.0% 0.0% 0.0%
Grade 12 100.0% 0.0% 0.0% 0.0% 0.0% 0.0% 0.0%
©Copyright 2010, Texas A&M University
All rights reserved.
Secondary Report-Page 23 of 90

8/7/2019 MATAGORDA COUNTY - Palacios ISD - 2010 Texas School Survey of Drug and Alcohol Use
http://slidepdf.com/reader/full/matagorda-county-palacios-isd-2010-texas-school-survey-of-drug-and-alcohol 24/90
Palacios
SPRING 2010
Table D-3: Average age of first use of:
Grade 8 Grade 9 Grade 12
Marijuana
11.5 12.5 15.0
Cocaine
* * *
Crack
* * *
Hallucinogens
* * *
Uppers
* * *
Downers
* 13.0 *
Rohypnol
* * *
Steroids
* * *
Ecstasy* * *
Heroin
* * *
Table D-4: Age of first use of marijuana by family situation:
Never 9/Under 10 to 11 12 to 13 14 to 15 16 to 17 Over 17
Two parent family
All 85.0% 1.1% 2.0% 3.8% 4.9% 2.2% 1.1%
Grade 8 89.6% 1.5% 4.5% 3.0% 1.5% 0.0% 0.0%
Grade 9 86.6% 1.5% 1.5% 4.5% 6.0% 0.0% 0.0%
Grade 12 77.8% 0.0% 0.0% 3.7% 7.4% 7.4% 3.7%
Other family situation
All 65.7% 8.0% 3.9% 9.0% 10.8% 0.0% 2.7%
Grade 8 68.0% 8.0% 4.0% 16.0% 4.0% 0.0% 0.0%
Grade 9 63.6% 12.1% 0.0% 9.1% 15.2% 0.0% 0.0%
Grade 12 66.7% 0.0% 11.1% 0.0% 11.1% 0.0% 11.1%
©Copyright 2010, Texas A&M University
All rights reserved.
Secondary Report-Page 24 of 90

8/7/2019 MATAGORDA COUNTY - Palacios ISD - 2010 Texas School Survey of Drug and Alcohol Use
http://slidepdf.com/reader/full/matagorda-county-palacios-isd-2010-texas-school-survey-of-drug-and-alcohol 25/90
Palacios
SPRING 2010
Table D-5: If you wanted some, how difficult would it be to get..
Never
Heard Of Impossible
Very
Difficult
Somewhat
Difficult
Somewhat
Easy Very Easy
Marijuana?
All 20.3% 31.2% 9.5% 9.9% 8.0% 21.1%
Grade 8 17.5% 37.1% 9.3% 9.3% 8.2% 18.6%
Grade 9 20.6% 35.1% 8.2% 9.3% 7.2% 19.6%Grade 12 23.5% 17.6% 11.8% 11.8% 8.8% 26.5%
Cocaine?
All 29.1% 40.2% 11.8% 7.7% 2.9% 8.4%
Grade 8 27.1% 39.6% 11.5% 7.3% 7.3% 7.3%
Grade 9 32.7% 45.9% 8.2% 9.2% 1.0% 3.1%
Grade 12 26.5% 32.4% 17.6% 5.9% 0.0% 17.6%
Crack?
All 29.0% 39.2% 12.9% 8.3% 1.8% 8.7%
Grade 8 26.0% 39.6% 11.5% 10.4% 5.2% 7.3%
Grade 9 33.3% 45.5% 9.1% 8.1% 0.0% 4.0%
Grade 12 26.5% 29.4% 20.6% 5.9% 0.0% 17.6%
Hallucinogens?
All 42.3% 30.5% 12.3% 5.8% 3.8% 5.3%
Grade 8 46.5% 26.3% 15.2% 4.0% 4.0% 4.0%
Grade 9 46.3% 35.8% 4.2% 7.4% 2.1% 4.2%
Grade 12 31.4% 28.6% 20.0% 5.7% 5.7% 8.6%
Uppers?
All 54.2% 25.2% 6.1% 6.0% 2.7% 5.8%
Grade 8 58.3% 25.0% 8.3% 1.0% 3.1% 4.2%
Grade 9 63.0% 22.8% 2.2% 6.5% 2.2% 3.3%
Grade 12 37.1% 28.6% 8.6% 11.4% 2.9% 11.4%
Downers?
All 53.5% 24.3% 8.1% 5.6% 1.9% 6.7%
Grade 8 58.7% 22.8% 8.7% 2.2% 3.3% 4.3%
Grade 9 62.8% 24.5% 3.2% 4.3% 0.0% 5.3%Grade 12 34.3% 25.7% 14.3% 11.4% 2.9% 11.4%
Rohypnol?
All 50.3% 29.4% 6.9% 4.6% 3.0% 5.7%
Grade 8 56.4% 28.7% 6.4% 2.1% 2.1% 4.3%
Grade 9 55.2% 31.3% 6.3% 4.2% 0.0% 3.1%
Grade 12 36.1% 27.8% 8.3% 8.3% 8.3% 11.1%
Steroids?
All 29.6% 44.9% 10.7% 6.1% 3.8% 5.0%
Grade 8 28.3% 44.6% 9.8% 7.6% 6.5% 3.3%
Grade 9 32.0% 51.5% 5.2% 5.2% 4.1% 2.1%
Grade 12 27.8% 36.1% 19.4% 5.6% 0.0% 11.1%
Ecstasy?All 35.8% 35.4% 6.1% 10.0% 5.0% 7.8%
Grade 8 37.9% 34.7% 7.4% 10.5% 5.3% 4.2%
Grade 9 39.8% 37.6% 3.2% 8.6% 6.5% 4.3%
Grade 12 27.8% 33.3% 8.3% 11.1% 2.8% 16.7%
©Copyright 2010, Texas A&M University
All rights reserved.
Secondary Report-Page 25 of 90

8/7/2019 MATAGORDA COUNTY - Palacios ISD - 2010 Texas School Survey of Drug and Alcohol Use
http://slidepdf.com/reader/full/matagorda-county-palacios-isd-2010-texas-school-survey-of-drug-and-alcohol 26/90
Palacios
SPRING 2010
Table D-5: If you wanted some, how difficult would it be to get..Continue
d
Never
Heard Of Impossible
Very
Difficult
Somewhat
Difficult
Somewhat
Easy Very Easy
Heroin?
All 36.0% 37.3% 10.7% 5.5% 5.3% 5.3%
Grade 8 33.0% 37.1% 13.4% 3.1% 7.2% 6.2%
Grade 9 44.1% 37.6% 9.7% 5.4% 3.2% 0.0%
Grade 12 28.6% 37.1% 8.6% 8.6% 5.7% 11.4%
©Copyright 2010, Texas A&M University
All rights reserved.
Secondary Report-Page 26 of 90

8/7/2019 MATAGORDA COUNTY - Palacios ISD - 2010 Texas School Survey of Drug and Alcohol Use
http://slidepdf.com/reader/full/matagorda-county-palacios-isd-2010-texas-school-survey-of-drug-and-alcohol 27/90
Palacios
SPRING 2010
Table D-6: Since school began in the fall, on how many days (if any) have you..
None 1-3 Times 4-9 Times 10+ Times
Attended class while high from marijuana use?
All 93.9% 3.2% 2.2% 0.7%
Grade 8 92.0% 4.0% 2.0% 2.0%
Grade 9 93.3% 4.8% 1.9% 0.0%
Grade 12 97.2% 0.0% 2.8% 0.0%
Attended class while high from use of some other drug?
All 93.8% 4.4% 0.7% 1.1%
Grade 8 93.0% 4.0% 1.0% 2.0%
Grade 9 90.5% 7.6% 1.0% 1.0%
Grade 12 100.0% 0.0% 0.0% 0.0%
Gotten into trouble with teachers because of your drug use?
All 98.1% 1.2% 0.0% 0.7%
Grade 8 98.9% 0.0% 0.0% 1.1%
Grade 9 96.0% 3.0% 0.0% 1.0%
Grade 12 100.0% 0.0% 0.0% 0.0%
Table D-7: School year use of marijuana by absences and conduct problems:
Average days absent due to
illness or other reasons
Marijuana Users: 4.2
Marijuana Non-use 3.0
Average days conduct problems
reported
Marijuana Users: 3.5
Marijuana Non-use 1.2
Table D-8: During the past twelve months, how many times have you..
None 1-3 Times 4-9 Times 10+ Times
Driven a car when you've felt high from drugs?
All 95.8% 1.8% 1.2% 1.2%
Grade 9 97.0% 1.0% 2.0% 0.0%
Grade 12 93.9% 3.0% 0.0% 3.0%
Gotten into trouble with the police because of drug use?
All 98.1% 1.6% 0.4% 0.0%
Grade 8 97.8% 1.1% 1.1% 0.0%
Grade 9 99.0% 1.0% 0.0% 0.0%
Grade 12 97.1% 2.9% 0.0% 0.0%
©Copyright 2010, Texas A&M University
All rights reserved.
Secondary Report-Page 27 of 90
8/7/2019 MATAGORDA COUNTY - Palacios ISD - 2010 Texas School Survey of Drug and Alcohol Use
http://slidepdf.com/reader/full/matagorda-county-palacios-isd-2010-texas-school-survey-of-drug-and-alcohol 28/90
Palacios
SPRING 2010
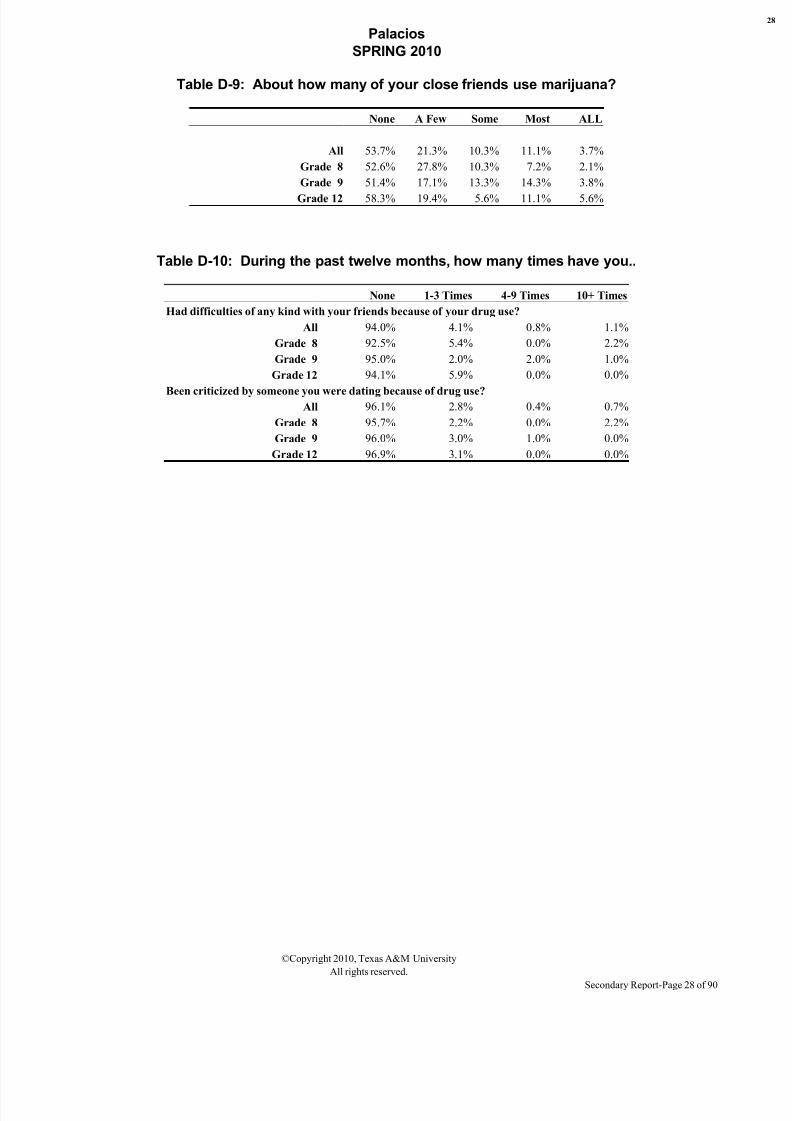
Table D-9: About how many of your close friends use marijuana?
None A Few Some Most ALL
All 53.7% 21.3% 10.3% 11.1% 3.7%
Grade 8 52.6% 27.8% 10.3% 7.2% 2.1%
Grade 9 51.4% 17.1% 13.3% 14.3% 3.8%
Grade 12 58.3% 19.4% 5.6% 11.1% 5.6%
Table D-10: During the past twelve months, how many times have you..
None 1-3 Times 4-9 Times 10+ Times
Had difficulties of any kind with your friends because of your drug use?
All 94.0% 4.1% 0.8% 1.1%
Grade 8 92.5% 5.4% 0.0% 2.2%
Grade 9 95.0% 2.0% 2.0% 1.0%
Grade 12 94.1% 5.9% 0.0% 0.0%
Been criticized by someone you were dating because of drug use?All 96.1% 2.8% 0.4% 0.7%
Grade 8 95.7% 2.2% 0.0% 2.2%
Grade 9 96.0% 3.0% 1.0% 0.0%
Grade 12 96.9% 3.1% 0.0% 0.0%
©Copyright 2010, Texas A&M University
All rights reserved.
Secondary Report-Page 28 of 90

8/7/2019 MATAGORDA COUNTY - Palacios ISD - 2010 Texas School Survey of Drug and Alcohol Use
http://slidepdf.com/reader/full/matagorda-county-palacios-isd-2010-texas-school-survey-of-drug-and-alcohol 29/90
Palacios
SPRING 2010
Table D-11: Thinking of parties you attended this school year, how often weremarijuana and/or other drugs used?
Never Seldom
Half
the Time
Most
of the Time Always Don't know
Didn't
attend
All 57.7% 12.8% 5.6% 4.0% 4.7% 1.7% 13.5%
Grade 8 61.6% 10.1% 3.0% 5.1% 5.1% 4.0% 11.1%
Grade 9 58.5% 16.0% 7.5% 3.8% 3.8% 0.9% 9.4%Grade 12 51.4% 11.4% 5.7% 2.9% 5.7% 0.0% 22.9%
Table D-12: How often, if ever, do you smoke marijuana in..
CATEGORY Never Seldom
Half
the Time
Most of
the Time Always Don't know
Joints? All 83.2% 4.1% 4.8% 4.0% 3.6% 0.3%
Grade 8 86.7% 2.0% 3.1% 4.1% 3.1% 1.0%
Grade 9 82.1% 4.7% 5.7% 4.7% 2.8% 0.0%
Grade 12 80.6% 5.6% 5.6% 2.8% 5.6% 0.0%
Blunts? All 82.4% 4.1% 5.5% 3.3% 3.3% 1.4%
Grade 8 84.7% 2.0% 5.1% 2.0% 4.1% 2.0%
Grade 9 83.7% 2.9% 5.8% 4.8% 2.9% 0.0%
Grade 12 77.8% 8.3% 5.6% 2.8% 2.8% 2.8%
Bongs or water pipes? All 89.1% 5.3% 1.9% 1.9% 1.1% 0.7%
Grade 8 94.8% 1.0% 1.0% 0.0% 1.0% 2.1%
Grade 9 86.4% 8.7% 1.9% 1.0% 1.9% 0.0%
Grade 12 86.1% 5.6% 2.8% 5.6% 0.0% 0.0%
Pipes? All 87.6% 5.2% 2.2% 1.5% 2.2% 1.4%
Grade 8 91.8% 1.0% 1.0% 1.0% 3.1% 2.0%
Grade 9 88.7% 4.7% 2.8% 0.9% 2.8% 0.0%
Grade 12 80.6% 11.1% 2.8% 2.8% 0.0% 2.8%
Some other way? All 89.9% 3.6% 1.8% 0.0% 1.8% 2.9%Grade 8 88.8% 4.1% 2.0% 0.0% 2.0% 3.1%
Grade 9 91.4% 1.9% 2.9% 0.0% 2.9% 1.0%
Grade 12 88.9% 5.6% 0.0% 0.0% 0.0% 5.6%
©Copyright 2010, Texas A&M University
All rights reserved.
Secondary Report-Page 29 of 90

8/7/2019 MATAGORDA COUNTY - Palacios ISD - 2010 Texas School Survey of Drug and Alcohol Use
http://slidepdf.com/reader/full/matagorda-county-palacios-isd-2010-texas-school-survey-of-drug-and-alcohol 30/90
Palacios
SPRING 2010
Table D-13: How do your parents feel about kids your age using marijuana?
Strongly
Disapprove
Mildly
Disapprove Neither
Mildly
Approve
Strongly
Approve Don't know
All 87.7% 1.2% 1.5% 0.7% 0.7% 8.1%
Grade 8 83.3% 0.0% 2.1% 1.0% 1.0% 12.5%
Grade 9 85.7% 2.9% 1.9% 1.0% 1.0% 7.6%
Grade 12 97.0% 0.0% 0.0% 0.0% 0.0% 3.0%
Table D-14: How dangerous do you think it is for kids your age to use...
Very
Dangerous
Somewhat
Dangerous
Not very
Dangerous
Not at All
Dangerous Do Not Know
Marijuana?
All 66.8% 11.4% 9.6% 7.0% 5.2%
Grade 8 68.1% 16.0% 9.6% 5.3% 1.1%
Grade 9 69.1% 11.3% 6.2% 7.2% 6.2%
Grade 12 61.8% 5.9% 14.7% 8.8% 8.8%
Cocaine?
All 83.3% 7.6% 2.7% 0.4% 6.0%
Grade 8 86.0% 5.4% 4.3% 1.1% 3.2%
Grade 9 80.2% 10.4% 1.0% 0.0% 8.3%
Grade 12 84.4% 6.3% 3.1% 0.0% 6.3%
Crack?
All 85.1% 6.1% 1.9% 0.4% 6.4%
Grade 8 88.5% 2.3% 3.4% 1.1% 4.6%
Grade 9 82.7% 9.2% 0.0% 0.0% 8.2%
Grade 12 84.8% 6.1% 3.0% 0.0% 6.1%
Ecstasy?
All 79.2% 7.7% 3.1% 1.2% 8.8%
Grade 8 80.0% 5.6% 5.6% 1.1% 7.8%Grade 9 74.7% 10.5% 1.1% 2.1% 11.6%
Grade 12 84.8% 6.1% 3.0% 0.0% 6.1%
Steroids?
All 77.7% 12.1% 2.7% 0.0% 7.5%
Grade 8 79.1% 11.0% 4.4% 0.0% 5.5%
Grade 9 73.5% 13.3% 3.1% 0.0% 10.2%
Grade 12 82.4% 11.8% 0.0% 0.0% 5.9%
Heroin?
All 85.4% 5.6% 1.5% 0.0% 7.5%
Grade 8 86.7% 4.4% 2.2% 0.0% 6.7%
Grade 9 82.5% 8.2% 0.0% 0.0% 9.3%
Grade 12 88.2% 2.9% 2.9% 0.0% 5.9%
©Copyright 2010, Texas A&M University
All rights reserved.
Secondary Report-Page 30 of 90

8/7/2019 MATAGORDA COUNTY - Palacios ISD - 2010 Texas School Survey of Drug and Alcohol Use
http://slidepdf.com/reader/full/matagorda-county-palacios-isd-2010-texas-school-survey-of-drug-and-alcohol 31/90
Palacios
SPRING 2010
Table D-15: How recently, if ever, have you taken...
Past
Month
School
Year
Ever
Used
Never
Used
Methamphetamine?
All 0.0% 0.0% 0.4% 99.6%
Grade 8 0.0% 0.0% 0.0% 100.0%
Grade 9 0.0% 0.0% 1.0% 99.0%Grade 12 0.0% 0.0% 0.0% 100.0%
Table D-16: How recently, if ever, have you taken the following PRESCRIPTION DRUGS...
Past
Month
School
Year
Ever
Used
Never
Used
Codeine?
All 5.6% 9.8% 13.4% 86.6%
Grade 8 4.1% 6.1% 10.2% 89.8%
Grade 9 8.7% 13.6% 17.5% 82.5%
Grade 12 2.9% 8.6% 11.4% 88.6%
Oxycontin, Percodan or Percocet?
All 0.0% 0.0% 1.1% 98.9%
Grade 8 0.0% 0.0% 1.1% 98.9%
Grade 9 0.0% 0.0% 2.0% 98.0%
Grade 12 0.0% 0.0% 0.0% 100.0%
Vicodin, Lortab or Lorcet?
All 1.2% 1.6% 4.7% 95.3%
Grade 8 0.0% 0.0% 2.2% 97.8%
Grade 9 3.0% 4.0% 6.0% 94.0%
Grade 12 0.0% 0.0% 5.7% 94.3%
Valium or Diazepam?
All 0.4% 0.4% 1.2% 98.8%Grade 8 0.0% 0.4% 1.5% 98.5%
Grade 9 1.0% 1.0% 2.0% 98.0%
Grade 12 0.0% 1.0% 1.0% 99.0%
Xanax or Alprazolam?
All 1.1% 1.9% 3.5% 96.5%
Grade 8 1.1% 2.1% 2.1% 97.9%
Grade 9 2.0% 2.9% 4.9% 95.1%
Grade 12 0.0% 0.0% 2.9% 97.1%
Table D-17: How recently, if ever, have you taken the following OVER-THE COUNTER drugs...
Past
Month
School
Year
Ever
Used
Never
Used
DXM, Triple C?
All 1.5% 2.2% 4.1% 95.9%
Grade 8 2.1% 2.1% 4.2% 95.8%
Grade 9 1.9% 3.9% 6.8% 93.2%
Grade 12 0.0% 0.0% 0.0% 100.0%
©Copyright 2010, Texas A&M University
All rights reserved.
Secondary Report-Page 31 of 90

8/7/2019 MATAGORDA COUNTY - Palacios ISD - 2010 Texas School Survey of Drug and Alcohol Use
http://slidepdf.com/reader/full/matagorda-county-palacios-isd-2010-texas-school-survey-of-drug-and-alcohol 32/90
Palacios
SPRING 2010
©Copyright 2010, Texas A&M University
All rights reserved.
Secondary Report-Page 32 of 90

8/7/2019 MATAGORDA COUNTY - Palacios ISD - 2010 Texas School Survey of Drug and Alcohol Use
http://slidepdf.com/reader/full/matagorda-county-palacios-isd-2010-texas-school-survey-of-drug-and-alcohol 33/90
Palacios
SPRING 2010
Table I-1: How recently, if ever, have you used...
Past
Month
School
Year
Ever
Used
Never
Used
Spray paint?
All 0.3% 0.3% 6.2% 93.8%
Grade 8 1.0% 1.3% 13.5% 86.5%
Grade 9 0.0% 1.3% 6.0% 94.0%Grade 12 0.0% 1.3% 1.3% 98.7%
Whiteout,correction fld?
All 2.1% 4.8% 13.8% 86.2%
Grade 8 5.1% 12.2% 25.5% 74.5%
Grade 9 0.9% 1.9% 13.2% 86.8%
Grade 12 0.0% 0.0% 0.0% 100.0%
Computer dusting sprays?
All 1.8% 2.5% 4.7% 95.3%
Grade 8 3.1% 4.1% 6.2% 93.8%
Grade 9 2.0% 2.9% 4.9% 95.1%
Grade 12 0.0% 0.0% 2.7% 97.3%
Helium,butane,propane,whippets,freon?
All 1.1% 2.5% 6.1% 93.9%
Grade 8 2.1% 5.2% 10.3% 89.7%
Grade 9 1.0% 1.9% 6.7% 93.3%
Grade 12 0.0% 0.0% 0.0% 100.0%
Glue?
All 0.0% 0.3% 3.6% 96.4%
Grade 8 0.0% 1.0% 6.2% 93.8%
Grade 9 0.0% 0.0% 3.8% 96.2%
Grade 12 0.0% 0.0% 0.0% 100.0%
Toluene,paint thinner,other solvents?
All 0.7% 0.7% 3.7% 96.3%
Grade 8 0.0% 0.7% 4.9% 95.1%
Grade 9 0.0% 0.7% 4.7% 95.3%Grade 12 2.7% 3.5% 3.5% 96.5%
Gasoline,octane booster,carburetor cleaner?
All 0.7% 1.4% 4.3% 95.7%
Grade 8 1.0% 2.1% 7.2% 92.8%
Grade 9 1.0% 1.9% 4.8% 95.2%
Grade 12 0.0% 0.0% 0.0% 100.0%
Other aerosols/sprays?
All 0.7% 0.7% 4.8% 95.2%
Grade 8 2.0% 2.7% 10.9% 89.1%
Grade 9 0.0% 2.7% 4.6% 95.4%
Grade 12 0.0% 2.7% 5.4% 94.6%
Any inhalant?All 5.1% 8.2% 21.4% 78.6%
Grade 8 11.0% 18.0% 31.0% 69.0%
Grade 9 1.9% 3.7% 22.4% 77.6%
Grade 12 2.7% 2.7% 8.1% 91.9%
Table I-2: How often do you normally use inhalants?
©Copyright 2010, Texas A&M University
All rights reserved.
Secondary Report-Page 33 of 90

8/7/2019 MATAGORDA COUNTY - Palacios ISD - 2010 Texas School Survey of Drug and Alcohol Use
http://slidepdf.com/reader/full/matagorda-county-palacios-isd-2010-texas-school-survey-of-drug-and-alcohol 34/90
Palacios
SPRING 2010
Never
Used
Every
Day
Several
Times a
Week
Several
Times a
Month
About
Once a
Month
About
Once a
Year
Less than
Once a
Year
All 87.1% 0.0% 0.7% 1.4% 2.9% 3.9% 4.0%
Grade 8 77.6% 0.0% 1.0% 4.1% 5.1% 7.1% 5.1%
Grade 9 88.2% 0.0% 1.0% 0.0% 2.9% 3.9% 3.9%
Grade 12 97.2% 0.0% 0.0% 0.0% 0.0% 0.0% 2.8%
I-3: Number of different kinds of inhalants used
None One Two to Three Four Plus
All 78.6% 9.9% 7.6% 3.8%
Grade 8 69.3% 9.9% 13.9% 6.9%
Grade 9 77.6% 11.2% 7.5% 3.7%
Grade 12 91.9% 8.1% 0.0% 0.0%
©Copyright 2010, Texas A&M University
All rights reserved.
Secondary Report-Page 34 of 90

8/7/2019 MATAGORDA COUNTY - Palacios ISD - 2010 Texas School Survey of Drug and Alcohol Use
http://slidepdf.com/reader/full/matagorda-county-palacios-isd-2010-texas-school-survey-of-drug-and-alcohol 35/90
Palacios
SPRING 2010
Table I-4: Average age of first use of:
Grade 8 Grade 9 Grade 12
Inhalants
11.6 12.8 *
Table I-5: Since school began in the fall, on how many days (if any) have youattended class while high from inhalant use?
None 1-3 Times 4-9 Times 10+ Times
All 96.9% 2.1% 0.3% 0.7%
Grade 8 93.0% 4.0% 1.0% 2.0%
Grade 9 98.1% 1.9% 0.0% 0.0%
Grade 12 100.0% 0.0% 0.0% 0.0%
©Copyright 2010, Texas A&M University
All rights reserved.
Secondary Report-Page 35 of 90

8/7/2019 MATAGORDA COUNTY - Palacios ISD - 2010 Texas School Survey of Drug and Alcohol Use
http://slidepdf.com/reader/full/matagorda-county-palacios-isd-2010-texas-school-survey-of-drug-and-alcohol 36/90
Palacios
SPRING 2010
Table I-6: School year use of inhalants by absences and conduct problems:
Average days absent due to
illness or other reasons
Inhalants Users: 3.4
Inhalants Non-use 3.1
Average days conduct problems
reported
Inhalants Users: 3.7
Inhalants Non-use 1.3
Table I-7: About how many of your close friends use inhalants?
None A Few Some Most ALL
All 75.0% 17.4% 6.1% 0.7% 0.7%
Grade 8 67.3% 22.4% 9.2% 1.0% 0.0%
Grade 9 73.5% 17.6% 7.8% 1.0% 0.0%
Grade 12 86.5% 10.8% 0.0% 0.0% 2.7%
Table I-8: How dangerous do you think it is for kids your age to use inhalants?
Very
Dangerous
Somewhat
Dangerous
Not very
Dangerous
Not at All
Dangerous Do Not Know
All 68.3% 17.4% 8.0% 1.1% 5.1%
Grade 8 60.2% 22.6% 11.8% 2.2% 3.2%Grade 9 67.7% 18.8% 6.3% 1.0% 6.3%
Grade 12 79.4% 8.8% 5.9% 0.0% 5.9%
©Copyright 2010, Texas A&M University
All rights reserved.
Secondary Report-Page 36 of 90
8/7/2019 MATAGORDA COUNTY - Palacios ISD - 2010 Texas School Survey of Drug and Alcohol Use
http://slidepdf.com/reader/full/matagorda-county-palacios-isd-2010-texas-school-survey-of-drug-and-alcohol 37/90
Palacios
SPRING 2010
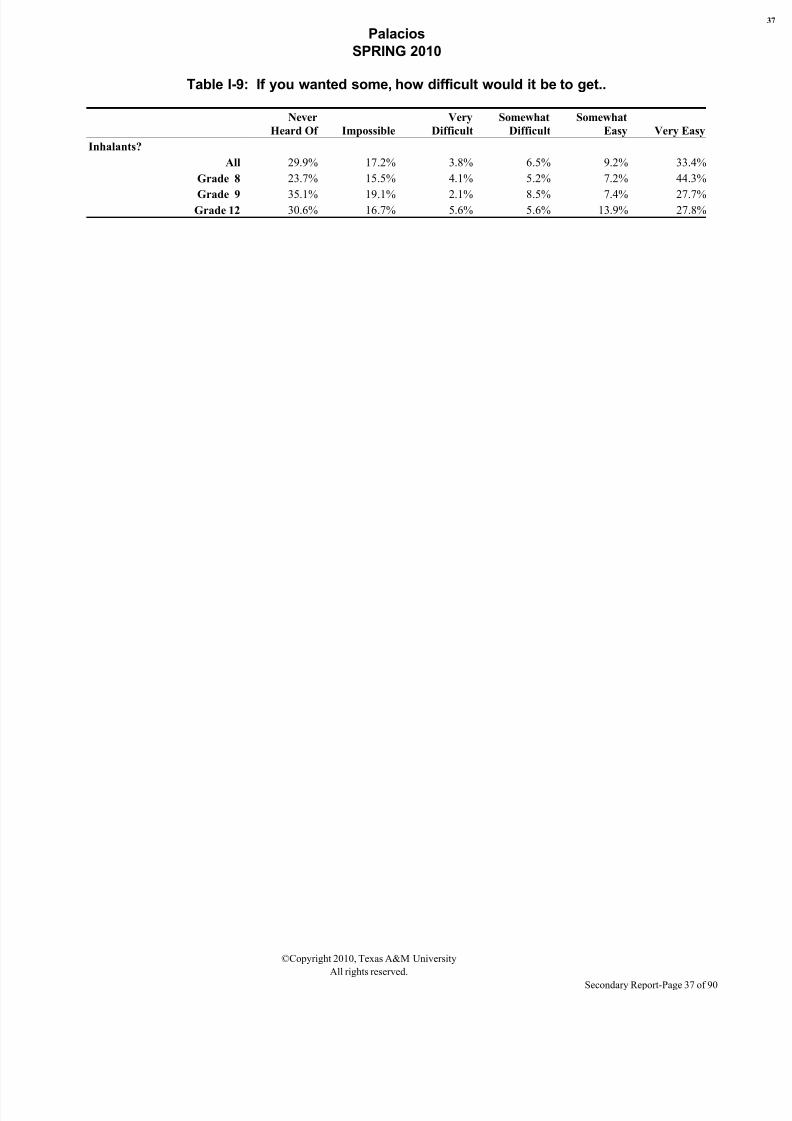
Table I-9: If you wanted some, how difficult would it be to get..
Never
Heard Of Impossible
Very
Difficult
Somewhat
Difficult
Somewhat
Easy Very Easy
Inhalants?
All 29.9% 17.2% 3.8% 6.5% 9.2% 33.4%
Grade 8 23.7% 15.5% 4.1% 5.2% 7.2% 44.3%
Grade 9 35.1% 19.1% 2.1% 8.5% 7.4% 27.7%Grade 12 30.6% 16.7% 5.6% 5.6% 13.9% 27.8%
©Copyright 2010, Texas A&M University
All rights reserved.
Secondary Report-Page 37 of 90

8/7/2019 MATAGORDA COUNTY - Palacios ISD - 2010 Texas School Survey of Drug and Alcohol Use
http://slidepdf.com/reader/full/matagorda-county-palacios-isd-2010-texas-school-survey-of-drug-and-alcohol 38/90
Palacios
SPRING 2010
Table X-1: Since school began in the fall, have you gotten any informationon drugs or alcohol from the following sources?
CATEGORY Yes
A school health class All 48.8%
Grade 8 55.0%
Grade 9 51.6%
Grade 12 36.7%
An assembly program All 66.5%
Grade 8 45.6%
Grade 9 87.1%
Grade 12 58.6%
Guidance counselor All 28.7%
Grade 8 10.4%
Grade 9 34.8%
Grade 12 41.4%
Science class All 21.6%
Grade 8 24.4%
Grade 9 20.0%
Grade 12 20.7%Social studies class All 12.4%
Grade 8 6.5%
Grade 9 9.9%
Grade 12 23.3%
Student group session All 11.8%
Grade 8 6.4%
Grade 9 14.4%
Grade 12 14.3%
An invited school guest All 45.6%
Grade 8 20.5%
Grade 9 79.1%
Grade 12 21.4%
Another source at school All 33.0%
Grade 8 24.1%
Grade 9 41.1%
Grade 12 31.0%
Any school source All 66.7%
Grade 8 59.4%
Grade 9 81.3%
Grade 12 54.1%
©Copyright 2010, Texas A&M University
All rights reserved.
Secondary Report-Page 38 of 90

8/7/2019 MATAGORDA COUNTY - Palacios ISD - 2010 Texas School Survey of Drug and Alcohol Use
http://slidepdf.com/reader/full/matagorda-county-palacios-isd-2010-texas-school-survey-of-drug-and-alcohol 39/90
Palacios
SPRING 2010
Table X-2: If you had a drug or alcohol problem and needed help, who would you go to?
CATEGORY Yes
Counselor/program in-school All 37.3%
Grade 8 31.3%
Grade 9 39.0%
Grade 12 42.4%
Another adult in school All 34.2%
Grade 8 31.3%
Grade 9 35.8%
Grade 12 35.3%
Counselor/program outside-school All 34.1%
Grade 8 34.8%
Grade 9 31.4%
Grade 12 37.5%
Your parents All 58.7%
Grade 8 58.3%
Grade 9 63.5%
Grade 12 51.5%
A medical doctor All 44.8%Grade 8 43.2%
Grade 9 46.6%
Grade 12 44.1%
Your friends All 71.2%
Grade 8 75.8%
Grade 9 79.0%
Grade 12 52.9%
Another adult All 58.3%
Grade 8 59.6%
Grade 9 66.0%
Grade 12 44.1%
Table X-3: Since school began in the fall, have you sought help, other thanfrom family or friends, for problems in any way connected with your use of alcohol, marijuana, or other drugs?
CATEGORY Yes
Seek Help All 7.6%
Grade 8 4.4%
Grade 9 7.1%
Grade 12 12.5%
©Copyright 2010, Texas A&M University
All rights reserved.
Secondary Report-Page 39 of 90

8/7/2019 MATAGORDA COUNTY - Palacios ISD - 2010 Texas School Survey of Drug and Alcohol Use
http://slidepdf.com/reader/full/matagorda-county-palacios-isd-2010-texas-school-survey-of-drug-and-alcohol 40/90
Palacios
SPRING 2010
Table X-4: About how many of your friends:
None A Few Some Most ALL
Feel close to their parents?
All 7.8% 30.7% 28.0% 29.2% 4.3%
Grade 8 10.0% 31.0% 25.0% 30.0% 4.0%
Grade 9 5.7% 33.0% 29.2% 24.5% 7.5%
Grade 12 8.1% 27.0% 29.7% 35.1% 0.0%
Sometimes carry weapons?
All 65.3% 21.5% 8.0% 3.3% 1.8%
Grade 8 69.4% 25.5% 4.1% 1.0% 0.0%
Grade 9 70.1% 19.6% 5.6% 3.7% 0.9%
Grade 12 52.8% 19.4% 16.7% 5.6% 5.6%
Care about making good grades?
All 5.4% 16.2% 22.3% 41.2% 14.8%
Grade 8 5.1% 17.2% 24.2% 38.4% 15.2%
Grade 9 1.9% 17.0% 20.8% 41.5% 18.9%
Grade 12 11.1% 13.9% 22.2% 44.4% 8.3%
Belong/want to belong to a gang?
All 69.1% 19.9% 7.0% 2.1% 1.8%Grade 8 69.8% 21.9% 4.2% 3.1% 1.0%
Grade 9 66.0% 18.9% 12.3% 0.9% 1.9%
Grade 12 73.0% 18.9% 2.7% 2.7% 2.7%
Wish they could drop out of school?
All 56.7% 28.0% 11.3% 2.2% 1.8%
Grade 8 59.4% 25.0% 10.4% 3.1% 2.1%
Grade 9 50.9% 33.0% 12.3% 2.8% 0.9%
Grade 12 62.2% 24.3% 10.8% 0.0% 2.7%
©Copyright 2010, Texas A&M University
All rights reserved.
Secondary Report-Page 40 of 90

8/7/2019 MATAGORDA COUNTY - Palacios ISD - 2010 Texas School Survey of Drug and Alcohol Use
http://slidepdf.com/reader/full/matagorda-county-palacios-isd-2010-texas-school-survey-of-drug-and-alcohol 41/90
Palacios
SPRING 2010
Table X-5: How safe do you feel when you are:
Very Safe
Somewhat
Safe
Not Very
Safe
Not Safe at
All
Don't
Know
In your home?
All 78.8% 18.0% 1.9% 0.3% 1.0%
Grade 8 77.2% 19.8% 0.0% 1.0% 2.0%
Grade 9 80.4% 14.0% 4.7% 0.0% 0.9%Grade 12 78.4% 21.6% 0.0% 0.0% 0.0%
Out in your neighborhood?
All 42.6% 44.0% 8.2% 0.7% 4.5%
Grade 8 35.0% 49.0% 7.0% 2.0% 7.0%
Grade 9 43.0% 43.9% 9.3% 0.0% 3.7%
Grade 12 51.4% 37.8% 8.1% 0.0% 2.7%
At school?
All 47.4% 39.5% 6.8% 2.1% 4.1%
Grade 8 46.0% 38.0% 5.0% 2.0% 9.0%
Grade 9 53.3% 36.4% 5.6% 1.9% 2.8%
Grade 12 40.5% 45.9% 10.8% 2.7% 0.0%
©Copyright 2010, Texas A&M University
All rights reserved.
Secondary Report-Page 41 of 90

8/7/2019 MATAGORDA COUNTY - Palacios ISD - 2010 Texas School Survey of Drug and Alcohol Use
http://slidepdf.com/reader/full/matagorda-county-palacios-isd-2010-texas-school-survey-of-drug-and-alcohol 42/90
Palacios
SPRING 2010
©Copyright 2010, Texas A&M University
All rights reserved.
Secondary Report-Page 42 of 90

8/7/2019 MATAGORDA COUNTY - Palacios ISD - 2010 Texas School Survey of Drug and Alcohol Use
http://slidepdf.com/reader/full/matagorda-county-palacios-isd-2010-texas-school-survey-of-drug-and-alcohol 43/90
Palacios
SPRING 2010
2. Prevalence Tables
©Copyright 2010, Texas A&M University
All rights reserved.
Secondary Report-Page 43 of 90

8/7/2019 MATAGORDA COUNTY - Palacios ISD - 2010 Texas School Survey of Drug and Alcohol Use
http://slidepdf.com/reader/full/matagorda-county-palacios-isd-2010-texas-school-survey-of-drug-and-alcohol 44/90
Palacios
SPRING 2010
©Copyright 2010, Texas A&M University
All rights reserved.
Secondary Report-Page 44 of 90

8/7/2019 MATAGORDA COUNTY - Palacios ISD - 2010 Texas School Survey of Drug and Alcohol Use
http://slidepdf.com/reader/full/matagorda-county-palacios-isd-2010-texas-school-survey-of-drug-and-alcohol 45/90
Palacios
SPRING 2010
Table B1: Prevalence and recency of use of selected substances by gradeAll students
Past
Month
School
Year
Ever
Used
Never
Used
Tobacco
All 10.3% 16.1% 30.3% 69.7%
Grade 8 8.0% 11.0% 28.0% 72.0%Grade 9 6.5% 15.0% 30.8% 69.2%
Grade 12 18.9% 24.3% 32.4% 67.6%
Alcohol
All 30.6% 46.4% 69.9% 30.1%
Grade 8 27.7% 37.6% 69.3% 30.7%
Grade 9 29.9% 50.5% 72.0% 28.0%
Grade 12 35.1% 51.4% 67.6% 32.4%
Inhalants
All 5.1% 8.2% 21.4% 78.6%
Grade 8 11.0% 18.0% 31.0% 69.0%
Grade 9 1.9% 3.7% 22.4% 77.6%
Grade 12 2.7% 2.7% 8.1% 91.9%
Any Illicit Drug
All 6.8% 11.3% 19.7% 80.3%
Grade 8 5.9% 10.9% 14.9% 85.1%
Grade 9 8.4% 10.3% 20.6% 79.4%
Grade 12 5.4% 13.5% 24.3% 75.7%
Marijuana
All 5.8% 10.9% 19.4% 80.6%
Grade 8 5.0% 10.0% 13.0% 87.0%
Grade 9 6.9% 9.8% 21.6% 78.4%
Grade 12 5.4% 13.5% 24.3% 75.7%
Marijuana Only
All 3.6% 6.4% 12.2% 87.8%
Grade 8 3.0% 5.0% 7.9% 92.1%
Grade 9 4.7% 4.7% 11.2% 88.8%
Grade 12 2.7% 10.8% 18.9% 81.1%
Cocaine or Crack
All 0.3% 0.3% 1.8% 98.2%
Grade 8 1.0% 1.0% 3.0% 97.0%
Grade 9 0.0% 0.0% 0.0% 100.0%
Grade 12 0.0% 0.0% 2.7% 97.3%
Cocaine
All 0.3% 0.3% 1.4% 98.6%
Grade 8 1.0% 1.0% 2.0% 98.0%
Grade 9 0.0% 0.0% 0.0% 100.0%
Grade 12 0.0% 0.0% 2.7% 97.3%Crack
All 0.0% 0.0% 0.3% 99.7%
Grade 8 0.0% 0.0% 1.0% 99.0%
Grade 9 0.0% 0.0% 0.0% 100.0%
Grade 12 0.0% 0.0% 0.0% 100.0%
©Copyright 2010, Texas A&M University
All rights reserved.
Secondary Report-Page 45 of 90

8/7/2019 MATAGORDA COUNTY - Palacios ISD - 2010 Texas School Survey of Drug and Alcohol Use
http://slidepdf.com/reader/full/matagorda-county-palacios-isd-2010-texas-school-survey-of-drug-and-alcohol 46/90
Palacios
SPRING 2010
Table B1: Prevalence and recency of use of selected substances by gradeAll students(Continued)
Past
Month
School
Year
Ever
Used
Never
Used
Hallucinogens
All 0.0% 0.7% 1.9% 98.1%
Grade 8 0.0% 1.0% 2.1% 97.9%
Grade 9 0.0% 1.0% 3.0% 97.0%
Grade 12 0.0% 0.0% 0.0% 100.0%
Uppers
All 0.0% 0.0% 0.4% 99.6%
Grade 8 0.0% 0.0% 1.1% 98.9%
Grade 9 0.0% 0.0% 0.0% 100.0%
Grade 12 0.0% 0.0% 0.0% 100.0%
Downers
All 1.1% 1.9% 2.2% 97.8%
Grade 8 2.1% 2.1% 3.1% 96.9%
Grade 9 1.0% 3.1% 3.1% 96.9%
Grade 12 0.0% 0.0% 0.0% 100.0%
Rohypnol
All 0.0% 0.7% 1.5% 98.5%
Grade 8 0.0% 1.0% 1.0% 99.0%
Grade 9 0.0% 1.0% 3.1% 96.9%
Grade 12 0.0% 0.0% 0.0% 100.0%
Steroids
All 1.1% 1.1% 1.1% 98.9%
Grade 8 0.0% 0.0% 0.0% 100.0%
Grade 9 1.0% 1.0% 1.0% 99.0%
Grade 12 2.8% 2.8% 2.8% 97.2%
Ecstasy
All 1.1% 1.8% 2.6% 97.4%Grade 8 0.0% 2.0% 2.0% 98.0%
Grade 9 1.0% 1.0% 3.0% 97.0%
Grade 12 2.8% 2.8% 2.8% 97.2%
Heroin
All 0.0% 0.0% 0.0% 100.0%
Grade 8 0.0% 0.0% 0.0% 100.0%
Grade 9 0.0% 0.0% 0.0% 100.0%
Grade 12 0.0% 0.0% 0.0% 100.0%
©Copyright 2010, Texas A&M University
All rights reserved.
Secondary Report-Page 46 of 90

8/7/2019 MATAGORDA COUNTY - Palacios ISD - 2010 Texas School Survey of Drug and Alcohol Use
http://slidepdf.com/reader/full/matagorda-county-palacios-isd-2010-texas-school-survey-of-drug-and-alcohol 47/90
Palacios
SPRING 2010
Table B2: Prevalence and recency of use of selected substances by gradeMale students
Past
Month
School
Year
Ever
Used
Never
Used
Tobacco
All 14.9% 21.3% 36.8% 63.2%
Grade 8 9.4% 13.2% 30.2% 69.8%Grade 9 7.5% 17.0% 34.0% 66.0%
Grade 12 33.3% 38.9% 50.0% 50.0%
Alcohol
All 34.0% 44.8% 67.6% 32.4%
Grade 8 26.4% 32.1% 66.0% 34.0%
Grade 9 34.0% 45.3% 66.0% 34.0%
Grade 12 44.4% 61.1% 72.2% 27.8%
Inhalants
All 6.9% 8.9% 18.1% 81.9%
Grade 8 11.5% 17.3% 26.9% 73.1%
Grade 9 3.8% 3.8% 15.1% 84.9%
Grade 12 5.6% 5.6% 11.1% 88.9%
Any Illicit Drug
All 7.8% 10.6% 20.5% 79.5%
Grade 8 5.7% 9.4% 15.1% 84.9%
Grade 9 7.5% 7.5% 17.0% 83.0%
Grade 12 11.1% 16.7% 33.3% 66.7%
Marijuana
All 8.1% 11.0% 20.7% 79.3%
Grade 8 5.7% 9.4% 13.2% 86.8%
Grade 9 8.3% 8.3% 18.8% 81.3%
Grade 12 11.1% 16.7% 33.3% 66.7%
Marijuana Only
All 5.0% 7.1% 14.9% 85.1%
Grade 8 3.8% 5.7% 9.4% 90.6%
Grade 9 5.7% 5.7% 11.3% 88.7%
Grade 12 5.6% 11.1% 27.8% 72.2%
Cocaine or Crack
All 0.7% 0.7% 2.1% 97.9%
Grade 8 1.9% 1.9% 5.8% 94.2%
Grade 9 0.0% 0.0% 0.0% 100.0%
Grade 12 0.0% 0.0% 0.0% 100.0%
Cocaine
All 0.7% 0.7% 1.4% 98.6%
Grade 8 1.9% 1.9% 3.8% 96.2%
Grade 9 0.0% 0.0% 0.0% 100.0%
Grade 12 0.0% 0.0% 0.0% 100.0%Crack
All 0.0% 0.0% 0.7% 99.3%
Grade 8 0.0% 0.0% 1.9% 98.1%
Grade 9 0.0% 0.0% 0.0% 100.0%
Grade 12 0.0% 0.0% 0.0% 100.0%
©Copyright 2010, Texas A&M University
All rights reserved.
Secondary Report-Page 47 of 90
8/7/2019 MATAGORDA COUNTY - Palacios ISD - 2010 Texas School Survey of Drug and Alcohol Use
http://slidepdf.com/reader/full/matagorda-county-palacios-isd-2010-texas-school-survey-of-drug-and-alcohol 48/90
Palacios
SPRING 2010
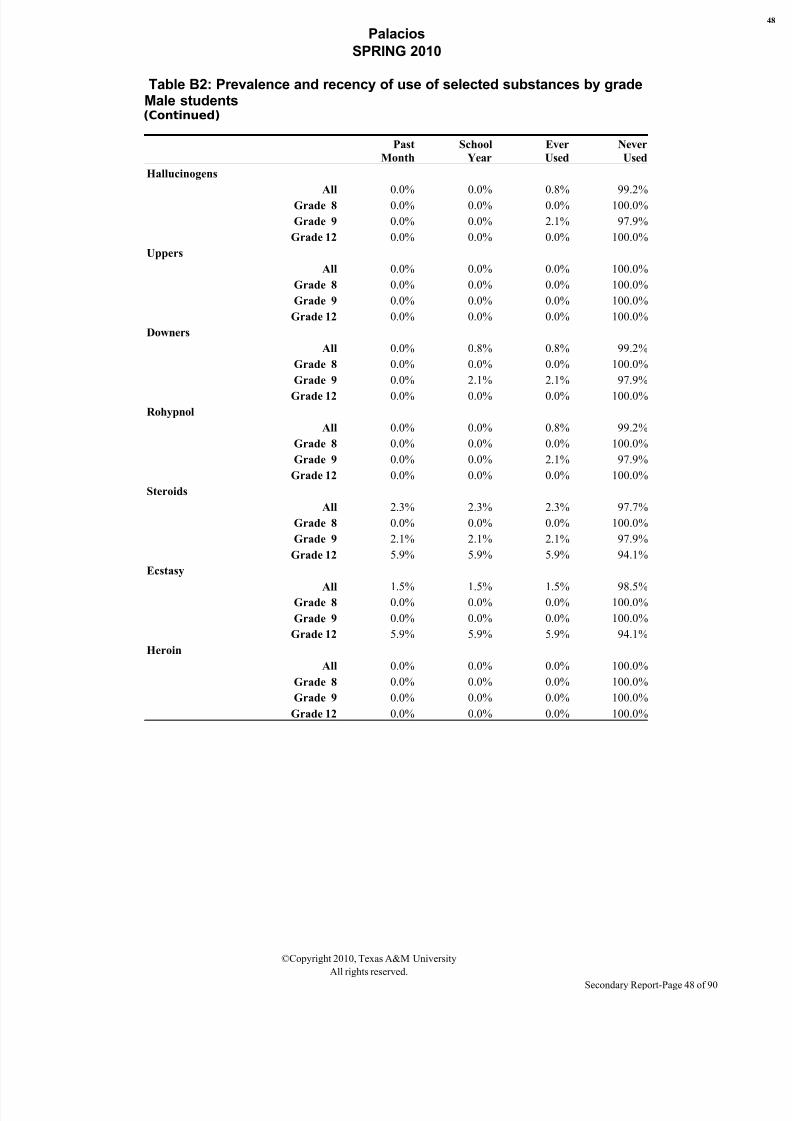
Table B2: Prevalence and recency of use of selected substances by gradeMale students(Continued)
Past
Month
School
Year
Ever
Used
Never
Used
Hallucinogens
All 0.0% 0.0% 0.8% 99.2%
Grade 8 0.0% 0.0% 0.0% 100.0%
Grade 9 0.0% 0.0% 2.1% 97.9%
Grade 12 0.0% 0.0% 0.0% 100.0%
Uppers
All 0.0% 0.0% 0.0% 100.0%
Grade 8 0.0% 0.0% 0.0% 100.0%
Grade 9 0.0% 0.0% 0.0% 100.0%
Grade 12 0.0% 0.0% 0.0% 100.0%
Downers
All 0.0% 0.8% 0.8% 99.2%
Grade 8 0.0% 0.0% 0.0% 100.0%
Grade 9 0.0% 2.1% 2.1% 97.9%
Grade 12 0.0% 0.0% 0.0% 100.0%
Rohypnol
All 0.0% 0.0% 0.8% 99.2%
Grade 8 0.0% 0.0% 0.0% 100.0%
Grade 9 0.0% 0.0% 2.1% 97.9%
Grade 12 0.0% 0.0% 0.0% 100.0%
Steroids
All 2.3% 2.3% 2.3% 97.7%
Grade 8 0.0% 0.0% 0.0% 100.0%
Grade 9 2.1% 2.1% 2.1% 97.9%
Grade 12 5.9% 5.9% 5.9% 94.1%
Ecstasy
All 1.5% 1.5% 1.5% 98.5%Grade 8 0.0% 0.0% 0.0% 100.0%
Grade 9 0.0% 0.0% 0.0% 100.0%
Grade 12 5.9% 5.9% 5.9% 94.1%
Heroin
All 0.0% 0.0% 0.0% 100.0%
Grade 8 0.0% 0.0% 0.0% 100.0%
Grade 9 0.0% 0.0% 0.0% 100.0%
Grade 12 0.0% 0.0% 0.0% 100.0%
©Copyright 2010, Texas A&M University
All rights reserved.
Secondary Report-Page 48 of 90
8/7/2019 MATAGORDA COUNTY - Palacios ISD - 2010 Texas School Survey of Drug and Alcohol Use
http://slidepdf.com/reader/full/matagorda-county-palacios-isd-2010-texas-school-survey-of-drug-and-alcohol 49/90
Palacios
SPRING 2010
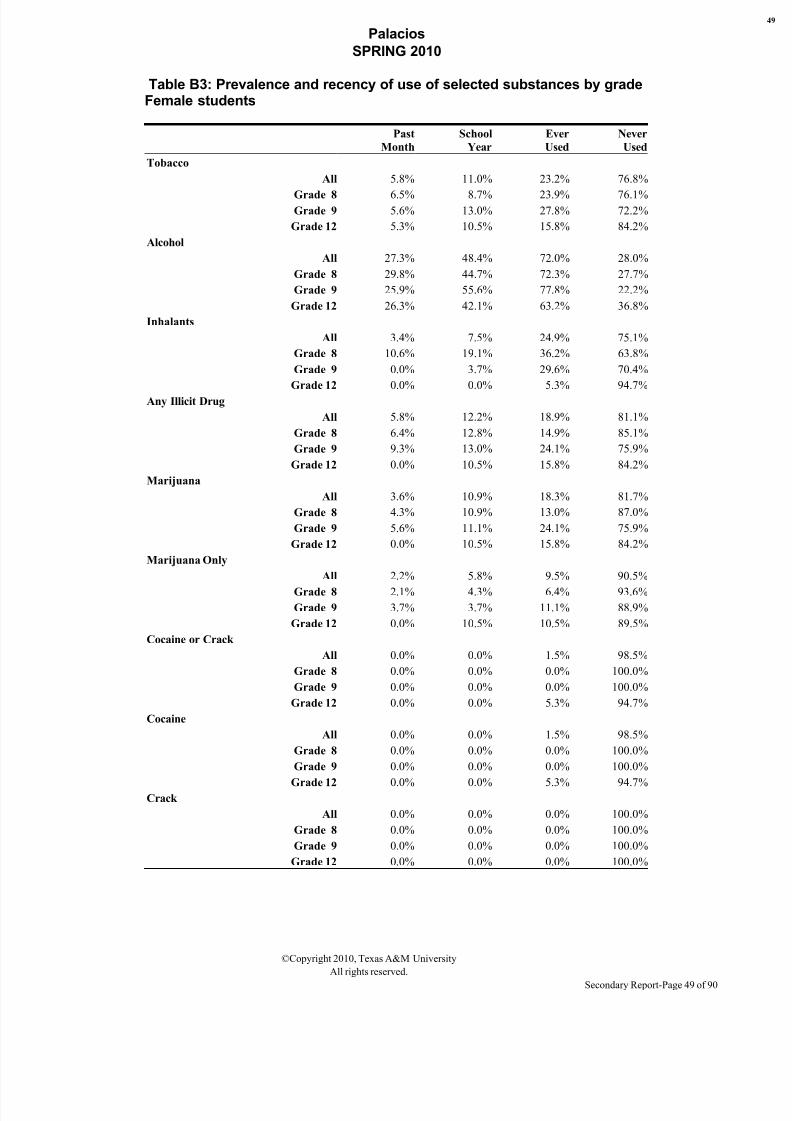
Table B3: Prevalence and recency of use of selected substances by gradeFemale students
Past
Month
School
Year
Ever
Used
Never
Used
Tobacco
All 5.8% 11.0% 23.2% 76.8%
Grade 8 6.5% 8.7% 23.9% 76.1%Grade 9 5.6% 13.0% 27.8% 72.2%
Grade 12 5.3% 10.5% 15.8% 84.2%
Alcohol
All 27.3% 48.4% 72.0% 28.0%
Grade 8 29.8% 44.7% 72.3% 27.7%
Grade 9 25.9% 55.6% 77.8% 22.2%
Grade 12 26.3% 42.1% 63.2% 36.8%
Inhalants
All 3.4% 7.5% 24.9% 75.1%
Grade 8 10.6% 19.1% 36.2% 63.8%
Grade 9 0.0% 3.7% 29.6% 70.4%
Grade 12 0.0% 0.0% 5.3% 94.7%
Any Illicit Drug
All 5.8% 12.2% 18.9% 81.1%
Grade 8 6.4% 12.8% 14.9% 85.1%
Grade 9 9.3% 13.0% 24.1% 75.9%
Grade 12 0.0% 10.5% 15.8% 84.2%
Marijuana
All 3.6% 10.9% 18.3% 81.7%
Grade 8 4.3% 10.9% 13.0% 87.0%
Grade 9 5.6% 11.1% 24.1% 75.9%
Grade 12 0.0% 10.5% 15.8% 84.2%
Marijuana Only
All 2.2% 5.8% 9.5% 90.5%
Grade 8 2.1% 4.3% 6.4% 93.6%
Grade 9 3.7% 3.7% 11.1% 88.9%
Grade 12 0.0% 10.5% 10.5% 89.5%
Cocaine or Crack
All 0.0% 0.0% 1.5% 98.5%
Grade 8 0.0% 0.0% 0.0% 100.0%
Grade 9 0.0% 0.0% 0.0% 100.0%
Grade 12 0.0% 0.0% 5.3% 94.7%
Cocaine
All 0.0% 0.0% 1.5% 98.5%
Grade 8 0.0% 0.0% 0.0% 100.0%
Grade 9 0.0% 0.0% 0.0% 100.0%
Grade 12 0.0% 0.0% 5.3% 94.7%Crack
All 0.0% 0.0% 0.0% 100.0%
Grade 8 0.0% 0.0% 0.0% 100.0%
Grade 9 0.0% 0.0% 0.0% 100.0%
Grade 12 0.0% 0.0% 0.0% 100.0%
©Copyright 2010, Texas A&M University
All rights reserved.
Secondary Report-Page 49 of 90

8/7/2019 MATAGORDA COUNTY - Palacios ISD - 2010 Texas School Survey of Drug and Alcohol Use
http://slidepdf.com/reader/full/matagorda-county-palacios-isd-2010-texas-school-survey-of-drug-and-alcohol 50/90
Palacios
SPRING 2010
Table B3: Prevalence and recency of use of selected substances by gradeFemale students(Continued)
Past
Month
School
Year
Ever
Used
Never
Used
Hallucinogens
All 0.0% 1.5% 2.9% 97.1%
Grade 8 0.0% 2.2% 4.3% 95.7%
Grade 9 0.0% 1.9% 3.8% 96.2%
Grade 12 0.0% 0.0% 0.0% 100.0%
Uppers
All 0.0% 0.0% 0.7% 99.3%
Grade 8 0.0% 0.0% 2.2% 97.8%
Grade 9 0.0% 0.0% 0.0% 100.0%
Grade 12 0.0% 0.0% 0.0% 100.0%
Downers
All 2.2% 3.0% 3.7% 96.3%
Grade 8 4.4% 4.4% 6.7% 93.3%
Grade 9 2.0% 4.0% 4.0% 96.0%
Grade 12 0.0% 0.0% 0.0% 100.0%
Rohypnol
All 0.0% 1.5% 2.2% 97.8%
Grade 8 0.0% 2.2% 2.2% 97.8%
Grade 9 0.0% 2.0% 3.9% 96.1%
Grade 12 0.0% 0.0% 0.0% 100.0%
Steroids
All 0.0% 0.0% 0.0% 100.0%
Grade 8 0.0% 0.0% 0.0% 100.0%
Grade 9 0.0% 0.0% 0.0% 100.0%
Grade 12 0.0% 0.0% 0.0% 100.0%
Ecstasy
All 0.8% 2.1% 3.7% 96.3%Grade 8 0.0% 4.3% 4.3% 95.7%
Grade 9 1.9% 1.9% 5.8% 94.2%
Grade 12 0.0% 0.0% 0.0% 100.0%
Heroin
All 0.0% 0.0% 0.0% 100.0%
Grade 8 0.0% 0.0% 0.0% 100.0%
Grade 9 0.0% 0.0% 0.0% 100.0%
Grade 12 0.0% 0.0% 0.0% 100.0%
©Copyright 2010, Texas A&M University
All rights reserved.
Secondary Report-Page 50 of 90

8/7/2019 MATAGORDA COUNTY - Palacios ISD - 2010 Texas School Survey of Drug and Alcohol Use
http://slidepdf.com/reader/full/matagorda-county-palacios-isd-2010-texas-school-survey-of-drug-and-alcohol 51/90
Palacios
SPRING 2010
Table B4: Prevalence and recency of use of selected substances by gradeWhite students
Past
Month
School
Year
Ever
Used
Never
Used
Tobacco
All 25.7% 31.4% 45.5% 54.5%
Grade 8 18.8% 25.0% 43.8% 56.3%Grade 9 16.7% 20.0% 30.0% 70.0%
Grade 12 41.7% 50.0% 66.7% 33.3%
Alcohol
All 45.7% 63.1% 78.6% 21.4%
Grade 8 37.5% 50.0% 75.0% 25.0%
Grade 9 33.3% 60.0% 76.7% 23.3%
Grade 12 66.7% 75.0% 83.3% 16.7%
Inhalants
All 8.1% 9.5% 24.0% 76.0%
Grade 8 25.0% 31.3% 37.5% 62.5%
Grade 9 0.0% 0.0% 23.3% 76.7%
Grade 12 8.3% 8.3% 16.7% 83.3%
Any Illicit Drug
All 5.7% 15.6% 27.3% 72.7%
Grade 8 6.3% 12.5% 12.5% 87.5%
Grade 9 3.3% 3.3% 16.7% 83.3%
Grade 12 8.3% 33.3% 50.0% 50.0%
Marijuana
All 5.7% 15.6% 27.3% 72.7%
Grade 8 6.3% 12.5% 12.5% 87.5%
Grade 9 3.3% 3.3% 16.7% 83.3%
Grade 12 8.3% 33.3% 50.0% 50.0%
Marijuana Only
All 4.2% 12.8% 21.6% 78.4%
Grade 8 6.3% 6.3% 6.3% 93.8%
Grade 9 0.0% 0.0% 13.3% 86.7%
Grade 12 8.3% 33.3% 41.7% 58.3%
Cocaine or Crack
All 0.0% 0.0% 4.2% 95.8%
Grade 8 0.0% 0.0% 6.3% 93.8%
Grade 9 0.0% 0.0% 0.0% 100.0%
Grade 12 0.0% 0.0% 8.3% 91.7%
Cocaine
All 0.0% 0.0% 4.3% 95.7%
Grade 8 0.0% 0.0% 6.3% 93.8%
Grade 9 0.0% 0.0% 0.0% 100.0%
Grade 12 0.0% 0.0% 8.3% 91.7%Crack
All 0.0% 0.0% 0.0% 100.0%
Grade 8 0.0% 0.0% 0.0% 100.0%
Grade 9 0.0% 0.0% 0.0% 100.0%
Grade 12 0.0% 0.0% 0.0% 100.0%
©Copyright 2010, Texas A&M University
All rights reserved.
Secondary Report-Page 51 of 90

8/7/2019 MATAGORDA COUNTY - Palacios ISD - 2010 Texas School Survey of Drug and Alcohol Use
http://slidepdf.com/reader/full/matagorda-county-palacios-isd-2010-texas-school-survey-of-drug-and-alcohol 52/90
Palacios
SPRING 2010
Table B4: Prevalence and recency of use of selected substances by gradeWhite students(Continued)
Past
Month
School
Year
Ever
Used
Never
Used
Hallucinogens
All 0.0% 0.0% 0.0% 100.0%
Grade 8 0.0% 0.0% 0.0% 100.0%
Grade 9 0.0% 0.0% 0.0% 100.0%
Grade 12 0.0% 0.0% 0.0% 100.0%
Uppers
All 0.0% 0.0% 0.0% 100.0%
Grade 8 0.0% 0.0% 0.0% 100.0%
Grade 9 0.0% 0.0% 0.0% 100.0%
Grade 12 0.0% 0.0% 0.0% 100.0%
Downers
All 0.0% 1.5% 1.5% 98.5%
Grade 8 0.0% 0.0% 0.0% 100.0%
Grade 9 0.0% 3.4% 3.4% 96.6%
Grade 12 0.0% 0.0% 0.0% 100.0%
Rohypnol
All 0.0% 0.0% 0.0% 100.0%
Grade 8 0.0% 0.0% 0.0% 100.0%
Grade 9 0.0% 0.0% 0.0% 100.0%
Grade 12 0.0% 0.0% 0.0% 100.0%
Steroids
All 0.0% 0.0% 0.0% 100.0%
Grade 8 0.0% 0.0% 0.0% 100.0%
Grade 9 0.0% 0.0% 0.0% 100.0%
Grade 12 0.0% 0.0% 0.0% 100.0%
Ecstasy
All 0.0% 0.0% 0.0% 100.0%Grade 8 0.0% 0.0% 0.0% 100.0%
Grade 9 0.0% 0.0% 0.0% 100.0%
Grade 12 0.0% 0.0% 0.0% 100.0%
Heroin
All 0.0% 0.0% 0.0% 100.0%
Grade 8 0.0% 0.0% 0.0% 100.0%
Grade 9 0.0% 0.0% 0.0% 100.0%
Grade 12 0.0% 0.0% 0.0% 100.0%
©Copyright 2010, Texas A&M University
All rights reserved.
Secondary Report-Page 52 of 90

8/7/2019 MATAGORDA COUNTY - Palacios ISD - 2010 Texas School Survey of Drug and Alcohol Use
http://slidepdf.com/reader/full/matagorda-county-palacios-isd-2010-texas-school-survey-of-drug-and-alcohol 53/90
Palacios
SPRING 2010
Table B5: Prevalence and recency of use of selected substances by gradeBlack students
Past
Month
School
Year
Ever
Used
Never
Used
Tobacco
All 0.0% 15.1% 15.1% 84.9%
Grade 8 0.0% 0.0% 0.0% 100.0%Grade 9 * * * *
Grade 12 0.0% 0.0% 0.0% 100.0%
Alcohol
All 22.2% 29.7% 44.0% 56.0%
Grade 8 * * * *
Grade 9 * * * *
Grade 12 * * * *
Inhalants
All 0.0% 0.0% 15.1% 84.9%
Grade 8 0.0% 0.0% 0.0% 100.0%
Grade 9 * * * *
Grade 12 0.0% 0.0% 0.0% 100.0%
Any Illicit Drug
All 7.5% 7.5% 7.5% 92.5%
Grade 8 0.0% 0.0% 0.0% 100.0%
Grade 9 * * * *
Grade 12 0.0% 0.0% 0.0% 100.0%
Marijuana
All 0.0% 0.0% 7.5% 92.5%
Grade 8 0.0% 0.0% 0.0% 100.0%
Grade 9 * * * *
Grade 12 0.0% 0.0% 0.0% 100.0%
Marijuana Only
All 0.0% 0.0% 0.0% 100.0%
Grade 8 0.0% 0.0% 0.0% 100.0%
Grade 9 0.0% 0.0% 0.0% 100.0%
Grade 12 0.0% 0.0% 0.0% 100.0%
Cocaine or Crack
All 0.0% 0.0% 0.0% 100.0%
Grade 8 0.0% 0.0% 0.0% 100.0%
Grade 9 0.0% 0.0% 0.0% 100.0%
Grade 12 0.0% 0.0% 0.0% 100.0%
Cocaine
All 0.0% 0.0% 0.0% 100.0%
Grade 8 0.0% 0.0% 0.0% 100.0%
Grade 9 0.0% 0.0% 0.0% 100.0%
Grade 12 0.0% 0.0% 0.0% 100.0%Crack
All 0.0% 0.0% 0.0% 100.0%
Grade 8 0.0% 0.0% 0.0% 100.0%
Grade 9 0.0% 0.0% 0.0% 100.0%
Grade 12 0.0% 0.0% 0.0% 100.0%
©Copyright 2010, Texas A&M University
All rights reserved.
Secondary Report-Page 53 of 90

8/7/2019 MATAGORDA COUNTY - Palacios ISD - 2010 Texas School Survey of Drug and Alcohol Use
http://slidepdf.com/reader/full/matagorda-county-palacios-isd-2010-texas-school-survey-of-drug-and-alcohol 54/90
Palacios
SPRING 2010
Table B5: Prevalence and recency of use of selected substances by gradeBlack students(Continued)
Past
Month
School
Year
Ever
Used
Never
Used
Hallucinogens
All 0.0% 0.0% 0.0% 100.0%
Grade 8 0.0% 0.0% 0.0% 100.0%
Grade 9 0.0% 0.0% 0.0% 100.0%
Grade 12 0.0% 0.0% 0.0% 100.0%
Uppers
All 0.0% 0.0% 0.0% 100.0%
Grade 8 0.0% 0.0% 0.0% 100.0%
Grade 9 0.0% 0.0% 0.0% 100.0%
Grade 12 0.0% 0.0% 0.0% 100.0%
Downers
All 7.5% 7.5% 7.5% 92.5%
Grade 8 0.0% 0.0% 0.0% 100.0%
Grade 9 * * * *
Grade 12 0.0% 0.0% 0.0% 100.0%
Rohypnol
All 0.0% 0.0% 0.0% 100.0%
Grade 8 0.0% 0.0% 0.0% 100.0%
Grade 9 0.0% 0.0% 0.0% 100.0%
Grade 12 0.0% 0.0% 0.0% 100.0%
Steroids
All 0.0% 0.0% 0.0% 100.0%
Grade 8 0.0% 0.0% 0.0% 100.0%
Grade 9 0.0% 0.0% 0.0% 100.0%
Grade 12 0.0% 0.0% 0.0% 100.0%
Ecstasy
All 0.0% 0.0% 0.0% 100.0%Grade 8 0.0% 0.0% 0.0% 100.0%
Grade 9 0.0% 0.0% 0.0% 100.0%
Grade 12 0.0% 0.0% 0.0% 100.0%
Heroin
All 0.0% 0.0% 0.0% 100.0%
Grade 8 0.0% 0.0% 0.0% 100.0%
Grade 9 0.0% 0.0% 0.0% 100.0%
Grade 12 0.0% 0.0% 0.0% 100.0%
©Copyright 2010, Texas A&M University
All rights reserved.
Secondary Report-Page 54 of 90

8/7/2019 MATAGORDA COUNTY - Palacios ISD - 2010 Texas School Survey of Drug and Alcohol Use
http://slidepdf.com/reader/full/matagorda-county-palacios-isd-2010-texas-school-survey-of-drug-and-alcohol 55/90
Palacios
SPRING 2010
Table B6: Prevalence and recency of use of selected substances by gradeMexican/American students
Past
Month
School
Year
Ever
Used
Never
Used
Tobacco
All 7.8% 13.6% 31.5% 68.5%
Grade 8 7.9% 11.1% 30.2% 69.8%Grade 9 4.1% 12.2% 34.7% 65.3%
Grade 12 14.3% 21.4% 28.6% 71.4%
Alcohol
All 29.0% 47.8% 73.8% 26.2%
Grade 8 31.3% 40.6% 73.4% 26.6%
Grade 9 30.6% 51.0% 75.5% 24.5%
Grade 12 21.4% 57.1% 71.4% 28.6%
Inhalants
All 4.8% 10.3% 23.8% 76.2%
Grade 8 9.4% 18.8% 32.8% 67.2%
Grade 9 2.0% 6.1% 22.4% 77.6%
Grade 12 0.0% 0.0% 7.1% 92.9%
Any Illicit Drug
All 7.9% 12.1% 20.7% 79.3%
Grade 8 6.3% 12.5% 18.8% 81.3%
Grade 9 10.2% 14.3% 26.5% 73.5%
Grade 12 7.1% 7.1% 14.3% 85.7%
Marijuana
All 7.4% 11.7% 19.8% 80.2%
Grade 8 4.8% 11.1% 15.9% 84.1%
Grade 9 10.6% 14.9% 27.7% 72.3%
Grade 12 7.1% 7.1% 14.3% 85.7%
Marijuana Only
All 3.7% 5.0% 10.7% 89.3%
Grade 8 1.6% 4.7% 9.4% 90.6%
Grade 9 8.2% 8.2% 14.3% 85.7%
Grade 12 0.0% 0.0% 7.1% 92.9%
Cocaine or Crack
All 0.7% 0.7% 1.4% 98.6%
Grade 8 1.6% 1.6% 3.2% 96.8%
Grade 9 0.0% 0.0% 0.0% 100.0%
Grade 12 0.0% 0.0% 0.0% 100.0%
Cocaine
All 0.7% 0.7% 0.7% 99.3%
Grade 8 1.6% 1.6% 1.6% 98.4%
Grade 9 0.0% 0.0% 0.0% 100.0%
Grade 12 0.0% 0.0% 0.0% 100.0%Crack
All 0.0% 0.0% 0.7% 99.3%
Grade 8 0.0% 0.0% 1.6% 98.4%
Grade 9 0.0% 0.0% 0.0% 100.0%
Grade 12 0.0% 0.0% 0.0% 100.0%
©Copyright 2010, Texas A&M University
All rights reserved.
Secondary Report-Page 55 of 90

8/7/2019 MATAGORDA COUNTY - Palacios ISD - 2010 Texas School Survey of Drug and Alcohol Use
http://slidepdf.com/reader/full/matagorda-county-palacios-isd-2010-texas-school-survey-of-drug-and-alcohol 56/90
8/7/2019 MATAGORDA COUNTY - Palacios ISD - 2010 Texas School Survey of Drug and Alcohol Use
http://slidepdf.com/reader/full/matagorda-county-palacios-isd-2010-texas-school-survey-of-drug-and-alcohol 57/90
Palacios
SPRING 2010
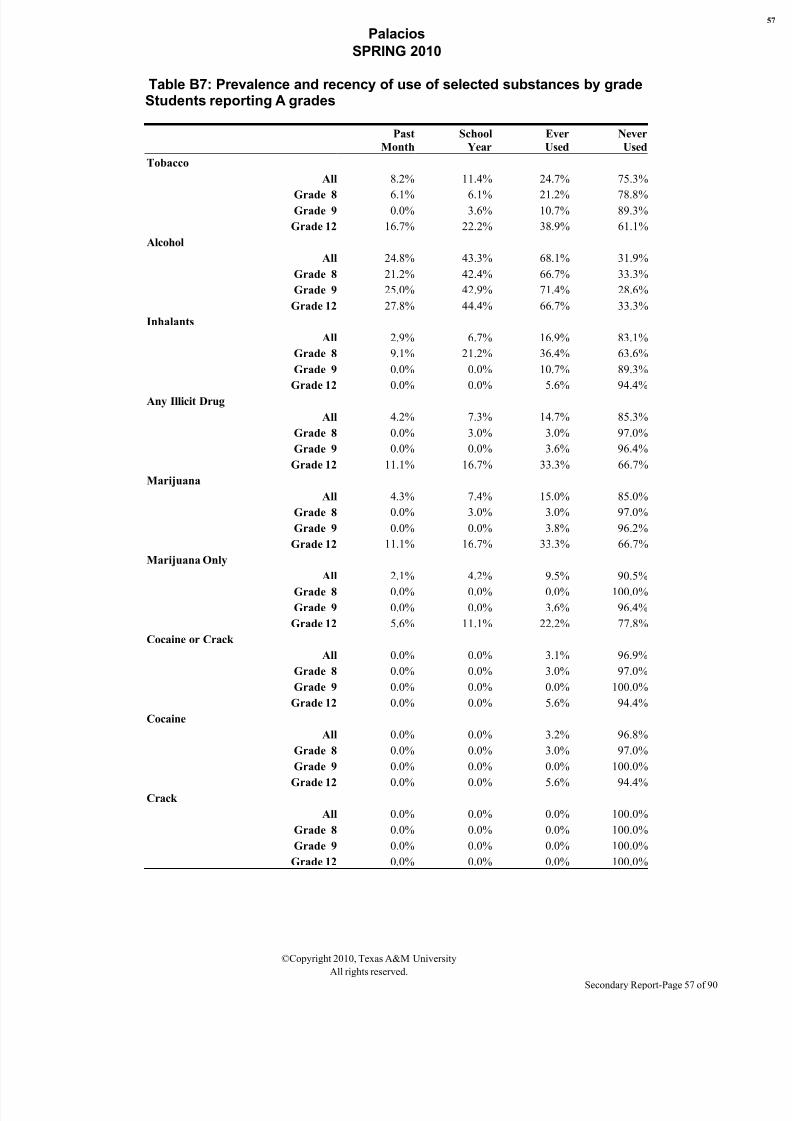
Table B7: Prevalence and recency of use of selected substances by gradeStudents reporting A grades
Past
Month
School
Year
Ever
Used
Never
Used
Tobacco
All 8.2% 11.4% 24.7% 75.3%
Grade 8 6.1% 6.1% 21.2% 78.8%Grade 9 0.0% 3.6% 10.7% 89.3%
Grade 12 16.7% 22.2% 38.9% 61.1%
Alcohol
All 24.8% 43.3% 68.1% 31.9%
Grade 8 21.2% 42.4% 66.7% 33.3%
Grade 9 25.0% 42.9% 71.4% 28.6%
Grade 12 27.8% 44.4% 66.7% 33.3%
Inhalants
All 2.9% 6.7% 16.9% 83.1%
Grade 8 9.1% 21.2% 36.4% 63.6%
Grade 9 0.0% 0.0% 10.7% 89.3%
Grade 12 0.0% 0.0% 5.6% 94.4%
Any Illicit Drug
All 4.2% 7.3% 14.7% 85.3%
Grade 8 0.0% 3.0% 3.0% 97.0%
Grade 9 0.0% 0.0% 3.6% 96.4%
Grade 12 11.1% 16.7% 33.3% 66.7%
Marijuana
All 4.3% 7.4% 15.0% 85.0%
Grade 8 0.0% 3.0% 3.0% 97.0%
Grade 9 0.0% 0.0% 3.8% 96.2%
Grade 12 11.1% 16.7% 33.3% 66.7%
Marijuana Only
All 2.1% 4.2% 9.5% 90.5%
Grade 8 0.0% 0.0% 0.0% 100.0%
Grade 9 0.0% 0.0% 3.6% 96.4%
Grade 12 5.6% 11.1% 22.2% 77.8%
Cocaine or Crack
All 0.0% 0.0% 3.1% 96.9%
Grade 8 0.0% 0.0% 3.0% 97.0%
Grade 9 0.0% 0.0% 0.0% 100.0%
Grade 12 0.0% 0.0% 5.6% 94.4%
Cocaine
All 0.0% 0.0% 3.2% 96.8%
Grade 8 0.0% 0.0% 3.0% 97.0%
Grade 9 0.0% 0.0% 0.0% 100.0%
Grade 12 0.0% 0.0% 5.6% 94.4%Crack
All 0.0% 0.0% 0.0% 100.0%
Grade 8 0.0% 0.0% 0.0% 100.0%
Grade 9 0.0% 0.0% 0.0% 100.0%
Grade 12 0.0% 0.0% 0.0% 100.0%
©Copyright 2010, Texas A&M University
All rights reserved.
Secondary Report-Page 57 of 90

8/7/2019 MATAGORDA COUNTY - Palacios ISD - 2010 Texas School Survey of Drug and Alcohol Use
http://slidepdf.com/reader/full/matagorda-county-palacios-isd-2010-texas-school-survey-of-drug-and-alcohol 58/90
Palacios
SPRING 2010
Table B7: Prevalence and recency of use of selected substances by gradeStudents reporting A grades(Continued)
Past
Month
School
Year
Ever
Used
Never
Used
Hallucinogens
All 0.0% 0.0% 0.0% 100.0%
Grade 8 0.0% 0.0% 0.0% 100.0%
Grade 9 0.0% 0.0% 0.0% 100.0%
Grade 12 0.0% 0.0% 0.0% 100.0%
Uppers
All 0.0% 0.0% 0.0% 100.0%
Grade 8 0.0% 0.0% 0.0% 100.0%
Grade 9 0.0% 0.0% 0.0% 100.0%
Grade 12 0.0% 0.0% 0.0% 100.0%
Downers
All 0.0% 0.0% 0.0% 100.0%
Grade 8 0.0% 0.0% 0.0% 100.0%
Grade 9 0.0% 0.0% 0.0% 100.0%
Grade 12 0.0% 0.0% 0.0% 100.0%
Rohypnol
All 0.0% 0.0% 0.0% 100.0%
Grade 8 0.0% 0.0% 0.0% 100.0%
Grade 9 0.0% 0.0% 0.0% 100.0%
Grade 12 0.0% 0.0% 0.0% 100.0%
Steroids
All 2.2% 2.2% 2.2% 97.8%
Grade 8 0.0% 0.0% 0.0% 100.0%
Grade 9 0.0% 0.0% 0.0% 100.0%
Grade 12 5.9% 5.9% 5.9% 94.1%
Ecstasy
All 2.2% 2.2% 2.2% 97.8%Grade 8 0.0% 0.0% 0.0% 100.0%
Grade 9 0.0% 0.0% 0.0% 100.0%
Grade 12 5.9% 5.9% 5.9% 94.1%
Heroin
All 0.0% 0.0% 0.0% 100.0%
Grade 8 0.0% 0.0% 0.0% 100.0%
Grade 9 0.0% 0.0% 0.0% 100.0%
Grade 12 0.0% 0.0% 0.0% 100.0%
©Copyright 2010, Texas A&M University
All rights reserved.
Secondary Report-Page 58 of 90

8/7/2019 MATAGORDA COUNTY - Palacios ISD - 2010 Texas School Survey of Drug and Alcohol Use
http://slidepdf.com/reader/full/matagorda-county-palacios-isd-2010-texas-school-survey-of-drug-and-alcohol 59/90
Palacios
SPRING 2010
Table B8: Prevalence and recency of use of selected substances by gradeStudents reporting grades lower than A
Past
Month
School
Year
Ever
Used
Never
Used
Tobacco
All 11.6% 19.0% 33.8% 66.2%
Grade 8 9.0% 13.4% 31.3% 68.7%Grade 9 9.0% 19.2% 38.5% 61.5%
Grade 12 22.2% 27.8% 27.8% 72.2%
Alcohol
All 34.1% 47.7% 70.3% 29.7%
Grade 8 30.9% 35.3% 70.6% 29.4%
Grade 9 32.1% 53.8% 71.8% 28.2%
Grade 12 44.4% 55.6% 66.7% 33.3%
Inhalants
All 6.4% 8.5% 22.5% 77.5%
Grade 8 11.9% 16.4% 28.4% 71.6%
Grade 9 2.6% 3.8% 25.6% 74.4%
Grade 12 5.6% 5.6% 5.6% 94.4%
Any Illicit Drug
All 8.3% 13.1% 22.1% 77.9%
Grade 8 8.8% 14.7% 20.6% 79.4%
Grade 9 11.5% 12.8% 25.6% 74.4%
Grade 12 0.0% 11.1% 16.7% 83.3%
Marijuana
All 6.8% 12.3% 21.5% 78.5%
Grade 8 7.5% 13.4% 17.9% 82.1%
Grade 9 9.3% 12.0% 26.7% 73.3%
Grade 12 0.0% 11.1% 16.7% 83.3%
Marijuana Only
All 4.4% 7.7% 13.8% 86.2%
Grade 8 4.4% 7.4% 11.8% 88.2%
Grade 9 6.4% 6.4% 14.1% 85.9%
Grade 12 0.0% 11.1% 16.7% 83.3%
Cocaine or Crack
All 0.5% 0.5% 1.1% 98.9%
Grade 8 1.5% 1.5% 3.0% 97.0%
Grade 9 0.0% 0.0% 0.0% 100.0%
Grade 12 0.0% 0.0% 0.0% 100.0%
Cocaine
All 0.5% 0.5% 0.5% 99.5%
Grade 8 1.5% 1.5% 1.5% 98.5%
Grade 9 0.0% 0.0% 0.0% 100.0%
Grade 12 0.0% 0.0% 0.0% 100.0%Crack
All 0.0% 0.0% 0.5% 99.5%
Grade 8 0.0% 0.0% 1.5% 98.5%
Grade 9 0.0% 0.0% 0.0% 100.0%
Grade 12 0.0% 0.0% 0.0% 100.0%
©Copyright 2010, Texas A&M University
All rights reserved.
Secondary Report-Page 59 of 90

8/7/2019 MATAGORDA COUNTY - Palacios ISD - 2010 Texas School Survey of Drug and Alcohol Use
http://slidepdf.com/reader/full/matagorda-county-palacios-isd-2010-texas-school-survey-of-drug-and-alcohol 60/90
Palacios
SPRING 2010
Table B8: Prevalence and recency of use of selected substances by gradeStudents reporting grades lower than A(Continued)
Past
Month
School
Year
Ever
Used
Never
Used
Hallucinogens
All 0.0% 0.5% 2.3% 97.7%
Grade 8 0.0% 1.6% 3.2% 96.8%
Grade 9 0.0% 0.0% 2.8% 97.2%
Grade 12 0.0% 0.0% 0.0% 100.0%
Uppers
All 0.0% 0.0% 0.6% 99.4%
Grade 8 0.0% 0.0% 1.6% 98.4%
Grade 9 0.0% 0.0% 0.0% 100.0%
Grade 12 0.0% 0.0% 0.0% 100.0%
Downers
All 1.7% 3.0% 3.5% 96.5%
Grade 8 3.2% 3.2% 4.8% 95.2%
Grade 9 1.4% 4.2% 4.2% 95.8%
Grade 12 0.0% 0.0% 0.0% 100.0%
Rohypnol
All 0.0% 0.5% 1.8% 98.2%
Grade 8 0.0% 1.5% 1.5% 98.5%
Grade 9 0.0% 0.0% 2.8% 97.2%
Grade 12 0.0% 0.0% 0.0% 100.0%
Steroids
All 0.6% 0.6% 0.6% 99.4%
Grade 8 0.0% 0.0% 0.0% 100.0%
Grade 9 1.4% 1.4% 1.4% 98.6%
Grade 12 0.0% 0.0% 0.0% 100.0%
Ecstasy
All 0.6% 1.7% 2.9% 97.1%Grade 8 0.0% 3.0% 3.0% 97.0%
Grade 9 1.4% 1.4% 4.1% 95.9%
Grade 12 0.0% 0.0% 0.0% 100.0%
Heroin
All 0.0% 0.0% 0.0% 100.0%
Grade 8 0.0% 0.0% 0.0% 100.0%
Grade 9 0.0% 0.0% 0.0% 100.0%
Grade 12 0.0% 0.0% 0.0% 100.0%
©Copyright 2010, Texas A&M University
All rights reserved.
Secondary Report-Page 60 of 90

8/7/2019 MATAGORDA COUNTY - Palacios ISD - 2010 Texas School Survey of Drug and Alcohol Use
http://slidepdf.com/reader/full/matagorda-county-palacios-isd-2010-texas-school-survey-of-drug-and-alcohol 61/90
Palacios
SPRING 2010
Table B9: Prevalence and recency of use of selected substances by gradeStudents living with two parents
Past
Month
School
Year
Ever
Used
Never
Used
Tobacco
All 9.1% 14.2% 25.3% 74.7%
Grade 8 5.8% 10.1% 23.2% 76.8%Grade 9 2.7% 9.6% 21.9% 78.1%
Grade 12 21.4% 25.0% 32.1% 67.9%
Alcohol
All 29.9% 46.0% 69.9% 30.1%
Grade 8 22.9% 37.1% 67.1% 32.9%
Grade 9 31.5% 47.9% 68.5% 31.5%
Grade 12 35.7% 53.6% 75.0% 25.0%
Inhalants
All 5.3% 7.6% 18.4% 81.6%
Grade 8 13.0% 20.3% 29.0% 71.0%
Grade 9 0.0% 0.0% 17.8% 82.2%
Grade 12 3.6% 3.6% 7.1% 92.9%
Any Illicit Drug
All 5.6% 7.5% 14.7% 85.3%
Grade 8 4.3% 7.1% 10.0% 90.0%
Grade 9 5.5% 5.5% 13.7% 86.3%
Grade 12 7.1% 10.7% 21.4% 78.6%
Marijuana
All 5.1% 7.1% 14.5% 85.5%
Grade 8 4.3% 7.1% 8.6% 91.4%
Grade 9 4.3% 4.3% 14.5% 85.5%
Grade 12 7.1% 10.7% 21.4% 78.6%
Marijuana Only
All 2.5% 4.0% 9.6% 90.4%
Grade 8 2.9% 4.3% 5.7% 94.3%
Grade 9 1.4% 1.4% 6.8% 93.2%
Grade 12 3.6% 7.1% 17.9% 82.1%
Cocaine or Crack
All 0.5% 0.5% 1.5% 98.5%
Grade 8 1.4% 1.4% 4.3% 95.7%
Grade 9 0.0% 0.0% 0.0% 100.0%
Grade 12 0.0% 0.0% 0.0% 100.0%
Cocaine
All 0.5% 0.5% 1.0% 99.0%
Grade 8 1.4% 1.4% 2.9% 97.1%
Grade 9 0.0% 0.0% 0.0% 100.0%
Grade 12 0.0% 0.0% 0.0% 100.0%Crack
All 0.0% 0.0% 0.5% 99.5%
Grade 8 0.0% 0.0% 1.4% 98.6%
Grade 9 0.0% 0.0% 0.0% 100.0%
Grade 12 0.0% 0.0% 0.0% 100.0%
©Copyright 2010, Texas A&M University
All rights reserved.
Secondary Report-Page 61 of 90

8/7/2019 MATAGORDA COUNTY - Palacios ISD - 2010 Texas School Survey of Drug and Alcohol Use
http://slidepdf.com/reader/full/matagorda-county-palacios-isd-2010-texas-school-survey-of-drug-and-alcohol 62/90
Palacios
SPRING 2010
Table B9: Prevalence and recency of use of selected substances by gradeStudents living with two parents(Continued)
Past
Month
School
Year
Ever
Used
Never
Used
Hallucinogens
All 0.0% 0.0% 0.0% 100.0%
Grade 8 0.0% 0.0% 0.0% 100.0%
Grade 9 0.0% 0.0% 0.0% 100.0%
Grade 12 0.0% 0.0% 0.0% 100.0%
Uppers
All 0.0% 0.0% 0.0% 100.0%
Grade 8 0.0% 0.0% 0.0% 100.0%
Grade 9 0.0% 0.0% 0.0% 100.0%
Grade 12 0.0% 0.0% 0.0% 100.0%
Downers
All 0.6% 1.1% 1.1% 98.9%
Grade 8 0.0% 0.0% 0.0% 100.0%
Grade 9 1.5% 3.0% 3.0% 97.0%
Grade 12 0.0% 0.0% 0.0% 100.0%
Rohypnol
All 0.0% 0.0% 0.6% 99.4%
Grade 8 0.0% 0.0% 0.0% 100.0%
Grade 9 0.0% 0.0% 1.5% 98.5%
Grade 12 0.0% 0.0% 0.0% 100.0%
Steroids
All 1.1% 1.1% 1.1% 98.9%
Grade 8 0.0% 0.0% 0.0% 100.0%
Grade 9 0.0% 0.0% 0.0% 100.0%
Grade 12 3.7% 3.7% 3.7% 96.3%
Ecstasy
All 1.1% 1.1% 2.2% 97.8%Grade 8 0.0% 0.0% 0.0% 100.0%
Grade 9 0.0% 0.0% 2.9% 97.1%
Grade 12 3.7% 3.7% 3.7% 96.3%
Heroin
All 0.0% 0.0% 0.0% 100.0%
Grade 8 0.0% 0.0% 0.0% 100.0%
Grade 9 0.0% 0.0% 0.0% 100.0%
Grade 12 0.0% 0.0% 0.0% 100.0%
©Copyright 2010, Texas A&M University
All rights reserved.
Secondary Report-Page 62 of 90

8/7/2019 MATAGORDA COUNTY - Palacios ISD - 2010 Texas School Survey of Drug and Alcohol Use
http://slidepdf.com/reader/full/matagorda-county-palacios-isd-2010-texas-school-survey-of-drug-and-alcohol 63/90
Palacios
SPRING 2010
Table B10: Prevalence and recency of use of selected substances by gradeStudents not living with two parents
Past
Month
School
Year
Ever
Used
Never
Used
Tobacco
All 13.4% 21.0% 41.7% 58.3%
Grade 8 13.3% 13.3% 36.7% 63.3%Grade 9 14.7% 26.5% 50.0% 50.0%
Grade 12 11.1% 22.2% 33.3% 66.7%
Alcohol
All 32.6% 47.9% 69.5% 30.5%
Grade 8 40.0% 40.0% 73.3% 26.7%
Grade 9 26.5% 55.9% 79.4% 20.6%
Grade 12 33.3% 44.4% 44.4% 55.6%
Inhalants
All 4.8% 9.7% 29.1% 70.9%
Grade 8 6.7% 13.3% 36.7% 63.3%
Grade 9 5.9% 11.8% 32.4% 67.6%
Grade 12 0.0% 0.0% 11.1% 88.9%
Any Illicit Drug
All 9.8% 20.8% 31.9% 68.1%
Grade 8 10.0% 20.0% 26.7% 73.3%
Grade 9 14.7% 20.6% 35.3% 64.7%
Grade 12 0.0% 22.2% 33.3% 66.7%
Marijuana
All 7.6% 20.1% 31.5% 68.5%
Grade 8 6.9% 17.2% 24.1% 75.9%
Grade 9 12.1% 21.2% 36.4% 63.6%
Grade 12 0.0% 22.2% 33.3% 66.7%
Marijuana Only
All 6.3% 12.4% 18.5% 81.5%
Grade 8 3.3% 6.7% 13.3% 86.7%
Grade 9 11.8% 11.8% 20.6% 79.4%
Grade 12 0.0% 22.2% 22.2% 77.8%
Cocaine or Crack
All 0.0% 0.0% 2.5% 97.5%
Grade 8 0.0% 0.0% 0.0% 100.0%
Grade 9 0.0% 0.0% 0.0% 100.0%
Grade 12 0.0% 0.0% 11.1% 88.9%
Cocaine
All 0.0% 0.0% 2.6% 97.4%
Grade 8 0.0% 0.0% 0.0% 100.0%
Grade 9 0.0% 0.0% 0.0% 100.0%
Grade 12 0.0% 0.0% 11.1% 88.9%Crack
All 0.0% 0.0% 0.0% 100.0%
Grade 8 0.0% 0.0% 0.0% 100.0%
Grade 9 0.0% 0.0% 0.0% 100.0%
Grade 12 0.0% 0.0% 0.0% 100.0%
©Copyright 2010, Texas A&M University
All rights reserved.
Secondary Report-Page 63 of 90

8/7/2019 MATAGORDA COUNTY - Palacios ISD - 2010 Texas School Survey of Drug and Alcohol Use
http://slidepdf.com/reader/full/matagorda-county-palacios-isd-2010-texas-school-survey-of-drug-and-alcohol 64/90
Palacios
SPRING 2010
Table B10: Prevalence and recency of use of selected substances by gradeStudents not living with two parents(Continued)
Past
Month
School
Year
Ever
Used
Never
Used
Hallucinogens
All 0.0% 2.5% 6.4% 93.6%
Grade 8 0.0% 3.6% 7.1% 92.9%
Grade 9 0.0% 3.1% 9.4% 90.6%
Grade 12 0.0% 0.0% 0.0% 100.0%
Uppers
All 0.0% 0.0% 1.2% 98.8%
Grade 8 0.0% 0.0% 3.7% 96.3%
Grade 9 0.0% 0.0% 0.0% 100.0%
Grade 12 0.0% 0.0% 0.0% 100.0%
Downers
All 2.5% 3.9% 5.2% 94.8%
Grade 8 7.4% 7.4% 11.1% 88.9%
Grade 9 0.0% 3.2% 3.2% 96.8%
Grade 12 0.0% 0.0% 0.0% 100.0%
Rohypnol
All 0.0% 2.5% 3.9% 96.1%
Grade 8 0.0% 3.4% 3.4% 96.6%
Grade 9 0.0% 3.2% 6.5% 93.5%
Grade 12 0.0% 0.0% 0.0% 100.0%
Steroids
All 1.3% 1.3% 1.3% 98.7%
Grade 8 0.0% 0.0% 0.0% 100.0%
Grade 9 3.0% 3.0% 3.0% 97.0%
Grade 12 0.0% 0.0% 0.0% 100.0%
Ecstasy
All 1.3% 3.7% 3.7% 96.3%Grade 8 0.0% 6.9% 6.9% 93.1%
Grade 9 3.1% 3.1% 3.1% 96.9%
Grade 12 0.0% 0.0% 0.0% 100.0%
Heroin
All 0.0% 0.0% 0.0% 100.0%
Grade 8 0.0% 0.0% 0.0% 100.0%
Grade 9 0.0% 0.0% 0.0% 100.0%
Grade 12 0.0% 0.0% 0.0% 100.0%
©Copyright 2010, Texas A&M University
All rights reserved.
Secondary Report-Page 64 of 90

8/7/2019 MATAGORDA COUNTY - Palacios ISD - 2010 Texas School Survey of Drug and Alcohol Use
http://slidepdf.com/reader/full/matagorda-county-palacios-isd-2010-texas-school-survey-of-drug-and-alcohol 65/90
Palacios
SPRING 2010
Table B11: Prevalence and recency of use of selected substances by gradeStudents would seek help from adults for substance abuse problems
Past
Month
School
Year
Ever
Used
Never
Used
Tobacco
All 6.1% 10.0% 24.9% 75.1%
Grade 8 2.6% 5.1% 21.8% 78.2%Grade 9 3.4% 10.2% 27.3% 72.7%
Grade 12 16.7% 16.7% 25.0% 75.0%
Alcohol
All 24.8% 37.5% 63.3% 36.7%
Grade 8 21.5% 30.4% 63.3% 36.7%
Grade 9 27.3% 45.5% 68.2% 31.8%
Grade 12 25.0% 33.3% 54.2% 45.8%
Inhalants
All 4.1% 6.8% 17.9% 82.1%
Grade 8 6.3% 11.4% 25.3% 74.7%
Grade 9 2.3% 4.5% 17.0% 83.0%
Grade 12 4.2% 4.2% 8.3% 91.7%
Any Illicit Drug
All 4.7% 6.5% 11.8% 88.2%
Grade 8 3.8% 6.3% 7.6% 92.4%
Grade 9 5.7% 8.0% 14.8% 85.2%
Grade 12 4.2% 4.2% 12.5% 87.5%
Marijuana
All 4.4% 6.7% 12.1% 87.9%
Grade 8 2.5% 6.3% 7.6% 92.4%
Grade 9 6.0% 8.4% 15.7% 84.3%
Grade 12 4.2% 4.2% 12.5% 87.5%
Marijuana Only
All 3.8% 3.8% 7.6% 92.4%
Grade 8 2.5% 2.5% 3.8% 96.2%
Grade 9 4.5% 4.5% 8.0% 92.0%
Grade 12 4.2% 4.2% 12.5% 87.5%
Cocaine or Crack
All 0.0% 0.0% 0.4% 99.6%
Grade 8 0.0% 0.0% 1.3% 98.7%
Grade 9 0.0% 0.0% 0.0% 100.0%
Grade 12 0.0% 0.0% 0.0% 100.0%
Cocaine
All 0.0% 0.0% 0.5% 99.5%
Grade 8 0.0% 0.0% 1.3% 98.7%
Grade 9 0.0% 0.0% 0.0% 100.0%
Grade 12 0.0% 0.0% 0.0% 100.0%Crack
All 0.0% 0.0% 0.0% 100.0%
Grade 8 0.0% 0.0% 0.0% 100.0%
Grade 9 0.0% 0.0% 0.0% 100.0%
Grade 12 0.0% 0.0% 0.0% 100.0%
©Copyright 2010, Texas A&M University
All rights reserved.
Secondary Report-Page 65 of 90

8/7/2019 MATAGORDA COUNTY - Palacios ISD - 2010 Texas School Survey of Drug and Alcohol Use
http://slidepdf.com/reader/full/matagorda-county-palacios-isd-2010-texas-school-survey-of-drug-and-alcohol 66/90
Palacios
SPRING 2010
Table B11: Prevalence and recency of use of selected substances by gradeStudents would seek help from adults for substance abuse problems(Continued)
Past
Month
School
Year
Ever
Used
Never
Used
Hallucinogens
All 0.0% 0.5% 2.0% 98.0%
Grade 8 0.0% 0.0% 1.3% 98.7%
Grade 9 0.0% 1.2% 3.7% 96.3%
Grade 12 0.0% 0.0% 0.0% 100.0%
Uppers
All 0.0% 0.0% 0.5% 99.5%
Grade 8 0.0% 0.0% 1.3% 98.7%
Grade 9 0.0% 0.0% 0.0% 100.0%
Grade 12 0.0% 0.0% 0.0% 100.0%
Downers
All 0.5% 1.0% 1.4% 98.6%
Grade 8 1.3% 1.3% 2.6% 97.4%
Grade 9 0.0% 1.2% 1.2% 98.8%
Grade 12 0.0% 0.0% 0.0% 100.0%
Rohypnol
All 0.0% 1.0% 2.0% 98.0%
Grade 8 0.0% 1.3% 1.3% 98.7%
Grade 9 0.0% 1.2% 3.7% 96.3%
Grade 12 0.0% 0.0% 0.0% 100.0%
Steroids
All 1.5% 1.5% 1.5% 98.5%
Grade 8 0.0% 0.0% 0.0% 100.0%
Grade 9 1.2% 1.2% 1.2% 98.8%
Grade 12 4.3% 4.3% 4.3% 95.7%
Ecstasy
All 0.0% 0.0% 0.5% 99.5%Grade 8 0.0% 0.0% 0.0% 100.0%
Grade 9 0.0% 0.0% 1.2% 98.8%
Grade 12 0.0% 0.0% 0.0% 100.0%
Heroin
All 0.0% 0.0% 0.0% 100.0%
Grade 8 0.0% 0.0% 0.0% 100.0%
Grade 9 0.0% 0.0% 0.0% 100.0%
Grade 12 0.0% 0.0% 0.0% 100.0%
©Copyright 2010, Texas A&M University
All rights reserved.
Secondary Report-Page 66 of 90

8/7/2019 MATAGORDA COUNTY - Palacios ISD - 2010 Texas School Survey of Drug and Alcohol Use
http://slidepdf.com/reader/full/matagorda-county-palacios-isd-2010-texas-school-survey-of-drug-and-alcohol 67/90
Palacios
SPRING 2010
Table B12: Prevalence and recency of use of selected substances by gradeStudents would not seek help from adults for substance abuse problems
Past
Month
School
Year
Ever
Used
Never
Used
Tobacco
All 22.3% 32.9% 44.8% 55.2%
Grade 8 27.8% 27.8% 44.4% 55.6%Grade 9 22.2% 33.3% 44.4% 55.6%
Grade 12 18.2% 36.4% 45.5% 54.5%
Alcohol
All 48.1% 74.3% 91.3% 8.7%
Grade 8 50.0% 66.7% 94.4% 5.6%
Grade 9 38.9% 72.2% 88.9% 11.1%
Grade 12 54.5% 81.8% 90.9% 9.1%
Inhalants
All 8.2% 11.4% 34.8% 65.2%
Grade 8 29.4% 41.2% 52.9% 47.1%
Grade 9 0.0% 0.0% 50.0% 50.0%
Grade 12 0.0% 0.0% 9.1% 90.9%
Any Illicit Drug
All 15.6% 25.8% 41.6% 58.4%
Grade 8 16.7% 27.8% 33.3% 66.7%
Grade 9 22.2% 22.2% 44.4% 55.6%
Grade 12 9.1% 27.3% 45.5% 54.5%
Marijuana
All 11.9% 24.0% 40.0% 60.0%
Grade 8 16.7% 27.8% 27.8% 72.2%
Grade 9 11.1% 16.7% 44.4% 55.6%
Grade 12 9.1% 27.3% 45.5% 54.5%
Marijuana Only
All 3.4% 13.6% 24.4% 75.6%
Grade 8 5.6% 16.7% 16.7% 83.3%
Grade 9 5.6% 5.6% 27.8% 72.2%
Grade 12 0.0% 18.2% 27.3% 72.7%
Cocaine or Crack
All 1.6% 1.6% 6.7% 93.3%
Grade 8 5.6% 5.6% 11.1% 88.9%
Grade 9 0.0% 0.0% 0.0% 100.0%
Grade 12 0.0% 0.0% 9.1% 90.9%
Cocaine
All 1.7% 1.7% 5.3% 94.7%
Grade 8 5.6% 5.6% 5.6% 94.4%
Grade 9 0.0% 0.0% 0.0% 100.0%
Grade 12 0.0% 0.0% 9.1% 90.9%Crack
All 0.0% 0.0% 1.6% 98.4%
Grade 8 0.0% 0.0% 5.6% 94.4%
Grade 9 0.0% 0.0% 0.0% 100.0%
Grade 12 0.0% 0.0% 0.0% 100.0%
©Copyright 2010, Texas A&M University
All rights reserved.
Secondary Report-Page 67 of 90

8/7/2019 MATAGORDA COUNTY - Palacios ISD - 2010 Texas School Survey of Drug and Alcohol Use
http://slidepdf.com/reader/full/matagorda-county-palacios-isd-2010-texas-school-survey-of-drug-and-alcohol 68/90
Palacios
SPRING 2010
Table B12: Prevalence and recency of use of selected substances by gradeStudents would not seek help from adults for substance abuse problems(Continued)
Past
Month
School
Year
Ever
Used
Never
Used
Hallucinogens
All 0.0% 1.7% 1.7% 98.3%
Grade 8 0.0% 5.9% 5.9% 94.1%
Grade 9 0.0% 0.0% 0.0% 100.0%
Grade 12 0.0% 0.0% 0.0% 100.0%
Uppers
All 0.0% 0.0% 0.0% 100.0%
Grade 8 0.0% 0.0% 0.0% 100.0%
Grade 9 0.0% 0.0% 0.0% 100.0%
Grade 12 0.0% 0.0% 0.0% 100.0%
Downers
All 3.6% 5.5% 5.5% 94.5%
Grade 8 5.9% 5.9% 5.9% 94.1%
Grade 9 6.3% 12.5% 12.5% 87.5%
Grade 12 0.0% 0.0% 0.0% 100.0%
Rohypnol
All 0.0% 0.0% 0.0% 100.0%
Grade 8 0.0% 0.0% 0.0% 100.0%
Grade 9 0.0% 0.0% 0.0% 100.0%
Grade 12 0.0% 0.0% 0.0% 100.0%
Steroids
All 0.0% 0.0% 0.0% 100.0%
Grade 8 0.0% 0.0% 0.0% 100.0%
Grade 9 0.0% 0.0% 0.0% 100.0%
Grade 12 0.0% 0.0% 0.0% 100.0%
Ecstasy
All 5.4% 7.0% 7.0% 93.0%Grade 8 0.0% 5.6% 5.6% 94.4%
Grade 9 5.9% 5.9% 5.9% 94.1%
Grade 12 9.1% 9.1% 9.1% 90.9%
Heroin
All 0.0% 0.0% 0.0% 100.0%
Grade 8 0.0% 0.0% 0.0% 100.0%
Grade 9 0.0% 0.0% 0.0% 100.0%
Grade 12 0.0% 0.0% 0.0% 100.0%
©Copyright 2010, Texas A&M University
All rights reserved.
Secondary Report-Page 68 of 90

8/7/2019 MATAGORDA COUNTY - Palacios ISD - 2010 Texas School Survey of Drug and Alcohol Use
http://slidepdf.com/reader/full/matagorda-county-palacios-isd-2010-texas-school-survey-of-drug-and-alcohol 69/90
Palacios
SPRING 2010
Table B13: Prevalence and recency of use of selected substances by gradeStudents living in town three years or less
Past
Month
School
Year
Ever
Used
Never
Used
Tobacco
All 16.4% 20.9% 40.0% 60.0%
Grade 8 19.0% 28.6% 47.6% 52.4%Grade 9 5.9% 5.9% 29.4% 70.6%
Grade 12 * * * *
Alcohol
All 46.7% 57.9% 74.2% 25.8%
Grade 8 40.9% 59.1% 77.3% 22.7%
Grade 9 41.2% 47.1% 64.7% 35.3%
Grade 12 * * * *
Inhalants
All 13.5% 17.9% 31.6% 68.4%
Grade 8 22.7% 31.8% 50.0% 50.0%
Grade 9 5.9% 5.9% 17.6% 82.4%
Grade 12 0.0% 0.0% 0.0% 100.0%
Any Illicit Drug
All 2.2% 8.8% 25.4% 74.6%
Grade 8 4.5% 18.2% 27.3% 72.7%
Grade 9 0.0% 0.0% 17.6% 82.4%
Grade 12 * * * *
Marijuana
All 2.3% 9.0% 23.8% 76.2%
Grade 8 4.5% 18.2% 22.7% 77.3%
Grade 9 0.0% 0.0% 18.8% 81.3%
Grade 12 * * * *
Marijuana Only
All 2.2% 6.6% 11.3% 88.7%
Grade 8 4.5% 13.6% 18.2% 81.8%
Grade 9 0.0% 0.0% 5.9% 94.1%
Grade 12 0.0% 0.0% 0.0% 100.0%
Cocaine or Crack
All 0.0% 0.0% 9.4% 90.6%
Grade 8 0.0% 0.0% 9.1% 90.9%
Grade 9 0.0% 0.0% 0.0% 100.0%
Grade 12 * * * *
Cocaine
All 0.0% 0.0% 7.2% 92.8%
Grade 8 0.0% 0.0% 4.5% 95.5%
Grade 9 0.0% 0.0% 0.0% 100.0%
Grade 12 * * * *Crack
All 0.0% 0.0% 2.4% 97.6%
Grade 8 0.0% 0.0% 4.5% 95.5%
Grade 9 0.0% 0.0% 0.0% 100.0%
Grade 12 0.0% 0.0% 0.0% 100.0%
©Copyright 2010, Texas A&M University
All rights reserved.
Secondary Report-Page 69 of 90

8/7/2019 MATAGORDA COUNTY - Palacios ISD - 2010 Texas School Survey of Drug and Alcohol Use
http://slidepdf.com/reader/full/matagorda-county-palacios-isd-2010-texas-school-survey-of-drug-and-alcohol 70/90
Palacios
SPRING 2010
Table B13: Prevalence and recency of use of selected substances by gradeStudents living in town three years or less(Continued)
Past
Month
School
Year
Ever
Used
Never
Used
Hallucinogens
All 0.0% 0.0% 5.1% 94.9%
Grade 8 0.0% 0.0% 0.0% 100.0%
Grade 9 0.0% 0.0% 12.5% 87.5%
Grade 12 0.0% 0.0% 0.0% 100.0%
Uppers
All 0.0% 0.0% 0.0% 100.0%
Grade 8 0.0% 0.0% 0.0% 100.0%
Grade 9 0.0% 0.0% 0.0% 100.0%
Grade 12 0.0% 0.0% 0.0% 100.0%
Downers
All 0.0% 0.0% 0.0% 100.0%
Grade 8 0.0% 0.0% 0.0% 100.0%
Grade 9 0.0% 0.0% 0.0% 100.0%
Grade 12 0.0% 0.0% 0.0% 100.0%
Rohypnol
All 0.0% 0.0% 2.5% 97.5%
Grade 8 0.0% 0.0% 0.0% 100.0%
Grade 9 0.0% 0.0% 6.3% 93.8%
Grade 12 0.0% 0.0% 0.0% 100.0%
Steroids
All 2.5% 2.5% 2.5% 97.5%
Grade 8 0.0% 0.0% 0.0% 100.0%
Grade 9 6.3% 6.3% 6.3% 93.8%
Grade 12 0.0% 0.0% 0.0% 100.0%
Ecstasy
All 0.0% 0.0% 0.0% 100.0%Grade 8 0.0% 0.0% 0.0% 100.0%
Grade 9 0.0% 0.0% 0.0% 100.0%
Grade 12 0.0% 0.0% 0.0% 100.0%
Heroin
All 0.0% 0.0% 0.0% 100.0%
Grade 8 0.0% 0.0% 0.0% 100.0%
Grade 9 0.0% 0.0% 0.0% 100.0%
Grade 12 0.0% 0.0% 0.0% 100.0%
©Copyright 2010, Texas A&M University
All rights reserved.
Secondary Report-Page 70 of 90

8/7/2019 MATAGORDA COUNTY - Palacios ISD - 2010 Texas School Survey of Drug and Alcohol Use
http://slidepdf.com/reader/full/matagorda-county-palacios-isd-2010-texas-school-survey-of-drug-and-alcohol 71/90
Palacios
SPRING 2010
Table B14: Prevalence and recency of use of selected substances by gradeStudents living in town more than three years
Past
Month
School
Year
Ever
Used
Never
Used
Tobacco
All 9.2% 15.5% 28.1% 71.9%
Grade 8 4.1% 5.5% 20.5% 79.5%Grade 9 6.9% 17.2% 31.0% 69.0%
Grade 12 17.1% 22.9% 31.4% 68.6%
Alcohol
All 27.5% 44.8% 69.3% 30.7%
Grade 8 23.3% 31.5% 65.8% 34.2%
Grade 9 27.6% 51.7% 74.7% 25.3%
Grade 12 31.4% 48.6% 65.7% 34.3%
Inhalants
All 3.0% 5.9% 19.1% 80.9%
Grade 8 5.6% 12.5% 25.0% 75.0%
Grade 9 1.1% 3.4% 23.0% 77.0%
Grade 12 2.9% 2.9% 8.6% 91.4%
Any Illicit Drug
All 7.5% 11.8% 18.9% 81.1%
Grade 8 5.5% 8.2% 11.0% 89.0%
Grade 9 10.3% 12.6% 21.8% 78.2%
Grade 12 5.7% 14.3% 22.9% 77.1%
Marijuana
All 6.3% 11.2% 18.9% 81.1%
Grade 8 4.2% 6.9% 9.7% 90.3%
Grade 9 8.3% 11.9% 22.6% 77.4%
Grade 12 5.7% 14.3% 22.9% 77.1%
Marijuana Only
All 4.0% 6.6% 12.8% 87.2%
Grade 8 2.7% 2.7% 5.5% 94.5%
Grade 9 5.7% 5.7% 12.6% 87.4%
Grade 12 2.9% 11.4% 20.0% 80.0%
Cocaine or Crack
All 0.0% 0.0% 0.0% 100.0%
Grade 8 0.0% 0.0% 0.0% 100.0%
Grade 9 0.0% 0.0% 0.0% 100.0%
Grade 12 0.0% 0.0% 0.0% 100.0%
Cocaine
All 0.0% 0.0% 0.0% 100.0%
Grade 8 0.0% 0.0% 0.0% 100.0%
Grade 9 0.0% 0.0% 0.0% 100.0%
Grade 12 0.0% 0.0% 0.0% 100.0%Crack
All 0.0% 0.0% 0.0% 100.0%
Grade 8 0.0% 0.0% 0.0% 100.0%
Grade 9 0.0% 0.0% 0.0% 100.0%
Grade 12 0.0% 0.0% 0.0% 100.0%
©Copyright 2010, Texas A&M University
All rights reserved.
Secondary Report-Page 71 of 90

8/7/2019 MATAGORDA COUNTY - Palacios ISD - 2010 Texas School Survey of Drug and Alcohol Use
http://slidepdf.com/reader/full/matagorda-county-palacios-isd-2010-texas-school-survey-of-drug-and-alcohol 72/90
Palacios
SPRING 2010
Table B14: Prevalence and recency of use of selected substances by gradeStudents living in town more than three years(Continued)
Past
Month
School
Year
Ever
Used
Never
Used
Hallucinogens
All 0.0% 0.9% 1.3% 98.7%
Grade 8 0.0% 1.4% 2.9% 97.1%
Grade 9 0.0% 1.2% 1.2% 98.8%
Grade 12 0.0% 0.0% 0.0% 100.0%
Uppers
All 0.0% 0.0% 0.4% 99.6%
Grade 8 0.0% 0.0% 1.4% 98.6%
Grade 9 0.0% 0.0% 0.0% 100.0%
Grade 12 0.0% 0.0% 0.0% 100.0%
Downers
All 1.3% 2.3% 2.7% 97.3%
Grade 8 2.9% 2.9% 4.3% 95.7%
Grade 9 1.2% 3.6% 3.6% 96.4%
Grade 12 0.0% 0.0% 0.0% 100.0%
Rohypnol
All 0.0% 0.9% 1.4% 98.6%
Grade 8 0.0% 1.4% 1.4% 98.6%
Grade 9 0.0% 1.2% 2.5% 97.5%
Grade 12 0.0% 0.0% 0.0% 100.0%
Steroids
All 0.9% 0.9% 0.9% 99.1%
Grade 8 0.0% 0.0% 0.0% 100.0%
Grade 9 0.0% 0.0% 0.0% 100.0%
Grade 12 2.9% 2.9% 2.9% 97.1%
Ecstasy
All 1.4% 2.2% 3.2% 96.8%Grade 8 0.0% 2.8% 2.8% 97.2%
Grade 9 1.2% 1.2% 3.7% 96.3%
Grade 12 2.9% 2.9% 2.9% 97.1%
Heroin
All 0.0% 0.0% 0.0% 100.0%
Grade 8 0.0% 0.0% 0.0% 100.0%
Grade 9 0.0% 0.0% 0.0% 100.0%
Grade 12 0.0% 0.0% 0.0% 100.0%
©Copyright 2010, Texas A&M University
All rights reserved.
Secondary Report-Page 72 of 90

8/7/2019 MATAGORDA COUNTY - Palacios ISD - 2010 Texas School Survey of Drug and Alcohol Use
http://slidepdf.com/reader/full/matagorda-county-palacios-isd-2010-texas-school-survey-of-drug-and-alcohol 73/90
Palacios
SPRING 2010
3. Margin Tables
©Copyright 2010, Texas A&M University
All rights reserved.
Secondary Report-Page 73 of 90
8/7/2019 MATAGORDA COUNTY - Palacios ISD - 2010 Texas School Survey of Drug and Alcohol Use
http://slidepdf.com/reader/full/matagorda-county-palacios-isd-2010-texas-school-survey-of-drug-and-alcohol 74/90
Palacios
SPRING 2010
©Copyright 2010, Texas A&M University
All rights reserved.
Secondary Report-Page 74 of 90

8/7/2019 MATAGORDA COUNTY - Palacios ISD - 2010 Texas School Survey of Drug and Alcohol Use
http://slidepdf.com/reader/full/matagorda-county-palacios-isd-2010-texas-school-survey-of-drug-and-alcohol 75/90
Palacios
Spring 2010
The FREQ Procedure
GENDER
q1 Frequency Percent
Female 121 49.55
Male 123 50.45
Frequency Missing = 0.8109520629
GRADE
q2 Frequency Percent
Grade 8 82 33.43
Grade 9 98 39.88
Grade 12 65 26.69
LIVE WITH BOTH
PARENTS
q3 Frequency PercentNo 71 29.19
Yes 173 70.81
Frequency Missing = 0.8109520629
AGE
q4 Frequency Percent
12 1 0.38
13 29 11.75
14 85 35.14
15 52 21.3916 9 3.71
17 31 12.72
18 33 13.45
19 or older 4 1.45
Frequency Missing = 1.7241540253
ETHNICITY
q5 Frequency Percent
African/American 12 4.96
Asian/American 32 13.17Mexican/American 121 49.73
Native/American 1 0.33
Other 16 6.58
White 62 25.23
Frequency Missing = 0.9132019623
ON AVERAGE WHAT
GRADES DO YOU GET
q6 Frequency Percent
Mostly A's 84 34.72
Mostly B's 109 45.03
Mostly C's 40 16.71
Mostly D's 4 1.80
Mostly F's 4 1.73
Frequency Missing = 2.6802622778
LENGTH OF TIME IN
THIS DISTRICT
q7 Frequency Percent
<1 year 15 6.34
2-3 years 22 9.20
>4 years 200 84.46
Frequency Missing = 7.6053182647
DO YOU HAVE A
JOB
q8 Frequency Percent
No 203 84.44
Yes 37 15.56
Frequency Missing = 4.4044163031
DO YOU GET AN
ALLOWANCE
q9 Frequency Percent
No 189 78.45
Yes 52 21.55
Frequency Missing = 3.55055795
EITHER PARENT COLLEGEGRADUATE
q10 Frequency Percent
Don't Know 41 17.12
No 110 45.59
Yes 90 37.28
Frequency Missing = 3.44830805
QUALIFY FOR
FREE/REDUCED PRICE
LUNCH
q11 Frequency Percen
Don't Know 40 16.67
No 90 37.4
Yes 111 45.92
Frequency Missing = 3.44830805
PARTICIPATE IN
SCHOOL ATHLETICS
q12a Frequency Percent
No 102 45.69
Yes 121 54.31
Frequency Missing = 22.8165962
PARTICIPATE IN
SCHOOL
BAND/ORCHESTRA
q12b Frequency Percent
No 155 78.10
Yes 44 21.90
Frequency Missing = 45.9657697
PARTICIPATE IN
SCHOOL CHOIR
q12c Frequency Percent
No 169 86.56
Yes 26 13.44
Frequency Missing = 50.1227799
PARTICIPATE IN
DRAMA/SPEECH/ARTCLUBS
q12d Frequency Percent
No 122 60.88
Yes 78 39.12
The frequencies have been weighted so that the analysis reflects
the distribution of students by grade level in the district
©Copyright 2010, Texas A&M University
All rights reserved.
Page 75 of 90

8/7/2019 MATAGORDA COUNTY - Palacios ISD - 2010 Texas School Survey of Drug and Alcohol Use
http://slidepdf.com/reader/full/matagorda-county-palacios-isd-2010-texas-school-survey-of-drug-and-alcohol 76/90
Palacios
Spring 2010
Frequency Missing = 44.848067962
PARTICIPATE IN DRILL
TEAM/CHEERLEADING
q12e Frequency Percent
No 170 86.61
Yes 26 13.39
Frequency Missing = 49.047984466
PARTICIPATE IN
STUDENT
GOVERNMENT
q12f Frequency Percent
No 187 98.11
Yes 4 1.89
Frequency Missing = 54.629446139
PARTICIPATE IN SCHOOL
NEWSPAPER/YEARBOOK
q12g Frequency Percent
No 187 96.83
Yes 6 3.17
Frequency Missing = 51.949183862
PARTICIPATE IN
ACADEMIC
CLUBS/SOCIETIES
q12h Frequency Percent
No 148 74.88
Yes 50 25.12
Frequency Missing = 47.894423547
PARTICIPATE IN
ACADEMIC
COMPETITIONGROUPS
q12i Frequency Percent
No 143 70.28
Yes 61 29.72
Frequency Missing = 41.014244765
PARTICIPATE IN
SCHOOL SERVICE
CLUBS
q12j Frequency Percent
No 181 92.76
Yes 14 7.24
Frequency Missing = 50.139217256
PARTICIPATE IN
OTHER SCHOOL
CLUBS OR GROUPS
q12k Frequency Percent
No 143 70.80
Yes 59 29.20
Frequency Missing = 42.790695267
PARTICIPATE IN
ATHLETIC TEAMS
OUTSIDE OF SCHOOL
q12l Frequency Percent
No 145 73.83
Yes 51 26.17
Frequency Missing = 48.79118819
PARTICIPATE IN
OTHER CLUBS OR
GROUPS OUTSIDE OF
SCHOOL
q12m Frequency Percent
No 155 76.72
Yes 47 23.28
Frequency Missing = 42.619711571
DO YOU FEEL SAFE IN YOU
HOM
q13a Frequency Perce
Very Safe 193 78.
Somewhat Safe 44 17.
Not Very Safe 5 1.
Not Safe At All 1 0.
Don't Know 3 1.
DO YOU FEEL SAFE IN YOU
NEIGHBORHOO
q13b Frequency Perce
Very Safe 104 42.
Somewhat Safe 107 43.
Not Very Safe 20 8.
Not Safe At All 2 0.
Don't Know 11 4.
Frequency Missing = 0.81095206
DO YOU FEEL SAFE A
SCHOO
q13c Frequency Perce
Very Safe 116 47.
Somewhat Safe 96 39.
Not Very Safe 17 6.
Not Safe At All 5 2.
Don't Know 10 4.
Frequency Missing = 0.81095206
FRIENDS FEELING
CLOSE TO THEIR
PARENTS
q14a Frequency Percent
None 19 7.76
A Few 75 30.74
Some 68 27.96
Most 71 29.20
All 11 4.34
Frequency Missing = 1.72415402
The frequencies have been weighted so that the analysis reflects
the distribution of students by grade level in the district
©Copyright 2010, Texas A&M University
All rights reserved.
Page 76 of 90

8/7/2019 MATAGORDA COUNTY - Palacios ISD - 2010 Texas School Survey of Drug and Alcohol Use
http://slidepdf.com/reader/full/matagorda-county-palacios-isd-2010-texas-school-survey-of-drug-and-alcohol 77/90
Palacios
Spring 2010
HOW MANY FRIENDS
CARRY WEAPONS
q14b Frequency Percent
None 157 65.29
A Few 52 21.52
Some 19 8.03
Most 8 3.32
All 4 1.85
Frequency Missing = 4.1999165043
HOW MANY FRIENDS
CARE ABOUT GOOD
GRADES
q14c Frequency Percent
None 13 5.38
A Few 39 16.23
Some 54 22.31
Most 99 41.24All 36 14.84
Frequency Missing = 4.3021664037
HOW MANY FRIENDS
BELONG TO A GANG
q14d Frequency Percent
None 166 69.14
A Few 48 19.86
Some 17 7.03
Most 5 2.13
All 4 1.83
Frequency Missing = 4.9679622771
FRIENDS WISHING TO
DROP OUT OF
SCHOOL
q14e Frequency Percent
None 136 56.73
A Few 67 28.05
Some 27 11.27
Most 5 2.15
All 4 1.79
Frequency Missing = 4.9679622771
PARENTS ATTEND
PTA/SCHOOL OPEN
HOUSES
q15 Frequency Percent
No 140 63.83
Yes 79 36.17
Frequency Missing = 26.152622758
RECENT INHALANT USE - SPRAY
PAINT
Q16A Frequency Percent
Never Heard/Used 228 93.79
In Your Lifetime 14 5.87
In the Past Month 1 0.33
Frequency Missing = 1.6219041259
RECENT INHALANT USE -
WHITEOUT, CORRECTION FLUID,
MAGIC MARKERS
Q16B Frequency Percent
Never Heard/Used 207 86.22
In Your Lifetime 22 8.96
Since School Began 7 2.75
In the Past Month 5 2.07
Frequency Missing = 5.1131184666
RECENT INHALANT USE -
COMPUTER DUSTING SPRAYS
Q16C Frequency Percent
Never Heard/Used 226 95.28
In Your Lifetime 5 2.20
Since School Began 2 0.73
In the Past Month 4 1.80
Frequency Missing = 7.8098180635
RECENT INHALANT USE - HEL
BUTANE, PROPANE, WHIPP
REFRIGERANTS/FR
Q16D Frequency Pe
Never Heard/Used 224
In Your Lifetime 9
Since School Began 3
In the Past Month 3
Frequency Missing = 6.83727249
RECENT INHALANT USE - GL
Q16E Frequency Per
Never Heard/Used 228 9
In Your Lifetime 8
Since School Began 1
Frequency Missing = 8.60433280
RECENT INHALANT U
TOLUENE, PAINT THINN
OTHER SOLVEN
Q16F Frequency Per
Never Heard/Used 228 9
In Your Lifetime 7
In the Past Month 2
Frequency Missing = 8.62077012
RECENT INHALANT U
GASOLINE, OCTANE BOOST
CARBURETOR CLEAN
Q16G Frequency Per
Never Heard/Used 229 9
In Your Lifetime 7
Since School Began 2
In the Past Month 2
Frequency Missing = 5.98341413
The frequencies have been weighted so that the analysis reflects
the distribution of students by grade level in the district
©Copyright 2010, Texas A&M University
All rights reserved.
Page 77 of 90

8/7/2019 MATAGORDA COUNTY - Palacios ISD - 2010 Texas School Survey of Drug and Alcohol Use
http://slidepdf.com/reader/full/matagorda-county-palacios-isd-2010-texas-school-survey-of-drug-and-alcohol 78/90
Palacios
Spring 2010
RECENT INHALANT USE - OTHER
AEROSOLS/SPRAYS
Q16H Frequency Percent
Never Heard/Used 230 95.16
In Your Lifetime 10 4.17
In the Past Month 2 0.67
Frequency Missing = 3.3460581512
RECENT CIGARETTE USE
Q17A Frequency Percent
Never Heard/Used 173 70.95
In Your Lifetime 34 13.91
Since School Began 13 5.50
In the Past Month 23 9.65
Frequency Missing = 1.6219041259
RECENT SMOKELESS TOBACCO
USE
Q17B Frequency Percent
Never Heard/Used 212 88.69
In Your Lifetime 12 5.11
Since School Began 3 1.42
In the Past Month 11 4.78
Frequency Missing = 5.9834141388
RECENT BEER USE
Q17C Frequency Percent
Never Heard/Used 96 39.70
In Your Lifetime 61 25.38
Since School Began 28 11.57
In the Past Month 56 23.34
Frequency Missing = 3.3460581512
RECENT WINE COOLER USE
Q17D Frequency Percent
Never Heard/Used 130 54.08
In Your Lifetime 40 16.66
Since School Began 32 13.28
In the Past Month 38 15.98
Frequency Missing = 5.0702121765
RECENT WINE USE
Q17E Frequency Percent
Never Heard/Used 143 62.75
In Your Lifetime 38 16.63
Since School Began 18 8.04In the Past Month 29 12.57
Frequency Missing = 16.414150871
RECENT LIQUOR USE
Q17F Frequency Percent
Never Heard/Used 113 47.01
In Your Lifetime 45 18.69
Since School Began 40 16.53
In the Past Month 43 17.78
Frequency Missing = 5.3176182654
RECENT INHALANT USE
Q17G Frequency Percent
Never Heard/Used 211 87.02
In Your Lifetime 23 9.60
Since School Began 5 2.05
In the Past Month 3 1.34
Frequency Missing = 2.5351060882
RECENT MARIJUANA USE
Q18A Frequency Percent
Never Heard/Used 193 80.58
In Your Lifetime 20 8.54
Since School Began 12 5.05
In the Past Month 14 5.83
Frequency Missing = 5.3769618747
RECENT COCAINE USE
Q18B Frequency Percent
Never Heard/Used 233 98.56
In Your Lifetime 3 1.09
In the Past Month 1 0.34
Frequency Missing = 9.0297697
RECENT CRACK U
Q18C Frequency Per
Never Heard/Used 234 9
In Your Lifetime 1
Frequency Missing = 9.8407217
RECENT HALLUCINOGEN
Q18E Frequency Per
Never Heard/Used 229 9
In Your Lifetime 3
Since School Began 2
Frequency Missing = 11.3603760
RECENT UPPER U
Q18F Frequency Per
Never Heard/Used 229 9
In Your Lifetime 1
Frequency Missing = 14.8515903
RECENT DOWNER
Q18G Frequency Per
Never Heard/Used 226 9
In Your Lifetime 1
Since School Began 2
In the Past Month 3
Frequency Missing = 14.0406382
RECENT ROHYPNOL
Q18H Frequency Per
Never Heard/Used 229 9
In Your Lifetime 2
Since School Began 2
Frequency Missing = 12.4187341
The frequencies have been weighted so that the analysis reflects
the distribution of students by grade level in the district
©Copyright 2010, Texas A&M University
All rights reserved.
Page 78 of 90

8/7/2019 MATAGORDA COUNTY - Palacios ISD - 2010 Texas School Survey of Drug and Alcohol Use
http://slidepdf.com/reader/full/matagorda-county-palacios-isd-2010-texas-school-survey-of-drug-and-alcohol 79/90
Palacios
Spring 2010
RECENT STEROID USE
Q18I Frequency Percent
Never Heard/Used 231 98.85
In the Past Month 3 1.15
Frequency Missing = 11.403282304
RECENT ECSTASY USE
Q18J Frequency Percent
Never Heard/Used 229 97.39
In Your Lifetime 2 0.78
Since School Began 2 0.69
In the Past Month 3 1.14
Frequency Missing = 9.7813781777
RECENT HEROIN USE
Q18K Frequency Percent
Never Heard/Used 233 100.00
Frequency Missing = 11.505532203
TOBACCO USE IN PAST MONTH
q19a Frequency Percent
Never Heard/Used 210 86.91
1-2 times 12 5.11
3-10 times 14 5.80
11+ times 5 2.18
Frequency Missing = 3.3460581512
ALCOHOL USE IN PAST MONTH
q19b Frequency Percent
Never Heard/Used 148 61.24
1-2 times 55 22.80
3-10 times 28 11.69
11+ times 10 4.27
Frequency Missing = 3.3460581512
INHALANT USE IN PAST MONTH
q19c Frequency Percent
Never Heard/Used 224 93.37
1-2 times 14 5.96
3-10 times 1 0.34
11+ times 1 0.34
Frequency Missing = 4.9679622771
MARIJUANA USE IN PAST
MONTH
q19d Frequency Percent
Never Heard/Used 211 87.71
1-2 times 17 7.22
3-10 times 8 3.26
11+ times 4 1.81
Frequency Missing = 4.2592601135
COCAINE USE IN PAST MONTH
q19e Frequency Percent
Never Heard/Used 240 99.66
3-10 times 1 0.34
Frequency Missing = 4.2592601135
CRACK USE IN PAST MONTH
q19f Frequency Percent
Never Heard/Used 242 100.00
Frequency Missing = 3.3460581512
CLOSE FRIENDS USE
CIGARETTES
q20a Frequency Percent
Never heard/None 97 40.69
A few 84 35.28
Some 41 17.41
Most 12 5.12
All 4 1.49
Frequency Missing = 7.7075681641
CLOSE FRIENDS U
SMOKELESS TOBAC
q20b Frequency Perc
Never heard/None 138 59
A few 49 2
Some 32 13
Most 10 4
All 4
Frequency Missing = 12.1713280
CLOSE FRIENDS USE BE
q20c Frequency Perc
Never heard/None 45 19
A few 61 26
Some 56 23
Most 50 2
All 22 9
Frequency Missing = 11.3010324
CLOSE FRIENDS USE WI
COOLE
q20d Frequency Perc
Never heard/None 90 3
A few 55 23
Some 47 19
Most 34 14
All 10 4
Frequency Missing = 9.43172218
CLOSE FRIENDS USE WI
q20e Frequency Perc
Never heard/None 113 4
A few 64 27
Some 33 14
Most 15 6
All 7 3
Frequency Missing = 12.922936
The frequencies have been weighted so that the analysis reflects
the distribution of students by grade level in the district
©Copyright 2010, Texas A&M University
All rights reserved.
Page 79 of 90

8/7/2019 MATAGORDA COUNTY - Palacios ISD - 2010 Texas School Survey of Drug and Alcohol Use
http://slidepdf.com/reader/full/matagorda-county-palacios-isd-2010-texas-school-survey-of-drug-and-alcohol 80/90
Palacios
Spring 2010
CLOSE FRIENDS USE LIQUOR
q20f Frequency Percent
Never heard/None 72 30.35
A few 55 23.11
Some 47 19.75
Most 43 18.01
All 21 8.78
Frequency Missing = 6.7943662018
CLOSE FRIENDS USE INHALANTS
q20g Frequency Percent
Never heard/None 179 75.02
A few 41 17.37
Some 15 6.14
Most 2 0.72
All 2 0.74
Frequency Missing = 6.9988660006
CLOSE FRIENDS USE
MARIJUANA
q20h Frequency Percent
Never heard/None 128 53.65
A few 51 21.29
Some 24 10.26
Most 26 11.10
All 9 3.70
Frequency Missing = 6.8372724919
DIFFICULT TO GET
CIGARETTES
q21a Frequency Percent
Never heard of 43 18.12
Impossible 49 20.67
Very difficult 12 5.02
Somewhat diff 25 10.44
Somewhat easy 26 11.12
Very easy 82 34.64
Frequency Missing = 9.6362219882
DIFFICULT TO GET
SMOKELESS TOBACCO
q21b Frequency Percent
Never heard of 55 23.80
Impossible 59 25.67
Very difficult 17 7.38
Somewhat diff 21 9.13
Somewhat easy 22 9.73Very easy 56 24.29
Frequency Missing = 14.851590354
DIFFICULT TO GET BEER
q21c Frequency Percent
Never heard of 26 11.29
Impossible 38 16.53
Very difficult 10 4.11
Somewhat diff 21 8.95
Somewhat easy 58 24.88Very easy 79 34.25
Frequency Missing = 13.02518643
DIFFICULT TO GET WINE
COOLERS
q21d Frequency Percent
Never heard of 41 17.25
Impossible 46 19.45
Very difficult 14 5.88
Somewhat diff 27 11.45Somewhat easy 38 16.04
Very easy 70 29.93
Frequency Missing = 9.7384718876
DIFFICULT TO GET WINE
q21e Frequency Percent
Never heard of 35 14.95
Impossible 41 17.70
Very difficult 18 7.54
Somewhat diff 38 16.31Somewhat easy 35 14.97
Very easy 67 28.52
Frequency Missing = 10.549423951
DIFFICULT TO GET LIQUO
q21f Frequency Perce
Never heard of 34 14.
Impossible 46 19.
Very difficult 18 7.
Somewhat diff 25 10.
Somewhat easy 45 18.Very easy 68 29.
Frequency Missing = 9.63622198
DIFFICULT TO GE
INHALANT
q21g Frequency Perce
Never heard of 68 29.
Impossible 39 17.
Very difficult 9 3.
Somewhat diff 15 6.Somewhat easy 21 9.
Very easy 76 33.
Frequency Missing = 16.8824940
DIFFICULT TO GE
MARIJUAN
q21h Frequency Perce
Never heard of 46 20.
Impossible 71 31.
Very difficult 22 9.Somewhat diff 23 9.
Somewhat easy 18 8.
Very easy 48 21.
Frequency Missing = 17.6770088
DIFFICULT TO GET COCAIN
q21i Frequency Perce
Never heard of 66 29.
Impossible 91 40.
Very difficult 27 11.Somewhat diff 17 7.
Somewhat easy 7 2.
Very easy 19 8.
Frequency Missing = 17.5747589
The frequencies have been weighted so that the analysis reflects
the distribution of students by grade level in the district
©Copyright 2010, Texas A&M University
All rights reserved.
Page 80 of 90

8/7/2019 MATAGORDA COUNTY - Palacios ISD - 2010 Texas School Survey of Drug and Alcohol Use
http://slidepdf.com/reader/full/matagorda-county-palacios-isd-2010-texas-school-survey-of-drug-and-alcohol 81/90
Palacios
Spring 2010
DIFFICULT TO GET CRACK
q21j Frequency Percent
Never heard of 66 29.04
Impossible 90 39.23
Very difficult 30 12.92
Somewhat diff 19 8.30Somewhat easy 4 1.78
Very easy 20 8.73
Frequency Missing = 16.66155696
DIFFICULT TO GET
HALLUCINOGENS
q21l Frequency Percent
Never heard of 97 42.35
Impossible 70 30.50
Very difficult 28 12.31Somewhat diff 13 5.75
Somewhat easy 9 3.76
Very easy 12 5.33
Frequency Missing = 16.114448305
DIFFICULT TO GET UPPERS
q21m Frequency Percent
Never heard of 121 54.24
Impossible 56 25.17
Very difficult 14 6.09Somewhat diff 13 5.97
Somewhat easy 6 2.69
Very easy 13 5.83
Frequency Missing = 21.286910381
DIFFICULT TO GET DOWNERS
q21n Frequency Percent
Never heard of 119 53.48
Impossible 54 24.26
Very difficult 18 8.13Somewhat diff 12 5.55
Somewhat easy 4 1.89
Very easy 15 6.69
Frequency Missing = 22.704314708
DIFFICULT TO GET
ROHYPNOL
q21o Frequency Percent
Never heard of 114 50.26
Impossible 67 29.43
Very difficult 16 6.88
Somewhat diff 11 4.65
Somewhat easy 7 3.04
Very easy 13 5.74
Frequency Missing = 17.488946342
DIFFICULT TO GET STEROIDS
q21p Frequency Percent
Never heard of 67 29.57
Impossible 102 44.92
Very difficult 24 10.69Somewhat diff 14 6.07
Somewhat easy 9 3.76
Very easy 11 4.99
Frequency Missing = 18.197648505
DIFFICULT TO GET ECSTASY
q21q Frequency Percent
Never heard of 81 35.75
Impossible 80 35.43
Very difficult 14 6.08Somewhat diff 22 9.97
Somewhat easy 11 5.01
Very easy 17 7.76
Frequency Missing = 19.417600166
DIFFICULT TO GET HEROIN
q21r Frequency Percent
Never heard of 81 35.96
Impossible 84 37.32
Very difficult 24 10.67Somewhat diff 12 5.46
Somewhat easy 12 5.30
Very easy 12 5.29
Frequency Missing = 19.562756355
AGE WHEN FIRST USED
CIGARETTE
q22a Frequency Percen
9 or younger 11 15.1
10 years old 12 16.9
11 years old 3 4.6
12 years old 6 8.5
13 years old 13 17.9
14 years old 5 7.3
15 years old 11 14.8
16 years old 7 9.7
17 years old 4 4.8
Frequency Missing = 172.531951
AGE WHEN FIRST USED
SMOKELESS TOBACCO
q22b Frequency Percen
9 or younger 3 12.3
10 years old 4 16.8
11 years old 1 3.4
12 years old 4 13.8
13 years old 4 16.1
14 years old 3 10.4
15 years old 4 13.4
17 years old 2 6.7
18 or older 2 6.7
Frequency Missing = 218.675752
AGE WHEN FIRST USED
BEER
q22c Frequency Percen
9 or younger 30 21.0
10 years old 10 7.0
11 years old 7 4.8
12 years old 16 11.3
13 years old 33 22.8
14 years old 18 12.4
15 years old 14 9.3
16 years old 11 7.317 years old 4 2.4
18 or older 2 1.2
Frequency Missing = 100.977746
The frequencies have been weighted so that the analysis reflects
the distribution of students by grade level in the district
©Copyright 2010, Texas A&M University
All rights reserved.
Page 81 of 90

8/7/2019 MATAGORDA COUNTY - Palacios ISD - 2010 Texas School Survey of Drug and Alcohol Use
http://slidepdf.com/reader/full/matagorda-county-palacios-isd-2010-texas-school-survey-of-drug-and-alcohol 82/90
Palacios
Spring 2010
AGE WHEN FIRST USED
WINE COOLERS
q22d Frequency Percent
9 or younger 19 17.96
10 years old 5 4.62
11 years old 11 10.10
12 years old 9 8.2913 years old 20 19.12
14 years old 18 17.10
15 years old 12 11.05
16 years old 9 8.39
17 years old 2 1.68
18 or older 2 1.68
Frequency Missing = 139.73950895
AGE WHEN FIRST USED
WINEq22e Frequency Percent
9 or younger 10 10.44
10 years old 8 7.87
11 years old 7 7.03
12 years old 9 9.81
13 years old 27 28.02
14 years old 15 15.57
15 years old 12 12.11
16 years old 7 7.32
18 or older 2 1.83
Frequency Missing = 148.4102325
AGE WHEN FIRST USED
LIQUOR
q22f Frequency Percent
9 or younger 8 5.90
10 years old 3 2.71
11 years old 10 7.95
12 years old 13 10.07
13 years old 36 27.76
14 years old 26 19.98
15 years old 15 11.91
16 years old 12 9.60
17 years old 4 2.74
18 or older 2 1.37
Frequency Missing = 116.1384296
AGE WHEN FIRST USED
INHALANTS
q22g Frequency Percent
9 or younger 2 6.98
10 years old 3 9.60
11 years old 7 19.49
12 years old 7 19.32
13 years old 9 24.43
14 years old 4 12.34
15 years old 3 7.86
Frequency Missing = 210.13140435
AGE WHEN FIRST USED
MARIJUANA
q22h Frequency Percent
9 or younger 7 14.81
10 years old 2 5.15
11 years old 3 7.39
12 years old 3 5.37
13 years old 10 20.27
14 years old 10 20.79
15 years old 5 11.26
16 years old 4 7.48
18 or older 4 7.48
Frequency Missing = 197.75493501
AGE WHEN FIRST USED
COCAINE
q22i Frequency Percent
10 years old 1 33.33
12 years old 1 33.33
13 years old 1 33.33
Frequency Missing = 242.56714381
AGE WHEN FIRST
USED CRACK
q22j Frequency Percent
Frequency Missing = 245
AGE WHEN FIRST USED
HALLUCINOGENS
q22l Frequency Percen
12 years old 2 51.44
13 years old 1 22.84
15 years old 1 25.72
Frequency Missing = 241.449442
AGE WHEN FIRST USED
UPPERS
q22m Frequency Percen
10 years old 1 34.63
12 years old 1 34.63
13 years old 1 30.75
Frequency Missing = 242.362644
AGE WHEN FIRST USED
DOWNERS
q22n Frequency Percen
10 years old 2 21.79
12 years old 3 33.33
13 years old 1 10.25
14 years old 1 11.54
15 years old 2 23.08
Frequency Missing = 237.087932
AGE WHEN FIRST USED
ROHYPNOL
q22o Frequency Percen
13 years old 1 30.75
15 years old 2 69.25
Frequency Missing = 242.362644
AGE WHEN FIRST USED
STEROIDSq22p Frequency Percen
12 years old 1 100.00
Frequency Missing = 244.189047
The frequencies have been weighted so that the analysis reflects
the distribution of students by grade level in the district
©Copyright 2010, Texas A&M University
All rights reserved.
Page 82 of 90

8/7/2019 MATAGORDA COUNTY - Palacios ISD - 2010 Texas School Survey of Drug and Alcohol Use
http://slidepdf.com/reader/full/matagorda-county-palacios-isd-2010-texas-school-survey-of-drug-and-alcohol 83/90

8/7/2019 MATAGORDA COUNTY - Palacios ISD - 2010 Texas School Survey of Drug and Alcohol Use
http://slidepdf.com/reader/full/matagorda-county-palacios-isd-2010-texas-school-survey-of-drug-and-alcohol 84/90
Palacios
Spring 2010
HOW OFTEN NORMALLY
USE CRACK
q23j Frequency Percent
Never used 233 100.00
Frequency Missing = 12.154890757
HOW OFTEN NORMALLY USE
HALLUCINOGENS
q23l Frequency Percent
Several times/wk 1 0.40
About once/year 1 0.40
Never used 224 99.19
Frequency Missing = 19.256006657
HOW OFTEN NORMALLY USE
UPPERS
q23m Frequency Percent
Several times/mo 2 0.78
About once/month 1 0.36
< once/year 2 0.82
Never used 218 98.04
Frequency Missing = 22.687877389
HOW OFTEN NORMALLY USEDOWNERS
q23n Frequency Percent
Several times/mo 2 0.74
About once/month 3 1.09
About once/year 1 0.39
< once/year 3 1.18
Never used 224 96.59
Frequency Missing = 13.213248909
HOW OFTEN NORMALLY USE
ROHYPNOL
q23o Frequency Percent
Several times/wk 1 0.39
About once/month 1 0.35
< once/year 1 0.39
Never used 231 98.87
Frequency Missing = 11.301032404
HOW OFTEN NORMALLY
USE STEROIDS
q23p Frequency Percent
< once/year 1 0.35
Never used 231 99.65
Frequency Missing = 13.331936128
HOW OFTEN NORMALLY USE
ECSTASY
q23q Frequency Percent
Several times/mo 1 0.38
About once/month 2 0.74
About once/year 3 1.07
< once/year 1 0.38
Never used 232 97.42
Frequency Missing = 7.0417722907
HOW OFTEN NORMALLY USE
HEROIN
q23r Frequency Percent
About once/month 1 0.34
Never used 236 99.66
Frequency Missing = 7.7933807444
AMOUNT OF BEER AT ON
TIM
q24a Frequency Perc
Never drink this 102 43
12+ drinks 16 6
9-11 drinks 9 3
5-8 drinks 17 7
3-4 drinks 19 82 drinks 27 11
1 drink 16 6
< 1 drink 30 12
Frequency Missing = 9.47462847
AMOUNT OF WINE COOLE
AT ONE TIM
q24b Frequency Perc
Never drink this 125 53
12+ drinks 12 59-11 drinks 3 1
5-8 drinks 14 6
3-4 drinks 19 8
2 drinks 17 7
1 drink 27 11
< 1 drink 17 7
Frequency Missing = 10.4900803
AMOUNT OF WINE AT ON
TIMq24c Frequency Perc
Never drink this 141 61
12+ drinks 4 1
9-11 drinks 1 0
5-8 drinks 5 2
3-4 drinks 10 4
2 drinks 16 7
1 drink 25 10
< 1 drink 27 11
Frequency Missing = 14.0242009
The frequencies have been weighted so that the analysis reflects
the distribution of students by grade level in the district
©Copyright 2010, Texas A&M University
All rights reserved.
Page 84 of 90

8/7/2019 MATAGORDA COUNTY - Palacios ISD - 2010 Texas School Survey of Drug and Alcohol Use
http://slidepdf.com/reader/full/matagorda-county-palacios-isd-2010-texas-school-survey-of-drug-and-alcohol 85/90
Palacios
Spring 2010
AMOUNT OF LIQUOR AT ONE
TIME
q24d Frequency Percent
Never drink this 112 47.20
12+ drinks 12 5.10
9-11 drinks 6 2.63
5-8 drinks 19 7.84
3-4 drinks 22 9.232 drinks 17 7.31
1 drink 25 10.75
< 1 drink 24 9.95
Frequency Missing = 7.8527243537
HOW MANY 5+ DRINKS IN PAST
30 DAYS
q25 Frequency Percent
Never 5+ at time 90 37.44
None 85 35.331 day 19 8.07
2 days 14 5.76
3 to 5 days 16 6.86
6 to 9 days 8 3.35
10 or more days 8 3.19
Frequency Missing = 5.1131184666
GET ALCOHOLIC BEVERAGES
FROM HOME
q26a Frequency PercentDo not Drink 107 45.36
Never 65 27.71
Seldom 54 22.68
Most of the Time 7 2.87
Always 3 1.37
Frequency Missing = 8.6636764166
GET ALCOHOLIC BEVERAGES
FROM FRIENDS
q26b Frequency Percent
Do not Drink 95 40.70
Never 28 12.10
Seldom 49 21.08
Most of the Time 37 15.88
Always 24 10.25
Frequency Missing = 11.403282304
GET ALCOHOLIC BEVERAGES
FROM A STORE
q26c Frequency Percent
Do not Drink 99 41.72
Never 112 47.46
Seldom 11 4.53
Most of the Time 10 4.09
Always 5 2.21
Frequency Missing = 8.765926316
GET ALCOHOLIC BEVERAGES
AT PARTIES
q26d Frequency Percent
Do not Drink 89 37.41
Never 26 11.10
Seldom 43 17.86
Most of the Time 32 13.25
Always 49 20.38
Frequency Missing = 6.7350225925
GET ALCOHOLIC BEVERAGES
FROM OTHER SOURCES
q26e Frequency Percent
Do not Drink 100 42.47
Never 52 21.86
Seldom 36 15.38
Most of the Time 21 8.91
Always 27 11.37
Frequency Missing = 8.765926316
USE MARIJUANA AS JOIN
q27a Frequency Perc
Never 200 83
Seldom 10 4
Half the time 11 4
Most of the time 10 3
Always 9 3
Don't know 1 0
Frequency Missing = 5.11311846
USE MARIJUANA AS BLUN
q27b Frequency Perc
Never 196 82
Seldom 10 4
Half the time 13 5
Most of the time 8 3
Always 8 3
Don't know 3 1
Frequency Missing = 6.93952239
USE MARIJUANA IN BONGS O
WATER PIP
q27c Frequency Perc
Never 211 89
Seldom 13 5
Half the time 4 1
Most of the time 4 1
Always 3 1Don't know 2 0
Frequency Missing = 8.66367641
USE MARIJUANA IN PIP
q27d Frequency Perc
Never 210 87
Seldom 12 5
Half the time 5 2
Most of the time 3 1
Always 5 2
Don't know 3 1
Frequency Missing = 5.11311846
The frequencies have been weighted so that the analysis reflects
the distribution of students by grade level in the district
©Copyright 2010, Texas A&M University
All rights reserved.
Page 85 of 90

8/7/2019 MATAGORDA COUNTY - Palacios ISD - 2010 Texas School Survey of Drug and Alcohol Use
http://slidepdf.com/reader/full/matagorda-county-palacios-isd-2010-texas-school-survey-of-drug-and-alcohol 86/90
Palacios
Spring 2010
USE MARIJUANA OTHER
WAYS
q27e Frequency Percent
Never 215 89.87
Seldom 9 3.60
Half the time 4 1.83
Always 4 1.83
Don't know 7 2.88
Frequency Missing = 6.026320429
USED METHAMPHETAMINE
EVEN ONE TIME
q28 Frequency Percent
Never heard/used 238 99.62
At least once/life 1 0.38
Frequency Missing = 6.026320429
RECENT PRECRIPTION DRUG USE
- CODEINE
q29a Frequency Percent
Never heard/used 204 86.57
At least once/month 13 5.62
At least once/year 10 4.13
At least once/life 9 3.68
Frequency Missing = 9.6197846691
RECENT PRECRIPTION DRUG
USE - OXYCONTIN ETC
q29b Frequency Percent
Never heard/used 228 98.85
At least once/life 3 1.15
Frequency Missing = 14.792246745
RECENT PRECRIPTION DRUG USE
- VICODIN ETC
q29c Frequency PercentNever heard/used 218 95.35
At least once/month 3 1.20
At least once/year 1 0.40
At least once/life 7 3.05
Frequency Missing = 16.414150871
RECENT PRECRIPTION DRUG USE
- VALIUM ETC
q29d Frequency Percent
Never heard/used 222 98.83
At least once/month 1 0.41
At least once/life 2 0.77
Frequency Missing = 20.152771301
RECENT PRECRIPTION DRUG USE
- XANAX ETC
q29e Frequency Percent
Never heard/used 222 96.55
At least once/month 3 1.15
At least once/year 2 0.75
At least once/life 4 1.56
Frequency Missing = 14.732903136
TAKE DXM, TRIPLE CS, ETC. TO
GET HIGH
q30 Frequency Percent
Never heard/used 226 95.91
At least once/month 3 1.46
At least once/year 2 0.78
At least once/life 4 1.85
Frequency Missing = 9.4746284796
DANGEROUS FOR KIDS TO
USE TOBACCO
q31a Frequency Percent
Very 123 52.68
Somewhat 62 26.53
Not very 29 12.20
Not at all 8 3.35
Don't know 12 5.24
Frequency Missing = 11.241688795
DANGEROUS FOR KIDS TO
USE ALCOHOL
q31b Frequency Percen
Very 90 38.66
Somewhat 65 28.14
Not very 56 24.27
Not at all 12 5.16
Don't know 9 3.78
Frequency Missing = 13.1274363
DANGEROUS FOR KIDS TO
USE INHALANTS
q31c Frequency Percen
Very 152 68.33
Somewhat 39 17.37
Not very 18 8.04
Not at all 3 1.14
Don't know 11 5.13
Frequency Missing = 21.8340190
DANGEROUS FOR KIDS TO
USE MARIJUANA
q31d Frequency Percen
Very 150 66.79
Somewhat 26 11.45
Not very 22 9.61
Not at all 16 7.00
Don't know 12 5.15
Frequency Missing = 20.109865
DANGEROUS FOR KIDS TO
USE COCAINE
q31e Frequency Percen
Very 183 83.28
Somewhat 17 7.61
Not very 6 2.70
Not at all 1 0.37
Don't know 13 6.04
Frequency Missing = 25.3681396
The frequencies have been weighted so that the analysis reflects
the distribution of students by grade level in the district
©Copyright 2010, Texas A&M University
All rights reserved.
Page 86 of 90

8/7/2019 MATAGORDA COUNTY - Palacios ISD - 2010 Texas School Survey of Drug and Alcohol Use
http://slidepdf.com/reader/full/matagorda-county-palacios-isd-2010-texas-school-survey-of-drug-and-alcohol 87/90
Palacios
Spring 2010
DANGEROUS FOR KIDS TO
USE CRACK
q31f Frequency Percent
Very 186 85.13
Somewhat 13 6.13
Not very 4 1.92
Not at all 1 0.37
Don't know 14 6.45
Frequency Missing = 26.640387804
DANGEROUS FOR KIDS TO
USE ECSTASY
q31g Frequency Percent
Very 173 79.20
Somewhat 17 7.67
Not very 7 3.09
Not at all 3 1.21
Don't know 19 8.83
Frequency Missing = 26.947137502
DANGEROUS FOR KIDS TO
USE STEROIDS
q31h Frequency Percent
Very 174 77.73
Somewhat 27 12.11
Not very 6 2.68
Don't know 17 7.49
Frequency Missing = 21.629519237
DANGEROUS FOR KIDS TO
USE HEROIN
q31i Frequency Percent
Very 189 85.42
Somewhat 12 5.56
Not very 3 1.53
Don't know 17 7.50
Frequency Missing = 23.353673262
DANGEROUS FOR KIDS TO
USE METHAMPHETAMINE
q31j Frequency Percent
Very 188 82.07
Somewhat 12 5.36
Not very 4 1.84
Not at all 1 0.40
Don't know 24 10.33
Frequency Missing = 16.371244581
DAYS SKIPPED SINCE
SEPTEMBER
q32a Frequency Percent
None 210 91.00
1-3 days 15 6.49
4-9 days 3 1.40
10+ days 3 1.10
Frequency Missing = 14.040638291
DAYS ILL SINCE
SEPTEMBER
q32b Frequency Percent
None 86 36.63
1-3 days 122 51.63
4-9 days 23 9.89
10+ days 4 1.85
Frequency Missing = 9.4152848703
OTHER REASON FOR
DAYS MISSED SINCE
SEPTEMBER
q32c Frequency Percent
None 108 47.07
1-3 days 103 44.96
4-9 days 15 6.46
10+ days 3 1.50
Frequency Missing = 15.441605299
SENT TO
PRINCIPAL/DEAN SINCE
SEPTEMBER
q32d Frequency Percent
None 195 83.22
1-3 days 27 11.64
4-9 days 7 2.87
10+ days 5 2.27
Frequency Missing = 10.3878304
SOMEONE CALLED
HOME SINCE
SEPTEMBER
q32e Frequency Percent
None 204 86.92
1-3 days 26 10.92
4-9 days 2 0.69
10+ days 3 1.47
Frequency Missing = 10.3284868
IN TROUBLE FOR
DRINKING SINCE
SEPTEMBER
q32f Frequency Percent
None 231 99.61
10+ days 1 0.39
Frequency Missing = 12.922936
IN TROUBLE FOR DRUG
USE SINCE SEPTEMBER
q32g Frequency Percent
None 226 98.06
1-3 days 3 1.19
10+ days 2 0.75
Frequency Missing = 14.7922467
The frequencies have been weighted so that the analysis reflects
the distribution of students by grade level in the district
©Copyright 2010, Texas A&M University
All rights reserved.
Page 87 of 90

8/7/2019 MATAGORDA COUNTY - Palacios ISD - 2010 Texas School Survey of Drug and Alcohol Use
http://slidepdf.com/reader/full/matagorda-county-palacios-isd-2010-texas-school-survey-of-drug-and-alcohol 88/90
Palacios
Spring 2010
TROUBLE WITH FRIENDS
BECAUSE OF DRINKING
q33a Frequency Percent
None 210 90.35
1-3 times 19 8.16
4-9 times 2 0.74
10+ times 2 0.74
Frequency Missing = 13.051655401
DRIVEN A CAR AFTER A
GOOD BIT TO DRINK
q33b Frequency Percent
None 214 93.12
1-3 times 10 4.22
4-9 times 3 1.12
10+ times 4 1.54
Frequency Missing = 15.484511589
CRITICIZED BY DATE
BECAUSE OF DRINKING
q33c Frequency Percent
None 210 92.05
1-3 times 14 6.05
4-9 times 4 1.55
10+ times 1 0.35
Frequency Missing = 16.440619842
TROUBLE WITH POLICE
BECAUSE OF DRINKING
q33d Frequency Percent
None 218 96.19
1-3 times 9 3.81
Frequency Missing = 18.224117476
TROUBLE WITH FRIENDS
BECAUSE OF DRUG USE
q33e Frequency Percent
None 214 93.95
1-3 times 9 4.13
4-9 times 2 0.80
10+ times 3 1.11
Frequency Missing = 17.268009224
DRIVEN A CAR WHILE
HIGH FROM DRUGS
q33f Frequency Percent
None 217 96.49
1-3 times 3 1.19
4-9 times 2 0.81
10+ times 3 1.51
Frequency Missing = 19.948271502
CRITICIZED BY DATE
BECAUSE OF DRUG USE
q33g Frequency Percent
None 214 96.10
1-3 times 6 2.76
4-9 times 1 0.41
10+ times 2 0.73
Frequency Missing = 22.62853378
TROUBLE WITH POLICE
BECAUSE OF DRUG USE
q33h Frequency Percent
None 220 98.08
1-3 times 3 1.56
4-9 times 1 0.36
Frequency Missing = 20.818567174
CLASS DAYS DRUNK ON
ALCOHOL SINCE SEPT
q34a Frequency Percent
None 230 95.77
1-3 days 9 3.90
10+ days 1 0.34
Frequency Missing = 4.40441630
CLASS DAYS HIGH ON
MARIJUANA SINCE SEPT
q34b Frequency Percent
None 226 93.91
1-3 days 8 3.25
4-9 days 5 2.17
10+ days 2 0.67
Frequency Missing = 4.40441630
CLASS DAYS HIGH ON
INHALANTS SINCE SEPT
q34c Frequency Percent
None 233 96.88
1-3 days 5 2.11
4-9 days 1 0.34
10+ days 2 0.67
Frequency Missing = 4.40441630
CLASS DAYS HIGH ON
OTHER DRUG(S)
q34d Frequency Percent
None 226 93.84
1-3 days 11 4.38
4-9 days 2 0.72
10+ days 3 1.05
Frequency Missing = 4.40441630
The frequencies have been weighted so that the analysis reflects
the distribution of students by grade level in the district
©Copyright 2010, Texas A&M University
All rights reserved.
Page 88 of 90

8/7/2019 MATAGORDA COUNTY - Palacios ISD - 2010 Texas School Survey of Drug and Alcohol Use
http://slidepdf.com/reader/full/matagorda-county-palacios-isd-2010-texas-school-survey-of-drug-and-alcohol 89/90
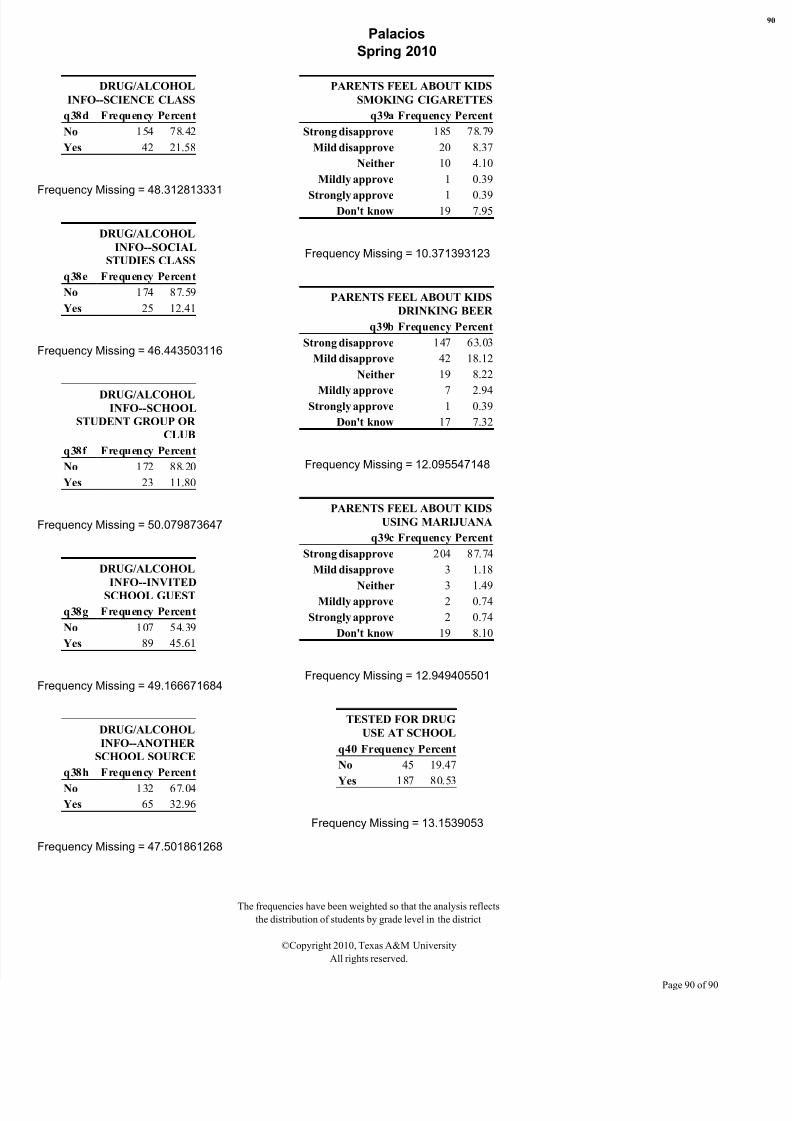
8/7/2019 MATAGORDA COUNTY - Palacios ISD - 2010 Texas School Survey of Drug and Alcohol Use
http://slidepdf.com/reader/full/matagorda-county-palacios-isd-2010-texas-school-survey-of-drug-and-alcohol 90/90
Palacios
Spring 2010
DRUG/ALCOHOL
INFO--SCIENCE CLASS
q38d Frequency Percent
No 154 78.42
Yes 42 21.58
Frequency Missing = 48.312813331
DRUG/ALCOHOL
INFO--SOCIAL
STUDIES CLASS
q38e Frequency Percent
No 174 87.59
Yes 25 12.41
Frequency Missing = 46.443503116
DRUG/ALCOHOLINFO--SCHOOL
STUDENT GROUP OR
CLUB
q38f Frequency Percent
No 172 88.20
Yes 23 11.80
Frequency Missing = 50.079873647
DRUG/ALCOHOL
INFO--INVITED
SCHOOL GUEST
q38g Frequency Percent
No 107 54.39
Yes 89 45.61
Frequency Missing = 49.166671684
DRUG/ALCOHOL
PARENTS FEEL ABOUT KIDS
SMOKING CIGARETTES
q39a Frequency Percent
Strong disapprove 185 78.79
Mild disapprove 20 8.37
Neither 10 4.10
Mildly approve 1 0.39
Strongly approve 1 0.39Don't know 19 7.95
Frequency Missing = 10.371393123
PARENTS FEEL ABOUT KIDS
DRINKING BEER
q39b Frequency Percent
Strong disapprove 147 63.03
Mild disapprove 42 18.12
Neither 19 8.22
Mildly approve 7 2.94Strongly approve 1 0.39
Don't know 17 7.32
Frequency Missing = 12.095547148
PARENTS FEEL ABOUT KIDS
USING MARIJUANA
q39c Frequency Percent
Strong disapprove 204 87.74
Mild disapprove 3 1.18
Neither 3 1.49Mildly approve 2 0.74
Strongly approve 2 0.74
Don't know 19 8.10
Frequency Missing = 12.949405501
TESTED FOR DRUG
USE AT SCHOOL