Embed Size (px)
Citation preview
University of Kentucky University of Kentucky
UKnowledge UKnowledge
Theses and Dissertations--Retailing and Tourism Management Retailing and Tourism Management
2015
A Comparative Life Cycle Assessment of Denim Jeans and a A Comparative Life Cycle Assessment of Denim Jeans and a
Cotton T-Shirt: The Production of Fast Fashion Essential Items Cotton T-Shirt: The Production of Fast Fashion Essential Items
From Cradle to Gate From Cradle to Gate
Tara Hackett University of Kentucky, [email protected]
Right click to open a feedback form in a new tab to let us know how this document benefits you. Right click to open a feedback form in a new tab to let us know how this document benefits you.
Recommended Citation Recommended Citation Hackett, Tara, "A Comparative Life Cycle Assessment of Denim Jeans and a Cotton T-Shirt: The Production of Fast Fashion Essential Items From Cradle to Gate" (2015). Theses and Dissertations--Retailing and Tourism Management. 9. https://uknowledge.uky.edu/mat_etds/9
This Master's Thesis is brought to you for free and open access by the Retailing and Tourism Management at UKnowledge. It has been accepted for inclusion in Theses and Dissertations--Retailing and Tourism Management by an authorized administrator of UKnowledge. For more information, please contact [email protected].
STUDENT AGREEMENT: STUDENT AGREEMENT:
I represent that my thesis or dissertation and abstract are my original work. Proper attribution
has been given to all outside sources. I understand that I am solely responsible for obtaining
any needed copyright permissions. I have obtained needed written permission statement(s)
from the owner(s) of each third-party copyrighted matter to be included in my work, allowing
electronic distribution (if such use is not permitted by the fair use doctrine) which will be
submitted to UKnowledge as Additional File.
I hereby grant to The University of Kentucky and its agents the irrevocable, non-exclusive, and
royalty-free license to archive and make accessible my work in whole or in part in all forms of
media, now or hereafter known. I agree that the document mentioned above may be made
available immediately for worldwide access unless an embargo applies.
I retain all other ownership rights to the copyright of my work. I also retain the right to use in
future works (such as articles or books) all or part of my work. I understand that I am free to
register the copyright to my work.
REVIEW, APPROVAL AND ACCEPTANCE REVIEW, APPROVAL AND ACCEPTANCE
The document mentioned above has been reviewed and accepted by the student’s advisor, on
behalf of the advisory committee, and by the Director of Graduate Studies (DGS), on behalf of
the program; we verify that this is the final, approved version of the student’s thesis including all
changes required by the advisory committee. The undersigned agree to abide by the statements
above.
Tara Hackett, Student
Dr. Elizabeth Easter, Major Professor
Dr. Scarlett Wesley, Director of Graduate Studies
A COMPARATIVE LIFE CYCLE ASSESSMENT OF DENIM JEANS AND A COTTON T-SHIRT: THE PRODUCTION OF FAST FASHION ESSENTIAL ITEMS
FROM CRADLE TO GATE
_______________________________
THESIS _______________________________
A Thesis submitted in partial fulfillment of the
requirements for the degree of Master of Science in the College of Agriculture
at the University of Kentucky
By
Tara Hackett
Lexington, Kentucky
Dr. Elizabeth Easter, Professor of Merchandising, Apparel and Textiles
Lexington, Kentucky
2015
Copyright© Tara Hackett 2015
ABSTRACT OF THESIS
A COMPARATIVE LIFE CYCLE ASSESSMENT OF DENIM JEANS AND A COTTON T-SHIRT: THE PRODUCTION OF FAST FASHION ESSENTIAL ITEMS
FROM CRADLE TO GATE
As a result of harmful textile production, sustainability has become the movement by which the apparel industry explores solutions to improve procedures in fashion design to maintain a healthy environment. However, the issue is consumers trust the sustainability claims and marketing materials of apparel products at face value without knowing its environmental impact. The overall purpose of this research was to compare the environmental implications of widely produced and owned apparel products through a life cycle assessment approach. This life cycle assessment study examines key environmental impact categories of the materials and production phase (cradle to gate) of a pair of jeans and a cotton t-shirt. The specific purpose of this study was to identify if the production processes make a sustainable product at the point of purchase. Furthermore, this research study compares the environmental impacts of a denim jean and dyed cotton t-shirt utilizing the ReCipe 2008 LCA tool.
KEYWORDS: Life Cycle Assessment, Sustainability, Cradle to Gate, ReCiPe 2008
Tara Hackett ___________________________________
July 27, 2015
___________________________________
A COMPARATIVE LIFE CYCLE ASSESSMENT OF DENIM JEANS AND A COTTON T-SHIRT: THE PRODUCTION OF FAST FASHION ESSENTIAL ITEMS
FROM CRADLE TO GATE
By
Tara Hackett
Dr. Elizabeth Easter
___________________________________ Director of Thesis Dr. Scarlett Wesley
___________________________________ Director of Graduate Studies July 27, 2015
___________________________________
iii
ACKNOWLEDGEMENTS
The following thesis, while an individual work, benefited from the insights
and direction of several people. First, my Thesis Chair, Dr. Elizabeth Easter,
exemplifies the high quality scholarship to which I aspire. Dr. Easter provided
timely and instructive comments and evaluation at every stage of the process.
Thank you for your support and believing in me. Next, I wish to thank the
complete Thesis Committee: Dr. Elizabeth Easter, Dr. Vanessa Jackson, and Dr.
Scarlett Wesley. Each individual provided insights that guided and challenged my
thinking, substantially improving the finished product.
In addition to the technical and instrumental assistance from my thesis
committee, I have received equally important assistance from family and friends.
My husband, Trae Hackett, has provided unwavering support through my journey,
always offering encouragement and a listening ear. Thank you for believing in my
vision. To my children, Trent, Taylor, and Teagan, for quiet times, cooperation
and understanding that provided quality studying time me. Last, to my extended
family and friends for filling in the gaps, supporting my decisions and providing a
safe and loving place for us to grow. The help from everyone has allowed me to
achieve my goals.
iv
TABLE OF CONTENTS
Acknowledgements............................................................................................................iii
List of Tables…………………………………………………………………………....viii
List of Figures……………………………………………………………………….……ix
Chapter One: Introduction………………………………………………………………...1
Problem……………………………………………………………………………2
Purpose…………………………………………………………………....……….3
Objectives…………………………………………………………………………3
Research Questions……………………………………………………………......4
Justification………………………………………………………………………..4
Limitations of Study………………………………………………………………5
Assumptions……………………………………………………………………….6
Chapter Two: Review of Literature……………………………………………………….7
Introduction………………………………………………………………………..7
Overview of Apparel Supply Chain……………….………………………………7
Globalization………………………………………………………………………9
Just-in-time Concept……………………………………………………..10
Agile Supply Chain…………………………………………………...….11
Quick Response Concept……………………………………………...…13
Fast Fashion…………………………………………………………………..….15
Consumer Driven………………………………………………………...16
Supply Chain Driven……………………………………………………..16
Sustainable Fashion……………………………………………………………...18
Product Life Cycle…………………………………………………………….....18
Raw Material Procurement………………………………………………19
v
Manufacturing/Production……………………………………………….21
Distribution……………………………………………………………....24
Consumer Use…………………………………………………………....24
Disposal………………………………………………………………..…26
Life Cycle Assessment………………………………………………………..….29
Goal And Scope…………………………………………………….……30
Life Cycle Inventory Analysis……………………………………..…….31
Life Cycle Impact Assessment………………………………...…………31
Life Cycle Interpretation………………………………………...……….31
ReCiPe 2008 LCA Method………………………………………………………33
Human Health……………………………………………………………38
Ecosystem………………………………………………………………..39
Resources………………………………………………………………...40
Summary……………………………………………………………….………...45
Chapter Three: Methodology…………………………………………………………….47
Introduction………………………………………………………………………47
Research Design………………………………………………………………….48
Goal and Scope………………………...………………………………...………48
Functional Unit…………………………………………………………..48
System Boundaries……………………………………………………….49
Materials Phase…………………………………………………..49
Production Phase…………………………………………………49
Environmental Impact Categories………………………………………..49
Climate Change…………………………………………………..50
Water Consumption……………………………………………...50
Eutrophication……………………………………………………51
vi
Land Occupation…………………………………………………51
Abiotic Depletion………………………………………………...51
Inventory Analysis……………………………………………………………….51
Chapter Four: Results……………………………………………………………………56
Introduction………………………………………………………………………56
Impact Assessment……………………………………………………………….56
Climate Change…………………………………………………………..57
Levi’s® 501® Jeans……………………………………………….57
Colored Cotton T-shirt……………………………………...……59
Water Consumption……………………………………………………...60
Levi’s® 501® Jeans……………………………………………….60
Colored Cotton T-shirt…………………………………………...62
Eutrophication……………………………………………………………63
Levi’s® 501® Jeans……………………………………………….63
Colored Cotton T-shirt…………………………………………...65
Land Occupation…………………………………………………………66
Levi’s® 501® Jeans……………………………………………….66
Colored Cotton T-shirt…………………………………………...68
Abiotic Depletion………………………………………………………...68
Levi’s® 501® Jeans……………………………………………….68
Colored Cotton T-shirt…………………………………………...70
Interpretation of Results………………………………………………………….71
Climate Change…………………………………………………………..71
Water Consumption……………………………………………………...71
Eutrophication……………………………………………………………72
Land Occupation…………………………………………………………72
vii
Abiotic Depletion………………………………………………….……..73
Chapter Five: Discussion and Conclusions………………………………………………74
Introduction………………………………………………………………………74
Fiber Cultivation and Harvest……………………………………………………75
Water Consumption……………………………………………………………...76
Energy Consumption…………………………………………………………….77
Life Cycle Assessment Data……………………………………………………..78
Limitations of Study……………………………………………………………..79
Recommendations for Future Research………………………………………….80
Appendices
Appendix A………………………………………………………………………81
Appendix B………………………………………………………………………83
Appendix C………………………………………………………………………84
Appendix D………………………………………………………………………87
Appendix E……………………………………………………………………..100
Bibliography….………………………………………………………………………...107
Vita……………………………………………………………………………………..115
viii
LIST OF TABLES
Table 2.1, Textile fiber types………….…………………………………………………21
Table 2.2, A rough guide of relative impact of textile products throughout life by
Category……………………………………………………………….....25
Table 2.3, Overview of midpoint categories, indicators, and characterization
Factors……………………………………………………………………36
Table 2.4, Overview of the endpoint categories, indicators and characterization
Factors……………………………………………………………………38
Table 2.5, Overview of Resource functions and properties……………………………...42
Table 3.1, Impact Categories and descriptions…………………………………………..50
Table C1, Sources of data collected within the Supply Chain…………………………...85
Table C2, Levi’s® 501® Jean Life cycle Impact………………………………………..86
Table D1, System structure in the EDIPTEX database for the T-shirt…………………..88
Table D2, Estimated transportation between phases of a cotton T-shirt………………...90
Table D3, System structure Lorry transport in the EDIPTEX
database for the T-shirt……………………………………………….….91
Table D4, Source identification for environmental impact potentials related to
energy to (Climate Change and Eutrophication)…………………..…….92
Table D5, Source identification of the most intensive processes in the life
cycle of the T-shirt (Abiotic Depletion)…………………………………95
Table D6, Consumption of chemicals - cotton cultivation……………………………...97
Table D7, Electricity consumption (all energy data for processes
in kWh per kg spun yarn)………………………………………………..98
ix
LISTOFFIGURES
Figure 2.1, Phases of a Product’s Life Cycle…………………………………………….19
Figure 2.2, Map of key processes, inputs and output in the textile production
chain ……………...………………………………………..….…………22
Figure 2.3, The Life Cycle Assessment Framework……………………………………..30
Figure 2.4, Relationship between LCI parameters, midpoint indicator and
endpoint indicator in ReCiPe 2008………………………………….…...34
Figure 3.1, The life cycle of a Levi’s® 501® jean………………………………………..53
Figure 3.2, Life cycle, flow and phases of a cotton t-shirt……………………………….55
Figure 4.1, Climate Change (kg CO2-e) by life cycle phase from cradle
to gate in the production of one pair of jeans…………………………….58
Figure 4.2, Percent of Climate Change by life cycle phase from cradle to gate in the
production of one pair of jeans…………………………………………..58
Figure 4.3, Percent of Climate Change by life cycle phase from cradle to gate
in the production of one colored cotton t-shirt…………………………...59
Figure 4.4, Water Consumption (liters) by life cycle phase from cradle to gate
in the production of one pair of jeans……………………………………61
Figure 4.5, Percent of Water Consumption by life cycle phase from cradle to
gate in the production of one pair of jeans……………………………….61
Figure 4.6, Water Consumption (liters) by fabric cultivation and yarn
spinning of cotton……………………………………….................…….63
x
Figure 4.7, Eutrophication (g PO4-e) by life cycle phase from cradle to
gate in the production of one pair of jeans………………………………64
Figure 4.8, Percent of Eutrophication by life cycle phase from cradle to
gate in the production of one pair of jeans…………………………...…..65
Figure 4.9, Percent of Eutrophication by life cycle phase from cradle to
gate in the production of one colored cotton t-shirt……………………..66
Figure 4.10, Land Occupation (m2/year) by life cycle phase from cradle to
gate in the production of one pair of jeans………………………………67
Figure 4.11, Percent of Land Occupation by life cycle phase from cradle to
gate in the production of one pair of jeans……………………………….67
Figure 4.12, Abiotic Depletion (mg Sb-e) by life cycle phase from cradle to
gate in the production of one pair of jeans……………………………….69
Figure 4.13, Percent of Abiotic Depletion by life cycle phase from cradle to
gate in the production of one pair of jeans……………………………….69
Figure 4.14, Percent of Abiotic Depletion by life cycle phase from cradle to gate in the
gate in the production of a colored cotton t-shirt………………………...71
1
Chapter One
“Eco chic,” “environmentally conscious,” “ethical consumerism,” “sustainable
fashion” and “clothing with a conscience” are new fashion buzzwords. Even more
familiar, ‘natural,’ ‘organic’ and ‘green’ are adjectives that are intended to shape
consumers’ minds and purchases towards more sustainable choices. However, really
knowing so is a difficult process. Besides, how often do consumers know where their
shirt’s cotton came from and how it was produced? The methods by which products are
manufactured, purchased, used, and disposed of affect the environment in many ways
(Joy, Sherry, Venkatesh, Wang & Chan, 2012). Therefore, sustainability gives the
designer and manufacturer a chance to think more critically about fashion design and
produce environmentally responsible clothing. So, Hethorn and Ulasewicz (2008) ask,
“How do we design, develop, and wear fashion in sustainable ways and still participate
with fashion as we know it” (p. xiii)? When considering sustainable fashion a designer
must assess what sustainability means to them, the environment, and the consumer.
Sustainability is a growing phenomenon in the world of fashion today.
Globalization has provided the apparel industry the opportunity to produce fashion at a
rapid rate. The advancement and improved enforcement of environmental laws by
regulatory authorities clearly demonstrate a growing recognition of the importance of
moving towards a more sustainable model for the textile and clothing industry (Dystar,
2010). Apparel production is taking place in countries where there is little concern for air
and water pollution created by textile fiber, yarn and fabric production (Hethorn &
Ulasewicz, 2008). Therefore, as a result of global textile production, sustainability has
become the movement by which the apparel industry explores solutions to improve
procedures of apparel production in order to maintain a healthy environment. Although
“manufacturers may use new designs and technology to minimize the impact of a product
on the environment, their efforts are pointless if the consumer does not buy
it”(Moisander, Markkula, & Eräranta, 2010, p. 73). The demand for sustainable fashion
depends on the consumer’s knowledge and understanding of the issues impacting
sustainability (Moisander et al., 2010) Therefore giving the consumer the opportunity to
widely influence the market. People are increasingly recognizing the issues associated
2
with sustainable consumption (Carrigan & Pelsmacker, 2009) and by purchasing and
wearing eco-friendly clothing, people express choices about their own ecological
footprint (Hethorn & Ulasewicz, 2008). Therefore it is the responsibility of the retailer to
source and label products ethically (Ritch & Schroder, 2012).
Problem
Sustainable fashion has been around since the early 1600s, as a way of life rather
than a choice. Before the Industrial Revolution, people were conserving resources
because of the cost and labor it took to produce the basic necessities of life (Hethorn &
Ulasewicz, 2008). Raw materials (textiles) for apparel came from nature and required a
long time to transform into fabrics. The labor required to produce a high quality product
contributed to the high cost of fabrics and apparel. Hence, quality fabrics were worn by
the wealthy as a way to express their wealth to society. By the end of the eighteenth
century industrial machines were introduced to spin yarns and weave fabrics; which
accelerated the production of fabrics.
Synthetic dyes, manufactured fibers, ready-to-wear, fashion magazines and more
were products of the industrial revolution and made it possible for the textile industry to
grow. In the 60’s fashion production and consumption changed during the postmodern
era. “Novelty in fashion was much desired to mirror rapid social change” (Hethorn &
Ulasewicz, 2008, p. 20). Fashion became available to all classes of people as apparel was
more abundant and easily accessible which led to the development of consumerism.
Stearns (1997) describes consumerism as a “society in which people formulate their goals
in life partly through acquiring goods they clearly do not need subsistence or traditional
display” (p. 105). As consumers began to purchase more, manufacturers responded, by
providing an abundance of goods. Marketing and advertising of fashion soon followed
and contributed to the greater interest in consumer consumption.
Along with the growth of the textile and apparel industries came many factors
including consumer awareness, government intervention by legislations, and
diversification in production. In addition, new developments in information and
communication technologies enabled the use of media to inform the consumer of the
3
impacts of the industry. The attention of the consumer has forced retailers to take action
to address their concerns of the environmental, economic and social impact of through
production (Jones, Hillier, Comfort, & Eastwood, 2005). Although, retailers have taken a
more proactive approach though apparel production, challenges still remain in convincing
a consumer of sustainable practices through apparel labelling. The United States
Environmental Protection Agency (USEPA) claims that eco-labels are placed on products
by manufacturers to indicate to consumers that the product meets certain environmental
and human health standards (USEPA, http://www.epa.gov/greenproducts/standards/).
However, the message of sustainability or eco-friendly products is sometimes falsely
conveyed, assuming that consumers are unaware of the processes and procedures
included in production. Unfortunately consumers trust the sustainability claims and
marketing materials of an apparel product at face value without knowing its
environmental impact.
Purpose
The overall purpose of this research was to compare the environmental
implications of widely produced and owned apparel products through a life cycle
assessment approach. This life cycle assessment study examined key environmental
impact categories of the materials and production phase of a pair of jeans and a cotton t-
shirt. Therefore, the specific purpose of this study was to identify if the production
processes make a sustainable product at the point of purchase.
Objectives
The overall objective of the research study was to assess the life cycle of two
apparel products to determine if the apparel products are fully sustainable for the
consumer at the point of purchase. This study focuses on the stages of manufacturing
that affect the validity of an eco-friendly labeled product. The objectives were to:
1. Assess the environment impacts of an apparel product’s life cycle from cradle
(raw material extraction) to gate (garment make-up & distribution).
2. Compare the environmental impacts of a pair of denim jeans and a cotton T-
shirt using the Life Cycle Assessment (LCA) ReCiPe 2008 methodology.
4
Research Questions
This research study addresses the overall question of whether or not the product is
sustainable based on the processes and procedures used during the manufacturing stages.
This study answers the following questions:
1. Do companies produce a 100% sustainable product based on the processes
and procedures of a sustainable design?
2. What phases of jean and cotton t-shirt production have the most significant
environmental impacts?
3. How do manufacturers ensure the validity of sustainable apparel labeling
through production and packaging?
Justification
During the rise of industrialization, textile manufactures were not concerned with
environmental effects as a result of production or fair labor practices (Hethorn &
Ulasewicz, 2008). Chemicals were emptied in nearby rivers and streams and work
conditions in mills were poor. As a result, the emergence of environmentalism and social
consciousness took place. Consumers began to consider ways to dispose, recycle, and
reuse their clothes. They were concerned with how their clothing was produced and the
impact the process had on the environment, thereby developing a conscientious lifestyle.
As a response to conscience consumerism, eco-labeling began to rise as a way to inform
consumers that companies care and are on board with their sustainable viewpoint.
Consumers have a desire to learn more about sustainable issues and practices that
lead to sustainable living. Luke (2008) proclaims that, “consumers play a role in
promoting peace and sustaining life through the choices they make when they purchase
apparel and other goods” (p. 77). In the opinion of the government and the consumer,
environmental issues are playing an increasingly important role in the textile industry
(Sivaramakrishnan, 2012). Society has placed a focus on sustainability by highlighting
issues of the environment in the media. When discussing sustainability as a whole the
concern with chemicals used in apparel production that affect human health and the
environment are not the only issues. Sustainability is about improving apparel
5
production in order to maintain a healthy environment in the future and addressing/
solving social inequities (Hethorn & Ulasewicz, 2008). As manufacturers continue to
design and produce sustainable products the consumer ultimately has the buying power
and determines the success of the product. People are more environmentally conscience
and applying their beliefs of the environment while purchasing products for their
lifestyle. However, the processes and materials available from which fashion products
are produced are unfamiliar to consumers, resulting in un-informed purchasing choices
(Hethorn & Ulasewicz, 2008). Therefore, the company’s responsibility is to examine the
production process from design to point of purchase to better inform consumers of
sustainable products.
Limitations of the study
This research study is a comparison study that focuses on the manufacturing of a
cotton T-shirt and a pair of denim jeans. These products are significant because they are
items that are widely owned by consumers in large amounts. On average, about 96% of
U.S. consumers own seven pairs of denim jeans at one time.(CottonIncorporated,
http://www.cottoninc.com/corporate/Market-Data/SupplyChainInsights/Driving-
Demand-For-Denim-Jeans/). People from many different generations wear the t-shirt in
many ways, colors, and fabrics. Today, contrary to the past, it is a staple piece for both
genders (Jefferson, http://www.ooshirts.com/guides/History-of-the-T-Shirt.html).
However, by using only jeans and t-shirts as a focus limits the study assuming they are
the only fast fashion items consumers own in excess.
The study used data from existing life cycle assessment studies and did not
conduct an actual LCA. The sample size was intentionally chosen to bring recognition of
the environmental impacts of largely owned and purchased fashion items. The
availability of studies conducted by companies in the US was limited and non-existent
therefore, the LCAs compared were from the United States and Denmark.
The Life Cycle Assessment (LCA) is the detailed analysis of a product’s design.
It describes the entire life of a product, which encompasses raw material extraction,
material production, manufacturing, product use, the end-of-life disposal, and all the
6
transportation that occurs in between each stage (ANSI/ISO 14040-1997). The product’s
use phase and end-of-life disposal phase occur as consumer behaviors and are critical
stages in a product’s life cycle. However, this study addressed the environmental impact
of the materials and production phase of the life cycle, excluding consumer behavior.
This study is a cradle to gate life cycle assessment. Furthermore, LCAs are still in
development and do not have consistent system boundaries to be used among all
industries. This study focused on a limited number of environmental impact categories
most important to the selected products rather than the 18 categories indicated by the
ReCiPe 2008 LCA tool. The International Standard recognizes that work remains to be
done and practical experience gained in order to further develop the LCA practice
(ANSI/ISO 14040-1997). The research was restricted by the amount of time available to
fully trace production.
Assumptions
The assumption was that the products sampled are representative of all apparel
products enforcing a sustainable initiative. The information from this study encourages
consumers to research the environmental impacts of their beloved denim jeans and t-shirt
fashion items purchased in excess. Furthermore, this study assessed the sustainable
resources and processes of a basic cotton t-shirt and denim jean utilizing a life cycle
assessment.
7
Chapter Two
Review of Literature
The overall purpose of this research was to compare the environmental
implications of widely produced and owned apparel products through a life cycle
assessment approach. In addition, determine if the apparel products are fully sustainable
for the consumer at the point of purchase. As apparel products are manufactured,
purchased, used, and disposed of, there are many harmful techniques that affect the
environment. (Joy et al., 2012). Fortunately the concept of sustainable apparel design can
give the designer and manufacturer an opportunity to positively impact the environment
through the production process. Because consumers are increasingly concerned for the
environment, it is important that manufactures clearly label sustainable apparel products.
The labeling and identification of sustainable products and production processes are not
clearly defined, and inconsistently regulated by the government to ensure the validity of a
sustainable garment.
In the following section, the review of literature will provide the theoretical
background for the movement towards sustainable apparel production. This study
focuses on the essential topics to developing an apparel garment by describing the
apparel industry in relation to the life cycle assessment. Therefore, the review of
literature covers globalization, fast fashion, sustainable fashion, and the life cycle
assessment of an apparel product, as these are the significant issues contributing to the
rise of eco-consciousness.
Overview of the Apparel Supply Chain
In the textile industry, supply chain is described as the flow of goods from the
very first process encountered in the production of a product through final sale to the end
consumer (Bruce, Daly, & Towers, 2004). The supply chain process of the apparel
industry begins with: fiber production, yarn manufacturing, fabric manufacturing, product
manufacturer, retailers, and the consumer, in that order (Keiser & Garner, 2012). The
United States apparel industry is an import and domestic industry, and according to
Cohen and Johnson (2012), more than half of all apparel consumed in the United States is
8
made from textiles produced outside the country and then imported to the U.S., while less
than half are produced domestically. Therefore the apparel industry supply chain is
highly fragmented and inherently complex; which makes fashion manufacturing less
transparent than agribusiness ((Mihm, 2010); Partridge, 2011).
In the past the apparel supply chain were very simple and operated in the same
manner with each industry segment having very specific responsibilities and its own
customer (Keiser & Garner, 2012). As technology evolved, the ability for businesses at
specific levels has begun to cross (Keiser & Garner, 2012). Retailers have bypassed the
middleman and are trying their hand at product development to secure more of the profit
and claim exclusivity at a more competitive price (Keiser & Garner, 2012). Now, the
apparel supply chain can be described as a complex network of suppliers and/or vendors
involved directly or indirectly in fulfilling customer demand for apparel. The supply
chain includes all the companies directly involved in designing, supplying material
components, manufacturing, and distributing apparel as well as auxiliary business (Keiser
& Garner, 2012). Products are delivered through multiple distribution channels including
stores, catalogs, television, and through the Internet.
Over time, the apparel supply chain has evolved because of competitiveness.
Therefore, the collaborative apparel supply chain came about because of wholesale brand
manufactures wanting to remain competitive by opening their own retail stores (Keiser &
Garner, 2012). Keiser & Garner (2012) say that a “Collaborative supply chain enhances
a product developer’s ability to compete in terms of product innovation, cost, speed to
market, manufacturing expertise, sustainability, and access to technology and resources
to be more flexible in its response to changing market needs” (p. 25). Today the
collaborative supply chain is the most common and is the means by which the apparel
industry functions. Zara is a Sweden based company that has been successful at making
the collaborative supply chain work in its favor. Zara accomplishes an 8-10 week
delivery response time opposed to a 40-50 week response time by committing to small
and frequent shipments to keep inventories fresh. This concept convinces the customer
that every time they visit the store they are guaranteed to see new merchandise,
compelling consumers to frequently shop as to it, may be gone tomorrow. The cutting
9
and dyeing process of an apparel product are crucial stages in apparel production,
however Zara has invested in a dye and finishing plant to have more control over the lead
times of its apparel goods (Keiser & Garner, 2012). They manage majority of the cutting
process, therefore this eliminates having a manufacturer and decreases the lead-time on
its apparel products. The design stage of the apparel production process is mainly
determined by the consumer, and dictates the design that has so successfully been
achieved by Zara (Keiser & Garner, 2012). Zara has efficiently reviewed each level of
the supply chain and tailored its business to it in order to make improvements that work
in their favor.
Globalization
Scientific and technological advances are two major factors that spurred
industrialization without considering the negative effects (Sadar, 2010). In the years
following World War II innovations and developments in textile technology and man-
made fibers were impressive, as well as the growth of worldwide consumption and
production of textiles (Linder, 2002). Worldwide consumption of major textile fibers
increased almost four times as much between 1950 and the late 1980s from 10 to 38
million tons (Linder, 2002). The growth was attributed mainly in part to the growth of
world population (Linder, 2002). World War II brought about progress in textile
technology resulting in the development of new materials and the introduction of new
techniques for the manufacture of known and new fibers into finished fabrics (Linder,
2002). New material innovations became a way of life and the textile industry continued
to improve production technologies, experienced increased productivity and increasing
automation of production (Linder, 2002). By the end of the 1980s, man-made fibers were
the most important raw material for textiles next to cotton (Linder, 2002).
Sadar (2010) goes on to proclaim that, “Fashion cycles continue to change rapidly
as a result of global communication and marketing, intense competition and rivalry, and
expanding production capacities in developing countries, especially in China and India”
(p. 144). In turn, globalization has put pressure on designers, manufactures and retailers
to encourage consumerism and the adaptation of fashion cycles. At the move towards
fast fashion, the apparel supply chain was unequipped for the growing demands of the
10
fashion industry, lead times were extremely long, complex and inflexible (Barnes and
Lea-Greenwood, 2006). The retail industry evolved from a production-driven industry to
a more concentrated consumer-driven industry. Therefore, new concepts were introduced
into the supply chain including just-in-time (Bruce et al., 2004), the agile supply chain
(Christopher, Lowson, & Peck, 2004; Bruce et al., 2004) and quick response systems
(Giunipero, Firoito, Pearcy, & Dandeo,2001) for improvement to response time.
Just-in-time Concept. The just-in-time management approach predates back to
the 1950s as a way to gain competitive advantage. It was a strategy invented by the
“father” of Toyota’s production system, Taiichi Ohno. It was designed with the idea in
mind of no waste or the avoidance of overproduction that results in dead stock and
inefficient use of labor (Michelsen, O'Connor, & Wiseman, 2014). His theory became
known as the JIT philosophy, focusing on a main goal of moving items through a
production system only when needed (Michelsen et al., 2014). The JIT theory gained
popularity and was introduced in the US in the late 1970s to early 1980s. JIT is an
inventory pull system approach to managing the supply chain (Abuhilal, Rabadi, &
Sousa-Poza, 2006). It enables the retailer to fill costumer orders at the time of purchase.
Retailers were able to reduce inventory to a minimum level, keeping on hand only the
amount needed (Epps, 1995). The literature highlights Dell and McDonald’s by
explaining that is was more efficient to sell customers burgers or computers right when
the customer orders it rather than selling premade burgers or computers that have the
tendency to age quickly (Michelsen et al., 2014). Therefore, custom tailored orders allow
companies to satisfy orders at a lower cost and prepare for rapid production (Michelsen et
al., 2014). Therefore, adopting an approach driven on a continuous delivery of items
(Epps, 1995). This concept can be attributed to the success of companies such as;
Hewlett-Packard, Dell, McDonald’s and Walmart (Michelsen et al., 2014).
In the textiles and clothing industry JIT can be described as the delivery of
finished goods just in time to be sold throughout the supply chain. The literature shows
that the JIT approach is successful due to collaboration and information sharing within
the supply chain, resulting in reduced holding cost (Abuhilal et al., 2006). The JIT
system afforded a retailer the opportunity to trust a supplier with all their consumer
11
needs, which in turn increased profits for the company. “They could deliberately
maintain restocking thresholds at very low levels in further efforts to eliminate waste and
cost, maximizing profit margins and customer satisfaction” (Michelsen et al., 2014,p. 34).
A strong supplier relationship is what makes the JIT approach successful and should be
one of respect, trust, and open and honest communication. Epps (1995) explains the
long-term contractual relationships with vendors eliminates the need for purchase
requisitions and purchase orders. By default, JIT is a retailer driven approach and
information sharing concept (Bruce et al., 2004; Abuhilal et al., 2006). However, being
solely reliant on one supplier poses risk for limited flexibility. There is always the
possibility of natural disasters that interrupt production and cause a shortage in supply or
even longer lead times than negotiated. Companies must be prepared for unexpected
issues in order to maintain the flow of goods.
As a result, retailers began to look for alternatives ways to react business.
According to Michelsen et al. (2014) the industry began to shift when businesses started
to: secure more than one company to supply their needs at competitive prices, avoid
long-term contracts with suppliers, and manufacturing their own products. The industry
was turning to a more agile approach to the supply chain.
Agile Supply Chain. The concept of agility in relations to the supply chain has
evolved over the course of twenty years and as of today is the essential condition for a
company’s survival and competition. The concept was derived by a group of scientist
from Lehigh University who were attempting to describe the essential aspects of the
production process (Yusuf, Sarhadi, & Gunasekaran, 1999). The study concluded that
the production system must always adapt to their business environment by focusing on
speed, flexibility, responsiveness and infrastructure (Christopher et al., 2004; Yusuf et al.,
1999). As the agile supply chain started to evolve, the drivers of agility were analyzed
and concluded as automation and price/cost consideration, widening customer choice and
expectation, competitive priorities, integration and proactivity, and achieving
manufacturing requirements in synergy (Yusuf et al., 1999). Historical events such as
World War II brought about increased demand and backlogs of customer orders leaving
the market unable to supply goods. As a result price became a dominant factor that
12
determined customers preferences, encouraging massive automation of the production
processes resulting in mass production of goods (Yusuf et al., 1999). Goods were being
manufactured in abundance at a low price. Widening customer choice and expectation is
another driver of agility that was spawn from the shift in customer preferences in favor of
quality in the 1980s. The market made vast efforts to focus on quality manufactured
goods while maintaining a competitive price (Yusuf et al., 1999).
Increasing the customer expectations for quality products helped to intensify the
attention devoted to product quality initiatives (Yusuf et al., 1999). As the market was
changing, responsiveness, new product introduction, delivery flexibility, quality, concern
for the environment and international competitiveness became competing priorities
(Yusuf et al., 1999). A main driver of agility was to develop a proactive manufactures to
better identify the consumers problems and requirements and to acquire capabilities just
ahead of need. However, proactivity is solely dependent on the integration and co-
ordination of the company’s strategic manufacturing systems (Yusuf et al., 1999). Last,
in order to achieve the manufacturing requirements all drivers of agility must work
together in synergy to be successful. For example, to remain competitive, manufacturers
are required to produce products at lower cost, high quality and with shorter lead times
and remain proactive and innovative. That includes integration both of a technical and
social nature, of technology, machinery, functions, strategies, people and management is
the foundation of competitive capabilities (Yusuf et al., 1999).
Conventional supply chains are indicative of longer lead times and forecast driven
business strategies as a way to adjust to consumer demands. Also, conventional supply
chains are inventory based, often leaving retailers over or under stocked. Consequently,
the supply chain made it difficult to see “real” demand, the ability to see what customers
are buying. Agile supply chains are shorter, demand-driven, inventory and information
based. Additionally, agile supply chains allow retailers to be flexible to customer needs
(Christopher et al., 2004).
Christopher et al. (2004) explains that the agile supply chain is significant in its
own right, by being market sensitive, virtual, network-based, and process aligned. It
shares up-to-date point-of-sale (POS) data that can be used across the supply chain for
13
immediate ordering and replenishment decisions (Barnes & Lea-Greenwood, 2006).
Being market sensitive suggest that the agile supply chain is closely connected to the
customer, forcing the fashion retailer to identify with the consumers preferences and
fashion needs (Christopher et al., 2004). The agile supply chain is also connected and
integrated through shared information with all players of the supply chain, which
includes the fabric manufactures, garment makers, and retailers (Christopher et al., 2004).
The idea of the virtual agile supply chain gives the retailer the opportunity to keep
shelves well stocked and presents the advantages of co-managed inventory (CMI). CMI
is the collaboration of the supplier and retailer to manage the flow of good to the store
(Christopher et al., 2004). A network based supply chain is flexible because it uses the
strengths of specialist players. Due to the growth of the supply chain, retailers have a
choice/ variety of suppliers (often small manufacturers) to use, that allows them to
receive technological, financial and logistical support (Christopher et al., 2004). In other
words, retailers do not have to put all their resources into on basket. The option to use
other venues is an advantage of a network based agile supply chain. Last, the agile
supply chain is process aligned, meaning that there are no boundaries between
connections. There are no delays between the different stages in the chain and the
transactions are paperless (Christopher et al., 2004). Rimiene (2011) proclaims that the
agile supply chains are the alliances of legally separated organizations such as: suppliers,
designers, producers, and logistics distinguished by flexibility, adaptability, and quick, as
well as effective, responses to changing markets. Retailers, manufacturers, and all other
parties that are geographically dispersed and independent of each other can operate as
one business (Christopher et al., 2004).
Quick Response Concept. The apparel industry is a fast moving industry that
has an overwhelming fashion influence where no single style stays around for a long
period of time. Consequently, Quick Response (QR) is an outcome of the consumer’s
desire for new and diverse goods of great quality. The unstoppable movement towards
change can be attributed to “mass-customization” of products with shorter seasons,
market segmentation and micro merchandising, and a large number of product saturation
resulting in decreased market share (Christopher et. al., 2004). Therefore, the quick
response concept is simply the ability to shorten time in the supply chain (Christopher et.
14
al., 2004) and is often synonymous with terms such as speed-to-market and fast-fashion
(Keiser & Garner, 2012, p.14).
In 1999, Lowson, King, and Hunter defined QR as:
A state of responsiveness and flexibility in which an organization seeks to provide
a highly diverse range of products and services to a customer in the exact
quantity, variety and quality, and at the right time, place and price as dictated by
real time customer/consumer demand. QR provides the ability to make demand-
information driven decisions at the last possible moment in time ensuring that
diversity of offering maximized and lead-times, expenditure, cost and inventory
minimized. QR places an emphasis upon flexibility and product velocity in order
to meet the changing requirements of a highly competitive, volatile and dynamic
marketplace (p. 77).
Although supply chain management and agile supply chains were evolving, on
average, an apparel product would take about 66 weeks to reach the retail store (Barnes &
Lea-Greenwood, 2006). The improved agile supply chain and supply chain management
served as the background of QR (Christopher et al., 2004) and in efforts to supply a
solution, QR was developed by Kurt Salmon Associates in 1986. The literature
highlights the original success of QR as the improved efficiency for basic textile
products, however more recently; it will be more successful when used with fast moving
high-fashion goods (Fast Fashion) (Giunipero et al., 2001). Quick response reduces the
production cycle from several months to a few weeks (Taplin, 1999). QR was also
created as a result of the need for competitive response from suppliers to low cost threats
from overseas (Barnes & Lea-Greenwood, 2006). Therefore, QR is based on sharing
critical information such as, sales information, rather than being forecast driven
(Birtwistle, Siddiqui, & Fiorito, 2003). Detailed information about stock keeping units
(SKU) such as, style, size, colors, sales numbers and order schedules and deliveries helps
retailers to respond to consumer demand much faster (Birtwistle et al., 2003).
15
Fast Fashion
The apparel industry has taken a significant turn in the past 20 years due to the
expansion of boundaries in the fashion industry (Djelic & Ainamo, 1999). Doyle, Moore,
and Morgan (2006) contribute the boundary changes to the fading of mass production, the
increase in the number of fashion seasons, and modified structural characteristics in the
supply chain have forced retailers to desire low cost and flexibility in design, quality,
delivery and speed to market. Before the 90s, consumer demand and fashion trends were
forecasted by retailers long before hitting the market and now retailers compete with each
other by offering the ability to provide runway fashions rapidly. Retailers were
establishing close relationships with manufacturers that allowed them to experience
improved distribution, greater variety of products on sales and shorter selling seasons
(Taplin, 1999).
The industry was based on standardized styles and trends that did not change
often due to the design restrictions of the factories. In the past consumers were not
moved by style and fashion but by basic apparel (Bhardwaj & Fairhurst, 2010). The fad
of mass production happened because the industry had begun to see an increase in the
import of fashion oriented apparel for women as compared to the standardized apparel in
the 1980s (Bhardwaj & Fairhurst, 2010). With the introduction of fashion goods came
the increase of mark-downs in the market, deemed necessary due to the inability to sell
fashion apparel during the forecasted season (Bhardwaj & Fairhurst, 2010).
Historically, the apparel industry had four distinct stages that governed the
fashion life cycle. The stages were: introduction and adoption by fashion leaders; growth
and increase in the public acceptance, mass conformity (maturation), and the decline and
obsolescence of fashion (Bhardwaj & Fairhurst, 2010). Fashions were created on a
seasonal guideline consisting of Spring/ Summer and Autumn/ Winter and were largely
inspired by runway shows, trade fairs, and fabric event (Bhardwaj & Fairhurst, 2010;
Birtwistle et al., 2003). Demands of fashion consumers, the need for quick reaction for
emerging trends and the move away from planned forecasts has resulted in a shift in the
apparel buying cycle (Barnes & Lea-Greenwood, 2006).
16
Consumer Driven. Fast fashion stems from the abundance of low cost apparel
collections that are available as knock-offs of the luxury brands (Joy et al., 2012). It is a
fast-response system to evolving trends that encourage disposability (Fletcher, 2008).
Overtime, fashion has evolved into a concept similar to fast food. Just like fast food,
convenient food prepared quickly and easily, fast fashion has become convenient for
consumers. Since, “the speed of fashion has become increasingly faster through instant
access to information through technology and quick production techniques, it is crucial
that manufacturers design, manufacture, and promote so that looks are desired at the
correct moment for the consumer” (Rousso, 2012, p. 114).
Bahardwaj and Fairhurst (2010) suggest that the fast fashion consumer-driven
approach is still fairly new and under-researched and requires constant review of
consumer behavior to understand the phenomenon. Therefore, the studies of (Barnes and
Lea-Greenwood, 2006; Bhardwaj and Fairhurst, 2010; (Cachon & Swinney, 2011) have
transitioned from a supplier driven approach to a consumer-driven approach to fast
fashion. The consumer-driven approach assumes that the process of renovation in the
fashion industry is fueled by the constant varying of consumer demands and the changes
in their lifestyle (Sproles & Burns, 1994). Cachon and Swinney (2011) suggest that the
consumer is also knowledgeable about the latest fashion trends and feels the need to
adapt to the reality around him or her in an affordable and dynamic way. Likewise the
shift represents the advent of “disposable” fashion, where the focus is on the product’s
affordability rather than quality (Christopher et al., 2004). Fast fashion gives the
consumer numerous apparel choices and affords them the opportunity to make a fashion
mistake, because the financial and psychological investment required is minimal
(Gabrielli, Baghi, & Codeluppi, 2012).
Supply Chain Driven. In the beginning, fast fashion strategies did not consider
the consumer’s consumption practices (Gabrielli et al., 2012). Bhardwaj and Fairhurst
(2010) examine fast fashion in terms of the consumer’s habits and consider the disposal
of fashion, which puts the focus on affordability and variety rather than product quality.
Therefore to satisfy the large consumer demand retailers routinely seek out new trends to
purchase weekly to introduce new items and replenish stock (Tokatli & Kizilgun, 2009).
17
Due to the ever-changing lifestyle of the consumer and their desire for newness, pressure
has been put on the established supply chain format and shifted the focus from price to
fast response (Barnes and Lea-Greenwood, 2006). As a result of rapid turnover there is
lower manufacturing and labor cost (Joy et al., 2012). So, retailers adopt the fast fashion
strategy to reflect current and emerging trends quickly and before their competition
(Fernie, 2004), with expectations of reducing demand uncertainty and generating high
consumption by shortening the production cycle of apparel products during the selling
season (Choi, Liu, Liu, Mak, & To, 2010).
The literature suggest that fast fashion has had an impact on the supply chain due
to the consumers constant demand for newness (Barnes & Lea-Greenwood, 2006).
“Traditionally in fashion industries orders from retailers have had to be placed on
suppliers many months ahead of the season” (Christopher et al., 2004, p. 369). Retailers
have gained power by creating partnerships with manufactures to supply product quickly.
When retailers work directly with the manufacturers they are able to be demand
responsive and react efficiently to sales by ordering more and getting product into the
stores quickly or by canceling orders of poor performing product (Barnes & Lea-
Greenwood, 2006). Consequently, when manufacturers are unable to meet the demands
of the retailer, the retailer may choose to take their business elsewhere. Setting
requirements for the manufacturer ensures that the supplier will supply the right product,
in the right conditions at the right time (Barnes & Lea-Greenwood, 2006). In this case
the retailer holds the cards as to manufacturers do not want to loose their business
(Barnes & Lea-Greenwood, 2006). Making the power of the retailer stronger is the
pressure placed on suppliers by the change in demand. The demand has pushed retailers
to increase responsibilities to the supplier by expecting them to carry out quality control
procedures, packaging, ticketing and product development (Barnes & Lea-Greenwood,
2006). Barnes and Lea-Greenwood (2006) make clear that fast fashion is a business
strategy that aims to reduce the processes of the buying cycle and lead times, in order to
satisfy consumer demand at its peak. Originally, customer demand was forecast-based,
by the buyer, with the known risk of possibly being overstocked or under stocked
(Christopher et al., 2004).
18
Sustainable Fashion
Sustainability includes social responsibility (human rights), energy and materials
use, production, consumption, disposal, and recycling. It also describes practices and
policies that reduce environmental pollution and do not exploit people or natural
resources in meeting the lifestyle needs of the present without compromising the future.
Sustainable fashion is living in harmony with nature and employing skilled workers in a
safe and humane working environment (Partridge, 2011). As for sustainable fashion, the
Nordic Fashion Association (2012) defines sustainable fashion as a dynamic process to
develop and implement design philosophies and business practices for managing the
economic, social and environmental factors. These factors of sustainable fashion are
most often described as the “triple bottom line” that assess sustainable improvement
(Hacking & Guthrie, 2008). The sustainability of a product is quantitatively assessed
through the use of a Life Cycle Assessment tool that addresses only the environmental
factor of the sustainable design.
Yvon Chouinard (2008) founder and owner of Patagonia, Inc. says, “sustainable
production means, you take out the same amount of energy as you put in with no
pollution or waste” (p.ix). Sustainable fashion is apparel produced without exhausting
resources or fouling the environment. However, (Joy, Sherry, Venkatesh, Wang, &
Chan, 2012) say, “While fast fashion companies can emulate luxury product, they may be
less able to match deeper elements of value, such as high ethical standards in sourcing,
efficient use of materials, low-impact manufacturing, assembly, and distribution; and the
availability of repair and upgrade services” (p.290). Therefore Orzada and Moore (2008)
stress that the “Design of textile and apparel products for a sustainable future depends on
an understanding of the relationship between fiber, yarn, and fabric” (p.302).
Product Life Cycle
The product life cycle is an analysis of product’s entire life that begins with raw
materials extraction and ends with disposal. However to encourage sustainability, a
product’s life cycle is an ongoing circle as production continues to grow. The purpose of
a product’s life cycle is to reduce its resource use and emissions to the environment as
19
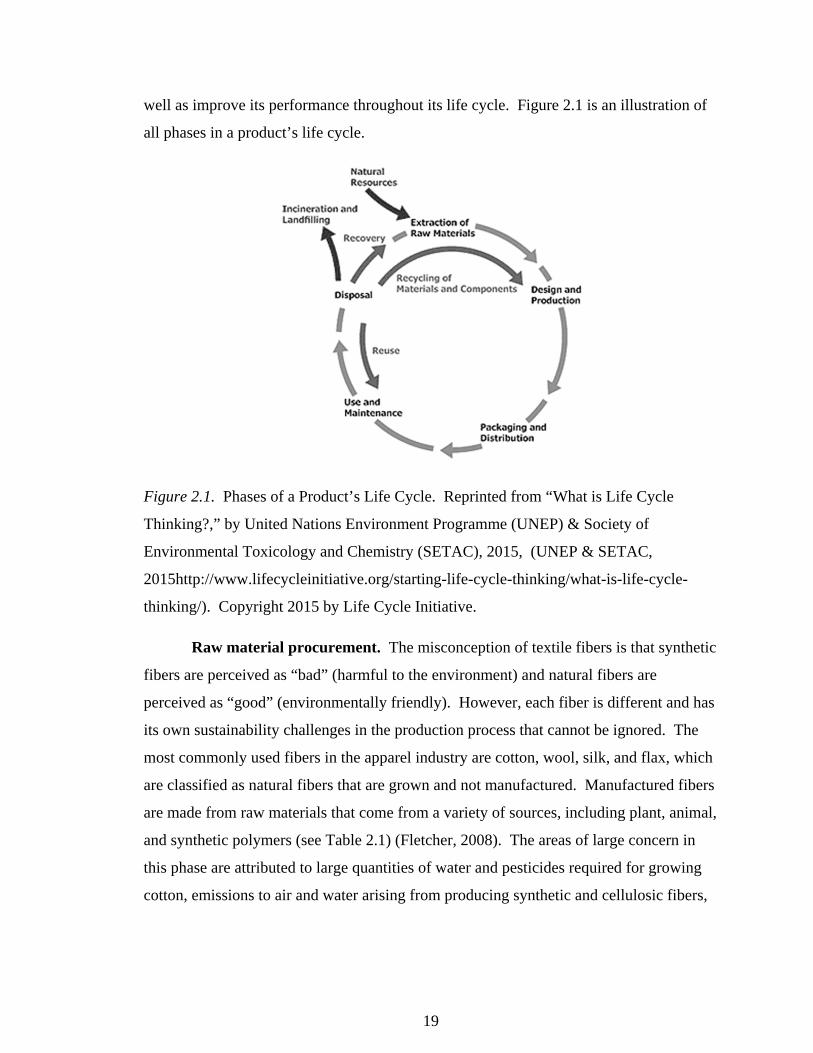
well as improve its performance throughout its life cycle. Figure 2.1 is an illustration of
all phases in a product’s life cycle.
Figure 2.1. Phases of a Product’s Life Cycle. Reprinted from “What is Life Cycle
Thinking?,” by United Nations Environment Programme (UNEP) & Society of
Environmental Toxicology and Chemistry (SETAC), 2015, (UNEP & SETAC,
2015http://www.lifecycleinitiative.org/starting-life-cycle-thinking/what-is-life-cycle-
thinking/). Copyright 2015 by Life Cycle Initiative.
Raw material procurement. The misconception of textile fibers is that synthetic
fibers are perceived as “bad” (harmful to the environment) and natural fibers are
perceived as “good” (environmentally friendly). However, each fiber is different and has
its own sustainability challenges in the production process that cannot be ignored. The
most commonly used fibers in the apparel industry are cotton, wool, silk, and flax, which
are classified as natural fibers that are grown and not manufactured. Manufactured fibers
are made from raw materials that come from a variety of sources, including plant, animal,
and synthetic polymers (see Table 2.1) (Fletcher, 2008). The areas of large concern in
this phase are attributed to large quantities of water and pesticides required for growing
cotton, emissions to air and water arising from producing synthetic and cellulosic fibers,
20
adverse impacts on water linked to natural fiber production and significant use of energy
and non-renewable resources for synthetics (Fletcher, 2008).
21
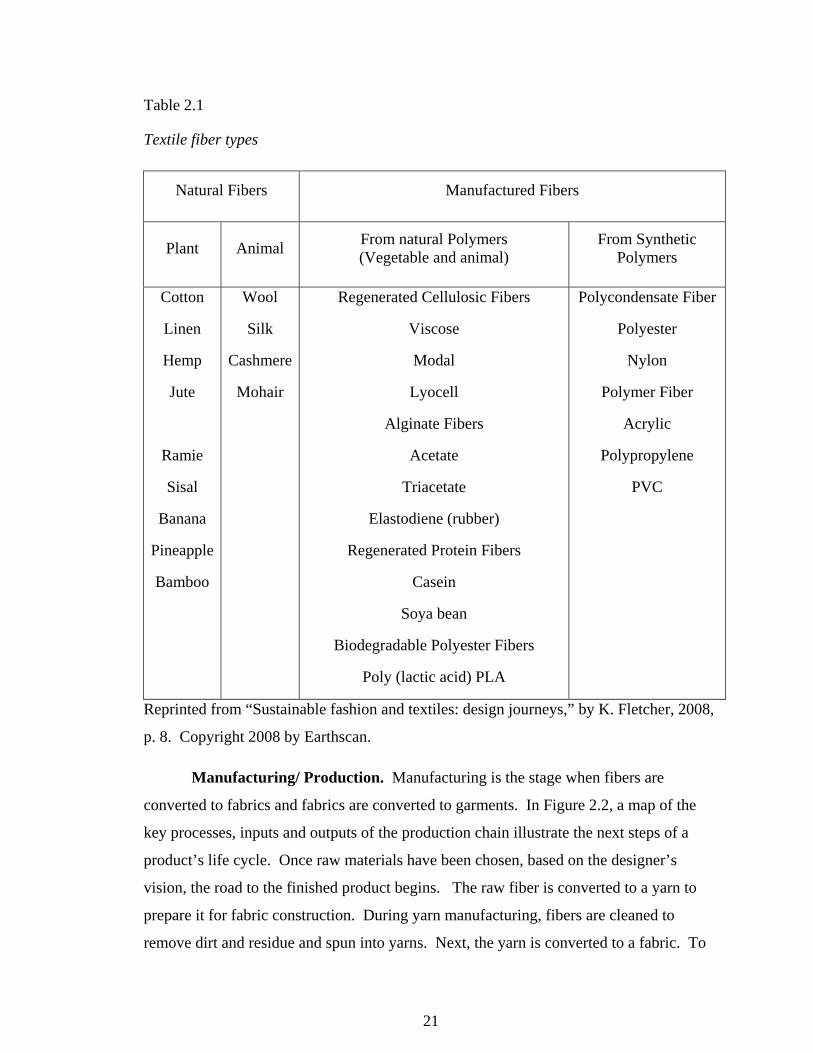
Table 2.1
Textile fiber types
Natural Fibers Manufactured Fibers
Plant Animal From natural Polymers (Vegetable and animal)
From Synthetic Polymers
Cotton
Linen
Hemp
Jute
Ramie
Sisal
Banana
Pineapple
Bamboo
Wool
Silk
Cashmere
Mohair
Regenerated Cellulosic Fibers
Viscose
Modal
Lyocell
Alginate Fibers
Acetate
Triacetate
Elastodiene (rubber)
Regenerated Protein Fibers
Casein
Soya bean
Biodegradable Polyester Fibers
Poly (lactic acid) PLA
Polycondensate Fiber
Polyester
Nylon
Polymer Fiber
Acrylic
Polypropylene
PVC
Reprinted from “Sustainable fashion and textiles: design journeys,” by K. Fletcher, 2008,
p. 8. Copyright 2008 by Earthscan.
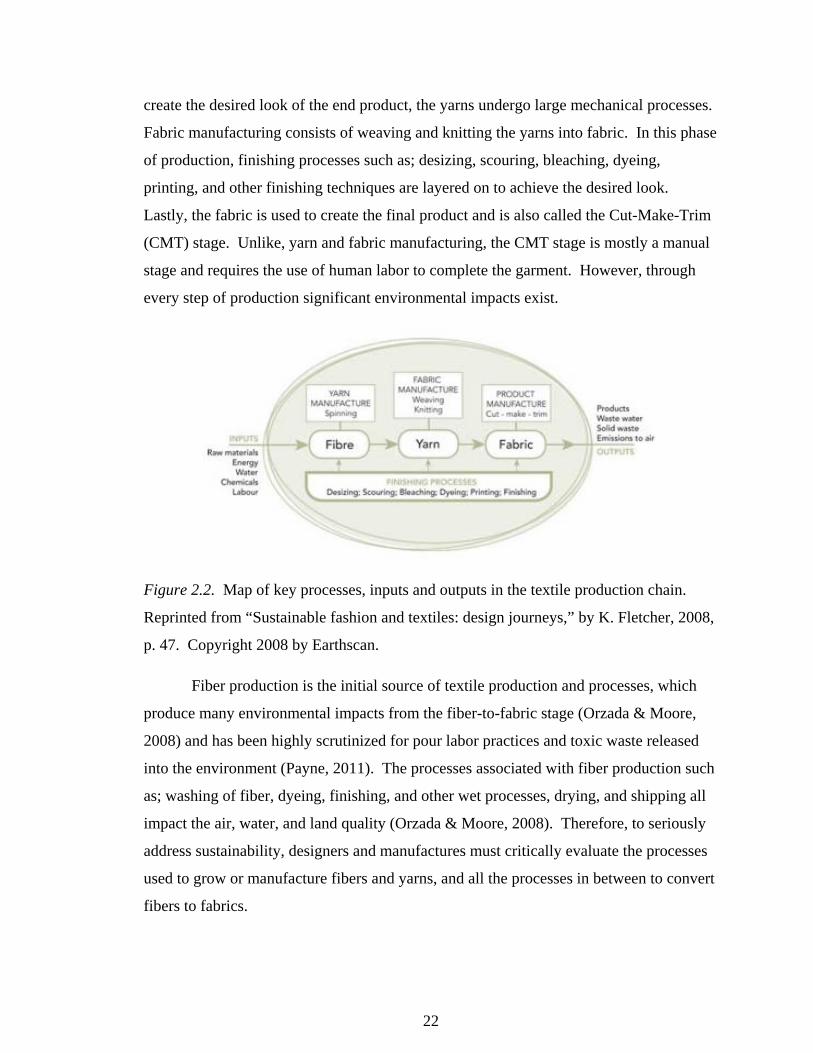
Manufacturing/ Production. Manufacturing is the stage when fibers are
converted to fabrics and fabrics are converted to garments. In Figure 2.2, a map of the
key processes, inputs and outputs of the production chain illustrate the next steps of a
product’s life cycle. Once raw materials have been chosen, based on the designer’s
vision, the road to the finished product begins. The raw fiber is converted to a yarn to
prepare it for fabric construction. During yarn manufacturing, fibers are cleaned to
remove dirt and residue and spun into yarns. Next, the yarn is converted to a fabric. To
22
create the desired look of the end product, the yarns undergo large mechanical processes.
Fabric manufacturing consists of weaving and knitting the yarns into fabric. In this phase
of production, finishing processes such as; desizing, scouring, bleaching, dyeing,
printing, and other finishing techniques are layered on to achieve the desired look.
Lastly, the fabric is used to create the final product and is also called the Cut-Make-Trim
(CMT) stage. Unlike, yarn and fabric manufacturing, the CMT stage is mostly a manual
stage and requires the use of human labor to complete the garment. However, through
every step of production significant environmental impacts exist.
Figure 2.2. Map of key processes, inputs and outputs in the textile production chain.
Reprinted from “Sustainable fashion and textiles: design journeys,” by K. Fletcher, 2008,
p. 47. Copyright 2008 by Earthscan.
Fiber production is the initial source of textile production and processes, which
produce many environmental impacts from the fiber-to-fabric stage (Orzada & Moore,
2008) and has been highly scrutinized for pour labor practices and toxic waste released
into the environment (Payne, 2011). The processes associated with fiber production such
as; washing of fiber, dyeing, finishing, and other wet processes, drying, and shipping all
impact the air, water, and land quality (Orzada & Moore, 2008). Therefore, to seriously
address sustainability, designers and manufactures must critically evaluate the processes
used to grow or manufacture fibers and yarns, and all the processes in between to convert
fibers to fabrics.
23
During fiber production the washing of fibers consist of using chemicals that can
be extensive and include toxic, corrosive, or biologically modifying reagents (Orzada &
Moore, 2008). However, fiber cleaning is necessary before moving on to the next step of
creating yarns and is accomplished with the use of water or detergent. What makes the
process harmful is the wastewater that contains pesticides or contaminants from natural
fibers that are released into the environment. For example, scouring fibers is an in-depth
cleaning procedure that removes persistent dirt from cotton, de-gum silk, or remove dirt
and grease from wool (Orzada & Moore, 2008). Sodium hydroxide is an alkali used
during scouring that damages fibers and leads to environmental contamination (Slater,
2005). Scouring involves hot water and detergents to remove soils, vegetable impurities,
grease and other contaminants from fibers (IFC, 2007). Bleaching is another method
used to clean fibers to remove the natural off-white color. Chlorine is the most common
bleaching agent used that damages protein fibers and is a major cause of environmental
issues, and it produces dangerous by-products during oxidation reactions (Slater, 2005).
In addition to cleaning fibers, dyeing and finishing also require chemicals and
large quantities of water. Dye residuals from preparation and finishing are often found in
waterways (Orzada & Moore, 2008) making the water supply harmful for the
environment and people. Finishing is a basic step of fiber transformation that consumer
products have received one or more treatments during production. The main processes of
fabric preparation can be attributed to desizing, bleaching, mercerizing, dyeing, printing,
and other specific treatments (IFC, 2007). These processes create significant wastewater
effluents (IFC, 2007). In the past, fabric finishing was performed by saturating in a water
bath for long periods of time however, since then improvements have been made to the
process to reduce the water and energy use(Orzada & Moore, 2008). Finishes can be
applied mechanically or chemically. Mechanical finishes involve the use of heat and
moisture while chemical finishes use chemical substances to produce the desired end
product. Finishes that create designs are applied with chemicals such as; sulfuric acid,
phenol, and sodium hydroxide (Collier & Tortora, 2011) using a method similar to
printing (Orzada & Moore, 2008). Alternatives to safer methods of textile finishing are
available however; the environmental impacts are never fully eliminated.
24
Environmental hazards also come in the form of emissions to air. Air pollutants
also happen during the finishing stages such as; drying, printing, fabric preparation and
through wastewater treatment residues (IFC, 2007). Solvents are released into the air as
residual from coating/ finishing fabrics, and from high-temperature drying ovens.
Solvents released into the air are harmful because they may contain compounds like
acetaldehyde, chlorofluorocarbons, dichlorobenzene, ethyl acetate, methylnaphthalene,
chlorotoluene, and many others (IFC, 2007).
Distribution. Transportation to the consumer is a large factor when considering
the LCA because large amounts of gas are used to transport. Now with higher gas prices
the freight charges have also increased. However, the transportation piece of distribution
does not only take place after manufacturing. Transportation is a large environmental
factor that happens in between each step of the life cycle. With raw materials grown in
one county and fabric production and garment assembly done in another, the garment
crosses the globe several times before it reaches the retail floor (Payne, 2011). The
distribution phase also focuses on simplifying the amount of packaging used to make the
product floor ready. Extra packing added at the end of production affects the cost of the
product and creates more waste that ends up landfills. It is extremely hard to quantify the
transportation impact.
Consumer Use. Consumer Use of the life cycle assessment process is geared to
the consumer and is no longer within the manufacturers control. This phase encourages
consumers to buy only when needed and take care of clothes to prolong the life.
Programs show that companies put much effort into encouraging customers about the
benefits of taking great care of their cloths such as; Levi Strauss & Co. “Care tag, for our
Planet”, reminding consumers to wash in cold and wash less (www.levistrauss.com),
mainly because consumer use has a larger environmental impact than production in some
textile products (Fletcher, 2008). Therefore, from the viewpoint of a designer or
manufacturer it is important to consider the use of the garment throughout its life cycle
when discussing sustainability.
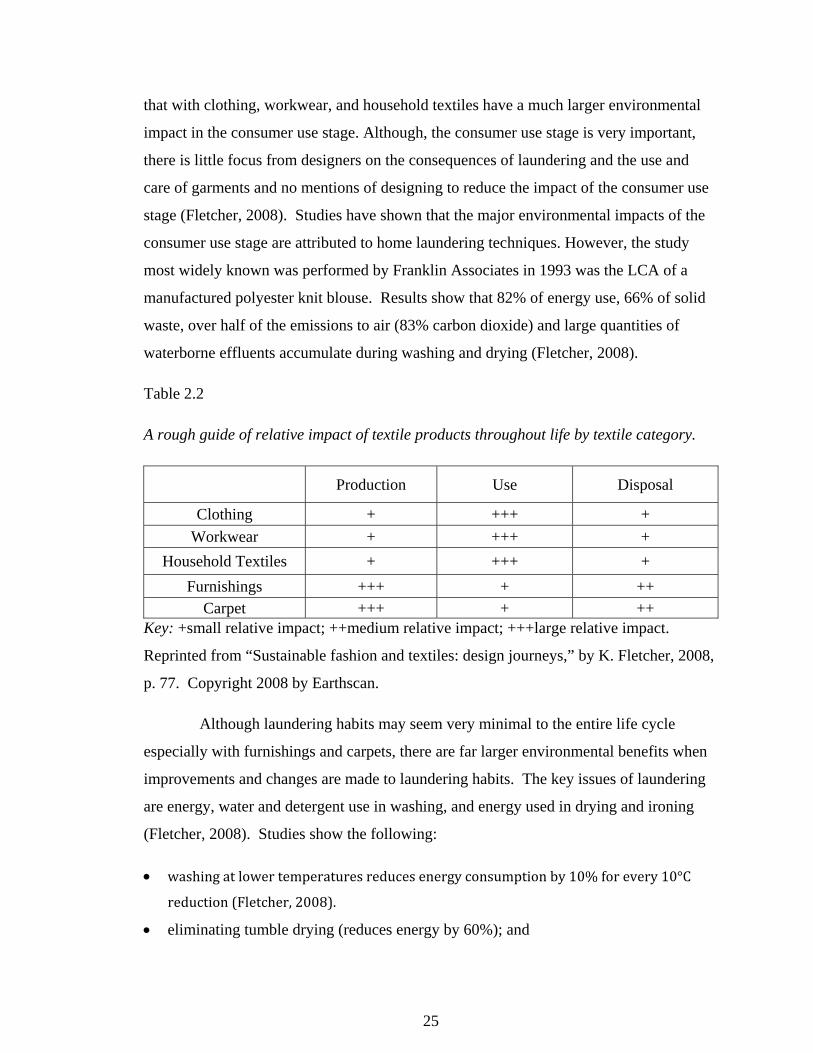
Table 2.2 illustrates the environmental impact by textile category reprinted from
“Sustainable fashion and Textiles: design journeys”(Fletcher, 2008). The table shows
25
that with clothing, workwear, and household textiles have a much larger environmental
impact in the consumer use stage. Although, the consumer use stage is very important,
there is little focus from designers on the consequences of laundering and the use and
care of garments and no mentions of designing to reduce the impact of the consumer use
stage (Fletcher, 2008). Studies have shown that the major environmental impacts of the
consumer use stage are attributed to home laundering techniques. However, the study
most widely known was performed by Franklin Associates in 1993 was the LCA of a
manufactured polyester knit blouse. Results show that 82% of energy use, 66% of solid
waste, over half of the emissions to air (83% carbon dioxide) and large quantities of
waterborne effluents accumulate during washing and drying (Fletcher, 2008).
Table 2.2
A rough guide of relative impact of textile products throughout life by textile category.
Production Use Disposal
Clothing + +++ +
Workwear + +++ +
Household Textiles + +++ +
Furnishings +++ + ++ Carpet +++ + ++
Key: +small relative impact; ++medium relative impact; +++large relative impact.
Reprinted from “Sustainable fashion and textiles: design journeys,” by K. Fletcher, 2008,
p. 77. Copyright 2008 by Earthscan.
Although laundering habits may seem very minimal to the entire life cycle
especially with furnishings and carpets, there are far larger environmental benefits when
improvements and changes are made to laundering habits. The key issues of laundering
are energy, water and detergent use in washing, and energy used in drying and ironing
(Fletcher, 2008). Studies show the following:
washingatlowertemperaturesreducesenergyconsumptionby10%forevery10°C
reduction(Fletcher,2008).
eliminating tumble drying (reduces energy by 60%); and
26
no ironing combined with lower washing temperatures can lead to 50% less total
energy consumption of the product (Fletcher, 2008).
Detergents are also a key issue within the consumer use phase that may have a large
impact on the environment. To reduce the quantity of detergent used, solutions such as
Switching to concentrated detergent uses less chemicals and less packaging (Fletcher,
2008)
Moving back to standard detergents is an option in order to assure consumers are
using the right level of detergent when washing to avoid overdosing.
Eliminating detergents all together and use washing balls filled with ceramic balls
that ionize oxygen molecules in the water to lift dirt from clothes (as detergent would)
without the use of chemicals.
On the other hand dry cleaning methods use a combination of liquid solvents and
detergents. Perchloroethylene (perc), is the most commonly used liquid dry cleaning
solution that is a petrochemical-based solvent (Fletcher, 2008). It is coupled with
detergent and the garment and agitated in a machine to remove dirt, oils and stains.
However it causes serious damage to the central nervous system, liver, kidneys and
reproductive system after long periods of exposure (Fletcher, 2008). As you can see, the
consumer use stage has a variety of cleaning methods that are harmful to the environment
and human health over a period of time. As sustainable fashion evolves, designers and
manufactures cannot ignore the consumer use stage as it has significant impact.
Designing and manufacturing with the care of garments in mind will encourage
consumers to think responsibly and instill value into the wardrobes. In doing so, there is
a better chance of prolonging the life of beloved fashion items and successfully closing
the loop of a product’s life cycle.
Disposal. What choices do consumers make when their favorite apparel item is
no longer meeting their needs? Do they donate it? Do they re-sell it? Or maybe they
simply throw it away. The disposal stage is the end of the product life cycle and Fletcher
(2008) points out that a consumer’s behavior is equally about disposal as it is buying.
Morgan and Birtwistle (2009) conclude that young consumers felt that fast fashion
27
encouraged a ‘throwaway culture’ were products and fashion lost intrinsic value,
encouraging consumers to replace and dispose of products before the end of their
intended life cycle. Manufacturers and designers can constantly make improvements to
sustainable fashion however, if the consumer is not aware of ways to help make a
positive environmental impact, the work is null and void. Utilizing the LCA data helps
manufacturers and designers better identify the environmental impacts and inform
consumers on how to close the loop.
The facts show that the U.S. generates on average 25 billion pounds of textiles per
year (EPA, 2009), which equates to about 82 pounds per U.S. resident. But of that 82
pounds per U.S. resident only 15% is donated or recycled (CTR, 2015). That leaves a
whopping 85% of all textiles are released into landfills (EPA, 2009). Or roughly, 70
pounds of textiles are thrown away by consumers yearly (CTR, 2015). The disposal
stage encourages recycling and donating. The goal is to reduce the amount of waste
going to landfills, to help positively affect our environment.
The most commonly known waste management strategies are the 3 R’s, also
known as reduce, reuse, and recycle. Reduce means to simply not buy. Eliminate the
amount owned and purchased. The EPA (2015) encourages consumers to buy products
with less packaging such as products with less added hangtags, no plastic wrap, or no
plastic hangers. The reuse of products refers to using the product for the same purpose or
for something completely different. Repair or reconditioning garments for new use has
been around for many generations and was originally done for economic reasons
(Fletcher, 2008). Repairing old items was practiced in the industry and in homes because
the labor was cheaper than purchasing new textile materials and garments (Fletcher,
2008). To create new life, in home techniques were replacing shirt collar and cuffs, using
old denim and knitwear to create blankets, cutting worn bed linens and clothing for
household cleaning purposes, patching trousers and jackets etc. However, the modern
day repairing and reconditioning of textiles and garments has decreased as a result of low
prices and the demand for the latest trends (Fletcher, 2008). Reusing also considers
donating unwanted items to charity groups or even to a family member or friend. “One
mans trash is another man’s treasure”. This old cliché saying has a rewarding undertone
28
in the fact that when donating not only are you preventing landfill waste but experiencing
a far better reward in helping others in need. The benefits of reducing and reusing are
vast, but the EPA (2015) list several important benefits for consumers such as
prevents pollution caused by reducing the need to harvest new raw materials;
saves energy and money;
reduces greenhouse gas emission that contribute to the global climate change;
helps sustain the environment for future generations;
reduces the amount of waste to be recycled or sent to landfills and incinerators; and
allows products to be used to their fullest extent.
Last, recycling is the process of collecting and processing materials that is
considered trash and turning it into a new product. Recycling saves resources and uses
less energy than the production of new items. Extracting fibers from fabrics is the
mechanical process by which garments are made new. Many programs specialize in
recycling old to new. Cotton Inc. established a recycling program called “The Cotton
From Blue to Green” in 2006 to emphasize the natural and environmental attributes of
cotton and to offer people the opportunity to give back to their community
(Cottoninc.com). Cotton Inc. takes all donated denim and partners with Bonded Logic
Inc. to transforms denim back to cotton fibers and into UltraTouch™Denim Insulation for
homes and civic building for communities in need. Patagonia is also another company
that uses recycled materials to form new sustainable products. Patagonia uses recycled
nylon, recycled polyester, and recycled wool in their product lines to help lessen their
environmental footprint. Using recycled nylon helps reduce the their dependency on
petroleum (Patagonia.com). In 1993 they also were the first company to transform trash
into fleece using plastic soda bottles, hence producing recycled polyester
(Patagonia.com). The use of recycled wool reduces the land use for sheep gazing,
eliminates the dyeing process by using and blending a variety of colored dyed wools, and
encourages new recycling opportunities for wool products that are no longer usable
(Patagonia.com). While synthetic textiles do not decompose and woolen textiles create
methane when decomposed, recycling garments is a sure way to protect our nations’
29
landfills. The possibilities are endless with recycling and have many environmental and
economic benefits.
Life Cycle Assessment
An undeniable fact is that any apparel product or textile product manufactured,
requires the use of raw materials, energy, equipment, and labor, which are determined in
the design and product development stage. While decisions are being made about
manufacturing, usage, maintenance, and the disposal of an apparel product, the
environment impacts are also being considered (Orzada & Moore, 2008). Hence, the Life
Cycle Assessment (LCA) is necessary because it is a detailed analysis of a product’s
design by assessing the environmental and economic impacts during the product’s life
cycle to ensure sustainable development. It describes the entire life of a product, which
encompasses raw material extraction, material production, manufacturing, product use,
the end-of-life disposal, and all the transportation that occurs in between each stage
(ANSI/ISO 14040-1997). The LCA is a compilation and evaluation of the inputs, outputs
and the potential environmental impacts of a product system throughout its life cycle
(ANSI/ISO 14040-1997).
Sivaramakrishnan (2012) notes that the “LCA explains in detail the waste
potential, energy usage and environmental effects of each stage” (p.50). In the
development stages of a sustainable product, assessment tools have been integral in the
process, giving designers and manufacturers an internal report card (Curwen, Park, &
Sarkar, 2013). Life cycle analyses are critical for understanding the global progress of
reducing negative impacts on the environment. Currently, the LCA is the most
comprehensive approach to assessing the environmental impacts of an apparel product
and is graded by the ISO 14040-14043 industry standard (Sivaramakrishnan, 2012). The
Life Cycle Assessment does not include social or economic impacts of sustainability.
The Life cycle assessment framework is described in four phases as seen in
Figure 2.3. The assessment is based on the goal and scope, inventory analysis, impact
assessment and interpretation of results (ANSI/ISO14040-1997 14040-1997). The
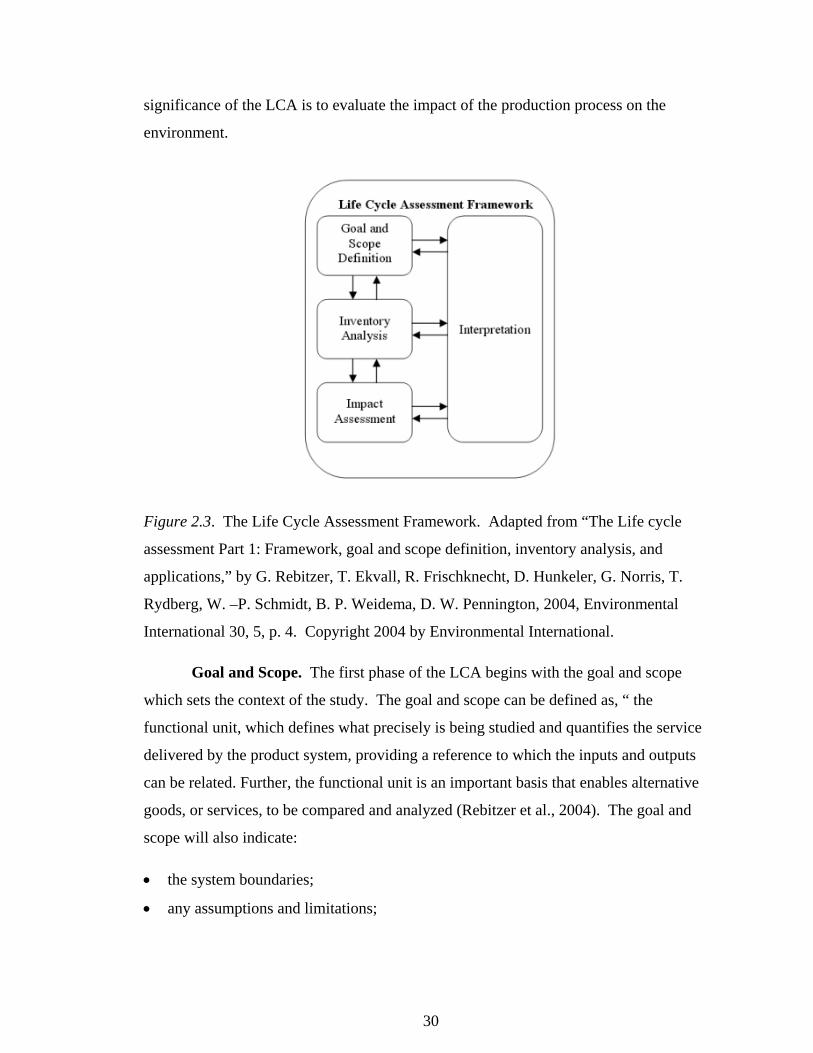
30
significance of the LCA is to evaluate the impact of the production process on the
environment.
Figure 2.3. The Life Cycle Assessment Framework. Adapted from “The Life cycle
assessment Part 1: Framework, goal and scope definition, inventory analysis, and
applications,” by G. Rebitzer, T. Ekvall, R. Frischknecht, D. Hunkeler, G. Norris, T.
Rydberg, W. –P. Schmidt, B. P. Weidema, D. W. Pennington, 2004, Environmental
International 30, 5, p. 4. Copyright 2004 by Environmental International.
Goal and Scope. The first phase of the LCA begins with the goal and scope
which sets the context of the study. The goal and scope can be defined as, “ the
functional unit, which defines what precisely is being studied and quantifies the service
delivered by the product system, providing a reference to which the inputs and outputs
can be related. Further, the functional unit is an important basis that enables alternative
goods, or services, to be compared and analyzed (Rebitzer et al., 2004). The goal and
scope will also indicate:
the system boundaries;
any assumptions and limitations;
31
the allocation metods used to partition the envrionmental load of a process when
several products or functions share the same process (The Functional Unit);
the impact categories chosen (14040-1997).
Life Cycle Inventory Analysis (LCI). The Life Cycle Inventory Analysis
focuses on inventory flows to and from nature. The inventory flows are the inputs of
water, energy, and raw materials and the outputs into the air, land, and water. A flow
chart is typically used to illustrate the what is being assessed with in the study and
process of sustainable design. The quality of the data being assessed is entirely
dependent on the product’s availability of information and should be checked against
several resources (ISO 14040:2006). When the study is complete, the inventory analysis,
the model will reveal quantitative results of the product’s total emissions, waste, energy
consumed, and resouces used throughout the it’s life cycle (Baumann and Tillman,).
Life Cycle Impact Assessment (LCIA). After the inventory analysis, follows
the impact assessment. This phases focuses on taking the results of the inputs and outputs
and strategically categorizes them. Data is orgaznized into a flowchart of the processess
that represent the input and output flows. During the impact assessment, the researcher
should be sure to represent a full picture of the prouct’s environment impact, while not
loosing focus on insignificant factors (Hsu, 2009). The mandatory elements of the
impact assessment are
the selection of impact categories, category indicators, and characterization models;
the classificaiton stage, where the inventory parameters are sorted and assigned; and
impact measurement, indicating where the inventory in categories are characterized,
using many possible LCA methodologies.
Life Cycle Interpretation. The interpretation of the study aids in ensuring the
validity of the study. It is important to review the results by identifying key data
elements that had a large significance to the study and the environment. The ISO
14040:2006 requires the interpretation phase to have:
32
identification of significant issues based on the results of the LCI and LCIA phases of
a LCA;
evaluation of the study considering completeness, sensitivity and consistency checks;
and
conclusions, limitations and recommendations.
According to the ISO 14042, the Life Cycle Impact Assessment (LCIA) standard,
the three main groups of environmental impact are resource use, human heatlh
consequences, and ecological consequences. The environmental imapct groups are
further divided into categories, included are: climate change, stratosphere ozone
depletion, photooxidant formation (smog), eutrophicaton, acidification, water use, noise
(Pennington, Potting, Finnveden, Lindeijer, Jolliet, Rydberg, Rebitzer, 2004). The LCIA
also consist of mandatory and optional elements. The International Organization for
standardization (ISO) 14042 (2003) states the mandatory elements of the LCIA are the
impact categories, category indicators, and characterization models, impact results, and
calculation of category indicator results. The optional elements as outlined in the ISO
14042 standards, are the calcultations of the magnitude of category indicators, grouping
and/or weighing of results, and data quality analysis.
There are differences in conducting LCAs because many LCIAs address different
questions and products, therefore, resulting in the use of different approaches. There is
no single method that is applicable in all situations. Some LCAs focus on the waste and
emissions of a product life cycle inventory, but often do not reflect the full extent of
releases nor are they necessarily associated with the product of interest in the study
(Pennington et al., 2004). Since the LCA is a comparative assessment methodology,
inconsistences vary and may introduce unintentional bias (Pennington et al., 2004).
LCAs can also differ in the risk and impacts estimated. Pennington et al., (2004) gives an
example comparing two LCAs that analyze toxicological impacts, one may estimate
impacts to the whole population whereas common toxicology impact approaches the
specific exposure concentrations for individuals are compared to policy-based toxicity
thresholds or standards. Furthermore, the independent developments of LCAs have led to
33
discrepancies between methods that cannot be explained by necessity alone, therefore
allowing historical factors to play an important role (Goedkoop et al., 2013).
ReCiPe 2008 LCA Method
LCAs have gained popularity since the 1990s when the first studies were
conducted on products regarding sustainability. The CML (Centrum Milieukunde
Leiden), the Eco-indicator 95, and the later version Eco-indicator 99 are LCA
methodologies that paved the way of examining environmental impacts and are widely
accepted methodologies (Goedkoop et al., 2013). The CML approaches the baseline
method of characterization (the midpoint) and the Eco-indicator 99 focuses on the
interpretation of results (the end point) (Goedkoop et al., 2013). It was deemed important
and desirable to develop a methodology where midpoint and endpoint could be used.
Therefore, the ReCiPe method and design was developed by a group of LCA experts
from RIVM, CML, PRé Consultants, and Radboud University Nijmegen (see Appendix
A). The ReCiPe 2008 LCA tool condenses and combines the long list of inventory
results into a small limited number of environmental impact categories (midpoint and
endpoint categories) (Goedkoop et al.). The method is designed according to the Cultural
Theory by Thompson in 1990 that follows three perspectives: individualist (I), hierarchist
(H), and egalitarian (E) (Goedkoop et al., 2013; Thompson, Ellis, & Wildavsky, 1990).
Throughout the study the perspectives are subjective and affect the results of the endpoint
depending on the perspectives of the researcher.
Perspective (I) is based on the short term, undisputed impact types, technological
optimism (Thompson et al., 1990)
Perspective (H) is based on the most common policy principles in regards to time-
frame and other issues (Thompson et al., 1990).
Perspective (E) takes into account the longest time-frame and impacts that are not
fully developed or established (Thompson et al., 1990).
ReCiPe 2008 indicates eighteen midpoints, much like the CML, and more
importantly three endpoint categories as the main principles of the method. The basis
and environmental issues linked to the midpoint and endpoint indicators are; climate
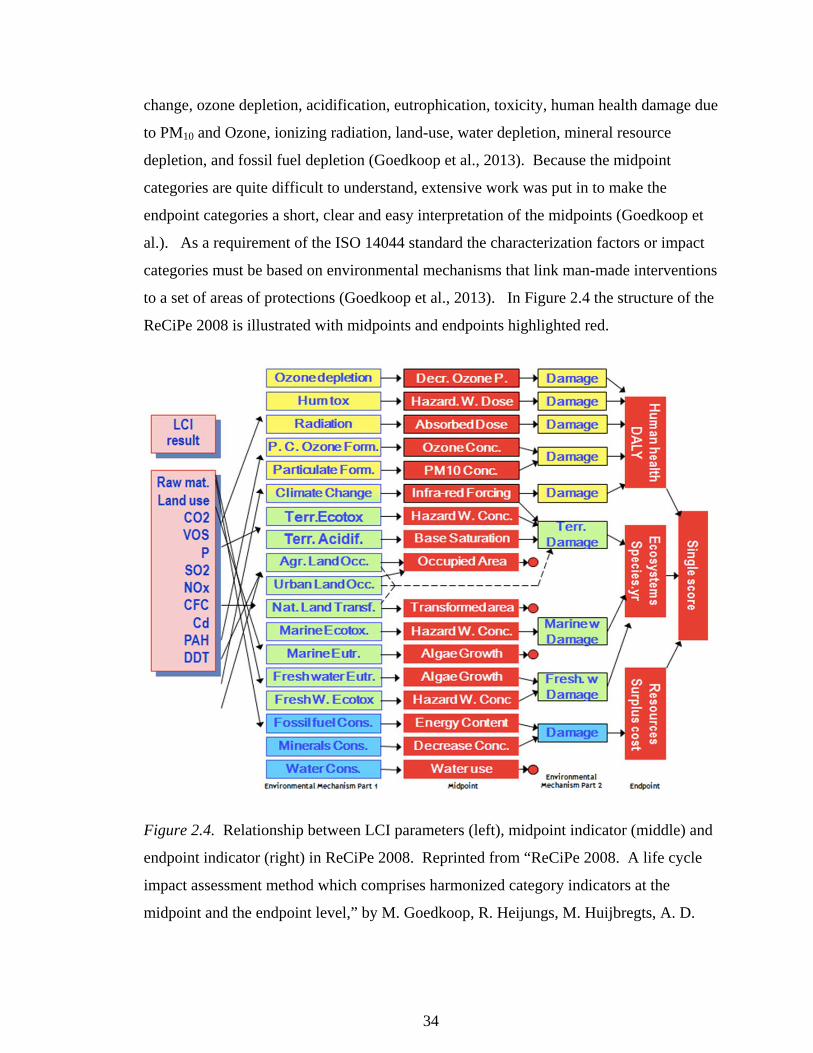
34
change, ozone depletion, acidification, eutrophication, toxicity, human health damage due
to PM10 and Ozone, ionizing radiation, land-use, water depletion, mineral resource
depletion, and fossil fuel depletion (Goedkoop et al., 2013). Because the midpoint
categories are quite difficult to understand, extensive work was put in to make the
endpoint categories a short, clear and easy interpretation of the midpoints (Goedkoop et
al.). As a requirement of the ISO 14044 standard the characterization factors or impact
categories must be based on environmental mechanisms that link man-made interventions
to a set of areas of protections (Goedkoop et al., 2013). In Figure 2.4 the structure of the
ReCiPe 2008 is illustrated with midpoints and endpoints highlighted red.
Figure 2.4. Relationship between LCI parameters (left), midpoint indicator (middle) and
endpoint indicator (right) in ReCiPe 2008. Reprinted from “ReCiPe 2008. A life cycle
impact assessment method which comprises harmonized category indicators at the
midpoint and the endpoint level,” by M. Goedkoop, R. Heijungs, M. Huijbregts, A. D.
35
Schryver, J. Struijs, R. V. Zelm, 2013, p. 3. Copyright by RIVM, CML, PRé
Consultants, and RUN, 2013.
Furthermore, impact categories are merely names of the environmental
mechanisms, and impact indicators are measurable data points of the impact categories.
Lastly, the midpoint travels through the system to an endpoint (category of damage).
Therefore, the endpoint is better explained as the areas of protection that form the basis of
decisions in policy and sustainable development (Goedkoop et al., 2013).. The eighteen
midpoints are expressed as follows; Climate Change (CC), Ozone Depletion (OD),
Terrestrial Acidification (TA), Freshwater Eutrophication (FE), Marine Eutrophication
(ME), Human Toxicity (HT), Photochemical Oxidant Formation (POF), Particulate
Matter Formation (PMF), Terrestrial Ecotoxicity (TET), Freshwater Ecotoxicity (FET),
Marine Ecotoxicity (MET), Ionizing Radiation (IR), Agricultural Land Occupation
(ALO), Urban Land Occupation (ULO), Natural Land Transformation (NLT), Water
Depletion (WD), Mineral Resource Depletion (MRD) and Fossil Resource Depletion
(FD). Table 2.3 is an explanation of midpoint categories, indicators, and characterization
factors
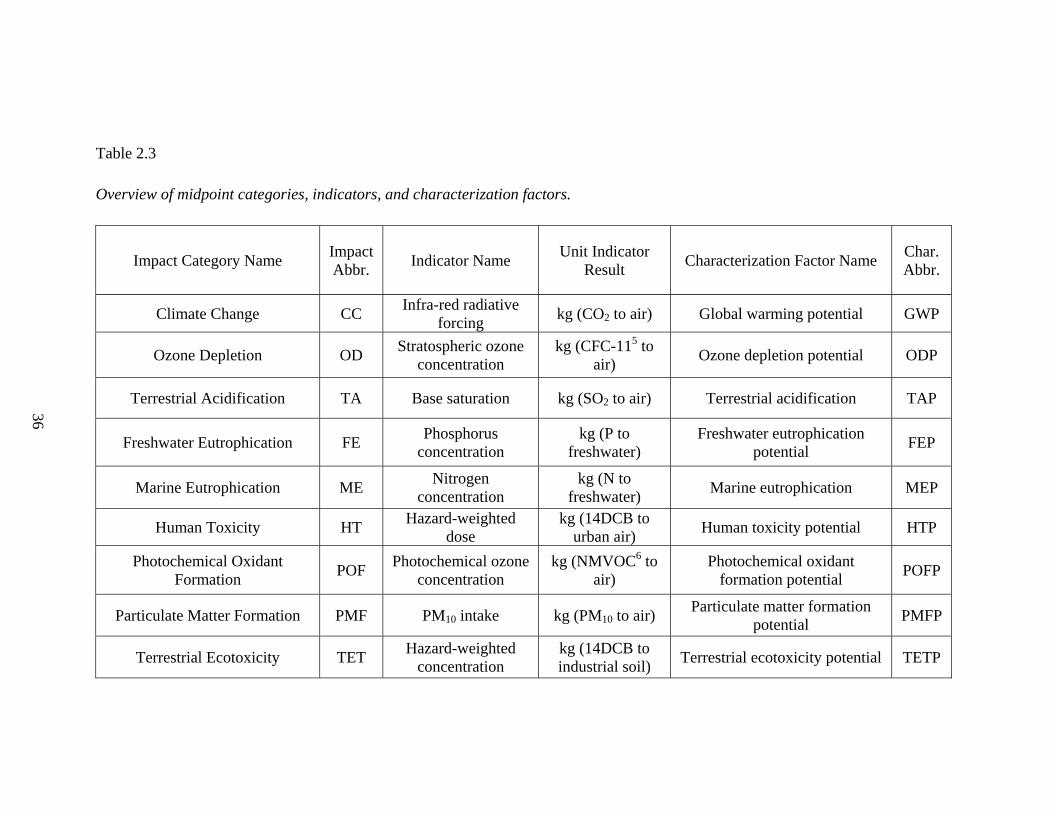
36
Table 2.3
Overview of midpoint categories, indicators, and characterization factors.
Impact Category Name Impact Abbr.
Indicator Name Unit Indicator
Result Characterization Factor Name
Char. Abbr.
Climate Change CC Infra-red radiative
forcing kg (CO2 to air) Global warming potential GWP
Ozone Depletion OD Stratospheric ozone
concentration kg (CFC-115 to
air) Ozone depletion potential ODP
Terrestrial Acidification TA Base saturation kg (SO2 to air) Terrestrial acidification TAP
Freshwater Eutrophication FE Phosphorus
concentration kg (P to
freshwater) Freshwater eutrophication
potential FEP
Marine Eutrophication ME Nitrogen
concentration kg (N to
freshwater) Marine eutrophication MEP
Human Toxicity HT Hazard-weighted
dose kg (14DCB to
urban air) Human toxicity potential HTP
Photochemical Oxidant Formation
POF Photochemical ozone
concentration kg (NMVOC6 to
air) Photochemical oxidant
formation potential POFP
Particulate Matter Formation PMF PM10 intake kg (PM10 to air) Particulate matter formation
potential PMFP
Terrestrial Ecotoxicity TET Hazard-weighted
concentration kg (14DCB to industrial soil)
Terrestrial ecotoxicity potential TETP
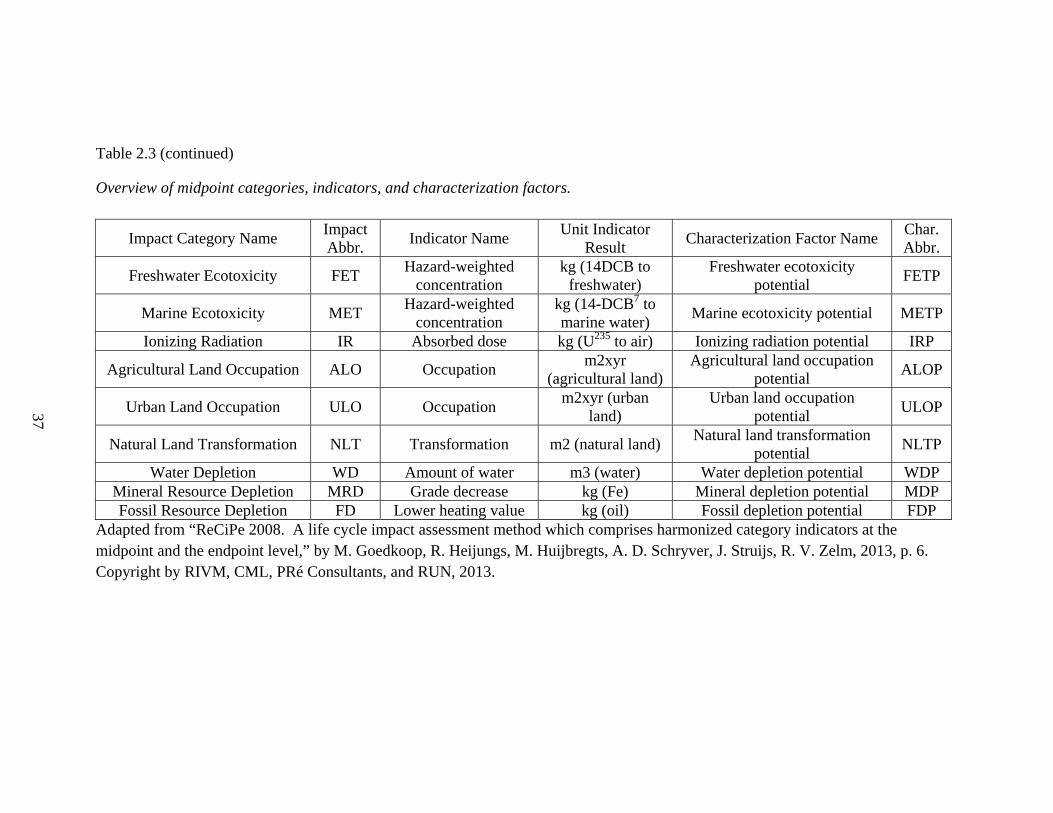
37
Table 2.3 (continued)
Overview of midpoint categories, indicators, and characterization factors.
Impact Category Name Impact Abbr.
Indicator Name Unit Indicator
Result Characterization Factor Name
Char. Abbr.
Freshwater Ecotoxicity FET Hazard-weighted
concentration kg (14DCB to
freshwater) Freshwater ecotoxicity
potential FETP
Marine Ecotoxicity MET Hazard-weighted
concentration kg (14-DCB7 to marine water)
Marine ecotoxicity potential METP
Ionizing Radiation IR Absorbed dose kg (U235 to air) Ionizing radiation potential IRP
Agricultural Land Occupation ALO Occupation m2xyr
(agricultural land) Agricultural land occupation
potential ALOP
Urban Land Occupation ULO Occupation m2xyr (urban
land) Urban land occupation
potential ULOP
Natural Land Transformation NLT Transformation m2 (natural land) Natural land transformation
potential NLTP
Water Depletion WD Amount of water m3 (water) Water depletion potential WDP Mineral Resource Depletion MRD Grade decrease kg (Fe) Mineral depletion potential MDP Fossil Resource Depletion FD Lower heating value kg (oil) Fossil depletion potential FDP
Adapted from “ReCiPe 2008. A life cycle impact assessment method which comprises harmonized category indicators at the midpoint and the endpoint level,” by M. Goedkoop, R. Heijungs, M. Huijbregts, A. D. Schryver, J. Struijs, R. V. Zelm, 2013, p. 6. Copyright by RIVM, CML, PRé Consultants, and RUN, 2013.
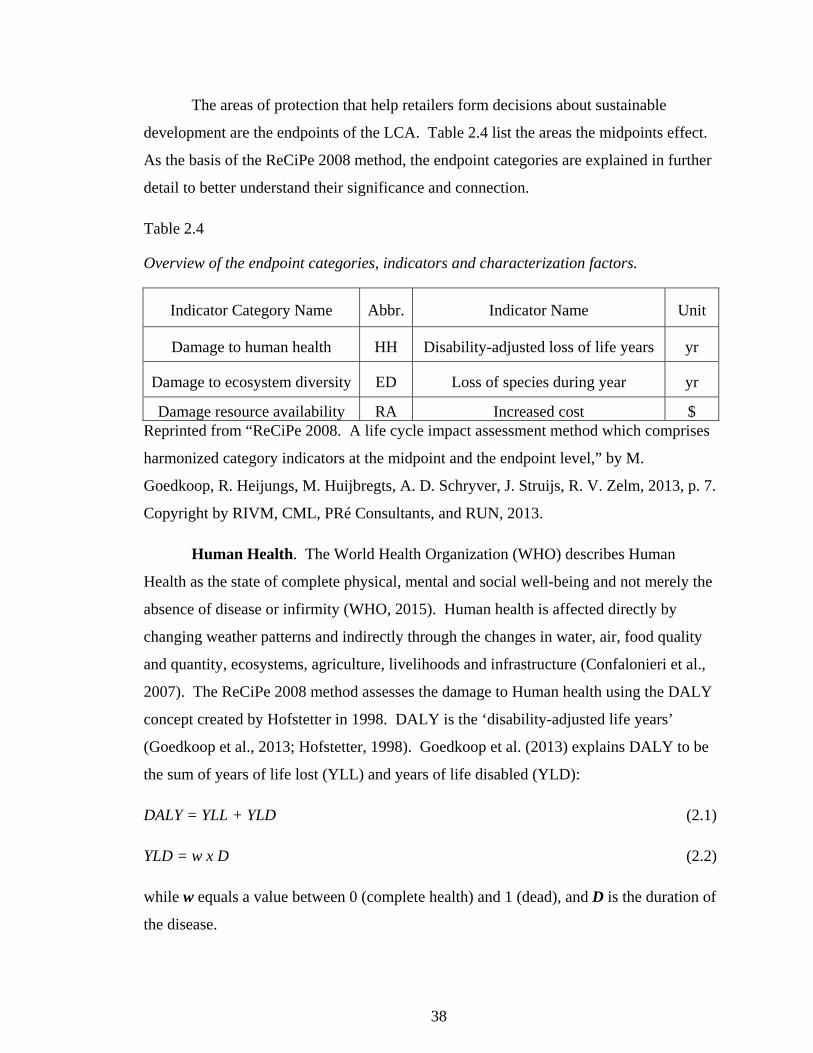
38
The areas of protection that help retailers form decisions about sustainable
development are the endpoints of the LCA. Table 2.4 list the areas the midpoints effect.
As the basis of the ReCiPe 2008 method, the endpoint categories are explained in further
detail to better understand their significance and connection.
Table 2.4
Overview of the endpoint categories, indicators and characterization factors.
Indicator Category Name Abbr. Indicator Name Unit
Damage to human health HH Disability-adjusted loss of life years yr
Damage to ecosystem diversity ED Loss of species during year yr
Damage resource availability RA Increased cost $ Reprinted from “ReCiPe 2008. A life cycle impact assessment method which comprises
harmonized category indicators at the midpoint and the endpoint level,” by M.
Goedkoop, R. Heijungs, M. Huijbregts, A. D. Schryver, J. Struijs, R. V. Zelm, 2013, p. 7.
Copyright by RIVM, CML, PRé Consultants, and RUN, 2013.
Human Health. The World Health Organization (WHO) describes Human
Health as the state of complete physical, mental and social well-being and not merely the
absence of disease or infirmity (WHO, 2015). Human health is affected directly by
changing weather patterns and indirectly through the changes in water, air, food quality
and quantity, ecosystems, agriculture, livelihoods and infrastructure (Confalonieri et al.,
2007). The ReCiPe 2008 method assesses the damage to Human health using the DALY
concept created by Hofstetter in 1998. DALY is the ‘disability-adjusted life years’
(Goedkoop et al., 2013; Hofstetter, 1998). Goedkoop et al. (2013) explains DALY to be
the sum of years of life lost (YLL) and years of life disabled (YLD):
DALY = YLL + YLD (2.1)
YLD = w x D (2.2)
while w equals a value between 0 (complete health) and 1 (dead), and D is the duration of
the disease.
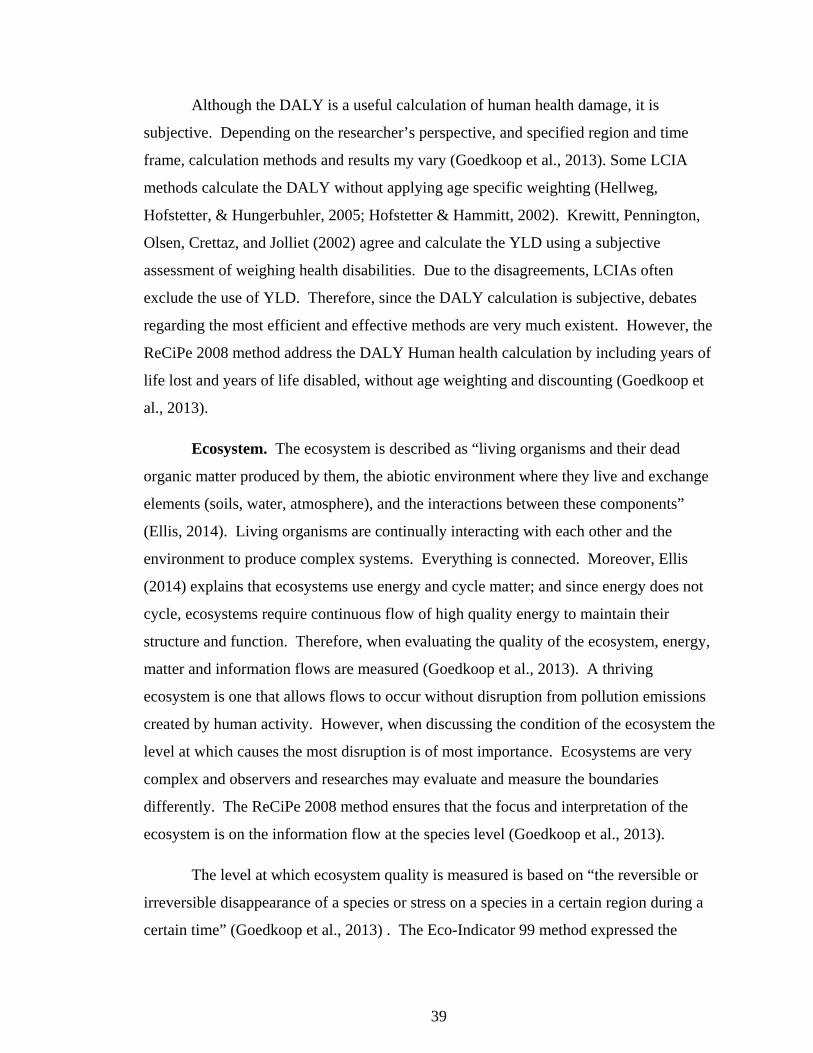
39
Although the DALY is a useful calculation of human health damage, it is
subjective. Depending on the researcher’s perspective, and specified region and time
frame, calculation methods and results my vary (Goedkoop et al., 2013). Some LCIA
methods calculate the DALY without applying age specific weighting (Hellweg,
Hofstetter, & Hungerbuhler, 2005; Hofstetter & Hammitt, 2002). Krewitt, Pennington,
Olsen, Crettaz, and Jolliet (2002) agree and calculate the YLD using a subjective
assessment of weighing health disabilities. Due to the disagreements, LCIAs often
exclude the use of YLD. Therefore, since the DALY calculation is subjective, debates
regarding the most efficient and effective methods are very much existent. However, the
ReCiPe 2008 method address the DALY Human health calculation by including years of
life lost and years of life disabled, without age weighting and discounting (Goedkoop et
al., 2013).
Ecosystem. The ecosystem is described as “living organisms and their dead
organic matter produced by them, the abiotic environment where they live and exchange
elements (soils, water, atmosphere), and the interactions between these components”
(Ellis, 2014). Living organisms are continually interacting with each other and the
environment to produce complex systems. Everything is connected. Moreover, Ellis
(2014) explains that ecosystems use energy and cycle matter; and since energy does not
cycle, ecosystems require continuous flow of high quality energy to maintain their
structure and function. Therefore, when evaluating the quality of the ecosystem, energy,
matter and information flows are measured (Goedkoop et al., 2013). A thriving
ecosystem is one that allows flows to occur without disruption from pollution emissions
created by human activity. However, when discussing the condition of the ecosystem the
level at which causes the most disruption is of most importance. Ecosystems are very
complex and observers and researches may evaluate and measure the boundaries
differently. The ReCiPe 2008 method ensures that the focus and interpretation of the
ecosystem is on the information flow at the species level (Goedkoop et al., 2013).
The level at which ecosystem quality is measured is based on “the reversible or
irreversible disappearance of a species or stress on a species in a certain region during a
certain time” (Goedkoop et al., 2013) . The Eco-Indicator 99 method expressed the
40
potentially disappeared fraction of species integrated over area and time as PDF
(Goedkoop et al., 2013; Goedkoop & Spriensma, 2000). Goedkoop et al. (2013) further
calculates the endpoint characterization factor for the ReCiPe 2008, adapted from the
Eco-Indicator 99, using the following components:
CFED = the endpoint characterization factor for ecosystem damage
PDFterr = the characterization factor in PDF.m2.yr, and SDterr the species density factor
for terrestrial systems, in species/m2
PDFfw = the characterization factor in PDF.m3.yr, and SDfw the species density for
freshwater systems in Species/m3.
PDFmw = the characterization factor in PDF.m3.yr, and SDmw the species density for
marine water systems in Species/m3
Therefore,
CFED = PDFterr × SDterr + PDFfw × SDfw + PDFmw × SDmw (2.3)
The species density included in the above equation is determined by finding out
how many species there are, how the distribution of species is over land, fresh and marine
water, and the right surface and volume to use (Goedkoop et al., 2013). The total amount
and type of species and surface and volume use was acquired from GEO 2000 by
UNCEP (Goedkoop et al., 2013). The distribution of species over terrestrial, freshwater
and marine water was adapted from Dudgeon et al. (2006). Furthermore, the data
researched in the previous sources were analyzed to give the following species densities:
Terrestrial species density: 1.48 E-8 [1/m2];
Freshwater species density: 7.89 E-10 [1/m3]; and
Marine species density: 3.46 E-12 [1/m3] (Goedkoop et al., 2013).
Resources. When discussing the earth’s resources the most important issue is
whether or the environment has a sufficient amount to sustain future generations. The
Life Cycle Initiative task force has categorized natural resources into three categories that
were address at the midpoint level. Natural resources are classified as biotic, abiotic and
41
land (UNEP & SETAC, 2015). In Table 2.5, some of the resources used and their
functions are categorized according to their function and properties.
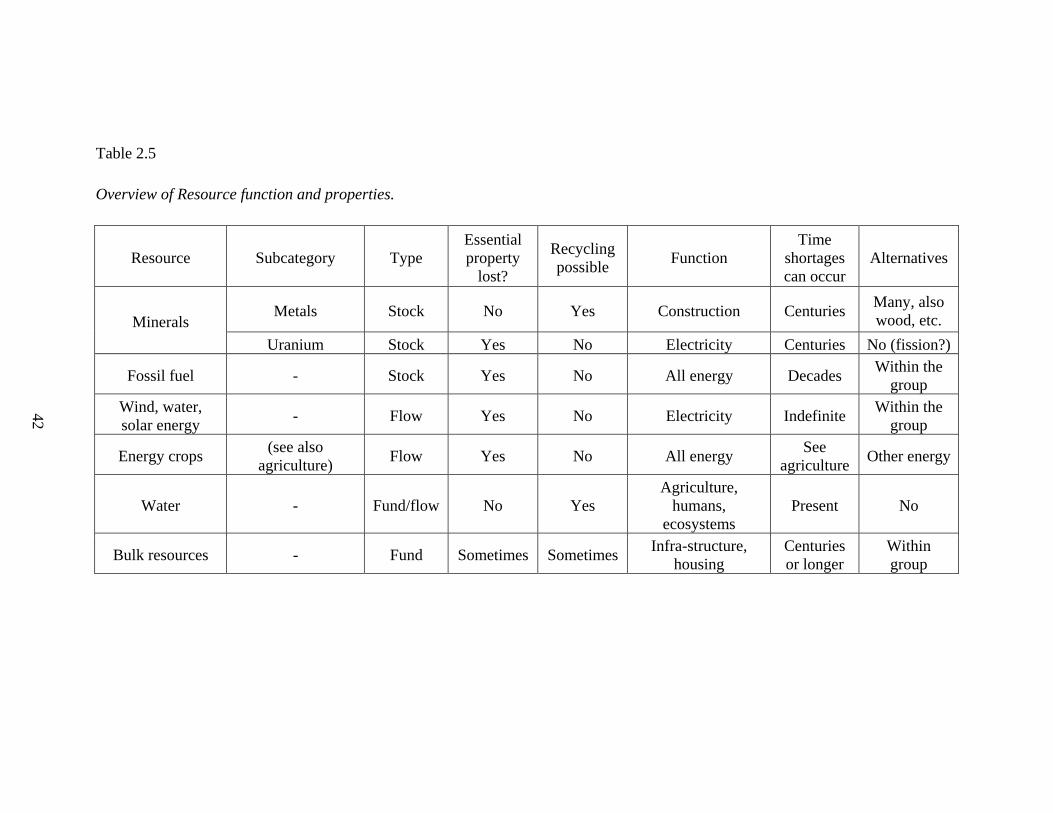
42
Table 2.5
Overview of Resource function and properties.
Resource Subcategory Type Essential property
lost?
Recycling possible
Function Time
shortages can occur
Alternatives
Minerals Metals Stock No Yes Construction Centuries
Many, also wood, etc.
Uranium Stock Yes No Electricity Centuries No (fission?)
Fossil fuel - Stock Yes No All energy Decades Within the
group Wind, water, solar energy
- Flow Yes No Electricity Indefinite Within the
group
Energy crops (see also
agriculture) Flow Yes No All energy
See agriculture
Other energy
Water - Fund/flow No Yes Agriculture,
humans, ecosystems
Present No
Bulk resources - Fund Sometimes Sometimes Infra-structure,
housing Centuries or longer
Within group
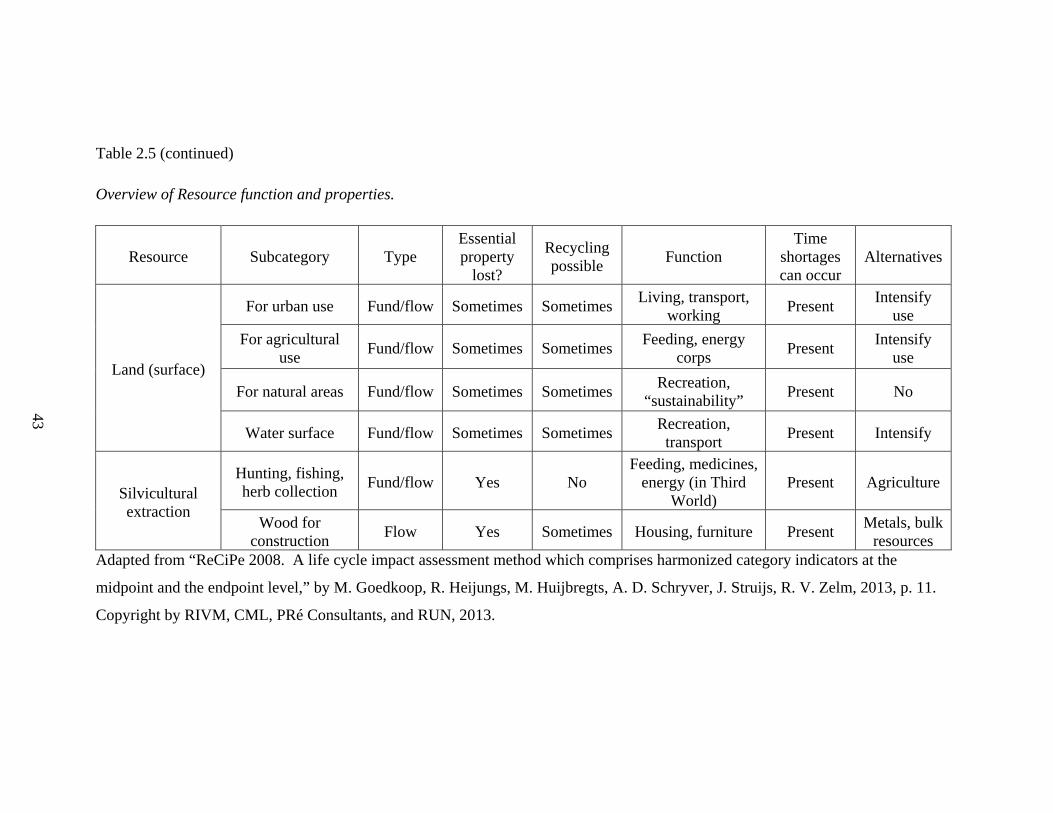
43
Table 2.5 (continued)
Overview of Resource function and properties.
Resource Subcategory Type Essential property
lost?
Recycling possible
Function Time
shortages can occur
Alternatives
Land (surface)
For urban use Fund/flow Sometimes Sometimes Living, transport,
working Present
Intensify use
For agricultural use
Fund/flow Sometimes Sometimes Feeding, energy
corps Present
Intensify use
For natural areas Fund/flow Sometimes Sometimes Recreation,
“sustainability” Present No
Water surface Fund/flow Sometimes Sometimes Recreation,
transport Present Intensify
Silvicultural extraction
Hunting, fishing, herb collection
Fund/flow Yes No Feeding, medicines,
energy (in Third World)
Present Agriculture
Wood for construction
Flow Yes Sometimes Housing, furniture Present Metals, bulk
resources Adapted from “ReCiPe 2008. A life cycle impact assessment method which comprises harmonized category indicators at the
midpoint and the endpoint level,” by M. Goedkoop, R. Heijungs, M. Huijbregts, A. D. Schryver, J. Struijs, R. V. Zelm, 2013, p. 11.
Copyright by RIVM, CML, PRé Consultants, and RUN, 2013.
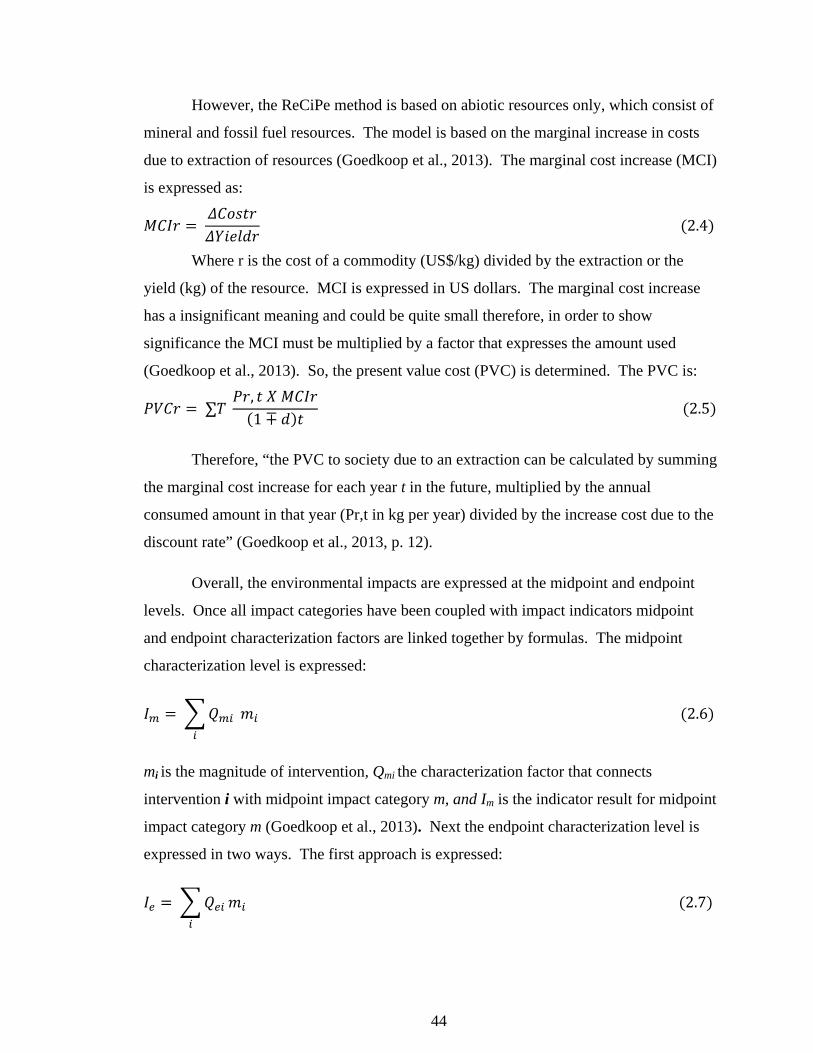
44
However, the ReCiPe method is based on abiotic resources only, which consist of
mineral and fossil fuel resources. The model is based on the marginal increase in costs
due to extraction of resources (Goedkoop et al., 2013). The marginal cost increase (MCI)
is expressed as:
2.4
Where r is the cost of a commodity (US$/kg) divided by the extraction or the
yield (kg) of the resource. MCI is expressed in US dollars. The marginal cost increase
has a insignificant meaning and could be quite small therefore, in order to show
significance the MCI must be multiplied by a factor that expresses the amount used
(Goedkoop et al., 2013). So, the present value cost (PVC) is determined. The PVC is:
∑ , 1 ∓
2.5
Therefore, “the PVC to society due to an extraction can be calculated by summing
the marginal cost increase for each year t in the future, multiplied by the annual
consumed amount in that year (Pr,t in kg per year) divided by the increase cost due to the
discount rate” (Goedkoop et al., 2013, p. 12).
Overall, the environmental impacts are expressed at the midpoint and endpoint
levels. Once all impact categories have been coupled with impact indicators midpoint
and endpoint characterization factors are linked together by formulas. The midpoint
characterization level is expressed:
2.6
mi is the magnitude of intervention, Qmi the characterization factor that connects
intervention i with midpoint impact category m, and Im is the indicator result for midpoint
impact category m (Goedkoop et al., 2013). Next the endpoint characterization level is
expressed in two ways. The first approach is expressed:
2.7
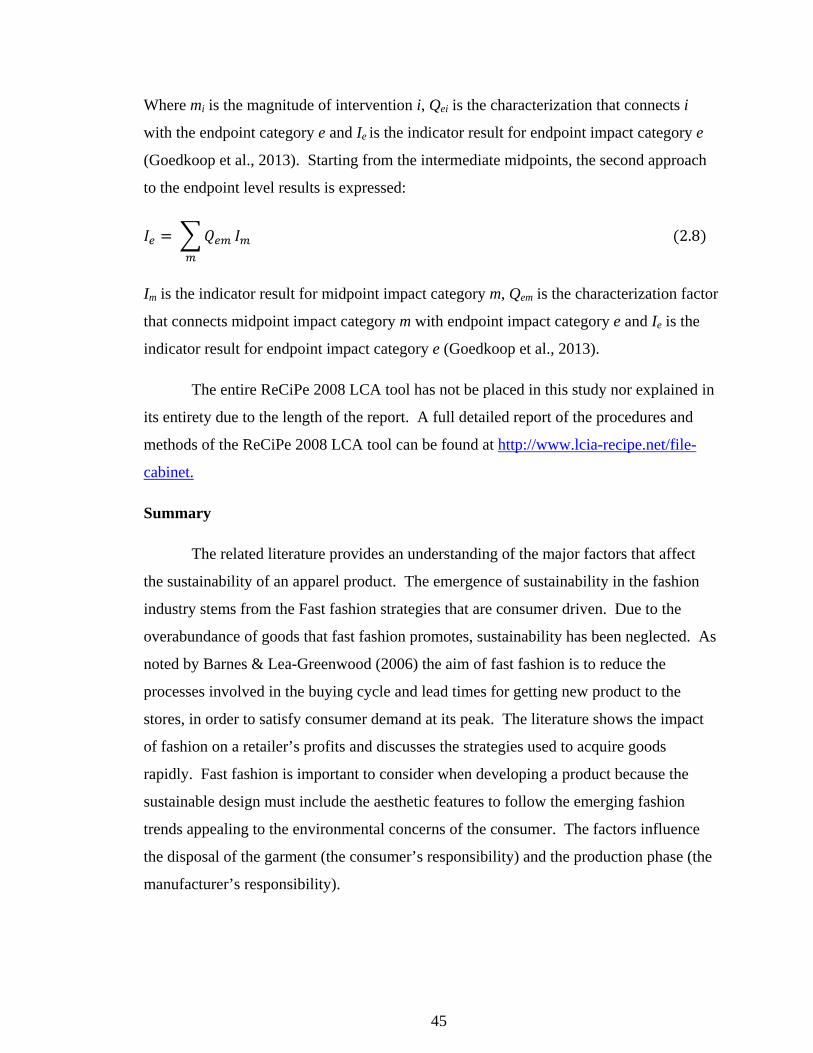
45
Where mi is the magnitude of intervention i, Qei is the characterization that connects i
with the endpoint category e and Ie is the indicator result for endpoint impact category e
(Goedkoop et al., 2013). Starting from the intermediate midpoints, the second approach
to the endpoint level results is expressed:
2.8
Im is the indicator result for midpoint impact category m, Qem is the characterization factor
that connects midpoint impact category m with endpoint impact category e and Ie is the
indicator result for endpoint impact category e (Goedkoop et al., 2013).
The entire ReCiPe 2008 LCA tool has not be placed in this study nor explained in
its entirety due to the length of the report. A full detailed report of the procedures and
methods of the ReCiPe 2008 LCA tool can be found at http://www.lcia-recipe.net/file-
cabinet.
Summary
The related literature provides an understanding of the major factors that affect
the sustainability of an apparel product. The emergence of sustainability in the fashion
industry stems from the Fast fashion strategies that are consumer driven. Due to the
overabundance of goods that fast fashion promotes, sustainability has been neglected. As
noted by Barnes & Lea-Greenwood (2006) the aim of fast fashion is to reduce the
processes involved in the buying cycle and lead times for getting new product to the
stores, in order to satisfy consumer demand at its peak. The literature shows the impact
of fashion on a retailer’s profits and discusses the strategies used to acquire goods
rapidly. Fast fashion is important to consider when developing a product because the
sustainable design must include the aesthetic features to follow the emerging fashion
trends appealing to the environmental concerns of the consumer. The factors influence
the disposal of the garment (the consumer’s responsibility) and the production phase (the
manufacturer’s responsibility).
46
In the 21st century sustainability is often paired with corporate social
responsibility, to place responsibilities on the retailers and manufacturers to be aware of
their carbon footprint on the environment. Sustainable fashion also coincides with social
responsibility in regards to the developing stages of an apparel product. Creating
sustainable fashion consist of the retailer & manufactures making an informed decision to
be socially responsible, environmentally sustainable, economically viable, and designing
with integrity. Therefore, the fashion industry must work diligently to become more
transparent with manufacturing procedures for the consumer’s knowledge.
Life Cycle Assessments are critical to sustainable fashion, because they trace the
steps and procedures of production to ensure the sustainability of the garment. Although
LCAs are widely used by retailers, they are very time consuming and costly. As
environmental concerns become more of a global issue LCAs will help quantify a
company’s environmental footprint. Equally, as consumers demand to know the
environmental of the products they purchase, LCAs will gain importance across the
industry and help manufacturers meet customer needs and concerns. However, the
results of a LCA have to be interpreted and weighed therefore, the results are not
straightforward all the time and simple enough to determine one product over the other
(B.V., 2000). Therefore producing data from the LCA gives the manufacturer a
convincing way to ensure and market to the consumer the environmental advantages of
purchasing a sustainable product.
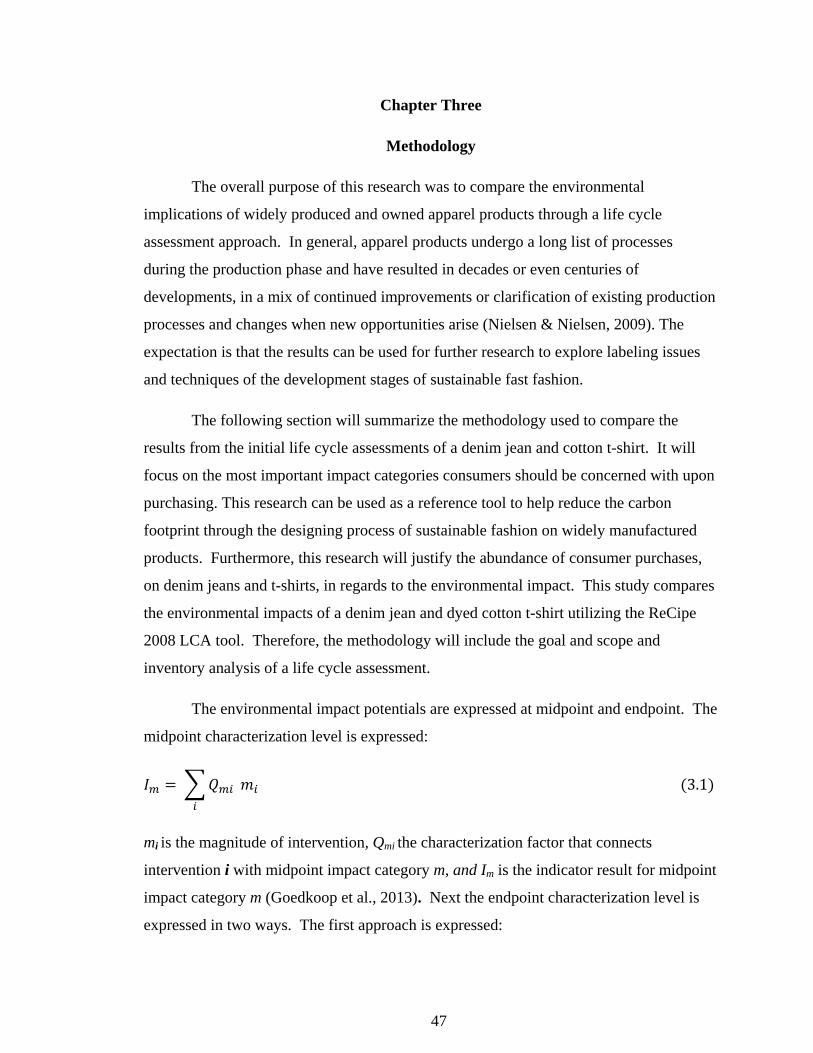
47
Chapter Three
Methodology
The overall purpose of this research was to compare the environmental
implications of widely produced and owned apparel products through a life cycle
assessment approach. In general, apparel products undergo a long list of processes
during the production phase and have resulted in decades or even centuries of
developments, in a mix of continued improvements or clarification of existing production
processes and changes when new opportunities arise (Nielsen & Nielsen, 2009). The
expectation is that the results can be used for further research to explore labeling issues
and techniques of the development stages of sustainable fast fashion.
The following section will summarize the methodology used to compare the
results from the initial life cycle assessments of a denim jean and cotton t-shirt. It will
focus on the most important impact categories consumers should be concerned with upon
purchasing. This research can be used as a reference tool to help reduce the carbon
footprint through the designing process of sustainable fashion on widely manufactured
products. Furthermore, this research will justify the abundance of consumer purchases,
on denim jeans and t-shirts, in regards to the environmental impact. This study compares
the environmental impacts of a denim jean and dyed cotton t-shirt utilizing the ReCipe
2008 LCA tool. Therefore, the methodology will include the goal and scope and
inventory analysis of a life cycle assessment.
The environmental impact potentials are expressed at midpoint and endpoint. The
midpoint characterization level is expressed:
3.1
mi is the magnitude of intervention, Qmi the characterization factor that connects
intervention i with midpoint impact category m, and Im is the indicator result for midpoint
impact category m (Goedkoop et al., 2013). Next the endpoint characterization level is
expressed in two ways. The first approach is expressed:
48
3.2
Where mi is the magnitude of intervention i, Qei is the characterization that connects i
with the endpoint category e and Ie is the indicator result for endpoint impact category e
(Goedkoop et al., 2013). Starting from the intermediate midpoints, the second approach
to the endpoint level results is expressed:
3.3
Im is the indicator result for midpoint impact category m, Qem is the characterization factor
that connects midpoint impact category m with endpoint impact category e and Ie is the
indicator result for endpoint impact category e (Goedkoop et al., 2013).
Research Design
This study is a comparative analysis of life cycle assessments conducted on the
Levi’s® 501® jeans and a colored cotton t-shirt by EDIPTEX. The qualitative research
design was used to determine the most efficient method to analyze the environmental
impacts of a single pair of jeans and a cotton t-shirt. Data was analyzed and compared in
accordance with a life cycle assessment framework.
Goal and Scope
The study is based on life cycle assessment (LCA) principles according to the ISO
14040 standards where all significant processes from “cradle to gate” are included.
Cradle to gate is an assessment of a partial product life cycle from resource extraction
(cradle) to the factory gate (ex. before it is transported the consumer). This LCA
compares the environmental impacts of widely owned fashion items using an accounting
method in a short-term LCA. Although the Gabi 6 LCA software was not available for
this study, the ReCipe 2008 LCA method was utilized to compare existing LCA results
under the same parameters.
Functional Unit. The functional unit is the comparison of two high volume fast
fashion items. The production of 1 pair of Levi’s® 501® medium stonewash jeans and 1
49
color dyed T-shirt. The weight of the jeans is around 340g and the weight of the T-shirt is
around 250g.
System Boundaries. The study addressed the cradle to gate phases of the life
cycle of a denim jean and T-shirt. The system boundaries assessed were raw materials
production, fabric production, garment manufacturing and transportation and distribution.
Materials phase. The material phase covers cotton cultivation needed to produce
1 pair of denim jeans and 1 T-shirt. Cotton cultivation often requires fertilizers for the
land, the use of large amounts of water, and pesticides to prevent insect, worms and
weeds (Laursen et al., 2007). This study includes the procedures used in the extraction of
cotton for the production of 1 pair of denim jeans and 1 T-shirt.
Production phase. A large amount of environmental impacts occur in this phase
due to the steps taken to prepare cotton for the finished product. The production phase
includes fiber and yarn manufacturing, finishing processes (pre-treatment and dyeing)
and garment manufacturing and make-up. All phases of production were considered in
the LCA and the most important environmental impacts were assessed.
Environmental Impact Categories. Environmental impact potentials were
expressed at a midpoint and endpoint level. The environmental impact categories and
their descriptions used in this study are shown in Table 3.1. The following categories
were adapted from the life cycle assessment of a Levi’s® 501® jean conducted by Levi
Strauss & Co. Present in the ReCiPe 2008 methodology as essential environmental
impact categories are; Ozone Depletion (OD), Terrestrial Acidification (TA), Human
Toxicity (HT), Photochemical Oxidant Formation (POF), Particulate Matter Formation
(PMF), Terrestrial Ecotoxicity (TET), Freshwater Ecotoxicity (FET), Marine Ecotoxicity
(MET), Ionizing Radiation (IR), and Natural Land Transformation (NLT) that were
excluded from this study. Furthermore, the results will reveal the significant damage the
midpoint category indicators have on the endpoint categories; human health, ecosystems
and resources. Adding the endpoint categories is the basis of the ReCiPe 2008 method.
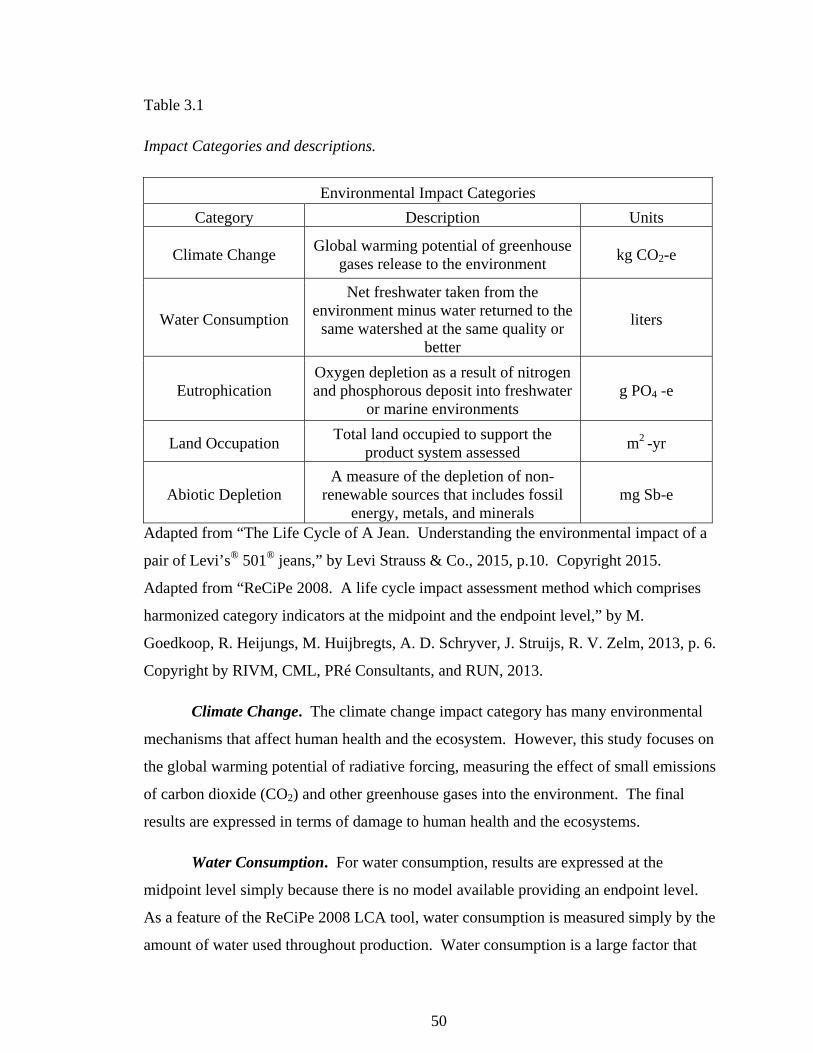
50
Table 3.1
Impact Categories and descriptions.
Environmental Impact Categories
Category Description Units
Climate Change Global warming potential of greenhouse
gases release to the environment kg CO2-e
Water Consumption
Net freshwater taken from the environment minus water returned to the
same watershed at the same quality or better
liters
Eutrophication Oxygen depletion as a result of nitrogen and phosphorous deposit into freshwater
or marine environments g PO4 -e
Land Occupation Total land occupied to support the
product system assessed m2 -yr
Abiotic Depletion A measure of the depletion of non-
renewable sources that includes fossil energy, metals, and minerals
mg Sb-e
Adapted from “The Life Cycle of A Jean. Understanding the environmental impact of a
pair of Levi’s® 501® jeans,” by Levi Strauss & Co., 2015, p.10. Copyright 2015.
Adapted from “ReCiPe 2008. A life cycle impact assessment method which comprises
harmonized category indicators at the midpoint and the endpoint level,” by M.
Goedkoop, R. Heijungs, M. Huijbregts, A. D. Schryver, J. Struijs, R. V. Zelm, 2013, p. 6.
Copyright by RIVM, CML, PRé Consultants, and RUN, 2013.
Climate Change. The climate change impact category has many environmental
mechanisms that affect human health and the ecosystem. However, this study focuses on
the global warming potential of radiative forcing, measuring the effect of small emissions
of carbon dioxide (CO2) and other greenhouse gases into the environment. The final
results are expressed in terms of damage to human health and the ecosystems.
Water Consumption. For water consumption, results are expressed at the
midpoint level simply because there is no model available providing an endpoint level.
As a feature of the ReCiPe 2008 LCA tool, water consumption is measured simply by the
amount of water used throughout production. Water consumption is a large factor that
51
also affects human health and the ecosystem, but is largely classified as a threat to our
natural resources. Therefore this study focuses on water lost and damaged rather than
recycled water.
Eutrophication. Eutrophication is a combination of freshwater and marine
environments. It is the excessive richness of nutrients in a lake or body of water,
frequently due to runoff from the land, which causes a dense growth of plant life and
death of animal life from the lack of oxygen. Eutrophication is expressed at the endpoint
level in terms of damage to the ecosystem. Phosphorus and nitrogen are the substances
contributing to the nutrient rich waters causing eutrophication in freshwater and marine
environments. Phosphorus is an essential nutrient for all life forms. However, elevated
amounts of phosphorus cause plants to naturally soak up more nitrogen before all
phosphorus is depleted, therefore, causing excessive algae growth in bodies of
freshwater.
Land Occupation. This study assess the damage land occupation has to the
ecosystem. Land Occupation concentrates on the area of land being used during the
production raw materials growth and production process; and the transformation of the
certain area of land. For this study Land Occupation results are expressed at the midpoint
and endpoint levels.
Abiotic Depletion. Abiotic depletion is the loss of naturally occurring minerals,
fossil energy and metals. Abiotic, meaning non-living, resources are addressed in terms
of their availability in future generations. Results are based on the overall cost of
resources lost during extraction and production. In this study abiotic depletion is
expressed at the midpoint and endpoint level, yielding results regarding the damage to the
world’s natural resources.
Inventory Analysis
Data was collected from existing LCAs of a pair of denim jeans and a T-shirt.
The data for the denim jeans was collected using “The Life Cycle of a Jean.
Understanding the environmental impact of a pair of Levi’s® 501® jeans,” Levi Strauss
& Co. LCA performed in 2014 (see Appendix B). The methodology used in the LCA
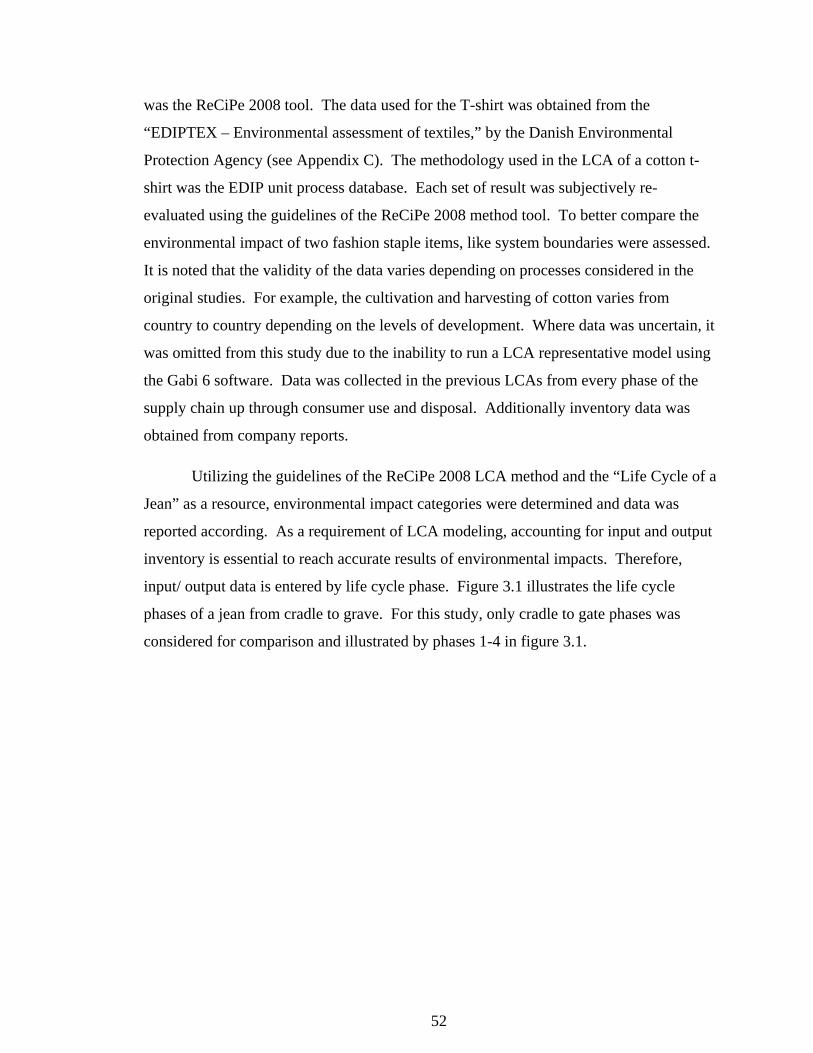
52
was the ReCiPe 2008 tool. The data used for the T-shirt was obtained from the
“EDIPTEX – Environmental assessment of textiles,” by the Danish Environmental
Protection Agency (see Appendix C). The methodology used in the LCA of a cotton t-
shirt was the EDIP unit process database. Each set of result was subjectively re-
evaluated using the guidelines of the ReCiPe 2008 method tool. To better compare the
environmental impact of two fashion staple items, like system boundaries were assessed.
It is noted that the validity of the data varies depending on processes considered in the
original studies. For example, the cultivation and harvesting of cotton varies from
country to country depending on the levels of development. Where data was uncertain, it
was omitted from this study due to the inability to run a LCA representative model using
the Gabi 6 software. Data was collected in the previous LCAs from every phase of the
supply chain up through consumer use and disposal. Additionally inventory data was
obtained from company reports.
Utilizing the guidelines of the ReCiPe 2008 LCA method and the “Life Cycle of a
Jean” as a resource, environmental impact categories were determined and data was
reported according. As a requirement of LCA modeling, accounting for input and output
inventory is essential to reach accurate results of environmental impacts. Therefore,
input/ output data is entered by life cycle phase. Figure 3.1 illustrates the life cycle
phases of a jean from cradle to grave. For this study, only cradle to gate phases was
considered for comparison and illustrated by phases 1-4 in figure 3.1.
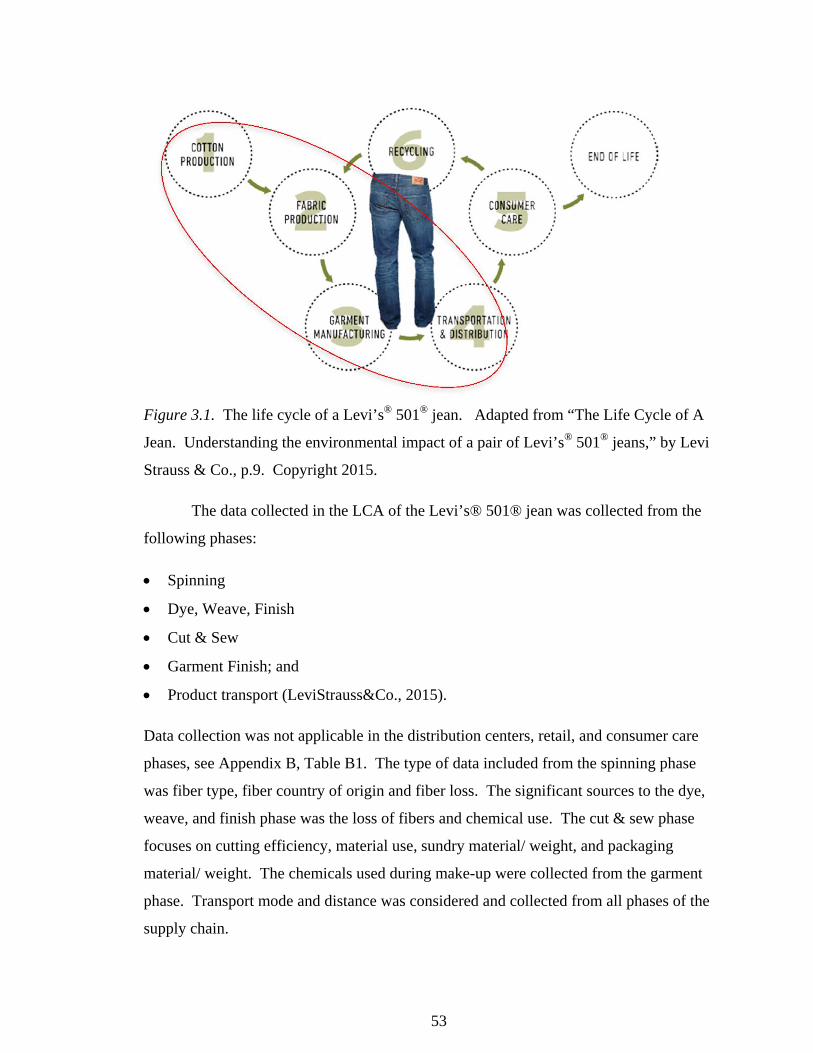
53
Figure 3.1. The life cycle of a Levi’s® 501® jean. Adapted from “The Life Cycle of A
Jean. Understanding the environmental impact of a pair of Levi’s® 501® jeans,” by Levi
Strauss & Co., p.9. Copyright 2015.
The data collected in the LCA of the Levi’s® 501® jean was collected from the
following phases:
Spinning
Dye, Weave, Finish
Cut & Sew
Garment Finish; and
Product transport (LeviStrauss&Co., 2015).
Data collection was not applicable in the distribution centers, retail, and consumer care
phases, see Appendix B, Table B1. The type of data included from the spinning phase
was fiber type, fiber country of origin and fiber loss. The significant sources to the dye,
weave, and finish phase was the loss of fibers and chemical use. The cut & sew phase
focuses on cutting efficiency, material use, sundry material/ weight, and packaging
material/ weight. The chemicals used during make-up were collected from the garment
phase. Transport mode and distance was considered and collected from all phases of the
supply chain.
54
Input/ Output inventory data for the colored cotton t-shirt was also accounted for
by life cycle phase. Figure 3.2 illustrates the life cycle phases of a cotton t-shirt from
cradle to grave. For this study, only the cradle to gate phases were considered for
comparison and noted as the materials phase, production phase and transport phase in
figure 3.2. In the impact assessment section of the LCA, the life cycle phases were re-
named to compare results for environmental impact at the same point in the life cycle.
The remaining steps of the life cycle assessment according to the International
Standard ISO 14040 series are the impact assessment and interpretation. Chapter 4
reports the environmental impacts by climate change, water consumption, eutrophication,
land occupation and abiotic depletion.
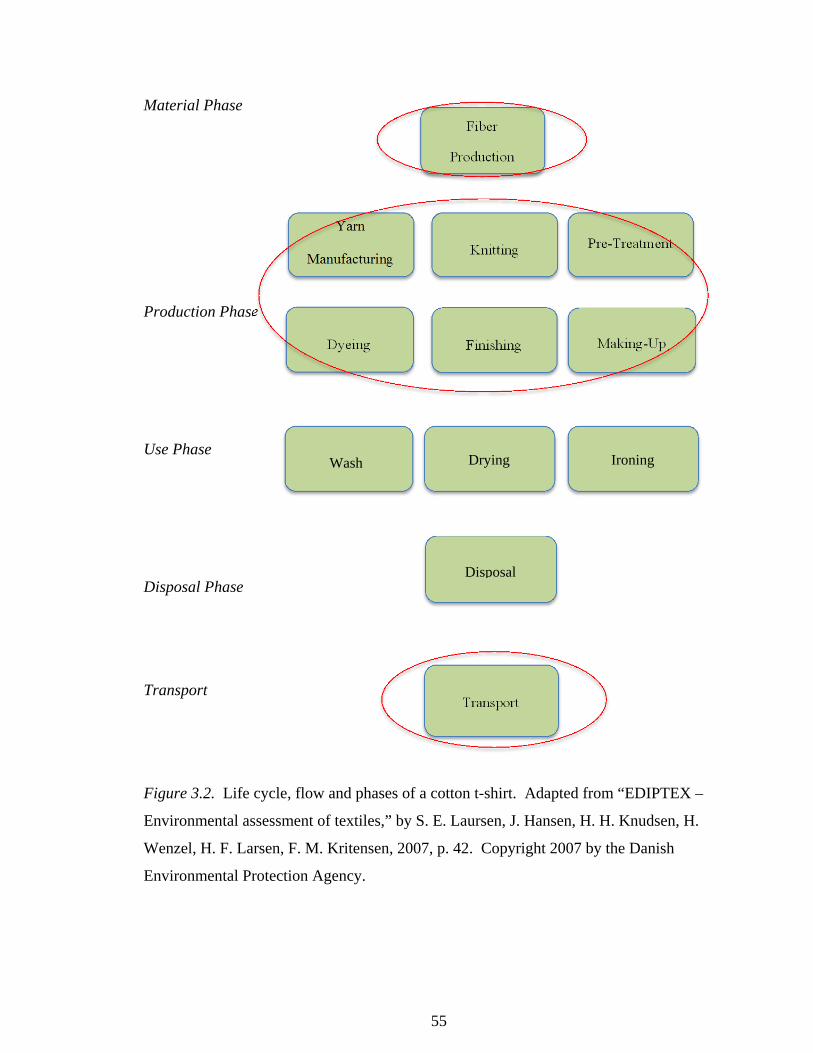
55
Material Phase
Production Phase
Use Phase
Disposal Phase
Transport
Figure 3.2. Life cycle, flow and phases of a cotton t-shirt. Adapted from “EDIPTEX –
Environmental assessment of textiles,” by S. E. Laursen, J. Hansen, H. H. Knudsen, H.
Wenzel, H. F. Larsen, F. M. Kritensen, 2007, p. 42. Copyright 2007 by the Danish
Environmental Protection Agency.
Fiber
Production
Knitting
Yarn
Manufacturing Pre-Treatment
Transport
Dyeing Finishing Making-Up
Wash Drying Ironing
Disposal
56
Chapter Four
Results
The overall purpose of this research was to compare the environmental
implications of widely produced and owned apparel products through a life cycle
assessment approach. In addition, determine if the apparel products are fully sustainable
for the consumer at the point of purchase. The expectation is that the results are used for
further research to explore labeling issues, improve production processes, and inform
consumers of the initial environmental impact fast fashion items have at the point of
purchase. This study focuses on the impact results from cradle to gate (raw materials to
point of purchase) therefore the result percentages have been adjusted from the original
study due to specified parameters of this study. The results of this study are presented
according to the production process and environmental impact categories.
Impact Assessment
The impact assessment is expressed according to the impact categories and the
system boundaries (cradle to gate). To determine the results, the ReCiPe 2008 LCA
methodology was used. As a result of software availability, the inputs and output data
required for modeling a LCA are not exact for the products chosen. However, the input
and output flows listed are representative of the processes used in the production of a pair
of jeans and a cotton t-shirt. Full life cycle results of the Levi’s® 501® jean and the
cotton t-shirt are included in Appendix B & C.
The categories of the life cycle process differed between the Levi’s® 501® jeans
and the colored cotton t-shirt but each phase was represented. However, each phase is
present in both life cycle assessments. The life cycle of the Levi’s® 501® is categorized
as:
Fiber Cultivation & Harvest – The harvest and cultivation of raw materials.
Fabric Assembly– Yarn spinning, dyeing, weaving, and fabric finishing
Cut, Sew, & Finish – Garment manufacture
Sundries & Packaging – Garment hardware and packaging
Transport & Retail – Transportation between phases and distribution to retail store.
57
The life cycle phases of the T-shirt have been re-categorized to better compare the
results by phase. See Appendix C, Figure C1 for the life cycle flow and phases of a color
cotton t-shirt used in the “EPIDTEX-Environmental Assessment of Textiles”(Laursen et
al., 2007). The life cycle of the cotton t-shirt is categorized as:
Fiber Cultivation & Harvest– The harvest and cultivation of raw materials.
Fabric Assembly - Yarn manufacturing & knitting
Finishing - Pre-treatment, dyeing, & finishing
Making-up – Garment manufacturing & packaging.
Transport & Retail – Transportation between phases and distribution to retail store.
Climate Change. The effects of climate change are dictated by the global
warming potential from the amounts of greenhouse emissions released into the
environment as a result of textile production. In the end, increase of temperature causes
damage to human health and damage to ecosystem diversity.
Levi’s® 501® Jeans. In the production of one pair of jeans, the most significant
impact of global warming occurs during the fabric assembly phase. However, when
considering the entire life cycle (cradle to grave), the largest impact occurs during the
consumer use phase. Although the transport and retail phase is assumed to have a large
climate change impact from diesel to fuel trucks, this phase provides the second largest
impact at 19% of the life cycle. Figures 4.1 & 4.2 show the impact of climate change
expressed in kg and percentages to the environment. Full life cycle results can be found
in Appendix C.
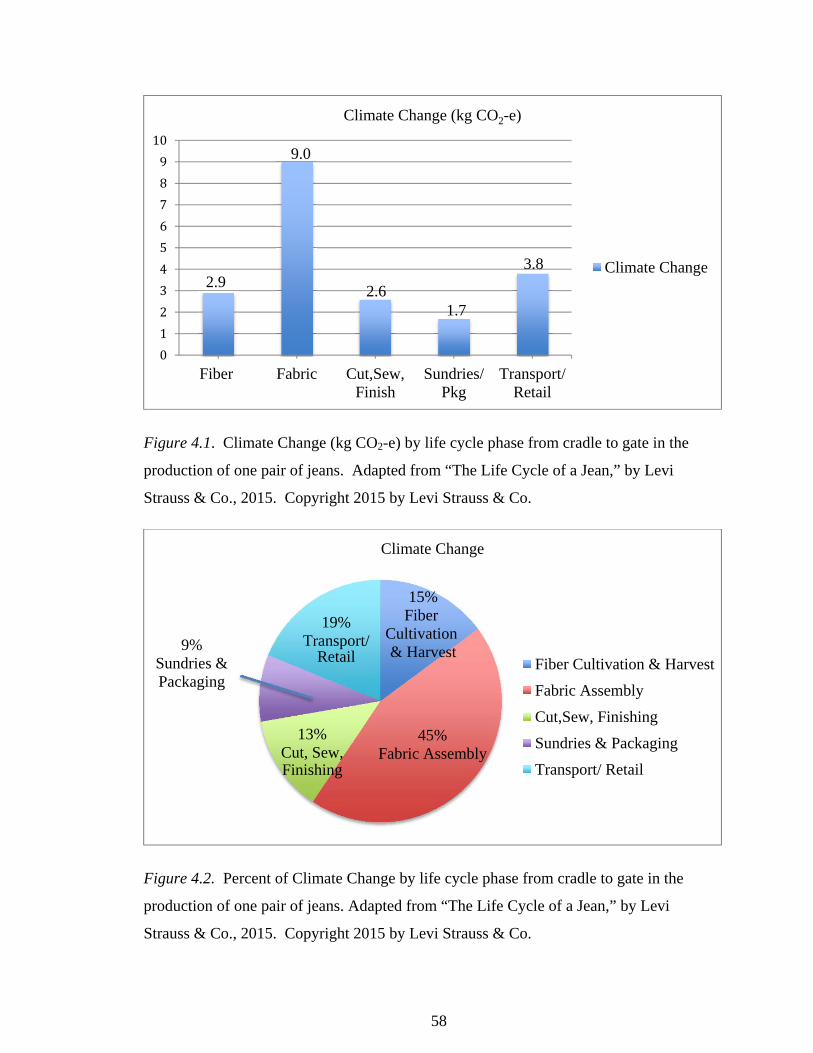
58
Figure 4.1. Climate Change (kg CO2-e) by life cycle phase from cradle to gate in the
production of one pair of jeans. Adapted from “The Life Cycle of a Jean,” by Levi
Strauss & Co., 2015. Copyright 2015 by Levi Strauss & Co.
Figure 4.2. Percent of Climate Change by life cycle phase from cradle to gate in the
production of one pair of jeans. Adapted from “The Life Cycle of a Jean,” by Levi
Strauss & Co., 2015. Copyright 2015 by Levi Strauss & Co.
0
1
2
3
4
5
6
7
8
9
10
Fiber Fabric Cut,Sew,Finish
Sundries/Pkg
Transport/Retail
Climate Change (kg CO2-e)
Climate Change2.9
9.0
2.61.7
3.8
Climate Change
Fiber Cultivation & Harvest
Fabric Assembly
Cut,Sew, Finishing
Sundries & Packaging
Transport/ Retail
45%Fabric Assembly
19%Transport/
Retail9%
Sundries &Packaging
13%Cut, Sew,Finishing
15%Fiber
Cultivation & Harvest
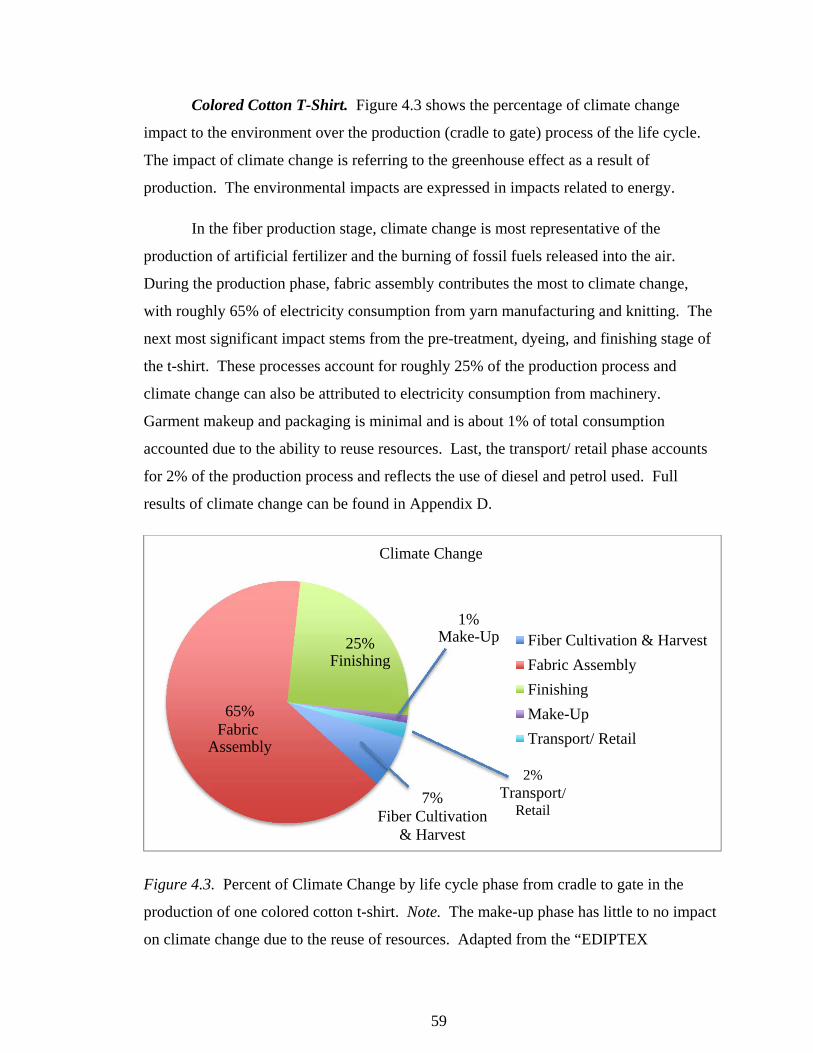
59
Colored Cotton T-Shirt. Figure 4.3 shows the percentage of climate change
impact to the environment over the production (cradle to gate) process of the life cycle.
The impact of climate change is referring to the greenhouse effect as a result of
production. The environmental impacts are expressed in impacts related to energy.
In the fiber production stage, climate change is most representative of the
production of artificial fertilizer and the burning of fossil fuels released into the air.
During the production phase, fabric assembly contributes the most to climate change,
with roughly 65% of electricity consumption from yarn manufacturing and knitting. The
next most significant impact stems from the pre-treatment, dyeing, and finishing stage of
the t-shirt. These processes account for roughly 25% of the production process and
climate change can also be attributed to electricity consumption from machinery.
Garment makeup and packaging is minimal and is about 1% of total consumption
accounted due to the ability to reuse resources. Last, the transport/ retail phase accounts
for 2% of the production process and reflects the use of diesel and petrol used. Full
results of climate change can be found in Appendix D.
Figure 4.3. Percent of Climate Change by life cycle phase from cradle to gate in the
production of one colored cotton t-shirt. Note. The make-up phase has little to no impact
on climate change due to the reuse of resources. Adapted from the “EDIPTEX
Climate Change
Fiber Cultivation & Harvest
Fabric Assembly
Finishing
Make-Up
Transport/ Retail
65%Fabric
Assembly
25%Finishing
7%Fiber Cultivation
& Harvest
1%Make-Up
2%Transport/
Retail
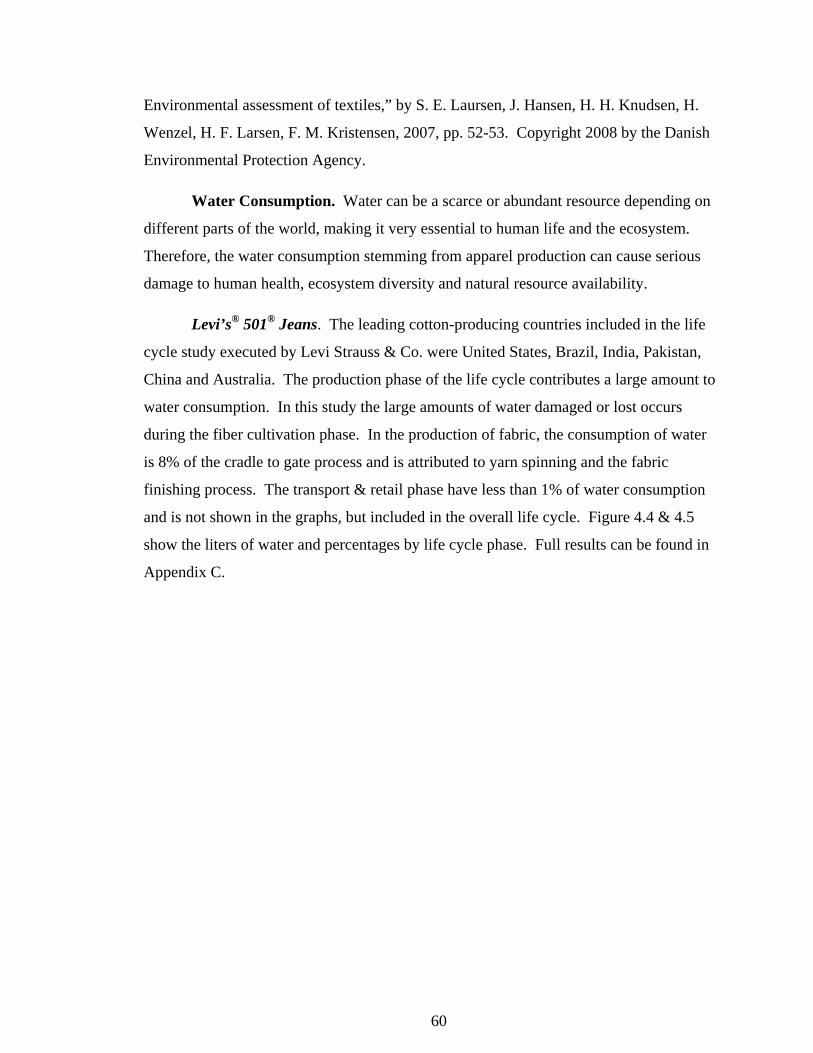
60
Environmental assessment of textiles,” by S. E. Laursen, J. Hansen, H. H. Knudsen, H.
Wenzel, H. F. Larsen, F. M. Kristensen, 2007, pp. 52-53. Copyright 2008 by the Danish
Environmental Protection Agency.
Water Consumption. Water can be a scarce or abundant resource depending on
different parts of the world, making it very essential to human life and the ecosystem.
Therefore, the water consumption stemming from apparel production can cause serious
damage to human health, ecosystem diversity and natural resource availability.
Levi’s® 501® Jeans. The leading cotton-producing countries included in the life
cycle study executed by Levi Strauss & Co. were United States, Brazil, India, Pakistan,
China and Australia. The production phase of the life cycle contributes a large amount to
water consumption. In this study the large amounts of water damaged or lost occurs
during the fiber cultivation phase. In the production of fabric, the consumption of water
is 8% of the cradle to gate process and is attributed to yarn spinning and the fabric
finishing process. The transport & retail phase have less than 1% of water consumption
and is not shown in the graphs, but included in the overall life cycle. Figure 4.4 & 4.5
show the liters of water and percentages by life cycle phase. Full results can be found in
Appendix C.
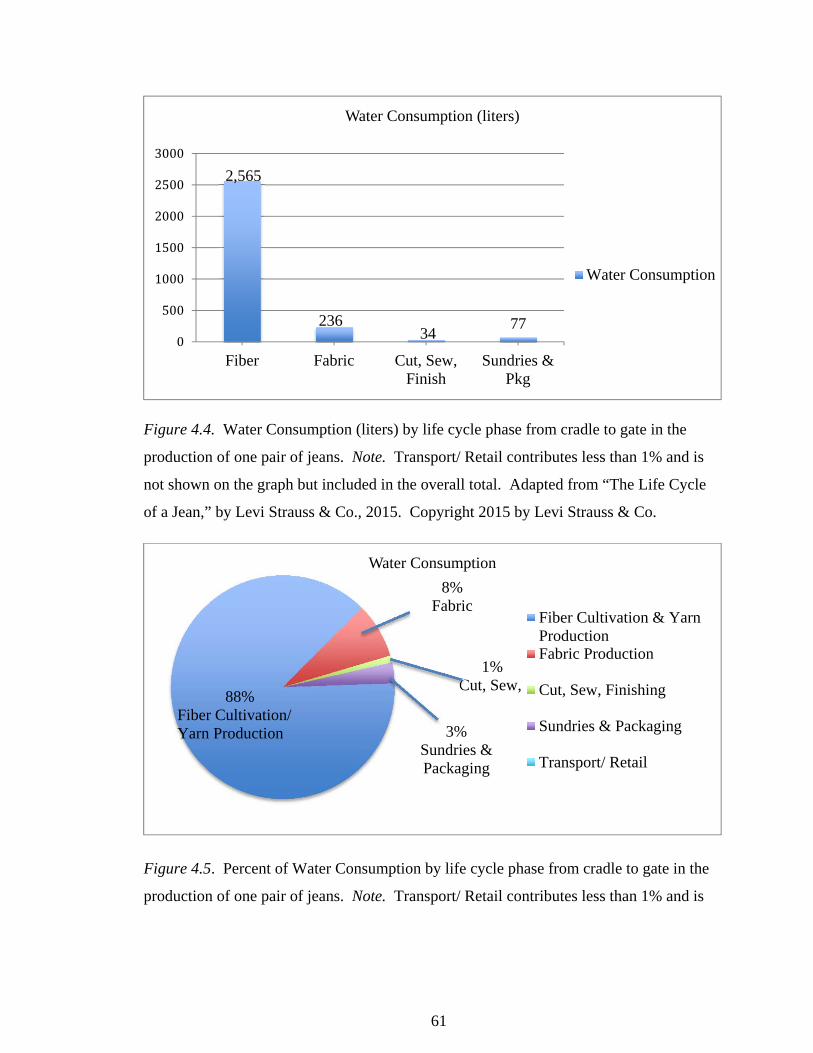
61
Figure 4.4. Water Consumption (liters) by life cycle phase from cradle to gate in the
production of one pair of jeans. Note. Transport/ Retail contributes less than 1% and is
not shown on the graph but included in the overall total. Adapted from “The Life Cycle
of a Jean,” by Levi Strauss & Co., 2015. Copyright 2015 by Levi Strauss & Co.
Figure 4.5. Percent of Water Consumption by life cycle phase from cradle to gate in the
production of one pair of jeans. Note. Transport/ Retail contributes less than 1% and is
Water Consumption
Fiber Cultivation & YarnProductionFabric Production
Cut, Sew, Finishing
Sundries & Packaging
Transport/ Retail
88%Fiber Cultivation/Yarn Production
8%Fabric
1%Cut, Sew,
3%Sundries &Packaging
0
500
1000
1500
2000
2500
3000
Fiber Fabric Cut, Sew,Finish
Sundries &Pkg
Water Consumption (liters)
Water Consumption
2,565
23634
77
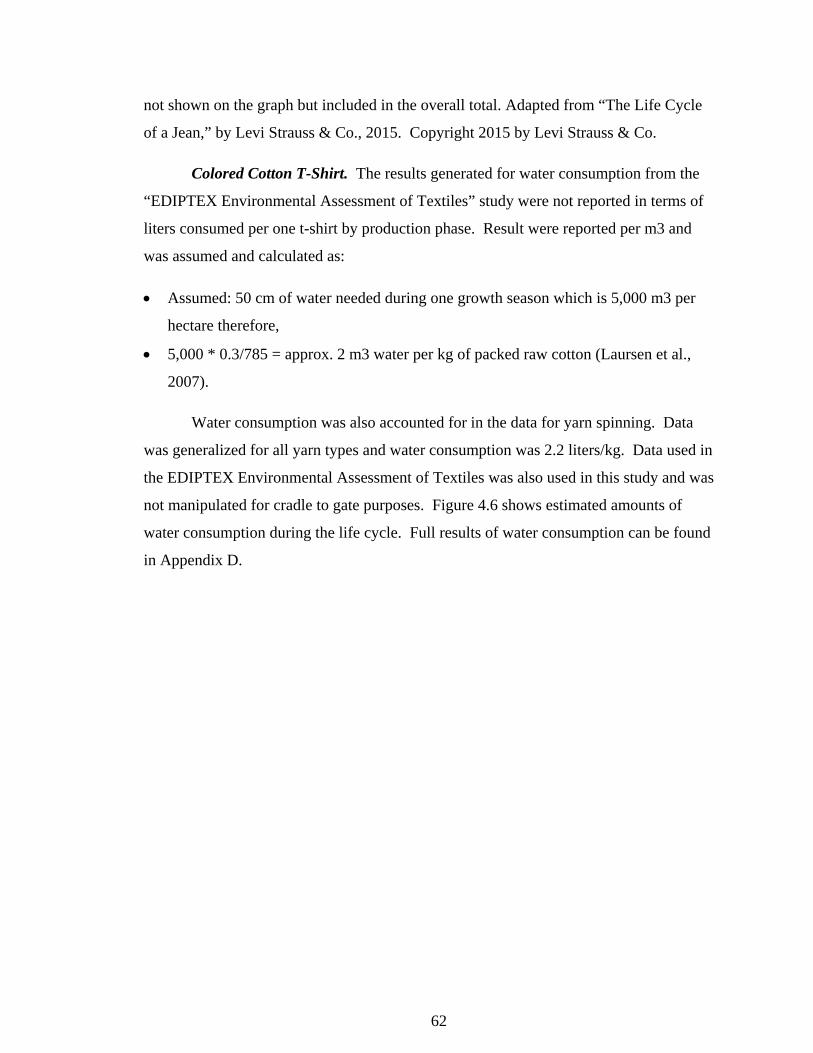
62
not shown on the graph but included in the overall total. Adapted from “The Life Cycle
of a Jean,” by Levi Strauss & Co., 2015. Copyright 2015 by Levi Strauss & Co.
Colored Cotton T-Shirt. The results generated for water consumption from the
“EDIPTEX Environmental Assessment of Textiles” study were not reported in terms of
liters consumed per one t-shirt by production phase. Result were reported per m3 and
was assumed and calculated as:
Assumed: 50 cm of water needed during one growth season which is 5,000 m3 per
hectare therefore,
5,000 * 0.3/785 = approx. 2 m3 water per kg of packed raw cotton (Laursen et al.,
2007).
Water consumption was also accounted for in the data for yarn spinning. Data
was generalized for all yarn types and water consumption was 2.2 liters/kg. Data used in
the EDIPTEX Environmental Assessment of Textiles was also used in this study and was
not manipulated for cradle to gate purposes. Figure 4.6 shows estimated amounts of
water consumption during the life cycle. Full results of water consumption can be found
in Appendix D.
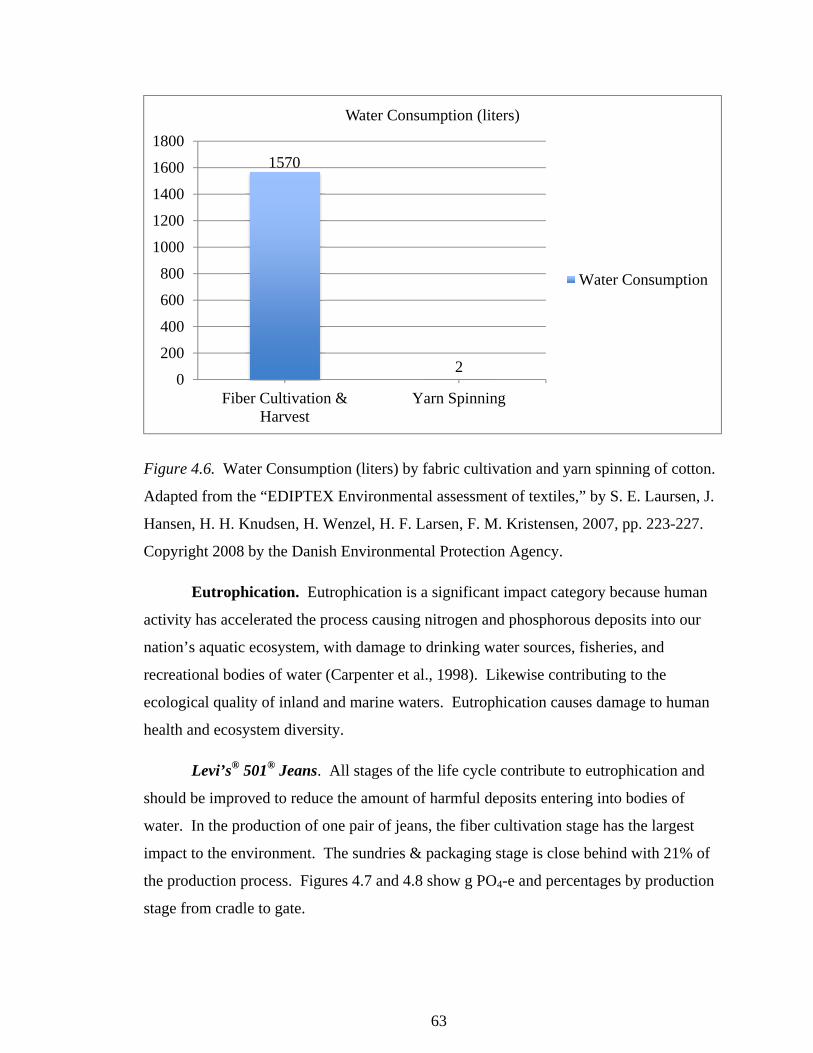
63
Figure 4.6. Water Consumption (liters) by fabric cultivation and yarn spinning of cotton.
Adapted from the “EDIPTEX Environmental assessment of textiles,” by S. E. Laursen, J.
Hansen, H. H. Knudsen, H. Wenzel, H. F. Larsen, F. M. Kristensen, 2007, pp. 223-227.
Copyright 2008 by the Danish Environmental Protection Agency.
Eutrophication. Eutrophication is a significant impact category because human
activity has accelerated the process causing nitrogen and phosphorous deposits into our
nation’s aquatic ecosystem, with damage to drinking water sources, fisheries, and
recreational bodies of water (Carpenter et al., 1998). Likewise contributing to the
ecological quality of inland and marine waters. Eutrophication causes damage to human
health and ecosystem diversity.
Levi’s® 501® Jeans. All stages of the life cycle contribute to eutrophication and
should be improved to reduce the amount of harmful deposits entering into bodies of
water. In the production of one pair of jeans, the fiber cultivation stage has the largest
impact to the environment. The sundries & packaging stage is close behind with 21% of
the production process. Figures 4.7 and 4.8 show g PO4-e and percentages by production
stage from cradle to gate.
0
200
400
600
800
1000
1200
1400
1600
1800
Fiber Cultivation &Harvest
Yarn Spinning
Water Consumption (liters)
Water Consumption
1570
2
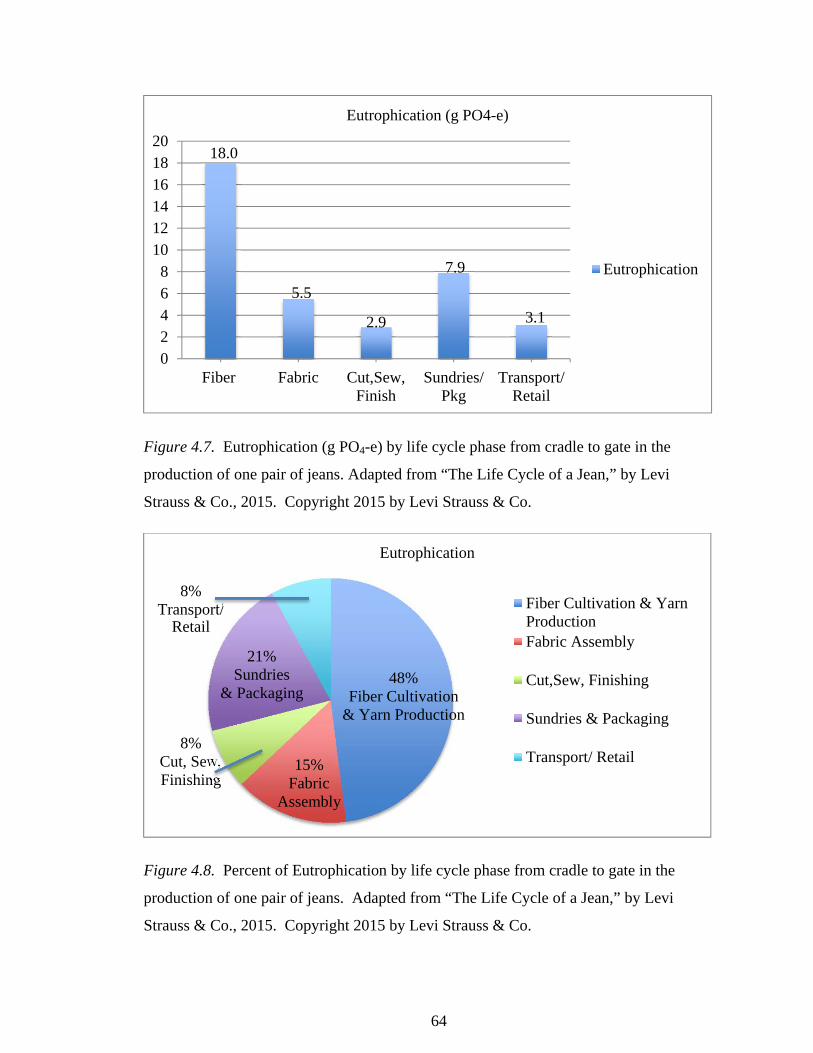
64
Figure 4.7. Eutrophication (g PO4-e) by life cycle phase from cradle to gate in the
production of one pair of jeans. Adapted from “The Life Cycle of a Jean,” by Levi
Strauss & Co., 2015. Copyright 2015 by Levi Strauss & Co.
Figure 4.8. Percent of Eutrophication by life cycle phase from cradle to gate in the
production of one pair of jeans. Adapted from “The Life Cycle of a Jean,” by Levi
Strauss & Co., 2015. Copyright 2015 by Levi Strauss & Co.
02468
101214161820
Fiber Fabric Cut,Sew,Finish
Sundries/Pkg
Transport/Retail
Eutrophication (g PO4-e)
Eutrophication
18.0
5.5
2.9
7.9
3.1
Eutrophication
Fiber Cultivation & YarnProductionFabric Assembly
Cut,Sew, Finishing
Sundries & Packaging
Transport/ Retail
48%Fiber Cultivation
& Yarn Production
8%Transport/
Retail
21%Sundries
& Packaging
8%Cut, Sew,Finishing
15%Fabric
Assembly
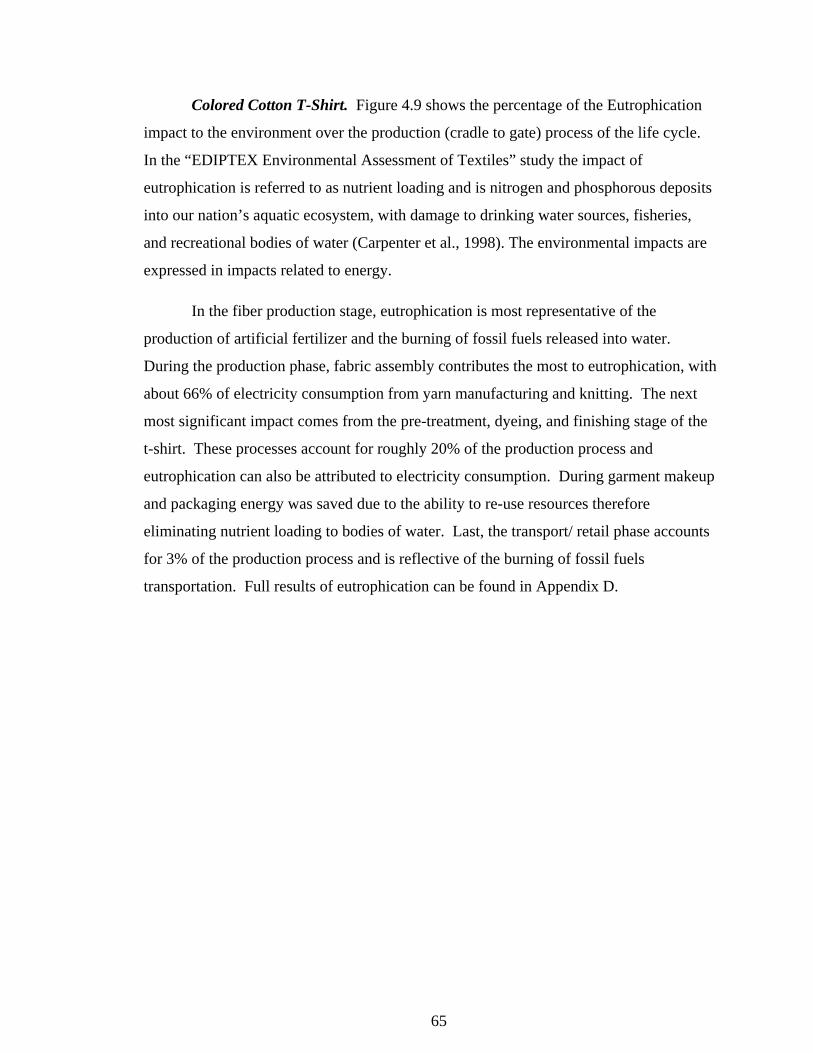
65
Colored Cotton T-Shirt. Figure 4.9 shows the percentage of the Eutrophication
impact to the environment over the production (cradle to gate) process of the life cycle.
In the “EDIPTEX Environmental Assessment of Textiles” study the impact of
eutrophication is referred to as nutrient loading and is nitrogen and phosphorous deposits
into our nation’s aquatic ecosystem, with damage to drinking water sources, fisheries,
and recreational bodies of water (Carpenter et al., 1998). The environmental impacts are
expressed in impacts related to energy.
In the fiber production stage, eutrophication is most representative of the
production of artificial fertilizer and the burning of fossil fuels released into water.
During the production phase, fabric assembly contributes the most to eutrophication, with
about 66% of electricity consumption from yarn manufacturing and knitting. The next
most significant impact comes from the pre-treatment, dyeing, and finishing stage of the
t-shirt. These processes account for roughly 20% of the production process and
eutrophication can also be attributed to electricity consumption. During garment makeup
and packaging energy was saved due to the ability to re-use resources therefore
eliminating nutrient loading to bodies of water. Last, the transport/ retail phase accounts
for 3% of the production process and is reflective of the burning of fossil fuels
transportation. Full results of eutrophication can be found in Appendix D.
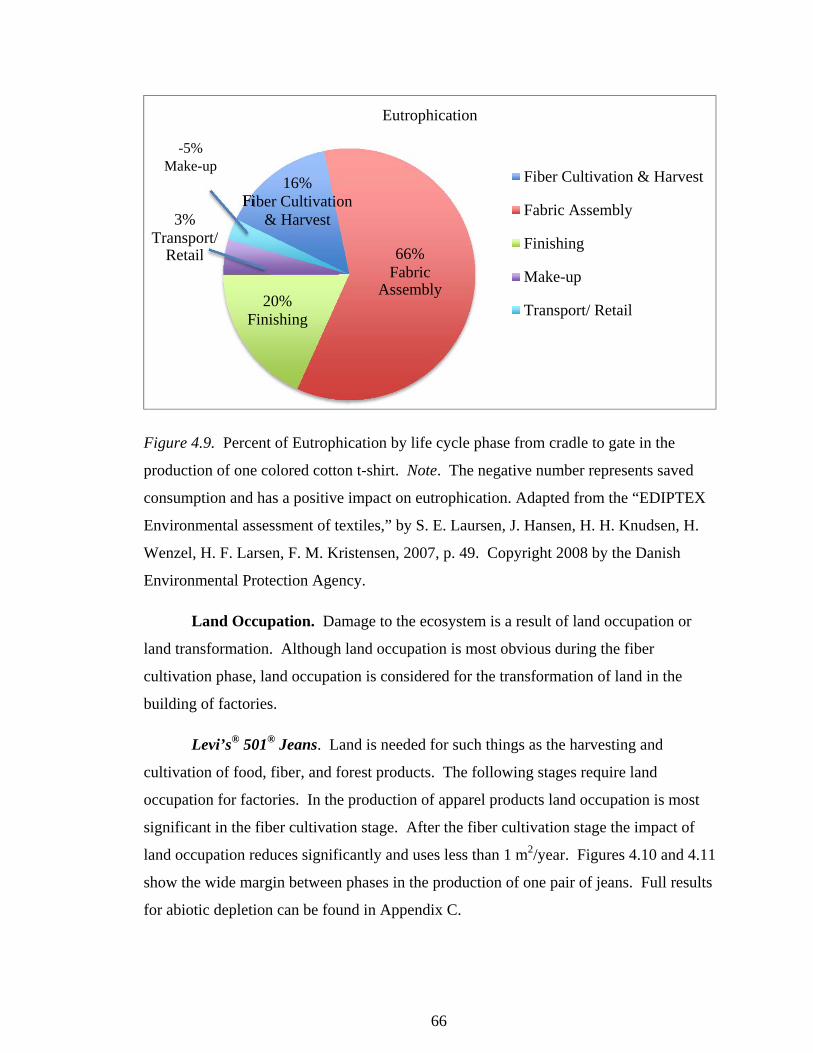
66
Figure 4.9. Percent of Eutrophication by life cycle phase from cradle to gate in the
production of one colored cotton t-shirt. Note. The negative number represents saved
consumption and has a positive impact on eutrophication. Adapted from the “EDIPTEX
Environmental assessment of textiles,” by S. E. Laursen, J. Hansen, H. H. Knudsen, H.
Wenzel, H. F. Larsen, F. M. Kristensen, 2007, p. 49. Copyright 2008 by the Danish
Environmental Protection Agency.
Land Occupation. Damage to the ecosystem is a result of land occupation or
land transformation. Although land occupation is most obvious during the fiber
cultivation phase, land occupation is considered for the transformation of land in the
building of factories.
Levi’s® 501® Jeans. Land is needed for such things as the harvesting and
cultivation of food, fiber, and forest products. The following stages require land
occupation for factories. In the production of apparel products land occupation is most
significant in the fiber cultivation stage. After the fiber cultivation stage the impact of
land occupation reduces significantly and uses less than 1 m2/year. Figures 4.10 and 4.11
show the wide margin between phases in the production of one pair of jeans. Full results
for abiotic depletion can be found in Appendix C.
Eutrophication
Fiber Cultivation & Harvest
Fabric Assembly
Finishing
Make-up
Transport/ Retail
66%Fabric
Assembly
16%Fiber Cultivation
& Harvest
20%Finishing
-5%Make-up
3%Transport/
Retail
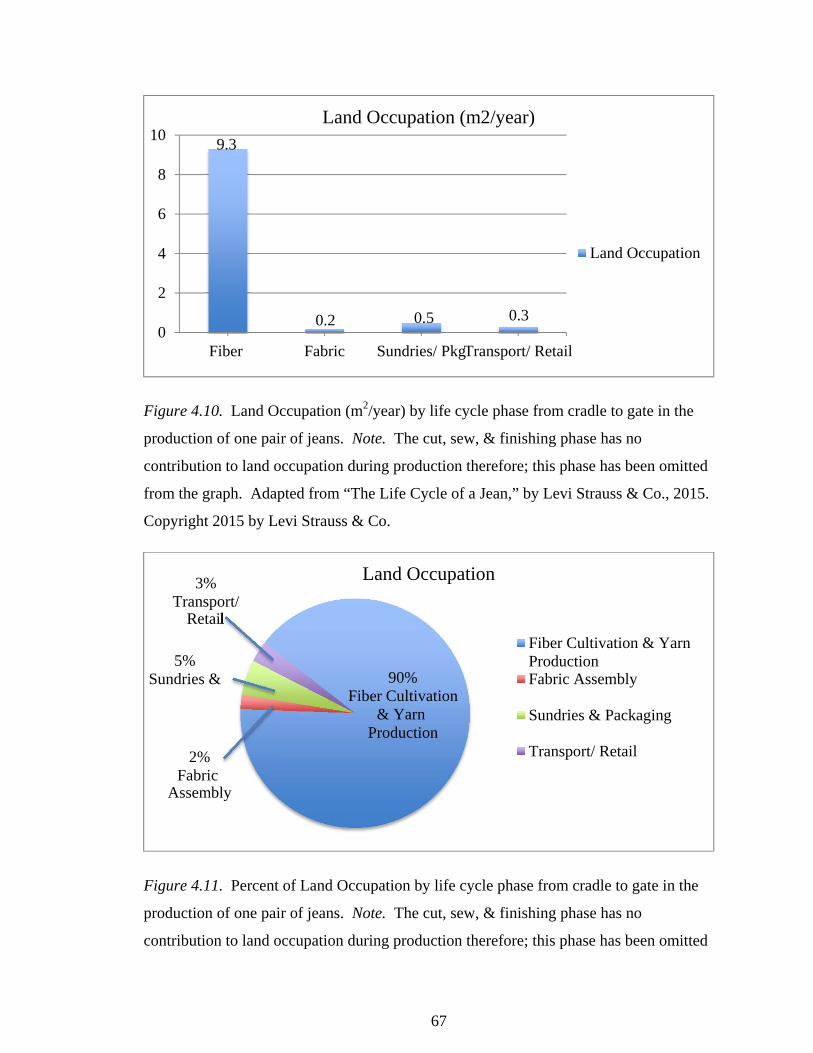
67
Figure 4.10. Land Occupation (m2/year) by life cycle phase from cradle to gate in the
production of one pair of jeans. Note. The cut, sew, & finishing phase has no
contribution to land occupation during production therefore; this phase has been omitted
from the graph. Adapted from “The Life Cycle of a Jean,” by Levi Strauss & Co., 2015.
Copyright 2015 by Levi Strauss & Co.
Figure 4.11. Percent of Land Occupation by life cycle phase from cradle to gate in the
production of one pair of jeans. Note. The cut, sew, & finishing phase has no
contribution to land occupation during production therefore; this phase has been omitted
0
2
4
6
8
10
Fiber Fabric Sundries/ PkgTransport/ Retail
Land Occupation (m2/year)
Land Occupation
9.3
0.2 0.5 0.3
Land Occupation
Fiber Cultivation & YarnProductionFabric Assembly
Sundries & Packaging
Transport/ Retail
90%Fiber Cultivation
& Yarn Production
3%Transport/
Retail
5%Sundries &
2%Fabric
Assembly
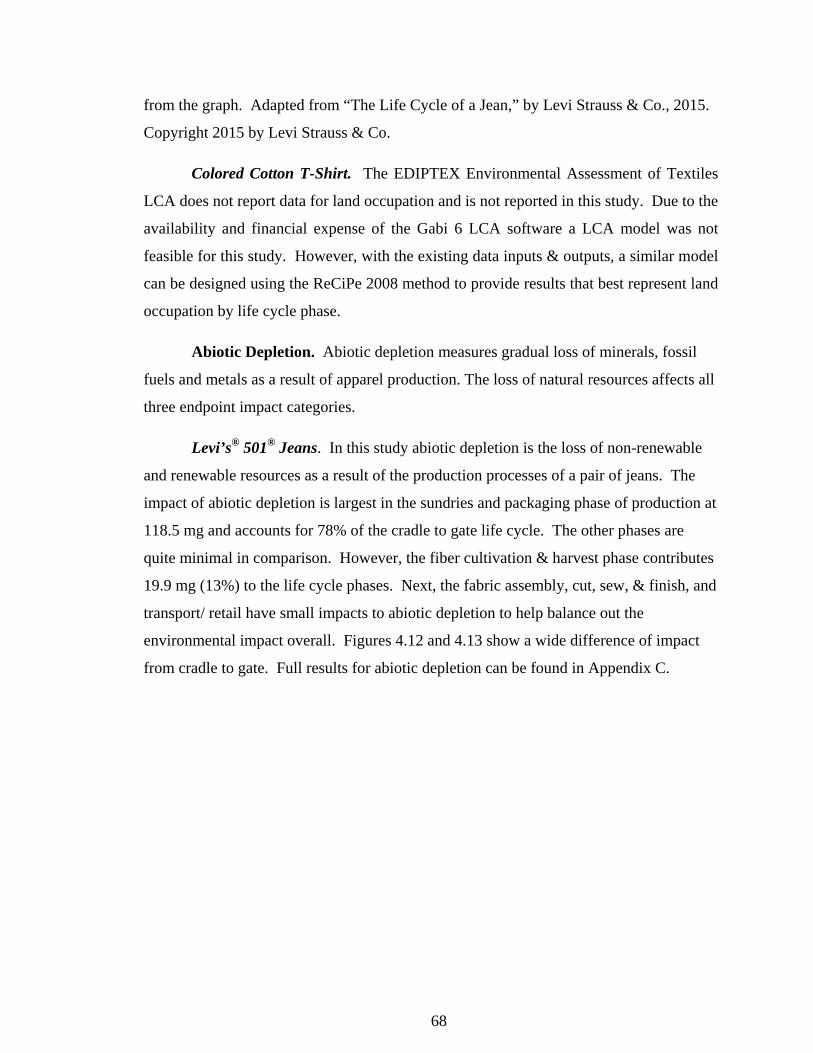
68
from the graph. Adapted from “The Life Cycle of a Jean,” by Levi Strauss & Co., 2015.
Copyright 2015 by Levi Strauss & Co.
Colored Cotton T-Shirt. The EDIPTEX Environmental Assessment of Textiles
LCA does not report data for land occupation and is not reported in this study. Due to the
availability and financial expense of the Gabi 6 LCA software a LCA model was not
feasible for this study. However, with the existing data inputs & outputs, a similar model
can be designed using the ReCiPe 2008 method to provide results that best represent land
occupation by life cycle phase.
Abiotic Depletion. Abiotic depletion measures gradual loss of minerals, fossil
fuels and metals as a result of apparel production. The loss of natural resources affects all
three endpoint impact categories.
Levi’s® 501® Jeans. In this study abiotic depletion is the loss of non-renewable
and renewable resources as a result of the production processes of a pair of jeans. The
impact of abiotic depletion is largest in the sundries and packaging phase of production at
118.5 mg and accounts for 78% of the cradle to gate life cycle. The other phases are
quite minimal in comparison. However, the fiber cultivation & harvest phase contributes
19.9 mg (13%) to the life cycle phases. Next, the fabric assembly, cut, sew, & finish, and
transport/ retail have small impacts to abiotic depletion to help balance out the
environmental impact overall. Figures 4.12 and 4.13 show a wide difference of impact
from cradle to gate. Full results for abiotic depletion can be found in Appendix C.
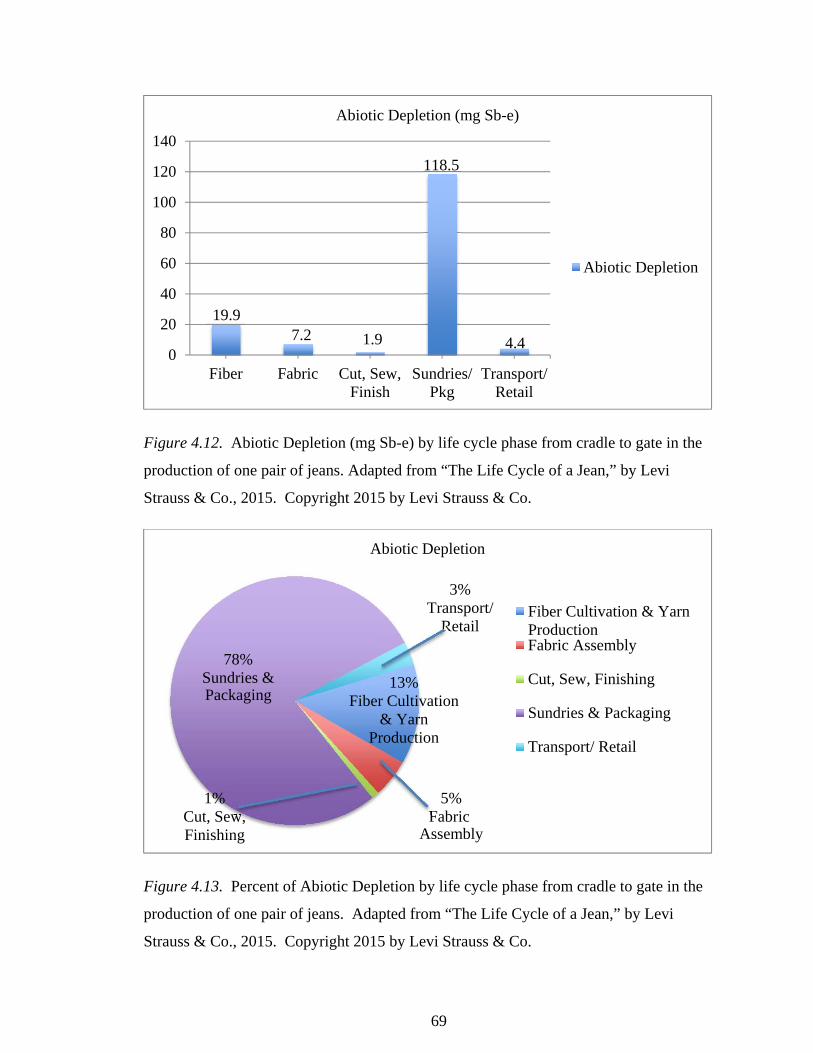
69
Figure 4.12. Abiotic Depletion (mg Sb-e) by life cycle phase from cradle to gate in the
production of one pair of jeans. Adapted from “The Life Cycle of a Jean,” by Levi
Strauss & Co., 2015. Copyright 2015 by Levi Strauss & Co.
Figure 4.13. Percent of Abiotic Depletion by life cycle phase from cradle to gate in the
production of one pair of jeans. Adapted from “The Life Cycle of a Jean,” by Levi
Strauss & Co., 2015. Copyright 2015 by Levi Strauss & Co.
0
20
40
60
80
100
120
140
Fiber Fabric Cut, Sew,Finish
Sundries/Pkg
Transport/Retail
Abiotic Depletion (mg Sb-e)
Abiotic Depletion
19.97.2 1.9
118.5
4.4
Abiotic Depletion
Fiber Cultivation & YarnProductionFabric Assembly
Cut, Sew, Finishing
Sundries & Packaging
Transport/ Retail
78%Sundries &Packaging
3%Transport/
Retail
13%Fiber Cultivation
& YarnProduction
5%Fabric
Assembly
1%Cut, Sew,Finishing
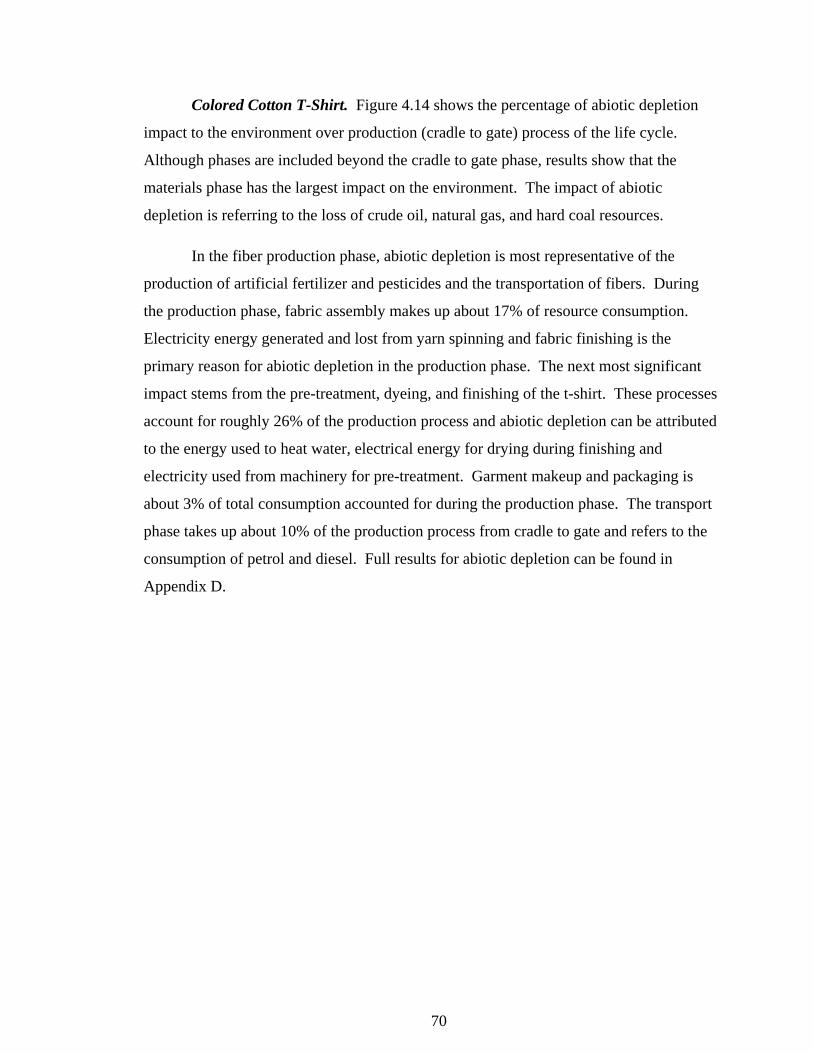
70
Colored Cotton T-Shirt. Figure 4.14 shows the percentage of abiotic depletion
impact to the environment over production (cradle to gate) process of the life cycle.
Although phases are included beyond the cradle to gate phase, results show that the
materials phase has the largest impact on the environment. The impact of abiotic
depletion is referring to the loss of crude oil, natural gas, and hard coal resources.
In the fiber production phase, abiotic depletion is most representative of the
production of artificial fertilizer and pesticides and the transportation of fibers. During
the production phase, fabric assembly makes up about 17% of resource consumption.
Electricity energy generated and lost from yarn spinning and fabric finishing is the
primary reason for abiotic depletion in the production phase. The next most significant
impact stems from the pre-treatment, dyeing, and finishing of the t-shirt. These processes
account for roughly 26% of the production process and abiotic depletion can be attributed
to the energy used to heat water, electrical energy for drying during finishing and
electricity used from machinery for pre-treatment. Garment makeup and packaging is
about 3% of total consumption accounted for during the production phase. The transport
phase takes up about 10% of the production process from cradle to gate and refers to the
consumption of petrol and diesel. Full results for abiotic depletion can be found in
Appendix D.
71
Figure 4.14. Percent of Abiotic Depletion by life cycle phase from cradle to gate in the
production of a colored cotton t-shirt. Adapted from the “EDIPTEX Environmental
assessment of textiles,” by S. E. Laursen, J. Hansen, H. H. Knudsen, H. Wenzel, H. F.
Larsen, F. M. Kristensen, 2007, p. 49. Copyright 2008 by the Danish Environmental
Protection Agency.
Interpretation of Results
Climate Change. The impact for climate change in the production of one pair of
jeans and cotton t-shirt is similiar. In accordance with the life cycle phase, fabric
assembly has the largest impact. Climate change is attributed to the electricity consumed
during the yarn manufacturing and fabric finishing to achieve the soft hand of a fabric.
The process is more rigorous in the production of a cotton t-shirt because a t-shirt is
expected to have a softer hand than denim jeans, therefore, requiring an extra softening
process to achieve the desired feel. When comparing the two items based on results, the
cotton t-shirt has a greater impact on climate change and is connected to global warming
that has an endpoint impact to human health and the ecosystem.
Water Consumption. Water Consumption results mainly reflect liters of water
consumed, and not reused, in the cultivation and harvest of cotton. The largest impact is
Abiotic Depletion
Fiber Cultivation & Harvest
Fabric Assembly
Finishing
Make-up
Transport/ Retail17%
FabricAssembly
26%Finishing
44%Fiber Cultivation
& Harvest
10%Transport/
Retail
3%Make-up
72
experienced in the fiber cultivation stage (raw materials extraction) in the production of
both products compared. The amount of liters is very close and, in this study, is assumed
to be equal because results are in terms of amount grown and not a single product.
However, water consumption does not only occur in the fiber production phase but in the
entire life cycle. Water is essential to the production of textiles. Although the t-shirt data
only shows data for the spinning phase, it is assumed water was used and consumed
throughout the cradle to gate process. Jeans require water that is lost during fabric
assembly and typically is a result of the finishing and dye processes. Water is
consumption in both products is not avoidable but essential. Adjustments to the impact
of water consumption can be affected by recycling water throughout the life cycle
process. Therefore, due to the lack of information, jeans require the most water to be
used. In turn, water consumption will affect our future generation in human health,
ecosystem diversity and resource availability.
Eutrophication. Water quality is a large concern when discussing environmental
impacts. Eutrophication is the continued act of nutrient deposits into freshwater aquatic
systems. The main problems for bodies of freshwater are phosphorus and nitrogen
deposits from outside sources. The results show eutrophication occurs in two very
different phases of production between a jean and t-shirt. Jeans show eutrophication is
the most prominent in the fiber cultivation and harvest phase. This is a result of
chemicals used causing nutrient rich runoff water. Water full of rich nutrients causes the
depletion of oxygen in freshwater aquatic systems, Therefore starting the negative impact
of eutrophication. On the other hand, the greatest impact to eutrophication happens in
the fabric assembly phase in the production of a cotton t-shirt. The fabric assembly phase
also uses chemicals that release nutrients into water consumed, but eutrophication impact
also comes from the electricity energy consumed. This is a direct impact of oxygen
depletion. Ultimately, over a period of time, production activities will result in oxygen
depletion and lead to the death of fish species. The endpoint impact is to human health
and ecosystem diversity.
Land Occupation. Land Occupation results were available for jeans only and
had the greatest presence in the fiber cultivation and harvest stage. Land occupation
73
contributes to 90% of production from the fiber phase. This mainly is the result of land
used for crop production. As a result the earth loses trees as a natural resource. It is not
as important in the remaining phases of the cradle to gate processes, due to the factories
and mills not requiring as much land to operate. Unlike other environmental impacts,
land occupation has an impact that is immediate to the availability of natural resources.
Other environmental impacts show results that happen over time and affect the quality of
the environment in the future.
Abiotic Depletion. Abiotic depletion is a large environmental issue to consider
in textile production because it uses so many natural resources that the earth cannot get
back. The results of the cotton t-shirt shows significant impact in the fiber cultivation
and harvest phase. On the other hand, the largest impact of abiotic depletion occurs in
the sundries and packaging phase for the production of a pair of jeans. This phase uses
fossil fuels, metals and miners that are non-renewable resources. In the production of
jeans, sundries production refers to all materials needed for the garment other than the
fabric. Sundries production included molding and forming of metals used for the zippers
and rivets and application process. This process uses an enormous amount of energy
from electricity consumption, Therefore causing this phase to have a large impact on the
environment. Without the use of sundries, the garment make-up phase would not have
such a large impact. Although, the make-up phase in the cotton t-shirt still has an
environmental impact from abiotic depletion the impact is considerably less. The impacts
of activities used have and endpoint impact on resource availability in future generations.
74
Chapter Five
Conclusion
The overall purpose of this research was to compare the environmental
implications of widely produced and owned apparel products through a life cycle
assessment approach. In addition, determine if the apparel products are fully sustainable
for the consumer at the point of purchase. The research focused on the important
environmental impacts as a result of jeans and t-shirt apparel production. This study used
existing life cycle assessments to compare two apparel items that are normally purchased
together by consumers.
The overall objective of the research study was to assess the life cycle of a
product to determine if it is a sustainable product for the consumer, at the point of
purchase. The first objective was to assess the environment impacts of an apparel
product’s life cycle from cradle (raw material extraction) to gate (garment make-up &
distribution). As the goal and scope of the study, the research results and discussion
followed a detailed structure of a LCA as proposed by the ISO 14040 series standards.
Furthermore, the scope of the LCA was to focus on the life cycle of a denim jean and
cotton t-shirt from cradle to gate rather than the entire life cycle from cradle to grave.
This decision was to analyze the sustainability of a product from manufacturing.
Next the results of two LCAs were combined to evaluate the results using the
ReCiPe 2008 method. Data results were analyzed and discussed in regards to the impact
categories indicated by the ReCiPe 2008 method. The environmental impacts were
climate change, eutrophication, water consumption, land occupation and abiotic
depletion. The research study shows that the most significant contributions to the
environmental impact related to processes, chemicals, and energy consumed originated
from the fiber cultivation and harvest phase production.
The resounding message within the life cycle assessments was that cradle to gate
apparel production is controlled by the retailer/manufacturer, therefore suggesting that
there is always room for improvement. Improvements should occur in the fiber
production phase by switching to organic cotton, which requires the use of less harmful
75
chemicals and not as many. Evaluating the choice of dyes and their potential impact on
the environment, before hand in the fabric assembly phase, helps in reducing the negative
impacts to human health and ecosystem diversity. The reuse of dye water for other
products can reduce water consumption and provide new avenues of textile dyeing. As a
result, a retailer/manufacturer can save energy and reduce consumption of pesticides
during fiber production and minimize waste.
Fiber Cultivation and Harvest
The cultivation and harvest of cotton is the most resource intensive, politically
debated and socially unfair process of an apparel product’s lifecycle (Camp, Scott, Clark,
Duane, & Haight, 2010). The concerns and issues are both environmental (negative
affects of harmful chemicals) and socially (respect to the farmers and their families
livelihoods) connected.
To produce a pair of jeans and a t-shirt, the processes start with the extraction of
raw materials (i.e. Cotton). However, cotton must be harvested in large amounts and for
several months before extraction. This means that pesticide and fertilizing treatments are
applied frequently throughout harvest, causing chemicals to be present in runoff water
through the duration. Artificial fertilizers and pesticides have a large effect on human
health and are the chemicals widely used in fiber cultivation.
The chemicals needed for cotton growth can potentially damage the quality of the
crop and the health of the farmers managing the crop. In addition to the fiber cultivation
and harvest phase, residual chemicals remain in the fiber and continue to cause toxic
impacts to humans during the fiber processing phase and do not disappear till the fiber
becomes a fabric and undergoes wet processing procedures. On the other hand, organic
cotton is an alternative to prevent toxic impacts on human health and the actual crop. In
many instances organic cotton cultivation uses organic manure for crop growth which
eliminates pesticides and fertilizers; reducing the affects of greenhouse gases (climate
change) and nutrient loading (eutrophication). However, energy related environmental
impacts are not completely eliminated because organic cotton harvest utilizes mechanical
weed control and transport to spread manure (Laursen et al., 2007). Although, organic
76
cotton is safer to harvest and helps to create a more sustainable apparel product, the
financial concerns associated with organic cotton lack government funding and are more
expensive for retailers/manufacturers to use.
Water Consumption
The results of this study show that water consumption had the most significant
impact in the fiber cultivation and harvest phase due to the large amounts of water used to
grow cotton. Cotton irrigation is important to the viability of the crop and the yield is
determined by how well the process is managed. Cotton harvest and cultivation varies
among many countries due to the climate. In the U.S., 65% of cotton is produced under
non-irrigated conditions (Cotton Incorporated, 2010). This means that the amount of
rainfall that occurs yearly is sufficient for the crop and does not need extra water. The
large differences in crop yield are because irrigation supplements rainfall, ensuring
enough water reaches the root of the crop. Since the occurrence of rainfall is random it
requires farmers to irrigate the land in order to stay competitive with other farmers
producing cotton. Although the amount of water used varies by country, the overall
amount utilized in apparel production is large and determines the yield of the crop.
Thereby, making it difficult to reduce the environmental impact of water consumption in
the fiber cultivation and harvest stage.
Yet, water consumption still has a significant impact in the production phase from
the dyeing and finishing processes. Large amounts of water combined with reactive dyes
are used to prepare dye baths. Conventional reactive dyes account for 70% of dyes used
for cotton (Cotton Incorporated, 2010). The percentage of dye that moves from the dye
bath to the fiber and permanently bonds is low. Therefore, removing the amount of dye
that does not affix permanently is extensively rinsed and washed, causing an increase in
water consumption in addition to the dye baths. Water is an essential resource needed in
apparel production but, the adoption of higher value dyes (dyes with higher affinity rates
that require less water) and low-liquor-ratio jet dyeing machines (high quality machines
with low ratio of water to material) can significantly reduce the amount of water
consumed and wasted.
77
Energy Consumption
Energy consumption is present in all phases of the life cycle however, in the
production of a pair jeans and t-shirt, energy is the largest in the production (finishing,
fabric assembly and garment make-up) phase. Energy consumption during the life cycle
is a reflection of the processes that require a lot electrical energy from the machinery
used in pesticide and artificial fertilizers, yarn manufacturing and garment assembly.
Energy consumption also occurs from the vehicles used in all areas of transport. Energy
consumption is linked to every process in the lifecycle so, when using more efficient
methods and machinery, energy consumption is reduced as an added benefit.
Furthermore, apparel production links the environmental impacts of water, energy and
chemical consumption in all phases of the lifecycle as a result of each process.
Motivation to adopt sustainable technologies and practices results in significant savings
in resources and environmental benefits (Cotton Incorporated, 2010).
There is no doubt that all textile production impacts the environment (Chen &
Burns, 2006) but, the retailer/ manufacturer has the ability to influence the production
processes up to the point of purchase to create a more sustainable design and a product
that has a reduced environmental impact. It is impossible to create an apparel item that is
considered a 100% sustainable garment that does not have any environmental impact.
Subsequently, the decisions made on the basis of sustainability can influence the
consumer’s habits in the use phase. When retailers/ designer provide consumers with
their efforts to reduce their carbon footprint, consumers can make educated purchasing
decisions on popular fast fashion items with sustainability in mind.
A move towards sustainable apparel production is not only the retailer’s
responsibility but also a response to consumer demand. The more consumers know of
sustainable practices, the more likely the apparel industry can provoke change.
Continuing to make sustainability an expectation allows the retailer/ manufacturer to
ensure the validity of a sustainable apparel product. Cotton Incorporated (2010) indicates
“that while consumers have become more environmentally aware, their understanding of
textile manufacturing and the effects on the environment is limited, as is their willingness
to pay more for environmentally friendly textile products” (p.1). The efforts and
78
improvements made towards sustainability should act as a badge of honor. Identifying
processes and removing the barriers of apparel production; and specifying the actions you
want the consumer to take helps strengthen the sustainable validity of an apparel product
(Luke, 2008). This will enable the consumer to make sustainable choices in their
selection of sustainable fashions. At the point of purchase, manufacturers can use this
opportunity to boast about their achievements through packaging and hang tags.
Evidence such as: websites and sustainable seals explaining the improvements encourage
the consumer to take a step further into the product, Therefore gaining confidence that the
retailer is concerned with the consumer’s needs and their views on sustainability.
Life Cycle Assessment Data
Both LCAs utilized in this study utilized data from a broad range of sources,
which created variability between products. This caused uncertainty of important data to
include by life cycle phase. A well-known hurdle in life cycle assessments is the access
to good and trustworthy data. Having strong relationships with suppliers and business
partners within the supply chain make it easier to obtain strong accurate data for LCA
modeling. Petersen, Handfield, and Ragatz (2005) have concluded that a valuable and
strong relationship with suppliers facilitates better decision-making by the product
development team and promotes the development of a better design.
There are uncertainties with any LCA model used to determine environmental
impacts. Depending on whether the LCA model is simplistic or more complex, the
parameters may vary leaving many input and output flows unaccounted for. More
complex models, that capture as many input and output inventory flows possible, have
the advantage of representing more accurate environmental impacts as a result of textile
production. However, it is impossible to capture all elements in the life cycle of a
product, as pointed out in chapter 4 with the elimination of results for land occupation in
the development of a cotton t-shirt.
It should be noted that the production of cotton varies from country to country and
is difficult to capture all countries with like procedures and requirements. Therefore
assumptions were made in the life cycle assessment of a cotton t-shirt and data was
79
generalized. In the finishing phase, the LCA of a jean considered a long list of chemicals
related to dyes and finishes whereas, the t-shirt analyzed only one reactive dye and one
acid dye that represents the entire study.
Limitations of Study
This research study focused on the manufacturing of a cotton T-shirt and a pair of
denim jeans. These products were significant because they are items that are widely
owned by consumers in large amounts. However, by using only jeans and t-shirts as a
focus limits the study, assuming they are the only fast fashion items consumers own in
excess. Although the processes within each life cycle phase are very similar between
jeans and a t-shirt, the finishing procedures used to achieve the look and feel of the end
product are different, and would be beneficial to compare like products of the same wash.
Likewise, the data used from “The Life Cycle of a Jean,”(LeviStrauss&Co., 2015) study
was based on sales and production data from 2012 and the LCA of a cotton t-shirt from
“EDIPTEX – Environmental assessment of textiles,”(Laursen et al., 2007) was based on
data from 1990 in regards to all processes that consume electrical energy.
For comparison, the study used data from previous life cycle assessments and
does not conduct an actual LCA. Due to the availability of resources, the inventory data
was not modeled in the Gabi 6 software. The Gabi 6 software is LCA software that can
be downloaded for a 30-day trail but does not come with pre-loaded inventory datasets
that supports textile production. The company also offers other software options and
textile datasets for a sizable fee. To be beneficial for purchase, the University of
Kentucky would need substantial reasoning to continue an ongoing license of the Gabi 6
professional software beyond the work of the this study. These issues made it difficult to
perform a LCA using software therefore, affecting the validity of comparison based on
the ReCiPe 2008 methodology.
Many life cycle assessments have been performed on various textile products
outside of the United States. The LCA used for the cotton t-shirt provided statistical data
from sources in Denmark and the jeans LCA was conducted for a US based company.
80
Using data from different countries affect the input and output flows at different phases.
Last, time was a hindrance in the collection of data.
Recommendations for Future Research
Based on the results and software obstacles, it is recommended that LCA software
be used to complete a life cycle assessment. A comparative analysis should be completed
using the same methodology in order to compare the environmental impacts of similar
products to each other. Previous LCAs have completed a comparison analysis but there
is a need for future work on fast fashion items that consumers normally purchase
together. Life cycle assessment research, available with statistical data, is needed yearly
to account for the changes in fiber production, a company’s sustainable initiative,
availability of suppliers, and factors that contribute to harm to human health, ecosystem
diversity, and resource availability.
Research is recommended to explore sustainable labeling as an extension of life
cycle assessments. Future research can investigate the connection between a consumers
purchasing decisions based on how much information is made available regarding the
company’s efforts towards sustainable production on fast fashion items. Last, Gabi 6
software is an easy tool to use, however the databases lack processes for textile
production and are not readily available. Collaboration with industry retailers will help
ensure that data is accurate and apparel products are widely represented in LCAs.
81
Appendix A
Definition of Terms
Abiotic Depletion - A measure of the depletion of non-renewable sources that includes
fossil energy, metals, and minerals (LeviStrauss&Co., 2015)
Agile Supply Chain – Is market sensitive with the ability to respond to actual real time
changes in demand. The use of information technology to share data between buyers and
suppliers (Bruce et al., 2004).
Climate Change - Global warming potential of greenhouse gases released into the
environment (LeviStrauss&Co., 2015).
Cradle to Gate – An assessment of a partial product life cycle from manufacture (cradle)
to the factory gate (gate) (Dupont, 2008).
Eutrophication - Oxygen depletion as a result of nitrogen and phosphorous deposit into
freshwater or marine environments (LeviStrauss&Co., 2015)
Fast Fashion – Low cost clothing collections based on current, high-cost luxury fashion
trends; a fast-response system that encourages disposability (Fletcher, 2008).
Globalization – The fast and unstoppable advances in information technologies, market
deregulation and large reductions in transport cost (Puig, Marques, & Ghauri, 2009).
Just-in-time – An inventory pull system approach to managing the supply chain
(Abuhilal, Rabadi, & Sousa-Poza, 2006)
Land Occupation – Occupation of a certain area of land during a certain time and or the
transformation of a certain area of land (Goedkoop et al., 2013).
Life Cycle - An analysis of a product’s entire life that begins with raw materials
extraction and ends with disposal.
82
Life Cycle Assessment (LCA) - A compilation and evaluation of the inputs, outputs and
the potential environmental impacts of a product system throughout its life cycle
(ANSI/ISO14040-1997 ).
Quick Response – A state of responsiveness and flexibility in which an organization
seeks to provide a highly diverse range of products and services to a customer in the
exact quantity, variety and quality, and at the right time, place and price as dictated by
real time customer/consumer demand (Lowson et al., 1999).
ReCiPe 2008 – The implementation of an LCIA method that is harmonized in terms of
modeling principles and choices, but which offers results at both the midpoint and
endpoint level (Goedkoop et al., 2013, p. 1).
Sundries – Hardware, buttons, snaps and ornaments that are attached to the garment
(Tortora & Merkel, 1996).
Sustainability – An activity that can be continued indefinitely without causing harm and
meeting a current generation’s needs without compromising those of future generations
(Fletcher, 2008).
Water Consumption - Net freshwater taken from the environment minus water returned to
the same watershed at the same quality or better (LeviStrauss&Co., 2015).
83
Appendix B
The ReCiPe 2008 method is a life cycle impact assessment method which
comprises harmonized category indicators at the midpoint and the endpoint level. As
supporting methodology material for this study, the full ReCiPe report can be accessed at
www.lcia-recipe.net/home. Additional reports are provided to better understand
normalization and characterization and CSV files to be used with the Simapro LCA
software. Due to the lengthy report, the ReCiPe 2008 was unable to be added to this
thesis. To be lead directly to the full report, copy and paste the address below into a web
browser.
ReCiPe 2008:
https://35f23ee4-a-62cb3a1a-s-sites.googlegroups.com/site/lciarecipe/file-
cabinet/ReCiPe_main_report_MAY_2013.pdf?attachauth=ANoY7cozb4El3bKOMksKK
4iuWvwkPqz9houGoGLaZLxS1zMPDCD0J1tbw_18QM5ocZdhPPSWBAhdsWXUlK_
G6ToHsQVKr7IDDsrXQWq3gaNzM54b3KpCmYG4zfT_BKkCMQ6H0ItuYMrG9AS
MVQLEwT3EKXdcpYQnz6CUjpRvYHwEkGEr9YEHzEbsXH9Rm6v9RrPmCoaq_-
gGgm2hY51cpr3l3QKsE25hAgx1zWOOPQe_pxBEsqU_0_yV3Wx7hkGy3OzqssRhE5p
3&attredirects=0
84
Appendix C
“The Life Cycle of a Jean. Understanding the environmental impact of a pair of
Levi’s® 501® jeans,” (LeviStrauss&Co., 2015) sustainability report was used as a
comparison throughout this thesis. Due to the lengthy report, the “Life Cycle of a Jean”
was unable to be added to this thesis. However, appendix C includes tables with
supporting data results and inventory analysis for the jean. To be lead directly to the full
report, copy and paste the address below into a web browser.
“The Life Cycle of a Jean. Understanding the environmental impact of a pair of Levi’s®
501® jeans”:
http://levistrauss.com/wp-content/uploads/2015/03/Full-LCA-Results-Deck-FINAL.pdf
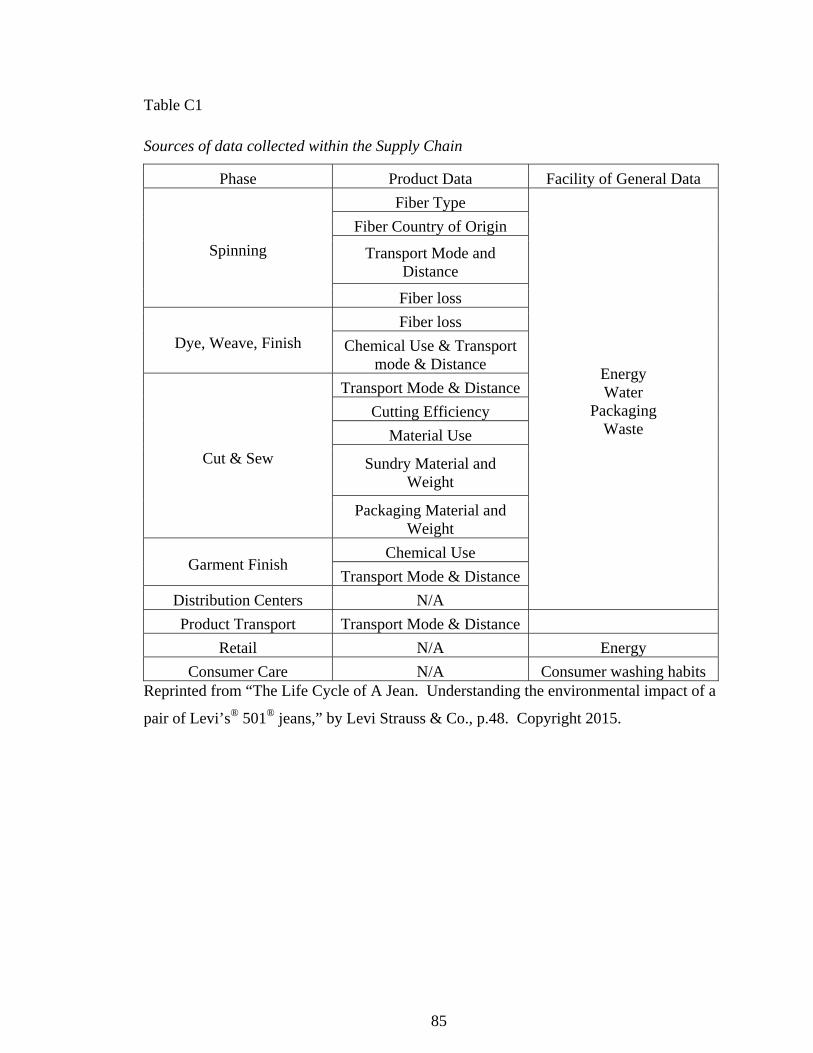
85
Table C1
Sources of data collected within the Supply Chain
Phase Product Data Facility of General Data
Spinning
Fiber Type
Energy Water
Packaging Waste
Fiber Country of Origin
Transport Mode and Distance
Fiber loss
Dye, Weave, Finish Fiber loss
Chemical Use & Transport mode & Distance
Cut & Sew
Transport Mode & Distance
Cutting Efficiency
Material Use
Sundry Material and Weight
Packaging Material and Weight
Garment Finish Chemical Use
Transport Mode & Distance
Distribution Centers N/A
Product Transport Transport Mode & Distance
Retail N/A Energy
Consumer Care N/A Consumer washing habits Reprinted from “The Life Cycle of A Jean. Understanding the environmental impact of a
pair of Levi’s® 501® jeans,” by Levi Strauss & Co., p.48. Copyright 2015.
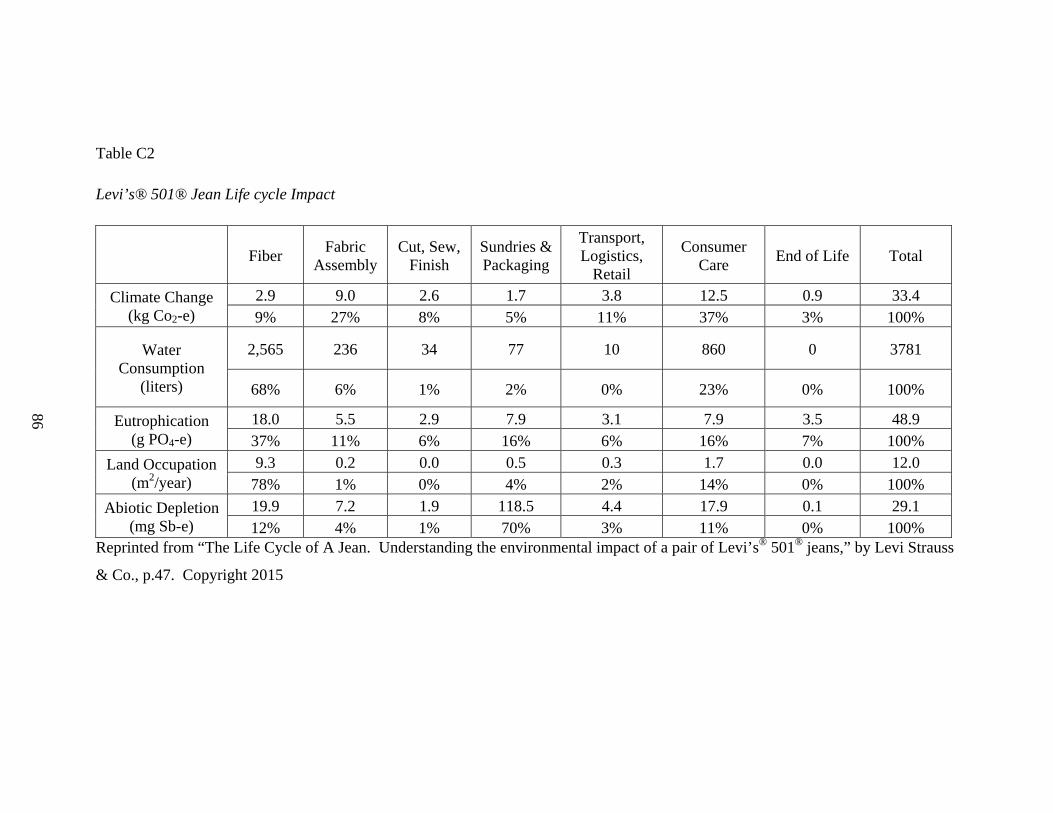
86
Table C2
Levi’s® 501® Jean Life cycle Impact
Fiber Fabric
Assembly Cut, Sew,
Finish Sundries & Packaging
Transport, Logistics,
Retail
Consumer Care
End of Life Total
Climate Change (kg Co2-e)
2.9 9.0 2.6 1.7 3.8 12.5 0.9 33.4 9% 27% 8% 5% 11% 37% 3% 100%
Water Consumption
(liters)
2,565 236 34 77 10 860 0 3781
68% 6% 1% 2% 0% 23% 0% 100%
Eutrophication (g PO4-e)
18.0 5.5 2.9 7.9 3.1 7.9 3.5 48.9 37% 11% 6% 16% 6% 16% 7% 100%
Land Occupation (m2/year)
9.3 0.2 0.0 0.5 0.3 1.7 0.0 12.0 78% 1% 0% 4% 2% 14% 0% 100%
Abiotic Depletion (mg Sb-e)
19.9 7.2 1.9 118.5 4.4 17.9 0.1 29.1 12% 4% 1% 70% 3% 11% 0% 100%
Reprinted from “The Life Cycle of A Jean. Understanding the environmental impact of a pair of Levi’s® 501® jeans,” by Levi Strauss
& Co., p.47. Copyright 2015
87
Appendix D
The “EDIPTEX – Environmental Assessment of Textiles,” (Laursen et
al., 2007) working report was used as a comparison throughout this thesis. Due
to the lengthy report, the “EDIPTEX – Environmental Assessment of Textiles” was
unable to be added to this thesis. However, appendix D includes tables with supporting
data results and inventory analysis for the t-shirt only. Supporting information includes
background data for the t-shirt, cotton harvest and cotton yarn spinning. To be lead
directly to the full report, copy and paste the address below into a web browser.
http://orbit.dtu.dk/en/searchall.html?searchall=EDIPTEX+-
+Environmental+Assessment+of+Textiles&uri=
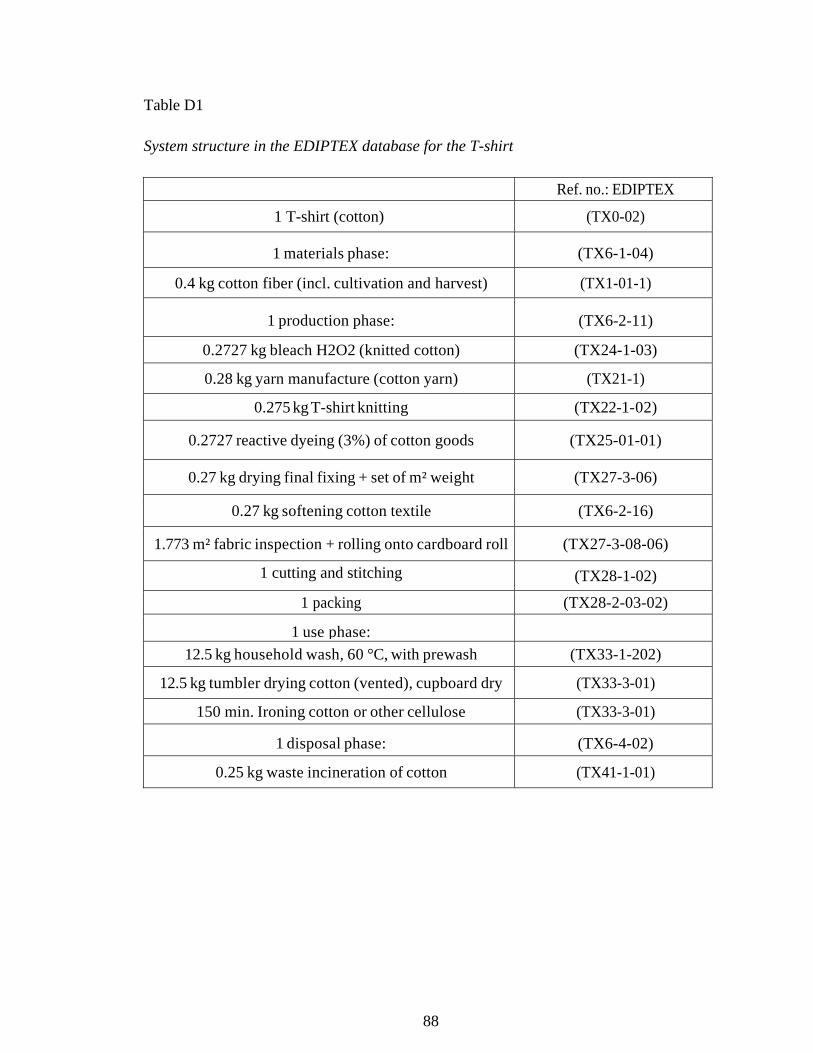
88
Table D1
System structure in the EDIPTEX database for the T-shirt
Ref. no.: EDIPTEX
1 T-shirt (cotton) (TX0-02)
1 materials phase: (TX6-1-04)
0.4 kg cotton fiber (incl. cultivation and harvest) (TX1-01-1)
1 production phase: (TX6-2-11)
0.2727 kg bleach H2O2 (knitted cotton) (TX24-1-03)
0.28 kg yarn manufacture (cotton yarn) (TX21-1)
0.275 kg T-shirt knitting (TX22-1-02)
0.2727 reactive dyeing (3%) of cotton goods (TX25-01-01)
0.27 kg drying final fixing + set of m² weight (TX27-3-06)
0.27 kg softening cotton textile (TX6-2-16)
1.773 m² fabric inspection + rolling onto cardboard roll (TX27-3-08-06)
1 cutting and stitching (TX28-1-02)
1 packing (TX28-2-03-02)
1 use phase:
12.5 kg household wash, 60 °C, with prewash (TX33-1-202)
12.5 kg tumbler drying cotton (vented), cupboard dry (TX33-3-01)
150 min. Ironing cotton or other cellulose (TX33-3-01)
1 disposal phase: (TX6-4-02)
0.25 kg waste incineration of cotton (TX41-1-01)
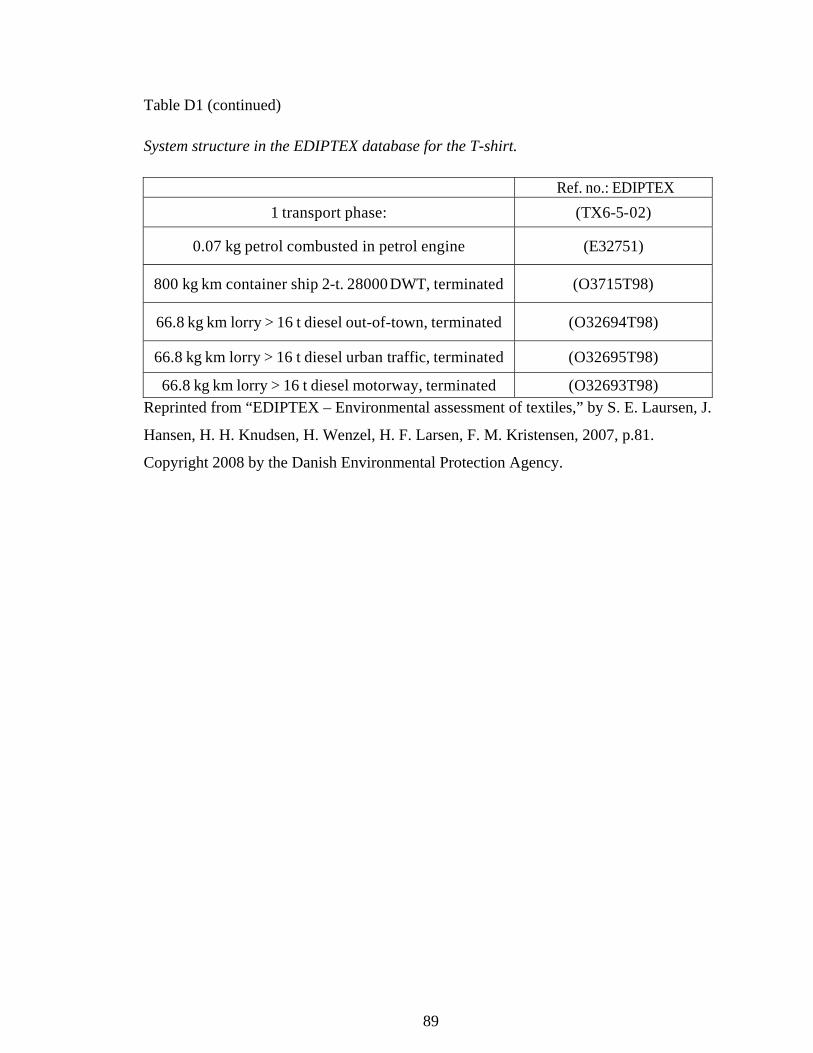
89
Table D1 (continued)
System structure in the EDIPTEX database for the T-shirt.
Ref. no.: EDIPTEX
1 transport phase: (TX6-5-02)
0.07 kg petrol combusted in petrol engine (E32751)
800 kg km container ship 2-t. 28000 DWT, terminated (O3715T98)
66.8 kg km lorry > 16 t diesel out-of-town, terminated (O32694T98)
66.8 kg km lorry > 16 t diesel urban traffic, terminated (O32695T98)
66.8 kg km lorry > 16 t diesel motorway, terminated (O32693T98) Reprinted from “EDIPTEX – Environmental assessment of textiles,” by S. E. Laursen, J.
Hansen, H. H. Knudsen, H. Wenzel, H. F. Larsen, F. M. Kristensen, 2007, p.81.
Copyright 2008 by the Danish Environmental Protection Agency.
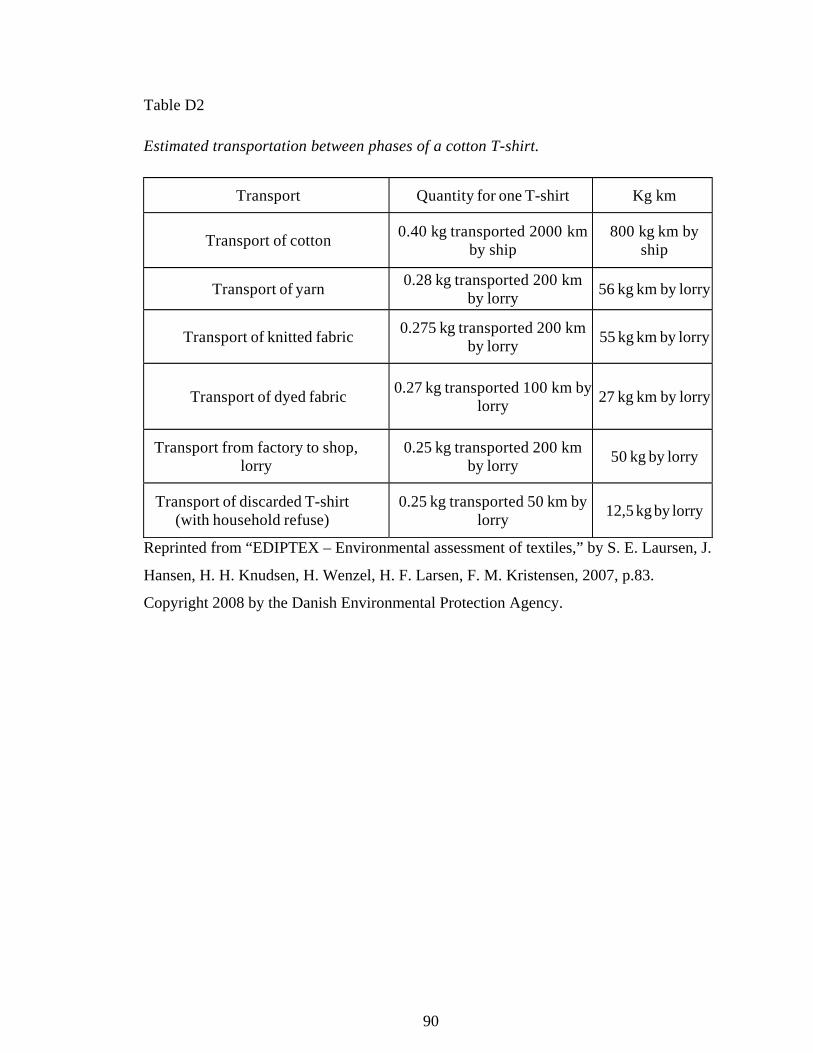
90
Table D2
Estimated transportation between phases of a cotton T-shirt.
Transport Quantity for one T-shirt Kg km
Transport of cotton 0.40 kg transported 2000 km
by ship 800 kg km by
ship
Transport of yarn 0.28 kg transported 200 km
by lorry 56 kg km by lorry
Transport of knitted fabric 0.275 kg transported 200 km
by lorry 55 kg km by lorry
Transport of dyed fabric 0.27 kg transported 100 km by
lorry 27 kg km by lorry
Transport from factory to shop, lorry
0.25 kg transported 200 km by lorry
50 kg by lorry
Transport of discarded T-shirt (with household refuse)
0.25 kg transported 50 km by lorry
12,5 kg by lorry
Reprinted from “EDIPTEX – Environmental assessment of textiles,” by S. E. Laursen, J.
Hansen, H. H. Knudsen, H. Wenzel, H. F. Larsen, F. M. Kristensen, 2007, p.83.
Copyright 2008 by the Danish Environmental Protection Agency.
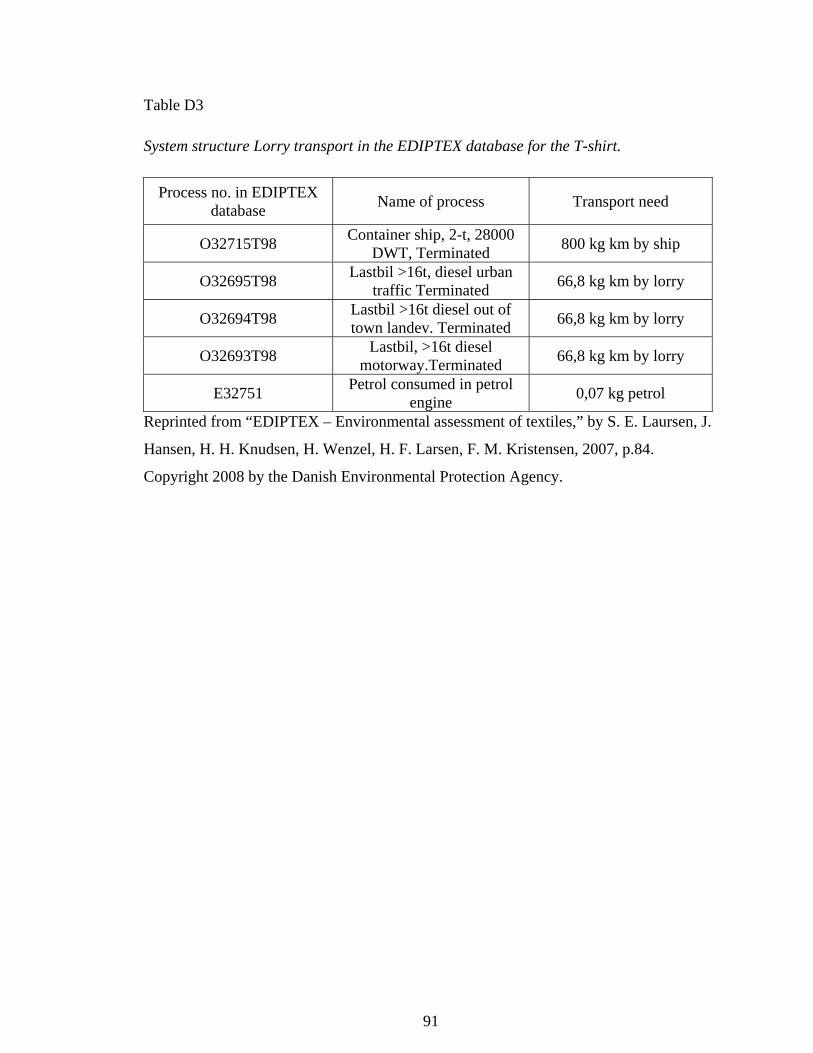
91
Table D3
System structure Lorry transport in the EDIPTEX database for the T-shirt.
Process no. in EDIPTEX database
Name of process Transport need
O32715T98 Container ship, 2-t, 28000
DWT, Terminated 800 kg km by ship
O32695T98 Lastbil >16t, diesel urban
traffic Terminated 66,8 kg km by lorry
O32694T98 Lastbil >16t diesel out of town landev. Terminated
66,8 kg km by lorry
O32693T98 Lastbil, >16t diesel
motorway.Terminated 66,8 kg km by lorry
E32751 Petrol consumed in petrol
engine 0,07 kg petrol
Reprinted from “EDIPTEX – Environmental assessment of textiles,” by S. E. Laursen, J.
Hansen, H. H. Knudsen, H. Wenzel, H. F. Larsen, F. M. Kristensen, 2007, p.84.
Copyright 2008 by the Danish Environmental Protection Agency.
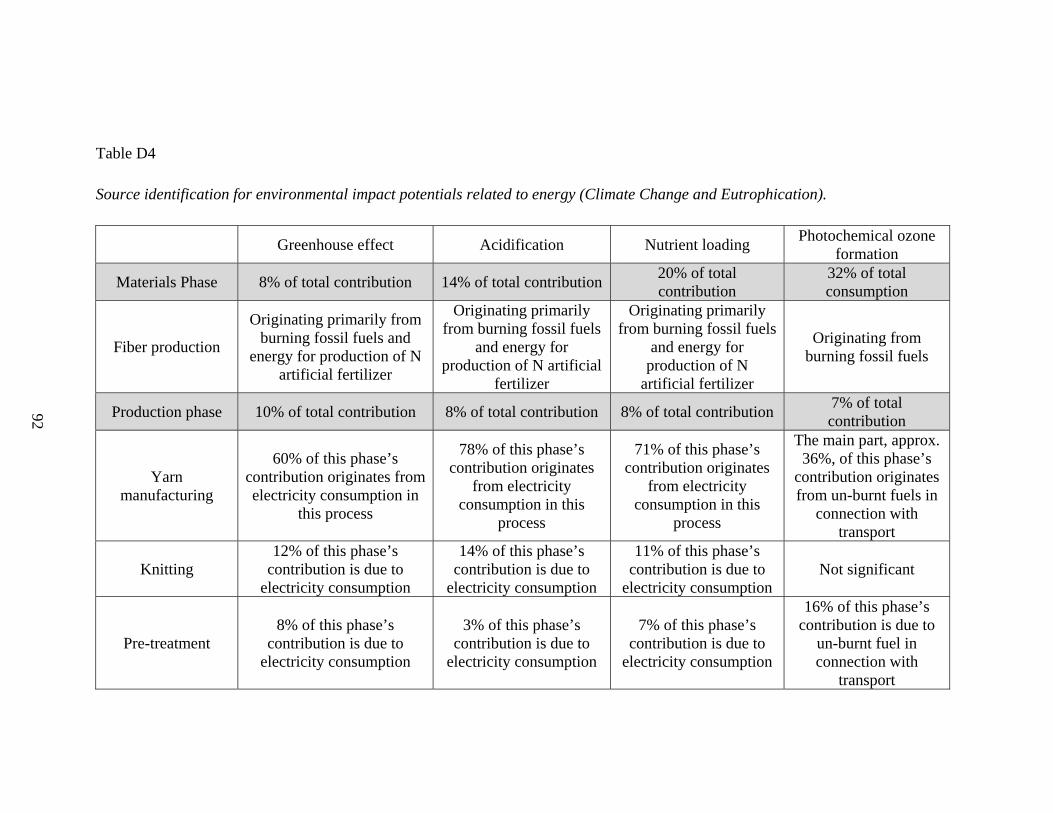
92
Table D4
Source identification for environmental impact potentials related to energy (Climate Change and Eutrophication).
Greenhouse effect Acidification Nutrient loading Photochemical ozone
formation
Materials Phase 8% of total contribution 14% of total contribution20% of total contribution
32% of total consumption
Fiber production
Originating primarily from burning fossil fuels and
energy for production of N artificial fertilizer
Originating primarily from burning fossil fuels
and energy for production of N artificial
fertilizer
Originating primarily from burning fossil fuels
and energy for production of N
artificial fertilizer
Originating from burning fossil fuels
Production phase 10% of total contribution 8% of total contribution 8% of total contribution 7% of total contribution
Yarn manufacturing
60% of this phase’s contribution originates from electricity consumption in
this process
78% of this phase’s contribution originates
from electricity consumption in this
process
71% of this phase’s contribution originates
from electricity consumption in this
process
The main part, approx. 36%, of this phase’s
contribution originates from un-burnt fuels in
connection with transport
Knitting 12% of this phase’s
contribution is due to electricity consumption
14% of this phase’s contribution is due to
electricity consumption
11% of this phase’s contribution is due to
electricity consumption Not significant
Pre-treatment 8% of this phase’s
contribution is due to electricity consumption
3% of this phase’s contribution is due to
electricity consumption
7% of this phase’s contribution is due to
electricity consumption
16% of this phase’s contribution is due to
un-burnt fuel in connection with
transport
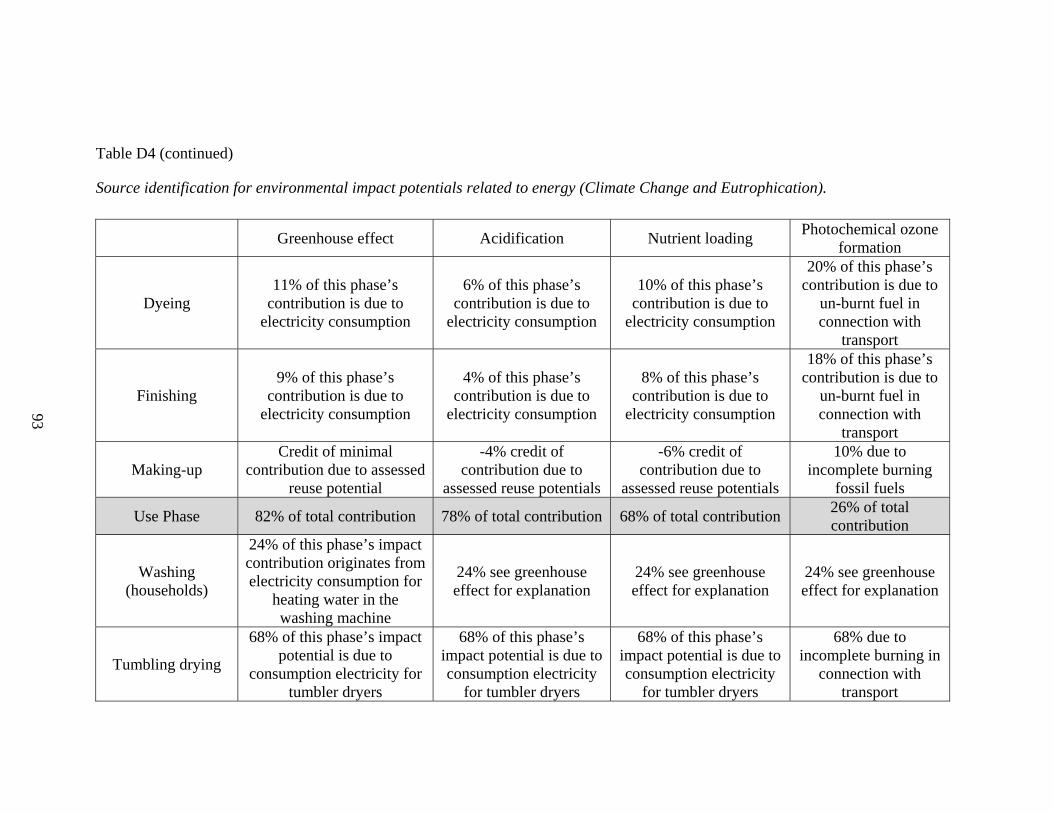
93
Table D4 (continued)
Source identification for environmental impact potentials related to energy (Climate Change and Eutrophication).
Greenhouse effect Acidification Nutrient loading Photochemical ozone
formation
Dyeing 11% of this phase’s
contribution is due to electricity consumption
6% of this phase’s contribution is due to
electricity consumption
10% of this phase’s contribution is due to
electricity consumption
20% of this phase’s contribution is due to
un-burnt fuel in connection with
transport
Finishing 9% of this phase’s
contribution is due to electricity consumption
4% of this phase’s contribution is due to
electricity consumption
8% of this phase’s contribution is due to
electricity consumption
18% of this phase’s contribution is due to
un-burnt fuel in connection with
transport
Making-up Credit of minimal
contribution due to assessed reuse potential
-4% credit of contribution due to
assessed reuse potentials
-6% credit of contribution due to
assessed reuse potentials
10% due to incomplete burning
fossil fuels
Use Phase 82% of total contribution 78% of total contribution 68% of total contribution 26% of total contribution
Washing (households)
24% of this phase’s impact contribution originates from electricity consumption for
heating water in the washing machine
24% see greenhouse effect for explanation
24% see greenhouse effect for explanation
24% see greenhouse effect for explanation
Tumbling drying
68% of this phase’s impact potential is due to
consumption electricity for tumbler dryers
68% of this phase’s impact potential is due to consumption electricity
for tumbler dryers
68% of this phase’s impact potential is due to consumption electricity
for tumbler dryers
68% due to incomplete burning in
connection with transport
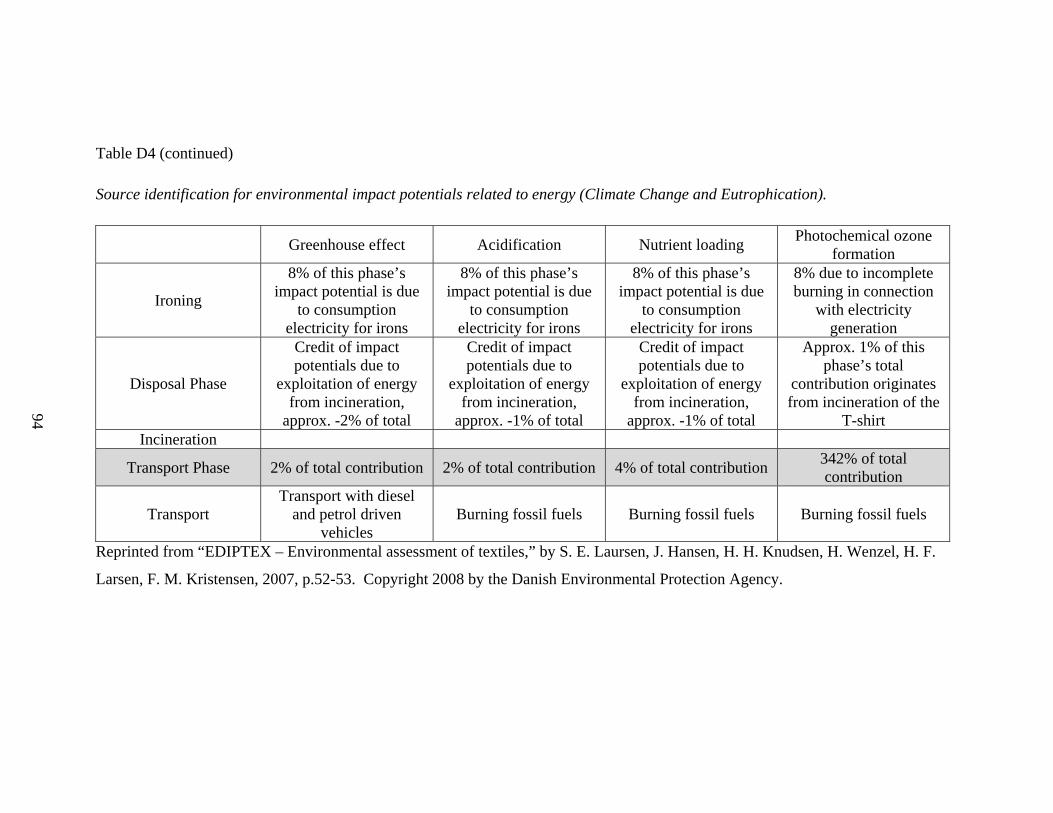
94
Table D4 (continued)
Source identification for environmental impact potentials related to energy (Climate Change and Eutrophication).
Greenhouse effect Acidification Nutrient loading Photochemical ozone
formation
Ironing
8% of this phase’s impact potential is due
to consumption electricity for irons
8% of this phase’s impact potential is due
to consumption electricity for irons
8% of this phase’s impact potential is due
to consumption electricity for irons
8% due to incomplete burning in connection
with electricity generation
Disposal Phase
Credit of impact potentials due to
exploitation of energy from incineration,
approx. -2% of total
Credit of impact potentials due to
exploitation of energy from incineration,
approx. -1% of total
Credit of impact potentials due to
exploitation of energy from incineration,
approx. -1% of total
Approx. 1% of this phase’s total
contribution originates from incineration of the
T-shirt Incineration
Transport Phase 2% of total contribution 2% of total contribution 4% of total contribution 342% of total contribution
Transport Transport with diesel
and petrol driven vehicles
Burning fossil fuels Burning fossil fuels Burning fossil fuels
Reprinted from “EDIPTEX – Environmental assessment of textiles,” by S. E. Laursen, J. Hansen, H. H. Knudsen, H. Wenzel, H. F.
Larsen, F. M. Kristensen, 2007, p.52-53. Copyright 2008 by the Danish Environmental Protection Agency.
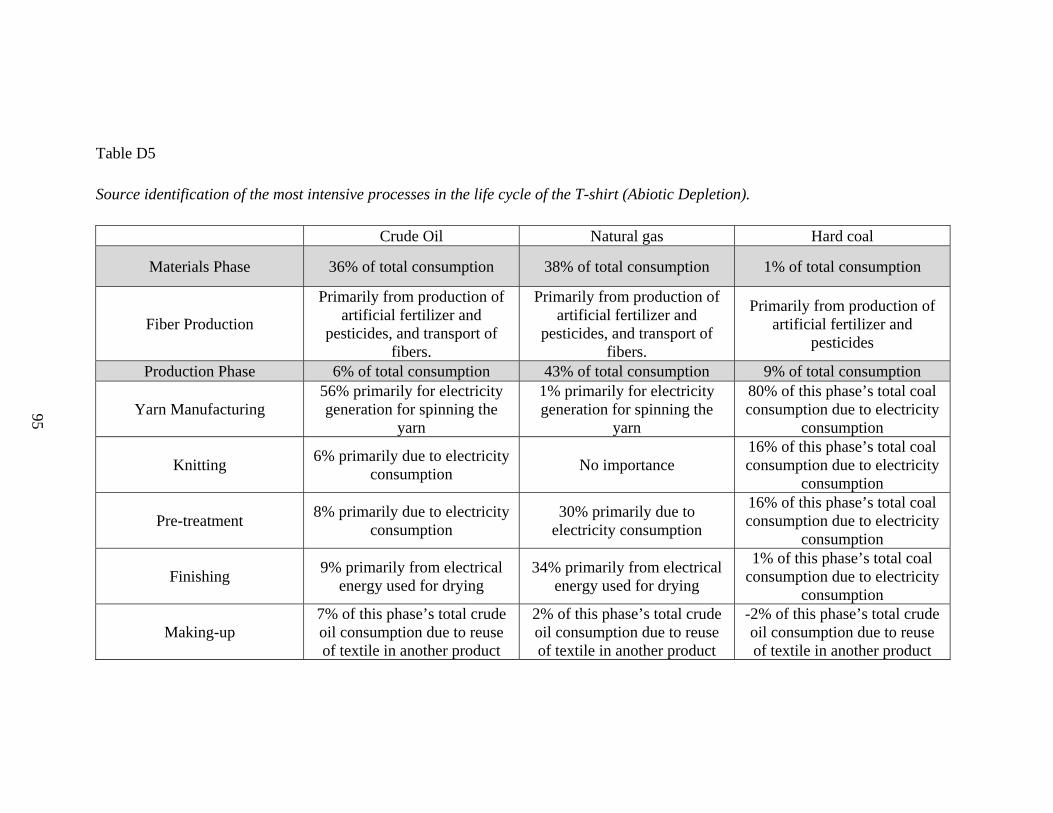
95
Table D5
Source identification of the most intensive processes in the life cycle of the T-shirt (Abiotic Depletion).
Crude Oil Natural gas Hard coal
Materials Phase 36% of total consumption 38% of total consumption 1% of total consumption
Fiber Production
Primarily from production of artificial fertilizer and
pesticides, and transport of fibers.
Primarily from production of artificial fertilizer and
pesticides, and transport of fibers.
Primarily from production of artificial fertilizer and
pesticides
Production Phase 6% of total consumption 43% of total consumption 9% of total consumption
Yarn Manufacturing 56% primarily for electricity generation for spinning the
yarn
1% primarily for electricity generation for spinning the
yarn
80% of this phase’s total coal consumption due to electricity
consumption
Knitting 6% primarily due to electricity
consumption No importance
16% of this phase’s total coal consumption due to electricity
consumption
Pre-treatment 8% primarily due to electricity
consumption 30% primarily due to
electricity consumption
16% of this phase’s total coal consumption due to electricity
consumption
Finishing 9% primarily from electrical
energy used for drying 34% primarily from electrical
energy used for drying
1% of this phase’s total coal consumption due to electricity
consumption
Making-up 7% of this phase’s total crude oil consumption due to reuse of textile in another product
2% of this phase’s total crude oil consumption due to reuse of textile in another product
-2% of this phase’s total crude oil consumption due to reuse of textile in another product
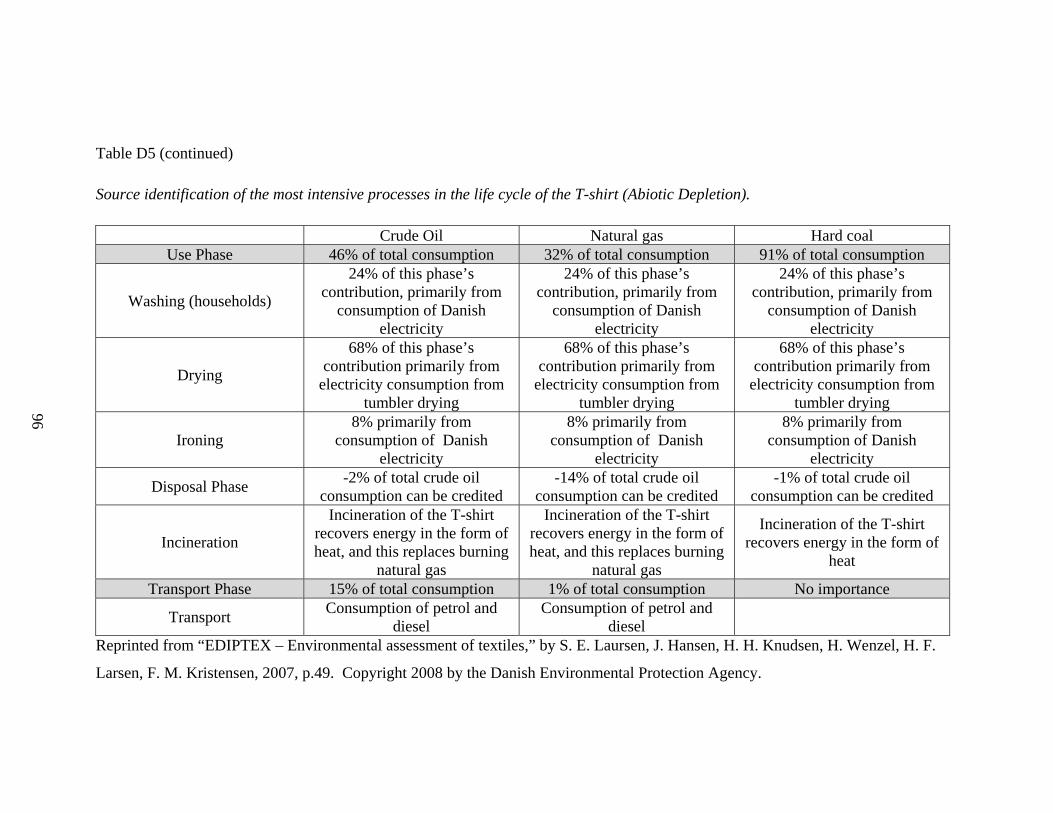
96
Table D5 (continued)
Source identification of the most intensive processes in the life cycle of the T-shirt (Abiotic Depletion).
Crude Oil Natural gas Hard coal Use Phase 46% of total consumption 32% of total consumption 91% of total consumption
Washing (households)
24% of this phase’s contribution, primarily from
consumption of Danish electricity
24% of this phase’s contribution, primarily from
consumption of Danish electricity
24% of this phase’s contribution, primarily from
consumption of Danish electricity
Drying
68% of this phase’s contribution primarily from
electricity consumption from tumbler drying
68% of this phase’s contribution primarily from
electricity consumption from tumbler drying
68% of this phase’s contribution primarily from
electricity consumption from tumbler drying
Ironing 8% primarily from
consumption of Danish electricity
8% primarily from consumption of Danish
electricity
8% primarily from consumption of Danish
electricity
Disposal Phase -2% of total crude oil
consumption can be credited -14% of total crude oil
consumption can be credited -1% of total crude oil
consumption can be credited
Incineration
Incineration of the T-shirt recovers energy in the form of heat, and this replaces burning
natural gas
Incineration of the T-shirt recovers energy in the form of heat, and this replaces burning
natural gas
Incineration of the T-shirt recovers energy in the form of
heat
Transport Phase 15% of total consumption 1% of total consumption No importance
Transport Consumption of petrol and
diesel Consumption of petrol and
diesel
Reprinted from “EDIPTEX – Environmental assessment of textiles,” by S. E. Laursen, J. Hansen, H. H. Knudsen, H. Wenzel, H. F.
Larsen, F. M. Kristensen, 2007, p.49. Copyright 2008 by the Danish Environmental Protection Agency.
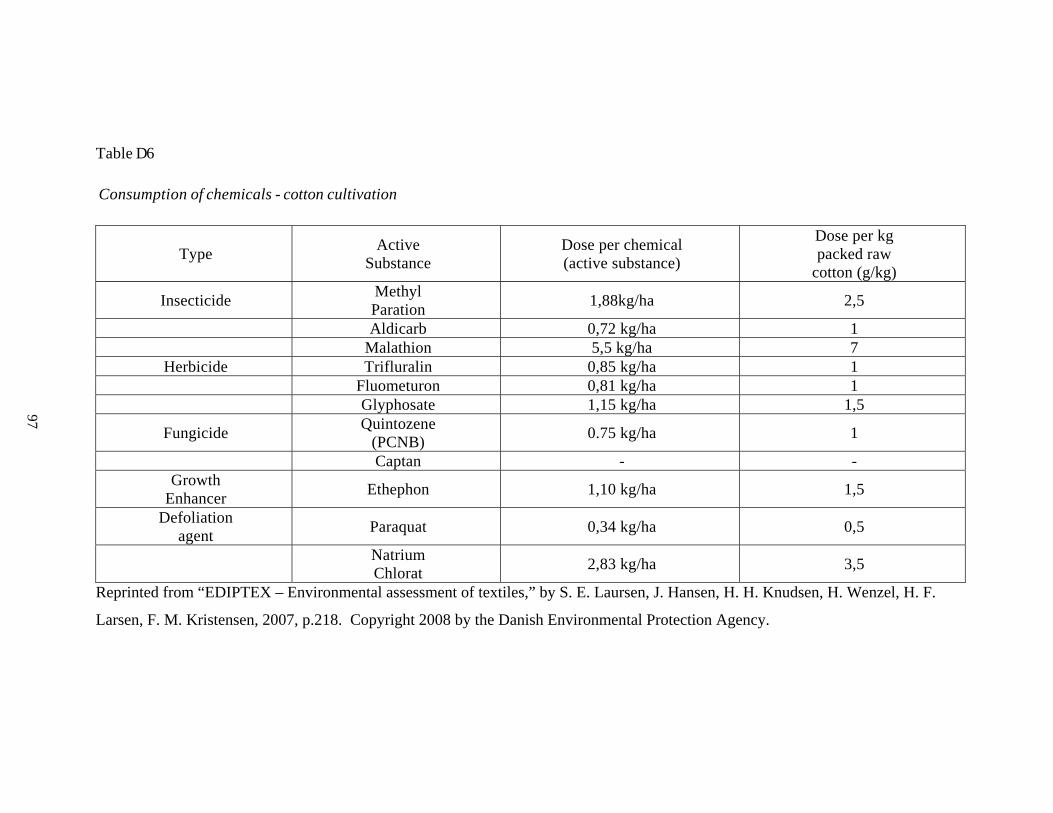
97
Table D6
Consumption of chemicals - cotton cultivation
Type Active
Substance Dose per chemical (active substance)
Dose per kg packed raw
cotton (g/kg)
Insecticide Methyl Paration
1,88kg/ha 2,5
Aldicarb 0,72 kg/ha 1 Malathion 5,5 kg/ha 7
Herbicide Trifluralin 0,85 kg/ha 1 Fluometuron 0,81 kg/ha 1 Glyphosate 1,15 kg/ha 1,5
Fungicide Quintozene
(PCNB) 0.75 kg/ha 1
Captan - - Growth
Enhancer Ethephon 1,10 kg/ha 1,5
Defoliation agent
Paraquat 0,34 kg/ha 0,5
Natrium Chlorat
2,83 kg/ha 3,5
Reprinted from “EDIPTEX – Environmental assessment of textiles,” by S. E. Laursen, J. Hansen, H. H. Knudsen, H. Wenzel, H. F.
Larsen, F. M. Kristensen, 2007, p.218. Copyright 2008 by the Danish Environmental Protection Agency.
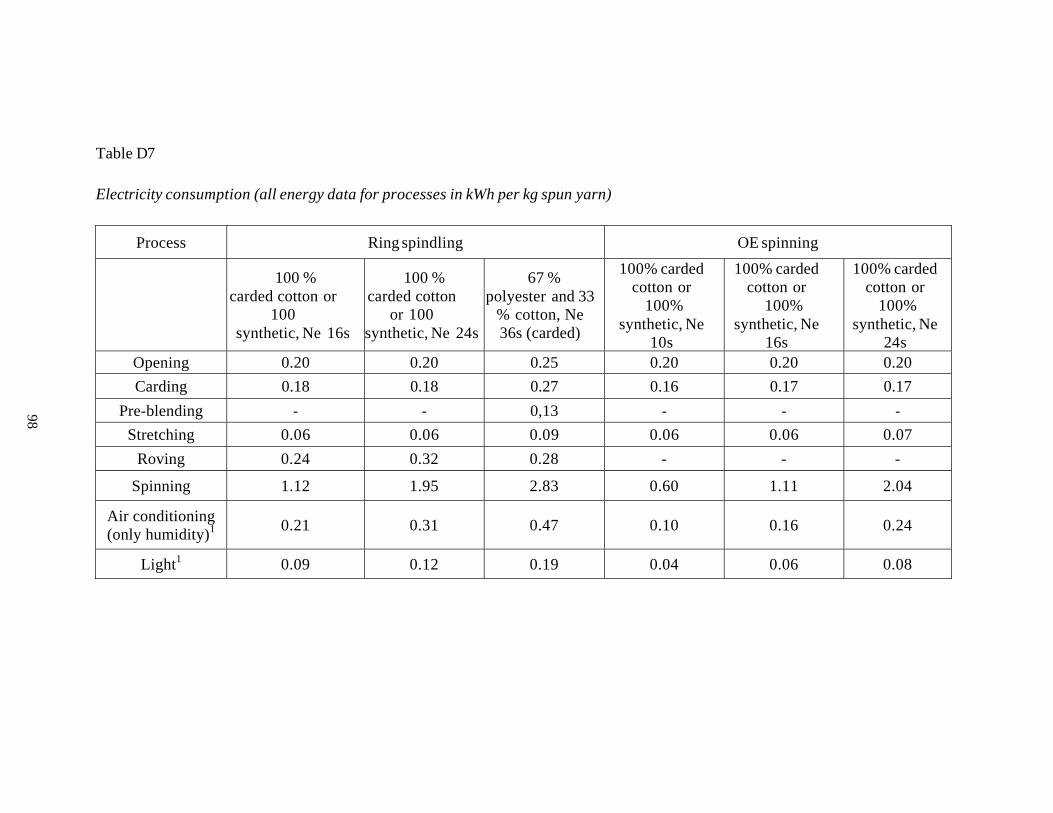
98
Table D7
Electricity consumption (all energy data for processes in kWh per kg spun yarn)
Process Ring spindling OE spinning
100 % carded cotton or
100 synthetic, Ne 16s
100 % carded cotton
or 100 synthetic, Ne 24s
67 % polyester and 33
% cotton, Ne 36s (carded)
100% carded cotton or
100% synthetic, Ne
10s
100% carded cotton or
100% synthetic, Ne
16s
100% carded cotton or
100% synthetic, Ne
24sOpening 0.20 0.20 0.25 0.20 0.20 0.20
Carding 0.18 0.18 0.27 0.16 0.17 0.17
Pre-blending - - 0,13 - - -
Stretching 0.06 0.06 0.09 0.06 0.06 0.07
Roving 0.24 0.32 0.28 - - -
Spinning 1.12 1.95 2.83 0.60 1.11 2.04
Air conditioning (only humidity)1
0.21 0.31 0.47 0.10 0.16 0.24
Light1 0.09 0.12 0.19 0.04 0.06 0.08
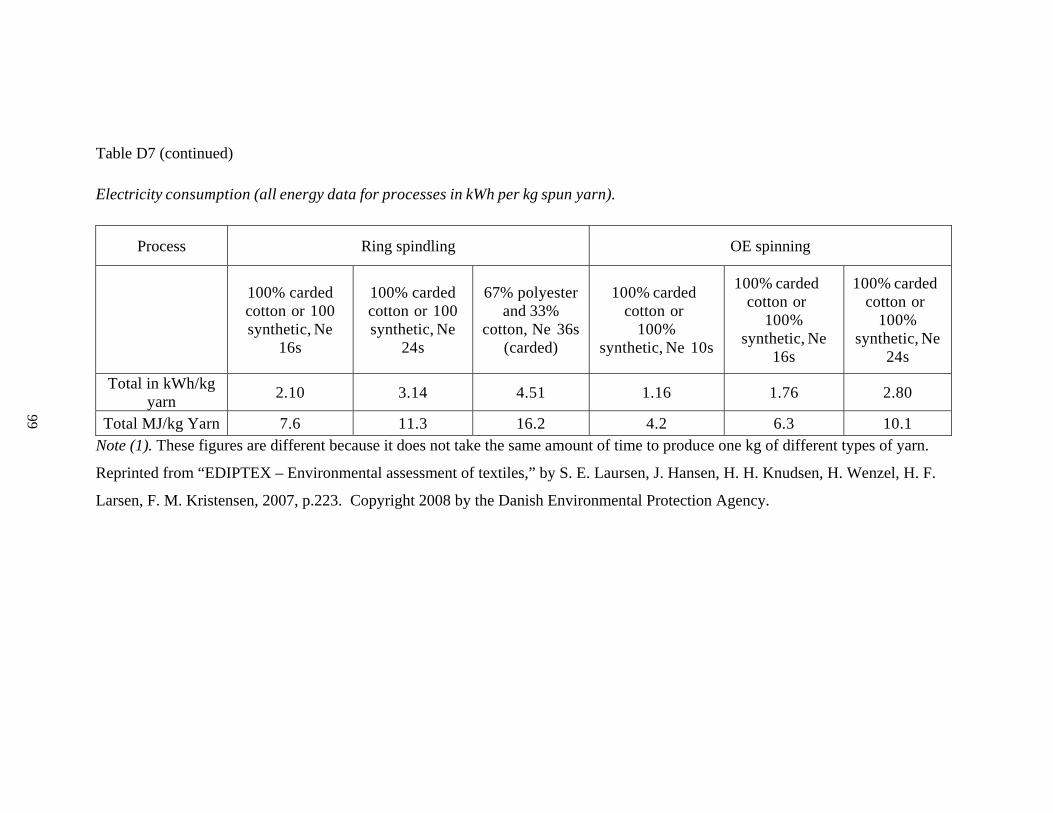
99
Table D7 (continued)
Electricity consumption (all energy data for processes in kWh per kg spun yarn).
Process Ring spindling OE spinning
100% carded cotton or 100 synthetic, Ne
16s
100% carded cotton or 100 synthetic, Ne
24s
67% polyester and 33%
cotton, Ne 36s (carded)
100% carded cotton or
100% synthetic, Ne 10s
100% carded cotton or
100% synthetic, Ne
16s
100% carded cotton or
100% synthetic, Ne
24s
Total in kWh/kg yarn
2.10 3.14 4.51 1.16 1.76 2.80
Total MJ/kg Yarn 7.6 11.3 16.2 4.2 6.3 10.1 Note (1). These figures are different because it does not take the same amount of time to produce one kg of different types of yarn.
Reprinted from “EDIPTEX – Environmental assessment of textiles,” by S. E. Laursen, J. Hansen, H. H. Knudsen, H. Wenzel, H. F.
Larsen, F. M. Kristensen, 2007, p.223. Copyright 2008 by the Danish Environmental Protection Agency.
100
Appendix E
Per the “Publication Manual of the American Psychological Association”,
copyright permission is required from the copyright holder when reprinting or adapting
tables and figures. Copyright permission was requested and approved from ReCiPe 2008
team and Levi Strauss & Co., for the use of material in “ReCiPe 2008. A life cycle
impact assessment method which comprises harmonized category indicators at the
midpoint and the endpoint level” and “The Life Cycle of a Jean. Understanding the
environmental impact of a pair of Levi’s® 501® jeans”. Permission was requested from
the Technical University of Denmark for the use of materials in “EDIPTEX –
Environmental assessment of textiles” and is awaiting approval.
101
102
103
104
105
106
107
Bibliography
14040-1997, A. I. Environmental management - Life cycle assessment - Principles and framework.
Abuhilal, L., Rabadi, G., & Sousa-Poza, A. (2006). Supply Chain Inventory Control: A Comparison Among JIT, MRP, and MRP With Information Sharing Using Simulation. Engineering Management Journal, 18(2).
B.V., P. C. (2000). The Eco-indicator 99 A damage oriented method for Life cycle Impact Assessment Methodology Report.
Barnes, L., & Lea-Greenwood, G. (2006). Fast fashioning the supply chain: shaping the research agenda. Journal of Fashion Marketing and Management, 10(3), 259-271. doi: 10.1108/13612020610679259
Bhardwaj, V., & Fairhurst, A. (2010). Fast fashion: response to changes in the fashion industry. The International Review of Retail, Distribution and Consumer Research, 20(1), 165-173. doi: 10.1080/09593960903498300
Birtwistle, G., Siddiqui, N., & Fiorito, S. S. (2003). Quick response: perceptions of UK fashion retailers. International Journal of Retail & Distribution Management, 31(2), 118-128. doi: 10.1108/09590550310462010
Bruce, M., Daly, L., & Towers, N. (2004). Lean or agile: A solution for supply chain management in the textiles and clothing industry? International Journal of Operations & Production Management, 24(2), 151-170. doi: 10.1108/01443570410514867
Cachon, G. P., & Swinney, R. (2011). The value of fast fashion: Quick response, enhanced design, and strategic consumer behavior. Management Science, 57(4), 778-795.
Camp, S., Clark, G., Duane, L., & Haight, A. (2010). Life cycle analysis and sustainability report - Levi Strauss & Co. ENVS 195: Sustainability Science, 1-23
Carpenter, S. R., Caraco, N. F., Correll, D. L., Howarth, R. W., Sharpley, A. N., & Smith, V. H. (1998). Nonpoint pollution of surface waters with phosphorus and nitrogen. Ecological Applications, 8(3), 559-568.
Carrigan, M., & Pelsmacker, P. d. (2009). Will ethical consumers sustain their values in the global credit crunch? International Marketing Review, 26(6), 674-687. doi: 10.1108/02651330911001341
108
Chen, H. L., & Burns, L. D. (2006). Environmental Analysis of Textile Products. Clothing and Textiles Research Journal, 24(3), 248-261. doi: 10.1177/0887302x06293065
Choi, T.-M., Liu, N., Liu, S.-C., Mak, J., & To, Y.-T. (2010). Fast fashion brand extensions: An empirical study of consumers preferences. . Journal of Brand Management, 17(7), 472-487.
Chouinard, Y. (2008). Foreword Sustainable Fashion Why Now? New York: Fairchild Books, Inc.
Christopher, M., Lowson, R., & Peck, H. (2004). Creating agile supply chains in the fashion industry. International Journal of Retail & Distribution Management, 32(8), 367-376. doi: 10.1108/09590550410546188
Cohen, A. C., & Johnson, I. (2012). J. J. Pizzuto's Fabric Science (10th ed.). New York: Fairchild Books.
Confalonieri, U., Menne, B., Akhtar, R., Ebi, K. L., Hauengue, M., Kovats, R. S., . . . Woodward, A. (2007). Climate Change 2007: Impacts, Adaption and Vulnerability. Contribution of Working Group II to the Fourth Assessment Report of the Intergovernmental Panel on Climate Change (pp. 391-431). Cambridge, UK.
Cottoninc.com. Blue Jeans Go Green. Retrieved March 24, 2015, 2015, from http://www.bluejeansgogreen.org/About-Us/Program-History/
Cotton Incorporated (2010). Supply chain insights. Driving demand for denim jeans. Retrieved June 3, 2015, from http://www.cottoninc.com/corporate/Market-Data/SupplyChainInsights/Driving-Demand-For-Denim-Jeans/
Cotton Incorporated, (2010). Supply chain insights. Sustainable Dyeing Solutions. Retrieved July 22, 2015, fromhttp://www.cottoninc.com/corporate/Market-Data/SupplyChainInsights/sustainable-dyeing-solutions/Sustainable-Dyeing-Solutions-02-10.pdf. (pp. 1-2).
Cotton Incorporated, (2010). Why irrigate cotton? Retrieved July 22, 2015 fromhttp://www.cottoninc.com/fiber/AgriculturalDisciplines/Engineering/Irrigation-Management/Why-Irrigate-Cotton/
CTR. (2015). The Facts about Textile Waste (Publication no. http://www.weardonaterecycle.org/images/textile-recycling-issues.png). Retrieved March 11, 2015
109
Curwen, L. G., Park, J., & Sarkar, A. K. (2013). Challenges and Solutions of Sustainable Apparel Product Development: A Case Study of Eileen Fisher. Clothing and Textiles Research Journal, 31(1), 32-47. doi: 10.1177/0887302x12472724
Djelic, M., & Ainamo, A. (1999). The coevolution o fnew organizational forms in the fashion industry. Organization Science, 10, No. 5, 622-637.
Doyle, S. A., Moore, C. M., & Morgan, L. (2006). Supplier management in fast moving fashion retailing. Journal of Fashion Marketing and Management, 10(3), 272-281. doi: 10.1108/13612020610679268
Dudgeon, D., Arthington, A. H., Gessner, M. O., Kawabata, Z.-I., Knowler, D. J., Leveque, C., Sullivan, C. A. (2006). Freshwater biodiversity: importance, threats, status and conservation challenges. Biological Reviews, 81(2), pp. 163-182.
Dupont. (2008). A glossary of common sustainability terms. Retrieved July 20, 2015, from http://www.corbiplastics.com/pdf/Glossary_of_SustainabilityTerms_EU.pdf
Dystar. (2010). Sustainability in textile processing.
Ellis, E. (2014). Ecosystem. In J. E. Duffy (Ed.), Encyclopedia of Earth.
EPA. (2009). (Publication no. http://www.epa.gov/osw/nonhaz/municipal/pubs/msw2009rpt.pdf). (EPA530-R-10-012). Retrieved March 10, 2015
EPA. (2015). Reducing and Reusing Basics. Retrieved March 23, 2015, 2015, from http://www2.epa.gov/recycle/reducing-and-reusing-basics
Epps, R. W. (1995). Just-in-time inventory management: Implementation of a successful program. Review of Business, 17(1), 5.
Fernie, J., & Azuma, N. (2004). The changing nature of Japanese fashion. Can quick response impove supply chain efficiency? European Journal of Marketing, 38(7), 790-808. doi: 10.1108/03090560410539258
Fletcher, K. (2008). Sustainable fashion and textiles: design journeys. New York: Earthscan.
Gabrielli, V., Baghi, I., & Codeluppi, V. (2012). Consumption practices of fast fashion products: A consumer-based approach. Journal of Fashion Marketing and Management, 17(2), 206-224.
Giunipero, L. C., Fiorito, S. S., Pearcy, D. H., & Dandeo, L. (2001). The impact of vendor incentives on Quick Response. The International Review of Retail,
110
Distribution and Consumer Research, 11(4), 359-376. doi: 10.1080/09593960126379
Goedkoop, M., Heijuns, R., Huijbregts, M., Schryver, A. D., Struijs, J., & Zelm, R. v. ReCiPe. Retrieved May 16, 2015, from http://www.lcia-recipe.net/home
Goedkoop, M., Heijuns, R., Huijbregts, M., Schryver, A. D., Struijs, J., & Zelm, R. v. (2013). ReCiPe 2008: A life cycle impact assessment method which comprises harmonised category indicators at the midpoint and the endpoint level (First ed., pp. 133).
Goedkoop, M., & Spriensma, R. (2000). The Eco-indicator 99. A damge oriented method for Life Cycle Impact Assessment (2nd ed.).
Hacking, T., & Guthrie, P. (2008). A framework for clarifying the meaning of Triple Bottom-Line, Integrated, and Sustainability Assessment. Environmental Impact Assessment Review, 28(2-3), 73-89. doi: 10.1016/j.eiar.2007.03.002
Hellweg, S., Hofstetter, T. B., & Hungerbuhler, K. (2005). Discounting and the Environment. Should Current Impacts be Weighted Differently than Impacts Harming Future Generations? The International Journal of Life Cycle Assessment, 8(1), 8-18. doi: 10.1065/Ica2002.09.097
Hethorn, J., & Ulasewicz, C. (2008). Sustainable Fashion Why Now? New York: Fairchild Books, Inc.
Hofstetter, P. (1998). Perspectives in Life Cycle Impact Assessments: a structured approach to combine models of the Technoshpere, Ecosphere and Valuesphere. Boston, MA: Springer US.
Hofstetter, P., & Hammitt, J. K. (2002). Selecting Human Health Metrics for Enviromental Decision-Support Tools. Risk Analysis, 22, 965-983.
Hsu, S. L. (2009). Life Cycle Assessment of Materials and Construction in Commerical Structures: Variability and Limitations. (Master of Engineering in Civil and Environmental Engineering), Massachusetts Institute of Technology.
IFC. (2007). Environmental, Health, and Safety Guidelines for Textile Manufacturing.
ISO. (2003). Enviromental Management: life cycle impact assessment: examples of application of ISO 14042 (1st ed.). Geneva: ISO.
Jefferson, T. History of the T-shirt. Retrieved June 2, 2015, from http://www.ooshirts.com/guides/History-of-the-T-Shirt.html
111
Jones, P., Hillier, D., Comfort, D., & Eastwood, I. (2005). Sustainable Retailing and Consumerism. Management Research News, 28(1), 34-44.
Joy, A., Sherry, J. F., Venkatesh, A., Wang, J., & Chan, R. (2012). Fast Fashion, Sustainability, and the Ethical Appeal of Luxury Brands. Fashion Theory, 16(3), 273-296. doi: 10.2752/175174112X13340749707123
Keiser, S. J., & Garner, M. B. (2012). Beyond Design The Synergy of Apparel Product Development (3rd. ed.). New York: Fairchild Books.
Krewitt, W., Pennington, D. W., Olsen, S. I., Crettaz, P., & Jolliet, O. (2002). Inidicators for human toxicity in Life Cycle Impact Assessment.
Laursen, S. E., Hansen, J., Knudsen, H. H., Wenzel, H., Larsen, H., & Kristensen, F. M. (2007). EDIPTEX - Environmental assessment of textiles (Vol. Working Report; No. 24, pp. 230).
LeviStrauss&Co. (2015). The Life Cycle of a Jean - Understanding the environmental impact of a pair of Levi's 501 jeans. Retrieved May 11, 2015 http://levistrauss.com/wp-content/uploads/2015/03/Full-LCA-Results-Deck-FINAL.pdf
Linder, S. H. (2002). Technology and Textiles Globalization. History and Technology, 18(1), 1-22.
Lowson, B., King, R., & Hunter, A. (1999). The Role of Quick Response Quick Response: The Managing the Supply Chain to Meet Consumer Demand (pp. 77-84). Chichester: John Wiley & Sons, LTD.
Luke, R. (2008). Popular Culture, Marketing, and the Ethical Consumer Sustainable Fashion. Why Now? (pp. 77-94). New York: Fairchild Books, Inc.
Michelsen, C. J., O'Connor, P., & Wiseman, T. (2014). Just in Time. Defense AT&L, 43(2), 32-36.
Mihm, B. (2010). Fast Fashion in a Flat World: Global sourcing strategies. International Business and Economics Research Journal, 9(6), 55-63.
Moisander, J., Markkula, A., & Eräranta, K. (2010). Construction of consumer choice in the market: challenges for environmental policy. International Journal of Consumer Studies, 34(1), 73-79. doi: 10.1111/j.1470-6431.2009.00821.x
Morgan, L. R., & Birtwistle, G. (2009). An investigation of young fashion consumers' disposal habits. International Journal of Consumer Studies, 33(2), 190-198. doi: 10.1111/j.1470-6431.2009.00756.x
112
Nielsen, A. M., & Nielsen, P. H. (2009). Comparative life cycle assessment of the Elemental T-shirt produced with biotechnology and a Conventional T-shirt produced with conventional technology. from http://improve.novozymes.com/Documents/LCA_elemental_t-shirt_and_biotechnology.pdf
NordicFashionAssociation. (2012). The Nice Consumer: Framework for achieving sustainable fashion consumption. Retrieved October 12, 2013, from http://www.nicefashion.org
Orzada, B., & Moore, M. A. (2008). Environmental Impact of Textile Production Sustainable Fashion (pp. 299-325). New York: Fairchild Books, Inc.
Partridge, D. J. (2011). Activist Capitalism and Supply-Chain Citizenship. Current Anthropology, 52(S3), S97-S111. doi: 10.1086/657256
Patagonia.com. Recycled Nylon. from http://www.patagonia.com/us/patagonia.go?assetid=37606
Patagonia.com. Recycled Polyester. Retrieved March 24, 2015, from http://www.patagonia.com/us/patagonia.go?assetid=2791
Patagonia.com. Recycled Wool. Retrieved March 24, 2015, from http://www.patagonia.com/us/patagonia.go?assetid=93863
Payne, A. (2011). The Life-cycle of the Fashion Garment and the Role of Australian Mass Market Designers. The International Journal of Environmental, Cultural, Economic and Social Sustainability, 7(3), 237-246.
Pennington, D. W., Potting, J., Finnveden, G., Lindeijer, E., Jolliet, O., Rydberg, T., & Rebitzer, G. (2004). Life Cycle Assessment Part 2: Current impact assessment practice. Environment International, 30, 721-739.
Petersen, K. J., Handfield, R. B., & Ragatz, G. L. (2005). Supplier integration into new product development: coordinating product, process and supply chain design. Journal of Operations Management, 23(3-4), 371-388. doi: 10.1016/j.jom.2004.07.009
Puig, F., Marques, H., & Ghauri, P. N. (2009). Globalization and its impact on operational decisions: The role of industrial districts in the textile industry. International Journal of Operations & Production Management, 29(7), 692-719. doi: 10.1108/01443570910971388
Rebitzer, G., Ekvall, T., Frischknecht, R., Hunkeler, D., Norris, G., Rydberg, T., . . . Pennington, D. W. (2004). Life cycle assessment part 1: framework, goal and
113
scope definition, inventory analysis, and applications. Environ Int, 30(5), 701-720. doi: 10.1016/j.envint.2003.11.005
Rimiene, K. (2011). Supply chain agility concept evolution (1990-2010). Economis and Management, 16, 892-899.
Rousso, C. (2012). Fashion Forward. A guide to Fashion Forecasting: Fairchild Books.
Sadar, A. (2010). Fashion and Sustainable Development. Paper presented at the 41st Internation Symposium on Novelties in Textiles: Oral Presentation, Slovenia, Ljubljana.
Sivaramakrishnan, C. N. (2012). Life cycle analysis of textiles. Colourage, 59(1).
Sproles, G. B., & Burns, L. D. (1994). Changing Appearances: understanding dress in contemporary society. New York: Fairchild Publications.
Stearns, P. N. (1997). Stages of Consumerism: Recent works on the issues of periodization. The Journal of Modern History, 69, 102-117
Taplin, I. M. (1999). Statistical Review: Continuity and change in the US apparel industry: A statistical profile. Journal of Fashion Marketing and Management, 3(4), 360-368. doi: 10.1108/eb022572
Thompson, M., Ellis, R., & Wildavsky, A. B. (1990). Cultural Theory. Boulder, Colorado: Westview Press.
Tokatli, N., & Kizilgun, O. (2009). From manufacturing garments for ready to wear to designing collection: Evidence from Turkey. Environment and Planning, 41, 146-162.
Tortora, P. G., & Merkel, R.S. (1996). Fairchild's Dictionary of Textiles. New York: Fairchild Publications.
UNEP, & SETAC. (2015). The Life Cycle Initiative. Retrieved June 2, 2015, from http://www.lifecycleinitiative.org/starting-life-cycle-thinking/what-is-life-cycle-thinking/
USEPA. (November 20, 2013). Introduction to Eco-labels and Standards. from http://www.epa.gov/greenproducts/standards/
WHO. (2015). World Health Organization. Retrieved May 20, 2015, from http://www.who.int/about/en/
114
Yusuf, Y. Y., Sarhadi, M., & Gunasekaran, A. (1999). Agile manufacturing: The drivers, concepts and attributes. International Journal of Production Economics, 62, 33-43.
115
VITA
Education Institution
B.S. Degree Management, May 1999; Minor, Business Communications University of
Kentucky, Lexington, KY
Professional Experience
Senior Technician, University of Kentucky, Lexington, KY, Aug. 2014 – May 2015
Lab Technician, University of Kentucky, Lexington, KY Jan. 2013 – May 2014
Merchandise Planner, Citi Trends, Savannah, GA, Aug. 2008 – July 2009
Planning Procurement Coordinator, American Signature Inc., Columbus, OH,
Sept. 2006 – Aug. 2008
Assistant Buyer, Belk Store Services Inc., Charlotte, NC, Jan. 2005 – June 2006
Merchandise Assistant, Belk Store Services Inc., Charlotte, NC, March 2003 – Dec. 2004
Assistant Store Manager, Limited Too Inc., Charlotte, NC, Jan. 2002 – Feb. 2003
Assistant Store Manager, Limited Too Inc., Louisville, KY, Jan. 2000 – Aug. 2001
Scholastic & Professional Honors
The Honor Society of Agriculture, Gamma Sigma Delta, 2014 - 2015
Recipient of Buster Award, 2013-2014
Retailing and Tourism Management Departmental Periodic Program Review, 2014
Appointed to National Fire Protection Association 1971 Annex Task Group, 2014
Cotton Inc. Blue Jeans Go Green Denim Drive Coordinator, 2013-2014
Tara Hackett
_________________________________